1. Introduction
Industrial wastewater treatment remains one of the most pressing environmental challenges, particularly for effluents with high organic loads and recalcitrant compounds that resist conventional biological processes. Agro-industrial operations such as food production, textile manufacturing, and pharmaceutical synthesis generate wastewaters rich in aromatic and phenolic pollutants that frequently exceed discharge limits for chemical oxygen demand (COD) and other toxic constituents [
1,
2,
3].
Advanced oxidation processes (AOPs) are defined by the in situ generation of hydroxyl radicals (•OH) as the principal oxidizing species, rather than by the direct action of the primary oxidant. This distinction matters because •OH reacts non-selectively at near diffusion-controlled rates (10
6–10
9 M
−1 s
−1), whereas molecular ozone reacts selectively with electron-rich moieties [
4,
5]. Among AOPs, ozonation (O
3) stands out for its dual mechanism, direct electrophilic oxidation of electron-rich moieties and indirect radical-mediated oxidation through •OH generation. Electro-catalytic ozonation qualifies as an AOP on this basis, because Fe
2+ generated by anodic dissolution decomposes ozone through Fenton-like pathways, shifting oxidation from selective molecular ozone attack toward non-selective radical chemistry. Despite its high oxidation potential (E° = 2.07 V), the practical performance of ozonation systems is often governed not by intrinsic reaction kinetics but by mass-transfer constraints. Although ozone is considerably more soluble in water than oxygen, approximately 110 mg/L at 25 °C compared with 9 mg/L for O
2, it is still regarded as sparingly soluble in the context of gas–liquid mass transfer. The equilibrium solubility of ozone can be described by Henry’s law, where the constant H (atm·(mole fraction)
−1) defines the gas–liquid partitioning, using the correlation of Johnson and Davis (1996) [
6] and Roth and Sullivan (1981) [
7]:
where [OH
−] is the hydroxide ion concentration (mol L
−1) and T is the absolute temperature (K). Hydroxide concentration was calculated from the measured pH using the ion product of water, Kw = 1.0 × 10
−14 at 298 K; over the ambient temperature range of these experiments the associated variation in Kw was small relative to the pH range investigated and was not separately corrected. The correlation yields
atm·(mole fraction)
−1 at 20–25 °C and near-neutral pH. By applying the ideal-gas relation, in which R is the universal gas constant (8.314 J mol
−1 K
−1) and
is the dimensionless, concentration-based Henry constant,
, this corresponds to a dimensionless Henry constant of approximately
, confirming that only a small fraction of ozone dissolves before reaching equilibrium. In the same work, Johnson and Davis measured the molecular diffusivity of ozone in water, D (m
2 s
−1), as
m
2 s
−1, giving
m
2 s
−1. Here
D20°C denotes the value at 20 °C. This correlation was determined in ultrapure water and therefore represents an upper bound for the present system; dissolved phenol, sulfate from pH adjustment, and electrochemically generated iron species increase bulk viscosity, so the effective ozone diffusivity in the ECO matrix is expected to be marginally lower. These combined properties, moderate solubility and relatively slow molecular diffusion, impose a significant constraint on the overall rate at which ozone is transferred from the gas to the liquid phase [
6,
7]. Accordingly, the overall transfer in aqueous systems is governed by the classical two-film theory [
8]:
where
is the ozone transfer rate (mg/L min
−1),
is the volumetric mass-transfer coefficient (min
−1),
is the saturation concentration in equilibrium with the gas phase, and
is the bulk liquid-phase concentration [
8,
9]. The
value thus defines gas–liquid contacting efficiency, and in many ozonation systems, the process rate is controlled more by ozone dissolution than by chemical oxidation once dissolved.
Electro-catalytic ozonation (ECO) integrates electrochemistry with ozonation to enhance radical generation. In ECO systems, sacrificial iron electrodes undergo anodic dissolution to release Fe
2+ ions that catalyze ozone decomposition through Fenton-like reactions [
10]:
The continuous Fe
2+ supply sustains multi-pathway radical formation, yielding significantly higher oxidation rates than conventional ozonation. Previous work by Abu El Haija and Abbassi (2026) [
10] showed that under optimized conditions reported in that study (pH 5–9, 175–200 mA, 3.6–5.3 g O
3 h
−1), the ECO system achieved >90% COD removal and complete degradation of phenol and vanillin within 30 min, whereas ozonation alone achieved only 51–64%. This synergy, however, raises a question the degradation data alone cannot answer: if the dissolved ozone is being consumed by Fe
2+-mediated reactions as fast as it dissolves, then does the measured liquid-phase ozone concentration reflect a balance between supply and consumption rather than transfer alone? Whether ECO performance is set by how much ozone can be delivered or by how rapidly it is consumed once delivered therefore remains unresolved, and the two have very different design consequences.
A review of ozonation and the AOP literature reveals that although many studies report strong pollutant removal, few quantify mass-transfer parameters such as
or ozone transfer efficiency (OTE) [
8,
9,
11]. This omission limits mechanistic understanding and hampers reactor design and scale-up. Conventional bubble-column reactors, the most common laboratory configuration, exhibit modest transfer rates. By contrast, advanced contactors achieve markedly superior performance. Oscillatory-flow reactors, for example, have reported
values of 3.12 min
−1 versus 1.47 min
−1 for standard bubble columns (Graça et al., 2020) [
12], and pilot-scale continuous-column reactors with extended residence times have achieved OTE > 90% (Yao et al., 2018) [
13]. These results underscore a significant performance gap. Bubble columns inherently suffer from large bubbles, short contact times, poor dispersion, and limited interfacial area, all factors that reduce
and ozone utilization [
14,
15,
16]. To date, no study has systematically evaluated ozone mass-transfer behavior in ECO systems, despite clear evidence that electrochemical conditions (pH gradients, Fe
2+ distribution, current flow) could substantially alter gas–liquid transport phenomena. Most ECO studies acknowledge mass transfer qualitatively but lack quantitative data (OTE,
, saturation indices) and rarely examine multiple operating regimes relevant to industrial treatment. Recent research on hybrid ozone-based AOPs further supports the two-stage nature of ozone mass transfer and demand [
17]. In the early phase, ozone transfer is rapid (OTE > 0.8) and dominated by fast-reacting organics, whereas later stages become diffusion- or reaction-limited once reactive species are depleted. Silva et al. (2019) [
17] observed this transition during photolytic and photocatalytic ozonation of municipal wastewater, noting that the transfer yield declined sharply after 30 min as the system shifted from kinetic to mass-transfer control. They also showed that matrices with higher organic and inorganic carbon maintained higher ozone transfer yields, and that photolytic enhancement (UV-C or UV-A/TiO
2) improved apparent transfer efficiency by accelerating ozone consumption in the liquid phase [
17]. These findings parallel expectations for ECO systems, where early Fe
2+–O
3 reactions rapidly deplete dissolved ozone before the process transitions to a transport-limited regime.
Building on this foundation, Abu El Haija and Abbassi (2026) established a 3.5 L polyvinyl chloride (PVC) batch ECO reactor equipped with iron electrodes and a ceramic diffuser for ozone delivery, varying pH (2–12), current (0–250 mA), and ozone dose (1.95–6.56 g/h) across 41 trials [
10]. Although the previous work emphasized degradation kinetics, it also generated a comprehensive dissolved-ozone dataset via real-time monitoring (0–30 min) under diverse conditions. The present study draws on this platform to isolate the factors governing dissolved ozone behavior through a controlled 3 × 3 × 3 factorial design (pH 3.5, 6, 9; O
3 generator setting 4, 6, 8; current 0, 125, 175 mA; 27 trials), providing a clean-water transfer baseline against which ECO dissolved-ozone trajectories are compared at every operating cell.
Coupled with known gas-flow rates and reactor geometry, these data provide a unique opportunity for quantitative mass-transfer characterization enabling calculation of
, dissolved ozone retention, ozone-decay kinetics, and pH-dependent dissolution behavior. The implications extend beyond academic interest to reactor design and process economics. If mass-transfer limitations dominate ECO performance as suggested for bubble-column systems, then optimizing gas–liquid contact is the most direct route to improved efficiency. Advanced contactors such as venturi injectors, rotating packed beds, and ozone saturators offer potential solutions [
11,
18]. In particular, saturator-based systems can achieve near-saturation ozone concentrations through inverted-cone geometry, controlled mixing zones, and extended residence times. This study therefore presents a systematic evaluation of ozone mass-transfer dynamics in a bench-scale ECO reactor and develops evidence-based design strategies for a saturator-based configuration. The analysis quantifies how efficiently supplied ozone accumulates as dissolved ozone across the full factorial envelope, determines
from time-resolved dissolved-ozone profiles, and examines the approach to saturation across the operating envelope. The results indicate that under ECO conditions dissolved ozone accumulation is limited by reactive ozone demand rather than by gas–liquid transfer capacity, motivating a conceptual two-stage saturator design in which pressurized ozone dissolution under conditions that suppress decomposition is decoupled from the reactive ECO bulk; transfer efficiencies above 80% have been reported for such contactors, against the <2.8% accumulation observed here. The contribution of this work is threefold. First, it provides quantitative mass-transfer characterization of an ECO system, a class of reactor for which such data have not previously been reported; existing ECO studies establish degradation performance but treat mass transfer qualitatively. Second, it separates the reactor’s intrinsic gas–liquid transfer capacity from the dissolved ozone behavior observed under reactive conditions, using a clean-water baseline measured on the same hardware across a full factorial envelope, and shows that the apparent transfer coefficient obtained under ECO conditions is a lumped supply–consumption term rather than a property of the contactor. Third, it converts that distinction into a design argument, establishing that the constraint on ECO performance lies in the kinetic competition between ozone supply and consumption rather than in contactor hardware, and identifying decoupled dissolution as the corresponding engineering response.
2. Materials and Methods
2.1. Reactor Configuration and Ozone Delivery System
All experiments were conducted in a custom-built cylindrical PVC batch reactor with a total volume of 3.5 L and a working liquid volume of 3.0 L, identical to the configuration described in a previous study [
10]. The column has an internal diameter of 154 mm, giving a cross-sectional area of 186 cm
2 and a liquid height of approximately 161 mm at the working volume. The reactor was equipped with two flat iron electrodes (AISI 1018 mild steel, 130 mm × 50.8 mm × 3.8 mm) mounted vertically with 3 cm inter-electrode spacing. These plates served dual roles as working and counter electrodes for electrochemical iron dissolution. Electrodes were mechanically cleaned with abrasive paper and rinsed with deionized water before each trial to remove surface oxide and any adhering deposits, ensuring consistent active surface area across runs. Electrical current was supplied via a programmable DC power supply (30 V, 5 A) operating in constant-current mode. The reactor featured a sealed top lid with multiple access ports for sampling, gas introduction, and sensor insertion, along with an off-gas outlet connected to a carbon-based ozone destruct unit for safe exhaust treatment. Ozone was generated using a VMUS-4 ozone generator (Oxidation Technologies, Inwood, IA, USA) [
19] supplied with oxygen of ≥99.5% purity at a fixed volumetric flow rate of 2.0 L/min (measured at standard conditions). The generator output was controlled via internal settings, corresponding to ozone mass production rates as specified by the manufacturer. For this investigation, generator settings of 4, 6, and 8 were employed, yielding the ozone mass flows of 3.62, 5.30, and 6.56 g/h, respectively. Ozone was introduced into the reactor through a ceramic diffuser positioned at the reactor bottom, providing distributed bubble formation and enhanced gas–liquid interfacial area.
Dissolved ozone concentrations were measured continuously throughout each experiment using an AquaSensors DataStick dissolved ozone probe (Thermo Fisher Scientific (Waltham, MA, USA)) [
20] with a measurement range of 0–20 mg/L. The probe was inserted through a sealed side port and positioned in the bulk liquid phase, away from electrode surfaces and the gas diffuser zone, to ensure representative bulk measurements. The probe was zeroed in ozone-free water before each experimental session and its response verified against the manufacturer’s calibration procedure. Between trials the reactor was drained, rinsed, and refilled, and the probe was allowed to return to baseline before ozone was introduced. Data were logged at 1 s intervals through the end of each experimental run. Logging in some trials commenced before ozone flow was initiated; the referencing of time to ozone onset is described in
Section 2.3.
2.2. Experimental Conditions and Operating Parameters
Experiments were designed as a full 3 × 3 × 3 factorial to systematically evaluate mass transfer performance across solution chemistry and electrochemical conditions relevant to electro-catalytic ozonation of phenolic wastewater. The design crossed three pH levels (3.5, 6, and 9), three ozone generator settings (4, 6, and 8; corresponding to 3.62, 5.30, and 6.56 g/h), and three applied currents (0, 125, and 175 mA), yielding 27 trials in total. Trials at 0 mA constitute the plain-ozonation baseline used to characterize gas–liquid transfer in the absence of electrochemically generated iron, while the 125 and 175 mA trials characterize ECO operation. Each trial utilized 3.0 L of solution. The ECO trials (125 and 175 mA) used synthetic phenolic wastewater prepared by dissolving phenol (analytical grade, ≥99% purity) to a concentration of 50 mg/L, corresponding to a theoretical chemical oxygen demand of approximately 119 mg/L. Solutions were prepared fresh before each trial and stirred until fully dissolved. Both trial types used municipal tap water as the base matrix, with no supporting electrolyte added; the background ionic content of the tap water provided sufficient conductivity for electrochemical operation. Additional ionic strength was derived from the sulfuric acid or sodium hydroxide used for pH adjustment and, in the ECO trials, from dissolved phenol and electrochemically generated iron species. Conductivity and alkalinity were not measured. The 0 mA and current-bearing arms therefore differ in matrix, ozone supply duration, and prior electrolysis as well as in applied current. The 0 mA trials are clean water sparged for 10 min with no prior electrolysis, whereas the 125 and 175 mA trials contain 50 mg/L phenol, are sparged for 30 min, and undergo 3 min of electrolysis before ozone addition. This study is accordingly framed as a comparison between a clean-water transfer baseline and ECO dissolved-ozone trajectories, not as a factorial estimate of the causal effect of applied current. Isolating a current effect would require a 0-mA phenolic-wastewater arm run under the identical 30 min protocol, which was not performed here and is identified as future work in
Section 3.6.
In all trials, solution pH was adjusted prior to each experiment using 2 M H
2SO
4 or 1 M NaOH and verified using an Orion Star A321 pH Portable Meter (Thermo Fisher Scientific, Waltham, MA, USA) [
21] calibrated against pH buffer standards. Initial pH was set before ozone introduction and was not actively controlled during the run. All experiments were conducted at ambient laboratory temperature, which was monitored but not actively controlled. Uncertainty in reported parameters reflects the standard deviation across triplicate trials, as described in
Section 2.6.
The factorial levels were selected to span the mechanistically distinct regimes relevant to ECO operation rather than to provide evenly spaced points for response-surface interpolation. The pH levels of 3.5, 6, and 9 correspond respectively to acidic conditions where molecular ozone predominates and self-decomposition is minimal, near-neutral conditions typical of unadjusted wastewater, and alkaline conditions where hydroxide-initiated decomposition becomes significant. The applied currents of 0, 125, and 175 mA provide a no-current baseline together with two levels shown in prior work on this reactor to sustain Fe2+ generation without excessive electrode passivation. Generator settings of 4, 6, and 8 bracket the usable output range of the VMUS-4 unit, with the corresponding ozone mass flows of 3.62, 5.30, and 6.56 g/h spanning a 1.8-fold range in gas-phase driving force. Because the levels are categorical and unequally spaced, the design supports comparison between levels but does not support interpolation between them; all analyses in this work are accordingly presented as level-wise comparisons rather than as fitted response surfaces.
The two trial types followed different ozone protocols. For plain-ozonation trials (0 mA), ozone was supplied for 10 min, and the dissolved ozone concentration was then monitored through the subsequent decay phase. For electro-catalytic trials, electrical current was initiated 3 min before ozone introduction to establish initial Fe
2+ concentrations in solution via anodic dissolution; ozone flow was then started at t = 0 and maintained continuously for 30 min, with dissolved ozone recorded throughout. The 0-mA clean-water condition was selected to characterize physical gas–liquid mass transfer in the absence of any chemical ozone demand, whether from electrochemically generated iron or from dissolved organics. This baseline therefore represents the reactor’s intrinsic transfer capacity; it does not isolate the electrochemical contribution alone. The complete set of experimental trials is summarized in
Table 1; fitted mass-transfer parameters for each trial are reported in
Table 2.
2.3. Definition of the Dissolved Ozone Inventory Fraction (DOIF)
The dissolved ozone inventory fraction (DOIF) expresses the mass of ozone present as dissolved ozone in the bulk liquid at a specified evaluation time, as a percentage of the total ozone mass supplied to the reactor up to that time. It is an operational retention index rather than a transfer efficiency: it is computed entirely from liquid-phase measurements and the generator supply rate and does not constitute a closed gas-phase mass balance. DOIF was calculated as:
where
= 3.0 L is the liquid volume,
is the dissolved ozone concentration at the evaluation time (taken as the median value over the final 30 s to suppress instantaneous fluctuation),
is the ozone mass flow rate from the generator, and
is the elapsed ozone supply time at which the index is evaluated. Because both numerator and denominator depend on
, DOIF values are comparable only when evaluated at the same time. At a fixed
the denominator is identical for all trials at a given generator setting and therefore cancels, so differences between trials reduce to differences in dissolved ozone concentration alone. All DOIF values reported in this work are evaluated at a common
= 8 min, referenced to the onset of ozone supply rather than to the start of data logging. This time was selected as the latest point at which all trials remained within their active ozone-supply phase: plain-ozonation trials reached maximum dissolved ozone between 3.9 and 8.5 min after onset, and by 10 min several had entered post-supply decay, with one trial retaining only 62% of its peak concentration. Evaluation at 8 min therefore avoids comparing trials under active supply against trials already in decay.
Time in all analyses is referenced to the onset of ozone supply, defined as the first sustained rise in dissolved ozone above the pre-supply baseline. Data logging in several trials commenced before ozone flow was initiated, giving pre-supply intervals ranging from 0.2 to 6.9 min across the factorial. All values are therefore computed on this onset-referenced time base.
DOIF is fundamentally distinct from ozone transfer efficiency (OTE). OTE quantifies the total mass of ozone crossing the gas–liquid interface, including ozone that is transferred and subsequently consumed by chemical reaction, and its determination requires time-integrated inlet and off-gas ozone measurements. DOIF captures only the ozone remaining dissolved and unreacted at the evaluation time. The two coincide only in the limit of negligible chemical demand, and DOIF must not be read as a measure of total system absorption efficiency.
This distinction is central to interpreting ECO trials. Ozone reacts rapidly with dissolved species (Fe
2+, phenol, and its oxidation intermediates), so the dissolved ozone concentration can remain well below saturation even under favorable transfer conditions, depressing DOIF through chemical consumption rather than poor physical transport. Off-gas ozone was not measured in this study, so true OTE could not be determined; this limitation is revisited in
Section 3.6. To separate net retention from intrinsic transfer behavior, DOIF was interpreted alongside the volumetric mass transfer coefficient (
) described in
Section 2.4.
2.4. Determination of Volumetric Mass Transfer Coefficient ()
The volumetric mass transfer coefficient characterizes the rate of ozone transfer from the gas phase to the liquid phase. It was determined by analyzing the dissolved ozone uptake kinetics during the uptake phase of each trial. The transfer rate follows two-film theory:
where
/
is the rate of change in dissolved ozone concentration,
is the volumetric mass transfer coefficient (min
−1), C* is the saturation concentration (mg/L),
is the bulk liquid concentration (mg/L), and
represents the chemical consumption rate (mg/L min
−1).
For plain-ozonation trials at pH 3.5 and 6, in the absence of electrochemically generated iron and added organics, chemical consumption during the uptake phase is small relative to mass transfer ( ≈ 0), so the general two-film expression (Equation (2)) reduces to Equation (6) for this well-mixed batch system. The tap water matrix carries a low background ozone demand from natural organic matter, so this assumption is approximate rather than exact; the resulting bias would slightly understate the true transfer coefficient in the plain-ozonation trials.
Integration of this first-order differential equation with the initial condition
(0) = 0 yields:
The choice of this model form warrants justification, since more elaborate descriptions of reactive gas–liquid systems are available. Three considerations governed the selection. First, Equation (7) is the exact analytical solution of Equation (6) under the condition
≈ 0, and is the form conventionally used to report volumetric mass transfer coefficients for ozone in bubble columns [
8,
10]; values obtained here are therefore directly comparable with published data for the same contactor class. Second, C* was fitted rather than fixed at the value predicted by Henry’s law. The interfacial ozone concentration depends on the gas-phase ozone fraction delivered at the diffuser, which was not measured independently, and which declines along the column as ozone is absorbed. Fixing C* to a calculated value would propagate that uncertainty directly into the fitted coefficient, whereas allowing both parameters to vary lets the attainable plateau be determined by the data. Third, a model containing an explicit reaction term was considered and rejected on identifiability grounds. Estimating a separate consumption rate requires either independent measurement of Fe
2+ concentration and the relevant rate constants, neither of which was available in this work, or the addition of a third free parameter to a monotonically rising curve. In trials where the uptake trajectory had not begun to plateau within the fit window, even the two-parameter form approached the limit of identifiability, returning a fitted saturation concentration above the maximum concentration actually observed. A three-parameter form would not have been estimable. The two-parameter model was therefore retained as the most complex description the present data can support, with the resulting coefficient reported as apparent wherever chemical consumption is not negligible.
Equation (7) is fitted to the measured dissolved ozone uptake data by nonlinear least-squares regression using the nls() function in R, with both
and C* treated as free fitting parameters. This fitting procedure is applied uniformly across all trial groups (clean water and phenolic wastewater); however, the resulting parameter retains its meaning as a true mass-transfer coefficient only where chemical consumption is negligible, and is reported as an apparent, lumped coefficient (
) elsewhere. The fit window spanned the uptake phase, from the onset of ozone supply to 8 min, applied uniformly across all trials. All fits converged. Goodness of fit was assessed using the coefficient of determination (R
2) and inspection of residuals, with R
2 reported for every trial in
Table 2.
For plain-ozonation trials at pH 9, and for all ECO trials, the fitted parameter from Equation (7) is reported as an apparent value () rather than a true mass-transfer coefficient. At pH 9, alkaline ozone decomposition contributes to dissolved ozone loss during uptake, so the assumption ≈ 0 no longer holds. In ECO trials, simultaneous gas–liquid transfer and reactive ozone demand occur throughout the uptake phase; therefore represents a lumped coefficient combining transfer and consumption rather than an independent physical mass-transfer parameter, and lower values are consistent with consumption suppressing dissolved ozone accumulation rather than poorer gas–liquid contacting.
Equation (6) treats chemical consumption as occurring in the bulk liquid, which is strictly valid only in the slow-reaction regime, where reaction is slow relative to diffusion across the liquid film. The applicable regime is conventionally identified by the Hatta number, which compares the rate of reaction within the film to the rate of physical transfer across it. Where the Hatta number is small, reaction occurs predominantly in the bulk and Equation (6) applies; where it is large, reaction occurs predominantly within the film and the transfer rate must be written with an enhancement factor E (dimensionless), giving .
The Fe2+–O3 reaction is rapid, and the ECO trials are therefore expected to fall in an intermediate-to-fast regime in which a non-negligible fraction of ozone is consumed within the liquid film rather than after equilibration with the bulk. Equation (6) as applied here is consequently a simplified pseudo-homogeneous approximation for the current-bearing trials. A rigorous film-theory treatment would require explicit determination of the Hatta number and of E, which in turn requires time-resolved Fe2+ concentration, the effective film thickness, and independent knowledge of kl and a; none of these were measured in this work. The practical consequence is that the coefficient fitted to ECO trials lumps together the physical transfer coefficient, the interfacial area, and any film-reaction enhancement, and cannot be decomposed into these components from liquid-phase data alone. This reinforces the interpretation adopted throughout: the apparent coefficient is an empirical descriptor of the observed uptake trajectory rather than a physical mass-transfer parameter, and comparisons between trials reflect differences in the combined supply–consumption balance rather than in contacting performance.
2.5. Normalized Approach to Saturation
To compare uptake behavior across operating conditions, dissolved ozone data from each trial were normalized by the observed maximum concentration. This places trials conducted under different ozone settings and pH levels on a common basis, revealing differences in the rate of approach to saturation independent of the absolute concentration attained. Normalization is applied in
Section 3.4.
2.6. Data Processing and Statistical Analysis
All data processing, curve fitting, and statistical analyses were performed using R statistical software (version 4.5.3, R Core Team (Vienna, Austria), 2026) [
22]. Dissolved ozone time series from the AquaSensors probe were synchronized with experimental timestamps and screened for isolated readings inconsistent with the surrounding record, which were treated as probe artifacts and excluded. Each experimental condition was performed in triplicate, and dissolved ozone series were averaged across replicates at each time point prior to fitting, so nonlinear least-squares estimation was performed on the replicate-mean series for each condition rather than on individual replicates. Fitting used the nls() function with the port algorithm for robust convergence, and goodness of fit was assessed by R
2 for each trial. Error bars in the figures that follow represent the standard deviation across triplicate trials: for fitted coefficients, the standard deviation of the coefficient; for DOIF, the standard deviation at the 8-minute evaluation time. Fitted parameters for all trials are reported in
Table 2, and measured series with overlaid fits are shown for all 27 trials in
Figure S1 in the Supplementary Materials.
3. Results and Discussion
3.1. Plain Ozonation: Establishing the Mass Transfer Baseline
To establish baseline mass transfer performance independent of electrochemical reaction effects, plain-ozonation experiments (0 mA) were conducted in clean water across the three pH levels (3.5, 6, and 9) and three ozone settings (4, 6, and 8) of the factorial design. These baselines serve two purposes: quantifying the intrinsic gas–liquid transfer characteristics of the bubble-diffuser reactor and providing a reference against which electro-catalytic ozonation (ECO) performance is compared in the following sections. The stability of dissolved ozone is strongly pH-dependent. Under acidic conditions, ozone is relatively stable in solution because hydroxide-initiated decomposition is slow. As pH increases, hydroxide ions (OH
−) accelerate a radical chain decomposition that lowers the dissolved ozone concentration the system can sustain [
23]. This decomposition pathway is expected to manifest most clearly once the ozone supply is removed, when decay is no longer offset by continued transfer.
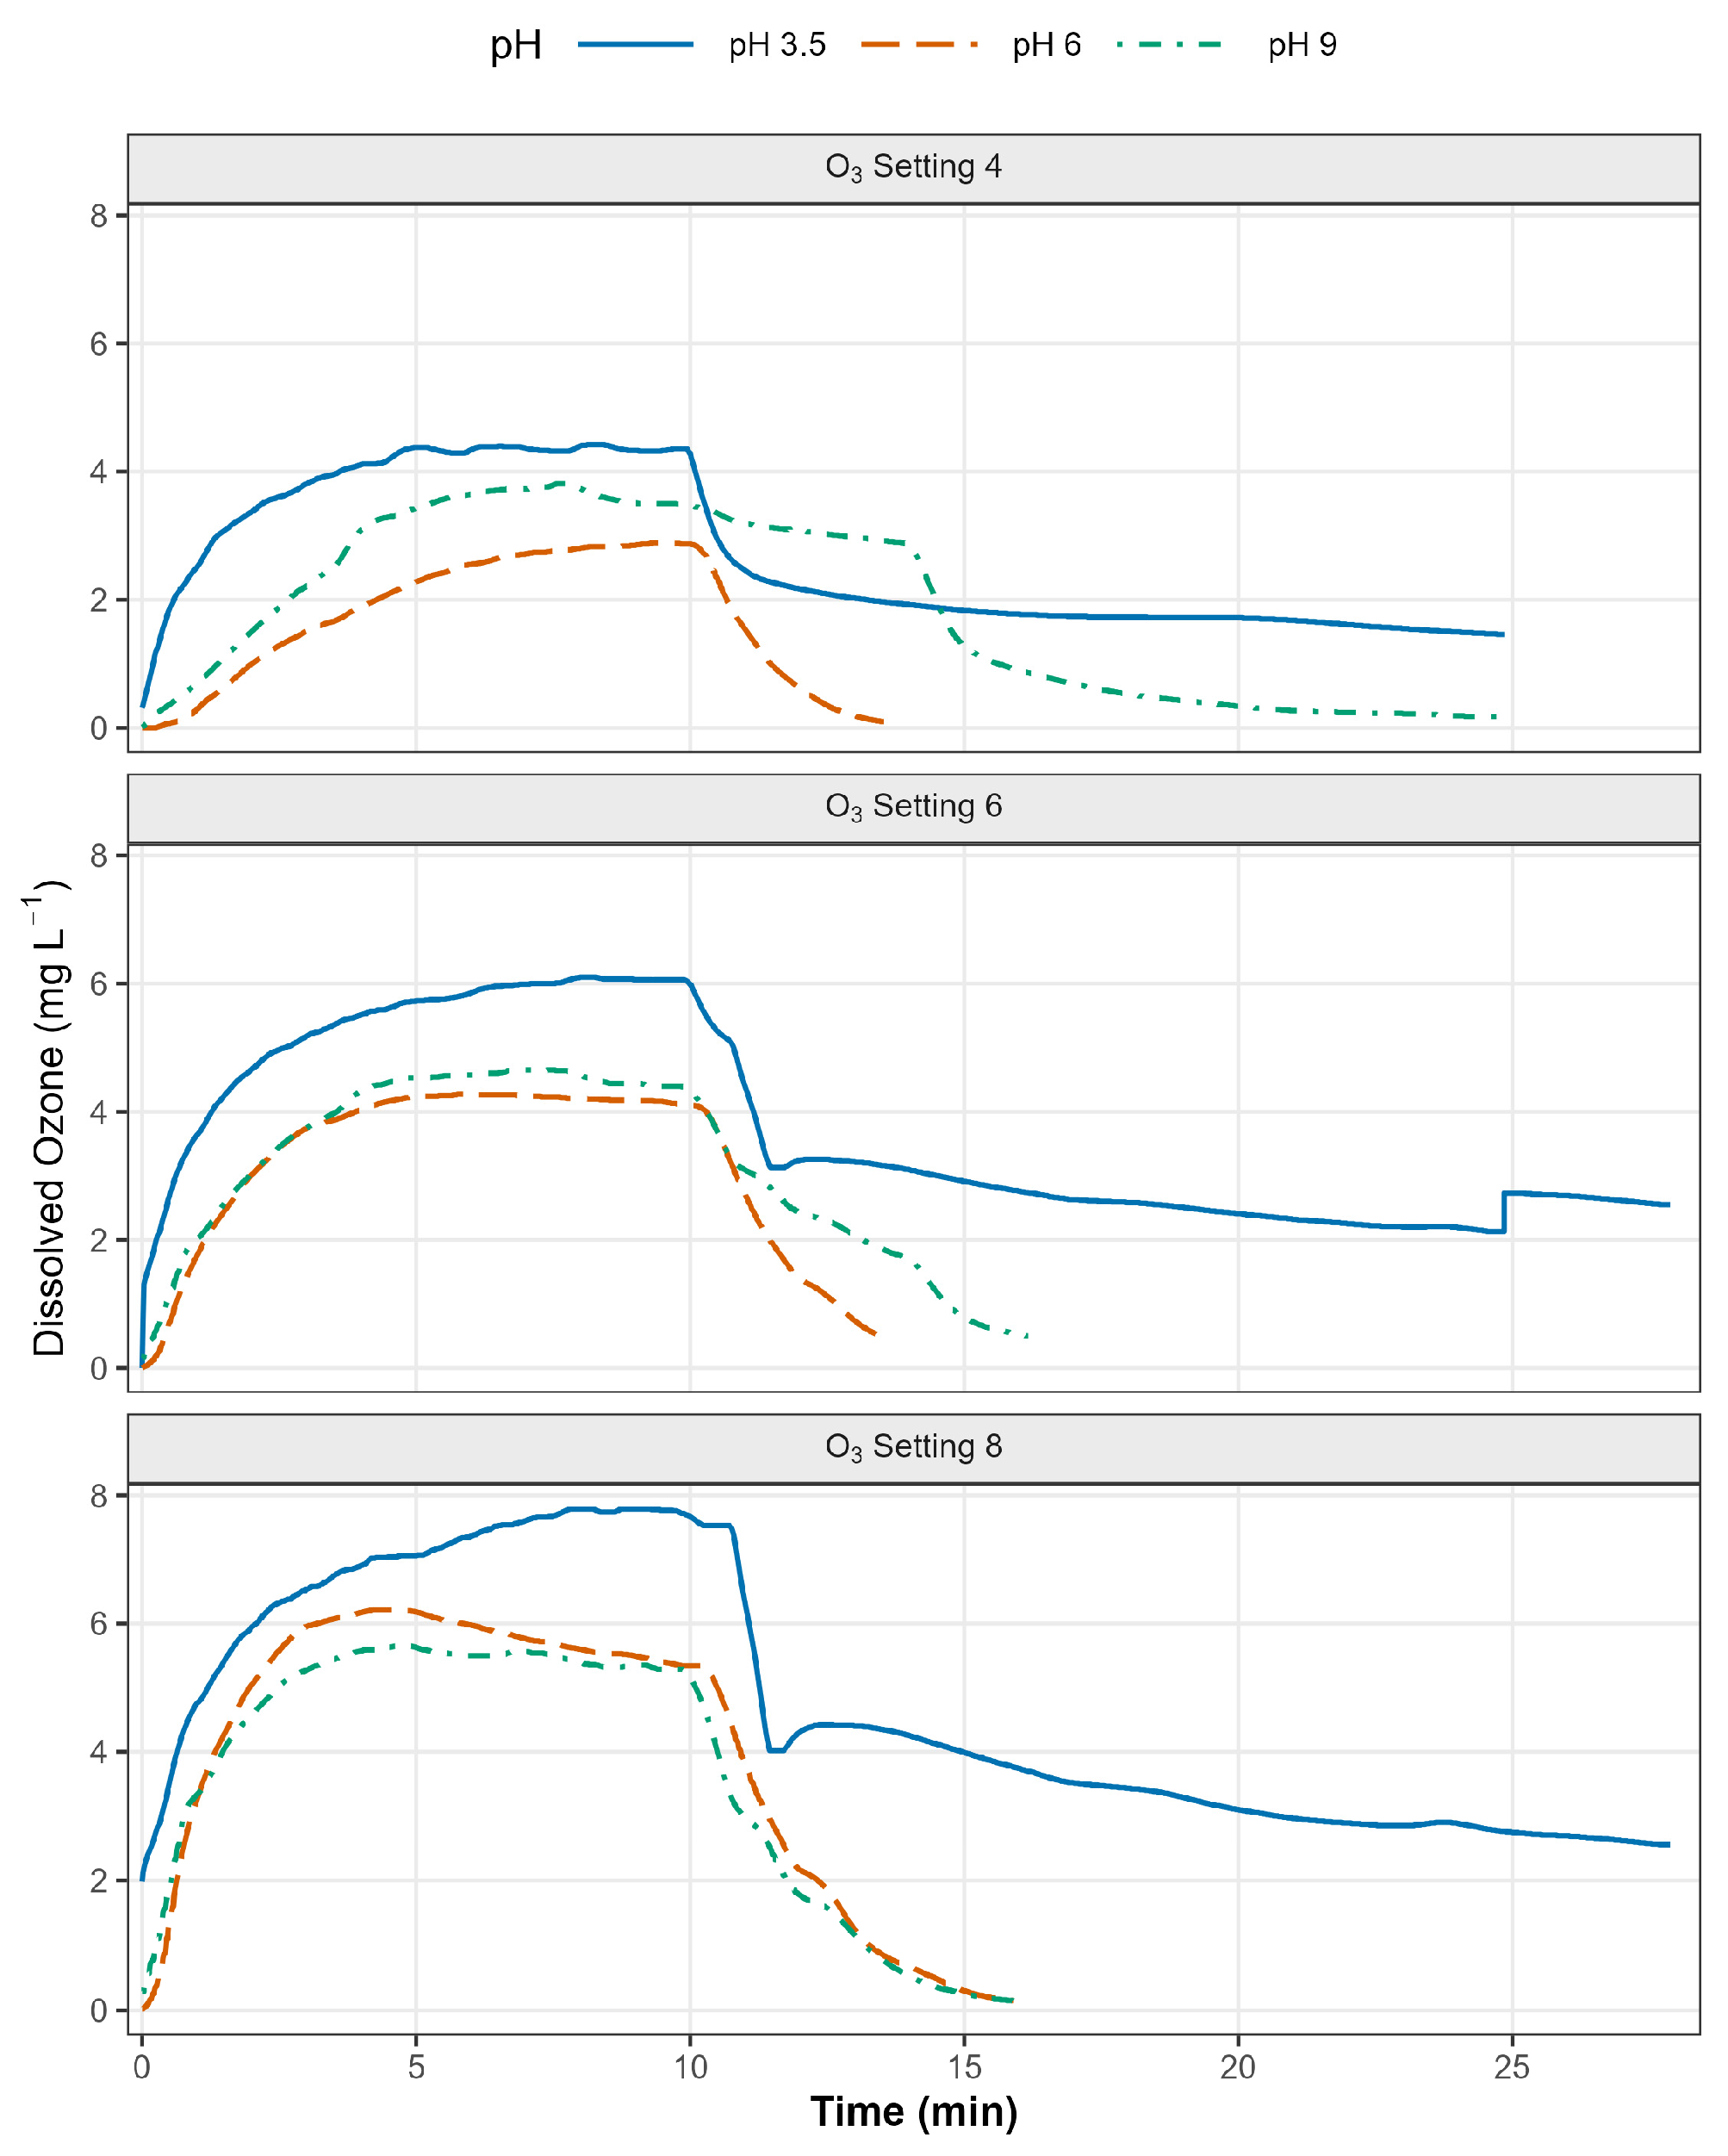
Figure 1 presents dissolved ozone profiles in clean water for each ozone setting. During the uptake phase, all conditions exhibited a smooth, monotonic approach toward a plateau, the characteristic signature of transfer-limited dissolution. The plateau concentration scaled with ozone setting at fixed pH, rising from Setting 4 to Setting 8 as the higher gas-phase ozone partial pressure increased the saturation driving force. At pH 3.5, plateau concentrations increased from approximately 4.3 mg/L at Setting 4 to 7.8 mg/L at Setting 8, consistent with Henry’s-law expectation that the saturation concentration rises with inlet ozone fraction.
The corresponding fitted saturation references (C* ≈ 4.27, 5.74, and 7.22 mg/L for Settings 4, 6, and 8) confirm this near-linear scaling. During the uptake phase, the pH dependence was modest, and at Settings 4 and 6 the pH 9 trace tracked at or slightly above pH 6, indicating that decomposition did not strongly suppress accumulation while active sparging continued to replenish dissolved ozone. The pH dependence emerged decisively in the decay phase following ozone shutoff. After the supply was stopped, dissolved ozone at pH 6 and pH 9 declined steeply, whereas pH 3.5 retained a substantial residual concentration well beyond the end of sparging. This divergence reflects the hydroxide-initiated decomposition mechanism: at higher pH, decay is governed by rapid radical-chain decomposition, while at pH 3.5 the slow decomposition kinetics allow dissolved ozone to persist.
The fitted k values capture this behavior, and for the pH 9 trials the coefficient is reported as apparent (
) because alkaline decomposition contributes to dissolved ozone loss during uptake as well, as discussed earlier in
Section 2.4. Taken together, the plain-ozonation baselines establish two reference points for the ECO analysis that follows: the saturation concentrations achievable by physical transfer alone at each ozone setting, and the pH-dependent decomposition that operates even without electrochemically generated iron. Against these baselines, the ECO trials, examined in
Section 3.2,
Section 3.3 and
Section 3.4, exhibit markedly suppressed dissolved ozone accumulation, consistent with an additional reactive ozone demand under ECO conditions.
3.2. Volumetric Mass Transfer Coefficient () Determination
To quantify gas–liquid transfer performance, the volumetric mass transfer coefficient was determined by nonlinear regression of the dissolved ozone uptake profiles (Equation (7)). For plain-ozonation trials at pH 3.5 and 6, where chemical consumption during uptake is negligible, the fitted parameter represents the physical transfer coefficient
. For plain-ozonation trials at pH 9 and for all ECO trials, where ozone consumption proceeds concurrently with transfer, the fitted parameter is designated as the apparent coefficient
to distinguish it from the physical transfer rate. Regression used the nls() function in R, with goodness of fit assessed by R
2. The resulting values across all 27 trials are summarized in
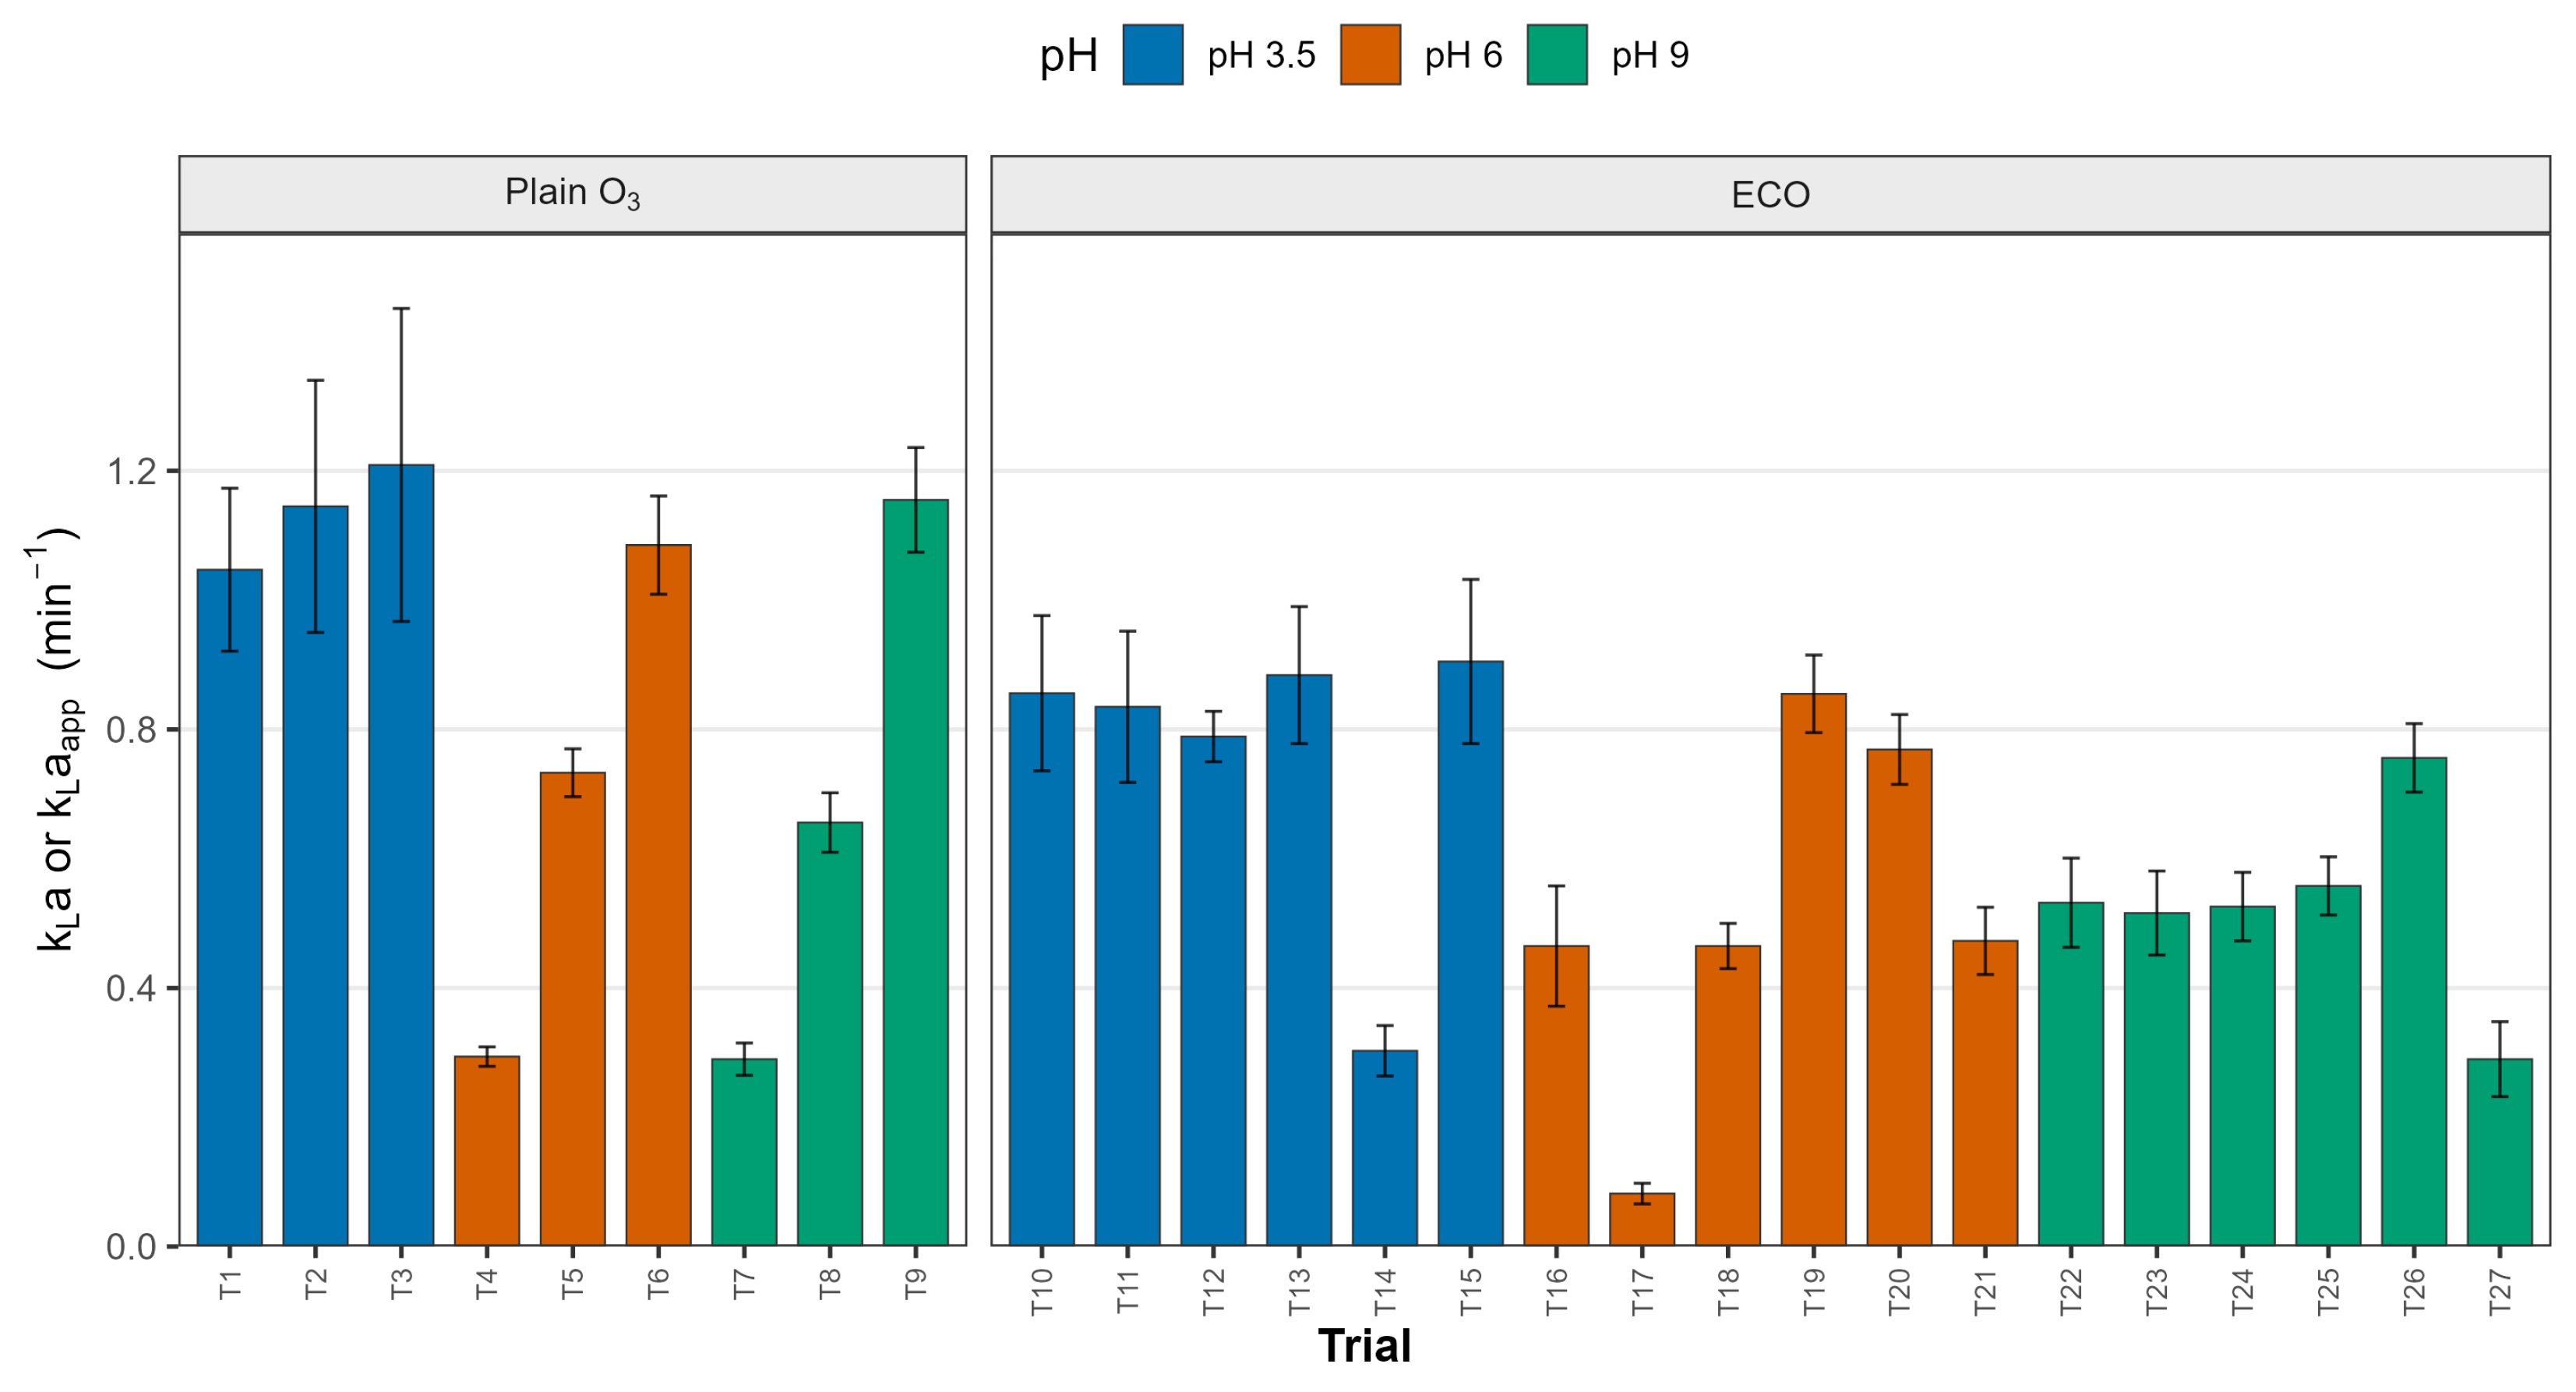
Figure 2 (error bars represent the standard deviation across triplicate trials (n = 3)).
For plain-ozonation trials,
ranged from 0.290 min
−1 (T7) to 1.209 min
−1 (T3). At pH 3.5, where ozone decomposition is slowest,
increased with ozone setting (1.047, 1.145, and 1.209 min
−1 for Settings 4, 6, and 8), reflecting the genuine physical transfer behavior of the reactor. These values fall within the range reported for ceramic-diffuser bubble columns [
8,
9], confirming expected baseline performance. The lowest plain-ozonation values occurred at Setting 4 (0.294 min
−1 at pH 6, T4; 0.290 min
−1 at pH 9, T7), where the modest transfer driving force of the lowest ozone setting limits uptake. At pH 9, where the fitted parameter is apparent rather than physical, part of this reduction additionally reflects alkaline decomposition competing with transfer rather than poorer gas–liquid contacting.
The ECO trials did not show a uniform suppression of
relative to the plain-ozonation baselines. Instead,
spanned nearly the full range observed for plain ozonation, from 0.082 min
−1 (T17) to 0.905 min
−1 (T15), with a median of 0.53 min
−1 and fifteen of the eighteen ECO trials falling between 0.46 and 0.91 min
−1, overlapping the plain-ozonation range. This scatter is itself diagnostic. Because
is fitted to a dissolved ozone trajectory shaped simultaneously by gas–liquid transfer and reactive ozone demand, its value tracks the local balance between ozone supply and consumption within each operating cell rather than an intrinsic transfer property of the reactor. A low
therefore indicates that consumption is suppressing dissolved ozone accumulation, not that the reactor transfers ozone more slowly; the physical hardware is unchanged across the 0, 125, and 175 mA trials.
should accordingly be interpreted as an apparent lumped coefficient combining transfer and consumption, and not as an independent physical mass-transfer parameter. The response to applied current was not uniform. At pH 6 and Setting 6, the fitted parameter fell from 0.733 min
−1 at 0 mA (T5) to 0.082 min
−1 at 175 mA (T17), whereas the corresponding 125 mA trial (T20) returned 0.769 min
−1, essentially unchanged from the plain-ozonation baseline. Comparable irregularity appears elsewhere in the factorial. This behavior is expected of a lumped parameter: because the fitted coefficient responds to the shape of the uptake trajectory rather than to transfer alone, trials in which dissolved ozone rises steadily without approaching a plateau return low values irrespective of the underlying contacting performance. Dissolved ozone accumulation itself, quantified by DOIF in
Section 3.3, declines consistently with applied current and provides the more reliable indicator of the supply–consumption balance.
3.3. Dissolved Ozone Inventory Fraction (DOIF)
The dissolved ozone inventory fraction (DOIF) quantifies the fraction of supplied ozone retained as dissolved ozone in the bulk liquid at the evaluation time (Equation (5)), serving as an operational measure of net dissolved ozone retention. It should not be interpreted as total ozone utilization, because ozone transferred and subsequently consumed by reaction is not captured without off-gas and reaction-product mass balances. The interpretation of a low DOIF therefore differs between trial types. In plain-ozonation trials, where chemical demand is minimal, DOIF reflects the genuine ceiling of physical gas–liquid transfer in the reactor. In ECO trials, a low DOIF instead reflects rapid reactive ozone demand, so the value represents net retention against an active consumption demand rather than transfer performance alone. The resulting DOIF values across all 27 trials are presented in
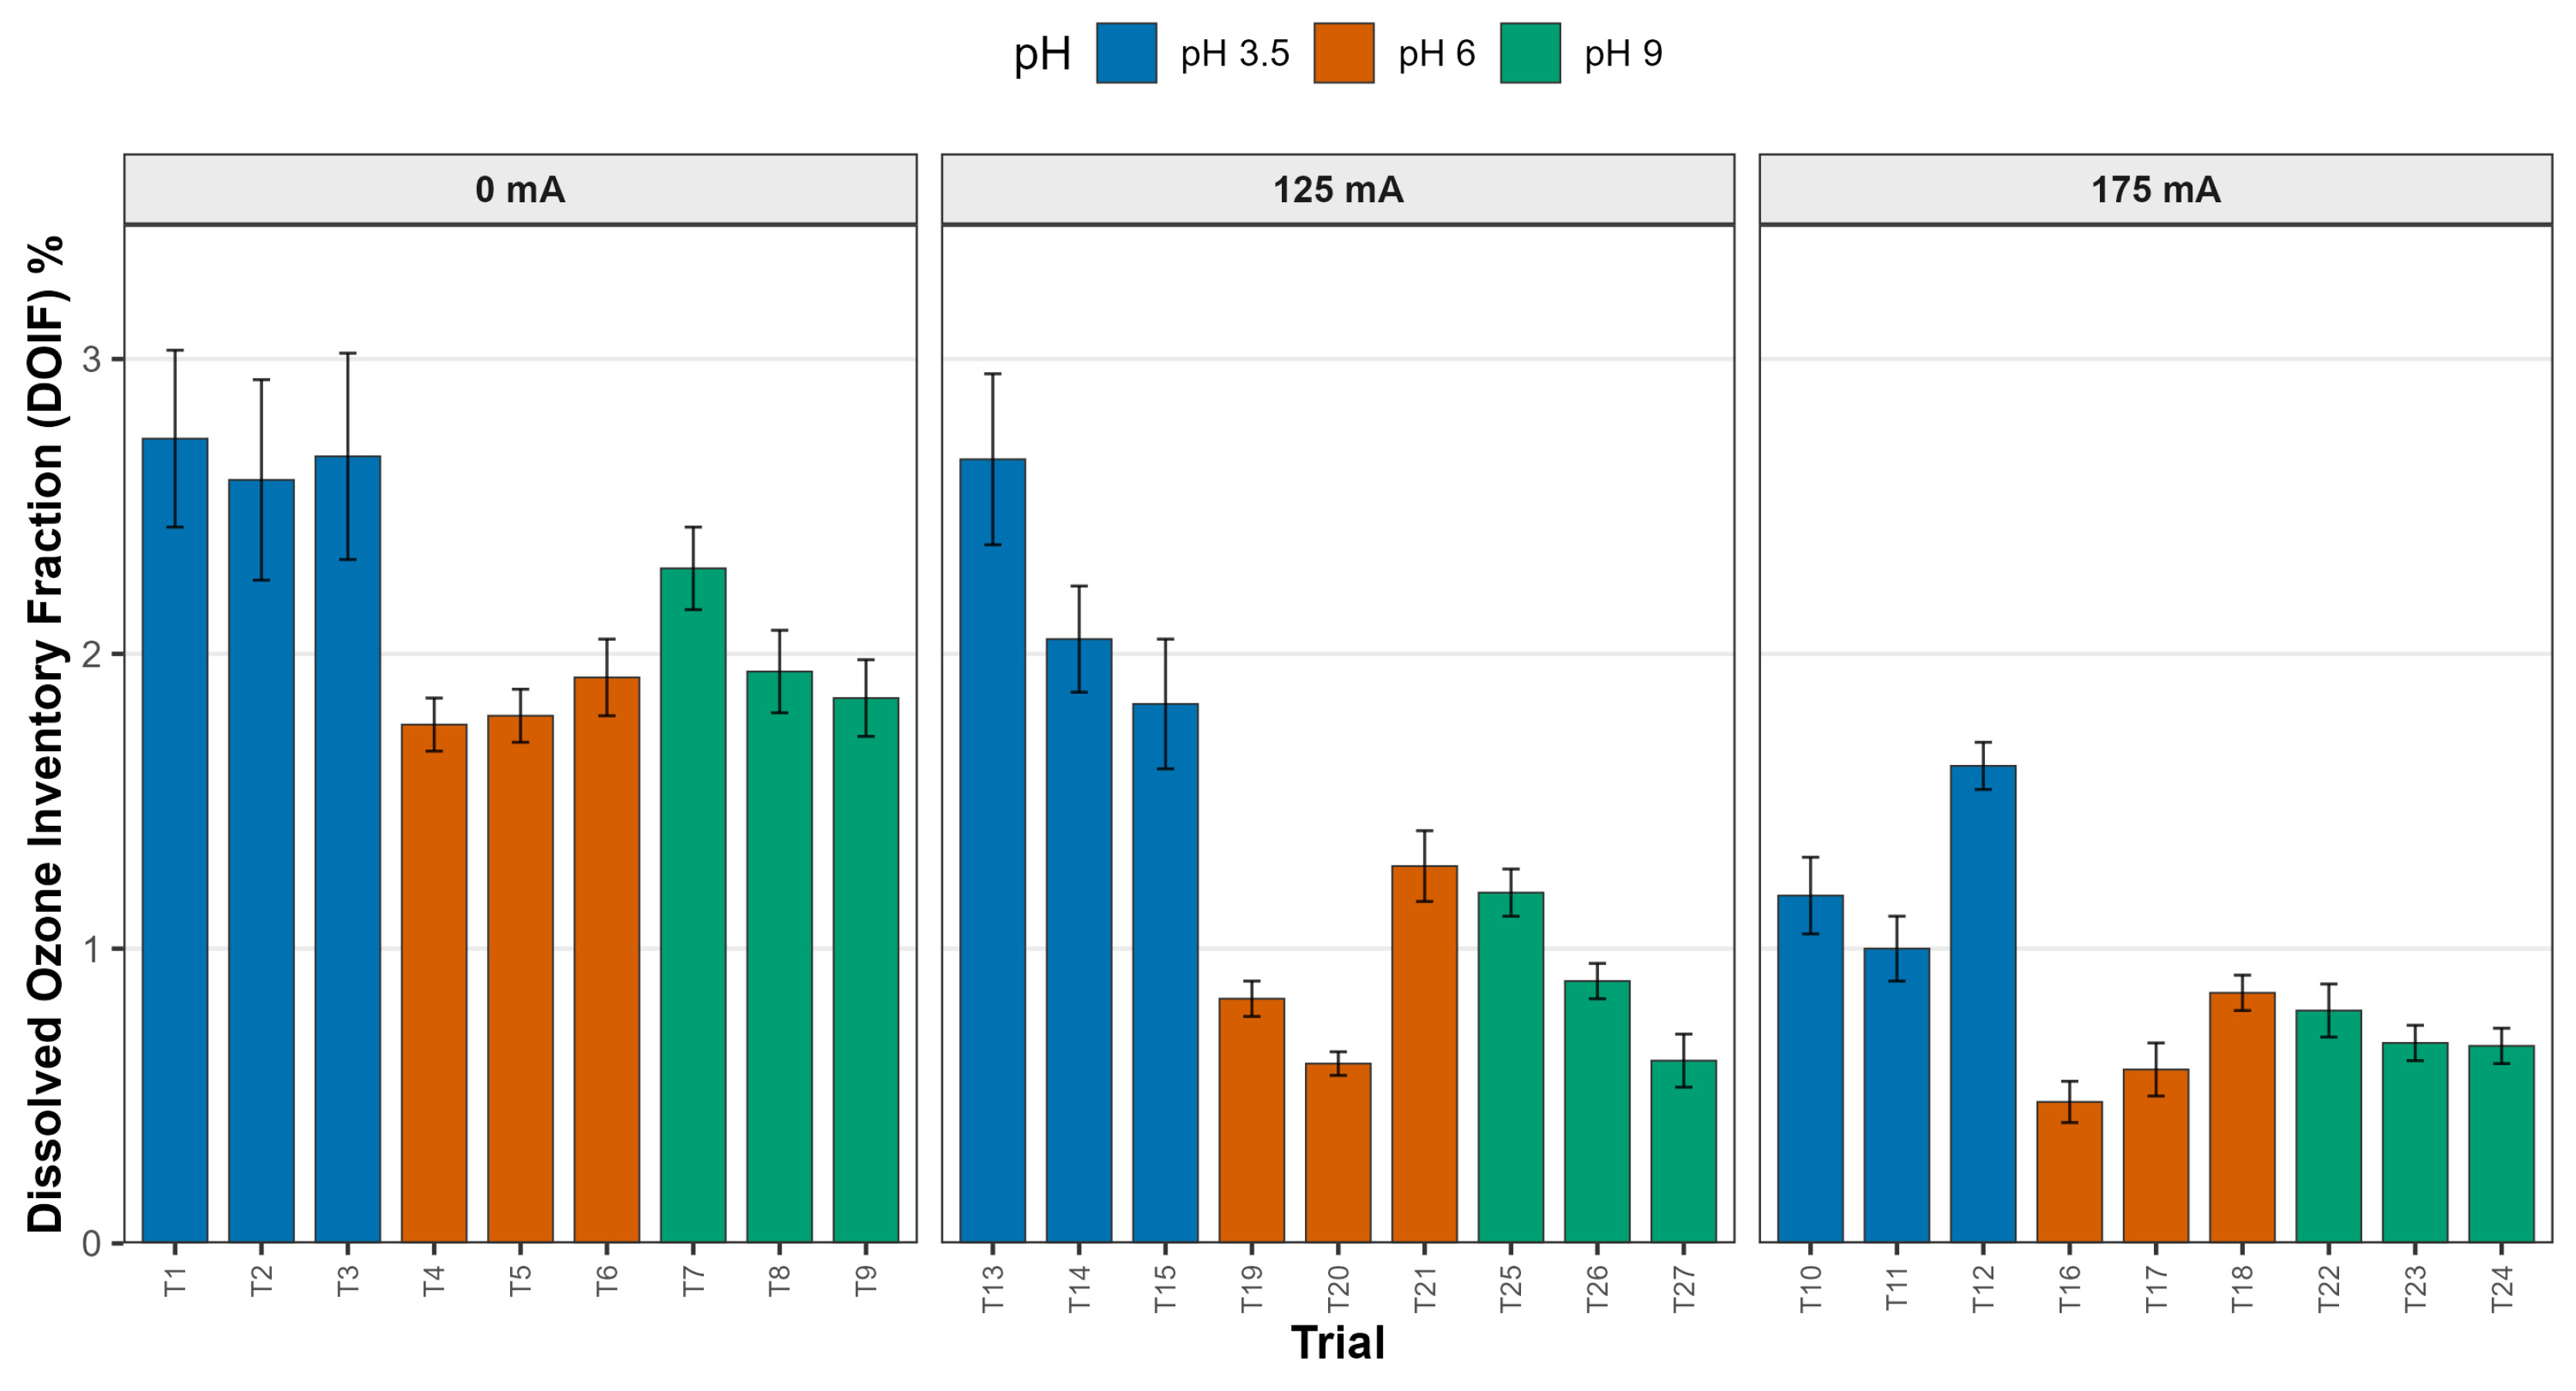
Figure 3 (error bars represent the standard deviation across triplicate trials (n = 3)).
Plain-ozonation DOIF ranged from 1.76% (T4) to 2.73% (T1), with pH 3.5 trials at the upper end (2.59–2.73%) and pH 6 trials at the lower end (1.76–1.92%). Even under the most favorable acidic conditions, only about 2.7% of the supplied ozone was retained as dissolved ozone at the 8 min evaluation time. This low ceiling is characteristic of ceramic-diffuser bubble columns, where large bubble size, short gas residence time, and limited interfacial area constrain transfer regardless of solution chemistry [
14,
16]. These baselines therefore establish the upper bound of dissolved ozone retention achievable in this reactor configuration.
ECO trials showed reduced DOIF relative to the plain-ozonation baselines, falling to 0.48–2.66%, a 1.0- to 3.7-fold reduction depending on condition. The highest ECO values occurred at pH 3.5 under 125 mA (T13, 2.66%; T14, 2.05%; T15, 1.83%), where the combination of low pH and lower current minimizes the reactive ozone demand, allowing a greater fraction of transferred ozone to persist in the bulk liquid. The lowest values occurred at pH 6 under 175 mA (T16, 0.48%; T17, 0.59%), where higher current sustains a greater reactive demand throughout the sparging period. Across the factorial, the pattern is consistent at a given pH and ozone setting: raising the current from 125 to 175 mA lowered DOIF in eight of the nine cells, and DOIF was consistently highest at pH 3.5, falling sharply and to a comparable degree at pH 6 and pH 9. This indicates that the balance between ozone supply and combined Fe2+/decomposition demand, rather than pH or ozone dose acting independently, governs net dissolved ozone retention in ECO operation.
Throughout this work, reactive ozone demand denotes the combined rate at which dissolved ozone is consumed under ECO conditions, comprising Fe
2+-mediated reactions, oxidation of phenol and its intermediates, and hydroxide-initiated decomposition at elevated pH. The present design cannot separate the relative contributions of these three pathways. It is essential to distinguish physical transfer limitation from reaction-driven consumption when interpreting these values. The low ECO DOIF is unlikely to indicate poor gas–liquid transfer, since the reactor hardware is unchanged from the plain-ozonation baselines. It is instead consistent with a reaction-sink effect, in which dissolved ozone is consumed as rapidly as it transfers, holding the bulk concentration low. This reactive ozone demand has two inseparable contributions in the present design: Fe
2+-mediated reactions sustained by continuous anodic dissolution, and oxidation of phenol and its intermediates, which are present only in the current-bearing arms. Attributing the suppression predominantly to Fe
2+ would require a 0-mA phenolic-wastewater control under the same 30 min protocol, together with time-resolved Fe
2+ and off-gas ozone measurement; none of these were performed here, and they are identified as priorities for future work. Silva et al. [
17] reported analogous two-stage behavior in photolytic and photocatalytic ozonation, where transfer yield remained high while fast-reacting species were abundant and declined as the system shifted toward transfer control. Some fraction of this consumption occurs within the liquid film rather than in the bulk (
Section 2.4); the distinction does not affect the interpretation of DOIF, which measures the ozone remaining in the bulk regardless of where consumption occurred, but it does mean that the apparent coefficient absorbs any film-reaction enhancement.
From a process standpoint, the consumed ozone is not lost unproductively. In ECO it is consumed through Fe
2+–O
3 reactions that generate hydroxyl radicals (Equations (3) and (4)), driving pollutant oxidation. The same conditions yielded >90% COD removal in the foundational study despite low dissolved ozone retention [
10]. The limitation is instead that the bulk liquid cannot sustain appreciable molecular ozone, constraining direct ozonation pathways that require dissolved O
3, such as electrophilic attack on aromatic rings. Moreover, the measured retention (<2.8% across all trials) falls far below advanced contactor performance where Yao et al. [
13] reported transfer efficiencies above 90% in optimized pilot-scale columns and rotating packed beds and venturi injectors routinely achieve 70–95% [
11,
18].
3.4. Direct Comparison: ECO vs. Plain Ozonation Mass Transfer
The preceding sections quantified mass transfer through derived parameters (
, DOIF), which, while informative, can obscure the temporal dynamics of ozone uptake. To visualize the suppression of dissolved ozone accumulation directly, concentration profiles were compared against plain-ozonation references under identical ozone dosing.
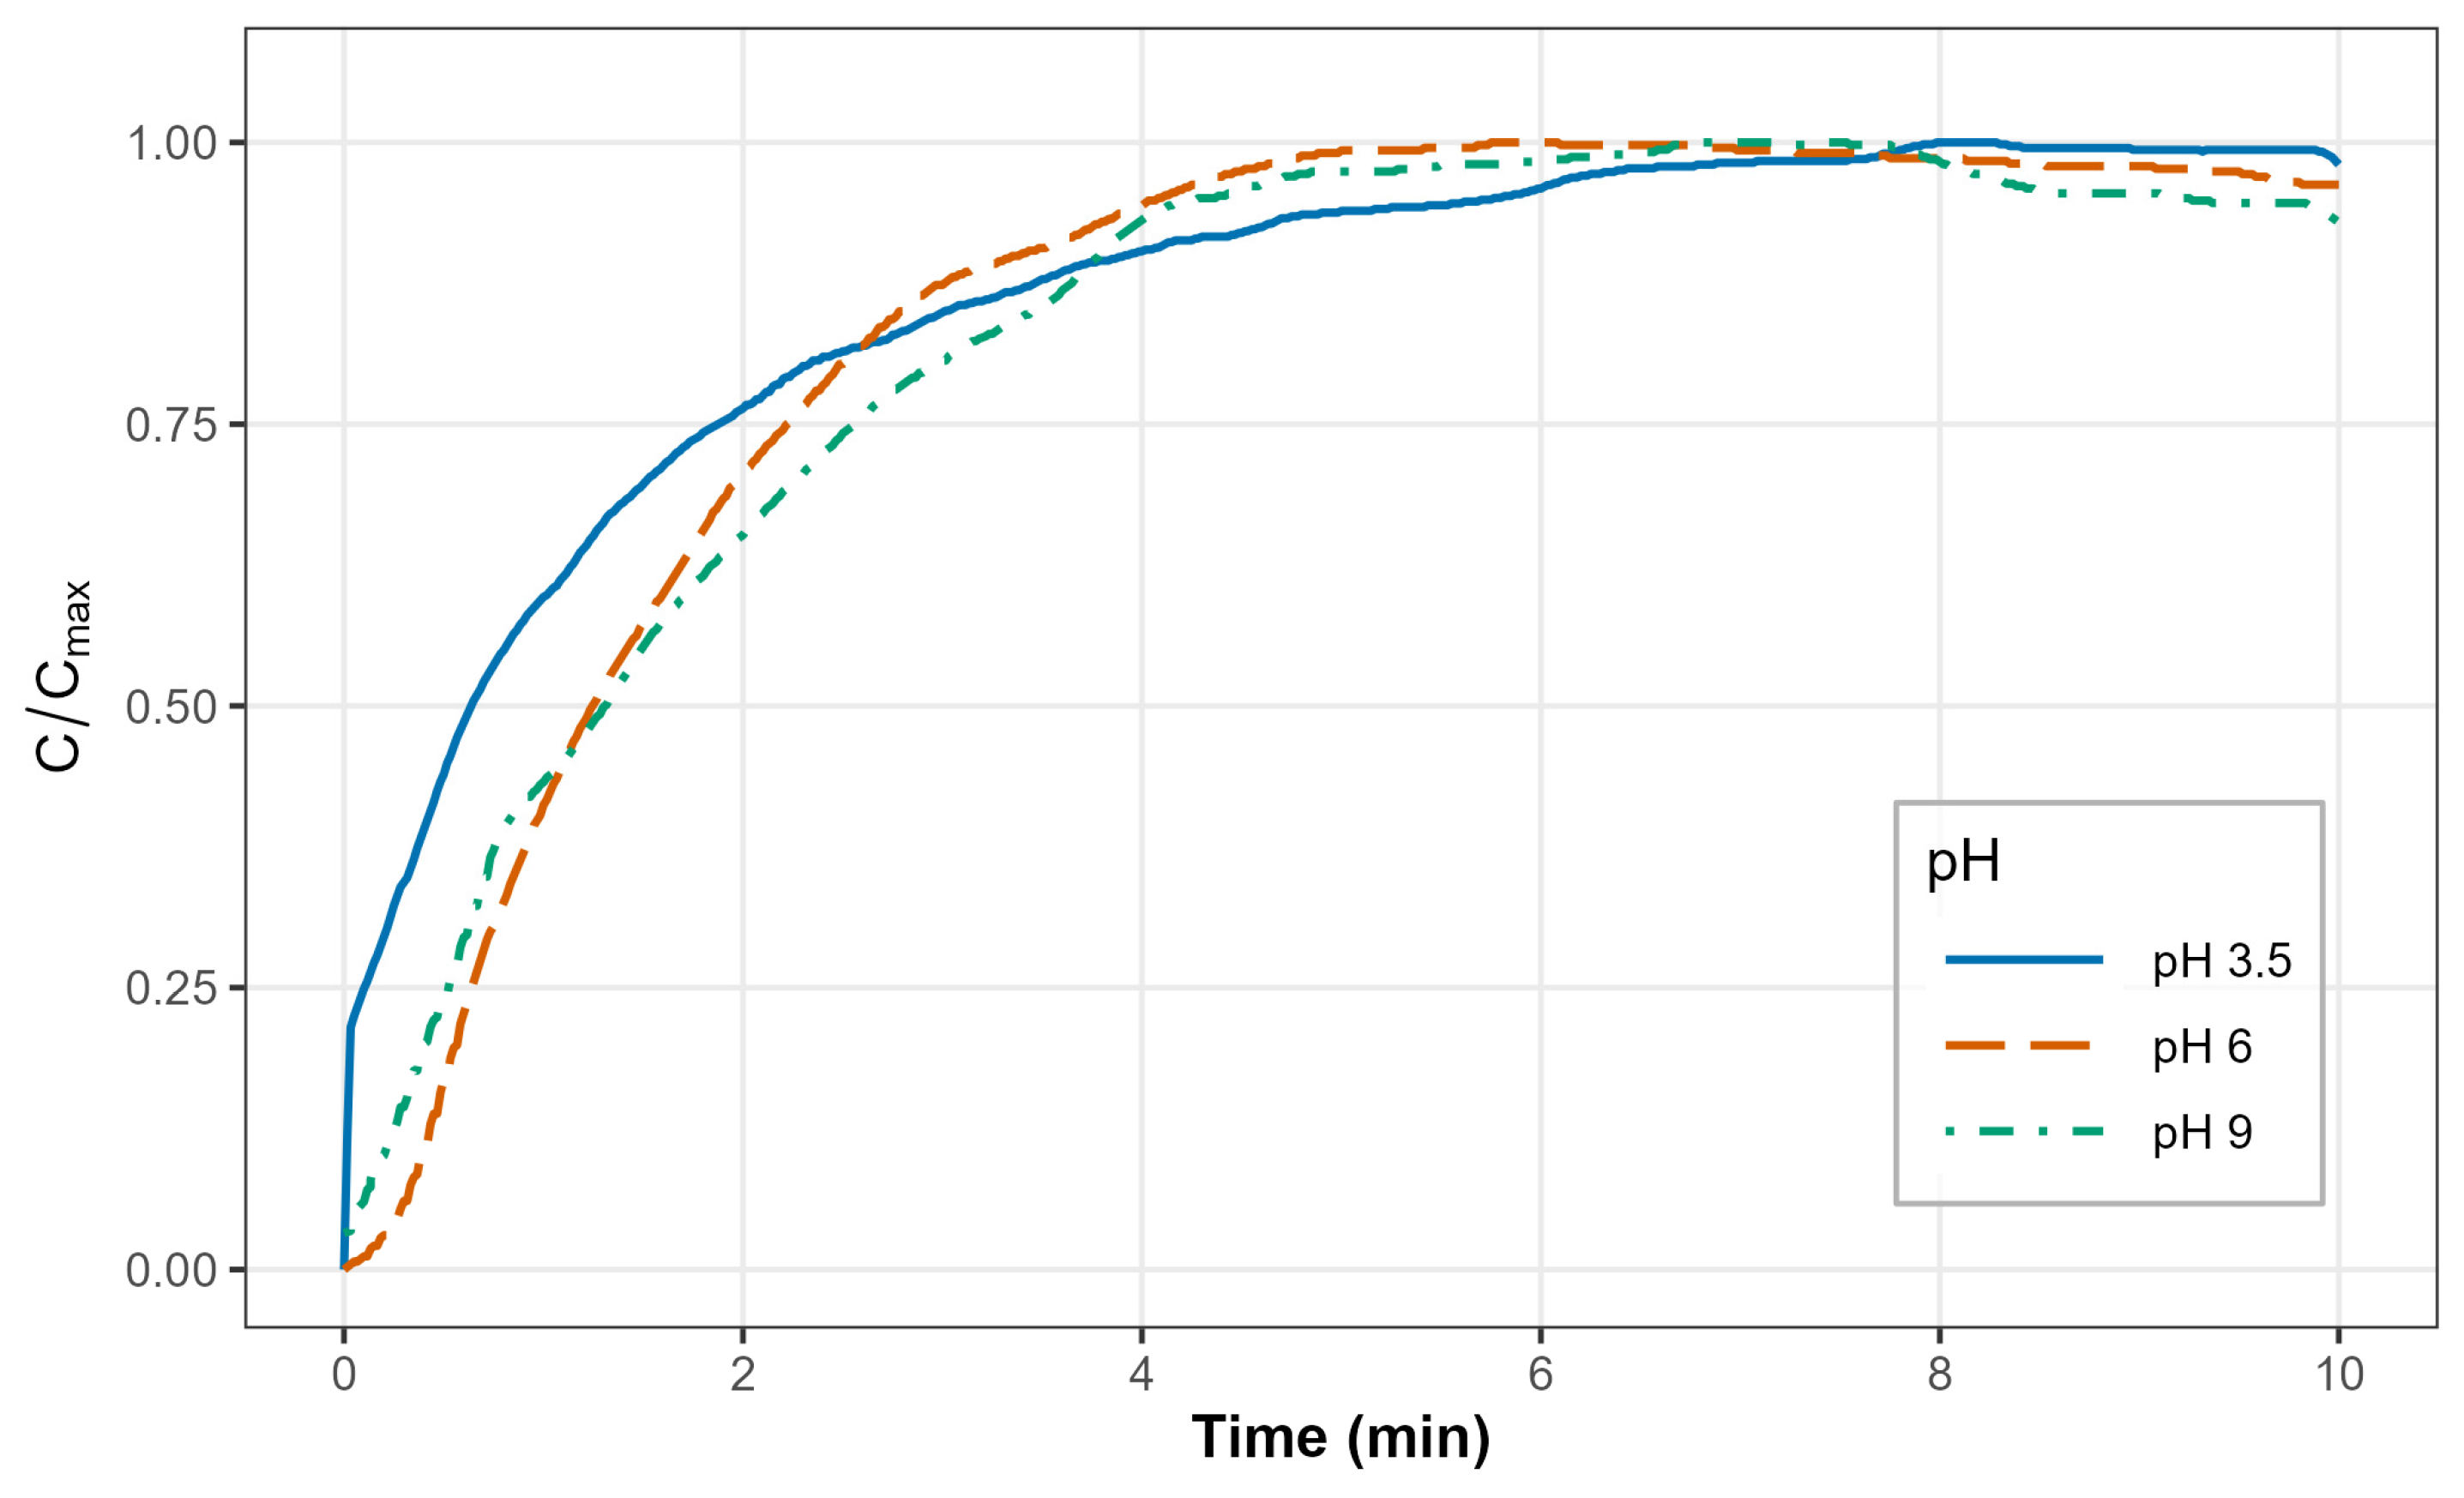
Figure 4 presents the normalized uptake (C/Cmax) for plain ozonation at pH 3.5, 6, and 9 at O
3 Setting 6, illustrating the approach to saturation during the supply period.
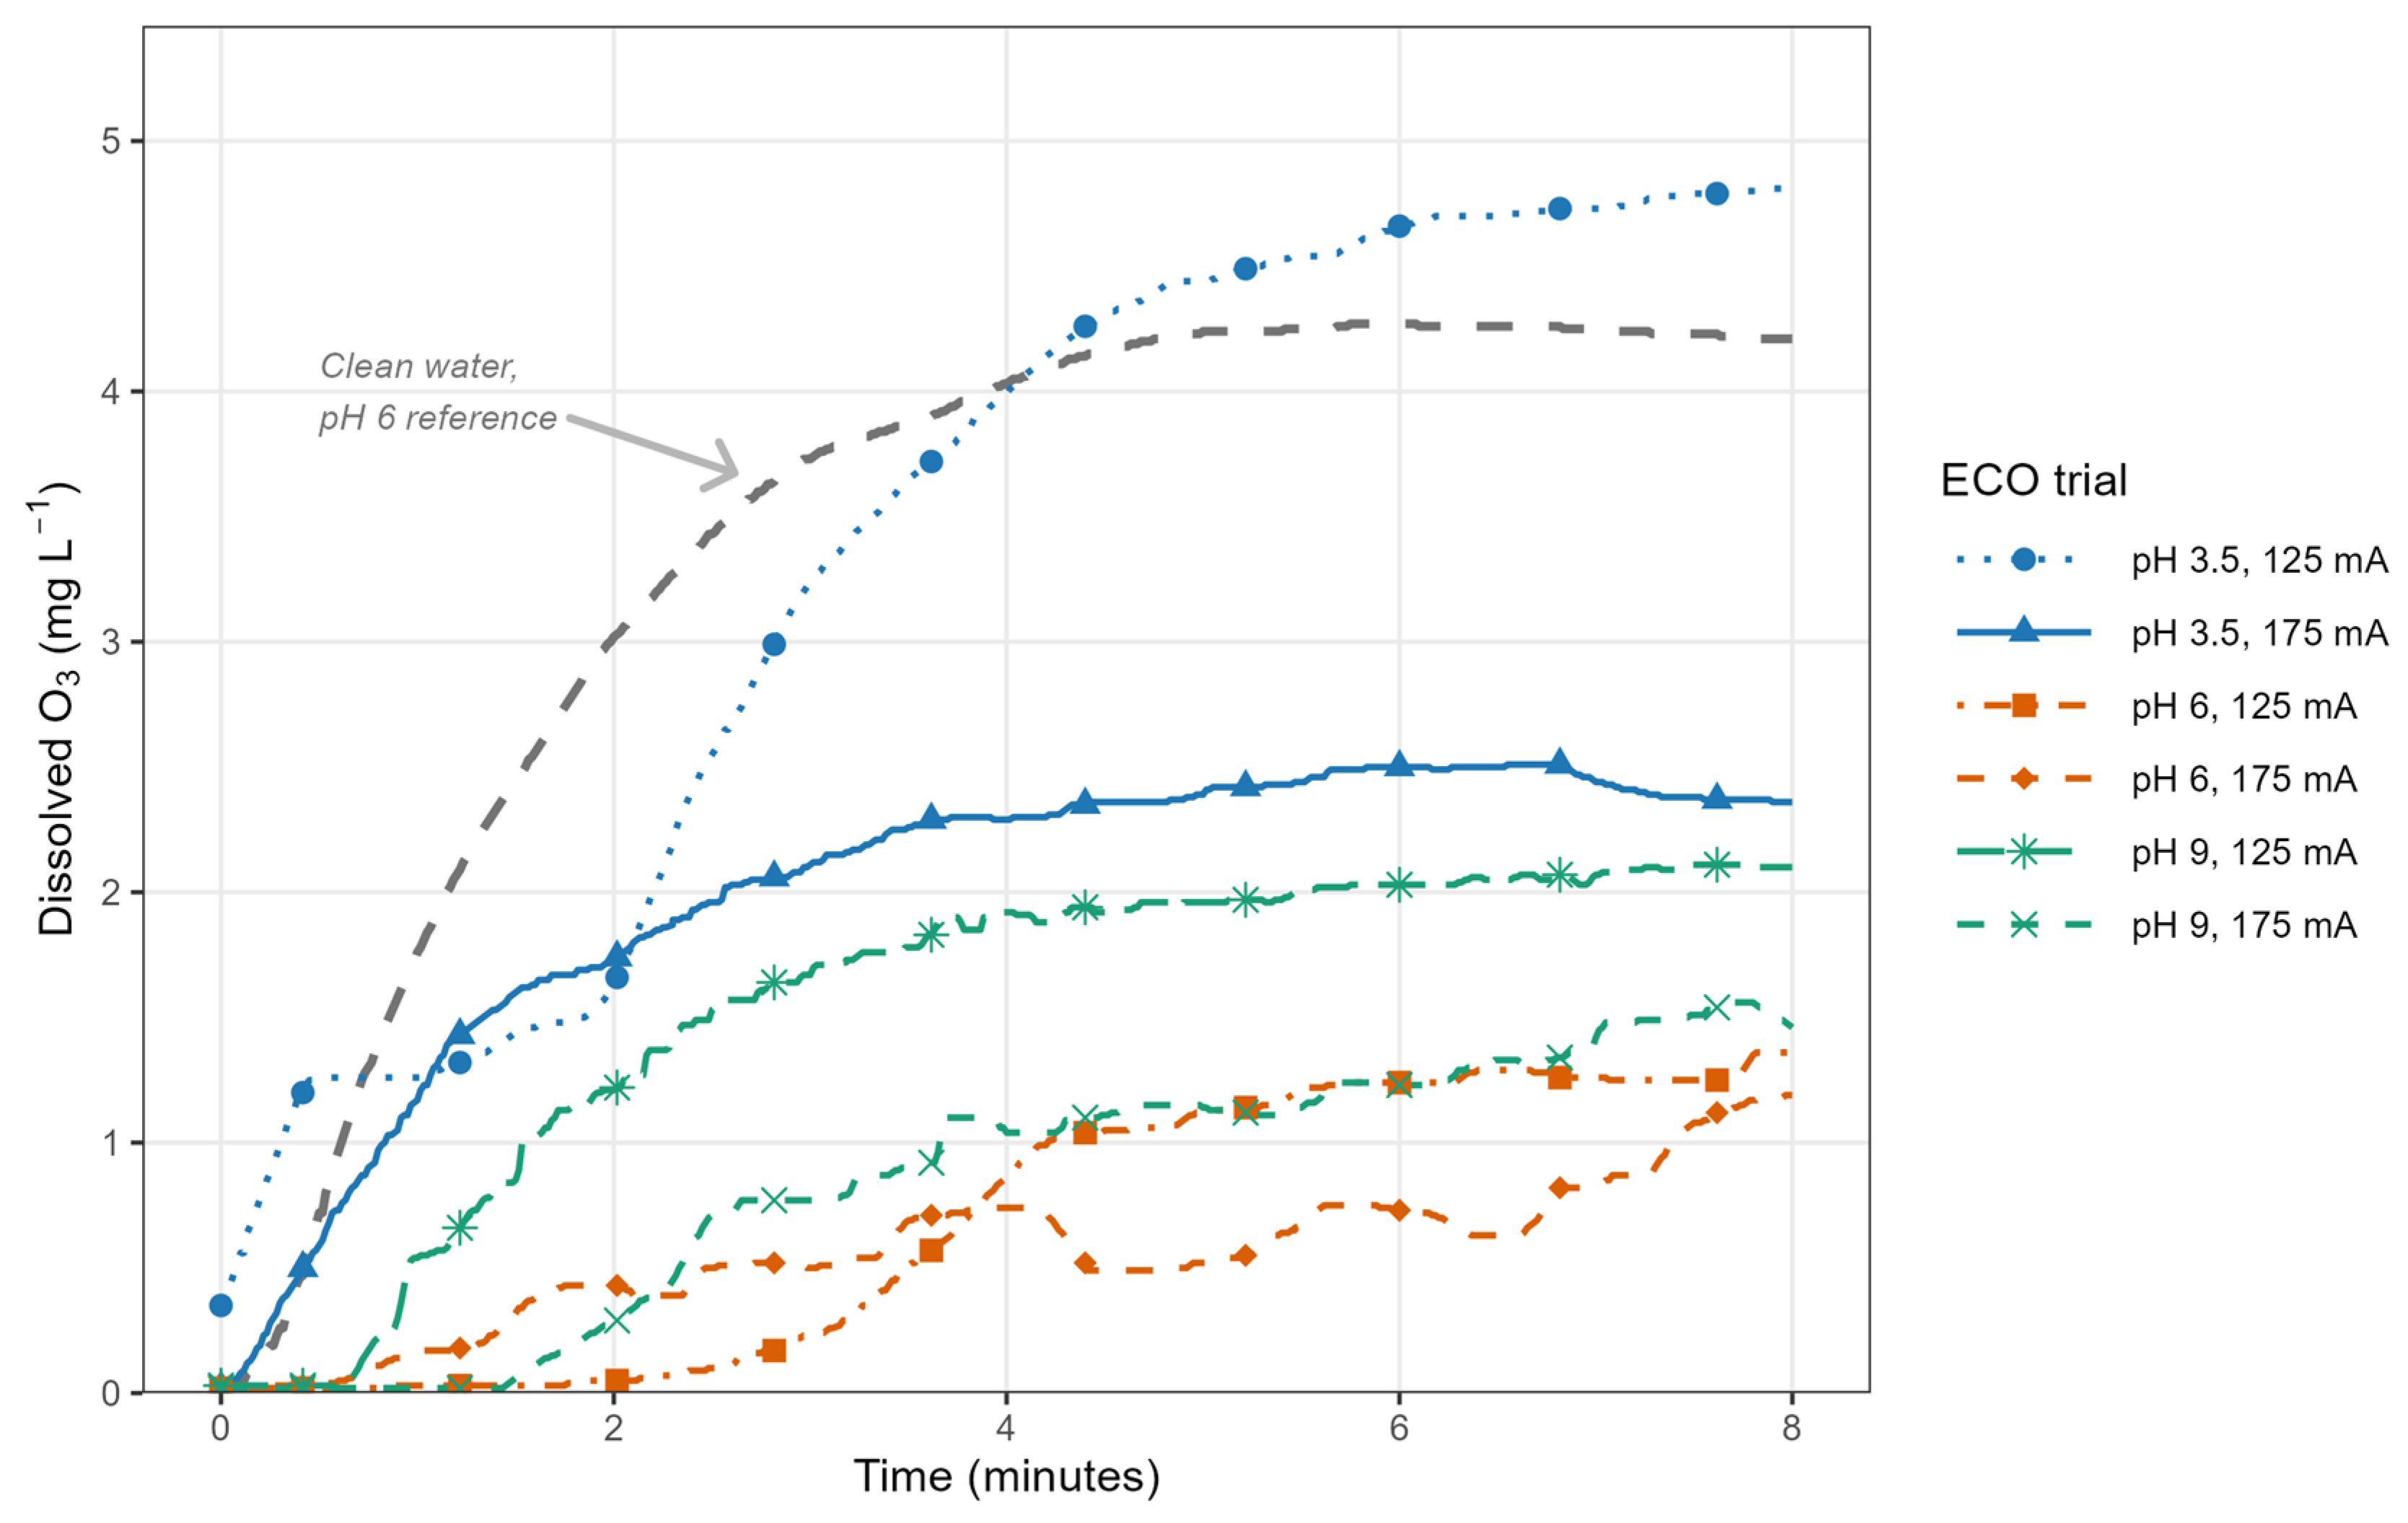
Figure 5 overlays the six Setting-6 ECO trials against the plain-ozonation pH 6 reference trajectory, showing the effects of applied current and pH on dissolved ozone accumulation under a common gas-phase driving force.
The normalized plain-ozonation curves (
Figure 4) follow the exponential approach to saturation predicted by Equation (7). At all three pH levels, dissolved ozone reached 90% of its maximum within approximately 3–4 min (3.1 min at pH 6, 3.5 min at pH 9, 3.7 min at pH 3.5), with the curves closely overlapping over the first two minutes. Despite these small differences, all three conditions attained near-complete saturation (C/Cmax ≥ 0.95) within the supply period, confirming that the reactor delivers dissolved ozone to near-equilibrium when chemical consumption is absent. In contrast, the ECO trials fell below the plain-ozonation reference and separated into a clear current- and pH-ordered cascade (
Figure 5). The most direct comparison is the pH 3.5 pair, which differ only in applied current. At 125 mA, dissolved ozone rose rapidly and exceeded the clean-water reference trajectory, reaching approximately 4.8 mg/L, whereas at 175 mA the same condition plateaued near 2.4 mg/L, roughly half as much. Because pH, ozone dose, and matrix are identical across this pair, the difference between them reflects the change in applied current. Higher current generates more Fe
2+ by anodic dissolution, which is expected to raise the reactive ozone demand and thereby suppress bulk accumulation. The same ordering holds at pH 9, where the 125-mA trial accumulated more dissolved ozone than its 175-mA counterpart throughout the window. At pH 6 the two currents produced closely comparable trajectories, with the 125-mA trial only marginally higher at the evaluation time.
pH compounded this effect: at fixed current, raising the pH lowered the accumulation trajectory. The pH 6 and pH 9 trials remained well below their pH 3.5 counterparts throughout the window, with the pH 6 trials holding near the bottom of the panel. This is consistent with alkaline ozone decomposition adding to the reactive demand, so that the two suppression mechanisms act together at high pH. The combined picture is that dissolved ozone accumulation in ECO is governed by the balance between ozone supply and the total consumption demand set jointly by current and pH, rather than by any change in the reactor’s physical transfer capacity. Taken together with the parameter analysis of
Section 3.2 and
Section 3.3,
Figure 4 and
Figure 5 show that ECO does not simply slow gas–liquid transfer; it superimposes a continuous consumption sink on an otherwise unchanged transfer process. Only the lowest-demand condition examined here (pH 3.5, 125 mA) sustained dissolved ozone above the plain-ozonation reference, while every higher-demand condition was driven below it. This reframes the low DOIF of
Section 3.3 not as a transfer deficiency but as the bulk-liquid signature of reaction-limited operation, the central rationale for the saturator concept developed in
Section 3.6.
3.5. DOIF Across the Factorial: pH–Current–Dose Interactions
Section 3.2,
Section 3.3 and
Section 3.4 examined mass transfer behavior trial by trial. To assess how dissolved ozone retention responds to the full operating space,
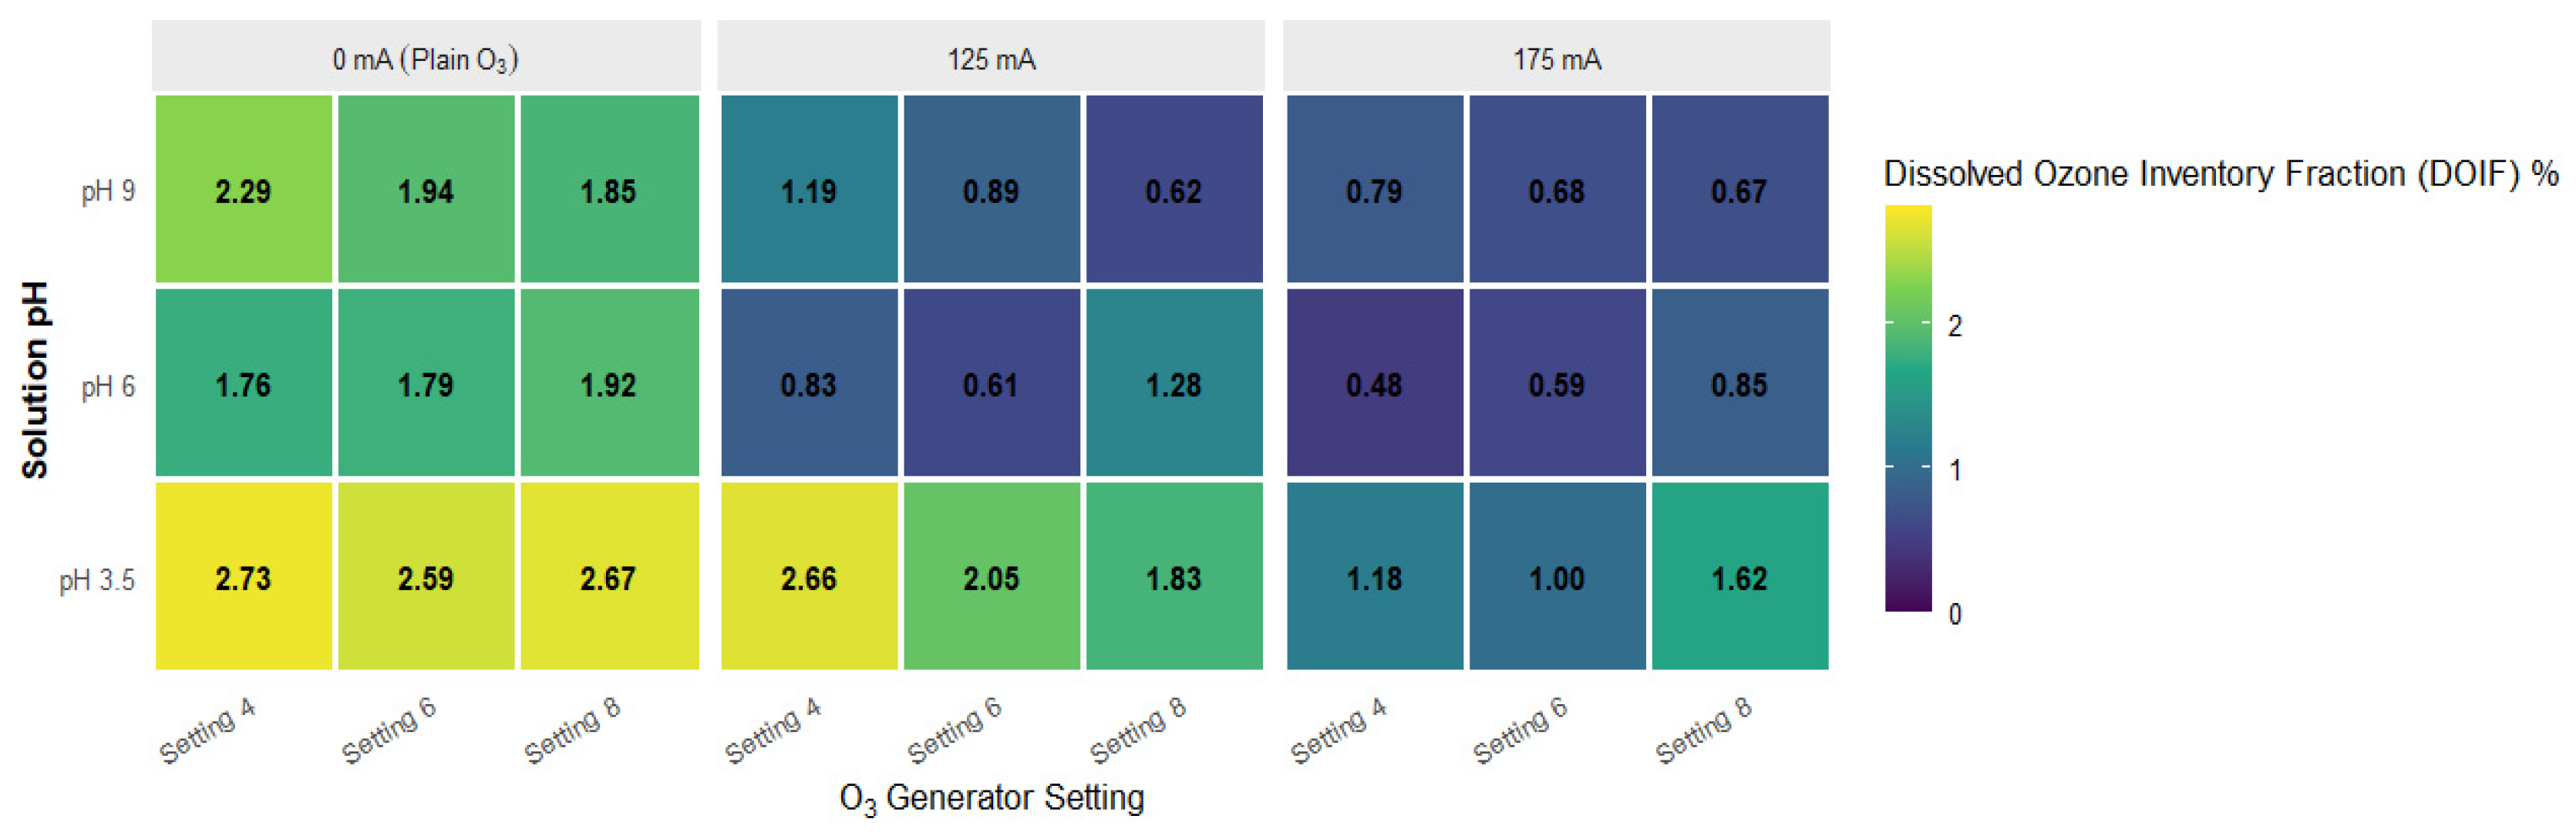
Figure 6 presents DOIF as a pH × O
3 setting grid faceted by applied current, spanning all 27 trials of the factorial design. This representation makes the dominant controls and their interactions visible simultaneously.
The most prominent feature is the discontinuity between the 0 mA panel and the two current-bearing panels. Plain ozonation occupies the high end of the scale uniformly (1.76–2.73%), with no cell falling below 1.76%. The introduction of current lowers DOIF in every cell relative to its own clean-water reference, with most ECO cells in the 0.48–1.28% range, although the pH 3.5/125 mA cells remain close to their baseline. This reduction is the clearest expression of the reaction-sink mechanism developed in the preceding sections. Because the reactor hardware and gas-phase driving force are identical across the three current panels at each (pH, setting) cell, the reduction cannot reflect a change in physical transfer capacity; it is consistent with the onset of a continuous reactive ozone demand once current is applied. Within the plain-ozonation panel, DOIF is highest at pH 3.5 (2.59–2.73%) and lower but still substantial at pH 6 and 9 (1.76–2.29%), and it varies little with ozone setting at fixed pH. This near-invariance with dose is consistent with a transfer-limited regime because DOIF normalizes retained ozone by supplied ozone: when transfer governs accumulation, raising the supply rate raises both numerator and denominator proportionally, leaving the ratio roughly constant.
The pH dependence is modest in this panel, consistent with
Section 3.1, where decomposition manifested chiefly in the decay phase rather than during active sparging. The current panels show a different and more complex structure. Introducing current depresses DOIF everywhere, but the response to current magnitude is not monotonic across all cells. At several conditions the 125 mA cell exceeds its 175 mA counterpart (e.g., pH 3.5/Setting 4, 2.66 vs. 1.18; pH 9/Setting 6, 0.89 vs. 0.68), while at one condition the 175 mA cell exceeds its 125 mA counterpart (pH 9/Setting 8, 0.67 vs. 0.62). This irregularity is expected for a lumped metric reflecting the supply–consumption balance. Once consumption dominates accumulation, small differences in the local balance between Fe
2+ generation, ozone supply, and decomposition produce the cell-to-cell scatter seen here, rather than a smooth gradient. The pH dependence changes character once current is applied. Under plain ozonation the pH effect is modest, but in the current-bearing panels DOIF is markedly higher at pH 3.5 (1.00–2.66%) than at either pH 6 (0.48–1.28%) or pH 9 (0.62–1.19%), which are comparable to one another. This is consistent with two suppression mechanisms acting together: the reactive demand introduced with current, and alkaline ozone decomposition that intensifies with pH. Once both operate, further increases in pH produce little additional suppression, suggesting the reactive sink already dominates dissolved ozone accumulation at pH 6.
Read together with
Figure 2,
Figure 3,
Figure 4 and
Figure 5,
Figure 6 consolidates the central finding of this work. Dissolved ozone retention in this reactor is set not by gas–liquid transfer hardware, which delivers 1.76–2.73% retention consistently under plain ozonation, but by the chemical demand imposed once current and alkaline conditions are introduced. Across the factorial, only the lowest-demand condition examined (pH 3.5, 125 mA) approached the retention achievable by transfer alone, while every higher-demand cell fell substantially below it. The reaction sink is therefore intrinsic to ECO operation across most of the practical envelope rather than an artifact of any single condition. This motivates a contactor that physically separates ozone dissolution from the reactive environment, the design rationale developed in
Section 3.6.
3.6. Comparison with Literature and Design Implications
The mass transfer parameters quantified in this study provide a basis for comparison with alternative ozone contactor technologies and establish quantitative targets for reactor improvement. Under plain ozonation at pH 3.5, where reactive ozone demand is absent (no current applied and no organics present) and hydroxide-initiated self-decomposition is suppressed by the low pH, chemical ozone consumption is negligible (≈0, per
Section 2.4), and the reactor achieved kLa values of 1.05–1.21 min
−1 across ozone Settings 4, 6, and 8, within the range reported for conventional ceramic-diffuser bubble columns (Ratnawati et al. [
8] report 0.5–1.5 min
−1 under comparable gas flow). The bubble-column hardware therefore performs as expected for its class; it is not an underperforming example of the configuration. Advanced contactors nonetheless achieve substantially higher transfer rates. Graça et al. [
12] reported
of 1.47–3.12 min
−1 for oscillatory-flow reactors with periodic constrictions, and rotating packed beds exceed 5 min
−1 with OTE routinely above 80% [
18]. The relevant gap is thus not that the present reactor is a poor bubble column, but that bubble columns as a class transfer ozone far more slowly than intensified contactors, and that this study’s measured dissolved-ozone retention (DOIF ≤ 2.73% under plain ozonation) sits well below the 70–95% transfer efficiencies of advanced designs.
This gap widens sharply under ECO conditions. As established in
Section 3.2,
Section 3.3,
Section 3.4 and
Section 3.5, applying current reduces dissolved ozone retention to DOIF of 0.48–2.66%, with
falling to as low as 0.082 min
−1 as reactive ozone demand competes with transfer throughout the run. A recent perspective by Garg et al. [
11] argued that gas–liquid mass transfer is frequently the overlooked rate-limiting step in ozone-based AOPs, with most studies focusing on reaction kinetics while neglecting transfer. The present findings refine this view: in ECO, the binding constraint is not transfer hardware but the kinetic competition between ozone supply and consumption. Despite > 90% COD removal in the foundational study [
10], the bulk liquid retains no more than 2.7% of supplied ozone as dissolved ozone, and under half that in most ECO conditions. This consumed ozone is largely productive, generating hydroxyl radicals through Fe
2+–O
3 reactions (Equations (3) and (4)); the operational limitation is that the bulk liquid cannot maintain an appreciable molecular-ozone reservoir, restricting direct ozonation pathways and leaving the process unable to exploit the full driving force the gas phase could supply.
Although hydrodynamic parameters were not measured directly, the reactor geometry constrains them sufficiently to explain the observed transfer ceiling. The 154 mm internal diameter gives a cross-sectional area of 186 cm
2 and a liquid height of 161 mm at the 3.0 L working volume. At the fixed gas flow of 2.0 L min
−1, the superficial gas velocity is therefore 1.8 mm s
−1, and the column Reynolds number is approximately 275. Both values place the system firmly in the homogeneous bubbly flow regime, well below the superficial velocities of 40–50 mm s
−1 at which transition to churn-turbulent flow typically occurs [
14,
16]. Ceramic diffusers of this type generate bubbles of approximately 1–3 mm at these flow rates, which rise at 0.3–0.5 m s
−1 and therefore traverse the 161 mm liquid column in less than one second. This short gas residence time, combined with a gas holdup below 1%, limits the specific interfacial area available for transfer and accounts directly for the
values of 1.05–1.21 min
−1 measured under plain ozonation.
These constraints are geometric rather than operational, and they cannot be relieved within the present configuration. Increasing the gas flow would raise the superficial velocity but would also promote bubble coalescence and reduce contact time, while finer diffusers reduce bubble size at the cost of increased back-pressure and fouling susceptibility. Intensified contactors overcome the limitation by a different route: venturi injectors and rotating packed beds generate interfacial areas one to two orders of magnitude larger and extend gas–liquid contact times well beyond one second, which is why they achieve transfer efficiencies above 80% where bubble columns of this class remain near 2–3% [
12,
18]. The hydrodynamic analysis therefore reinforces, rather than qualifies, the design conclusion drawn in this section: the dissolution stage requires a fundamentally different contactor geometry, since incremental modification of the existing one could at best yield marginal gains against a demand that would consume them.
This distinction is decisive for design. Because the suppression is chemical in origin, arising from consumption rather than from impaired gas–liquid contacting, incremental hydrodynamic improvements to the single-stage reactor (finer diffusers, higher gas flow, modified geometry) may improve transfer but cannot decouple dissolution from immediate chemical consumption. Any additional ozone transferred into the reactive bulk would be consumed just as rapidly. What is required is a contactor architecture that decouples ozone dissolution from the reactive ECO environment, allowing the two processes to be optimized independently.
A two-stage configuration is therefore proposed for future ECO development. In the first stage, ozone would be dissolved into clean water at low pH (2–4) in a dedicated saturator, where self-decomposition is slowest and the achievable dissolved ozone concentration is highest. The present results establish the relevant baseline: at pH 3.5 with no iron and no organics, the reactor reached roughly 4.3–7.2 mg/L across ozone settings (fitted C* up to 7.2 mg/L at Setting 8), at DOIF ≤ 2.73%, defining the upper bound of this bubble-column geometry. A pressurized contactor (venturi injector, packed column, or rotating packed bed) operating at the >80% transfer efficiencies reported for such devices [
11,
18] would, on the basis of those published figures, be expected to raise dissolution-stage performance by more than an order of magnitude relative to this baseline. Whether that performance is achieved when the saturator is coupled to a downstream reactive stage remains to be demonstrated, since the combined system efficiency depends on both units. In the second stage, this ozone-rich stream would feed the ECO reactor containing the iron electrodes, where Fe
2+-mediated reactions proceed against a far larger initial dissolved ozone reservoir than direct sparging can provide. By separating dissolution from reaction spatially, the configuration is intended to preserve the oxidative capacity of ECO while relieving the supply–consumption conflict that constrains the present single-stage design. This expectation follows from the mechanism identified here but has not been tested experimentally.
Finally, the parameters established here were obtained with synthetic wastewater containing a single model compound at low concentration (50 mg/L phenol). Real olive mill and agro-industrial effluents contain complex mixtures of phenolics, tannins, and other constituents at much higher COD loads, which would impose a substantially greater ozone demand on the saturator and may require larger contact volumes, higher pressures, or longer residence times to reach equivalent dissolved ozone concentrations before ECO treatment. Real effluents also vary in composition over time, so the instantaneous ozone demand imposed on the system would fluctuate rather than remain constant as in the present synthetic matrix. Because dissolved ozone retention here is governed by the balance between supply and consumption, a higher and time-varying demand would depress DOIF further and would make the reactive sink more dominant, not less. Operationally this favors a design in which the dissolution stage is buffered from the reactive environment, since a saturator operating on clean water at controlled pH is unaffected by fluctuations in influent load. The case for decoupling dissolution from reaction is therefore stronger for real effluents than for the synthetic matrix examined here.
A further limitation is that off-gas ozone was not measured in this work; true ozone transfer efficiency, which requires a closed gas-phase mass balance, could therefore not be determined, and the dissolved-phase metrics reported here (DOIF and
) quantify net liquid-phase retention rather than total gas–liquid transfer. Closing the gas-phase balance in future work would require direct off-gas ozone measurement, either by iodometric titration of the exhaust stream in potassium iodide traps or by continuous UV absorption monitoring at 254 nm. Either approach would allow true ozone transfer efficiency to be determined alongside DOIF and would permit the transferred and consumed fractions to be separated directly, resolving the ambiguity identified in
Section 3.3. The two-stage saturator concept is therefore advanced here as a testable hypothesis arising from the mass transfer constraints quantified in this study, rather than as a validated design. Its evaluation defines the reactor-development phase that follows from this work.
4. Conclusions
This study presents, to our knowledge, the first systematic quantification of ozone mass transfer in electro-catalytic ozonation of synthetic phenolic wastewater. A 3 × 3 × 3 factorial design across solution pH, ozone dose, and applied current was used to establish the intrinsic gas–liquid transfer capacity of a ceramic-diffuser bubble column and to compare it against dissolved ozone trajectories under ECO conditions.
Plain-ozonation baselines gave of 1.05–1.21 min−1 at pH 3.5 and a dissolved ozone inventory fraction of 1.76–2.73%, values consistent with published performance for this contactor class. Applying current reduced DOIF to 0.48–2.66%, a 1.0- to 3.7-fold reduction relative to the clean-water baseline, while fell as low as 0.082 min−1. This suppression is consistent with an increased reactive ozone sink under ECO conditions rather than with impaired gas–liquid transfer, since the contactor hardware was unchanged across all current levels. The fitted coefficient varied widely and non-monotonically across ECO trials, tracking the local balance between ozone supply and consumption rather than an intrinsic transfer property, and is therefore not a reliable proxy for physical transfer performance in reactive systems.
Several limitations bound these conclusions. The 0 mA and current-bearing arms differ in matrix, sparging duration, and prior electrolysis as well as in applied current, so the reduction in DOIF cannot be attributed to current alone; the relative contributions of Fe2+-mediated reactions and of phenol oxidation cannot be separated without a 0 mA phenolic-wastewater control. Off-gas ozone was not measured, so true ozone transfer efficiency could not be determined and the metrics reported here quantify liquid-phase retention rather than total transfer. The synthetic matrix contained a single model compound at 50 mg/L, whereas real agro-industrial effluents impose substantially higher and time-varying oxidant demand. These findings motivate, but do not yet demonstrate, a two-stage architecture in which ozone is dissolved to near-saturation in a dedicated contactor before delivery to the ECO reactor. Such a configuration would in principle decouple dissolution from reaction and supply a larger dissolved ozone reservoir than direct sparging can provide, though whether the predicted gains are realized in practice remains to be established. The immediate priorities for future work are the 0 mA phenolic control needed to apportion the reactive demand, off-gas measurement to close the gas-phase balance, and fabrication and testing of a saturator against the transfer efficiencies reported for intensified contactors.