Article

Continuous Monitoring of the Photocatalytic Degradation of Levofloxacin Using an Impedimetric Sensor-Based System

by
Bryan E. Alvarez-Serna
1,*,
Jesús S. Rodríguez-Girón
2,
Sandra Arzate-Salgado
1,
Daniel Sánchez-Martínez
3,
Rosa-María Ramírez-Zamora
4 and
Roberto G. Ramírez-Chavarría
4,*
1
División de Ciencias Básicas e Ingeniería, Universidad Autónoma Metropolitana Unidad Lerma, Lerma de Villada, Estado de México 52005, Mexico
2
Departamento de Energía, Universidad Autónoma Metropolitana Unidad Azcapotzalco, Ciudad de México 02128, Mexico
3
Facultad de Ingenería Civil, Departamento de Ecomateriales, Universidad Nacional Autónoma de Nuevo León, Nuevo León 66455, Mexico
4
Instituto de Ingeniería, Universidad Nacional Autónoma de México, Ciudad de México 04510, Mexico
*
Authors to whom correspondence should be addressed.
Processes 2026, 14(17), 2742; https://doi.org/10.3390/pr14172742
Submission received: 25 July 2026 / Revised: 23 August 2026 / Accepted: 24 August 2026 / Published: 27 August 2026

Abstract

Developing portable and reliable systems for online monitoring of antibiotic degradation in water is essential for studying, optimizing, and improving their efficiency. In this work, we introduce an impedimetric sensor-based system for online monitoring of the photocatalytic degradation of levofloxacin (LVX). The sensor consists of graphite pencil leads (GPL) modified with molecularly imprinted polymers (MIP) to ensure specificity and enhance sensitivity. The sensor was evaluated in a concentration range of 0 to 40 mg/L of LVX, achieving a detection limit of 1.3 mg/L, and subsequently tested in a photocatalytic degradation process. All measurements were validated using high-performance liquid chromatography (HPLC). Based on the results, the proposed system is a promising alternative to conventional analytical methods for online monitoring of degradation processes. This approach facilitates the optimization of degradation mechanisms, minimizing resource consumption and reducing analysis and operation times, especially in resource-limited environments.

1. Introduction

Water pollution by antibiotics (ATB) is a serious global public health and environmental issue, as these compounds are not fully biodegradable and promote antibiotic-resistant pathogens [1]. Among the wide variety of ATB considered contaminants of emerging concern, levofloxacin (LVX) is one of the most widely used worldwide due to its broad antimicrobial activity in various infectious disease treatments [2]. Moreover, LVX belongs to the fluoroquinolone family, a group of antibiotics identified with the highest presence in wastewater and surface water [3,4]. Consequently, developing and improving effective methods for eliminating ATB is essential to mitigate the spread of contaminated water. Advanced oxidation processes (AOP) are among the most commonly used approaches for eliminating ATBs such as LVX [5,6]. Specifically, homogeneous photocatalysis has proven to be an attractive alternative, as it uses a photocatalytic element and sunlight, making it an economical and easy-to-apply method [7]. Additionally, photocatalysis has demonstrated its potential to eliminate and mineralize LVX and other ATB from the fluoroquinolone family with high efficiency, low cost, and environmental friendliness [8,9].
Quantifying the concentration of the degraded ATB is crucial for examining the degradation mechanisms and effectiveness of photocatalytic processes. Currently, the most common methods used for tracking the degradation process include high-resolution mass spectrometry (HRMS) [10], high-performance liquid chromatography (HPLC) [11], and ultraviolet-visible (UV/VIS) spectroscopy [12], among others. These techniques provide reliable measurements with high resolution, sensitivity, and specificity. However, these methods require significant operating time, cannot perform online measurements, and may produce intermediate or significant products that undergo further degradation. Therefore, developing new techniques and devices for online monitoring of photocatalytic processes remains desirable to better understand degradation mechanisms, optimize experiments, and reduce operation times.
The online quantification of ATB in environmental samples requires monitoring systems equipped with reliable, portable, and high-performance analytical devices. For this purpose, the electrochemical sensors have proven highly selective, with low detection limits and accuracy [13]. Furthermore, they are affordable, easy to manufacture, and portable, making them ideal for detecting antibiotics in environmental applications [14,15]. Nevertheless, continuous monitoring of ATB degradation using electrochemical methods remains an open problem due to the different conditions and reactions occurring in degradation mechanisms [16].
Within the electrochemical sensing devices, impedance-based sensors are a powerful tool for evaluating the interaction between the electrode and the analyte through the charge carrier activity over the electrode surface [17]. Impedimetric sensors are classified as faradaic and non-faradaic. The former relies upon redox reactions, whereas the latter depends on charge accumulation in the electrical double layer [18]. Interestingly, impedance sensors are a good choice for environmental applications, as they do not consume analytes during measurement, have lower interference, allow online measurements, and are compatible with complex matrices [19]. Additionally, non-faradaic impedimetric sensors do not require redox probes, direct current polarization, or a reference electrode, simplifying the design and integration of the sensor [20]. Given these advantages, impedimetric sensors demonstrated sensitivity to changes in antibiotic concentration across different sample matrices [21,22]. However, many of these sensors employ sophisticated materials and complex electrode geometries, which increase fabrication complexity, particularly in resource-limited settings [23,24]. In addition, some conventional configurations rely on discrete measurements and require additional pretreatment steps, which dificult their implementation for continuous online monitoring. Therefore, developing impedimetric sensors that can be integrated into accessible and selective detection platforms for online monitoring of antibiotic concentration during degradation processes remains a challenge.
Graphite pencil leads (GPL) are a novel alternative for designing electrodes owing to their outstanding electrical properties and low-cost features. GPL have potential in sensor development, demonstrating the ease of integration and modification [25]. On the other hand, functionalization techniques to improve sensitivity and selectivity are the main issues that still need to be improved in their use and replication. Conventional modification techniques rely on materials such as nanocomposites, metallic nanoparticles, and metal oxides, which require extensive synthesis processes. A more affordable and easier-to-synthesize alternative, which still ensures improved selectivity, is molecularly imprinted polymer (MIP). This method has gained popularity as it creates suitable cavities to detect specific molecules, making it ideal for quantifying ATB with high selectivity and sensitivity [26]. A conventional way to produce MIP is by electropolymerizing a monomer with a template molecule onto an electrode, which reduces polymerization time and avoids cross-linking agents [27]. Among the wide variety of conductive polymers, polyaniline (PANI) is preferred for electrochemical applications, as it is easy to synthesize, exhibits good chemical stability, and has high electrical conductivity [28,29]. Furthermore, PANI can be electrodeposited using potentiostatic techniques, such as linear sweep voltammetry, or potentiodynamic techniques, such as cyclic voltammetry, simplifying the electrode modification process [30].
Inspired by the above ideas, this work introduces the design of an attractive impedimetric sensor for online monitoring of LVX degradation in a photocatalysis process. The sensor features a custom design that combines GPL modified with PANI-based MIP as electrodes and a case designed with 3D technology for easy integration. The sensor’s features enable its integration into a portable instrumentation system that allows for online impedance measurements to determine the concentration of LVX during a photocatalytic degradation process. In the present work, no supporting electrolyte was used to promote redox reactions. Therefore, the observed impedance changes can be primarily attributed to variations in the conductivity and interfacial properties of the PANI-modified electrode, rather than to a direct electrochemical reaction of the analyte. In this case, the main contribution of our work lies in providing a reference framework for developing highly selective and low-cost sensors to integrate them into new systems for studying and improving degradation mechanisms through online measurements. Moreover, the proposed sensor offers an attractive alternative to conventional analytical techniques for monitoring antibiotic degradation processes in environments with limited resources or online surveillance applications.

2. Basis of Electrochemical Impedance

The electrical impedance of an electrochemical sensor is determined by applying an alternating voltage signal of the form v ( t ) = v 0 sin ( ω t + α ) and measuring the resultant current flow, i ( t ) = i 0 cos ( ω t + β ), where v 0 and i 0 are the amplitudes, while α and β represent the phase of the voltage and current signal, respectively, and ω is an arbitrary frequency. Thus, the impedance is defined by the ratio
Z ( j ω ) = F { v ( t ) } F { i ( t ) } = V ( ω ) I ( ω ) = | Z | ( cos   θ + j sin   θ ) .
Here, F denotes the Fourier transform operator, and V ( ω ) and I ( ω ) are the voltage and current phasors, | Z | denotes the impedance magnitude, θ is the phase angle, and j = 1 . The impedance in (1) encodes the resistance to the flow of electrons and ions within an analyte due to faradaic or non-faradaic processes [31]. Faradaic processes involve electron transfer through redox reactions, whereas non-faradaic processes are associated with adsorption and desorption phenomena [18]. Hence, measuring impedance allows analysis of physicochemical phenomena at the electrode-electrolyte interface as a function of the analyte concentration [32].
Experimentally, interpreting the behavior of impedimetric sensors is non-trivial and depends on the prior knowledge of the underlying processes. For this purpose, equivalent electrical circuit models (ECM) are a versatile tool to approximate the measured impedance by a sensor [33].

3. Materials and Methods

3.1. Materials

All reagents used were of analytical-reagent grade. Levofloxacin (LVX), ciprofloxacin (CPX), tetracycline (TC), amoxicillin (AMX), acetonitrile, and phosphoric acid, all suitable for high-performance liquid chromatography (HPLC), were purchased from Sigma-Aldrich (St. Louis, MI, USA). Acetone, hydrochloric acid, hydrogen peroxide, aniline, acetic acid, ethanol, and distilled water were obtained from Meyer (Mexico City, Mexico). The sensor comprised a PANI-modified working electrode fabricated from a 3.15 mm-diameter 6B graphite pencil lead purchased from Faber-Castell (Stein, Germany), containing approximately 85% graphite [34], and a 4 mm-diameter 316L stainless-steel (SS) counter electrode purchased from Sigma-Aldrich (St. Louis, MI, USA). The bismuth molybdate phase α -Bi2Mo3O12 used in the degradation experiments was obtained via a microwave-assisted hydrothermal method as described in [35].

3.2. Electrochemical Preparation of MIP Modified GPL

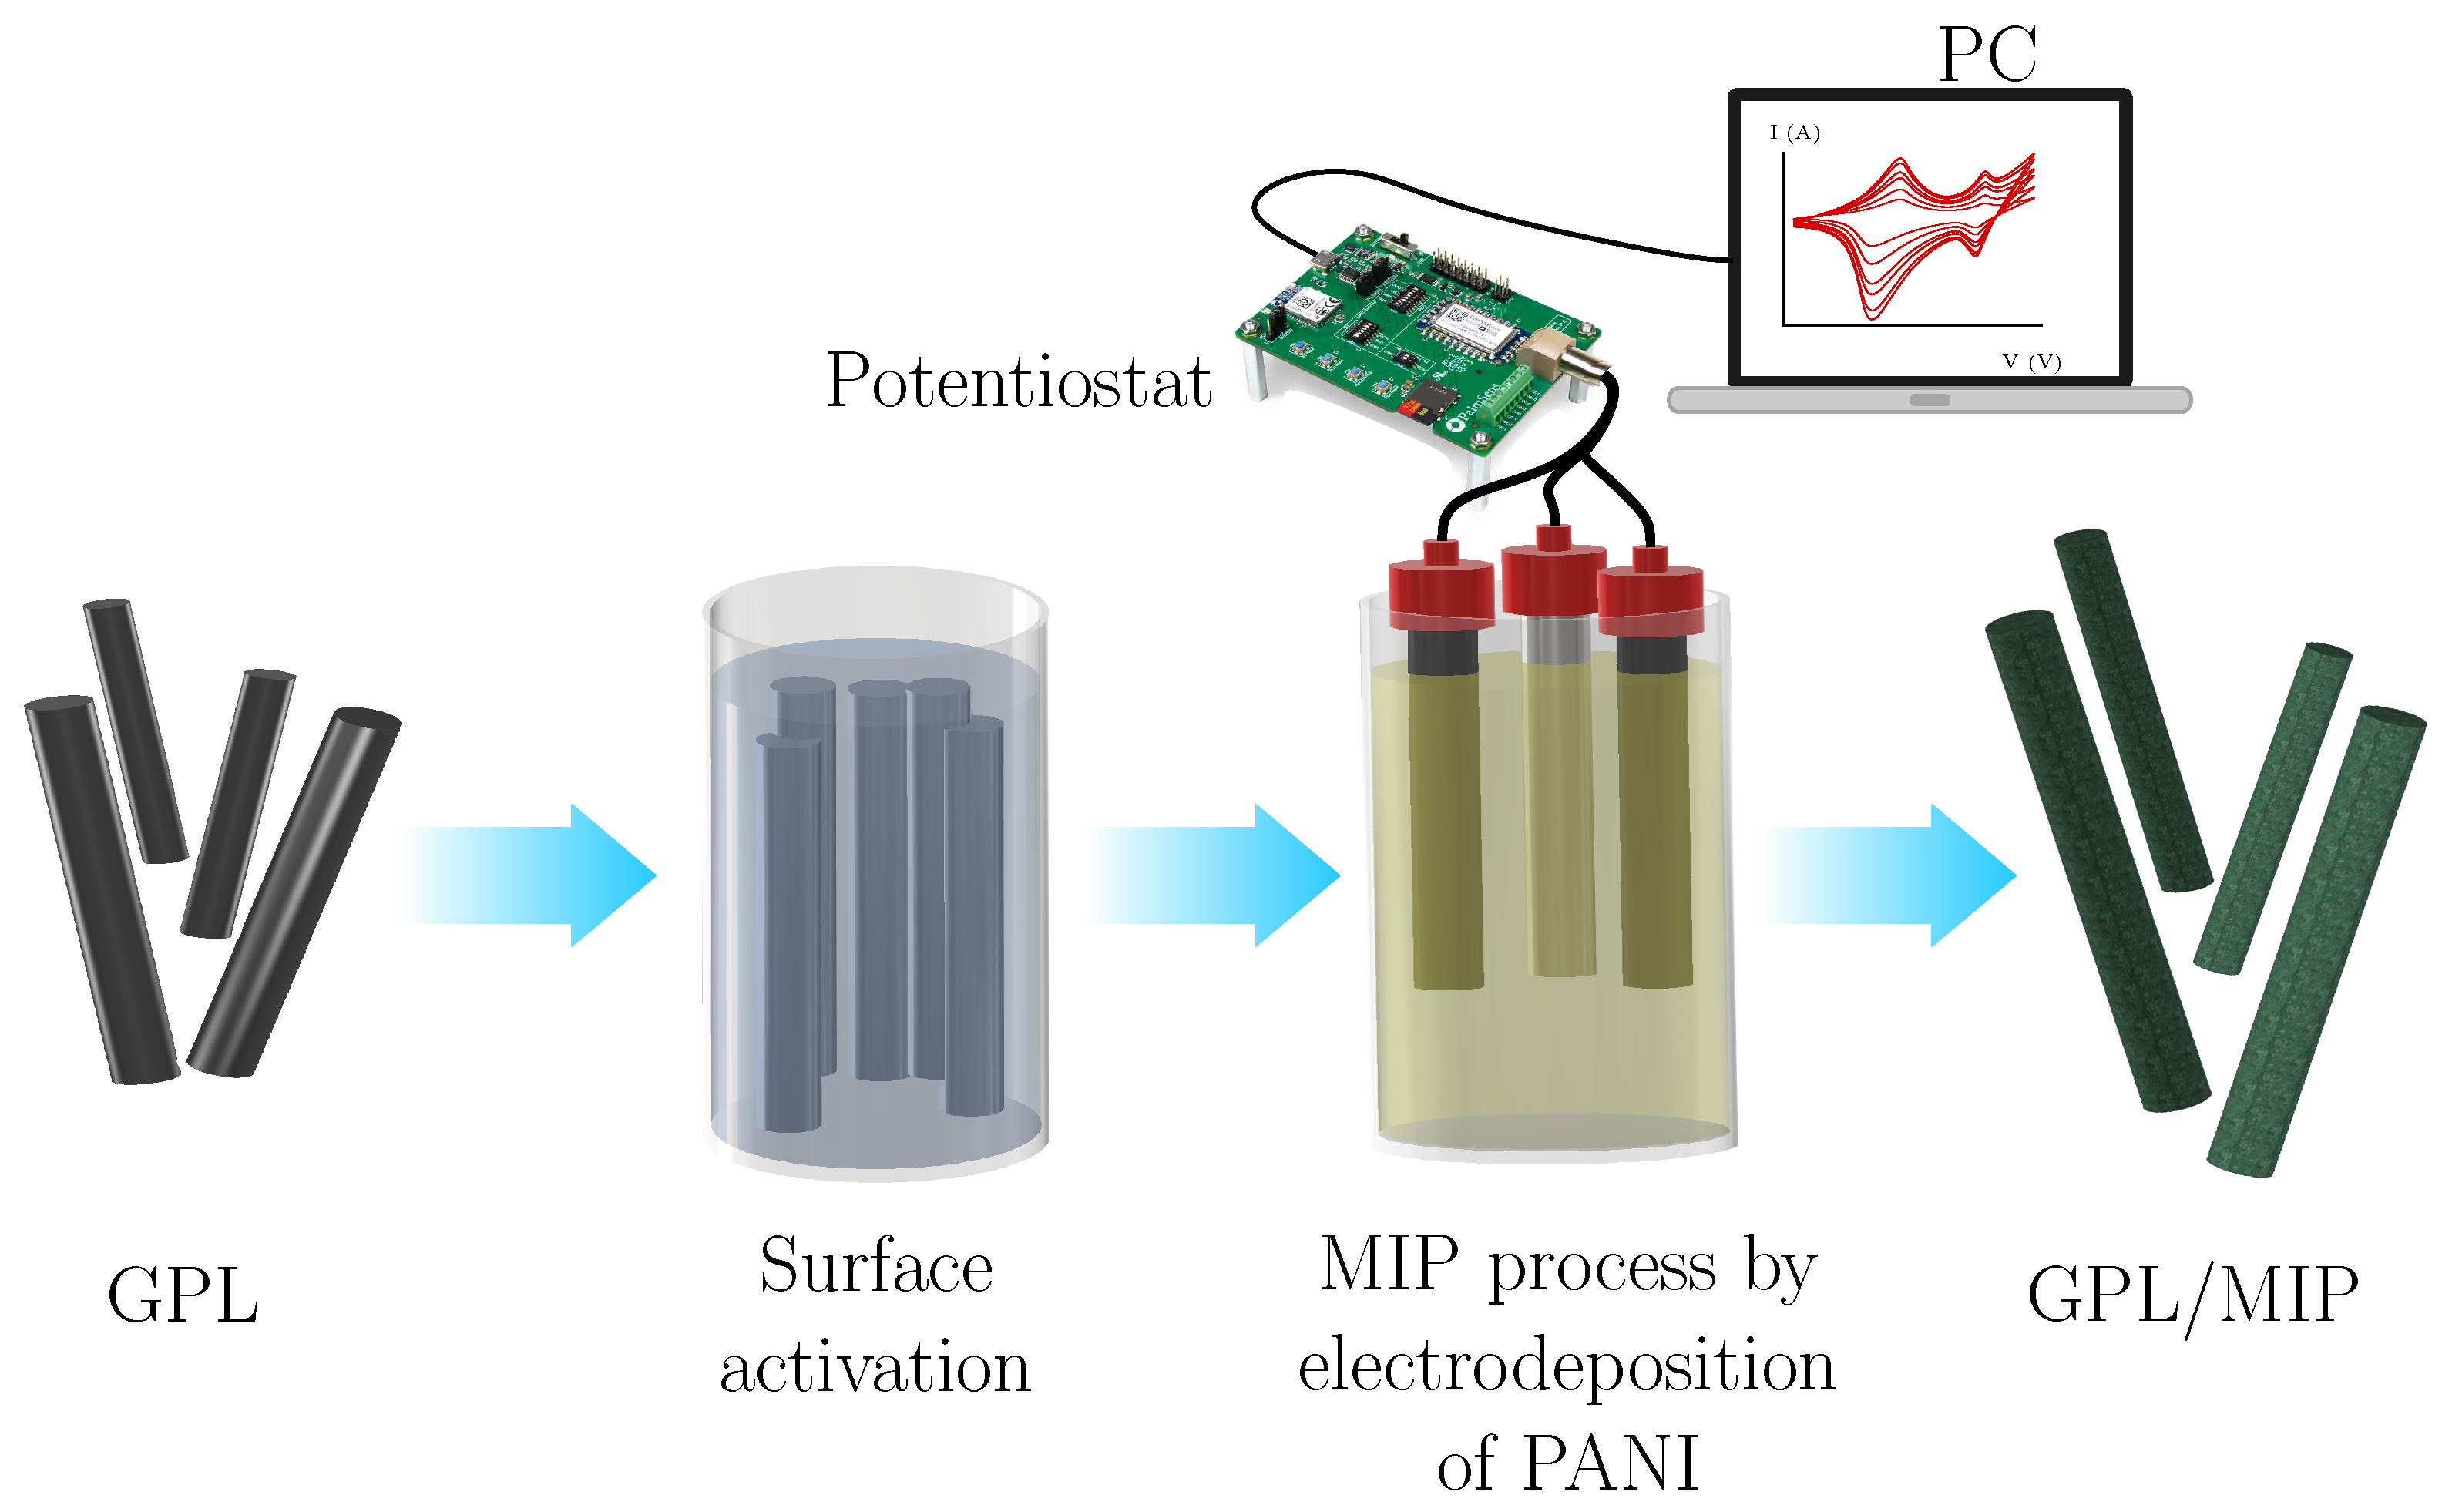
The MIP-modified GPL electrodes were obtained by the electrodeposition of polyaniline (PANI). Figure 1 illustrates the electrode modification process. Before the electropolymerization process, the electrodes were cleaned with acetone and immersed in a solution containing hydrochloric acid (HCl), hydrogen peroxide (H2O2), and distilled water in a 1:1:3 (v/v) ratio for 3 min to activate their surface. Subsequently, the MIP process by PANI electrodeposition was carried out using a three-electrode electrochemical cell and a potentiostat EmStat Pico development kit from PalmSens (Houten, The Netherlands). The electrochemical cell comprises a reference electrode (RE) of Ag/AgCl and two GPL as the counter (CE) and working (WE) electrodes, respectively. For the electropolymerization solution, a 20 mL mixture containing 100 mM HCl, 10 mM aniline, and 50 mg LVX as the template molecule was prepared. Electropolymerization was performed via cyclic voltammetry (CV) scanning from 0 to 1 V with a scan rate of 50   mVs 1 for 20 cycles. Finally, the GPL/MIP electrodes were immersed in a stirred solution of 0.1 M acetic acid and ethanol for 20 min to remove the template. The number of cycles, the mass of the template molecule, and the elution time were determined by the optimization of the electropolymerization process, as detailed in Section S1 and Figures S1 and S2 of the Supplementary Materials. The surface of the GPL electrodes modified with MIP (GPL/MIP) was characterized using field emission scanning electron microscopy (FESEM). FESEM images were obtained with a JMF 7600F SEM manufactured by JEOL Ltd. (Tokyo, Japan), operating at 10 kV, and a LABE-Low Angle Backscattered Electrons detector.

3.3. Measurement System

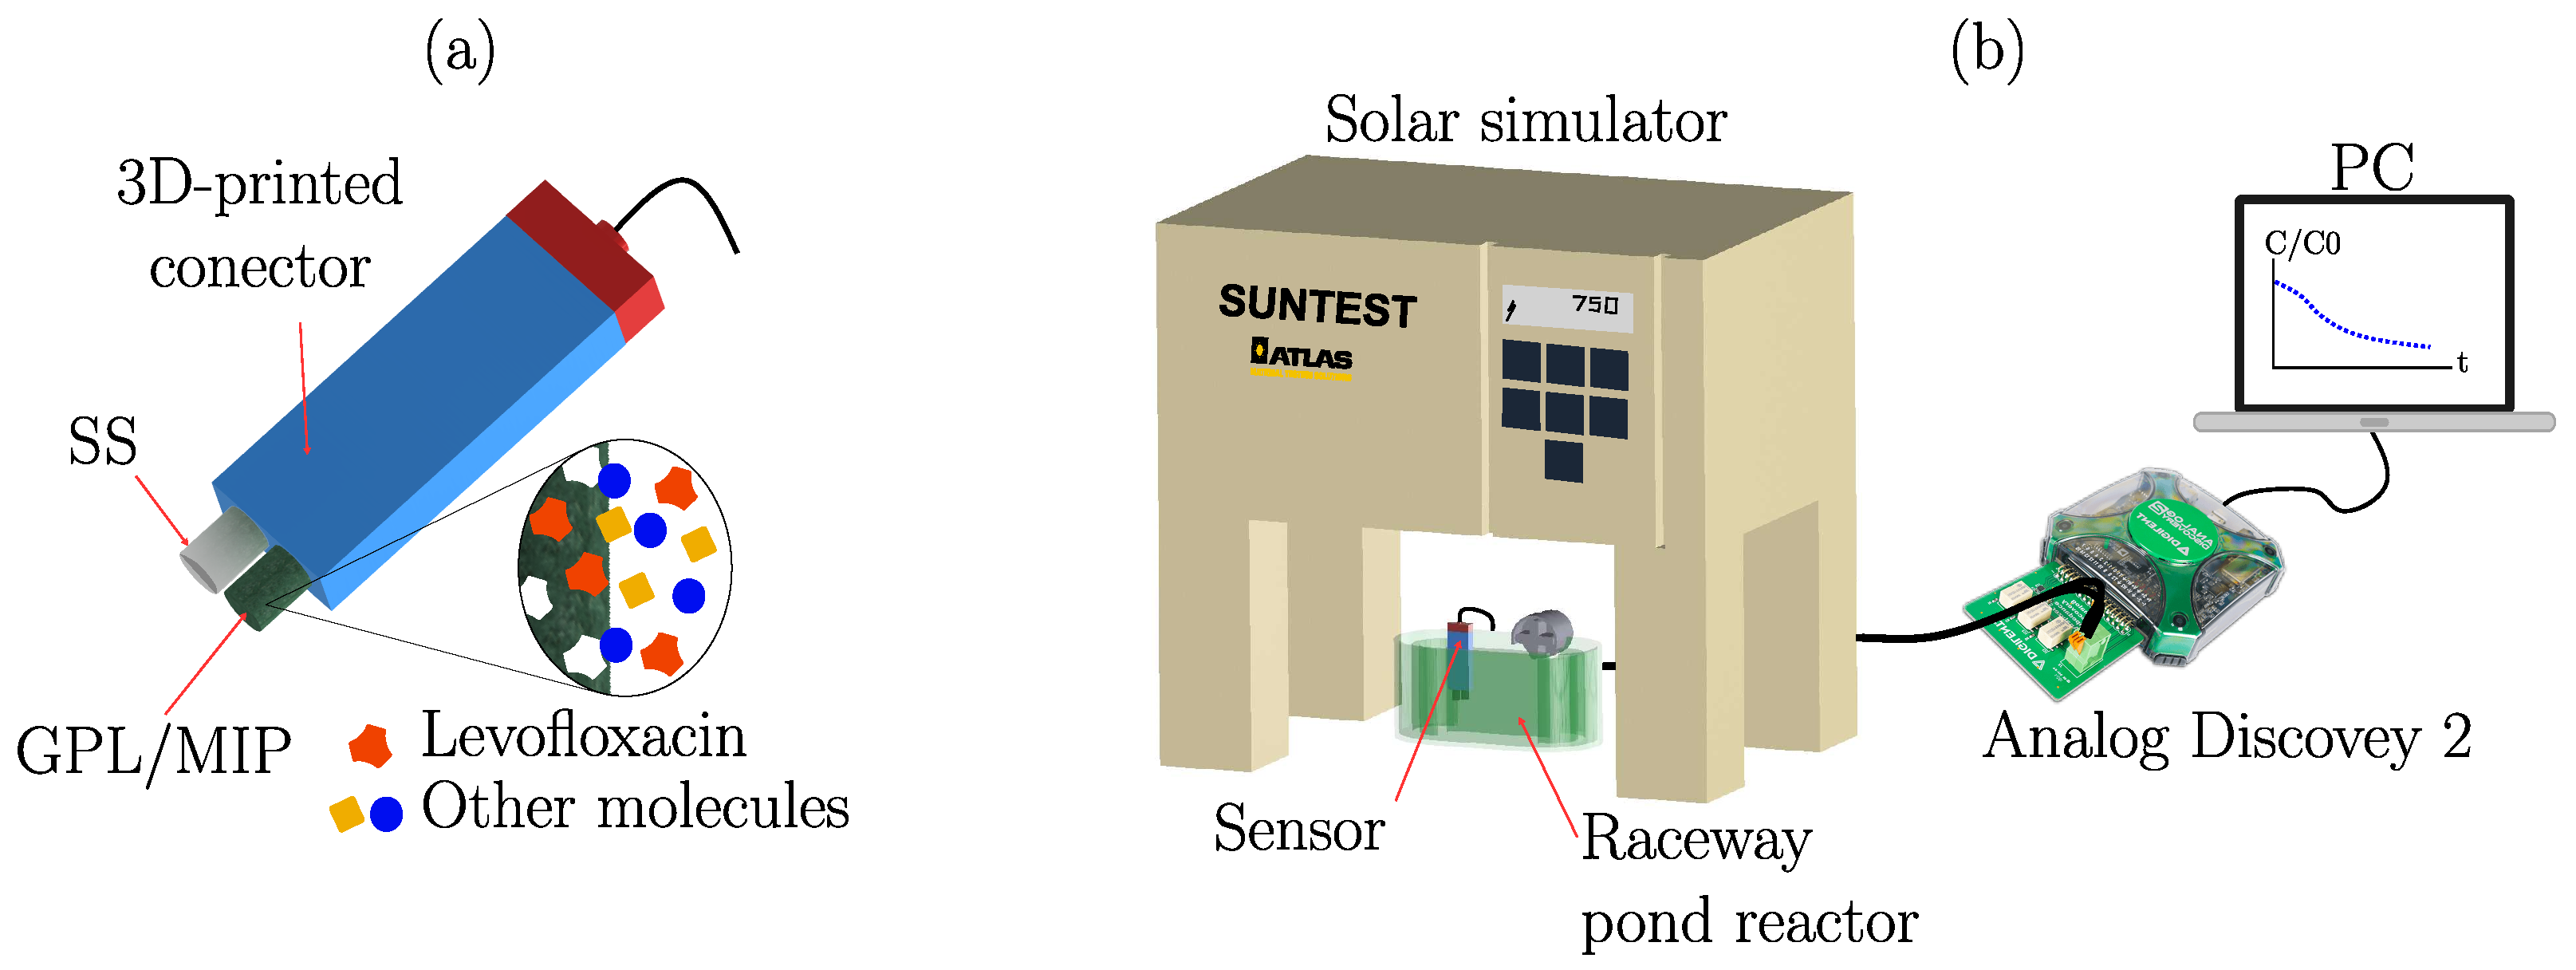
The sensor assembly for measuring impedance with two probes is shown in Figure 2a. The sensor consists of two electrodes isolated by a 3D printed casing made of polylactic acid filament to prevent current flow between the electrodes. On the other hand, the impedance measurements were performed using the Analog Discovery 2 (AD2) multifunctional board and the impedance analysis module, both manufactured by Digilent Inc. (Washington, DC, USA), employing the experimental setup illustrated in Figure 2b. The setup of the AD2 board and impedance plots were obtained using the WaveForms version 3.24.2 software. Impedance measurements were conducted with a peak-to-peak voltage amplitude of 150 mV at different frequency values, depending on the experiment.

3.4. Preparation of Characterization Samples

The LVX solutions were prepared in distilled water with the following concentration values: 0, 5, 10, 15, 20, 25, 30, 35, and 40 mg/L. All solutions were stored, the maximum for two days, protected from the light at a temperature of 10 °C.

3.5. HPLC Analysis

The concentration of LVX solutions was separately verified using high-performance liquid chromatography (HPLC) with an Agilent 1100 chromatography apparatus equipped with a photodiode detector. The injection volume was 20 μL with an ACE5 C18-AR stationary phase column. The mobile phase consisted of a mixture of 0.1% (v/v) phosphoric acid and acetonitrile in a volumetric ratio of 85:15. The eluent flow rate was 1.0 mL/min for 13 min, with a detection wavelength of 296 nm and a retention time close to 6 min.

3.6. Photocatalytic Degradation Experiment

The photocatalysis experiments were conducted in a raceway pond reactor coupled with an orbital shaker set at 150 rpm, within a SUNTEST CPS+ ATLAS solar simulator equipped with a xenon lamp whose intensity was maintained at 750 W/m2 for 60 min at a temperature of 25 °C, as shown in Figure 2b. A solution of 20 mg of LVX mixed by ultrasound in 1 L of distilled water was placed within the reactor. The solution pH remained unadjusted during the experiments and was monitored at the beginning and end of each test. Both experiments showed an average pH value of 6.6 ± 0.3. The MIP sensor was submerged for online monitoring of the LVX degradation process, and bismuth molybdate was added in two different proportions, 0.1 g and 1.0 g, respectively. The impedance measurements were conducted at a fixed frequency of 1 kHz and a peak-to-peak voltage amplitude of 150 mV for 60 min with 501 measurement points. Simultaneously, in each experiment, samples were taken at intervals of 0, 1, 3, 5, 10, 15, 20, 30, 45, and 60 min for HPLC analysis to compare the detection results.

4. Results and Discussion

4.1. Electropolyremization Process

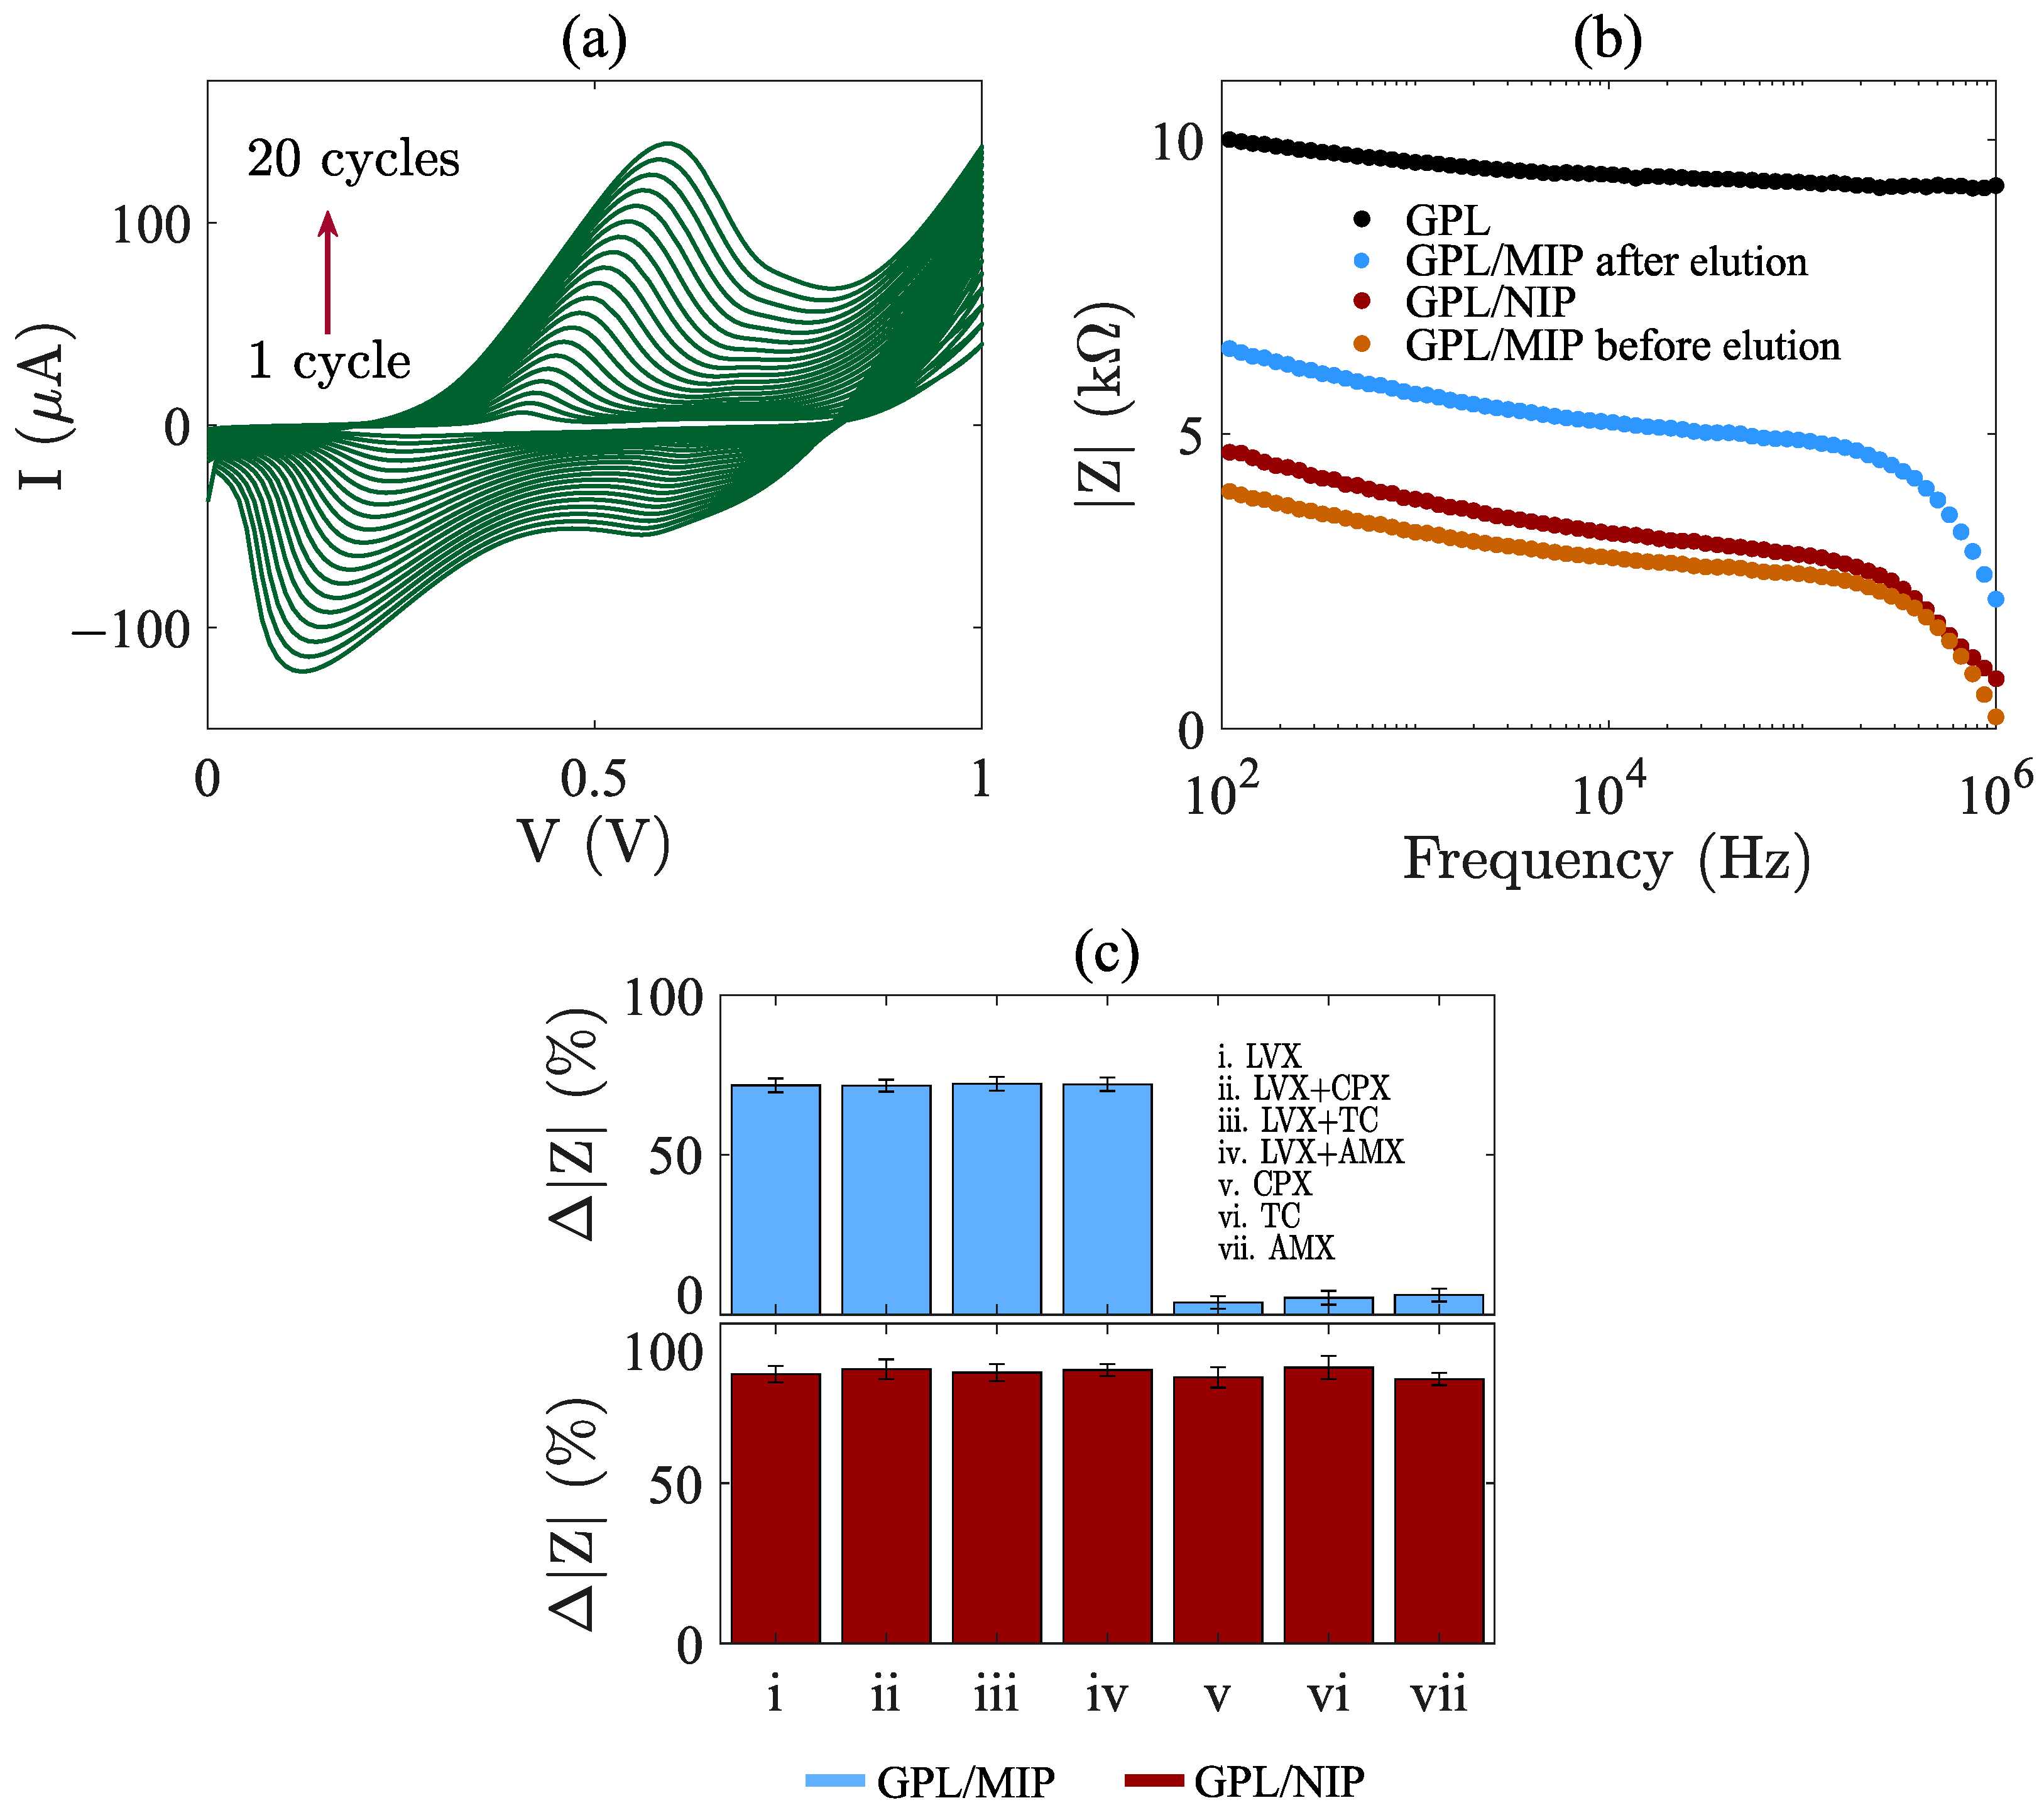
The electrochemical synthesis of PANI on the GPL electrode was performed by CV using 20 cycles, with a scan rate of 50   mVs 1 , in a solution containing the monomer and 50 mg of LVX as the template molecule. Figure 3a shows that the oxidation and reduction peak currents increase and decrease in amplitude, respectively, when the number of cycles increases. These results indicate the redox transitions of PANI, transitioning from a fully insulating form to a conductive form. After 20 cycles, the PANI deposited on the GPL electrode turns to dark green color and exhibits higher conductivity; therefore, the impedance of the GPL/MIP electrodes is lower than that of the unmodified GPL electrode. The electrochemical behavior and the shapes of the voltammograms are consistent with previously reported studies on PANI synthesis [36,37].
Figure 3b represents the impedance magnitude, | Z | , spectrum of the unmodified electrode (GPL), the modified electrode GPL/MIP before elution, the modified electrode GPL/MIP after elution and the modified electrode without the template molecule (GPL/NIP) in a 40 mg/L LVX solution. Impedance measurements were conducted from 10 2 to 10 6 Hz with a peak-to-peak voltage amplitude of 150 mV, recording 201 data points per measurement. In the impedance spectra, it can be observed that the | Z | of the GPL electrode is higher compared to the modified electrodes, confirming that the PANI deposited on the surface functions as a conductive polymer. On the other hand, the impedance magnitude of the GPL/MIP electrode before elution is similar to that of the GPL/NIP electrode, as no cavities are available for LVX molecules to adsorb onto the surface, indicating cavity saturation before the elution process. Meanwhile, after elution, the GPL/MIP electrode exhibits a lower | Z | than the GPL electrode but higher than the GPL/NIP and GPL/MIP before elution electrodes. This behavior makes sense due to molecular recognition cavities, which facilitate higher adsorption and demonstrate the electrode’s ability to recognize LVX molecules through impedance changes.
Lastly, Figure 3c illustrates the selectivity and interference study for GPL/MIP and GPL/NIP sensors. Herein, impedance measurements were taken in different solutions containing: (i) 40 mg/L LVX, (ii) 40 mg/L LVX and 40 mg/L CPX, (iii) 40 mg/L LVX and 40 mg/L TC, (iv) 40 mg/L LVX and 40 mg/L AMX, (v) 40 mg/L CPX, (vi) 40 mg/L TC, and (vii) 40 mg/L AMX. Each sample was measured with different electrodes, and three samples were taken in each experiment. The sensor response, given by Δ | Z | , was computed as follows
Δ | Z | = | Z i | | Z 0 | | Z 0 | × 100   %   ,
where | Z i | is the impedance of the measured solution, and | Z 0 | is the impedance of the blank solution. Interestingly, the solutions (i), (ii), (iii), and (iv) showed similar Δ | Z | values with a relative standard deviation close to 4%. Conversely, solutions (v), (vi), and (vii) exhibited a response of less than 5% as they did not contain LVX. These results indicate that the GPL/MIP sensor is sensitive to LVX due to the MIP process, and other drugs do not interfere with the measurement. Meanwhile, the GPL/NIP sensor exhibited a similar Δ | Z | value for all solutions, indicating that the sensor cannot distinguish the presence or absence of LVX due to the lack of recognition cavities.

4.2. Surface Characterization

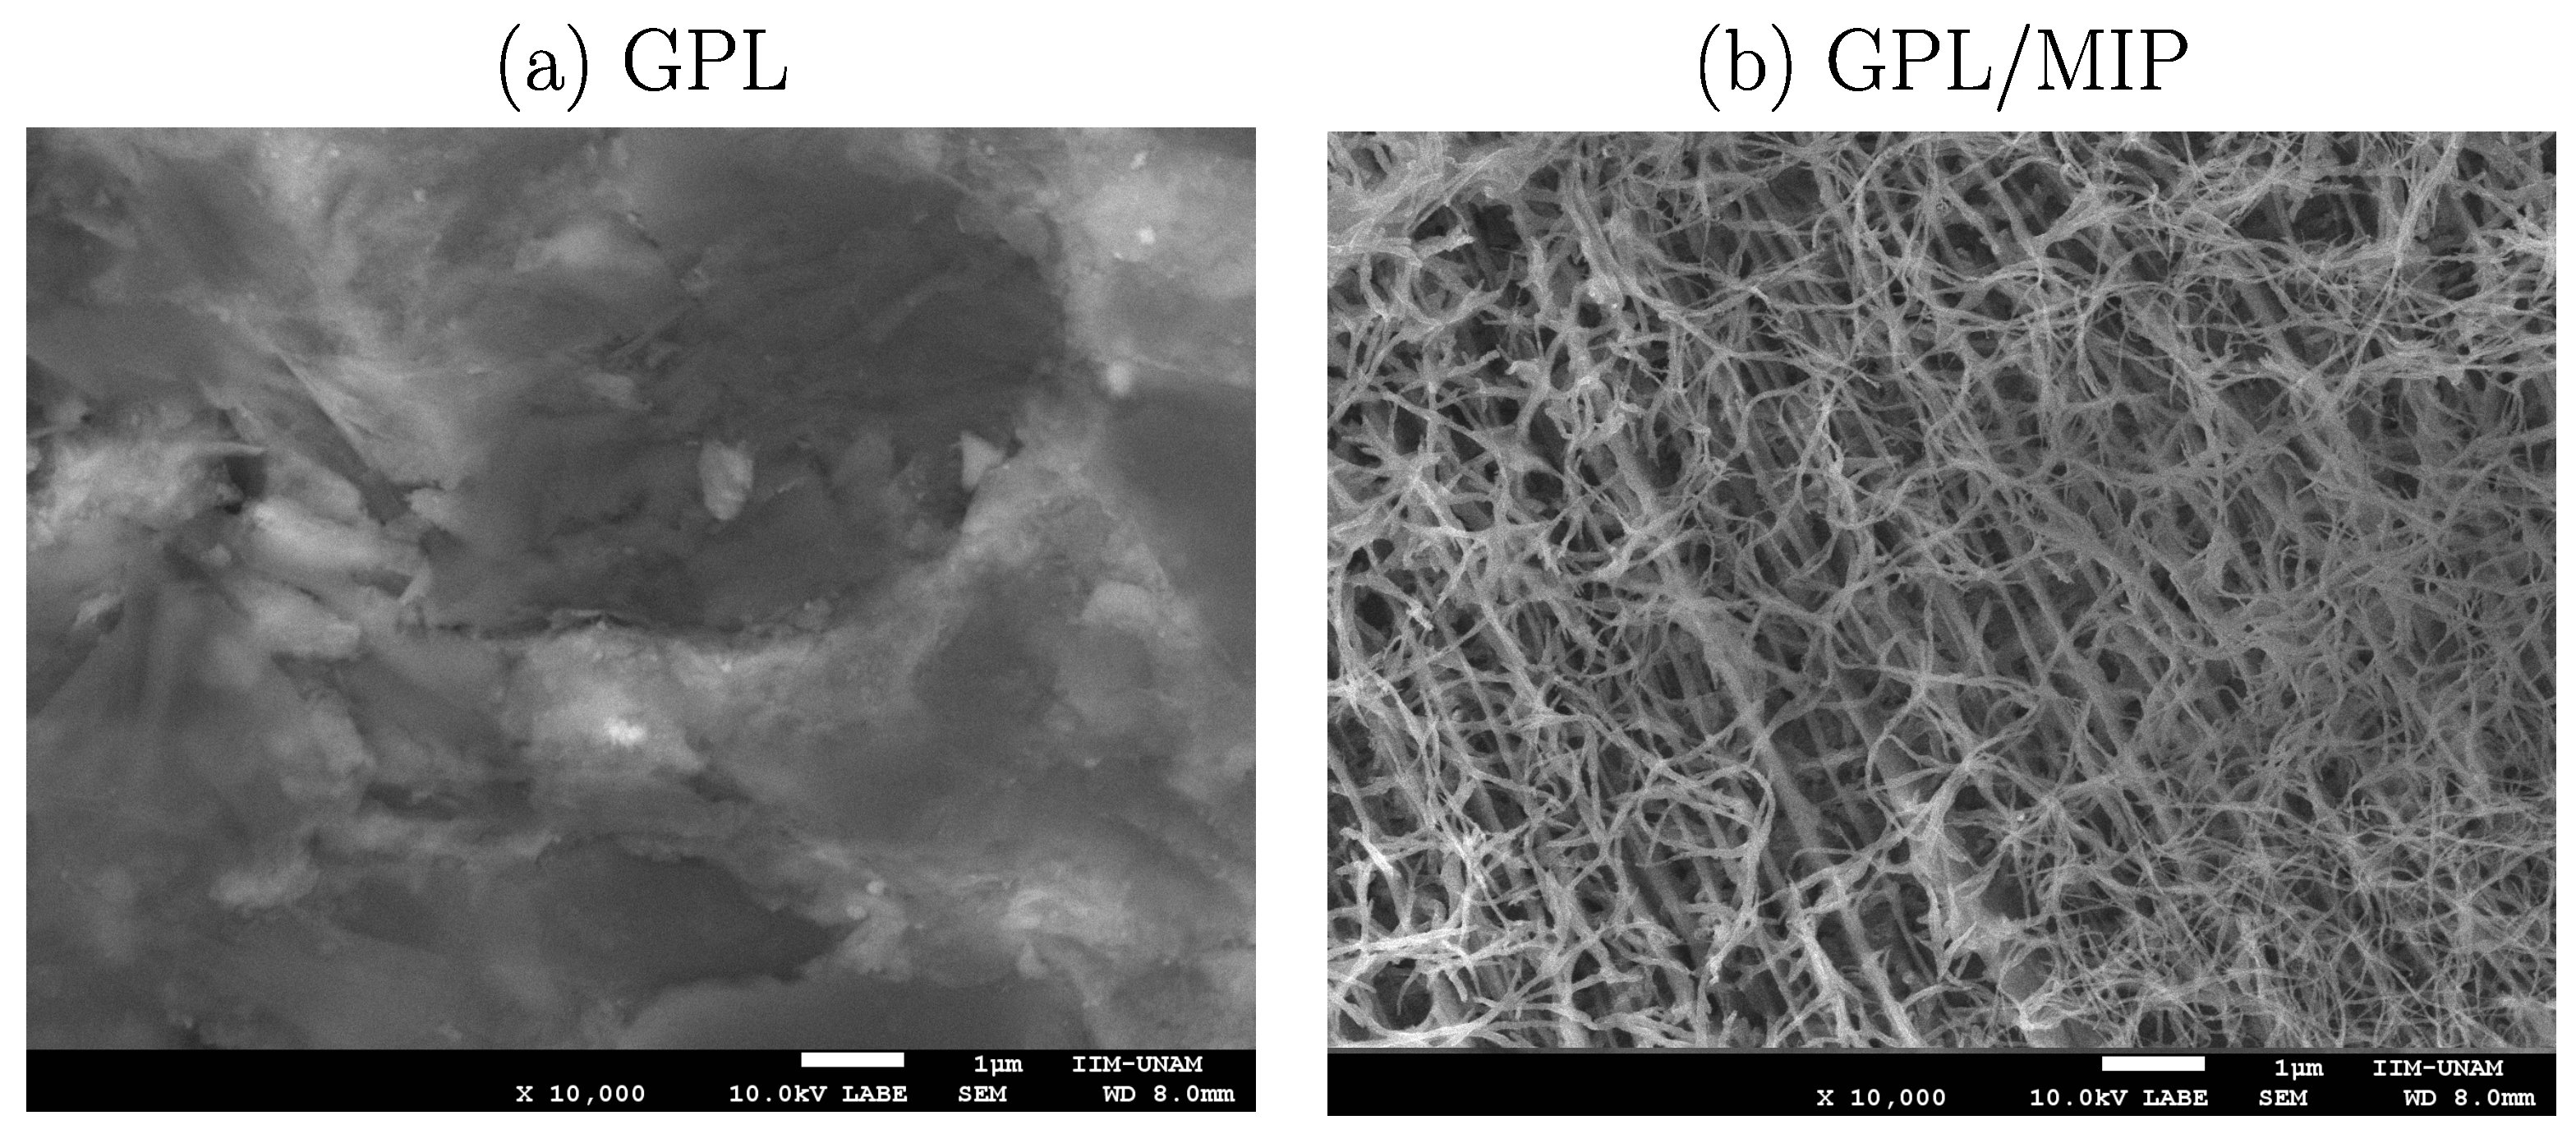
The surface morphology of electrodes GPL and GPL/MIP was studied using field emission scanning electron microscopy (FESEM) with a magnification of ×10,000 for both electrodes. Figure 4a displays the surface of the unmodified GPL electrode, revealing a regular graphite surface with slight imperfections and white patches, indicating impurities, as GPL is a mixture of graphite and clay. On the other hand, Figure 4b exhibits the PANI nanofibers formed after the electropolymerization process of PANI with 20 cycles on the GPL electrode. The nanofibers spread across the electrode surface due to electrodeposition, forming a well-developed porous and interconnected structure that can facilitate electrical charge transfer and the adsorption of chemical species [38,39].

4.3. MIP Sensor Characterization

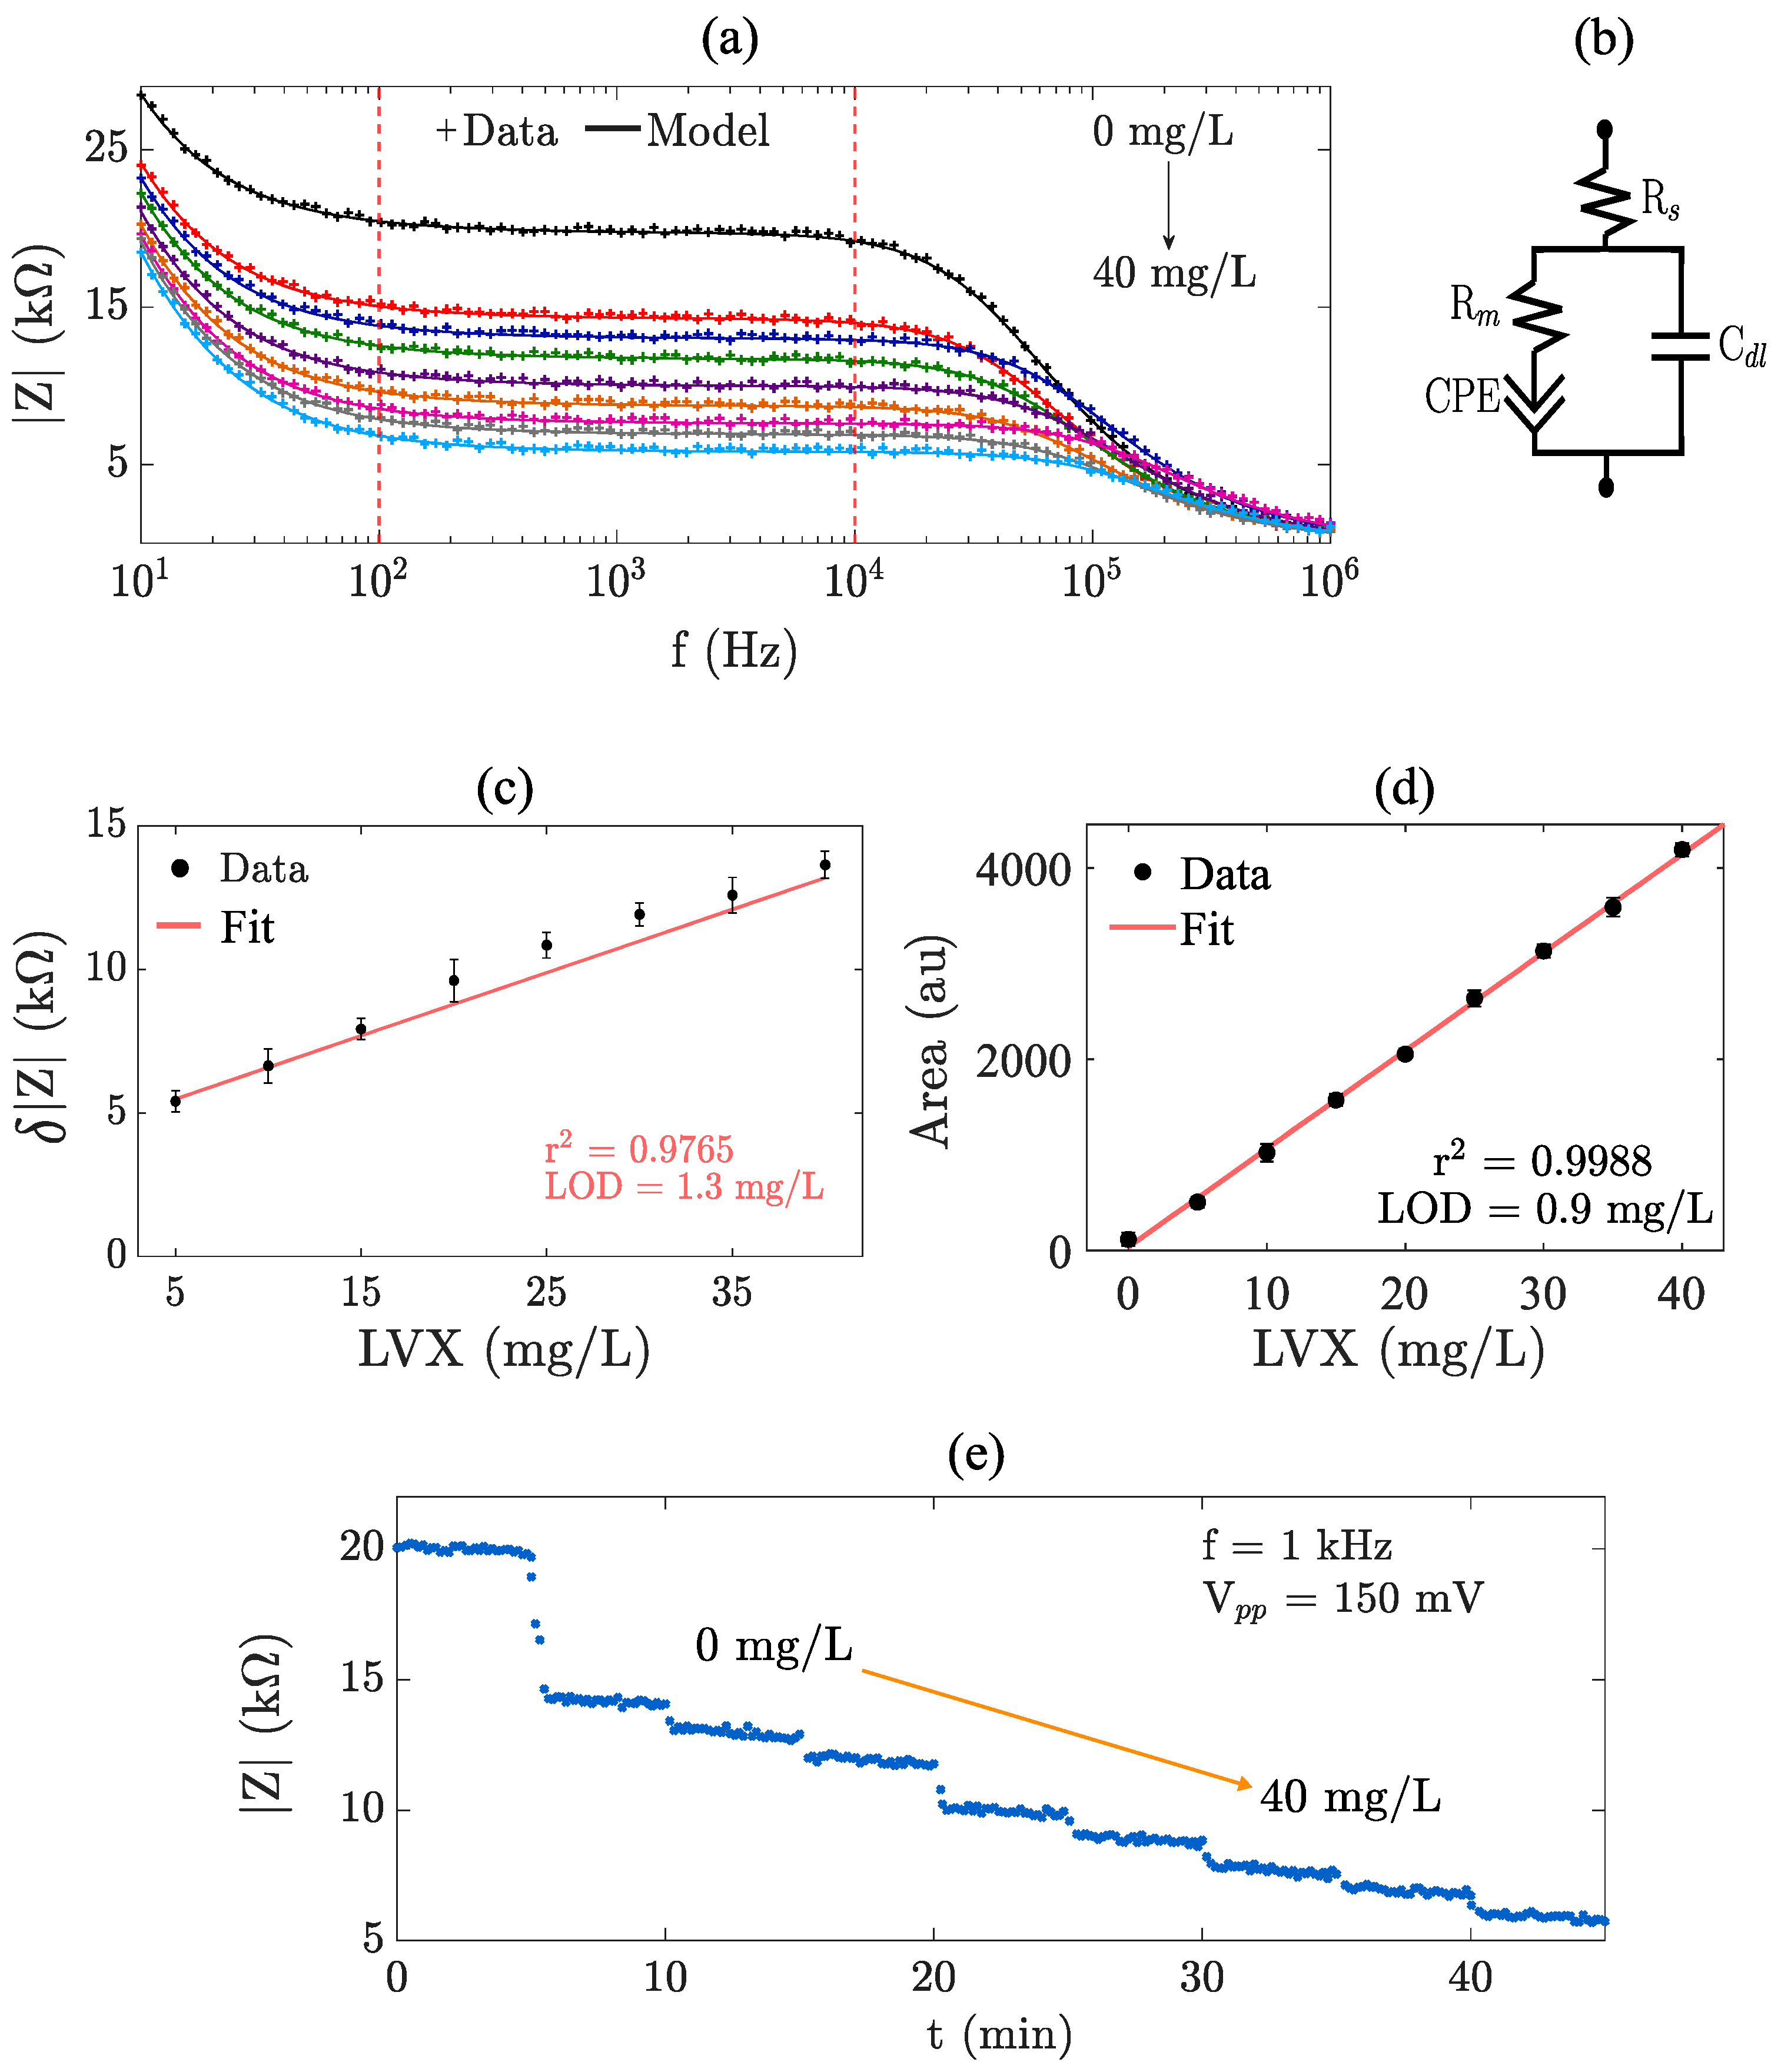
In this experiment, we evaluated the sensor’s ability to quantify LVX and determine the optimal frequency for impedance measurements. Samples were prepared in distilled water using the serial dilution method, with 0, 5, 10, 15, 20, 25, 30, 35, and 40 mg/L concentration values. Figure 5a shows the impedance magnitude spectrum ( | Z | ) in a frequency range from 10 1 to 10 6 Hz, where the impedance magnitude decreases as the LVX concentration increases. This impedance behavior is consistent with the expected outcome, as an increase in concentration enhances the capacitance of the electric double layer and reduces the solution resistance, thus lowering the effective impedance (Figure S3). This situation is confirmed by the agreement between the measured data (dots) and the proposed equivalent circuit model (solid line), exhibiting a relative difference of less than 4%. Within the frequency range from 10 2 to 10 4 Hz, delimited by the vertical dashed lines, the impedance magnitude decreases linearly with increasing LVX concentration. Therefore, any fixed frequency within this range can be selected to construct the calibration curve.
The ECM shown in Figure 5b was used to understand the underlying processes of the MIP-based sensor. The ECM comprises two resistors, one capacitor, and a constant phase element (CPE). In this configuration, R s represents the solution’s ohmic resistance, R m corresponds to the resistance from the thin layer of PANI over the electrode, the CPE accounts for the complex MIP/sample interface due to electrode surface heterogeneity [40], and C d l denotes the effective capacitance of the double layer formed between the electrodes and the solution ions. This model effectively describes the impedance response of the MIP sensor for concentration measurements.
Following this rationale, the sensor calibration curve was obtained at a fixed frequency of 1 kHz, as shown in Figure 5c. For the construction of the calibration curve, the change in impedance magnitude, δ |Z|, was calculated using the following expression
δ | Z | = | | Z i | | Z 0 | |   ,
where |Z0| is the impedance magnitude measured in LVX-free distilled water, which was used as the blank, and | Z i | is the impedance magnitude measured for the LVX solutions at concentrations of 5, 10, 15, 20, 25, 30, 35, and 40 mg/L.
This plot depicts the experimental data (black dots), the relative standard deviation for three measurements (vertical lines), and the best-fitting linear model (solid line). As anticipated, the impedance decreases due to increasing LVX concentration within the 5 to 40 mg/L range, with a correlation coefficient ( r 2 ) close to 98% and a limit of detection (LOD) of 1.3 mg/L. On the other hand, HPLC measurements were performed to validate the sensor response. Figure 5d presents the HPLC calibration curve, demonstrating a linear relationship between the area and the LVX concentration, with r 2 of 0.9988 and a LOD of 0.9 mg/L. In this sense, the LOD obtained with HPLC is lower than that of the MIP sensor, but they are in the same order of magnitude. As a remark, the MIP sensor cannot match the analytical performance of HPLC because the two techniques rely on different transduction mechanisms. Nevertheless, these findings suggest that the sensor can provide a reliable alternative for LVX detection in resource-limited settings or field tests where HPLC equipment is inaccessible.
Finally, the main objective of the MIP sensor is to quantify the concentration of LVX online during a photocatalytic degradation process. Hence, we experimented to evaluate the sensor’s time response to changes in LVX concentration. In the experiment, we varied the concentration from 0 to 40 mg/L, with increments of 5 mg/L every 5 min, using a fixed frequency of 1 kHz. Figure 5e depicts how the | Z | decreases as the LVX concentration increases, which aligns with the findings in Figure 5c. These results demonstrate that the sensor accurately responds to changes in LVX with variations less than 6%, which is suitable for optimizing experiments involving the photocatalytic degradation of LVX.

4.4. MIP Sensor Performance Analysis

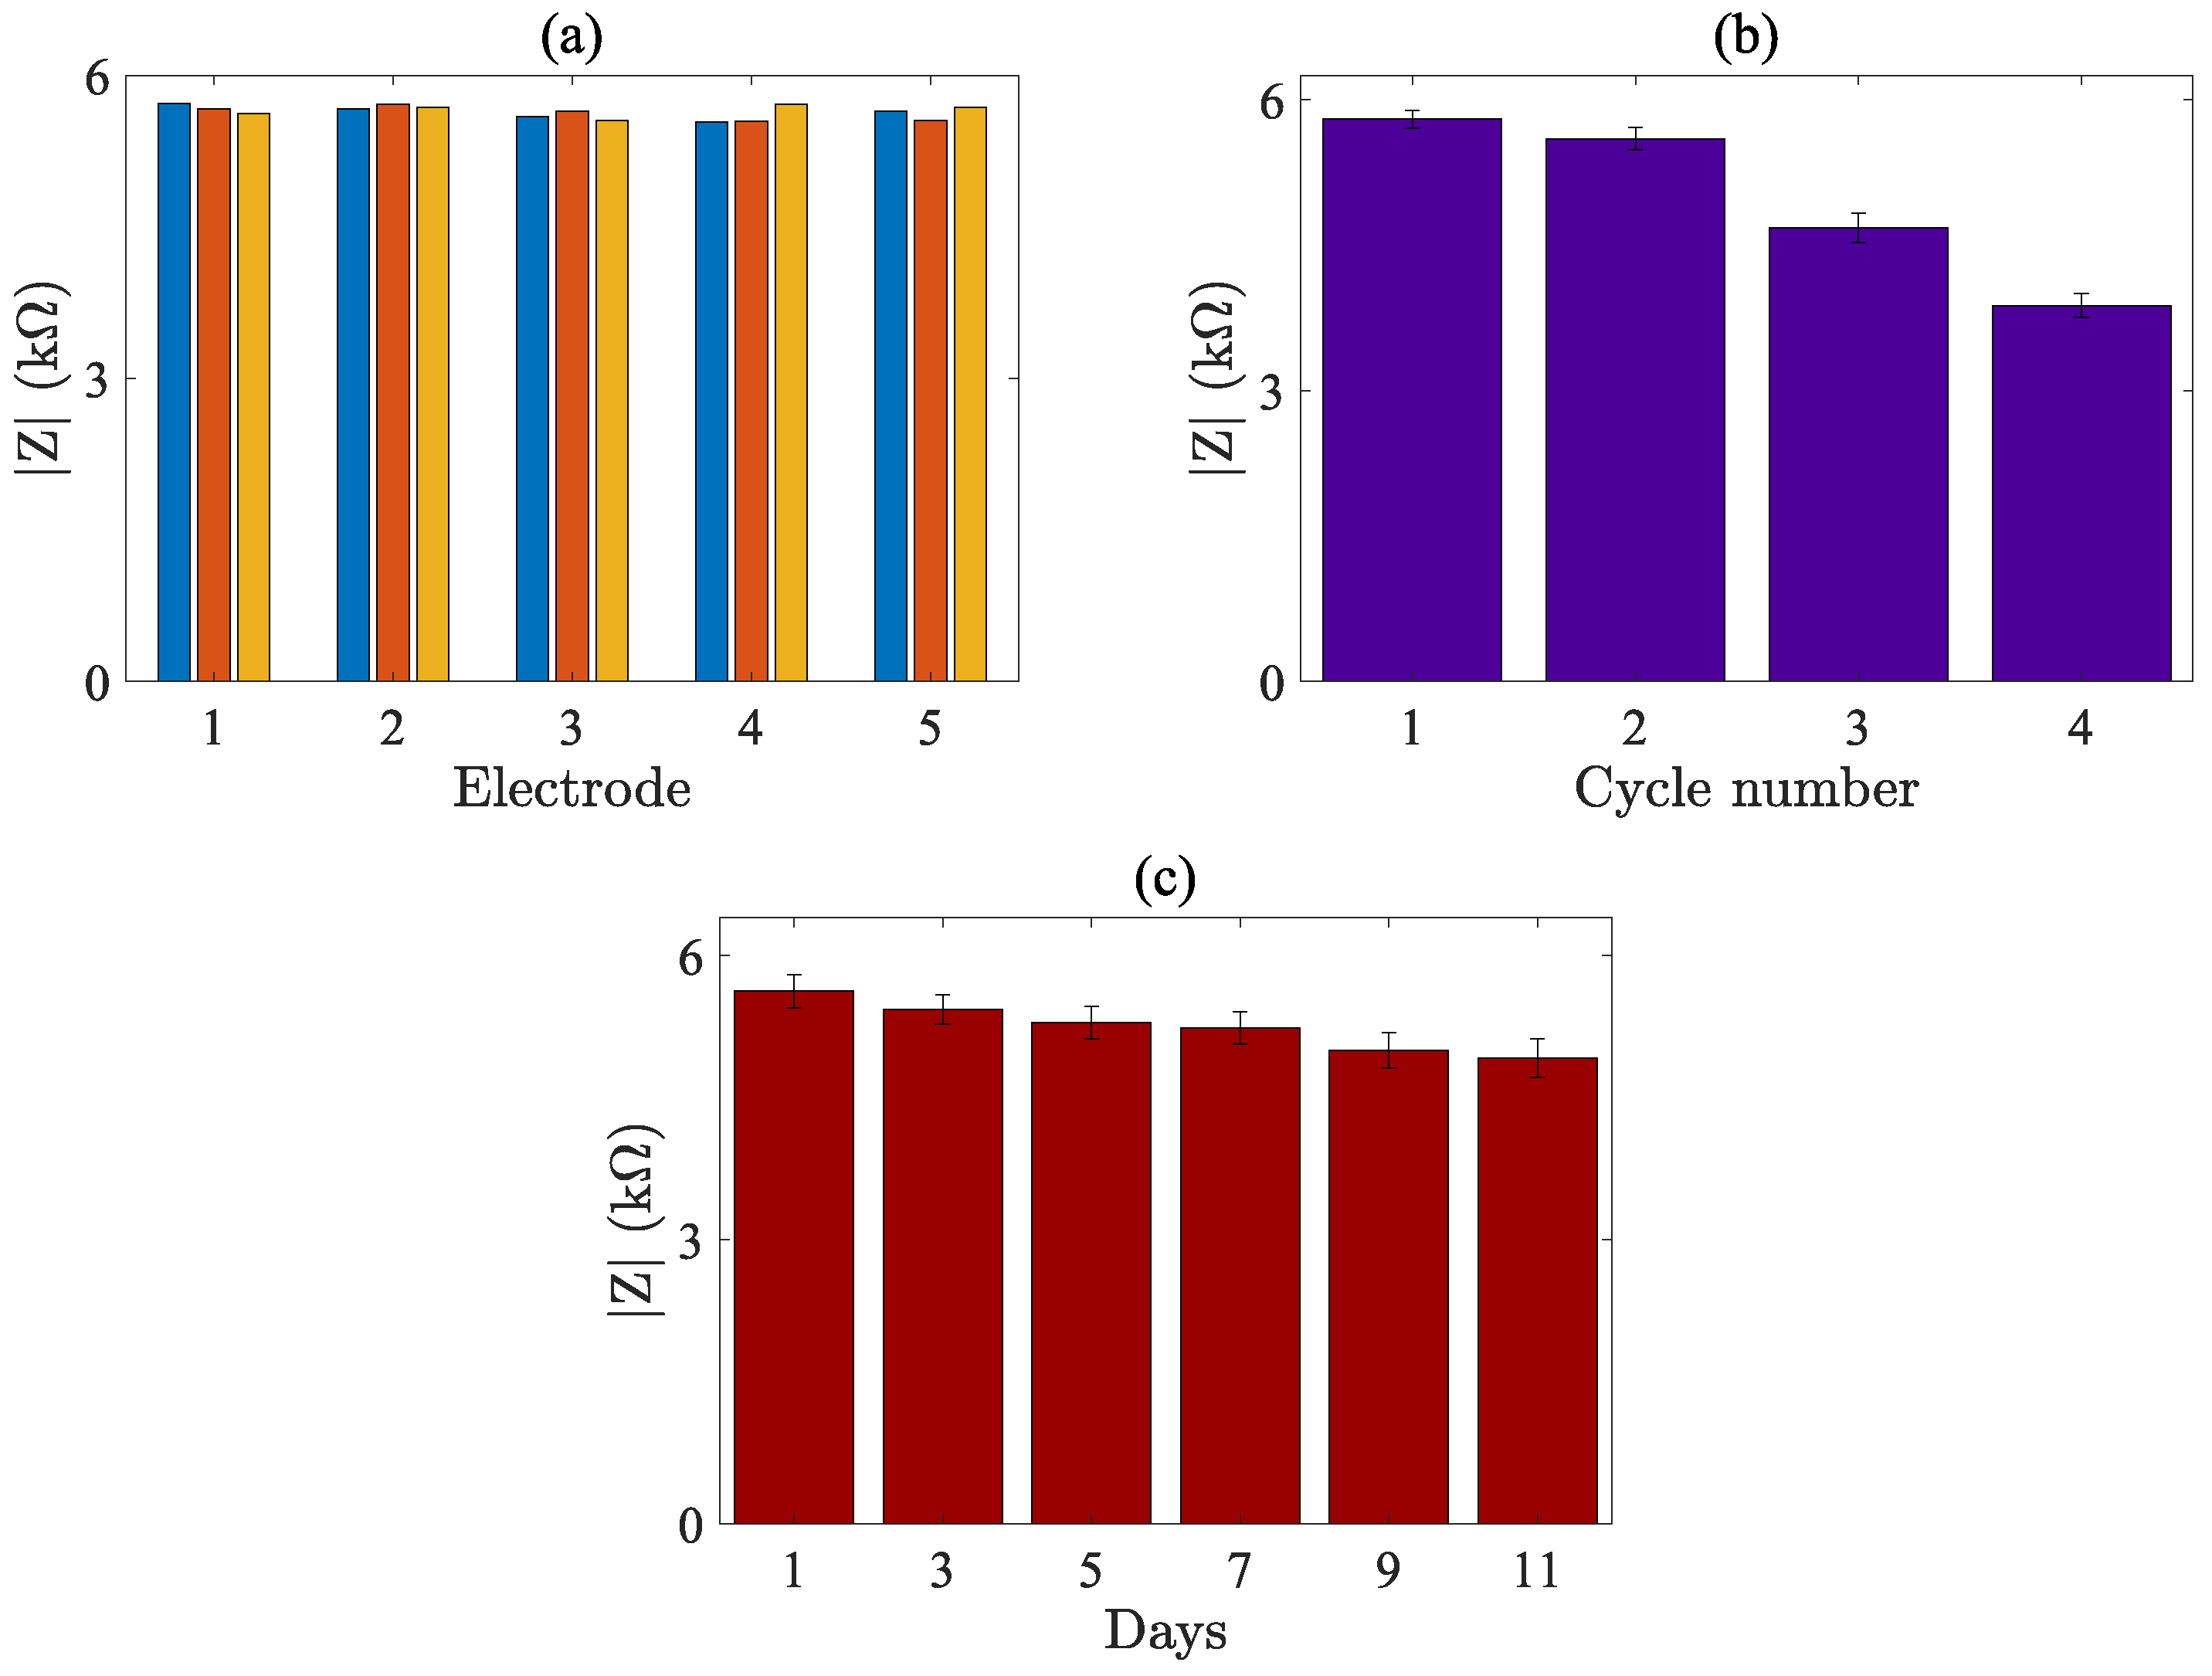
The repeatability and reproducibility were assessed using three measurements with five different GPL/MIP electrodes under similar experimental conditions for a 40 mg/L LVX solution. As depicted in Figure 6a, the relative standard deviation of the three measurements was less than 2.0% and approximately 3.1% for the five sensors. These results confirm that the electrode modification process offers good repeatability and reproducibility when executed correctly. Afterward, the GPL/MIP electrode’s reusability was investigated by employing the same electrode four times, which underwent three testing and elution processes at the end of each test. Figure 6b shows the reusability results, where after two cycles of reuse tests, the sensor response decreased to approximately 80% of the initial response, indicating a reduction in measurement accuracy after two usage cycles. Finally, to investigate the stability of the sensor, we stored different sensors for 1, 3, 5, 7, 9, and 11 days and measured the same LVX concentration three times, as shown in Figure 6c. The sensors were kept in Eppendorf plastic tubes and stored in a refrigerator at 4 °C until use. The initial response did not change significantly until the seventh day, when it dropped by approximately 10%. Then, on the ninth and eleventh days, the response decreased by 12.1% and 13.6%, respectively. This decrease in response after the seventh day could be attributed to damage in the cavities or alterations in the polymer adhesion due to the storage period [41].
These results confirm the operating conditions and limitations of the sensors regarding reuse and regeneration. However, the GPL substrates can potentially be recovered and subsequently refunctionalized to enable reuse of the original substrate. The recovery procedure is described in Section S2, and the results are shown in Figure S4.

4.5. Online Monitoring of LVX Photocatalytic Degradation Process

Two experiments were performed to demonstrate the applicability of the sensor for monitoring the photocatalytic degradation of LVX, using the experimental configuration and parameters shown in Section 3.6. Impedance measurements were performed at a frequency of 1 kHz with a peak-to-peak voltage amplitude of 150 mV. Additionally, both experiments were validated with HPLC measurements at time intervals of 0, 1, 3, 5, 10, 15, 20, 30, 45, and 60 min. Finally, to obtain the degradation profiles, the LVX degradation rate, LVX( C / C 0 ), was computed as follows
LVX ( C / C 0 ) = C i C 0   ,
where C 0 is the initial concentration value of 20 mg/L, and C i is the concentration value at different sampling times, i = 1 , 2 , , N .
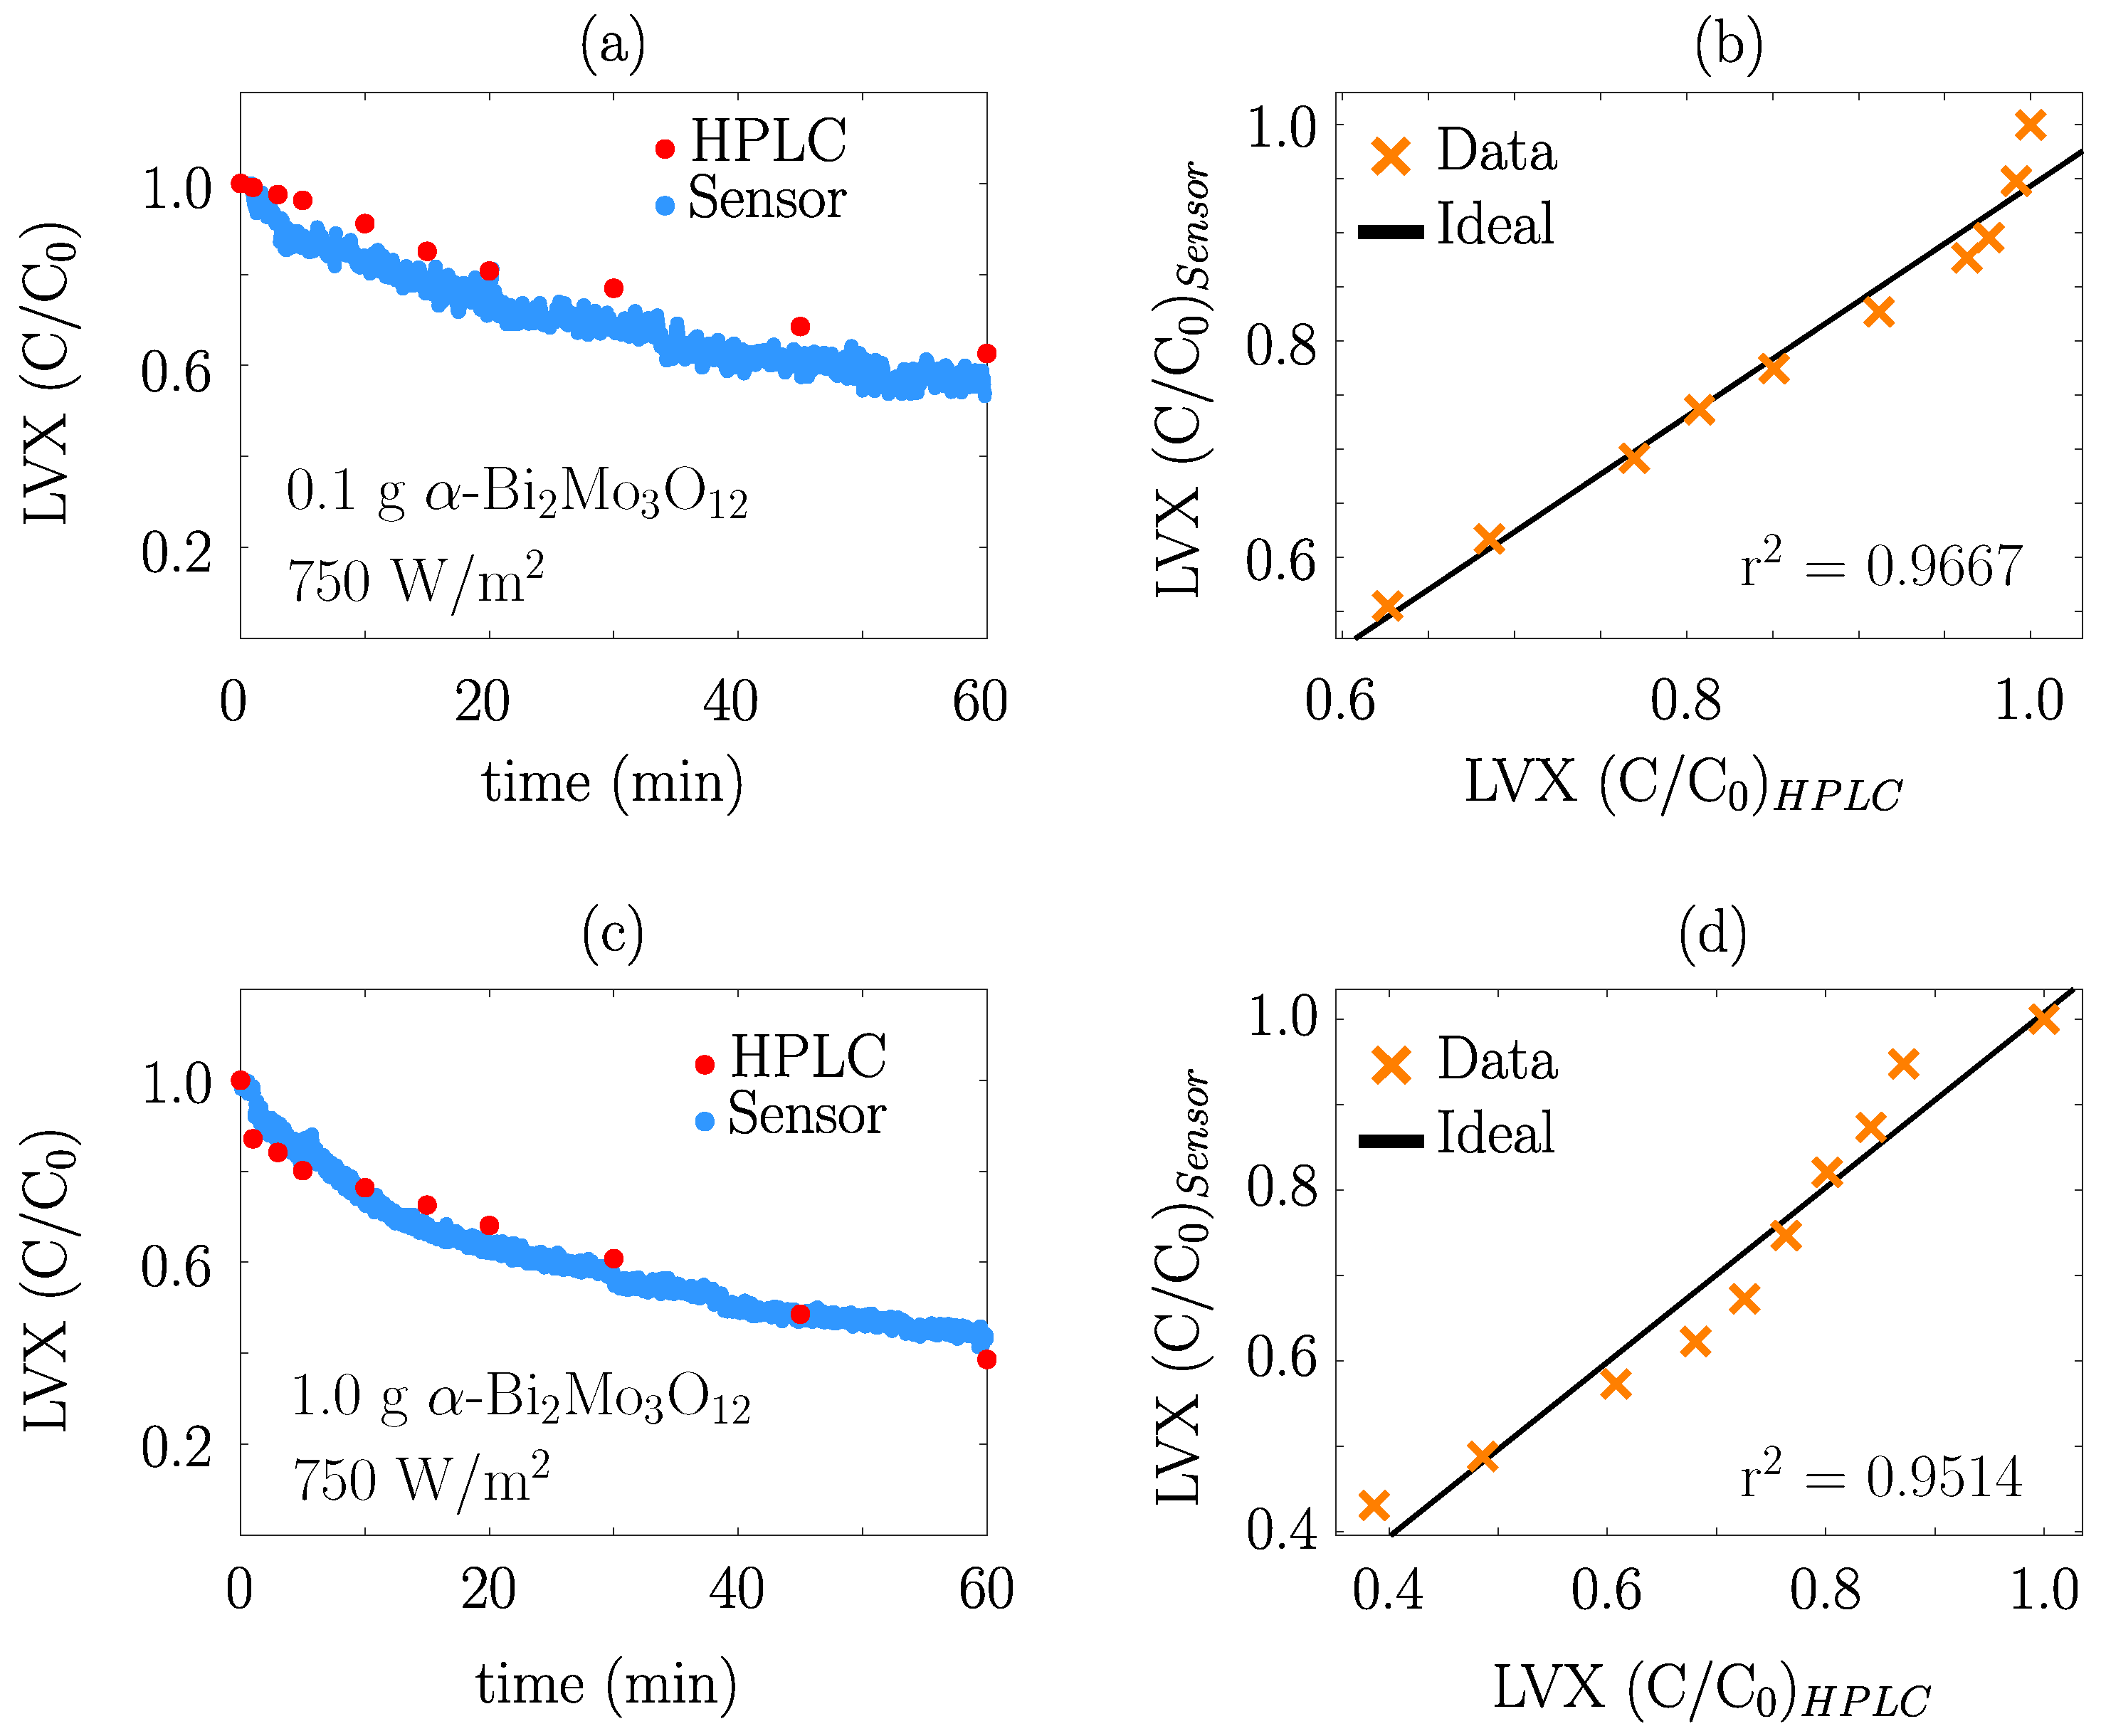
Figure 7a shows the online degradation of LVX using 0.1 g of α -Bi2Mo3O12 and 750   W / m 2 . Here, it is possible to see the sensor’s ability to monitor a degradation process online by taking continuous samples compared to HPLC measurements. In this experiment, we obtained a final degradation value of 0.57 with the sensor, while the value obtained with HPLC was 0.62. Additionally, to verify the relationship between the responses, a correlation plot is shown in the Figure 7b, where the solid line represents the ideal relationship, and the markers indicate the real correlation between the sensor data and the HPLC measurements. The results show that the correlation coefficient ( r 2 ) between ideal and real behavior is 0.9667, indicating a strong relationship between the sensor response and the HPLC measurements. These results are consistent with the fact that, over the 60-min duration of the experiment, the sensor’s response behavior closely mirrored the HPLC measurements.
A second test was carried out under the same light intensity but increasing the amount of α -Bi2Mo3O12 to 1.0 g. Figure 7c shows the results, where the degradation rate was lower than in the previous experiment since there was more catalytic material. The final degradation rate obtained in this experiment was 0.42 and 0.38, with the sensor and HPLC, respectively. This finding indicates that approximately 60% of the initial LVX concentration was degraded. Also, from Figure 7c, it is evident that LVX( C / C 0 )Sensor and LVX( C / C 0 )HPLC exhibited a decreasing time-dependent curve, which qualitatively confirms the sensor performance. The correlation between the sensor and HPLC data was computed to verify this situation, thus leading to a coefficient r 2 close to 95%, as depicted in Figure 7d.
These findings show that the sensor responds comparably to HPLC, with a correlation above 95% between both datasets. In addition, the proposed system reduces monitoring time compared with HPLC because each HPLC analysis requires approximately 13 min. To obtain the ten data points for each of the two degradation experiments, we performed a total of twenty HPLC analyses, which required approximately 4.3 h of chromatographic analysis. In contrast, sensor preparation, including activation, modification, and elution, requires approximately 36 min. Once prepared, the sensor continuously and automatically monitors the entire degradation process without requiring a separate analysis for each measurement point. This feature demonstrates the feasibility of the proposed system for reducing analysis time and facilitating the optimization of experimental parameters in pharmaceutical pollutant degradation processes.
In addition, different amounts of α -Bi2Mo3O12 produced no significant changes in the sensor response, demonstrating its ability to monitor changes in LVX concentration under the evaluated experimental conditions.
Finally, we monitored the pH at the beginning and end of the experiments and obtained an average value of 6.6 ± 0.3. We conducted these experiments in distilled water without adjusting the pH to avoid introducing additional ionic species from buffer solutions, HCl, or NaOH, which could alter the background conductivity and impedimetric response of the system. If the proposed sensor is used with different sample matrices or under experimental conditions involving a broader pH range, additional characterization and pH-specific calibration will be necessary, since pH can affect both photocatalytic degradation and the impedimetric sensor response [42,43,44].

4.6. Practical Applicability

The results indicate that the proposed MIP sensor can be applied to monitor LVX degradation online in a photocatalytic process under controlled experimental conditions. However, it is crucial to compare the performance of this monitoring system with previous reports to identify its advantages and disadvantages. Table 1 presents different monitoring systems, the analyte, the quantification technique, the limit of detection, the linear operating range, and the type of monitoring. The linear operating range is similar across all studies, and the detection limit obtained with our sensor is of the same order of magnitude as that reported in other works. Some studies report lower detection limits due to sophisticated analytical techniques, which do not allow online monitoring.
The proposed sensor provides a practical alternative to conventional analytical techniques such as HPLC, particularly for online monitoring applications. Although the sensor and HPLC rely on different transduction principles, and HPLC provides more robust analytical performance, the proposed system offers a promising tool for online monitoring by combining cost-effective materials with simple instrumentation.

5. Conclusions

This work introduces a cost-effective impedimetric sensor-based system for online monitoring of levofloxacin (LVX) photocatalytic degradation. Unlike conventional analytical methods, the proposed device enables online measurements to optimize degradation mechanisms sustainably and efficiently. The system was designed to monitor photocatalysis using an impedimetric sensor and continuous impedance measurements. The sensor combines the integration of graphite pencil leads (GPL) modified with molecularly imprinted polymers (MIP) and a 3D-printed case. These accessible and cost-effective materials and techniques are ideal for developing eco-friendly devices in resource-limited environments. The sensor demonstrated its ability to quantify the concentration of LVX with a detection limit of 1.3 mg/L in a range of 5 to 40 mg/L. In addition, we proposed an equivalent electrical circuit model to interpret the sensor’s behavior as a function of LVX concentration. With this model, we compared the ideal behavior with the experimental data, finding a relative difference of less than 4%. Subsequently, the sensor was integrated into a portable online monitoring system to quantify the degradation of LVX in a photocatalysis process under controlled conditions. The accuracy of these results was verified with high-performance liquid chromatography (HPLC) measurements, showing a correlation coefficient above 95% between the device readings and those obtained through HPLC. These results represent a significant advancement in developing portable online monitoring systems, sharing characteristics comparable to conventional analytical techniques. Additionally, this work contributes to a solid knowledge base for developing new online monitoring systems to understand and optimize the degradation mechanisms of antibiotics in photocatalysis processes. Finally, the sensor design and characterization methodology could be extended to other pharmaceutical compounds or adapted to different applications in water treatment processes. However, its use with real water samples will require additional interference studies, along with further characterization and calibration.

Supplementary Materials

The following supporting information can be downloaded at https://www.mdpi.com/article/10.3390/pr14172742/s1, Figure S1: Electropolymerization curves of PANI with (a) 10 cycles, (b) 15 cycles, (c) 20 cycles, (d) 25 cycles, and (e) 30 cycles. (f) Impedance magnitude spectra for various GPL/MIP electrodes modified with different numbers of cycles measured in phosphate-buffered saline (PBS) at pH 7.4; Figure S2: Optimization of experimental parameters for MIP-modified electrodes. (a) Different elution times and (b) effect of molar ratios between functional monomers and template molecules; Figure S3: Calibration curves used to determine the optimal system performance within the LVX concentration range of 0 to 40 mg/L. The black dots represent the experimental measurements, the solid line represents the linear fitting model, and the vertical bars represent the standard deviation of three measurements. (a) Calibration curve of impedance magnitude | Z | as a function of LVX concentration. (b) Calibration curve of capacitance C d l as a function of LVX concentration; Figure S4: Impedance measurements of a 40 mg/L LVX solution in distilled water for different successive GPL electrode recovery and reuse cycles.

Author Contributions

B.E.A.-S.: conceptualization, methodology, data collection, formal analysis, and writing-original draft. J.S.R.-G.: investigation, methodology, writing-review, and editing. S.A.-S.: methodology, writing-review, and editing. D.S.-M.: writing-review and editing, validation, and resources. R.-M.R.-Z.: writing-review and editing, validation, and resources. R.G.R.-C.: investigation, validation, funding acquisition, and writing-original draft. All authors have read and agreed to the published version of the manuscript.

Funding

This research was funded by SECTEI Project No. 135/2024.

Data Availability Statement

The original contributions presented in this study are included in the article/Supplementary Material. Further inquiries can be directed to the corresponding authors.

Acknowledgments

JSRG (CVU 824115) acknowledges the postdoctoral fellowship EPM 2024(1) provided by CONAHCyT/SECIHTI. This research was supported by SECTEI project No. 135/2024.

Conflicts of Interest

The authors declare no conflict of interest.

References

  1. Mishra, S.; Singh, A.K.; Cheng, L.; Hussain, A.; Maiti, A. Occurrence of antibiotics in wastewater: Potential ecological risk and removal through anaerobic–aerobic systems. Environ. Res. 2023, 226, 115678. [Google Scholar] [CrossRef] [Scilit] [PubMed]
  2. Saya, L.; Malik, V.; Gautam, D.; Gambhir, G.; Singh, W.R.; Hooda, S. A comprehensive review on recent advances toward sequestration of levofloxacin antibiotic from wastewater. Sci. Total Environ. 2022, 813, 152529. [Google Scholar] [CrossRef] [Scilit] [PubMed]
  3. Liu, X.; Liu, Y.; Lu, S.; Wang, Z.; Wang, Y.; Zhang, G.; Guo, X.; Guo, W.; Zhang, T.; Xi, B. Degradation difference of ofloxacin and levofloxacin by UV/H2O2 and UV/PS (persulfate): Efficiency, factors and mechanism. Chem. Eng. J. 2020, 385, 123987. [Google Scholar] [CrossRef] [Scilit]
  4. Maia, A.S.; Paíga, P.; Delerue-Matos, C.; Castro, P.M.; Tiritan, M.E. Quantification of fluoroquinolones in wastewaters by liquid chromatography-tandem mass spectrometry. Environ. Pollut. 2020, 259, 113927. [Google Scholar] [CrossRef] [Scilit] [PubMed]
  5. Hoang, N.T.; Mwazighe, F.M.; Le, P.C. Kinetic study on the degradation of organic pollutants in UV/persulfate and in other advanced oxidation processes: Role of radicals and improvement of the degradation rates. J. Environ. Chem. Eng. 2023, 11, 110456. [Google Scholar] [CrossRef] [Scilit]
  6. Li, S.; Wu, Y.; Zheng, H.; Li, H.; Zheng, Y.; Nan, J.; Ma, J.; Nagarajan, D.; Chang, J.S. Antibiotics degradation by advanced oxidation process (AOPs): Recent advances in ecotoxicity and antibiotic-resistance genes induction of degradation products. Chemosphere 2023, 311, 136977. [Google Scholar] [CrossRef] [Scilit] [PubMed]
  7. Bai, X.; Chen, W.; Wang, B.; Sun, T.; Wu, B.; Wang, Y. Photocatalytic degradation of some typical antibiotics: Recent advances and future outlooks. Int. J. Mol. Sci. 2022, 23, 8130. [Google Scholar] [CrossRef] [Scilit] [PubMed]
  8. Ganeshbabu, M.; Priya, J.S.; Manoj, G.M.; Puneeth, N.P.N.; Shobana, C.; Shankar, H.; Selvan, R.K. Photocatalytic degradation of fluoroquinolone antibiotics using chitosan biopolymer functionalized copper oxide nanoparticles prepared by facile sonochemical method. Int. J. Biol. Macromol. 2023, 253, 127027. [Google Scholar] [CrossRef] [Scilit] [PubMed]
  9. Chen, Q.; Hu, L.; Shi, Y.; Liu, C.; Hou, Y.; Bi, J.; Jimmy, C.Y.; Wu, L. Cu2O/WO3 S-scheme heterojunctions for photocatalytic degradation of levofloxacin based on coordination activation. Chemosphere 2024, 352, 141446. [Google Scholar] [CrossRef] [Scilit] [PubMed]
  10. Cheng, X.; Guan, R.; Chen, Y.; Qian, Y.; Shang, Q.; Sun, Y. Adsorption and photocatalytic degradation process of oxytetracycline using mesoporous Fe-TiO2 based on high-resolution mass spectrometry. Chem. Eng. J. 2023, 460, 141618. [Google Scholar] [CrossRef] [Scilit]
  11. Xie, D.; Che, H.; Chen, J.; Ao, Y. Visible-light-driven photocatalytic degradation of a typical UV filter by a novel composite photocatalyst: DFT calculation, degradation pathway, and toxicity evolution. Chem. Eng. J. 2023, 475, 146281. [Google Scholar] [CrossRef] [Scilit]
  12. Ranjbari, A.; Yu, J.; Kim, J.; Kim, J.; Park, M.; Kim, K.H.; Heynderickx, P.M. Fundamental kinetic modeling of dye sensitization photocatalysis by oxygen vacancy enriched ZnO for the quantification of degradation by catalyst or dye sensitizer. Appl. Surf. Sci. 2024, 659, 159867. [Google Scholar] [CrossRef] [Scilit]
  13. Barhoum, A.; Hamimed, S.; Slimi, H.; Othmani, A.; Abdel-Haleem, F.M.; Bechelany, M. Modern designs of electrochemical sensor platforms for environmental analyses: Principles, nanofabrication opportunities, and challenges. Trends Environ. Anal. Chem. 2023, 38, e00199. [Google Scholar] [CrossRef] [Scilit]
  14. Alvarez-Serna, B.; García-Mejía, T.A.; Arzate Salgado, S.Y.; Yañez-Aulestia, A.; Ramírez-Chavarría, R.G.; Ramirez-Zamora, R.M. Cost-effective Amperometric Sensor for Monitoring Levofloxacin in Groundwater. Electroanalysis 2024, 37, e202400096. [Google Scholar] [CrossRef] [Scilit]
  15. Wang, Q.; Xue, Q.; Chen, T.; Li, J.; Liu, Y.; Shan, X.; Liu, F.; Jia, J. Recent advances in electrochemical sensors for antibiotics and their applications. Chin. Chem. Lett. 2021, 32, 609–619. [Google Scholar] [CrossRef] [Scilit]
  16. Arellano, M.; Oturan, N.; Oturan, M.A.; Pazos, M.; Sanromán, M.Á.; González-Romero, E. Differential pulse voltammetry as a powerful tool to monitor the electro-Fenton process. Electrochim. Acta 2020, 354, 136740. [Google Scholar] [CrossRef] [Scilit]
  17. Sharma, N.K.; Nain, A.; Singh, K.; Rani, N.; Singal, A. Impedimetric sensors: Principles, applications and recent trends. Int. J. Innov. Technol. Explor. Eng. 2019, 8, 4015–4025. [Google Scholar] [CrossRef] [Scilit]
  18. Bataller, R.; Gandía, J.M.; García-Breijo, E.; Alcañiz, M.; Soto, J. A study of the importance of the cell geometry in non-Faradaic systems. A new definition of the cell constant for conductivity measurement. Electrochim. Acta 2015, 153, 263–272. [Google Scholar] [CrossRef] [Scilit]
  19. Panagopoulou, C.; Skotadis, E.; Aslanidis, E.; Tzourmana, G.; Rapesi, A.; Tsioustas, C.; Kainourgiaki, M.; Kleitsiotis, G.; Tsekenis, G.; Tsoukalas, D. Non-Faradaic Impedimetric Detection of Heavy Metal Ions via a Hybrid Nanoparticle-DNAzyme Biosensor. Biosensors 2024, 14, 321. [Google Scholar] [CrossRef] [Scilit] [PubMed]
  20. Assaifan, A.K.; Hezam, M.; Al-Gawati, M.A.; Alzahrani, K.E.; Alswieleh, A.; Arunachalam, P.; Al-Mayouf, A.; Alodhayb, A.; Albrithen, H. Label-free and simple detection of trace Pb (II) in tap water using non-faradaic impedimetric sensors. Sens. Actuators A Phys. 2021, 329, 112833. [Google Scholar] [CrossRef] [Scilit]
  21. Nguyen, S.H.; Nguyen, H.Q.; Tran, M.T. A label-free impedimetric strategy using interdigitated electrodes for tetracycline detection in Milk. Food Chem. X 2026, 37, 104171. [Google Scholar] [CrossRef] [Scilit] [PubMed]
  22. Sun, Y.; Zhao, J.; Liang, L. Recent development of antibiotic detection in food and environment: The combination of sensors and nanomaterials. Microchim. Acta 2021, 188, 21. [Google Scholar] [CrossRef] [Scilit] [PubMed]
  23. Phi Van, T.; Nguy, T.P.; Truong, L.T. A highly sensitive impedimetric sensor based on a MIP biomimetic for the detection of enrofloxacin. Anal. Methods 2022, 14, 2195–2203. [Google Scholar] [CrossRef] [Scilit] [PubMed]
  24. Alsaiari, N.S.; Katubi, K.M.M.; Alzahrani, F.M.; Siddeeg, S.M.; Tahoon, M.A. The application of nanomaterials for the electrochemical detection of antibiotics: A review. Micromachines 2021, 12, 308. [Google Scholar] [CrossRef] [Scilit] [PubMed]
  25. Annu; Sharma, S.; Jain, R.; Raja, A.N. Pencil graphite electrode: An emerging sensing material. J. Electrochem. Soc. 2020, 167, 037501. [Google Scholar] [CrossRef] [Scilit]
  26. Zhao, G.; Zhang, Y.; Sun, D.; Yan, S.; Wen, Y.; Wang, Y.; Li, G.; Liu, H.; Li, J.; Song, Z. Recent advances in molecularly imprinted polymers for antibiotic analysis. Molecules 2023, 28, 335. [Google Scholar] [CrossRef] [Scilit] [PubMed]
  27. Wei, M.; Geng, X.; Liu, Y.; Long, H.; Du, J. A novel electrochemical sensor based on electropolymerized molecularly imprinted polymer for determination of luteolin. J. Electroanal. Chem. 2019, 842, 184–192. [Google Scholar] [CrossRef] [Scilit]
  28. Liang, Y.; Wang, H.; Xu, Y.; Pan, H.; Guo, K.; Zhang, Y.; Chen, Y.; Liu, D.; Zhang, Y.; Yao, C.; et al. A novel molecularly imprinted polymer composite based on polyaniline nanoparticles as sensitive sensors for parathion detection in the field. Food Control 2022, 133, 108638. [Google Scholar] [CrossRef] [Scilit]
  29. Zeng, Z.; Chen, Y.; Zhu, X.; Yu, L. Polyaniline-supported nano metal-catalyzed coupling reactions: Opportunities and challenges. Chin. Chem. Lett. 2023, 34, 107728. [Google Scholar] [CrossRef] [Scilit]
  30. Mazumder, M.A.J.; Sheardown, H.; Al-Ahmed, A. Functional Polymers; Springer: Berlin/Heidelberg, Germany, 2019. [Google Scholar]
  31. Brett, C.M. Electrochemical impedance spectroscopy in the characterisation and application of modified electrodes for electrochemical sensors and biosensors. Molecules 2022, 27, 1497. [Google Scholar] [CrossRef] [Scilit] [PubMed]
  32. Ramírez-Chavarría, R.G.; Castillo-Villanueva, E.; Alvarez-Serna, B.E.; Carrillo-Reyes, J.; Torres, L.; Ramírez-Zamora, R.M.; Buitrón, G.; Alvarez-Icaza, L. Automatic Analysis of Isothermal Amplification via Impedance Time-Constant-Domain Spectroscopy: A SARS-CoV-2 Case Study. Chemosensors 2023, 11, 230. [Google Scholar] [CrossRef] [Scilit]
  33. Vivier, V.; Orazem, M.E. Impedance analysis of electrochemical systems. Chem. Rev. 2022, 122, 11131–11168. [Google Scholar] [CrossRef] [Scilit] [PubMed]
  34. Kaneko, S.; Rachi, T.; Yasui, M.; Shimizu, Y.; Tanaka, S.; Kato, C.; Satoh, K.; Shawuti, S.; Can, M.; Endo, T. Graphen growth: 10B lead pencil, print paper, and femtosecond laser. In Proceedings of the 2015 International Conference on Microwave and Photonics (ICMAP); IEEE: Piscataway, NJ, USA, 2015; pp. 1–2. [Google Scholar] [CrossRef] [Scilit]
  35. Rodríguez-Girón, J.; Hernández-Uresti, D.; Obregón, S.; Juárez-Ramírez, I.; Sánchez-Martínez, D. One-step microwave-assisted hydrothermal synthesis of α-Bi2Mo3O12 without surfactants at low temperature for their application in tetracycline photodegradation. Mater. Today Commun. 2022, 33, 104695. [Google Scholar] [CrossRef] [Scilit]
  36. Yarkaeva, Y.; Maistrenko, V.; Dymova, D.; Zagitova, L.; Nazyrov, M. Polyaniline and poly (2-methoxyaniline) based molecular imprinted polymer sensors for amoxicillin voltammetric determination. Electrochim. Acta 2022, 433, 141222. [Google Scholar] [CrossRef] [Scilit]
  37. Djaalab, E.; Samar, M.E.; Zougar, S.; Kherrat, R. Pt electrode modified with β-cyclodextrin/polyaniline for electrochemical sensing of penicillin V. Sens. Rev. 2020, 40, 247–254. [Google Scholar] [CrossRef] [Scilit]
  38. He, Y.; Wang, X.; Huang, H.; Zhang, P.; Chen, B.; Guo, Z. In-situ electropolymerization of porous conducting polyaniline fibrous network for solid-state supercapacitor. Appl. Surf. Sci. 2019, 469, 446–455. [Google Scholar] [CrossRef] [Scilit]
  39. Wu, Y.; Wang, J.; Ou, B.; Zhao, S.; Wang, Z.; Wang, S. Electrochemical preparation of polyaniline nanowires with the used electrolyte solution treated with the extraction process and their electrochemical performance. Nanomaterials 2018, 8, 103. [Google Scholar] [CrossRef] [Scilit] [PubMed]
  40. Venkatesh, S.; Yeung, C.C.; Li, T.; Lau, S.C.; Sun, Q.J.; Li, L.Y.; Li, J.H.; Lam, M.H.; Roy, V.A. Portable molecularly imprinted polymer-based platform for detection of histamine in aqueous solutions. J. Hazard. Mater. 2021, 410, 124609. [Google Scholar] [CrossRef] [Scilit] [PubMed]
  41. Li, S.; Zhong, T.; Long, Q.; Huang, C.; Chen, L.; Lu, D.; Li, X.; Zhang, Z.; Shen, G.; Hou, X. A gold nanoparticles-based molecularly imprinted electrochemical sensor for histamine specific-recognition and determination. Microchem. J. 2021, 171, 106844. [Google Scholar] [CrossRef] [Scilit]
  42. Zhao, C.; Pelaez, M.; Duan, X.; Deng, H.; O’Shea, K.; Fatta-Kassinos, D.; Dionysiou, D.D. Role of pH on photolytic and photocatalytic degradation of antibiotic oxytetracycline in aqueous solution under visible/solar light: Kinetics and mechanism studies. Appl. Catal. B Environ. 2013, 134, 83–92. [Google Scholar] [CrossRef] [Scilit]
  43. Alibrahim, K.A. Adsorption of levofloxacin antibiotic residuals from wastewater onto meso-porous ZnO nanoparticle: Equilibrium, kinetics, and thermodynamics. Desalin. Water Treat. 2022, 277, 177–189. [Google Scholar] [CrossRef] [Scilit]
  44. Bongaers, E.; Alenus, J.; Horemans, F.; Weustenraed, A.; Lutsen, L.; Vanderzande, D.; Cleij, T.; Troost, F.; Brummer, R.J.; Wagner, P. A MIP-based biomimetic sensor for the impedimetric detection of histamine in different pH environments. Phys. Status Solidi A 2010, 207, 837–843. [Google Scholar] [CrossRef] [Scilit]
  45. Lykos, C.; Kourkouta, T.; Konstantinou, I. Study on the photocatalytic degradation of metronidazole antibiotic in aqueous media with TiO2 under lab and pilot scale. Sci. Total Environ. 2023, 870, 161877. [Google Scholar] [CrossRef] [Scilit] [PubMed]
  46. Heakal, F.E.T.; Bakry, A.M. Role of amoxicillin in enhancing AZ31 alloy degradation resistance and its monitoring using nano-Pd electrochemical sensor. Mater. Chem. Phys. 2019, 234, 224–236. [Google Scholar] [CrossRef] [Scilit]
  47. Wang, Y.F.; Li, Z.; Jiang, M.; Yu, X.; Xu, L. “Two-in-one” sulfur and nitrogen co-doped fluorescent silicon nanoparticles: Simultaneous as the fluorescent probe and photocatalyst for in-situ real time visual monitoring and degradation of tetracycline antibiotics. Sci. Total Environ. 2022, 846, 157470. [Google Scholar] [CrossRef] [Scilit] [PubMed]
  48. Zhang, J.; Lv, C.; Shi, C.; Feng, J.; Wu, L. Oxygen-vacancy hydroxyapatite for visible-light photocatalytic degradation of tetracycline with online spectral monitoring. Microchem. J. 2023, 192, 108906. [Google Scholar] [CrossRef] [Scilit]
Figure 1. Schematic diagram of the molecularly imprinted polymer process by electropolymerization of polyaniline. The red lines represent the cyclic voltammograms recorded during the PANI electropolymerization process.
Processes 14 02742 g001
Figure 2. (a) GPL/MIP sensor. (b) Experimental setup of the MIP sensor for online monitoring of LVX degradation by photocatalysis.
Processes 14 02742 g002
Figure 3. (a) Electropolymerization curves of PANI with 20 cycles. (b) Impedance magnitude spectra for GPL, GPL/NIP, GPL/MIP before remove and GPL/MIP after remove electrodes in a 40 mg/L LVX solution over a frequency range of 10 2 to 10 6 Hz and a peak-to-peak amplitude of 150 mV. (c) Selectivity and interference of GPL/MIP and GPL/NIP impedance sensors.
Processes 14 02742 g003
Figure 4. Field emission scanning electron microscopy (FESEM) images showing the surface morphology of the (a) GPL electrode and (b) GPL/MIP modified with 20 cycles of electropolymerization.
Processes 14 02742 g004
Figure 5. (a) Impedance magnitude spectra in the range of 10 1 to 10 6 Hz for different LVX concentrations, represented by different colored lines. The vertical dashed lines delimit the frequency range from 10 2 to 10 4 Hz used to evaluate the linear dependence of impedance magnitude on LVX concentration. (b) Proposed equivalent electrical circuit model for the GPL/MIP sensor. (c) Calibration curve of impedance magnitude as a function of LVX concentration at a fixed frequency of 1 kHz for the GPL/MIP sensor. (d) HPLC calibration curve of area as a function of LVX concentration. (e) Online impedance magnitude measurements under controlled stepwise increases in LVX concentration at a fixed frequency of 1 kHz and a peak-to-peak voltage amplitude of 150 mV.
Processes 14 02742 g005
Figure 6. (a) Reproducibility, (b) reusability, and (c) stability of GPL/MIP impedance sensor.
Processes 14 02742 g006
Figure 7. (a) LVX degradation rate (LVX( C / C 0 )) in a photocatalysis process with 0.1 g of α -Bi2Mo3O12 and 750 W/m2. (b) Scatter plot of the relationship among LVX( C / C 0 )Sensor and LVX( C / C 0 )HPLC. (c) LVX( C / C 0 ) in a photocatalysis process with 1.0 g of α -Bi2Mo3O12 and 750 W/m2. (d) Scatter plot of the relationship among LVX( C / C 0 )Sensor and LVX( C / C 0 )HPLC.
Processes 14 02742 g007
Table 1. Comparison of different monitoring systems for degradation of antibiotics in photocatalytic process.
AnalyteQuantification
Technique
TransductionLOD
(mg/L)
Linear
Range
(mg/L)
Type of
Monitoring
References
MetronidazoleHigh-performance
liquid chromatography
OpticalNot specified1–10Offline[45]
AmoxicillinElectrochemical
impedance
spectroscopy
Electrochemical2.336.5–365.4Offline[46]
TetracyclineFluorescenceOptical0.0040.005–50Online[47]
TetracyclinePhotoluminescenceOpticalNot specified1–40Online[48]
LevofloxacinImpedance
measurements
Electrochemical1.35–40OnlineThis work
Disclaimer/Publisher’s Note: The statements, opinions and data contained in all publications are solely those of the individual author(s) and contributor(s) and not of MDPI and/or the editor(s). MDPI and/or the editor(s) disclaim responsibility for any injury to people or property resulting from any ideas, methods, instructions or products referred to in the content.