1. Introduction
Production continuity in heavy industrial facilities depends not only on the nominal capacity of primary process equipment and the internal efficiency of the production line but also on the performance of supporting logistics. In large-scale plants, the reliability of raw-material inflows, auxiliary-material circulation, intermediate-product handling, storage-area movements, and final-product dispatching constitutes an integral part of overall system performance. Internal logistics should therefore be considered a strategic operational function rather than a peripheral activity. In many facilities, the stability of these logistics flows directly determines capacity utilization, shipment reliability, bottleneck formation, and the resilience of the production schedule [
1,
2].
In industrial plants equipped with railway connections, in-plant shunting operations are among the most critical components of this logistics system. In cement, mining, iron and steel, power-generation, and other heavy-industry contexts, wagon marshalling, track switching, route setting, weighing-track entry, loading/unloading positioning, and pre-dispatch arrangement directly affect the execution of the daily production and distribution plan. Delays in these operations can propagate beyond rail traffic and affect loading-equipment utilization, inventory balance, shift coordination, dispatch timing, and customer-delivery performance. Consequently, the technical adequacy and operational controllability of the shunting locomotive are decisive determinants of overall logistics performance and production continuity [
1,
2,
3,
4,
5].
The duty profile of an in-plant shunting locomotive differs substantially from that of a mainline locomotive. Whereas mainline traction is governed primarily by sustained power, range, maximum speed, line capacity, and route availability, in-plant shunting is dominated by controlled low-speed movement, high tractive effort over short distances, frequent start–stop cycles, accurate positioning, safe coupling, and continuous operator awareness of the work area. For this reason, locomotive selection cannot be based only on nominal motor power, maximum speed, or total vehicle mass. The compatibility between the actual duty cycle, the propulsion architecture, the wheel–rail adhesion regime, and the safety-control system must therefore be assessed jointly.
Diesel and diesel–electric locomotives have historically dominated yard and plant shunting operations because of their power density, fueling flexibility, mechanical robustness, and established maintenance practices. However, the limitations of diesel-based shunting systems have become increasingly visible under contemporary cost, sustainability, and safety requirements. Diesel price volatility, scheduled engine maintenance, exhaust emissions, noise, vibration, fuel-storage requirements, operator exposure in enclosed or semi-enclosed areas, and dependence on externally leased equipment can all reduce the long-term economic and operational sustainability of diesel shunting in industrial plants.
Against this background, railway operators and industrial facilities have increasingly considered alternative traction technologies. Electrification has well-documented advantages in energy efficiency and emission reduction; however, conventional catenary electrification is not universally applicable because it requires substantial infrastructure investment, long implementation times, site-specific civil works, and sufficient traffic density to justify the capital expenditure [
1]. Battery-electric traction is therefore a particularly relevant option for short-distance, bounded-area railway operations with predictable task cycles and controllable charging opportunities [
1,
2].
Progress in lithium-ion battery technology, power-electronics integration, traction-control algorithms, and digital monitoring systems has expanded the applicability of battery-electric traction beyond passenger and urban rail applications. For freight and shunting tasks, battery-electric systems can reduce diesel dependence, remove local exhaust emissions, improve energy traceability, lower noise exposure, and provide more precise low-speed control [
2]. Nevertheless, their feasibility remains conditional on battery capacity, usable state-of-charge range, duty-cycle intensity, charging-infrastructure adequacy, battery cycle-life management, traction demand, and operational availability [
1,
2].
The typical duty profile of shunting locomotives is technically well aligned with battery-electric propulsion. These locomotives usually operate at low speeds, over short distances, with repetitive forward–reverse movements and variable wagon loads. Because the operation is confined to a defined plant area, the location of charging infrastructure and the timing of energy replenishment can be planned in advance. The literature similarly emphasizes that shunting locomotives are characterized by low speeds, limited travel distances, high cycle frequency, and bounded operating areas; under such conditions, battery-electric traction is a technically plausible solution for controlled industrial applications [
3].
A key engineering advantage of battery-electric shunting locomotives is their ability to deliver controllable torque from very low speeds. In diesel systems, precise low-speed movement is affected by internal-combustion-engine response, transmission behavior, mechanical lag, and operator experience. Electric traction, by contrast, provides more direct torque generation and faster modulation. This characteristic is especially valuable in wagon coupling, weighing-track alignment, loading-line positioning, and short-distance push–pull maneuvers, where repeatability and stopping accuracy are more important than maximum speed.
Regenerative braking is another important technical advantage of battery-electric traction in shunting duty cycles. Because in-plant shunting consists of frequent acceleration, braking, and re-acceleration events, part of the kinetic energy that would otherwise be dissipated as heat can be recovered and returned to the battery [
3]. The actual contribution of regenerative braking depends on wagon mass, track gradient, curve geometry, operator behavior, braking frequency, speed profile, and battery state of charge. Consequently, field-based assessments are necessary to determine the extent to which theoretical energy-recovery capability translates into measurable operational benefits.
Locomotive selection for yard operations is also an occupational safety and health decision. Although shunting speeds are low, the mass of the wagons, the presence of blind spots, coupling operations, frequent reversals, and the simultaneous movement of personnel and equipment create significant risk. Remote-control systems, deadman controls, emergency-stop systems, cameras, LED lighting, acoustic warnings, and programmable control infrastructure should therefore be treated as safety-critical elements rather than convenience features. Allowing the operator to control the locomotive from a position that provides a clearer line of sight can improve both precision and risk perception during coupling, weighing, and alignment tasks [
3,
4,
5].
The environmental dimension of this transition is equally important. Diesel locomotives produce direct greenhouse-gas emissions and local exhaust pollutants because of fuel combustion. These emissions influence not only corporate carbon accounting but also local air quality and worker exposure. Battery-electric locomotives produce no local exhaust emissions at the point of use and can therefore support cleaner plant-yard working conditions. However, the overall environmental performance of an electric system also depends on the electricity supply mix, charging efficiency, battery production, battery replacement interval, and end-of-life management. In this study, the principal calculation focuses on direct Scope 1 emission reduction, while Scope 2 and life-cycle effects are treated as boundary conditions requiring separate assessment.
Previous research has already established the technical feasibility of battery and hybrid railway traction, and Gotsov et al. [
3] specifically demonstrated the operation of a battery shunting locomotive in an industrial plant. The present study therefore does not claim to introduce battery-electric shunting or a new universal assessment methodology. The narrower research need is to document how a cement-plant replacement decision can be evaluated when ownership structure, fuel records, equipment ratings, field observations, direct carbon accounting, and safety-system architecture are examined within the same facility-scale case.
The case compares the previously leased diesel locomotive and the commissioned battery-electric locomotive within the same plant logistics context. The evidence is heterogeneous rather than experimentally matched: lease and diesel use are monthly record-based indicators; equipment parameters are specification-based; electricity use and maneuvering outcomes are site-reported; and the safety assessment is feature- and procedure-based. The analysis separates these evidence classes so that record-supported findings are not presented with the same certainty as operator-reported observations.
The principal question is whether the documented configuration is technically compatible with the plant duty profile and whether the available evidence supports a favorable facility-level decision not whether battery-electric traction is universally superior. The analysis therefore asks: (i) whether rated tractive effort, adhesion management, battery capacity, charging access, control functions, and track conditions are compatible with low-speed shunting; (ii) how the lease-and-fuel cost structure compares with a capital-intensive electric alternative when missing cost components are treated parametrically; and (iii) which operational, environmental, and OSH outcomes are directly measured, reported descriptively, or inferred from system design.
The scope is limited to one cement plant, one diesel platform, one battery-electric platform, and shunting within a bounded plant area. It excludes mainline freight, catenary electrification, matched trials involving multiple operators, long-term battery degradation, and full life-cycle assessment. Transferability therefore depends on duty-cycle similarity, track gauge, gradient and curvature, equivalent train resistance, rail-surface adhesion, ambient temperature, charging-window availability, electricity-supply reliability and carbon intensity, and local operating rules.
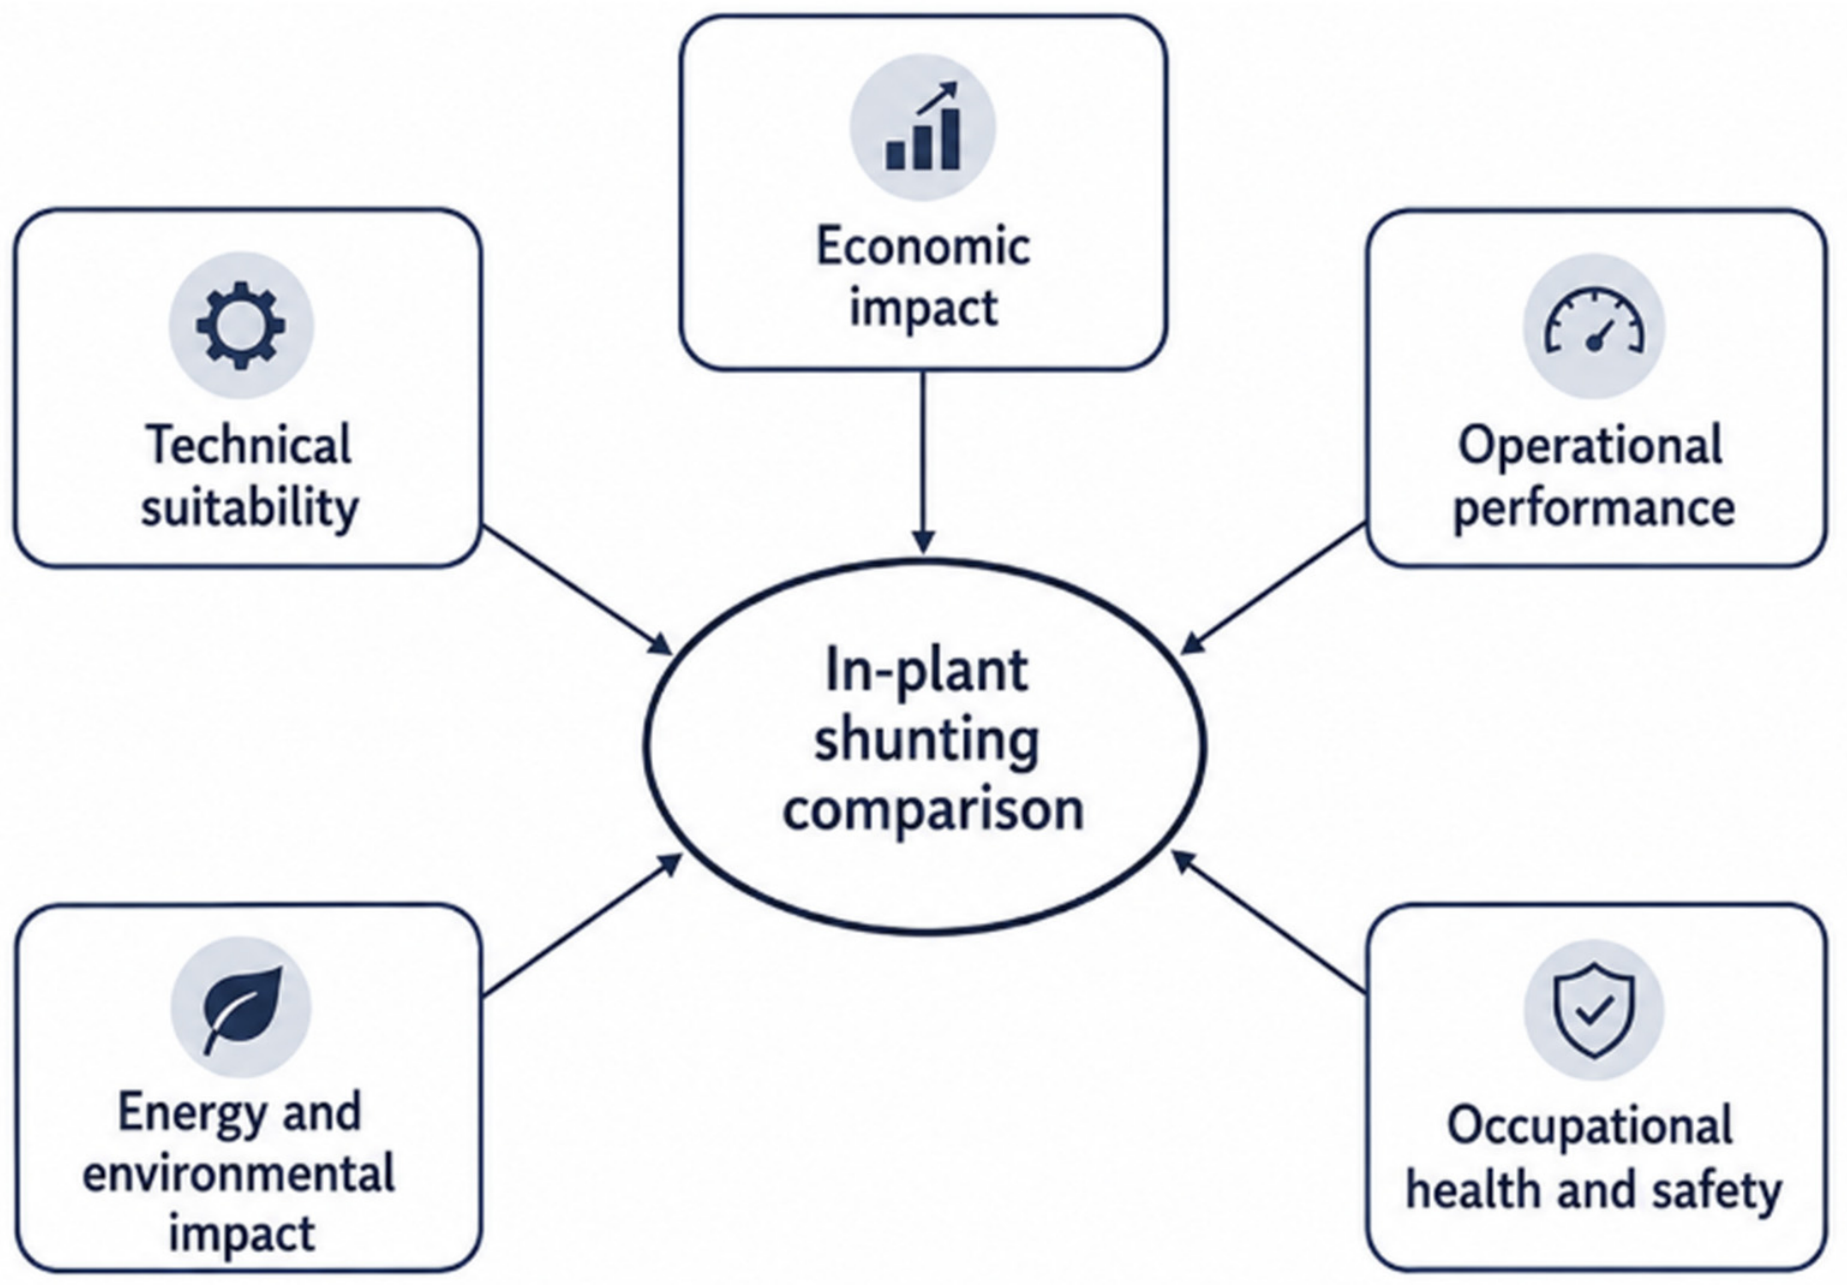
Figure 1 organizes the study along five analytical axes—technical suitability, economic impact, operational performance, energy and environmental impact, and OSH—and serves as an evidence map rather than a scoring algorithm. Within each axis, documentary records, technical specifications, descriptive field observations, calculated indicators, and design-based interpretations are distinguished. This distinction is central because the study does not aggregate the axes into a statistically validated composite index.
The contribution is thus application-specific: it provides a traceable account of a cement-plant locomotive replacement while explicitly bounding the three indicators that dominate the decision narrative—the operator-reported 20–40% task-time reduction range, the maximum documented 25-wagon movement, and the reported 24-month payback. The study complements prior industrial-shunting work [
3] by adding an ownership-cost comparison, direct Scope 1 accounting, a force-balance plausibility check, normalized payback sensitivity analysis, and an OSH-oriented control-system assessment; it does not claim methodological priority.
2. Literature Review
The railway decarbonization literature spans network-level techno-economic comparisons, train-dynamics simulation, component-level energy management, and industrial demonstrations. Zenith et al. [
1] compared overhead electrification, hydrogen, and batteries for freight cases in Norway and the United States, showing that infrastructure and mission profile dominate feasibility. Barbosa [
2] evaluated battery-only freight traction and identified energy density, charging access, cycle life, and availability as limiting variables. Cipek et al. [
4] quantified route-dependent fuel and emission effects through heavy-haul simulation, whereas the California Air Resources Board [
5] summarized short-range operational and maintenance characteristics. These studies are relevant design benchmarks, but their datasets and operating scales differ from a confined cement-plant yard.
The closest application is the industrial-plant study of Gotsov et al. [
3], which examined a battery shunter with regenerative braking for a documented duty cycle that included 12 wagons and reported an approximately 41% improvement in energy efficiency for that specific cycle. This precedent prevents the present case from being described as the first industrial battery-shunting study. The quantitative distinction is instead contextual: the Seza Cement case reports a 10-wagon reference weighing cycle, a maximum documented 25-wagon movement, a site-reported daily electricity indicator, a leased-diesel baseline, and an OSH control architecture, but it lacks cycle-resolved energy and statistically replicated time measurements.
Remote-control evidence must also be interpreted critically. Industry guidance indicates that remote operation can improve the operator’s line-of-sight position [
6,
7,
8,
9], while Federal Railroad Administration reports show that safety performance remains dependent on human factors, training, point protection, communication, and rule compliance [
10,
11,
12,
13,
14,
15,
16,
17]. Likewise, SIL 2 identifies the integrity level of defined safety functions under IEC 61508; it is not a plant-wide accident-frequency measure [
8]. Accordingly, the present OSH analysis evaluates available safeguards and required procedures rather than claiming a measured reduction in incidents.
Across the literature, the strongest quantitative results are generally obtained from clearly defined simulations, instrumented work cycles, or network models. By contrast, the present dataset integrates monthly records and selected field observations without a common cycle-level sampling frame.
Table 1 therefore compares study scale, method, data scope, principal finding, and limitation, enabling the facility-scale evidence to be positioned without overstating novelty.
The environmental and safety interpretation is supported by corporate greenhouse-gas accounting, fuel-emission factors, functional-safety standards, battery-electric train feasibility reports, welded-manufacturing requirements, locomotive emissions studies, diesel-exhaust health evidence, and remote-control safety assessments [
9,
10,
11,
12,
13,
14,
15,
16,
17]. These sources define calculation and risk-management boundaries; they do not substitute for plant-specific Scope 2 metering, exposure monitoring, or incident statistics.
2.1. Decision Variables in Alternative Traction Technologies
Battery cost, energy density, cycle life, battery-management capability, and charging-infrastructure requirements are key decision variables in battery-electric rail applications. The long-term decline in lithium-ion battery pack costs has improved the feasibility of electric vehicles and stationary storage systems [
18]. However, technology-learning trends alone are insufficient for investment decisions, because pack costs are also affected by production scale, raw-material availability, cell chemistry, manufacturing process, and supply-chain conditions [
19]. For industrial locomotives, these factors imply that the investment decision must consider not only current purchase cost but also technology maturity and exposure to replacement risk.
Battery management systems are essential for reliability, availability, and safety in industrial electric locomotives. Monitoring pack voltage, current, temperature, state of charge, and state of health directly affects usable energy, charging strategy, and fault prevention [
20]. At the same time, lithium-ion battery thermal-runaway risk requires appropriate cell selection, thermal management, electrical protection, mechanical integration, and operational limits [
21]. A battery-electric shunting locomotive should therefore be conceptualized as a mechatronic platform integrating traction motors, power electronics, battery management, charging control, operator interface, and functional-safety logic.
Battery life-cycle studies show that local-emission advantages during the use phase should be interpreted together with the environmental burdens of battery production, replacement, and end-of-life processing [
22]. This distinction defines the boundary of the present study. The principal quantitative calculation focuses on the reduction in direct Scope 1 diesel-combustion emissions, whereas a full life-cycle assessment would additionally require the electricity mix, charging efficiency, battery production impacts, expected replacement interval, and recycling pathway.
2.2. Battery-Electric Freight and Shunting Locomotives
Research on converting diesel trains to battery-electric operation indicates that economic, environmental, and grid-resilience benefits can be achieved when the charging infrastructure and mission profile are appropriately matched [
23]. Simulation-based studies of hydrogen-powered and battery-electric freight-locomotive options further show that route gradient, train mass, range, and energy demand are dominant design variables [
24]. These findings support the relevance of the Seza Cement case: short-distance, repetitive maneuvering tasks with clearly defined routes provide a more favorable operating envelope for battery-electric traction than long-distance mainline freight service.
Earlier work on onboard energy storage in rail vehicles also indicates that the storage unit must be designed in relation to the kinematic and operational properties of the duty cycle, rather than being treated as an isolated energy source [
25]. System-level studies on rail energy consumption similarly show that vehicle characteristics, operational rules, infrastructure layout, and control strategy interact strongly [
26]. For an in-plant shunting locomotive, this requires the locomotive, charging point, weighing-track geometry, wagon-sequencing logic, and shift timetable to be evaluated as a coupled operating system.
2.3. Literature on Regenerative Braking and Energy Storage
Energy-storage applications in railway systems have generated an extensive literature on the recovery and reuse of braking energy. Reviews show that batteries, supercapacitors, and flywheels offer different benefits depending on power demand, storage duration, cycle frequency, and installation configuration [
27]. Studies of regenerative braking in DC railway systems further demonstrate that storage-system location and operating strategy are decisive for the amount of energy that can be recovered and reused [
28].
Technical and economic studies of regenerative braking in freight trains show that, without a storage pathway, braking energy is largely dissipated as heat, whereas storage-enabled systems can improve overall energy efficiency [
29]. Assessments of battery-hybrid diesel-electric locomotives similarly indicate that fuel savings and emission reductions are achievable when route characteristics and energy-management strategies are favorable [
30]. This literature explains why regenerative braking is especially relevant to stop-and-go shunting operations.
Table 1.
Expanded literature axes and their methodological contributions to the Seza Cement case analysis.
Table 1.
Expanded literature axes and their methodological contributions to the Seza Cement case analysis.
| Study/Country/Platform | Method, Data Scope, and Principal Result | Limitation and Relevance to the Present Case |
|---|
| Zenith et al. [1]; Norway/USA; freight alternatives | Techno-economic case studies comparing overhead line, hydrogen, and batteries; feasibility depends strongly on mission profile and infrastructure. | Mainline/corridor scale; does not represent confined cement-plant shunting. |
| Barbosa [2]; freight battery traction | Technical-operational assessment of battery-only freight traction; identifies energy density, charging, cycle life, and availability constraints. | Analytical assessment rather than a plant before/after field dataset. |
| Gotsov et al. [3]; Bulgaria; industrial battery shunter | Documented industrial duty cycle, including 12 wagons; regenerative-braking study reported about 41% energy-efficiency improvement for that cycle. | Closest precedent; different plant, storage system, duty cycle, and outcome. Confirms that the traction concept is not new. |
| Cipek et al. [4]; heavy-haul diesel/battery | Route-based simulation of fuel and emission reduction potential. | Simulation results are sensitive to route, mass, and configuration; not a low-speed yard trial. |
| Popovich et al. [23]; USA; freight conversion | Network/economic/environmental modeling of diesel-to-battery conversion. | Network-level assumptions; no cement-plant maneuvering or operator-level data. |
| Cole et al. [24]; freight battery/hydrogen | Train-dynamics simulation emphasizing gradient, mass, range, and energy demand. | Useful for transferability conditions; not field validation. |
| Mayrink et al. [29] and Cipek et al. [30]; freight regenerative/hybrid | Technical-economic and route-based modeling of regenerative energy and hybrid fuel savings. | Supports mechanism plausibility; cannot supply a recovery percentage for the unmetered present system. |
| Present study; Türkiye; cement-plant diesel versus battery-electric shunting | Single-site records, specifications, descriptive operator observations, force-balance bound, Scope 1 calculation, normalized payback sensitivity, and safeguard assessment. | No cycle-level archive, sample size, matched protocol, task energy, full TCO, Scope 2/LCA, or quantified OSH outcome. |
2.4. Sustainable Transportation and Recent Energy-Optimization Studies
The broader literature on green freight transport emphasizes that energy efficiency and emission reduction require the joint consideration of vehicle technology, operating practice, and logistics-network design [
31]. Environmental assessments of freight transport also show that fuel type, distance, equipment efficiency, and local pollutant impacts can be as important as modal comparisons [
32]. Although in-plant locomotive electrification is narrower than a system-wide modal shift, it represents a measurable intervention within the industrial logistics chain.
Recent studies have advanced the optimization of onboard energy storage by considering stochastic regenerative-braking energy [
33]. Contemporary reviews of railway energy-storage applications also emphasize the co-design of battery technology, control strategy, duty cycle, and infrastructure conditions [
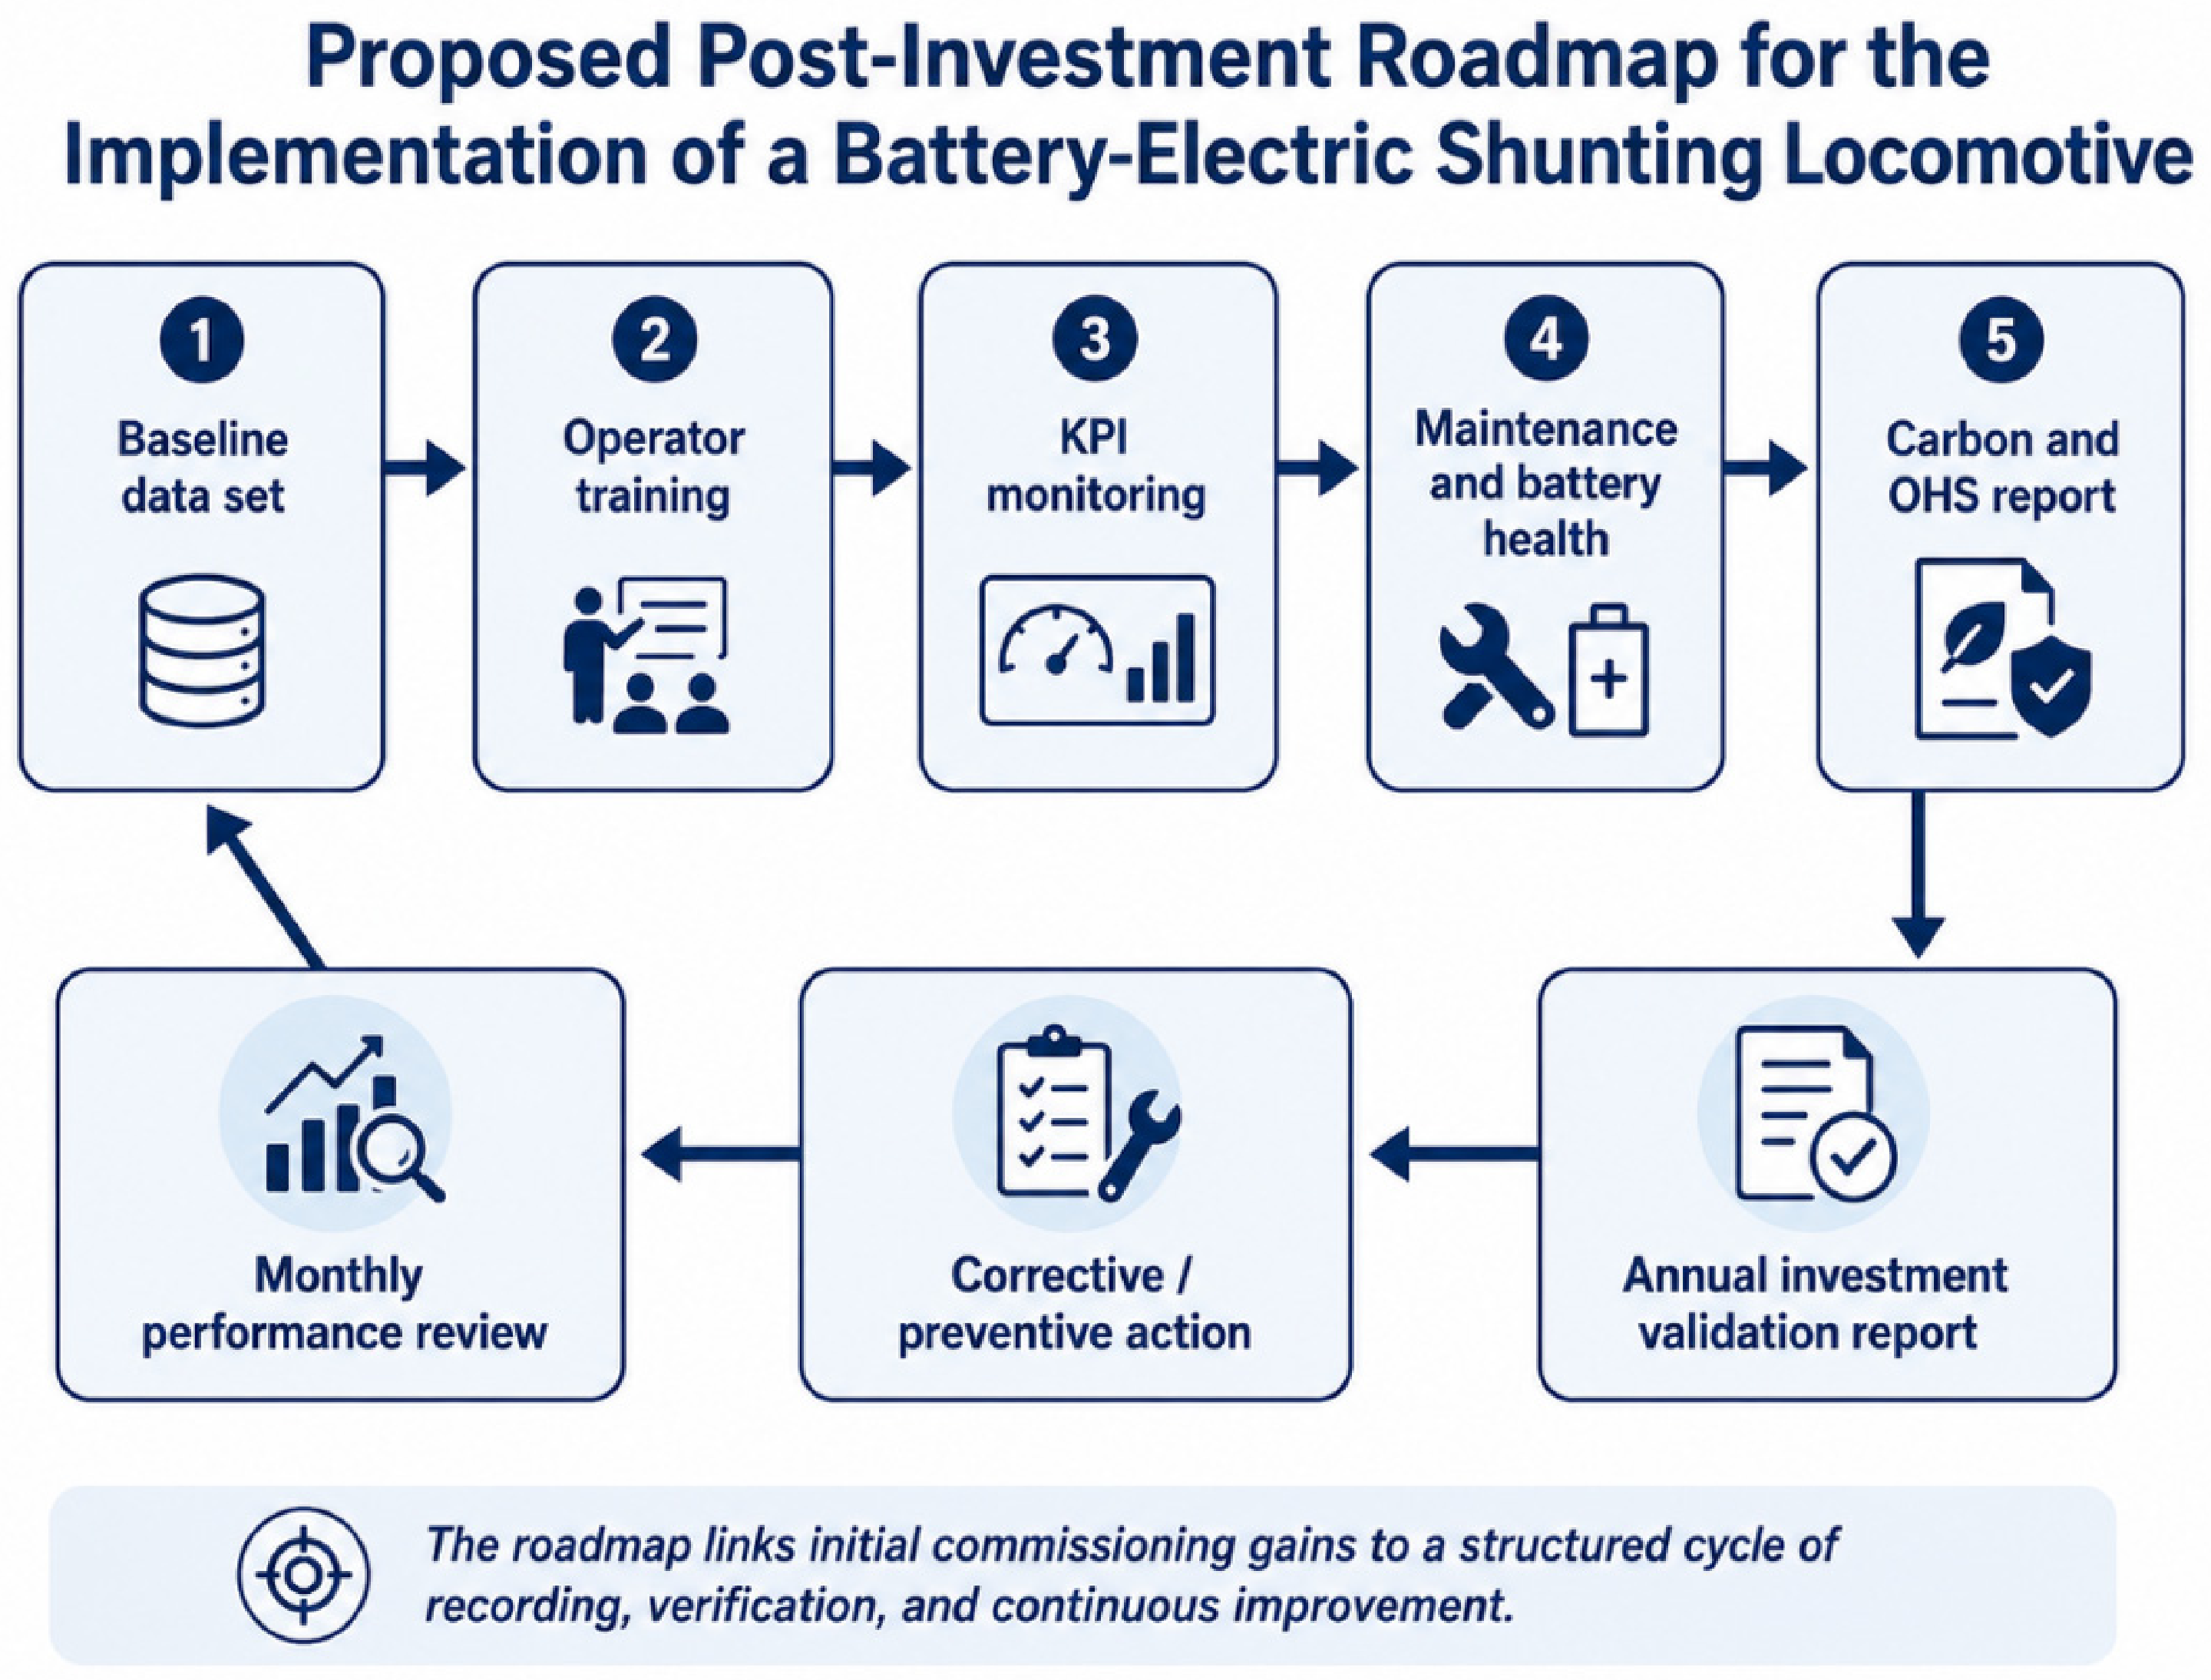
34]. These findings support the monitoring approach proposed for the Seza Cement case: battery-electric shunting performance should be assessed not only at the procurement stage but continuously using integrated energy, maintenance, operational, and safety data.
2.5. Gap in Case Studies for Industrial Facilities
Most battery-electric railway studies address mainline freight, urban rail, or simulation-based optimization. Industrial shunting is represented by Gotsov et al. [
3], but field studies that simultaneously report ownership structure, plant logistics, direct emissions, safety functions, and data-quality limitations remain uncommon. This paper is therefore positioned as a complementary cement-plant case, not as evidence that the underlying traction concept is new.
The practical value of the case lies in duty-profile specificity. A compact low-speed locomotive may be appropriate for a bounded yard yet unsuitable for sustained mainline operation; conversely, a mainline design can be technically and economically excessive for repetitive plant maneuvers. The analysis therefore treats manufacturer ratings, maximum field observations, and transferability conditions as separate quantities.
The case-study method combines quantitative and qualitative evidence, but the evidence is not pooled indiscriminately. Monthly lease and fuel values support direct arithmetic; technical documentation supports rated parameters; operator-reported ranges describe observed practice; and OSH features support a structured risk-control interpretation. No subjective observation is converted into a statistical estimate in the absence of an archived repetition count.
Table 2 summarizes the resulting evidence-bounded contribution. It states what the case directly documents, what it can plausibly interpret, and what remains outside the dataset. This provides a transparent facility-scale scope statement.
3. Materials and Methods
3.1. Study Area and Comparative Approach
The research design is an observational, before-and-after industrial case study of two locomotive platforms used for the same class of shunting tasks on the internal railway network of a cement plant. The diesel and battery-electric systems were not operated in a randomized crossover protocol, and weather, production volume, wagon load, rail condition, operator identity, and yard traffic were not experimentally controlled. A broadly constant facility context improves practical comparability but does not create an experimentally controlled comparison.
The source archive contains monthly leasing and diesel-consumption indicators, locomotive specifications, site-reported electricity use, selected observations of task duration and consist capacity, and operator information. It does not contain a cycle-by-cycle log from which the observation period, number of operating days, shifts, operators, total movements, sampling frequency, mean, standard deviation, confidence interval, or between-operator effects can be reconstructed. The operational values are therefore presented as descriptive ranges or maximum documented events, and no inferential statistical test is applied.
3.2. Systems Under Comparison
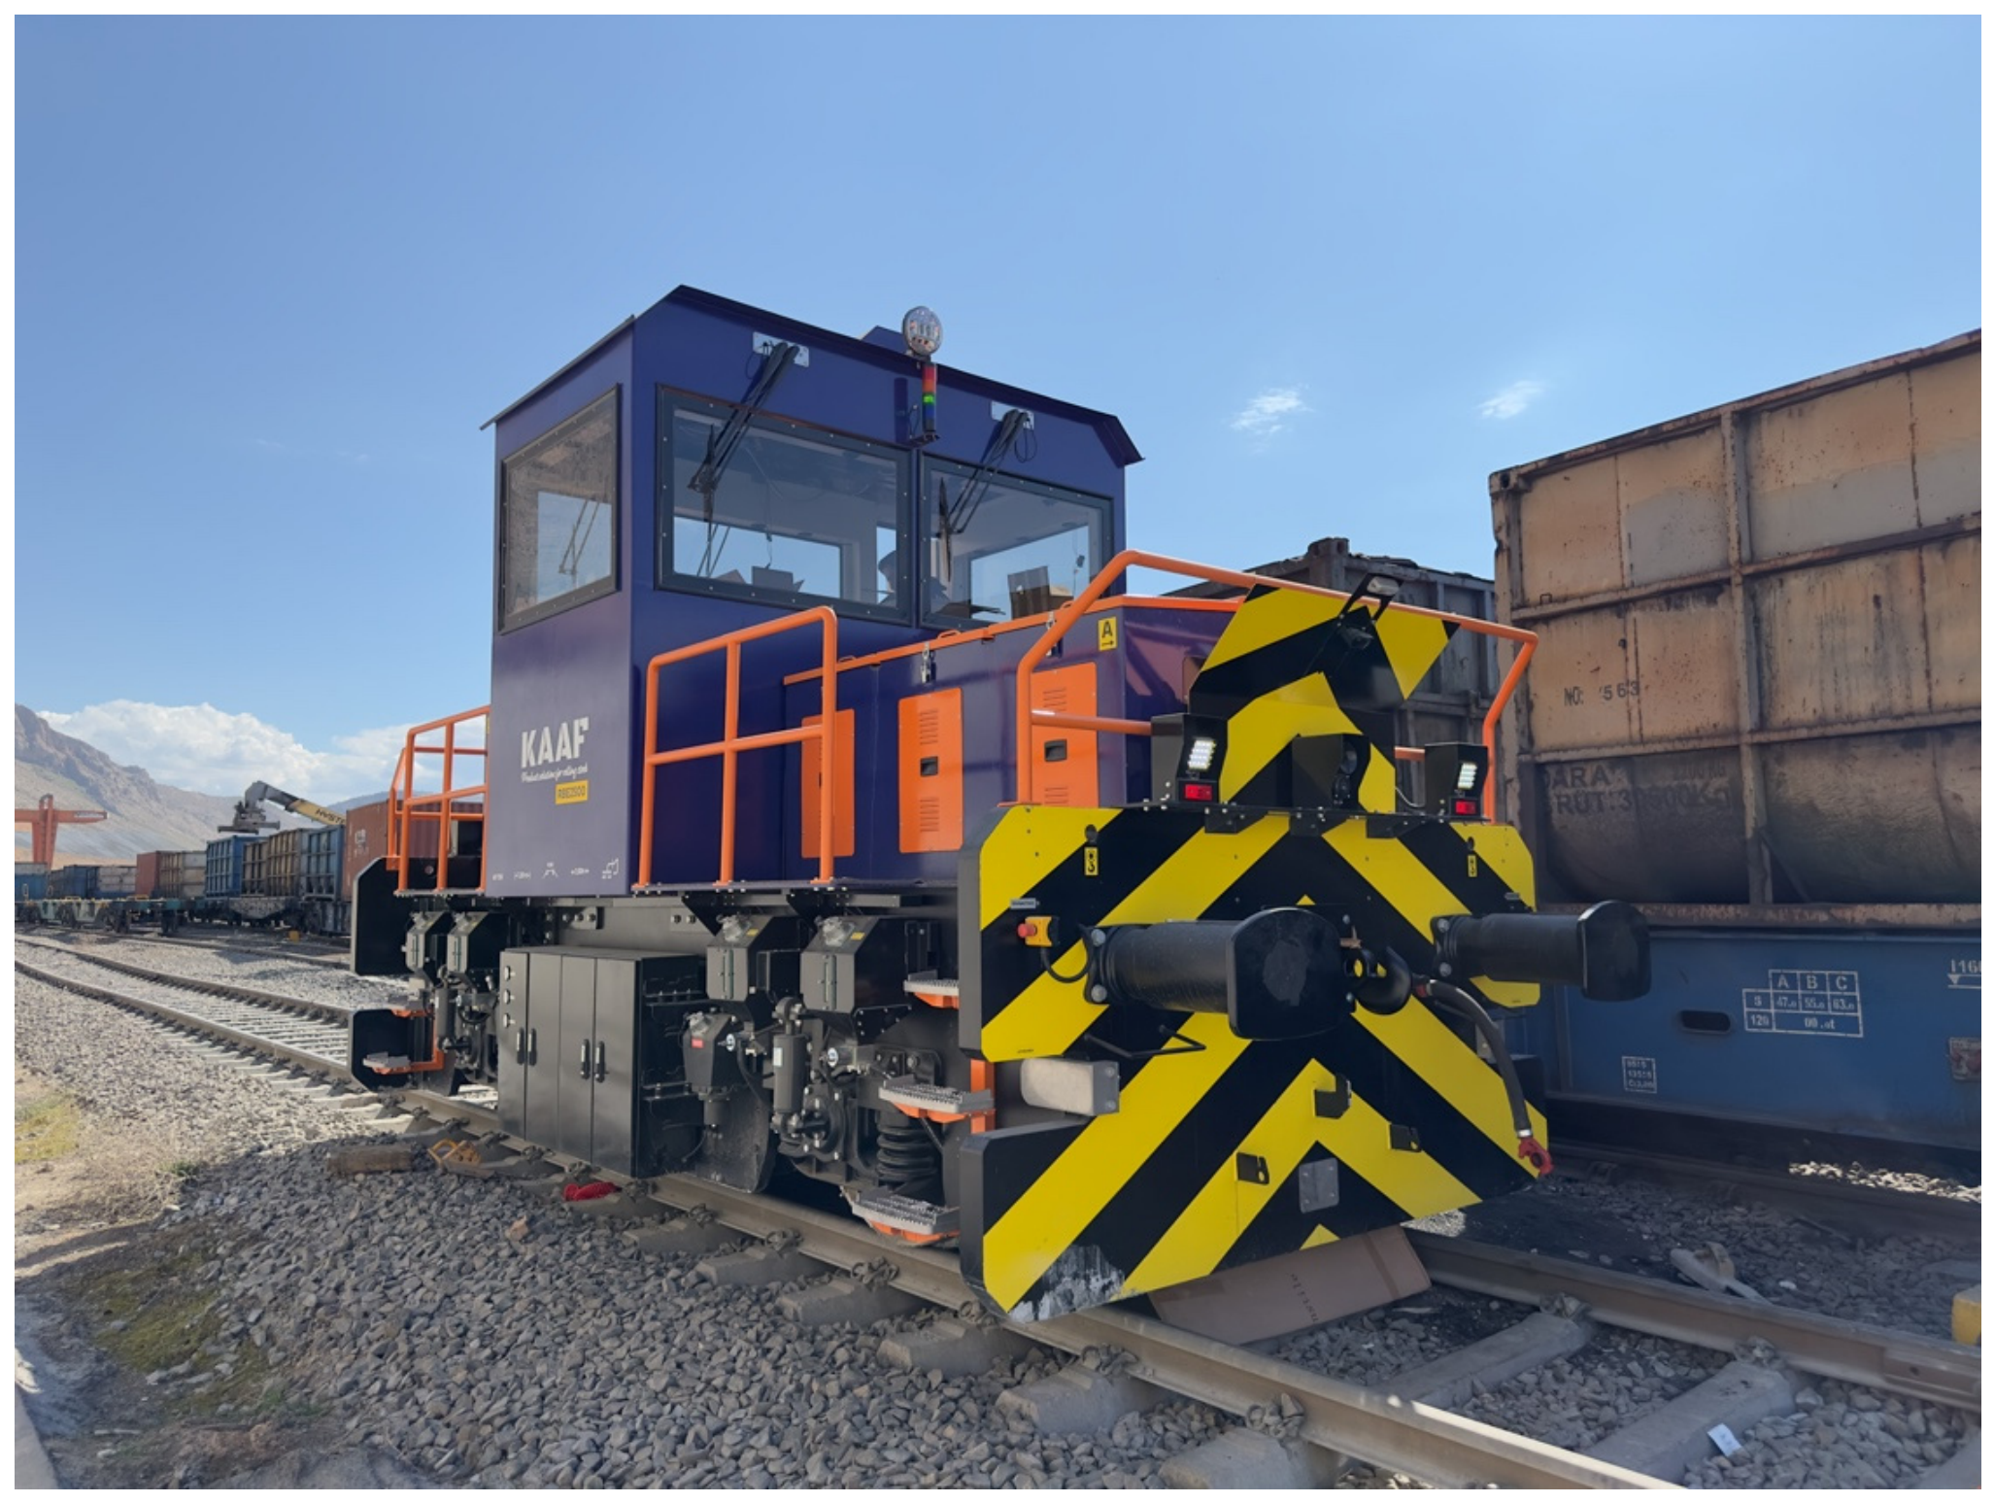
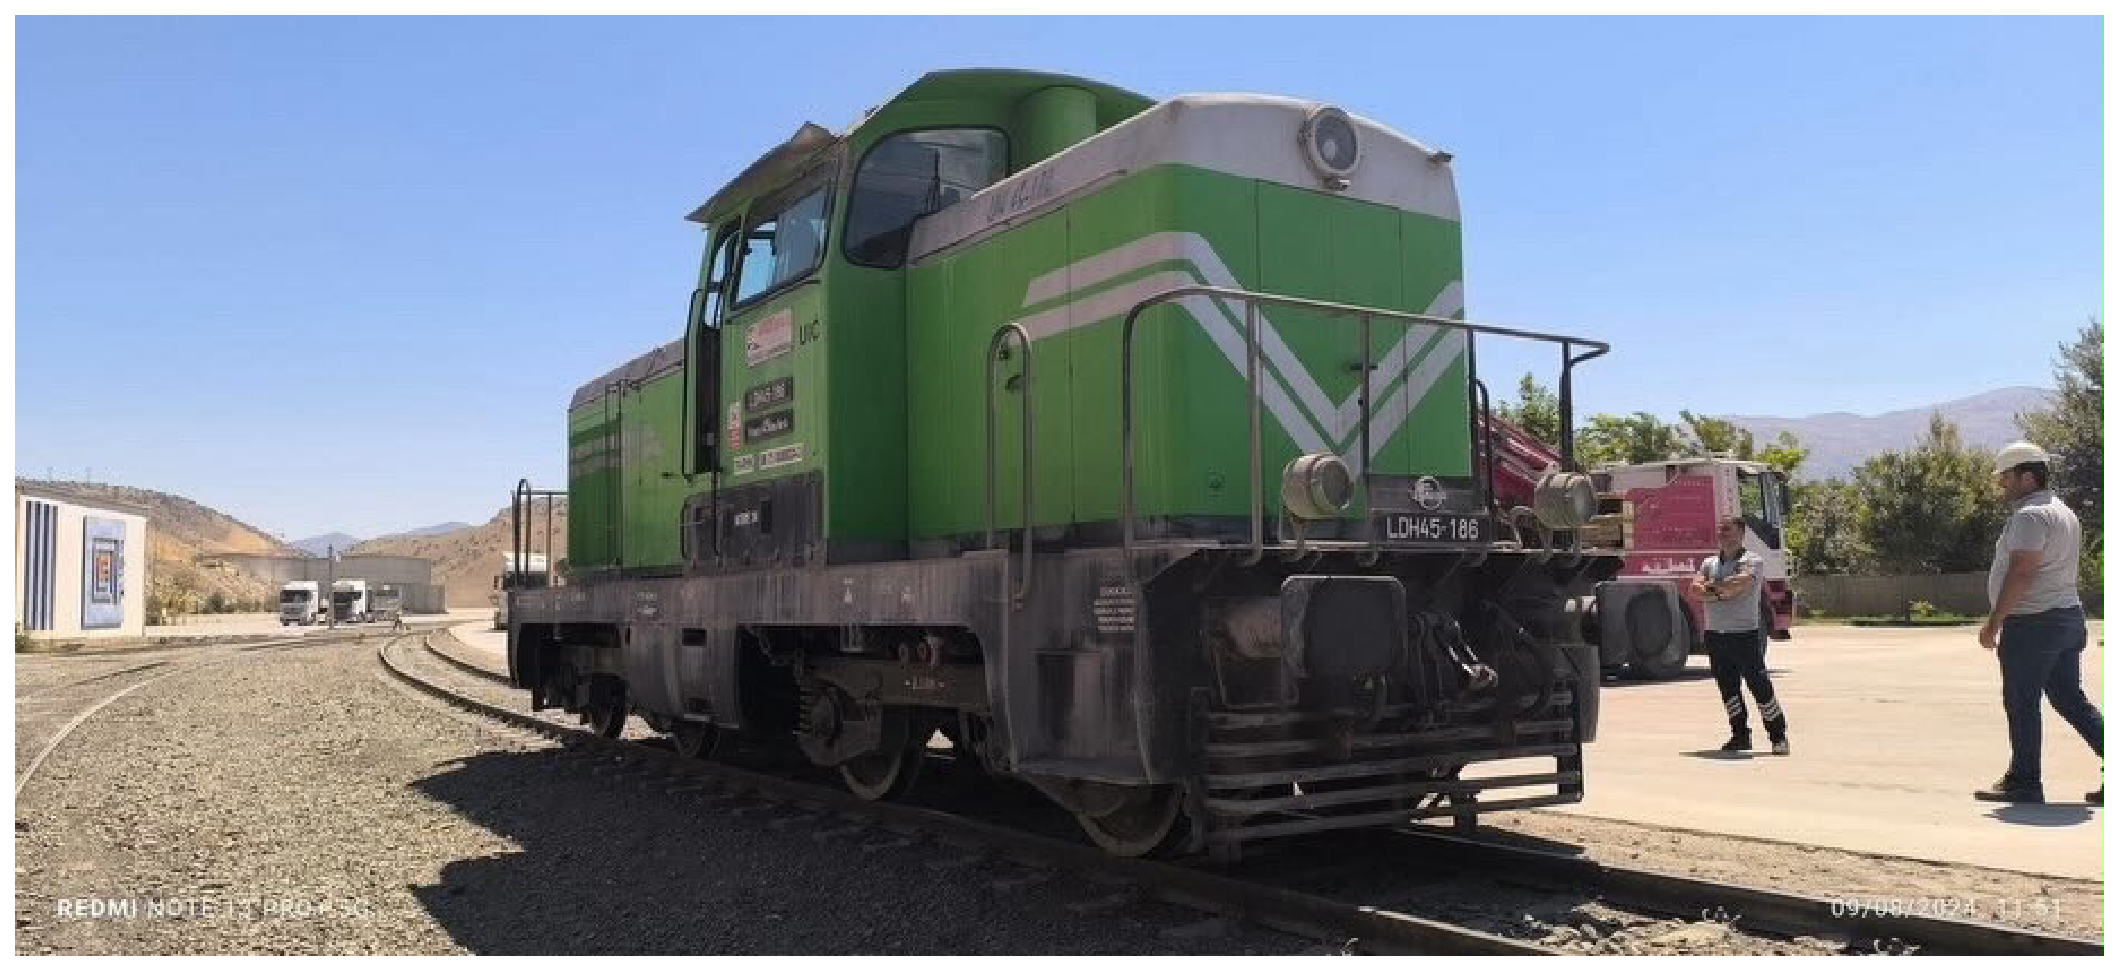
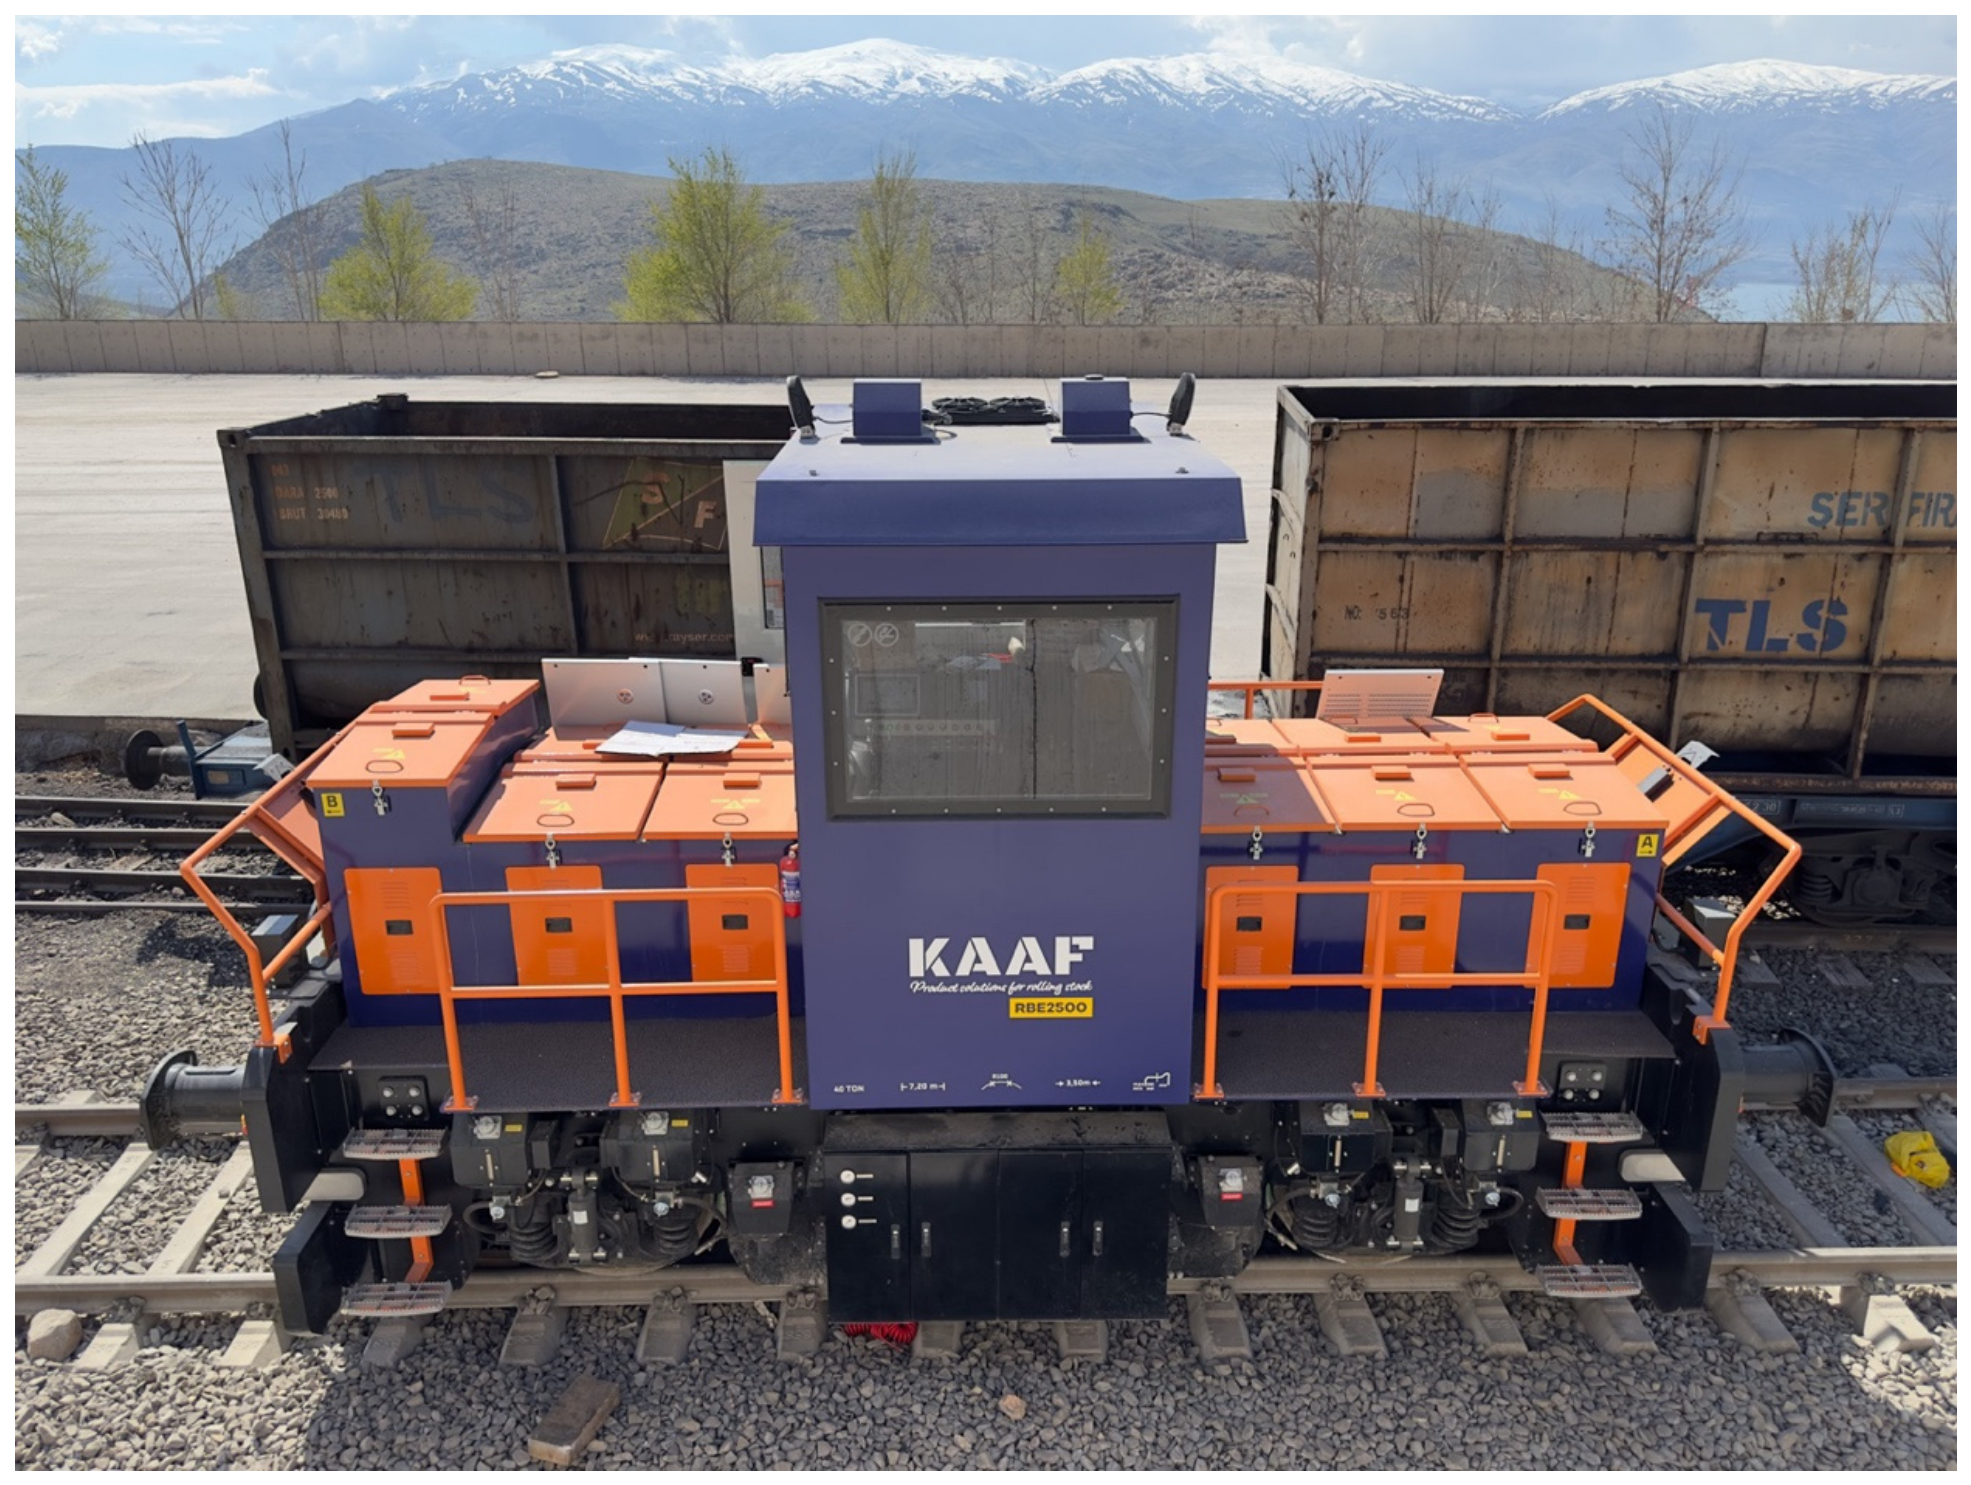
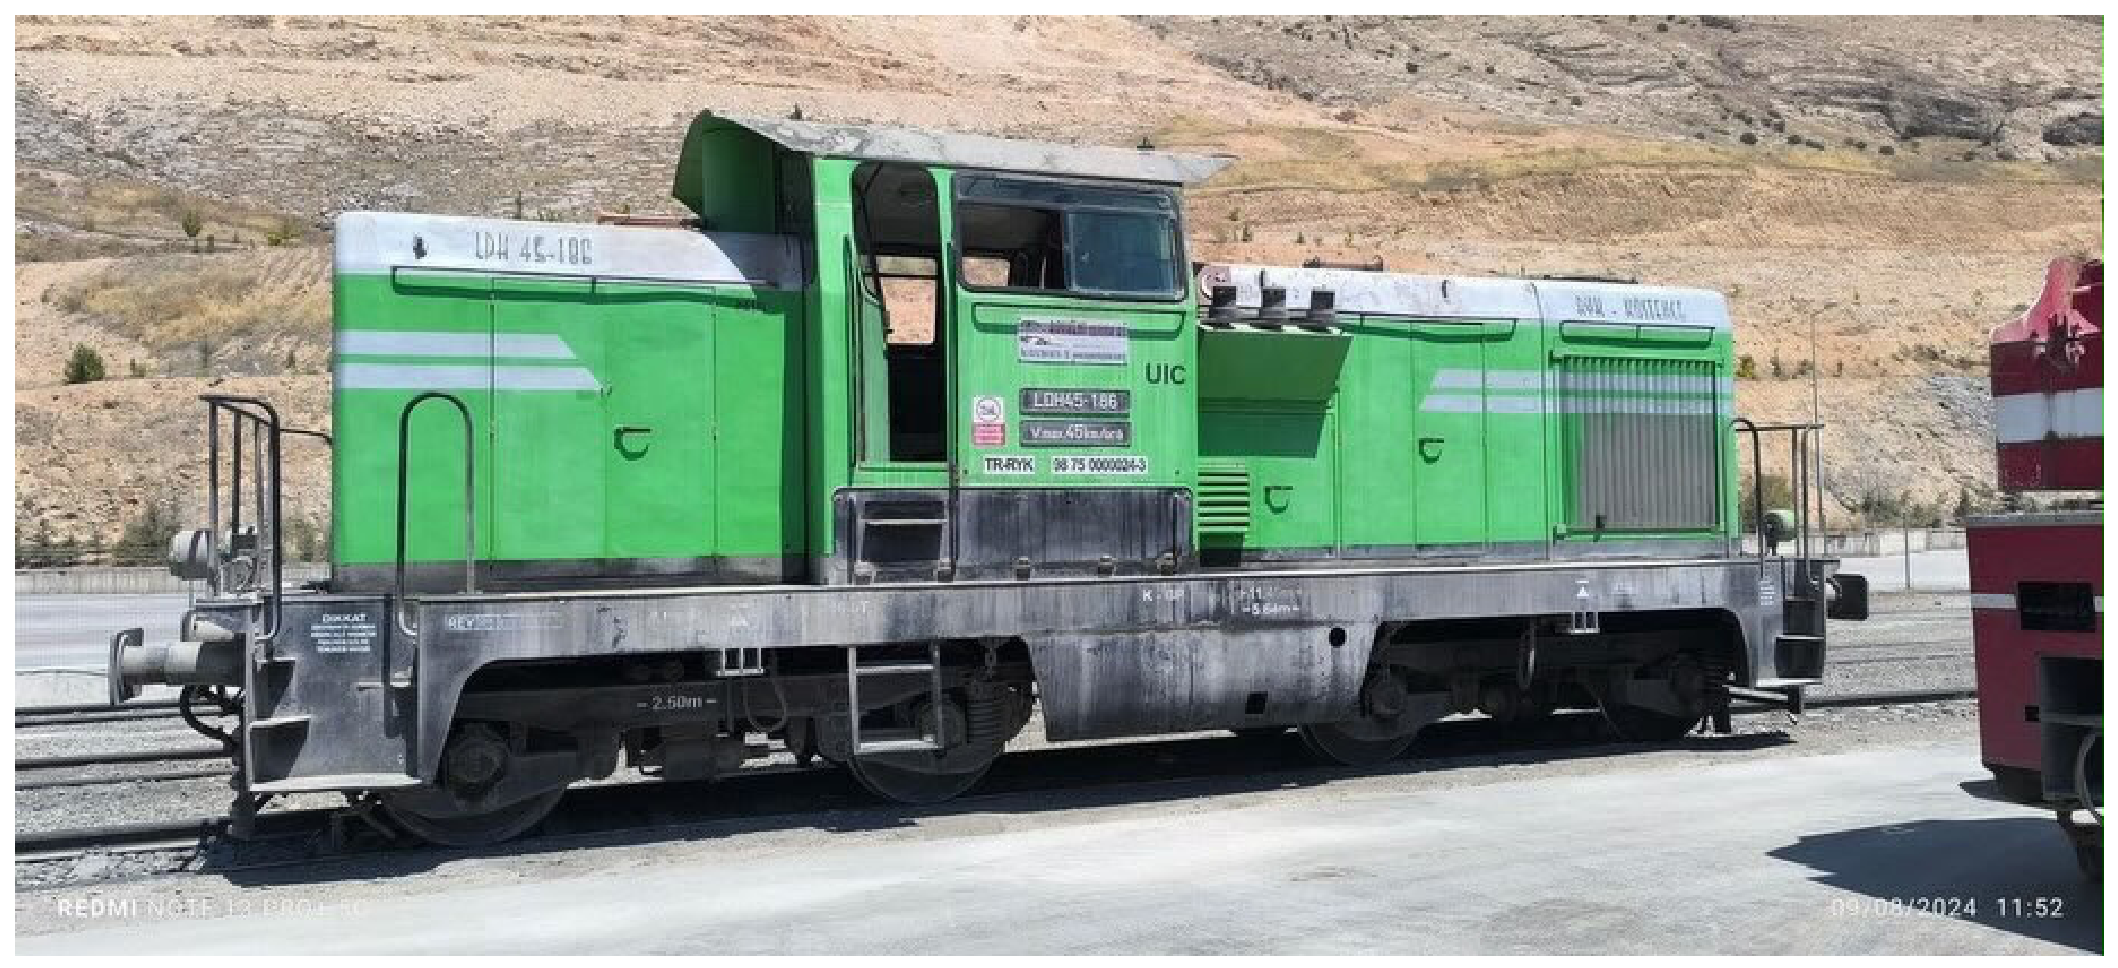
The diesel system was the LDH45-186 diesel-hydraulic shunting locomotive, equipped with a Cummins VTA28 engine (Cummins Inc., Columbus, IN, USA). The locomotive has a rated power of 820 hp, a maximum engine speed of 1500 rpm, a total mass of 47 t, a 1600 L fuel capacity, a 600 L main-tank volume, a maneuvering speed of 35 km/h, a 220 V AC auxiliary power supply, and a rapid-air supply system. The battery-electric shunting locomotive was manufactured/supplied by KAAF Demiryolu Araçları A.Ş. (Melikgazi, Kayseri, Türkiye) and has a 1435 mm track gauge, a manufacturer-rated pulling and pushing capacity of 1050 t on 0% grade, a catalog tractive effort of 77 kN, an 80 V DC nominal battery voltage, a 2000 Ah battery capacity, and a 280 A charging system. Its control architecture includes a Siemens programmable logic controller (PLC) and a 7-inch human–machine interface (HMI) (Siemens AG, Digital Industries, Nuremberg, Germany), together with SIL 2 remote-control functions and auxiliary safety systems. The PLC and HMI were used as onboard control and monitoring components rather than as analytical software for the present study.
Table 3 presents the technical specifications of the two systems side by side.
Figure 2 and
Figure 3 document the compared assets, whereas the reported 25-wagon movement is treated separately from the manufacturer-rated capacity in
Section 4.1 and
Section 4.4.
3.3. Evaluation Criteria
The analysis covers five analytical axes: technical suitability, economic impact, operational performance, energy and environmental impact, and OSH. Each axis was evaluated using an evidence hierarchy. Level A comprises invoices or business records; Level B comprises manufacturer or standard-based specifications; Level C comprises calculated quantities derived from Levels A and B; Level D comprises operator-reported ranges or maximum field events; and Level E comprises engineering interpretations that require further validation.
Technical suitability was assessed through rated tractive effort, manufacturer-rated capacity, propulsion architecture, energy storage, charging system, speed range, chassis and wheel configuration, adhesion aids, control system, and auxiliary safeguards. The analysis distinguishes catalog capability from field observation and applies a longitudinal force balance to the reported maximum-consist movement.
The economic assessment uses the documented diesel lease and fuel quantities and treats the approximately 24-month payback as a plant-reported indicator. Because disaggregated purchase, charger-installation, battery-replacement, diesel-maintenance, tax, and demand-charge data are not present in the source archive, the payback is not presented as an independently audited financial result. Instead, a normalized sensitivity and a full discounted-cash-flow formulation are provided.
Operational performance is described using loaded wagons per movement, the complete 10-wagon weighing-cycle range, corrective-maneuver requirements, low-speed alignment, operator visibility, and potential bottleneck effects. The 20–40% task-time reduction range is explicitly classified as an operator-reported descriptive range; it is not a sample mean and is not accompanied by a confidence interval.
The environmental calculation covers direct Scope 1 CO2 from displaced diesel use and point-of-use local exhaust emissions. The EIA factor is cross-checked against a GHG Protocol cross-sector factor. Purchased-electricity emissions, charging losses, battery manufacturing, battery replacement, and end-of-life are outside the quantified boundary and are treated as Scope 2 or life-cycle requirements.
The OSH assessment is safeguard-based. Remote-control operation, operator line of sight, deadman functionality, emergency stopping, camera support, warning systems, lighting, buffers, and control diagnostics are examined as layers of risk reduction. No pre- and post-conversion accident-frequency data, exposure measurements, or statistically tested safety outcomes are available; safety conclusions are therefore stated as capabilities and management requirements.
Table 4 summarizes the principal site indicators together with their evidence status. This prevents record-based quantities, operator-reported ranges, and manufacturer ratings from being interpreted as equivalent forms of evidence.
3.4. Calculation and Analysis Method
Corporate greenhouse-gas boundaries follow the Greenhouse Gas Protocol: direct combustion is Scope 1, whereas purchased electricity is Scope 2 [
9]. The following calculations formalize the activity data and are used for traceability; they are not presented as methodological innovations. The economic formulation separately identifies reported simple payback, normalized sensitivity, and the variables required for a full discounted analysis.
Annual diesel volume, direct CO
2 mass, and nominal battery energy were calculated using Equations (1)–(3). The EIA factor of 2.692 kg CO
2/L [
10] was cross-checked against the GHG Protocol cross-sector factor of 2.683 kg CO
2/L reported in the 2024 factor set [
9]. Applied to 21,600 L/year, the two factors produce 58.15 and 57.95 t CO
2/year, a difference of approximately 0.3%. The approximately 100 kWh/day value is used as a site-level electricity indicator because the source record does not specify whether it represents charger input, battery-side energy, or a task-normalized measurement.
3.5. Limitations of the Study
The evidentiary limits are material to interpretation. The source archive does not provide matched cycle records, operator-level repetitions, stage-resolved timestamps, task-specific diesel use, charger efficiency, regenerative-energy recovery, long-term battery state of health, disaggregated procurement costs, historical maintenance, failure frequency, downtime, or incident/exposure statistics. Consequently, the study reports documentary quantities directly, bounds descriptive observations, and reserves inferential or causal conclusions for future instrumented monitoring.
3.6. Dataset, Assumptions, and Data Quality
The dataset contains five evidence groups: documentary economic records; manufacturer and technical specifications; calculated indicators; site-reported energy information; and operator-reported operational observations. These groups differ in sampling resolution and should not be merged into a single statistical sample.
Table 5 identifies the source, aggregation level, and permissible analytical use of each group.
Record-based lease and diesel quantities are the highest-confidence inputs. Manufacturer ratings are authoritative for nominal capability but do not describe every field condition. The 7–9 min cycle and the 20–40% task-time reduction range are descriptive operator-reported values with no archived repetition count. The 25-wagon value is a maximum documented movement rather than an average or certified capacity. Long-term maintenance, battery replacement, and safety outcomes remain prospective monitoring variables.
3.7. Economic Sensitivity and Payback Period Calculation
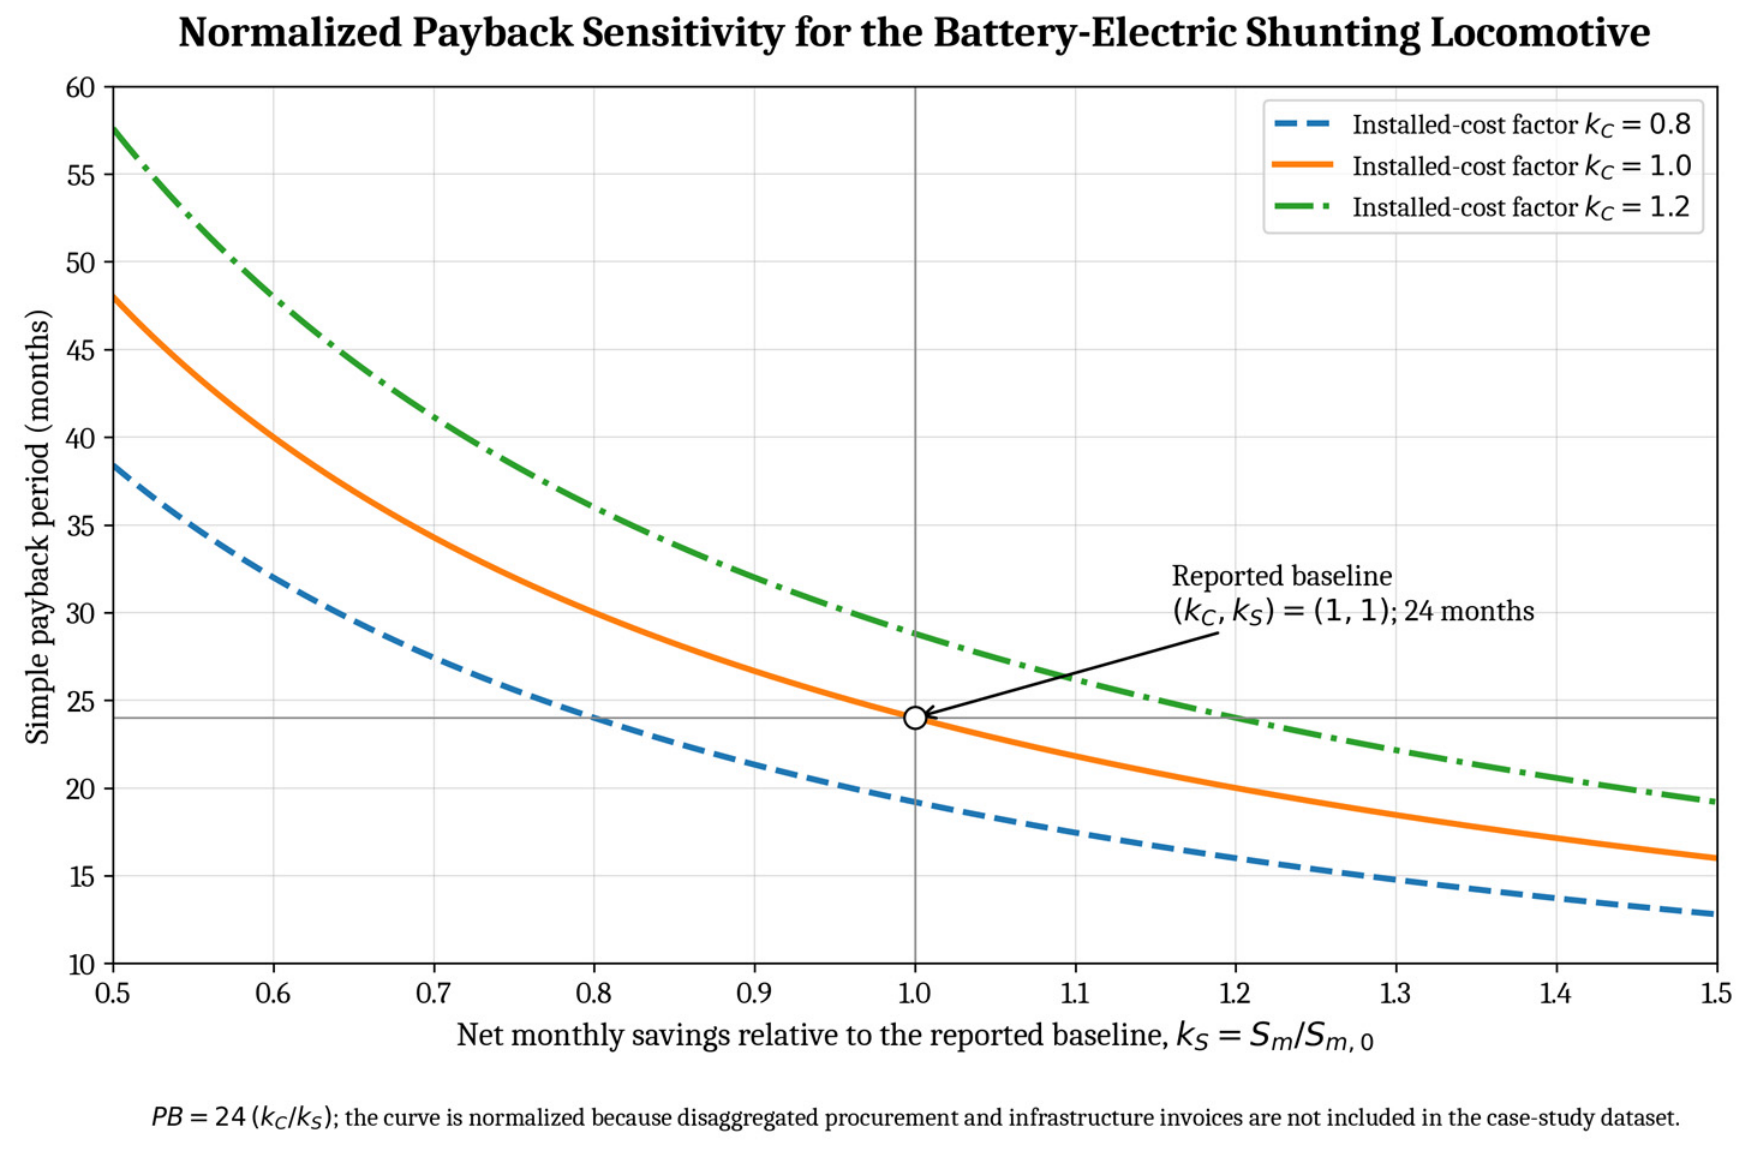
The approximately 24-month payback is used as the reported baseline, PB0, rather than as an independently reconstructed value. Monthly net savings, Sm, consist of avoided lease and diesel costs less grid-electricity costs, maintenance differences, demand charges, monthly infrastructure allocation, and a battery-replacement reserve. Charging efficiency enters through the grid-energy requirement. Equations (4)–(7) make these dependencies explicit.
Let Clease be the avoided monthly lease cost, V
d and P
d the monthly diesel volume and unit price, E
b and P
e the battery-side electricity requirement and electricity price, η
ch the charging efficiency, ΔC
maint the electric-minus-diesel maintenance difference, C
demand the electricity demand charge, C
infra,m the monthly infrastructure allocation, and C
bat,res the battery reserve. C
0 denotes installed capital cost. The normalized variables k
C = C
0/C
0,0 and k
S = S
m/S
m,0 permit sensitivity analysis without disclosing or inventing absent procurement invoices.
Figure 4 presents numerical normalized sensitivity curves. At the reference point (k
C = k
S = 1), payback is 24 months. A 20% lower installed cost combined with 20% higher net savings gives 16 months, whereas a 20% higher installed cost combined with 20% lower net savings gives 36 months. The wider plotted range shows that a 40% reduction in net savings with 20% higher installed cost would extend payback to 48 months. These are transparent normalized scenarios, not substitutes for undisclosed procurement data.
3.8. Definition of Operational Performance Indicators
Operational indicators were selected to characterize the plant duty cycle rather than maximum speed alone: wagons and gross tonnage per movement, complete weighing-cycle duration, corrective movements, low-speed alignment, operator line of sight, task standardization, track occupancy, and energy use. Their evidentiary status is reported together with each value.
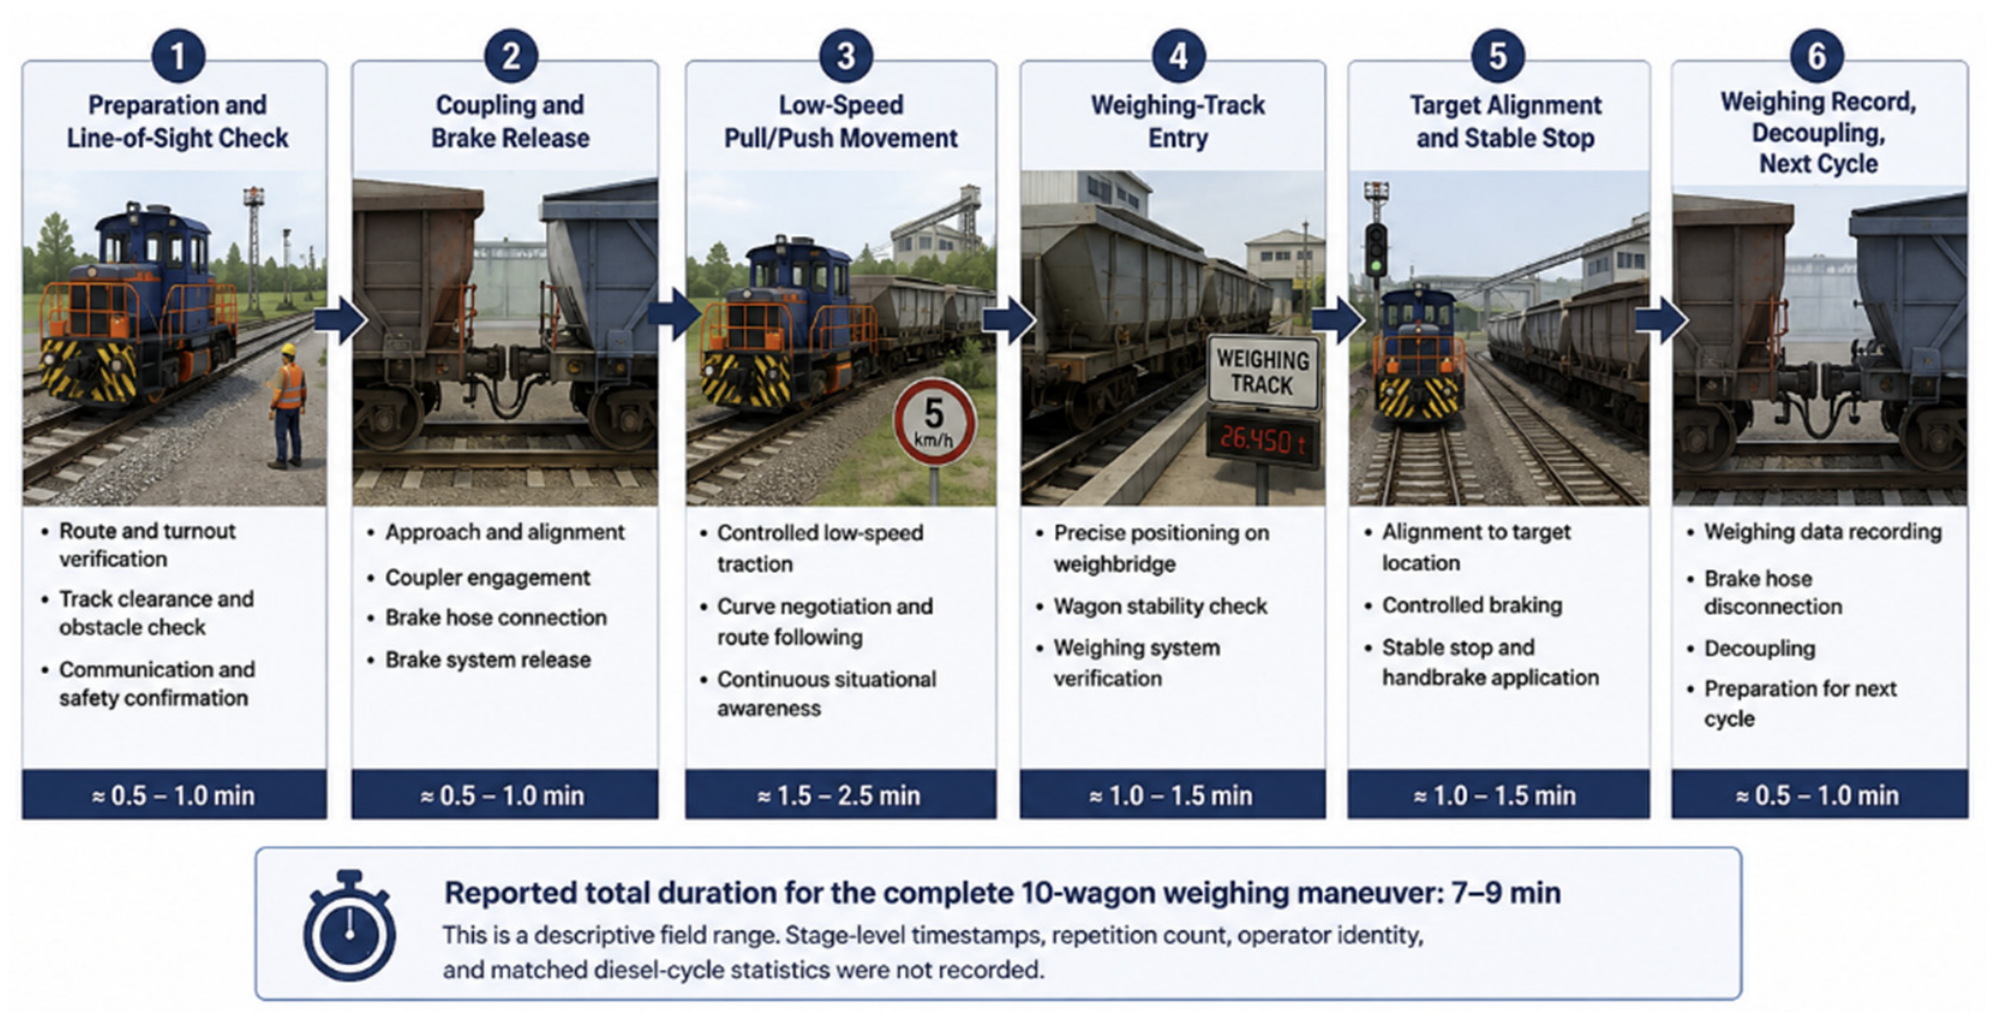
Two distinct observations are analyzed. The 10-wagon reference describes a complete weighing maneuver reported as 7–9 min. The 25-wagon value describes the maximum documented consist movement, approximately 1450 t. Neither value is a statistically derived mean, and they should not be combined into a single productivity ratio.
Figure 5 assigns the reported 7–9 min duration to the complete six-stage 10-wagon maneuver. Because stage-level timestamps were not archived, no artificial time allocation is assigned to preparation, coupling, movement, track entry, alignment, or recording. The 20–40% task-time reduction range is therefore discussed only as an operator-reported overall estimate.
3.9. Calculation Steps, Sources of Uncertainty, and the Need for Validation
The arithmetic calculations are fully traceable through Equations (1)–(3), while the traction and financial evaluations use the force-balance and cash-flow formulations presented in
Section 3.7 and
Section 4.4. Statistical analysis was not applied because the available source data do not define an observation unit or repetition count. Reporting an artificial standard deviation, confidence interval, ANOVA, or regression from aggregate and descriptive inputs would create unsupported precision.
Uncertainty is organized into four classes: activity-data uncertainty (monthly diesel and daily electricity aggregation); engineering-condition uncertainty (gradient, curvature, rolling resistance, adhesion, wagon mass, and acceleration); economic uncertainty (prices, installed cost, maintenance, demand charges, battery replacement, discounting, and residual value); and sampling uncertainty (unknown cycle count, operator distribution, shift conditions, and yard traffic). Only bounds that can be derived without introducing unsupported observations are quantified.
A future validation protocol should record, for every matched task: date and shift; operator identifier; ambient and rail conditions; wagon count and gross mass; route, gradient, and curve segment; start and finish timestamps; number of corrective movements; charger input; battery state of charge before and after; regenerative energy; alarm and safety-function activations; and diesel use for the matched baseline. With repeated tasks, distributional statistics, mixed-effects regression, confidence intervals, and operator and shift effects can then be reported.
Table 6 links each current indicator to its uncertainty source and the minimum evidence required for verification. The purpose is to ensure that the case remains traceable at the evidentiary level supported by the archive and to define a rigorous post-implementation monitoring design.
5. Economic Evaluation
5.1. Cost Structure of the Diesel System
The diesel baseline has two directly documented cost drivers: a monthly lease of approximately USD 10,000 and diesel consumption of approximately 1800 L/month. The fixed lease component is incurred independently of short-term utilization, whereas fuel expenditure varies with activity and unit price. Annual lease expenditure is therefore USD 120,000 excluding fuel, maintenance, downtime, storage, and refueling costs.
Annual diesel consumption is 21,600 L. No current fuel price is applied because the study archive does not define the relevant invoice period, tax treatment, or contractual basis. Diesel price therefore remains an explicit variable in Equation (4). This approach avoids presenting a temporally unstable price as a plant record while still showing how fuel-price escalation affects net savings.
5.2. Economic Viability and Payback Logic of the Electric System
The approximately 24-month payback is a plant-reported indicator. It is not described as an audited calculation because the case-study dataset does not disclose the installed locomotive price, charger and civil-works costs, battery replacement schedule, or complete maintenance records. The economic rationale is organized in three documented or structurally defined components:
- (i)
elimination of the monthly lease expense,
- (ii)
elimination of diesel-fuel consumption,
- (iii)
transition to an electricity- and condition-based maintenance cost profile.
The battery-electric investment removes the lease payment and diesel purchase from the shunting task, but it introduces capital recovery, grid-electricity expenditure, charging infrastructure, power-demand charges, battery degradation and replacement, specialized maintenance, and residual-value assumptions. Fewer combustion-related components may reduce some maintenance categories [
1,
12], yet no monetary saving is assigned without work-order data. The economic conclusion is therefore sensitivity-based rather than categorical.
5.3. Structural Comparison of Cost Items
The comparison is between a leased operating-expense model and an owned capital-asset model. The former combines fixed rent and variable fuel; the latter combines installed capital, electricity, charging-infrastructure costs, battery-related costs, and a different maintenance profile. Any comparison that omits the time value of money, battery replacement, or residual value can describe cash flow direction but cannot establish a complete total cost of ownership.
The lease-based diesel model involves the following operational risks:
dependence on the supplier’s service continuity,
exposure to lease-renewal and price-increase risk,
reduced operational resilience due to external equipment dependence,
absence of asset accumulation within the corporate fleet.
The electric ownership model provides the following advantages:
integration of the locomotive into the company’s own asset base,
greater continuity independent of external leasing arrangements,
a more measurable and predictable electricity-based energy cost structure,
direct accumulation of usage and performance data within the organization.
Asset control, data ownership, and reduced lease dependence are strategically relevant, but they are not monetized in the present dataset. They are therefore reported as management considerations rather than added to calculated savings.
Table 9 separates documented cash items from qualitative organizational effects.
5.4. Evaluation in Terms of Total Cost of Ownership
A complete total-cost-of-ownership model should include locomotive and charging-system capital cost, civil and electrical integration costs, capital recovery, electricity and demand charges, maintenance labor and parts, battery degradation and replacement, downtime, training, insurance and tax effects, residual value, and disposal. Equation (7) expresses these items in discounted form. Inflation and escalation are represented through time-indexed prices, while battery replacement is introduced in the replacement set R.
For annualized comparison, the capital-recovery factor can be applied as
, with equivalent annual capital cost C
0·CRF. This does not resolve missing inputs, but it specifies how they must be incorporated once procurement, financing, lifetime, and residual-value records are available.
Table 10 lists the required monitored cost categories.
5.5. Financial Uncertainties and Decision Sensitivity
The normalized sensitivity avoids false monetary precision while quantifying robustness around the reported baseline. Payback changes in direct proportion to the installed-cost multiplier kC and inversely with the net-savings multiplier kS. Thus, cost overruns, lower utilization, lower diesel prices, higher electricity costs and demand charges, higher maintenance, or a larger battery reserve extend payback; the opposite changes shorten it.
The fixed lease avoidance is a major savings component, but the magnitude of the fuel component still depends on diesel price and activity. Electricity cost must be calculated from metered grid input rather than nominal battery energy, because charging losses and auxiliary demand affect billed consumption. Consequently, the economic assessment should be updated from actual monthly invoices and work orders rather than a single set of assumptions.
A financially complete post-audit should report NPV, internal rate of return, discounted payback, equivalent annual cost, and scenario and uncertainty analyses. Required records include installed cost, financing terms, electricity tariff components, charger demand, battery state-of-health trajectory, replacement threshold, maintenance and downtime by system, tax treatment, and residual value. The analysis provides the formulation and normalized bounds, not an invented reconstruction of absent invoices.
5.6. Scenario-Based Economic Analysis
Table 11 converts the reported 24-month baseline into explicit normalized scenarios. The paired ±20% cases produce 16, 20, 30, and 36 months depending on the directions of the installed-cost and net-savings changes. These values show how omitted cost items can materially change the result even when no absolute price is assigned.
The scenarios are algebraic sensitivity cases rather than forecasts. They do not assume a specific diesel price, electricity tariff, battery price, or tax rate. Their purpose is to demonstrate the sensitivity of the reported payback and to identify the data required for plant-level verification.
Monthly validation should calculate Sm from actual lease avoidance, diesel price, metered grid electricity, demand charges, maintenance, infrastructure allocation, and battery reserve. The reported 24-month value should be accepted only if the cumulative realized cash flow supports it.
6. Operational Performance Analysis
Operational performance is evaluated as a descriptive facility outcome, not as an experimentally estimated treatment effect. The relevant performance dimensions are controlled low-speed movement, stable stopping, wagon positioning, track occupancy, coupling frequency, and completion of the weighing and loading work package. The analysis therefore distinguishes technical plausibility, reported observations, and performance metrics that still require repeated measurement.
6.1. Maneuvering Behavior and Low-Speed Precision
In plant-yard logistics, locomotive performance is determined primarily by controlled and repeatable low-speed movement rather than high running speed. Shunting locomotives operate over short distances, with frequent start–stop cycles, variable wagon loads, and restricted visibility. Accordingly, the quality of movement initiation, steady-state low-speed control, and controlled stopping at the target position are central components of operational performance.
Even small positioning errors during wagon coupling, weighing-track entry, loading-line positioning, or alignment can lengthen the cycle and require additional corrective movements. The propulsion system must respond to operator commands with low latency, provide stable tractive effort in both pulling and pushing directions, and limit abrupt impacts. Field performance should therefore be assessed through low-speed torque control, response stability, stopping accuracy, operator positioning, and repeatability rather than through tractive effort alone.
Electric traction can provide finer low-speed torque control than an engine–transmission chain. The available records, however, do not contain command-response traces or stopping-error distributions. Accordingly, electric traction is described as being consistent with smoother start–stop control, without assigning a quantified causal effect to propulsion architecture alone.
6.2. Time Savings and Reduction in Maneuver Count
The 20–40% task-time reduction is an operator-reported descriptive range. The archive does not identify the number of cycles, task categories, operators, shifts, observed minima and maxima, mean, standard deviation, or confidence interval. It is consequently not used as a statistically validated productivity gain. Its plausible engineering basis is the cumulative reduction in small delays during movement initiation, alignment, correction, braking, communication, and confirmation.
Fewer corrective movements would shorten a task and could reduce operator workload, coupling impacts, and track occupancy. These mechanisms are credible but were not measured individually. They are therefore treated as hypotheses for the monitoring protocol rather than proven secondary benefits.
The complete 10-wagon weighing maneuver was reported as 7–9 min. This range represents a concrete task-level observation, but it is not presented as an average or as a matched diesel-versus-electric comparison.
Figure 5 shows the full cycle and explicitly states that stage-resolved timestamps and repetition counts are not available.
6.3. Operational Impact of Traction Capacity
The diesel locomotive was reported to move approximately 10 loaded wagons during routine plant operation, whereas the maximum documented battery-electric movement comprised 25 loaded wagons (approximately 1450 t). These values are not distributional statistics and are not directly equivalent to the manufacturer’s 1050 t rating. The 25-wagon event is therefore used as a bounded field observation and examined through Equations (8)–(10).
If a larger consist can be moved safely under verified track and adhesion conditions, fewer cycles, coupling events, switch occupations, and field interactions may be required for a fixed daily wagon volume. The actual reduction depends on wagon availability, yard geometry, route resistance, loading sequence, and charging schedule; no daily throughput increase is calculated from the current archive.
The case shows why locomotive mass and engine power alone are insufficient selection criteria, but it does not establish that a lower-mass platform universally has greater hauling capacity. Field performance is the joint result of available adhesion, commanded torque, sanding, total train resistance, speed, acceleration, route geometry, and operating practice. Instrumented repetitions are required before the maximum event can be converted into a validated operational KPI.
6.4. Maneuvering Quality, Impact Effects, and Process Standardization
Maneuvering quality includes movement initiation, speed stability, stopping accuracy, coupling impact, corrective-movement count, and repeatability. These variables are relevant to weighing equipment and track infrastructure, but none was instrumented in the historical dataset. This subsection therefore defines the engineering mechanisms and measurement requirements rather than reporting unmeasured reductions in impact or wear.
An electric drive can modulate torque without the combustion-engine and transmission dynamics of the diesel baseline. This can reduce abrupt command transitions, but the effect on coupler force, wheel–rail load, or scale structure must be verified with force, acceleration, or vibration measurements. Accordingly, any reduction in impact or wear is treated as a testable hypothesis rather than a measured outcome.
PLC/HMI and remote-control data can support standardization only if they are logged and linked to task identifiers, operators, train mass, and route conditions. The system architecture provides this capability, but no between-shift variation has yet been quantified.
6.5. Bottleneck Reduction and Cycle Planning
Yard bottlenecks arise from system interactions rather than locomotive speed alone: wagon arrival, switch availability, scale readiness, loading status, crew coordination, and corrective maneuvers can all control cycle time. A locomotive change can remove one constraint while leaving others unchanged. Accordingly, total logistics performance cannot be attributed to traction technology alone.
A verified increase in wagons per movement would reduce the theoretical number of cycles for a fixed wagon volume, but the available data do not include daily wagon totals or matched schedules. The 10- and 25-wagon values are therefore used to identify potential opportunities for flow redesign, not to calculate a realized throughput percentage.
Operational use of larger consists requires route-specific authorization based on gradient, curve resistance, switch geometry, braking distance, siding length, scale capacity, communication, and pedestrian separation. Charging windows must be coordinated with the same shift plan. These constraints are incorporated into the transferability discussion and post-implementation KPI framework.
6.6. Comparative Analysis of Operational Performance Indicators
Table 12 separates each operational indicator into its source, reported form, evidentiary strength, and permissible interpretation. Capacity, time, controllability, visibility, and repeatability are not combined into a single score because the underlying data have different levels of resolution.
Table 12 does not classify operator-reported values as established productivity outcomes. It identifies the 25-wagon value as a maximum event, the 7–9 min value as a descriptive complete-cycle range, and the 20–40% value as an operator estimate without replicated measurements; this estimate requires matched time–motion validation.
6.7. The Effect of Equipment and Site Layout on Maneuvering Quality
Site-layout compatibility should be assessed through stopping points, coupler clearance, scale length, switch positions, pedestrian routes, sight lines, and safe operator locations. These factors determine whether low-speed control and remote operation can support consistent maneuvering quality.
Corrective movements add time and can introduce repeated coupler and track loading. These loads are not quantified; objective assessment requires records of the number of corrective movements, longitudinal acceleration, coupling events, and scale repositioning.
Direct torque control may reduce abrupt start–stop behavior, but this remains an engineering expectation until force or acceleration data are collected. Accordingly, potential equipment-life benefits are not monetized or presented as measured results.
Remote control can provide a more favorable observation position, subject to maintained line of sight, radio coverage, safe walking zones, and exclusion of personnel from the movement envelope. Site design and procedures therefore remain co-determinants of performance.
The PLC/HMI platform should log task identifier, command state, speed, current, voltage, state of charge, alarms, emergency stops, and operator identifier. These variables would convert maneuvering quality from qualitative judgment into a repeatable dataset.
6.8. On-Site Traffic Management, Shift Planning, and Coordination
Actual performance is a coupled result of locomotive capability, train preparation, scale and loading-point availability, switch layout, field personnel, charging access, and shift scheduling. Equipment replacement alone cannot guarantee the reported task-time range or consist-capacity effect.
A matched operational protocol should control or record wagon count and gross mass, route, scale readiness, rail condition, ambient conditions, operator, and traffic state. Without these covariates, cycle-time variation cannot be attributed uniquely to propulsion technology.
Larger consists should be scheduled only when siding length, scale capacity, braking margin, switch clearance, and personnel controls are verified. The 25-wagon event is not used as a default planning value without route-specific authorization.
Charging plans should be based on measured charger input, state-of-charge window, expected tasks, temperature, and contingency reserve. Charging, maintenance, and maneuver planning should therefore be managed as one availability model.
A standard communication protocol is required among the locomotive operator, scale operator, loading/unloading team, yard signalers, maintenance personnel, and OSH staff. Remote operation changes the operator’s position and therefore requires explicit movement zones, handover rules, and loss-of-communication procedures.
The operational interpretation is consequently conditional: the battery-electric platform provides capabilities that may support improved flow, but realized benefit depends on traffic design, charging strategy, operator competence, and safety procedures. Accordingly, any realized improvement must be evaluated within these operational constraints.
6.9. Operator Performance and Post-Training Standardization
Electric torque control, remote operation, and digital interfaces change rather than reduce training requirements. Required competencies include low-speed pulling and pushing control, battery and charger status, remote-control range, line-of-sight selection, communication-loss response, deadman-system response, emergency stopping, camera limitations, and warning-system use.
Training should use standardized task scripts for coupling, weighing-track entry, alignment, charging, power isolation, and coordination with field personnel. Quieter operation requires deliberate visual and audible warning practices.
Post-training standardization should be evaluated with repeated measurements of task duration, energy per task, correction count, stopping error, safety-function activations, alarm logs, and operator feedback. Similar performance across operators cannot be claimed until those data are collected.
Operator metrics must be normalized for train mass, route resistance, rail condition, traffic density, state of charge, and equipment status. Monitoring should support coaching and process improvement rather than attributing all variability to operator behavior.
PLC/HMI and charger records can provide the required objective trace, provided that timestamps and task and operator identifiers are recorded. These records define a monitoring pathway; they do not constitute a completed between-operator analysis.
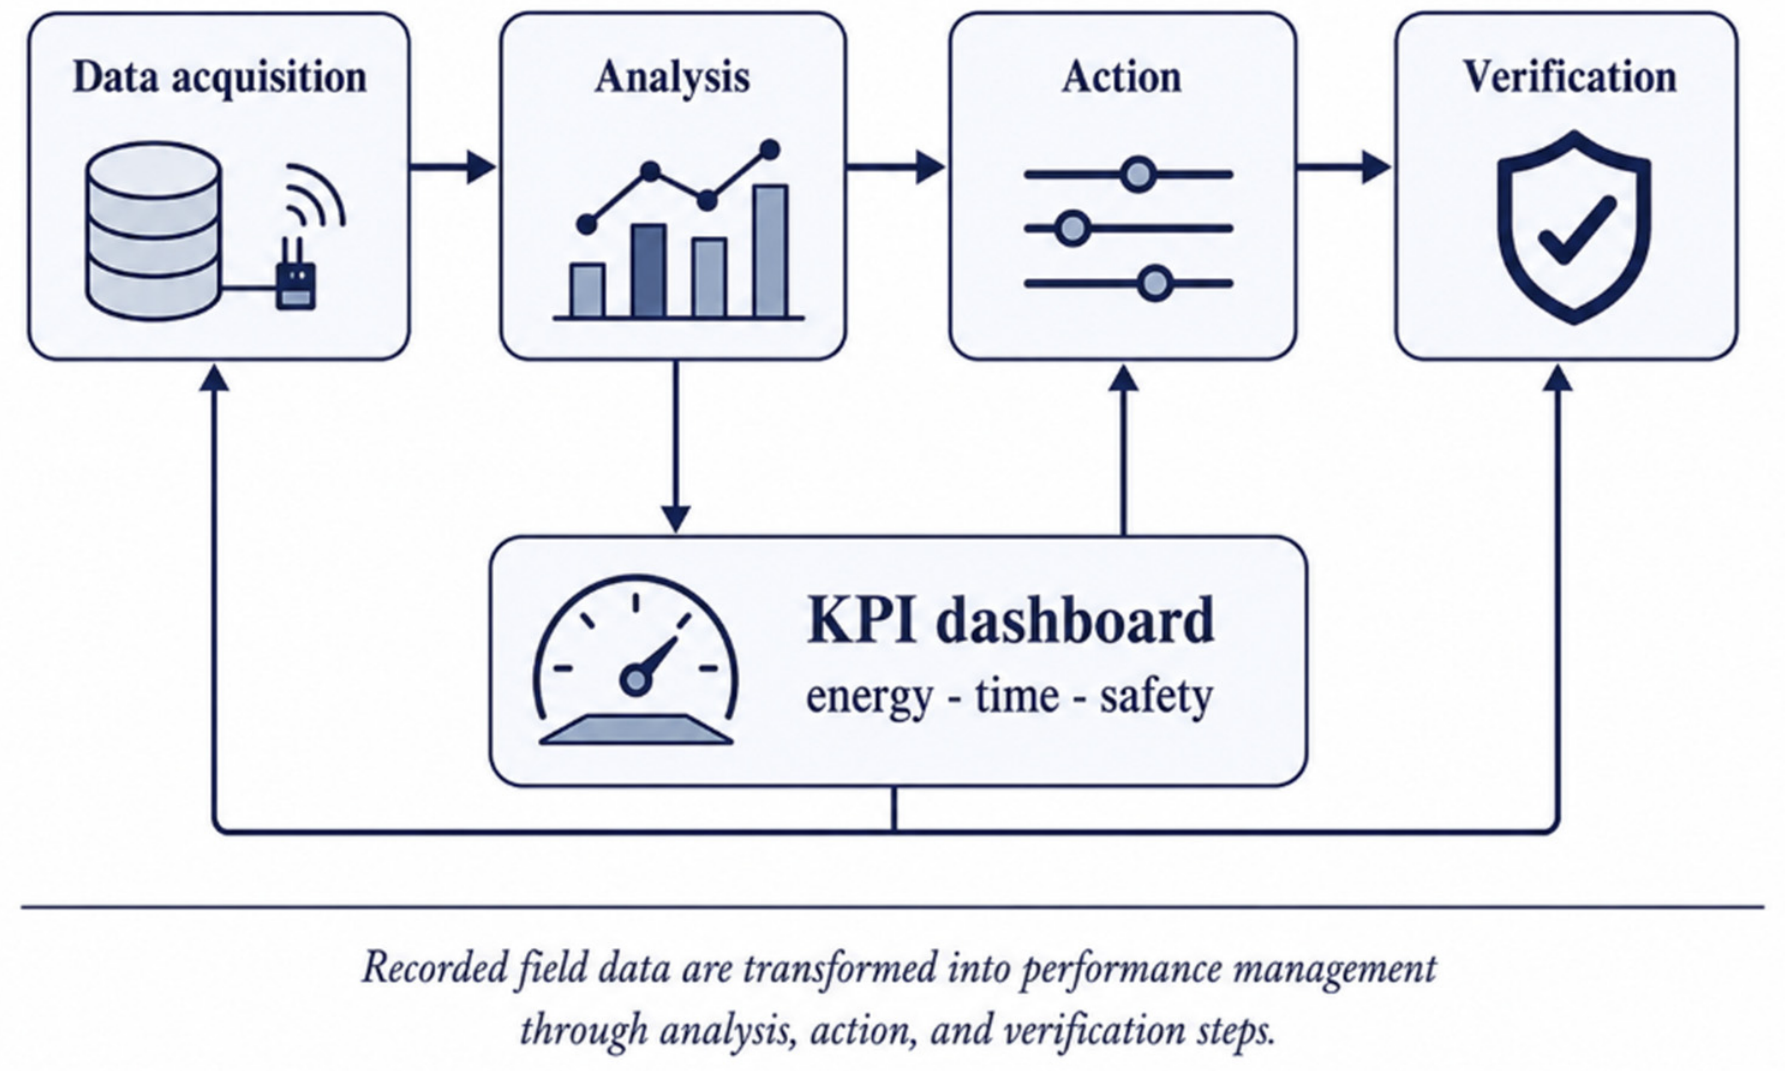
Sustained operational performance therefore requires a closed loop of authorization, field observation, data capture, feedback, and periodically updated work instructions. This management conclusion is supported by system capability; its quantitative effect remains a future validation outcome.
7. Energy Consumption and Environmental Impact Analysis
For in-plant shunting operations, energy consumption and environmental impact must be assessed in relation to propulsion architecture, duty-cycle structure, start–stop frequency, hauled tonnage, energy-recovery capability, local emissions, and the boundaries of corporate greenhouse-gas accounting. This Section therefore evaluates diesel fuel consumption, electricity use, regenerative-braking potential, Scope 1 emissions, Scope 2 boundary conditions, local air-quality effects, and battery life-cycle considerations.
7.1. Energy and Emission Profile of the Diesel System
The diesel baseline consumed approximately 1800 L/month, equivalent to 21,600 L/year. This is an annualized activity indicator derived from a monthly average; it is not a task-level fuel measurement and may vary with production and dispatch intensity.
Under the Greenhouse Gas Protocol, fuel combustion in equipment owned or controlled by the reporting organization is a source of Scope 1 emissions [
9]. Replacing the diesel shunting locomotive with a battery-electric system therefore directly reduces Scope 1 emissions within the plant boundary by eliminating diesel combustion during shunting.
Using Equation (2), annual direct CO
2 was calculated with both the EIA factor of 2.692 kg CO
2/L [
10] and the GHG Protocol cross-check factor of 2.683 kg CO
2/L [
9]. The two calculations are shown below.
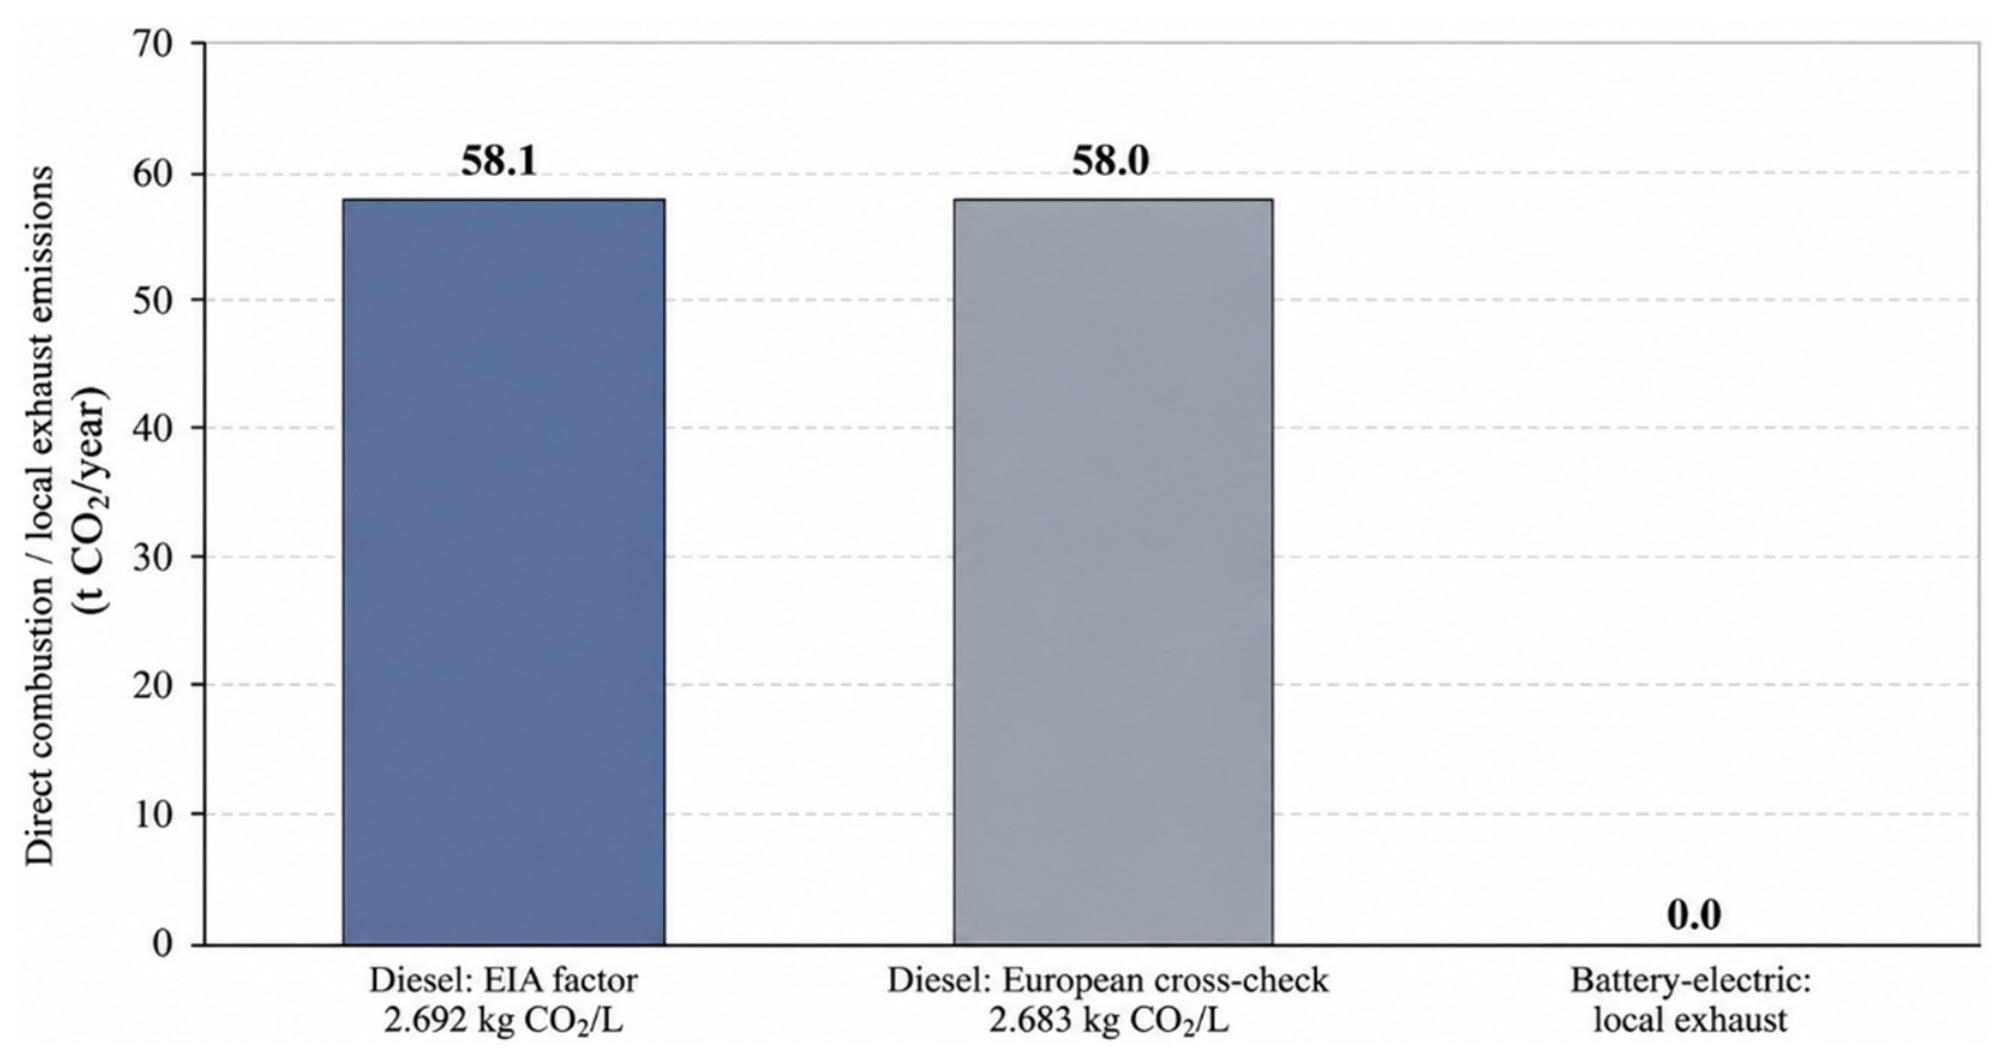
The factor cross-check yields a narrow 58.0–58.1 t CO2/year range. This is an arithmetically robust result of the reported diesel volume, but its annual representativeness still depends on the stability of the 1800 L/month activity estimate. The range quantifies avoided direct combustion only.
Diesel exhaust also contains NOx, particulate matter, CO, and other combustion products relevant to local air quality and occupational exposure. These pollutants were not measured at the plant; exposure reduction is therefore discussed as a plausible consequence of removing local combustion rather than a quantified concentration change.
The environmental interpretation distinguishes three boundaries: direct Scope 1 combustion, point-of-use local exhaust, and unquantified Scope 2 and life-cycle effects. This distinction prevents “zero local exhaust” from being interpreted as “zero life-cycle emissions.”
7.2. Energy Profile of the Electric System and Regenerative Braking Potential
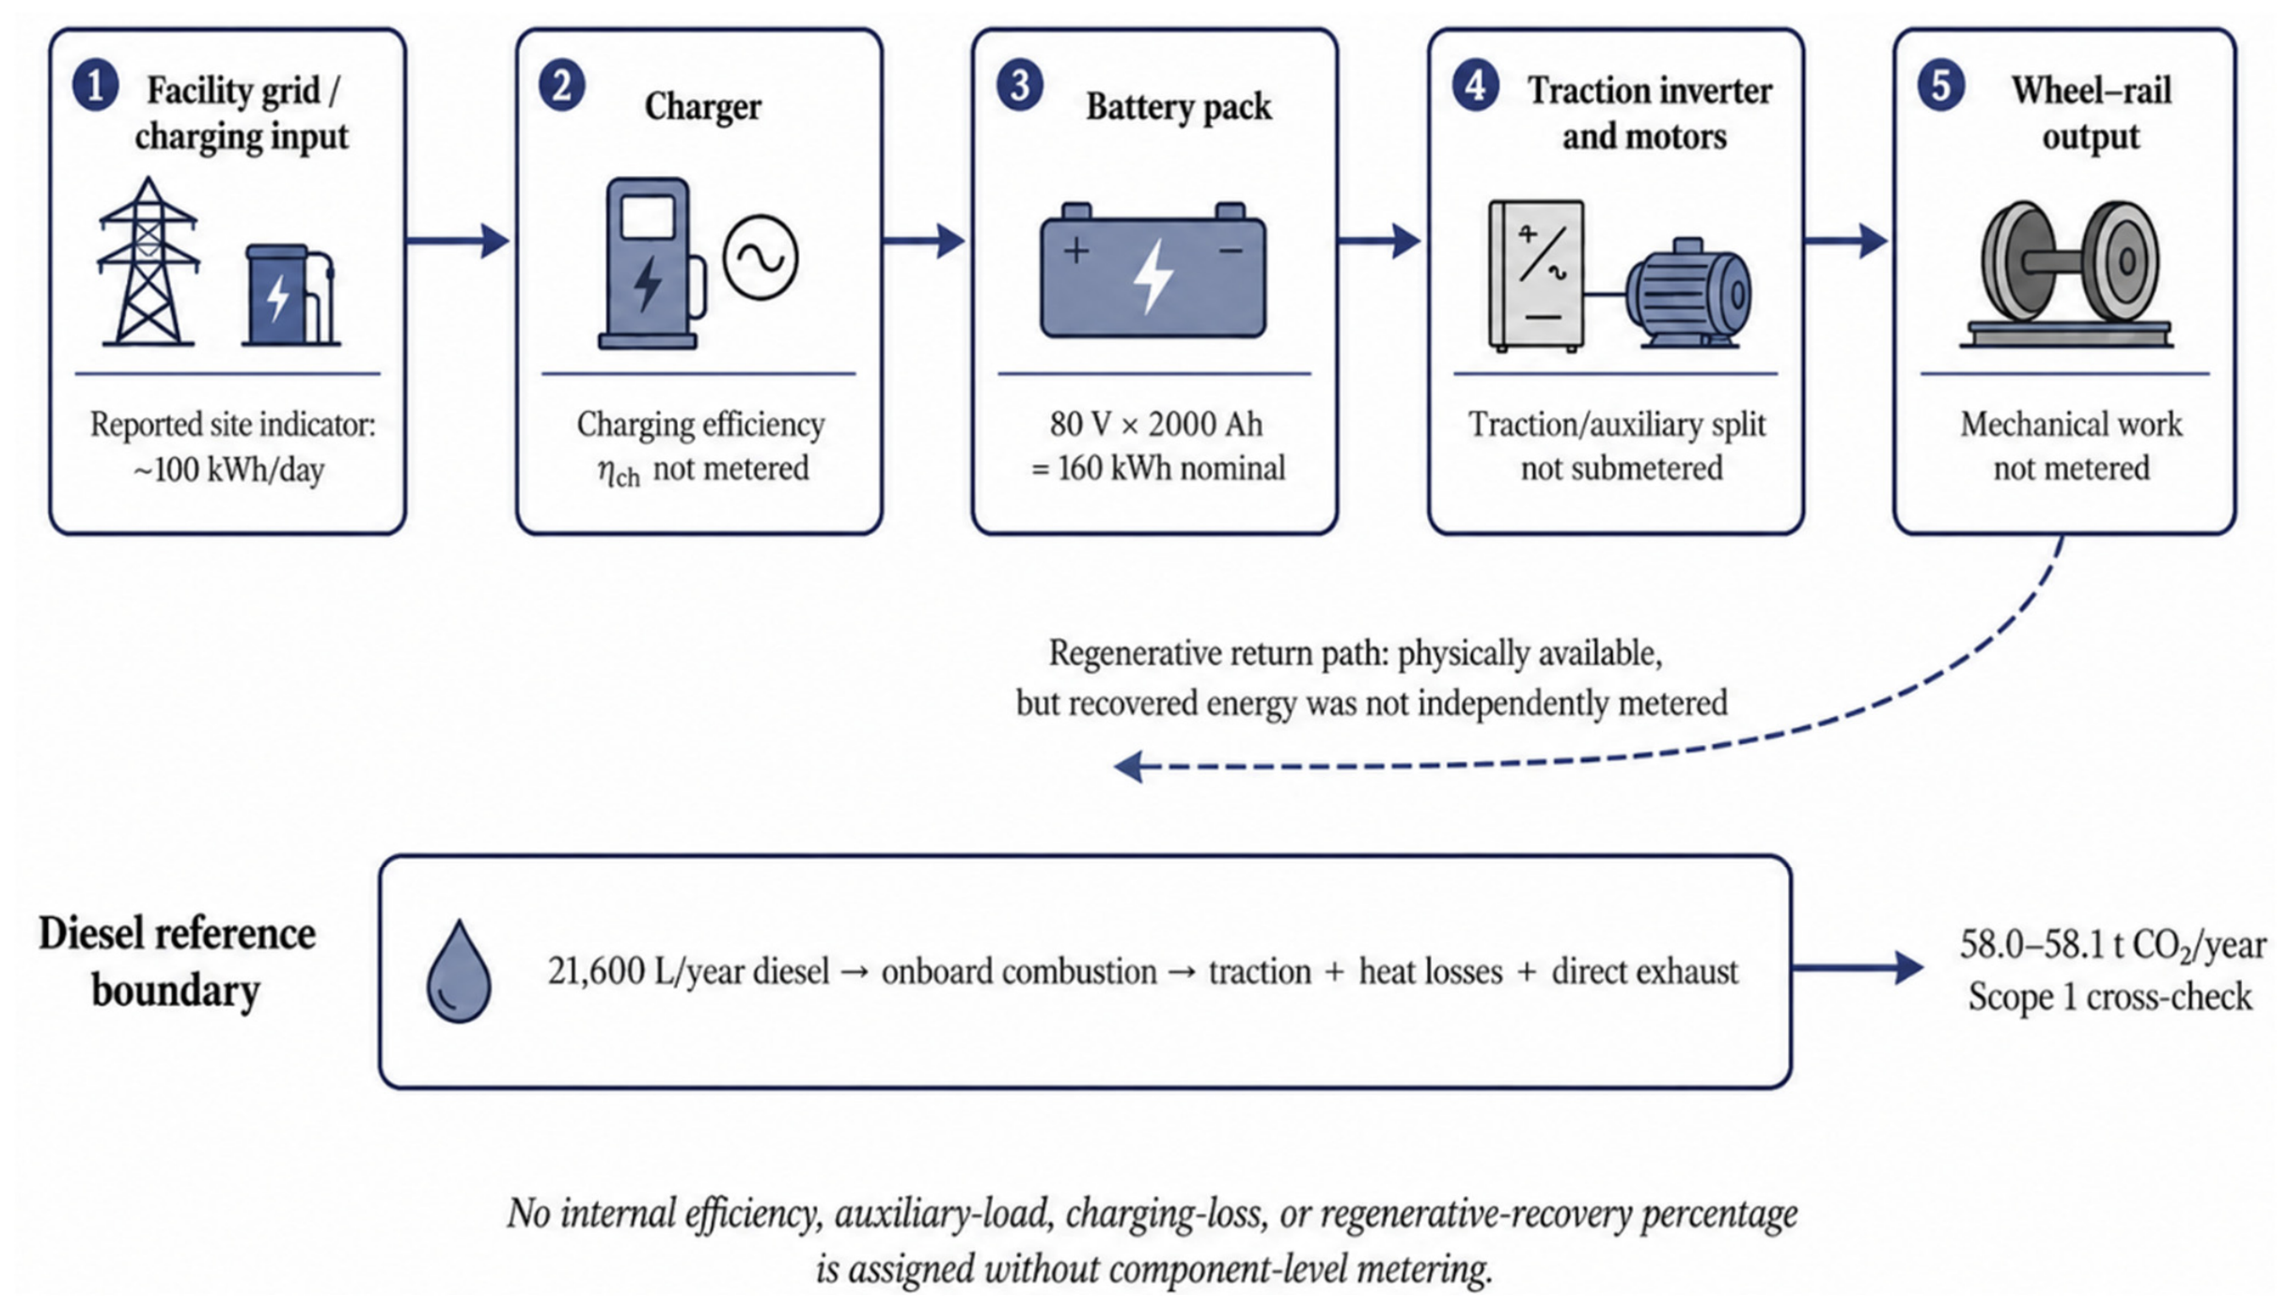
The energy profile of the battery-electric shunting locomotive is fundamentally different. In the diesel system, energy is stored as liquid fuel and converted through an internal combustion engine. In the electric system, energy is drawn from the plant electrical grid, stored in the battery pack, and converted to tractive output at the wheel–rail interface through the electric drive. Because there is no onboard fuel combustion during operation, the locomotive produces no local exhaust emissions at the point of use.
The nominal battery energy is calculated with Equation (3). The site also reported approximately 100 kWh/day, but the source record does not define the metering boundary or associated daily operating activity. The nominal energy calculation is therefore shown separately from the reported electricity indicator.
The ratio of the reported 100 kWh/day indicator to 160 kWh nominal capacity must not be interpreted as a 62.5% depth of discharge. Charging losses, auxiliary loads, regenerative return, initial and final states of charge, usable state-of-charge window, and measurement location are unknown. Daily autonomy can be verified only from synchronized charger and BMS records.
Regenerative braking is physically relevant to stop–start shunting, but recovered energy was not separately metered in this case. No regenerative-efficiency percentage or avoided-energy value is therefore reported.
Figure 8 identifies the regenerative path while marking it as an unmeasured branch.
Prior work has demonstrated cycle-dependent regenerative benefits [
3,
27,
28,
29,
30]. Those results support technical plausibility but cannot be transferred directly because train mass, speed profile, gradient, battery chemistry, control strategy, and state of charge differ.
The battery-electric locomotive has no onboard combustion and therefore produces no local exhaust emissions at the point of use. This boundary does not imply zero Scope 2 or life-cycle impact.
Scope 2 requires metered grid input and a location- or supplier-specific electricity factor; life-cycle assessment additionally requires battery manufacturing, replacement, and end-of-life data [
9,
22]. These quantities are not inferred from nominal capacity.
7.3. Assessment from the Perspective of Local Air Quality and Occupational Health
The environmental benefit of replacing diesel shunting extends beyond CO2 reduction. In-plant railway operations occur near loading/unloading zones, weighing areas, storage tracks, and personnel movement areas. Local exhaust emissions therefore have both environmental and occupational-hygiene significance.
Diesel exhaust contains particulate matter, nitrogen oxides, carbon monoxide, and other combustion-related pollutants. In cement plants, where dust and heavy-equipment movement are already present, diesel exhaust can create an additional inhalation exposure. Removing diesel propulsion from the shunting task can therefore reduce not only greenhouse-gas emissions but also local pollutant exposure.
The New South Wales EPA reported that generator-set and electric-hybrid yard locomotives can achieve substantial reductions in NOx and particulate emissions, in some cases approaching 90% depending on the application [
14]. Although that evidence does not describe the exact locomotive configuration used in this case, it supports the broader conclusion that reducing diesel combustion in yard locomotives has meaningful potential for local-air-quality improvement.
The International Agency for Research on Cancer has classified diesel engine exhaust as carcinogenic to humans [
15]. This classification strengthens the OSH rationale for reducing diesel exhaust in industrial yards. The transition to battery-electric shunting therefore contributes not only to carbon management but also to exposure reduction and workplace hygiene.
Removing onboard diesel combustion can reduce pollutant exposure near weighing, coupling, and loading areas, while quieter operation may reduce acoustic burden. Neither effect was measured in the present study. The OSH benefit is therefore framed as an exposure-reduction opportunity that requires pre- and post-conversion monitoring.
Quieter propulsion can also reduce auditory detectability. Sirens, LED lighting, cameras, signage, exclusion zones, and worker-notification rules must therefore be tested as compensating controls rather than treated as optional accessories.
7.4. Indirect Emissions, Electricity Mix, and Boundary Conditions
The quantified environmental result is the avoided direct-combustion range of 58.0–58.1 t CO
2/year. Scope 2 is not zero and should be calculated with Equation (11) from metered grid electricity and an appropriate electricity emission factor. Because the current 100 kWh/day indicator has an undefined measurement boundary, no annual Scope 2 value is calculated.
Figure 9 compares the EIA and GHG Protocol direct-combustion calculations and shows zero only for local exhaust from the battery-electric locomotive. The figure explicitly excludes purchased-electricity and battery life-cycle emissions.
Life-cycle performance depends on battery materials, energy used in cell manufacturing, usable life, replacement frequency, transport, and recycling [
22]. These burdens were not quantified and are not netted against the Scope 1 reduction.
Low-carbon electricity can reduce Scope 2 impact, but it does not remove charging losses, battery degradation, or availability constraints. Environmental management should therefore track grid kWh, charger efficiency, state of health, replacement events, and supplier-specific emission factors.
Table 13 consolidates the direct, indirect, local-pollutant, noise, and life-cycle boundaries so that point-of-use benefits are not confused with full life-cycle performance.
A complete follow-up assessment should report Scope 1 emissions, market- and location-based Scope 2 emissions, and battery life-cycle impacts as separate results; a net greenhouse-gas benefit should be presented only after all three components are quantified.
8. Assessment from an Occupational Safety and Health Perspective
Although shunting speed is low, risk remains high because heavy wagon consists interact with personnel, switches, scales, coupling zones, and plant equipment. The assessment therefore examines how the risk profile changes with remote control, deadman and emergency-stop functions, cameras, lighting, warnings, and electrical energy storage. It is a safeguard analysis, not a pre- and post-conversion incident-rate study.
8.1. Transformation of the Risk Structure in Shunting Operations
During in-plant shunting, the primary risk arises less from high speed than from the controlled movement of a heavy wagon consist within restricted sight lines and changing field conditions. During alignment, weighing-track entry, coupling, uncoupling, direction reversal, and loading-line positioning, the operator’s situational awareness, communication with field personnel, and command response are decisive. Maneuvering safety is therefore linked to perception, positioning, stopping capability, and procedural discipline as much as to braking hardware.
Conventional diesel shunting usually places the operator in the cab, where visibility can be restricted by locomotive geometry, wagon length, track layout, switches, loading equipment, and personnel movement. Reverse movements and coupling tasks can create blind spots, requiring reliance on field signaling and ground personnel. Under these conditions, safety depends heavily on operator experience and the quality of yard communication.
The SIL 2 remote-control system permits operation from a location with a potentially better line of sight within the documented range of approximately 180 m. This capability is relevant to coupling and alignment, but safe use still depends on radio coverage, point protection, exclusion zones, communication, and operator positioning [
6,
16,
17].
At the plant, remote control enables the operator to select an observation position relative to the wagon movement rather than remaining fixed in the cab. This can improve visibility and the ability to intervene; however, the dataset does not quantify stopping error, near-miss frequency, or incident reduction.
Remote control does not, however, eliminate risk by itself. Federal Railroad Administration assessments of remote-controlled locomotive operations emphasize that safety performance depends on human factors, training, procedural compliance, communication discipline, and yard rules in addition to equipment reliability [
16]. The safety contribution of the electric locomotive therefore depends on operator authorization, line-of-sight procedures, communication protocols, and continuous monitoring.
8.2. Functional Safety, Fail-Safe Approach, and Safety Components
The battery-electric locomotive integrates deadman, emergency-stop, handbrake, buffers, camera, LED lighting, movement-warning siren, diagnostics, and remote-control functions. These safeguards address different failure modes and should be verified as components of a layered safety architecture; their presence alone does not establish overall risk reduction.
SIL 2 applies to defined safety functions under IEC 61508 and must not be interpreted as a guarantee of complete locomotive or yard safety [
8]. Accordingly, SIL 2 is treated as a functional-integrity classification for specified safety functions rather than as a measured indicator of overall safety performance.
The fail-safe principle is crucial in shunting because loss of operator control, loss of line of sight, communication interruption, unexpected wagon movement, or personnel entry into a hazardous area may occur during a maneuver. In such cases, continued uncontrolled movement is unacceptable. The system must therefore be able to stop safely, isolate hazardous movement, or limit energy transfer.
Deadman and emergency-stop functions are practical implementations of this fail-safe logic. The deadman system verifies active operator engagement, while the emergency stop provides immediate intervention capability. Cameras, lighting, and movement alarms complement these controls by improving operator situational awareness and field-personnel awareness. Together, these elements form a risk-reduction architecture rather than a collection of independent accessories.
The effectiveness of the architecture depends on periodic function tests, point-protection rules, switch procedures, authorization, communication discipline, training, and event-log review [
16,
17]. These procedural dependencies are incorporated into
Table 14,
Table 15 and
Table 16.
8.3. Human Factors and Operator-Centered Assessment
Safety performance in remote-controlled battery-electric shunting cannot be explained by hardware alone. The operator’s role shifts from cab-based driving to field-based control, requiring selection of an appropriate line of sight, monitoring of the wagon consist, interpretation of remote-control feedback, communication with ground personnel, and supervision of risk boundaries.
FRA safety assessments identify human factors as central to accidents and switching incidents in remote-control operations [
16]. Although remote-control locomotives can improve switching precision, human-factor-related events remain significant; therefore, training, task design, attention management, and procedural discipline are essential. Human-reliability studies similarly show that workload, situational awareness, rule compliance, and operator behavior must be included in risk assessment [
17].
The electric locomotive’s remote control, camera support, and precise low-speed torque response can reduce some uncertainties associated with cab visibility and mechanical delay. However, the nature of the human-factor risk changes rather than disappears. Reduced cab-related blind spots are accompanied by requirements for remote-control ergonomics, communication continuity, safe operator positioning, line-of-sight maintenance, and coordination with nearby personnel.
Operators must therefore be trained to interpret battery indicators, operating modes, speed limits, braking behavior, deadman logic, emergency-stop procedures, camera visibility, and warning systems. Because the electric locomotive is quieter than the diesel locomotive, systematic use of acoustic and visual warnings is essential to ensure detectability by field personnel.
Operator-centered monitoring should be designed as a continuous-improvement mechanism rather than as a punitive control system. Emergency-stop use, deadman activations, communication interruptions, camera-visibility limitations, near misses, and operator feedback should be systematically collected and reviewed. These records can identify hazardous locations, training gaps, visibility constraints, and procedure weaknesses.
The PLC/HMI infrastructure can support this process by recording operating modes, alarm history, energy consumption, charging behavior, task duration, and safety-function activations. Such data can be used to improve training materials, identify recurring operational issues, and standardize high-quality operating practices across shifts.
8.4. Diesel Exhaust, Local Exposure, and Occupational Hygiene Aspects
Occupational safety assessment should also include exposure-related risks. Diesel locomotives produce exhaust gases, particulate matter, nitrogen oxides, carbon monoxide, and other combustion pollutants that can contribute to worker exposure in plant yards. In dusty cement-plant environments and semi-enclosed working zones, diesel exhaust can add a significant occupational-hygiene burden.
The International Agency for Research on Cancer classifies diesel engine exhaust as carcinogenic to humans [
15]. This classification indicates that reducing diesel propulsion in industrial sites is not only a carbon-management measure but also an occupational-health intervention. Eliminating diesel propulsion from shunting can therefore contribute to reduced exposure to exhaust-related pollutants.
Battery-electric shunting locomotives do not emit local exhaust at the point of use, which can improve air quality near weighing tracks, coupling zones, loading/unloading areas, and operator work locations. Evidence from locomotive-emission studies indicates that reducing diesel propulsion in yard locomotives can substantially reduce NOx and particulate emissions [
14]. This supports the occupational-hygiene value of the transition.
To document this benefit scientifically, pre- and post-conversion measurements should include particulate matter, NOx, CO, noise, and general air-quality indicators. Such measurements would convert the OSH effect from a qualitative observation into a quantified exposure-reduction result.
Reduced noise has both beneficial and adverse safety implications. It can lower acoustic exposure for operators and field personnel, but it may also reduce locomotive detectability. For this reason, quiet operation must be accompanied by effective LED lighting, movement sirens, cameras, signage, and worker-notification procedures.
The OSH interpretation has two evidence-bounded findings: removal of local diesel exhaust and availability of layered maneuvering safeguards. Neither exposure concentration nor incident frequency was measured.
Table 14 therefore reports risk-control capability and the evidence needed for outcome validation.
8.5. Requirements for Procedures, Training, and Authorization
The presence of SIL 2 remote-control functions, deadman functionality, emergency-stop controls, camera support, and LED lighting expands the available safety controls of the electric locomotive. This potential can be converted into measurable safety performance only through procedures, training, and authorization. Operators must understand the locations from which the locomotive may be controlled, how line of sight is maintained, how communication with field personnel is established, and which actions are required in emergency scenarios.
Authorization should cover not only the ability to operate the remote-control device but also field-risk identification, braking-distance estimation, wagon-consist behavior, switch-area rules, weighing-line procedures, and safe stopping. More precise electric control does not reduce the need for discipline; rather, it requires a dedicated training framework because the human-machine interface has changed [
16,
17].
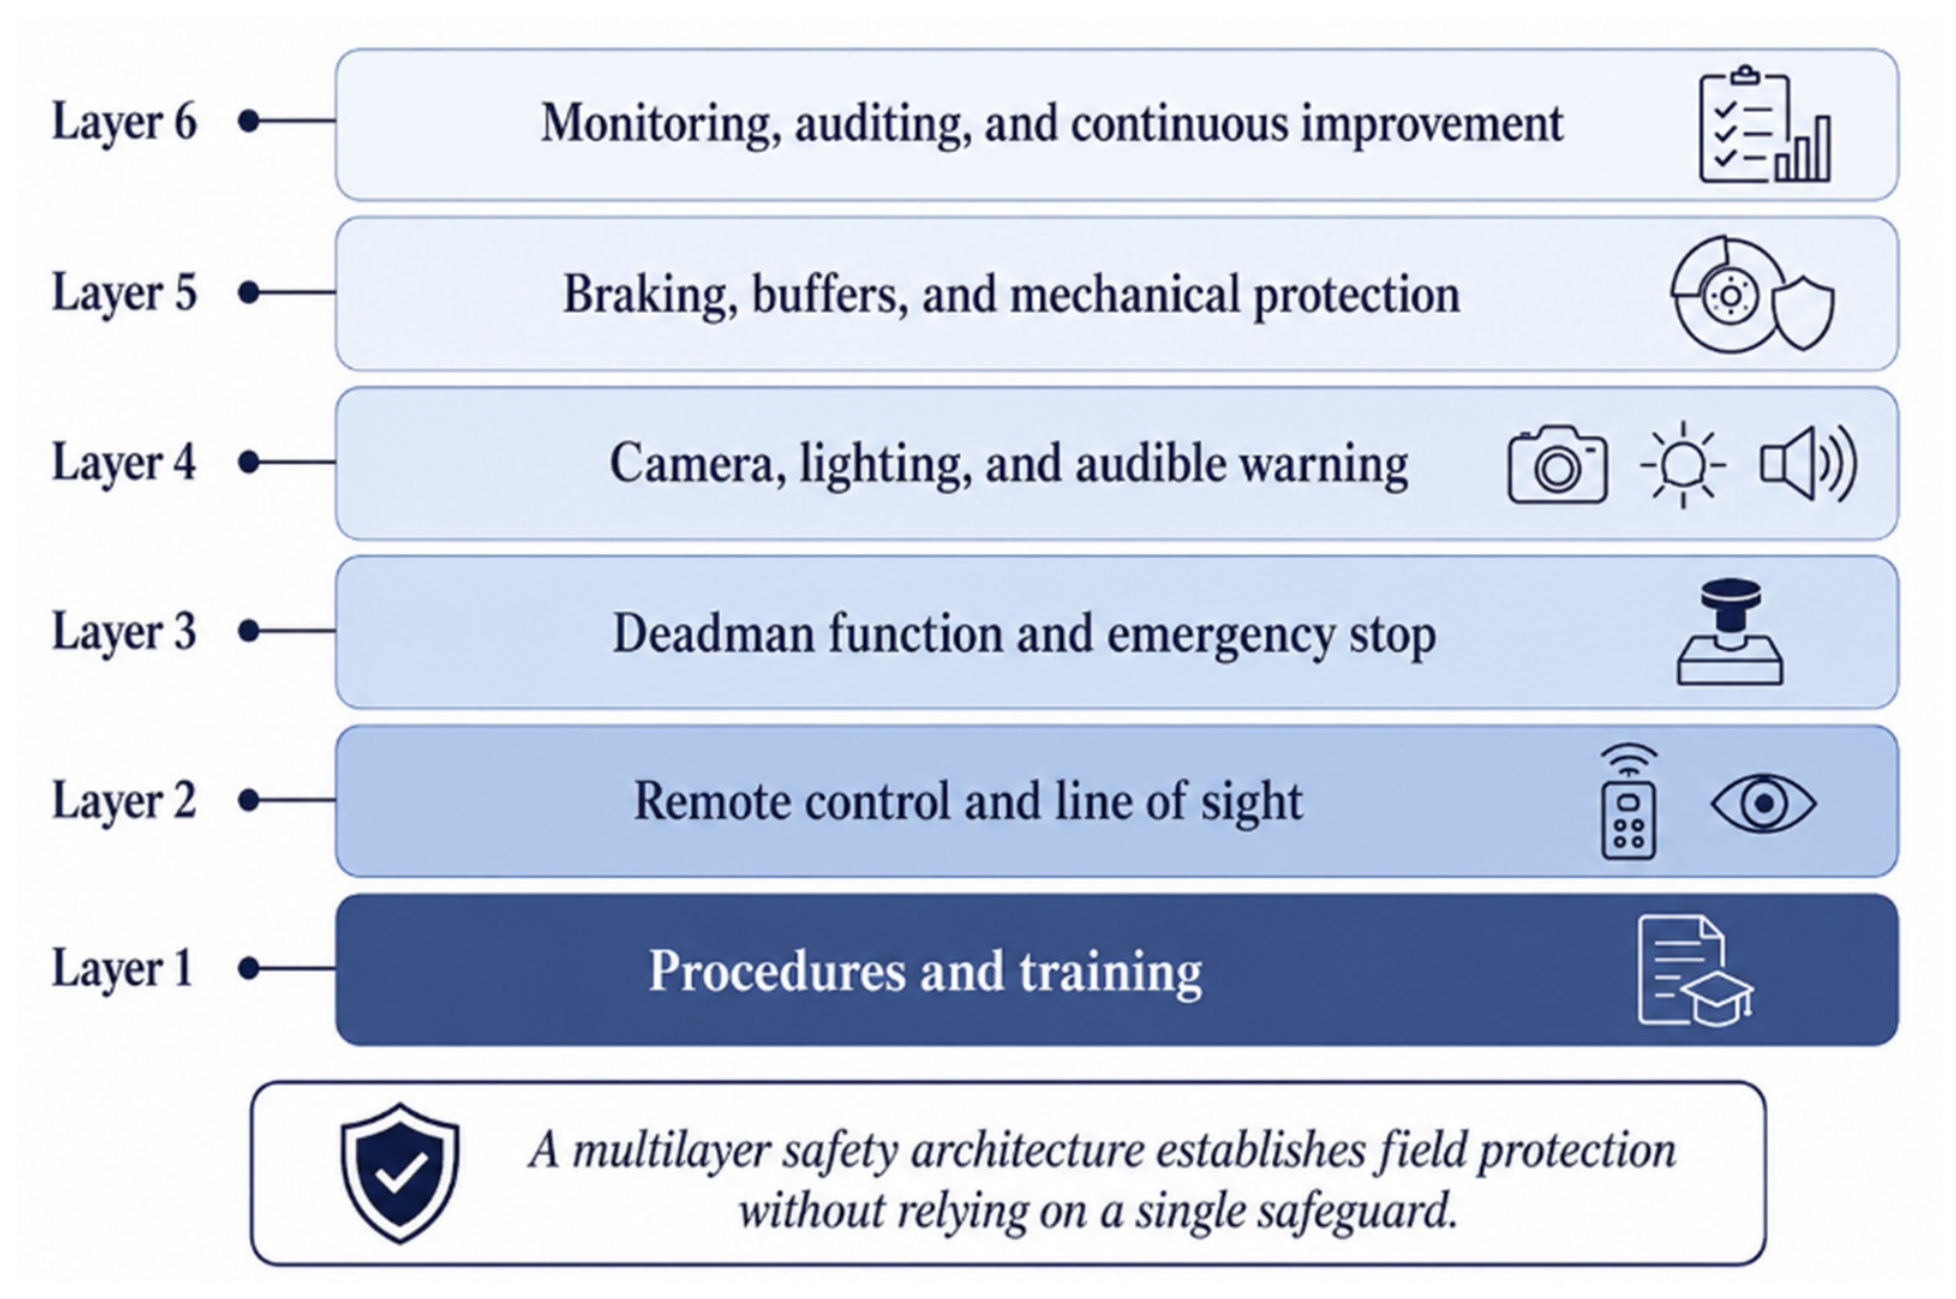
Figure 10 presents the proposed multi-layered risk-mitigation structure for battery-electric shunting. Procedures and training form the first layer; remote control and line-of-sight management form the second; deadman and emergency-stop functions form the third; camera, lighting, and warning systems form the fourth; mechanical protection components form the fifth; and recording and monitoring form the sixth. Combined application of these layers can improve the control of both human-error and technical-failure scenarios.
8.6. Occupational Hygiene and Field Exposure Measurement Plan
Replacing diesel shunting provides a clear opportunity to reduce exhaust and particulate exposure. To document this benefit, an occupational-hygiene measurement plan should include particulate matter, NOx, CO, noise, and air-quality measurements at representative locomotive work areas before and after conversion. This would allow the OSH contribution of electric shunting to be quantified rather than described only qualitatively.
The OSH monitoring plan should include accident and near-miss records, emergency-stop use, deadman activations, training records, remote-control communication interruptions, camera-visibility issues, warning-system tests, and maintenance-related safety nonconformities.
Table 15 consolidates each risk area, the corresponding control, the records to be maintained, and the evidence needed to evaluate effectiveness. Because quieter operation can reduce acoustic detectability, visual and audible warning verification must be included in routine monitoring.
8.7. Emergency Management and Power Isolation
Emergency management for battery-electric locomotives differs from that required for diesel systems. Diesel systems emphasize fuel, oil, exhaust temperature, and engine-related hazards, whereas electric systems require control of battery isolation, high-current circuits, charging connections, electrical faults, and battery temperature. Emergency procedures must therefore cover both mechanical stopping and electrical safety.
Energy isolation is essential during maintenance and fault response. Maintenance should not begin until the charger is disconnected, the battery circuit is isolated, and unauthorized access is prevented. Lockout-tagout principles should be adapted to battery-electric locomotive maintenance instructions to protect maintenance personnel from electrical hazards.
Emergency-stop and deadman functions should be tested periodically and documented across shifts and operators. Remote-control communication loss, remote-control battery depletion, camera failure, lighting failure, and siren malfunction should also be included in emergency scenarios.
Table 16 addresses the shifted hazard profile: diesel fuel and exhaust hazards decrease, while battery isolation, high-current circuits, charging connections, thermal alarms, and control-system failures require dedicated procedures. The transition redistributes risk rather than eliminating it.
The recommended checks are prospective controls. Their effectiveness should be evaluated through test completion, alarm history, communication-loss events, near misses, and maintenance nonconformities; effectiveness is not inferred from the presence of controls alone.
9. Discussion
The case supports three levels of inference. First, documentary results are direct: USD 10,000/month lease, approximately 1800 L/month diesel, and 58.0–58.1 t CO2/year in direct combustion emissions. Second, descriptive field information comprises the reported 7–9 min 10-wagon cycle, the operator-estimated 20–40% task-time reduction range, and the maximum 25-wagon movement. Third, engineering interpretations concern torque controllability, bottleneck potential, and safety capability. Maintaining this separation supports a conclusion of conditional facility-scale feasibility rather than categorical superiority.
The observed context is consistent with the operating envelope identified in prior work: bounded distance, low speed, frequent reversals, charging access, and repeated braking [
1,
2,
3,
4]. Gotsov et al. [
3] reported a 12-wagon industrial cycle and an improvement of approximately 41% in energy efficiency with regenerative braking, but that result cannot validate the operator-reported 20–40% task-time reduction range because the outcome, route, consist, storage system, and measurement protocol differ. Mainline and heavy-haul studies [
1,
2,
4,
23,
24,
29,
30] further show that gradient, mass, range, and infrastructure determine feasibility, underscoring why the Seza result should not be generalized beyond similar yards.
The principal engineering explanation for the favorable operational observations is the combination of low-speed torque command, remote observation position, and a bounded duty cycle with available charging. Nevertheless, route resistance and adhesion constrain interpretation of the 25-wagon event, whereas unmetered charging and regenerative flows limit the energy analysis. Safety functions can improve control options only when embedded in rules, training, point protection, and verification [
16,
17].
The main limitations are the absence of cycle-resolved matched data, operator and shift counts, stage timestamps, route-condition records, measured drawbar force, charging efficiency, regenerative energy, long-term battery degradation, complete procurement and maintenance costs, and incident/exposure statistics. These limitations do not negate the documentary case; they define it as an evidence-bounded industrial report and explain why descriptive ranges are not accompanied by inferential statistics.
9.1. Multi-Criteria Decision Matrix
Table 17 synthesizes the decision evidence without assigning a composite score. The diesel platform benefits from established maintenance practices and documented heavy-duty service. The electric platform provides a configuration compatible with low-speed in-plant duty, eliminates local combustion, and offers digital and remote-control functions. Economic, operational, and safety advantages remain conditional on the missing cost and monitoring variables identified in the table.
9.2. Generalizability of the Findings
Transferability requires similarity in at least eight domains: (i) 1435 mm gauge and compatible wheel/rail geometry; (ii) route resistance low enough that rolling, gradient, curvature, and acceleration demand remain below available adhesion-limited tractive effort; (iii) siding, scale, switch, and clearance dimensions compatible with the intended consist; (iv) repetitive low-speed duty rather than sustained mainline power; (v) ambient conditions and battery temperatures within the BMS design envelope; (vi) charging windows, electrical capacity, tariff, and grid reliability compatible with availability targets; (vii) trained remote-control operation and site-approved safety rules; and (viii) a diesel baseline with comparable lease, fuel, maintenance, and utilization structure.
The 25-wagon observation should not be transferred to sites with steeper gradients, tighter curves, poorer adhesion, heavier wagons, higher acceleration requirements, or different braking distances. Likewise, the 24-month payback cannot be transferred without local installed cost, fuel and electricity prices, demand charges, maintenance, battery life, discount rate, tax, and residual value. The result is most relevant to bounded industrial yards with predictable charging access and similar operating tasks.
9.3. Post-Implementation Monitoring and KPI Recommendations
Post-implementation evaluation requires systematic recording of electric-locomotive operational data. PLC, HMI, and charging-system records can provide energy consumption per task, battery state of charge, charging time, task-cycle duration, operator commands, fault and alarm logs, and safety-function activations. These data can transform the case-study framework into a dynamic performance-management system.
Figure 11 presents the proposed cycle of data acquisition, analysis, action, and verification.
Table 18 translates that cycle into task-level KPIs covering charger-input energy, battery state, cycle and stage times, correction movements, traction conditions, safety activations, and maintenance work orders. These records are required before operator effects, confidence intervals, reliability trends, or realized total cost of ownership can be estimated reliably.
9.4. Limitations of the Study and Directions for Future Research
The study is limited by aggregate and heterogeneous source data. It does not provide a controlled experiment, sample size, statistical uncertainty for operational outcomes, task-level energy, measured traction resistance, complete total cost of ownership, long-term battery state of health, Scope 2 emissions, life-cycle impacts, or quantified OSH outcomes. These limitations define the evidentiary scope of the findings and the conditions under which they may be interpreted.
Future work should implement a matched repeated-measures protocol across operators, shifts, weather and rail conditions, wagon masses, and routes; meter charger input, battery-side energy, auxiliaries, and regenerative return; record drawbar force or motor current and speed; and reconstruct full discounted cash flows. The resulting dataset can support confidence intervals, mixed-effects models, task-normalized kWh and cost indicators, Scope 2 calculation, battery life-cycle assessment, and pre- and post-conversion exposure and safety analyses.
9.5. Implementation Roadmap and Management Implications
Successful battery-electric shunting implementation does not end with procurement and commissioning. Post-investment management requires continuous energy monitoring, updated operator training, maintenance planning centered on the battery and charging system, formal reporting of emission reductions, and periodic evaluation of OSH performance. Accordingly, implementation is both a technology project and a process-management project.
The roadmap in
Figure 12 identifies development of an integrated database as the first post-commissioning step. Energy consumption, charging time, duty cycles, operator assignments, maintenance records, and safety events should be collected within a common data framework. The second step is training, because electric traction, remote control, and quiet operation require operating practices that differ from diesel operation. Subsequent steps include KPI monitoring, maintenance and battery-health management, and carbon and OSH reporting.
From a managerial perspective, the transformation requires coordination among procurement, maintenance, production planning, logistics, environmental management, and OSH units. The locomotive’s economic performance cannot be optimized by the maintenance team alone; realized benefits may decline if shift schedules, wagon grouping, charging windows, and traffic priorities are not aligned. Likewise, sustainability value cannot be demonstrated unless Scope 1 reductions are reported, and safety performance may be weakened if remote-control procedures are not updated.
An annual performance report is therefore recommended. The report should combine total electricity consumption, number of tasks, tonnage moved, average cycle duration, maintenance cost, unplanned downtime, battery-health indicators, safety-function activations, near-miss records, and estimated Scope 1 carbon reduction. This reporting structure would allow the initial investment case to be compared with realized performance and would support future scaling decisions at similar facilities.
10. Conclusions
This study provides a facility-scale comparison of one leased diesel and one battery-electric shunting locomotive in the in-plant railway operations of the Seza Cement Plant. Its contribution is an integrated and evidence-bounded case record, not a new traction concept or a universally generalizable performance trial. Documentary, specification-based, calculated, operator-reported, and interpretive evidence are separated throughout the analysis.
The strongest quantitative findings are the documented diesel baseline: USD 10,000/month lease, approximately 1800 L/month diesel, and 21,600 L/year. Cross-checking two direct-combustion factors gives 58.0–58.1 t CO2/year. The approximately 24-month payback remains a plant-reported indicator; normalized sensitivity yields 16–36 months for paired ±20% installed-cost and net-savings cases, while a complete financial result still requires data on purchase and infrastructure costs, battery replacement, maintenance, demand charges, taxation, the discount rate, and residual value.
Operational results are descriptive. The complete 10-wagon weighing maneuver was reported as 7–9 min, the 20–40% task-time reduction range is an operator estimate without an archived repetition count, and 25 loaded wagons (approximately 1450 t) is a maximum documented movement rather than a manufacturer-rated capacity. The force-balance check shows that the latter requires total equivalent resistance below approximately 5.41 N/kN when 77 kN is used as an upper tractive-effort bound. Route-specific validation remains necessary.
The 80 V, 2000 Ah system provides 160 kWh nominal battery energy, but usable energy, charging losses, auxiliary demand, and regenerative recovery were not metered. The electric locomotive has no onboard combustion and therefore produces no local exhaust emissions at the point of use; Scope 2 and battery life-cycle emissions remain outside the quantified result. Safety conclusions are similarly bounded: SIL 2 remote-control functions, a deadman function, emergency-stop controls, camera support, lighting, a siren, and buffers provide layered risk-control capability, but no accident-rate or exposure reduction was measured.
Within these boundaries, the configuration is technically plausible for a bounded, low-speed, repetitive cement-plant duty cycle with sufficiently low route resistance, adequate charging access, and suitable operating procedures. Potential economic and operational value arises from avoided lease and diesel use, low-speed controllability, remote observation, and digital monitoring, but realized benefit depends on route, adhesion, scheduling, electricity tariff, maintenance, battery health, and operator competence.
Post-implementation validation should record matched cycle times, operators, wagon mass, route condition, correction count, charger input, state of charge, regenerative energy, alarms, maintenance, downtime, and safety events. These data are required before statistical productivity claims, full TCO, Scope 2 and life-cycle assessment results, or quantified OSH outcomes can be reported.
Accordingly, battery-electric shunting should be considered a conditional engineering and logistics option for facilities with comparable duty cycles rather than a universally superior replacement. The Seza Cement case provides the documented baseline, plausibility checks, sensitivity structure, and monitoring roadmap needed for a more rigorous longitudinal evaluation.