1. Introduction
Electrolyzers that use proton exchange membranes are essential to the development of technologies that produce hydrogen. These electrolyzers offer a method that is both environmentally friendly and capable of meeting the demands for energy on a worldwide scale. These components are vital to the operation of renewable energy systems because of their capacity to function at high efficiency while having a low impact on the environment. Nevertheless, achieving optimal performance and operational stability of proton exchange membrane electrolyzers is a multidimensional task that requires innovations in the design of systems, the development of materials, and the implementation of operational methods. There is an additional layer of complexity added by the response of these systems under different conditions, which calls for the implementation of advanced strategies in order to improve performance. In recent years, a great number of studies have been conducted to investigate these problems, with the primary focus being on the development of novel materials, modeling methodologies, and hybrid systems in order to maximize the performance of proton exchange membrane electrolyzers.
1.1. Physical and Mechanism-Based Modeling and Experimental Optimization of PEMEs
Wang et al. [
1] studied the impact of the electrodeposition technique on Pt coating layers on Ti felt-based porous transport layers and proton exchange membrane electrolyzer (PEME) cells’ performance. They found that optimized Pt coating maximizes performance by improving the PTL/catalyst layer interface. High Pt coating led to lower cell performance due to increased mass-transfer resistance and restricted flow. To address this, water channels were constructed via laser ablation, reducing mass-transfer overpotential by over 40%. Aging tests confirmed the PEME cells’ durability, highlighting the positive effect of the Pt coating. Khan et al. [
2] developed a hybrid system that combines a PEME and loop heat pipe–photovoltaic thermal to produce hydrogen, oxygen, electricity, and heat. The system was compared to a conventional system, which was a direct grid-connected PEME. The study examined factors affecting oxygen and hydrogen production, internal voltage drops, and the loop heat pipe–photovoltaic thermal system. The results showed that the hybrid system showed a 6.31% higher production rate of hydrogen and oxygen compared to the conventional system. The new model also addresses some issues and provides a more stable solution for operating in dark or lower solar radiation. The economic analysis suggests the hybrid model is more cost-effective in the end. Wang et al. [
3] created a 3D multi-physics model to predict the correlation between component designs and critical parameters of PEME cells. The model revealed that water saturation and current density distribution were not evenly distributed, influenced by anode bipolar plates, porous transport layers, and proton exchange membranes’ thickness. Wide bipolar plate’s lands can cause local dehydration and current density drop, while thinner proton exchange membranes can lead to poor water and current density distribution, but improved cell performance.
Sun et al. [
4] developed a new hydrogen production and hot standby dual-mode system using thermal energy storage based on phase change material. The system aims for fast start-up and slow degradation, with the electrolyzer’s temperature maintained during hot standby mode. The system’s efficiency improved through waste heat recovery and utilization. The electrolyzer with a capacity of 397.2 Nm
3/h reduced start-up time by up to 785 s and voltage overshoot by 23.91% compared to cold start. The system achieved an efficiency of 58.86% using a higher melting point phase change material. Kimmel et al. [
5] developed a segmented bipolar plate for in situ diagnostics in a 25 cm
2 active area of proton exchange membrane water electrolysis. The segmented bipolar plate allowed for local measurements of current and temperature, revealing clamping pressure due to uneven torque forces during cell assembly. It also showed local current differences up to 80% when limiting water flow in the catalyst-coated membrane. The segmented bipolar plate also showed nonuniform mass transport phenomena due to flow field design and local degradation due to contaminants, confirmed by energy-dispersive X-ray spectroscopy. This versatile and robust tool demonstrated its superior value for diagnostics in proton exchange membrane water electrolysis systems. He et al. [
6] developed a three-dimensional model to study the impact of various factors on electrolyzers’ dynamic response. They found that linear and multi-step loading strategies could significantly mitigate overshoot. The flow field structure also showed excellent dynamic response performance. The loading magnitude had a greater effect than temperature, flow field structure, and anode porous transport layer porosity. Under combined variable load conditions, a single-serpentine flow field showed benefits in dynamic response and energy dissipation. Yang et al. [
7] developed a new optimal scheduling method that optimizes electrolyzer operational details using power forecasting and a multi-objective weighted rolling algorithm. The method significantly increased hydrogen production by 4.49% and 4.47% compared to simple start–stop and rotation strategies, and significantly reduced the number of switching actions by 53.92% and 54.37%, demonstrating its effectiveness in enhancing system performance.
Xu et al. [
8] created a three-dimensional multi-physics model analyzing mass and heat transfer, fluid flow, hydrogen crossover, and electrochemical reactions. They conducted transient simulations and analyzed critical parameters’ responses to fluctuation. The results showed a 15-second delay in temperature response, overshoot phenomena for oxygen concentration and voltage, and a sharp rise in hydrogen crossover when current density decreased abruptly. Xu et al. [
9] created a two-dimensional model of a proton exchange membrane water electrolyzer using an agglomerate model. They investigated the effects of catalyst layer composition, porous transport layer material properties, and operating conditions on proton exchange membrane water electrolyzer performance. The results showed that a small size of catalyst agglomerate improved proton exchange membrane water electrolyzer performance. However, increasing catalyst layer loading, porosity, and ionomer volume fraction led to high mass-transfer resistance, limiting performance. The optimal porous transport layer temperature was 353.15 K. The study provides valuable guidance for optimizing high-performance proton exchange membrane water electrolyzer design. Wang et al. [
10] studied the impact of a cathode microporous layer on water transport, hydrogen permeation, and cell performance in a proton exchange membrane water electrolyzer. They found that adding a microporous layer between the catalyst layer and the porous transport layer reduces interfacial contact resistance by 60%, leading to superior performance. The wettability of the microporous layer is crucial for water transport and hydrogen permeation in proton exchange membrane water electrolyzers. The hydrophobic microporous layer enhances water and hydrogen crossover, exceeding the technical safety criterion. The hydrophilic microporous layer with Nafion ionomers facilitates efficient water and hydrogen removal, resulting in low hydrogen crossover. Wang et al. [
11] created nonprecious metal-filled Pt-based coatings on TA1 using magnetron sputtering. The thinner coatings reduced Pt usage to 0.051 mg cm
2, enhancing electronic transmission capabilities. The coating’s dense oxides ensured excellent corrosion resistance. After 48 hours, the coating reduced the interfacial contact resistance of the Ti plate and reduced Ti ion dissolution in the corrosive solution. This innovative coating strategy minimizes the cost of proton exchange membrane water electrolyzer bipolar plates.
1.2. Machine Learning and Data-Driven Applications in PEME Systems
The optimization of the design of PEMEs, as well as their operational efficiency and longevity, presents a number of difficult issues. In order to address these issues, it is necessary to develop novel ways that include sophisticated modeling, data analysis, and optimization strategies for the system. Enhanced prediction, control, and optimization of PEME performance under variable conditions have been made possible by recent breakthroughs in machine learning, which have presented potential tools to address these difficulties. As will be discussed in the following sections, certain studies have utilized machine learning approaches in order to address particular features of these systems.
Wang et al. [
12] developed a data-driven workflow using artificial neural networks (ANNs) to predict dynamic voltage in a 10 kW level alkaline water electrolysis test system. The workflow includes automated processes for data importing, cleaning, ANN architecture optimization, model training, and voltage prediction. The model achieved an impressive accuracy of over 98% across four dynamic operation types. This ANN-based workflow offered a versatile framework for precise voltage prediction under dynamic operations. Zhao et al. [
13] developed a capacity optimization method to meet user demand in impoverished meteorological conditions. They determined optimal efficiency and operating conditions for an electrolyzer using an ANN. They designed a multi-objective energy dispatch strategy considering low-cost and long-life operations. This strategy increased daily dispatching costs by 0.055 but reduced electrolyzer volatility by 49%, promoting sustainable operation. It also reduced electrolyzer capacity by 17.5% by suppressing power fluctuations.
Mütter et al. [
14] used an ANN and algorithm-based optimization to reduce the number of expensive experiments needed to find suitable operating parameters. They trained an ANN with data from a complex multi-physics model and used a Bayesian hyperparameter-tuning algorithm instead of manual fine-tuning. Nested k-fold cross-validation was implemented to avoid over-fitting and ensure model consistency. The ANN achieved an increased prediction speed of over three orders of magnitude, with minimal decreases in accuracy. Genetic algorithm optimization produced consistent results close to the global optimum and provided alternative solutions with different gas compositions at high power. The validity of the genetic algorithm solutions is supported by a sensitivity analysis for the most promising solid oxide fuel cells’ operating case. Chen et al. [
15] developed a new framework called Knowledge-integrated Machine Learning to improve proton exchange membrane water electrolysis development. The framework aimed to address challenges in proton exchange membrane water electrolysis performance by incorporating data-driven models with domain-specific insights. The framework, called the “Ladder of Knowledge-integrated Machine Learning,” was applied to three case studies in cell degradation analysis, demonstrating improvements in interpolation accuracy, robustness in extrapolation, and enriched information representation, supporting autonomous knowledge discovery.
Hayatzadeh et al. [
16] used machine learning algorithms to analyze the impact of factors on commercial polymer exchange membrane water electrolyzers and their degradation. They examined the effects of temperature on three anode catalysts, pore diameter in the transport layer, and different anode catalyst loadings on cell potential performance. The study found that support vector regression and ANN can achieve prediction accuracy comparable to that of an ANN with a fully connected architecture. The results suggest that polymer exchange membrane water electrolyzers can be operated under conditions that improve performance and life time, leading to cost reduction in hydrogen production. Cho et al. [
17] developed an ANN model and integrated it with model predictive control to optimize the proton exchange membrane fuel cells’ system under different current load changes. The model was validated with a maximum relative error of 2.30% and trained using the non-linear autoregressive network with exogenous inputs. The neural network model predictive control provided optimal operating temperature and pressure for the proton exchange membrane fuel cell model at 10 s intervals. The neural network model predictive control improved system power by maintaining optimal stack temperature, cathode pressure, and membrane hydration. Mohamed et al. [
18] proposed two machine learning approaches to predict hydrogen production rate and cell current density for PEME cells based on design parameters. They trained and tested five machine learning models, including ANNs, polynomial regression, support vector machine regressor, K-nearest neighbor regressor, and decision tree regressor. The study found that Nafion115 and Nafion117 were the highest activation materials for current density. The ANN model showed the best performance, with minimal error values, indicating that the proposed methods can reduce the cost, effort, and time required for PEME cell fabrication. Bonab et al. [
19] developed five machine learning models to predict the cell potential of proton exchange membrane water electrolyzers. The Cascade-Forward Neural Network model accurately predicted cell potential with 99.998% accuracy. It had a relative error of less than 0.65% and an absolute error below 0.01 V, making it suitable for green hydrogen production monitoring and design.
1.3. Universal Research Gaps and Bottlenecks
Nonetheless, despite these achievements, some critical concerns remain insufficiently addressed in the existing research environment. A primary problem is the precise forecasting of PEME performance under real-world operating situations, where variable power inputs and changing environmental elements create uncertainties that conventional models fail to address. Moreover, although machine learning methodologies have robust predictive abilities, their generalizability across various PEME designs, materials, and operational contexts remains a worry, necessitating additional validation and standardization. A significant concern is the interpretability of machine learning models; some black-box methodologies yield extremely accurate predictions yet fail to elucidate the fundamental physical and electrochemical processes involved. This constrains its implementation in real situations where comprehending the causal links between input parameters and system performance is essential. Moreover, the integration of real-time monitoring data with machine-learning-based control techniques is a difficulty, as it is crucial to attain both rapid computing efficiency and strong flexibility to changing conditions for effective implementation. Bridging these gaps necessitates interdisciplinary collaboration that integrates modern machine learning techniques with expertise in electrochemistry, material science, and control engineering to provide more dependable, interpretable, and broadly applicable solutions for PEME optimization.
1.4. Scope and Novelty of the Proposed Work
The literature on PEMEs has primarily concentrated on improving material qualities, system designs, and operational tactics to augment performance, efficiency, and durability. Research has investigated diverse methodologies, encompassing experimental procedures, hybrid system integrations, and the formulation of intricate multi-physics models. These initiatives seek to enhance essential metrics such as current density distribution, water transport, and hydrogen production rates while tackling issues such as mass-transfer resistance, dynamic responsiveness to fluctuating conditions, and system deterioration. Recent improvements have integrated machine learning approaches, facilitating accurate predictions, optimization of operating parameters, and a decrease in experimental costs. The application of ANNs and other machine learning models has significantly enhanced prediction accuracy, offered strong optimization frameworks, and enabled knowledge discovery in PEME systems. Notwithstanding these gains, the principal emphasis has been on utilizing machine learning technologies for particular facets of system performance, including voltage prediction, degradation analysis, and capacity optimization. This study seeks to fill a significant gap in the literature by creating an integrative framework that comprehensively encapsulates the interactions among design, operational, and material characteristics in PEMEs through sophisticated machine learning approaches. This research adopts a complete strategy, utilizing machine learning for predictive analytics, system optimization, and improved generalizability, in contrast to previous studies that mostly concentrate on isolated metrics or specific operating circumstances. This study addresses a gap, offering a new approach to enhance the design and operating strategies of PEMEs, hence facilitating their effective and sustainable implementation in hydrogen production systems.
In the broader context of electrochemical system modeling, recent advances such as digital twins and physics informed neural networks (PINNs) are significantly reshaping the research landscape by integrating real-time data with fundamental physical laws. Furthermore, the implementation of uncertainty quantification and explainable artificial intelligence (XAI) is becoming increasingly vital to ensure that predictive models are not only accurate but also interpretable and reliable for industrial deployment. While the current work primarily focuses on a modular MLP framework, it is strategically aligned with these emerging trends by serving as an informed computer surrogate that bridges the gap between deterministic mathematical models and data-driven analytics. By establishing a high-fidelity predictive baseline, the proposed methodology provides the computational foundation necessary for the future development of comprehensive hybrid physics data-driven models and digital twin architectures for PEMEs.
Compared to existing machine learning applications in the PEME literature, which often rely on single-model architectures for isolated outputs such as voltage or degradation rate, this study introduces a dual-modular integrative framework. While conventional approaches treat the electrolyzer as a monolithic black-box, the proposed methodology explicitly distinguishes between thermal-kinetic and pressure-dependent electrochemical dynamics by developing two specialized ANN architectures. Methodologically, this work goes beyond the basic application of multi-layer perceptron (MLP) models by reconciling theoretical electrochemical modules (anode, cathode, and membrane) with data-driven predictors, thereby functioning as an ‘informed computer surrogate’ rather than an opaque predictive tool. This approach ensures that the high-fidelity results are grounded in the physical interplay of system parameters, providing a scalable benchmark that enhances both interpretability and predictive depth beyond standard regression-based MLP implementations.
The primary aim of this work is to reconcile theoretical PEME modeling with data-driven machine learning methodologies.
Section 2 offers a comprehensive analysis of the physical and electrochemical mechanisms that regulate PEME cell functionality, delineating the critical system factors that affect performance. The parameters (current density, temperature, pressure, and voltage) constitute the fundamental inputs and outputs for the machine learning models established in
Section 3. Within this paradigm, the ANN models function as computer surrogates for the intricate physical processes delineated in
Section 2, providing prediction capabilities that augment and refine conventional mathematical modeling methodologies. The systematic approach guarantees that the machine learning models function as informed predictors rather than opaque black boxes, utilizing essential domain information. This study integrates physics-based and data-driven approaches to provide a comprehensive framework that uses machine learning to enhance the modeling of PEME systems, therefore improving accuracy, efficiency, and practical application.
2. Modeling of the PEME Cell
In this study, the foundational dataset is obtained from a high-fidelity numerical simulation model developed by Abhishek et al. [
20]. This source model, which serves as the ground truth for machine learning training, is structured into four primary interconnected modules: anode, cathode, membrane, and stack voltage. The anode module calculates oxygen and water partial pressures and flow rates, while the cathode module is utilized to compute hydrogen production dynamics. The membrane module simulates complex water-transport phenomena, including electroosmotic drag and diffusion, based on empirical data from Nafion 117 membranes. The final stack voltage is determined by integrating the Nernst potential with activation, concentration, and both electronic and ionic ohmic overpotentials. The data instances are generated through dynamic simulations involving step changes in load current (ranging from 15 A to 40 A) and covering broad operational envelopes, including temperatures from 280 K to 363 K and pressures from 1 atm up to 200 atm. The physical reliability of the 136 extracted instances is reinforced by the fact that the source model was validated against experimental literature data, achieving a Root Mean Squared Error (RMSE) of 0.012. By focusing on these high-precision computational signals rather than generic structural descriptions, the developed ANN models function as informed computer surrogates that accurately reflect the non-linear electrochemical kinetics of the PEME system.
To establish a clear physical connection between the data-driven framework and the underlying electrochemical system, the baseline dataset was synthesized from the validated PEME dynamic model established by Abhishek et al. [
20]. The operating potential of a single PEME cell (V
cell) is calculated as the sum of the reversible cell voltage (V
rev) and the activation and ohmic overpotentials [
20]:
The activation overpotential (V
act), representing the kinetic losses at the electrode-electrolyte interfaces, is defined according to the Butler–Volmer formulation [
20]:
The ohmic overpotential (V
ohm), accounting for the ionic resistance of the proton exchange membrane and the electronic resistance of the cell components, is given by Ohm’s law [
20]:
where T is the stack operating temperature (K), i is the current density (A/cm
2), R is the universal gas constant, F is Faraday’s constant, α is the charge-transfer coefficient, i
0 is the exchange current density, and Rinternal is the internal area-specific resistance (Ω·cm
2). All operational boundaries, variable symbols, measurement ranges, and physical units corresponding to these governing equations are summarized in
Table 1.
The baseline simulation model from which the training data is derived incorporates several core physical assumptions to maintain computational efficiency while preserving accuracy. It is assumed that the physical properties within both the anode and cathode flow channels are uniformly distributed. The mass-transfer dynamics across the inlet and outlet control surfaces are governed by the standard nozzle flow rate equation, which establishes a deterministic boundary condition based on pressure differentials and temperature. Furthermore, the electrochemical reactions at the catalyst layer are assumed to follow macroscopic mass and species conservation laws, linking gas generation rates directly to the applied load current. These boundary conditions and assumptions ensure that the data points represent stable electrochemical states suitable for high-fidelity neural network mapping. The variables utilized as inputs (temperature, pressure, and current) and outputs (stack voltage and overpotentials) are physically defined as global stack parameters, functioning as the primary indicators of electrolyzer performance within the specified operational boundaries.
3. Machine Learning System Modeling
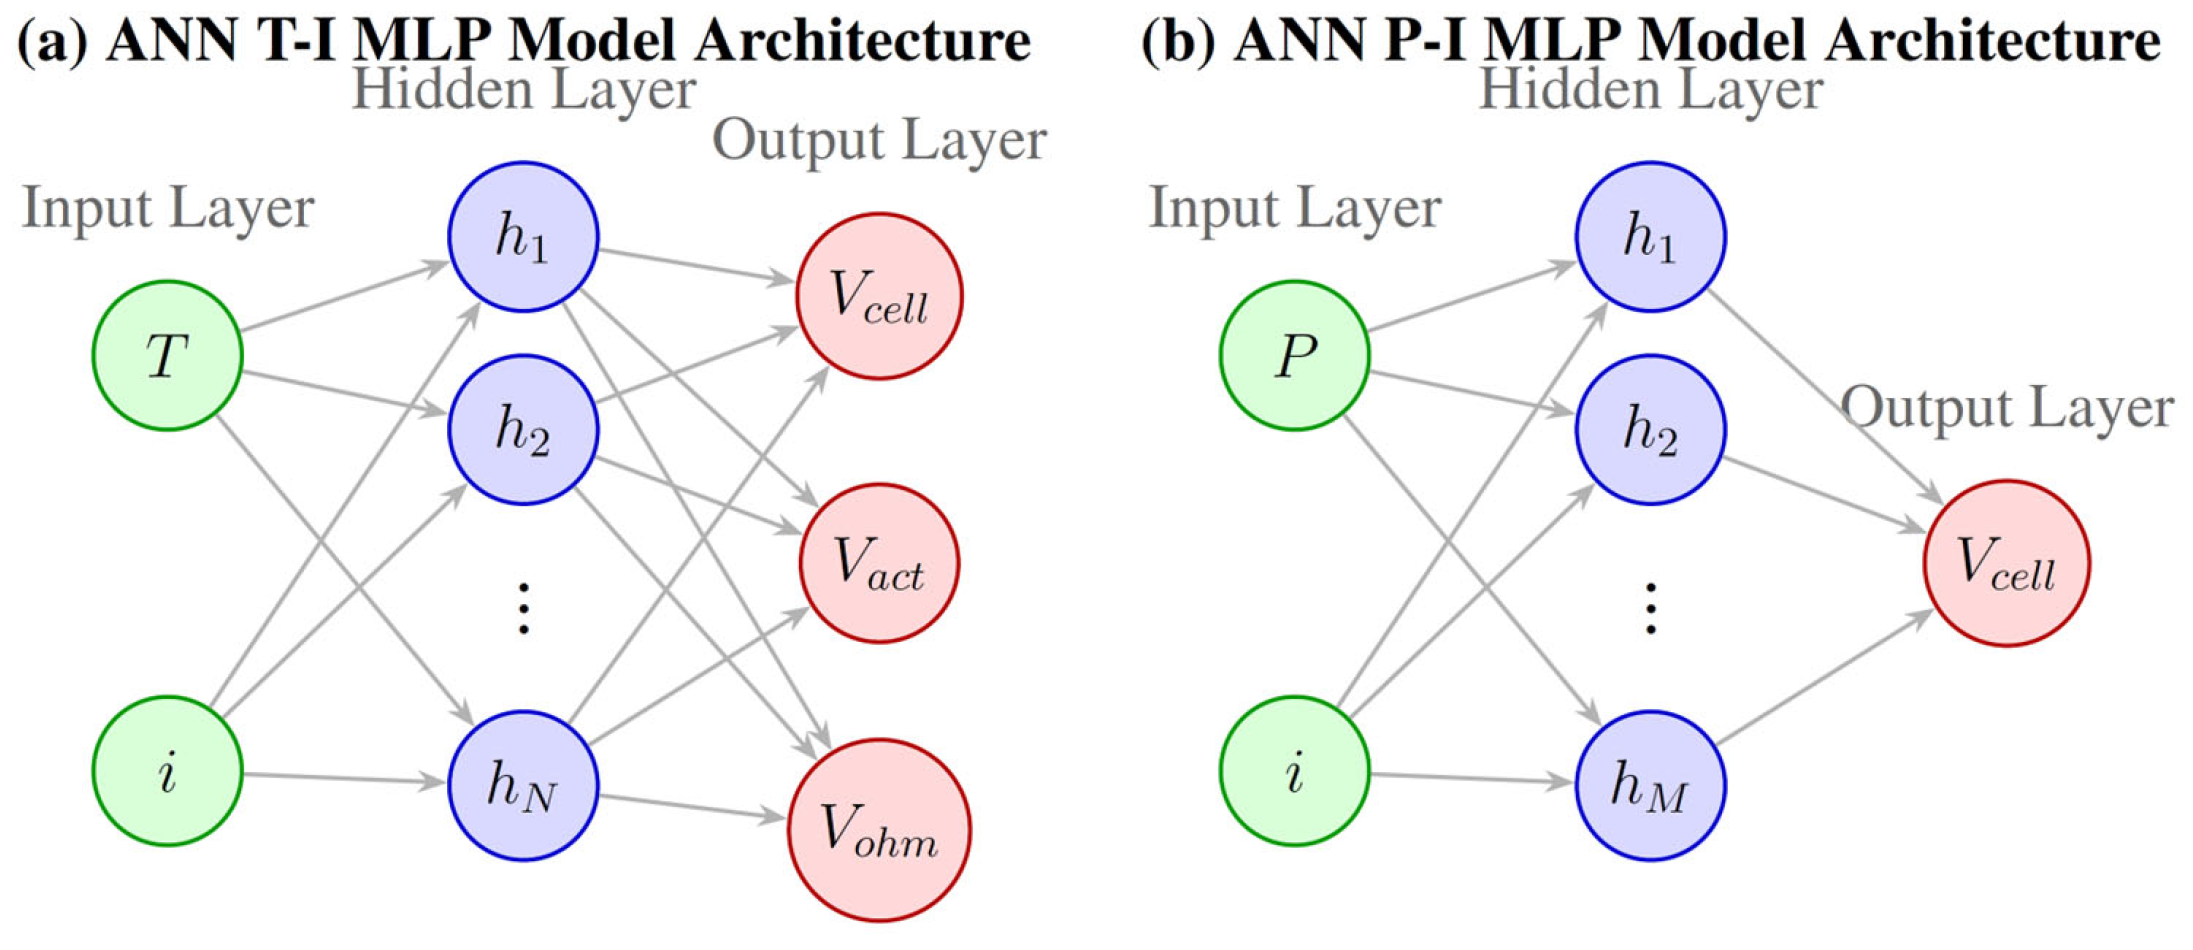
In this study, two independent ANN architectures were designed and implemented to predict the performance dynamics of PEME systems. ANNs are recognized for their superior accuracy in modeling intricate and non-linear electrochemical processes, outperforming conventional mathematical techniques through their ability to learn complex patterns within datasets. To ensure specialized predictive capability, the models are distinguished by their operational inputs and internal topologies. The T-I MLP Model is designed to estimate cell voltage, activation overvoltage, and ohmic overvoltage based on thermal and current inputs. Conversely, the P-I MLP Model focuses on predicting cell overvoltage using operating pressure and load current as input parameters. These networks feature independent structural designs, with hidden layer neuron counts of 15 and 13, respectively. This architectural differentiation ensures that each model is custom-tailored to capture the unique electrochemical kinetics of its respective domain, functioning as a high-fidelity computational surrogate for PEME performance assessment.
Details of these configurations are visually represented in
Figure 1. This figure provides a comprehensive overview of the developed MLP models, highlighting their structural differences and input–output mappings.
The effective grouping and partitioning of datasets play a pivotal role in the development of robust ANN models, as these steps significantly influence the accuracy and generalizability of the resulting predictions [
21]. For the ANN models developed in this study, a dataset comprising 136 instances was utilized. The dataset was systematically divided into three subsets: 70% of the data was allocated for training the models, 15% was reserved for validation to monitor and fine-tune the learning process, and the remaining 15% was used for testing to assess the models’ predictive capabilities. The detailed characteristics of the datasets used for both ANN models are presented in
Table 2.
To quantitatively evaluate whether the data-partitioning process preserved the underlying statistical characteristics of the original dataset, a comprehensive descriptive statistical analysis was conducted. The sample sizes (N), mean values, standard deviations (Std. Dev.), minimum (Min), and maximum (Max) values were calculated for all input variables, target outputs, and network predictions across the full dataset, as well as the training, validation, and testing subsets. Due to the extensive size of these detailed metrics across both ANN models, the complete quantitative results are provided in the
Supplementary Materials (
Table S1 for the T-I MLP Model and
Table S2 for the P-I MLP Model). As indicated by these metrics, the mean and standard deviation values across the subsets show strong alignment with those of the full dataset, mathematically proving the statistical consistency of the data split. Furthermore, the extreme values (Min/Max) and distribution metrics of the network predictions closely match the target values, confirming that the developed models operate reliably across the entire data domain without statistical bias.
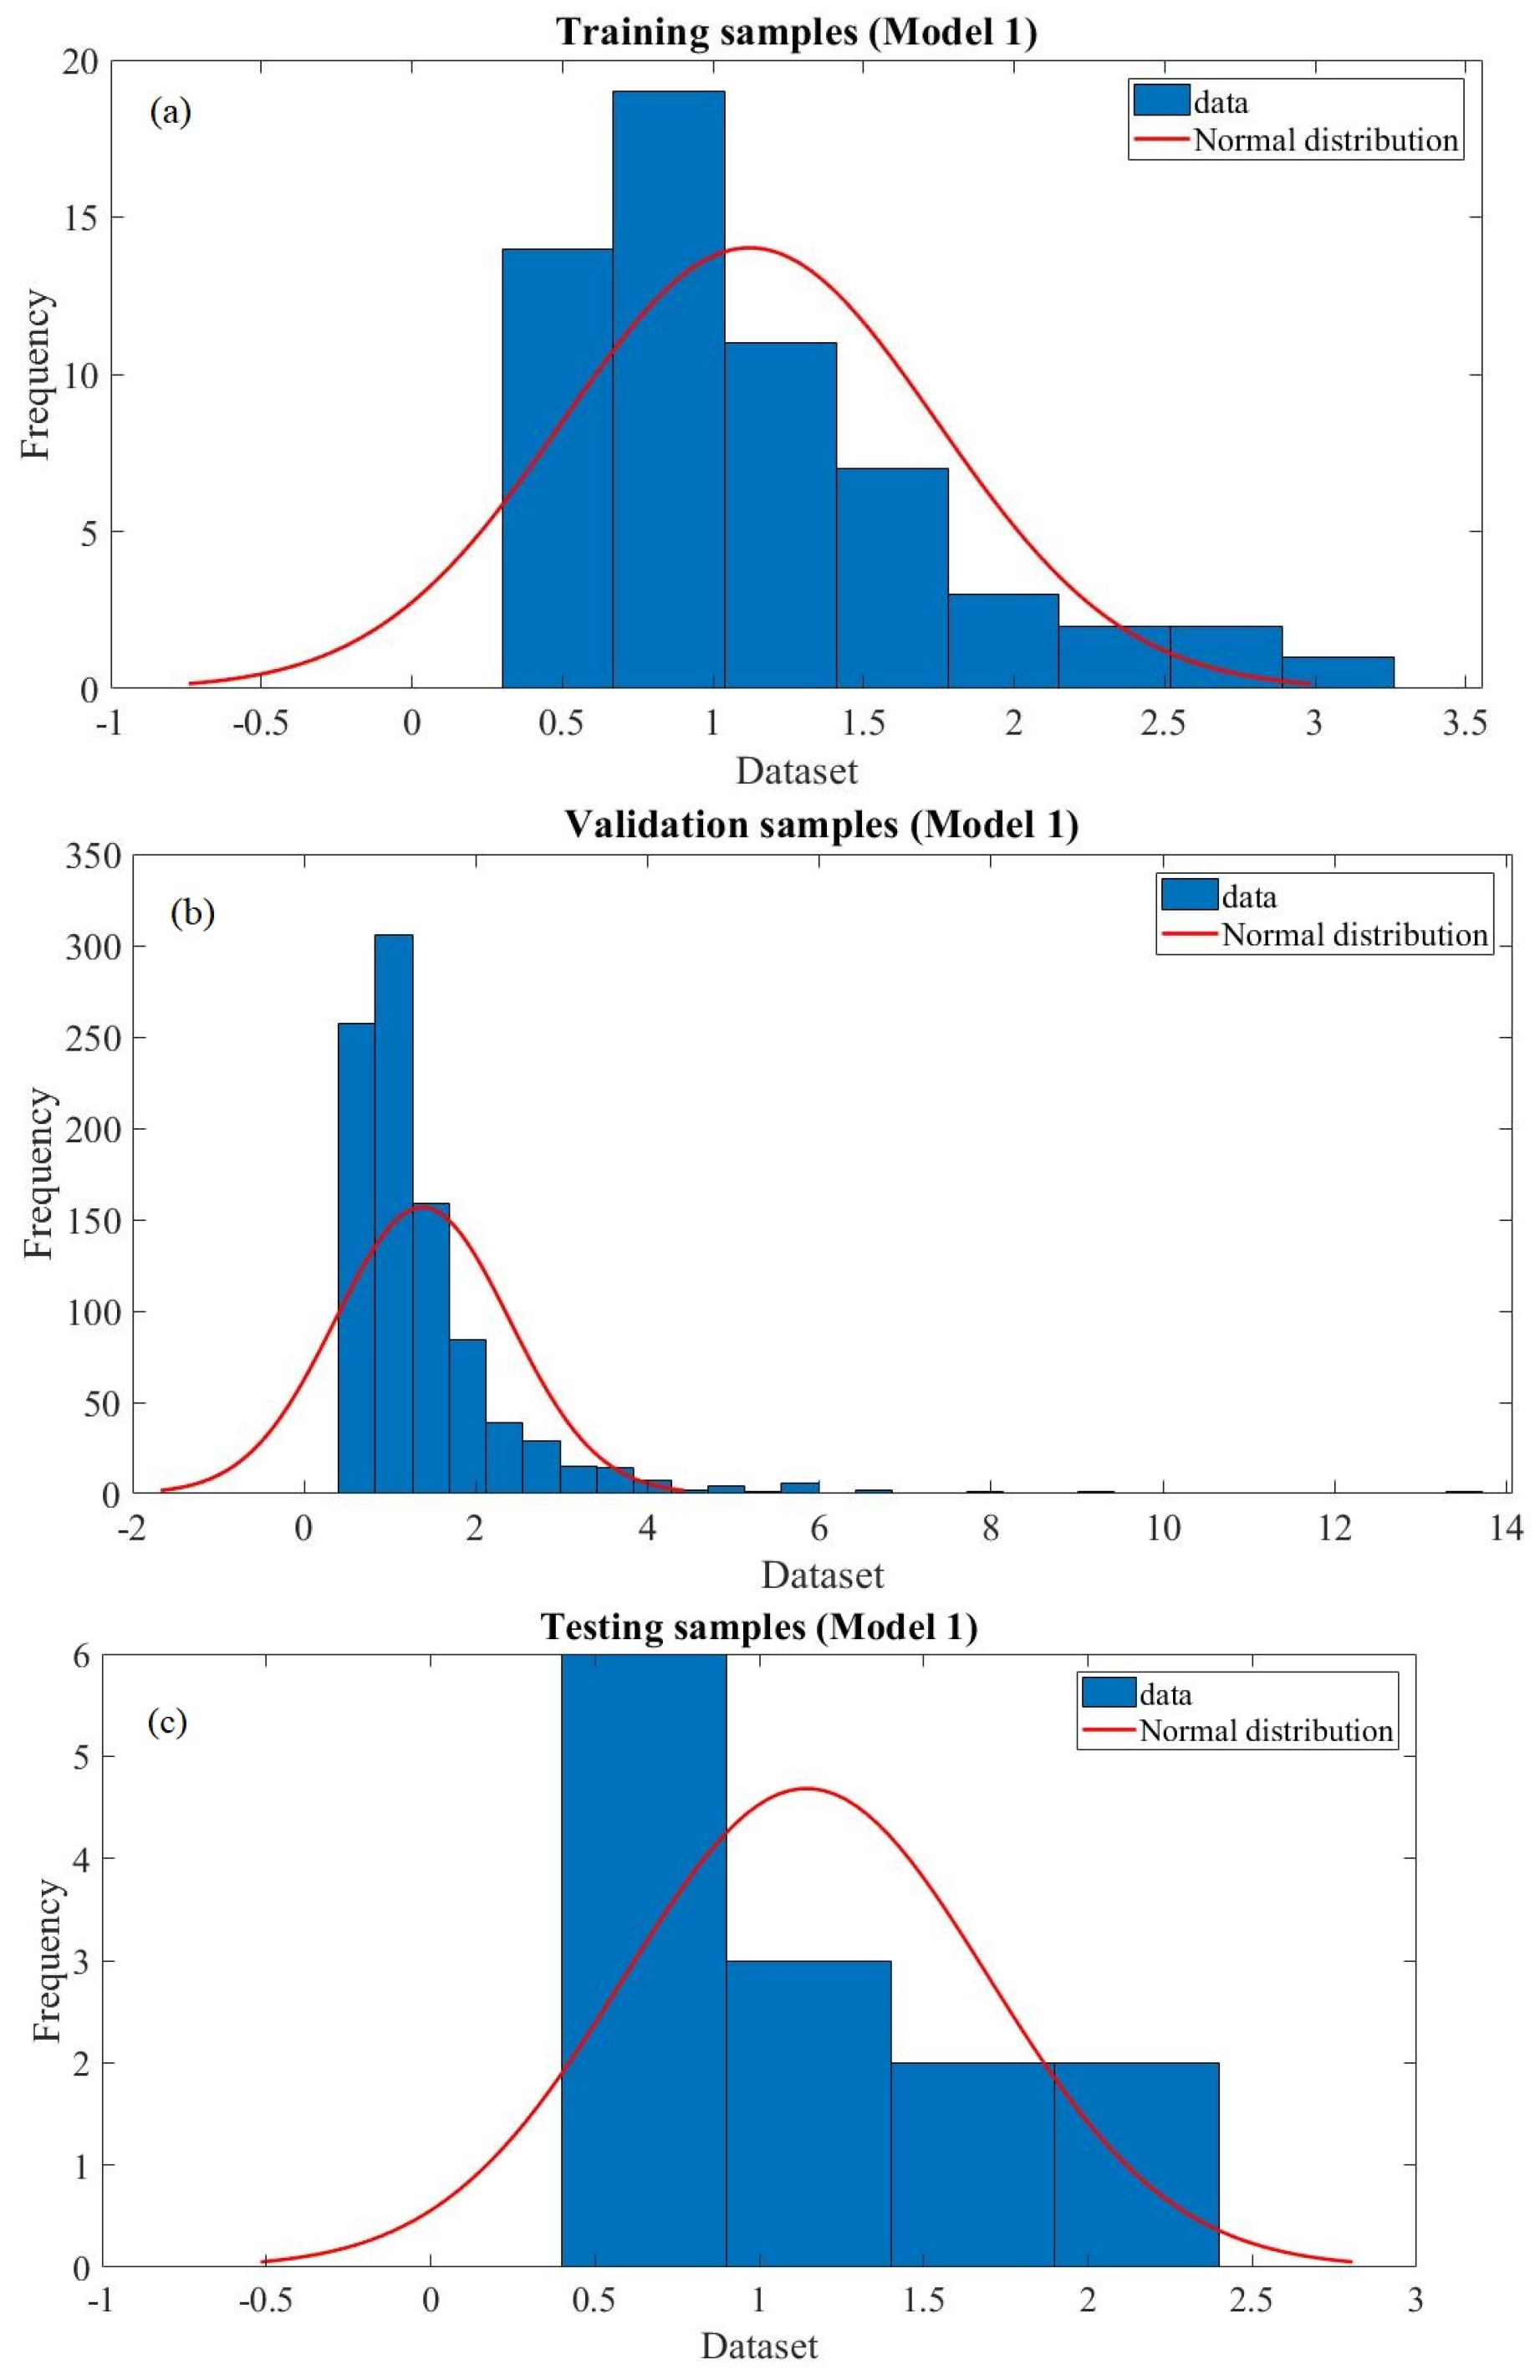
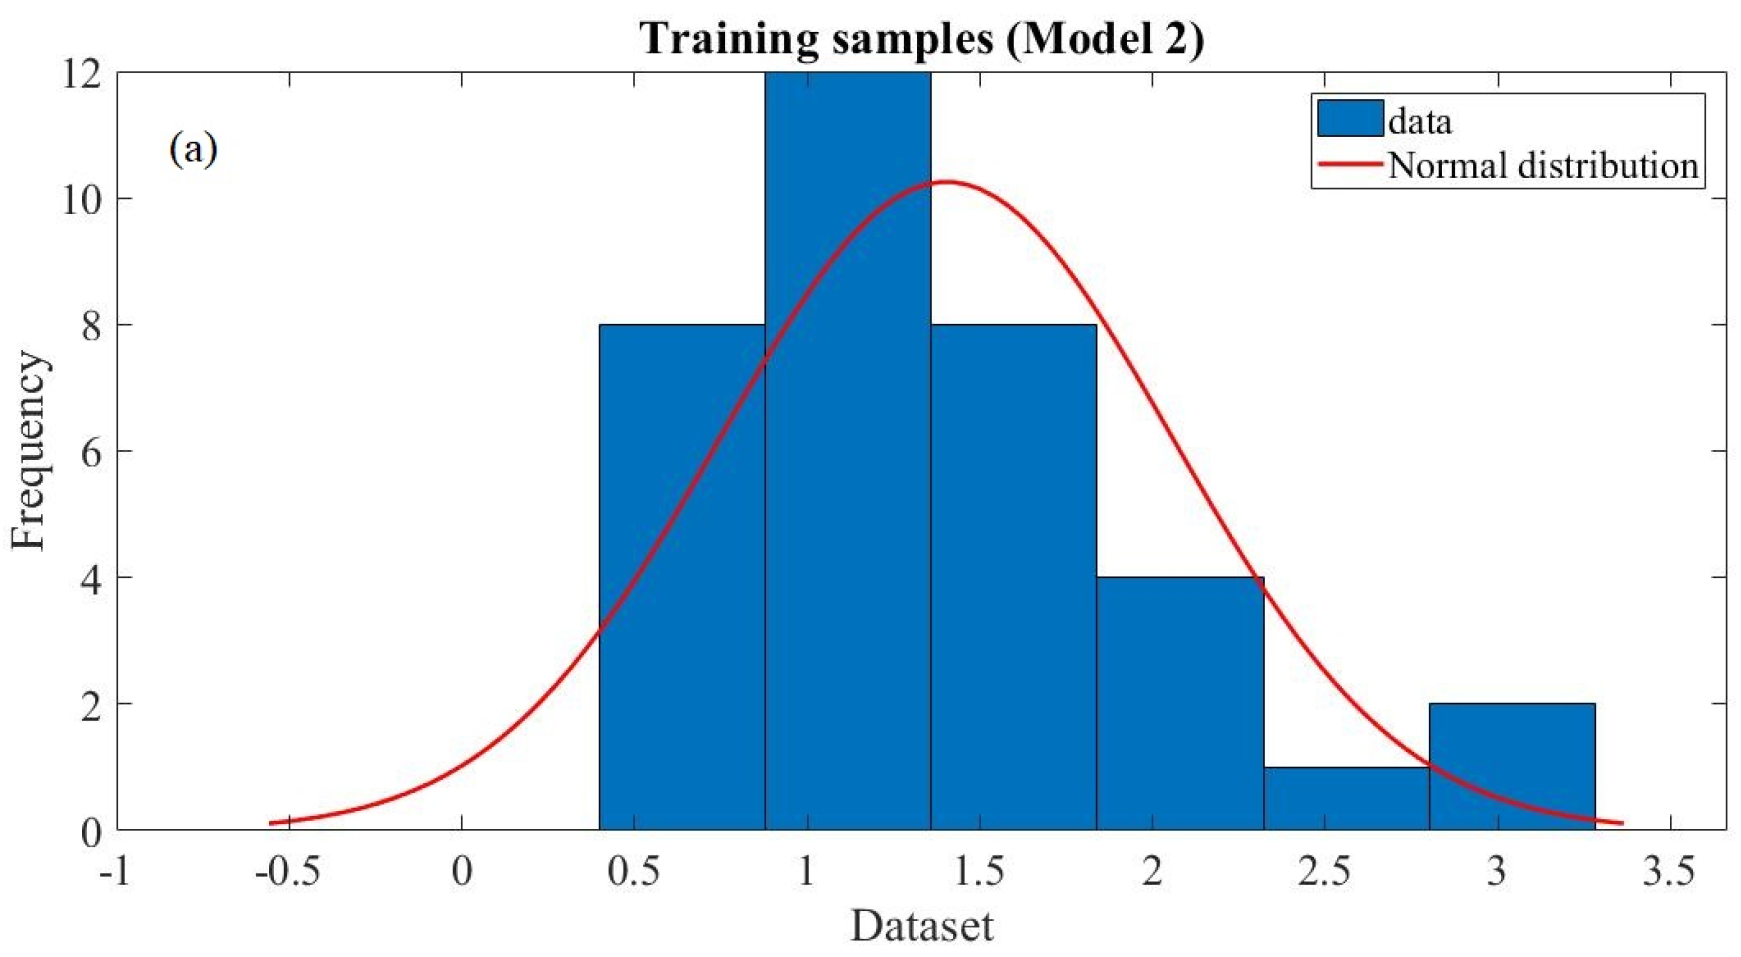
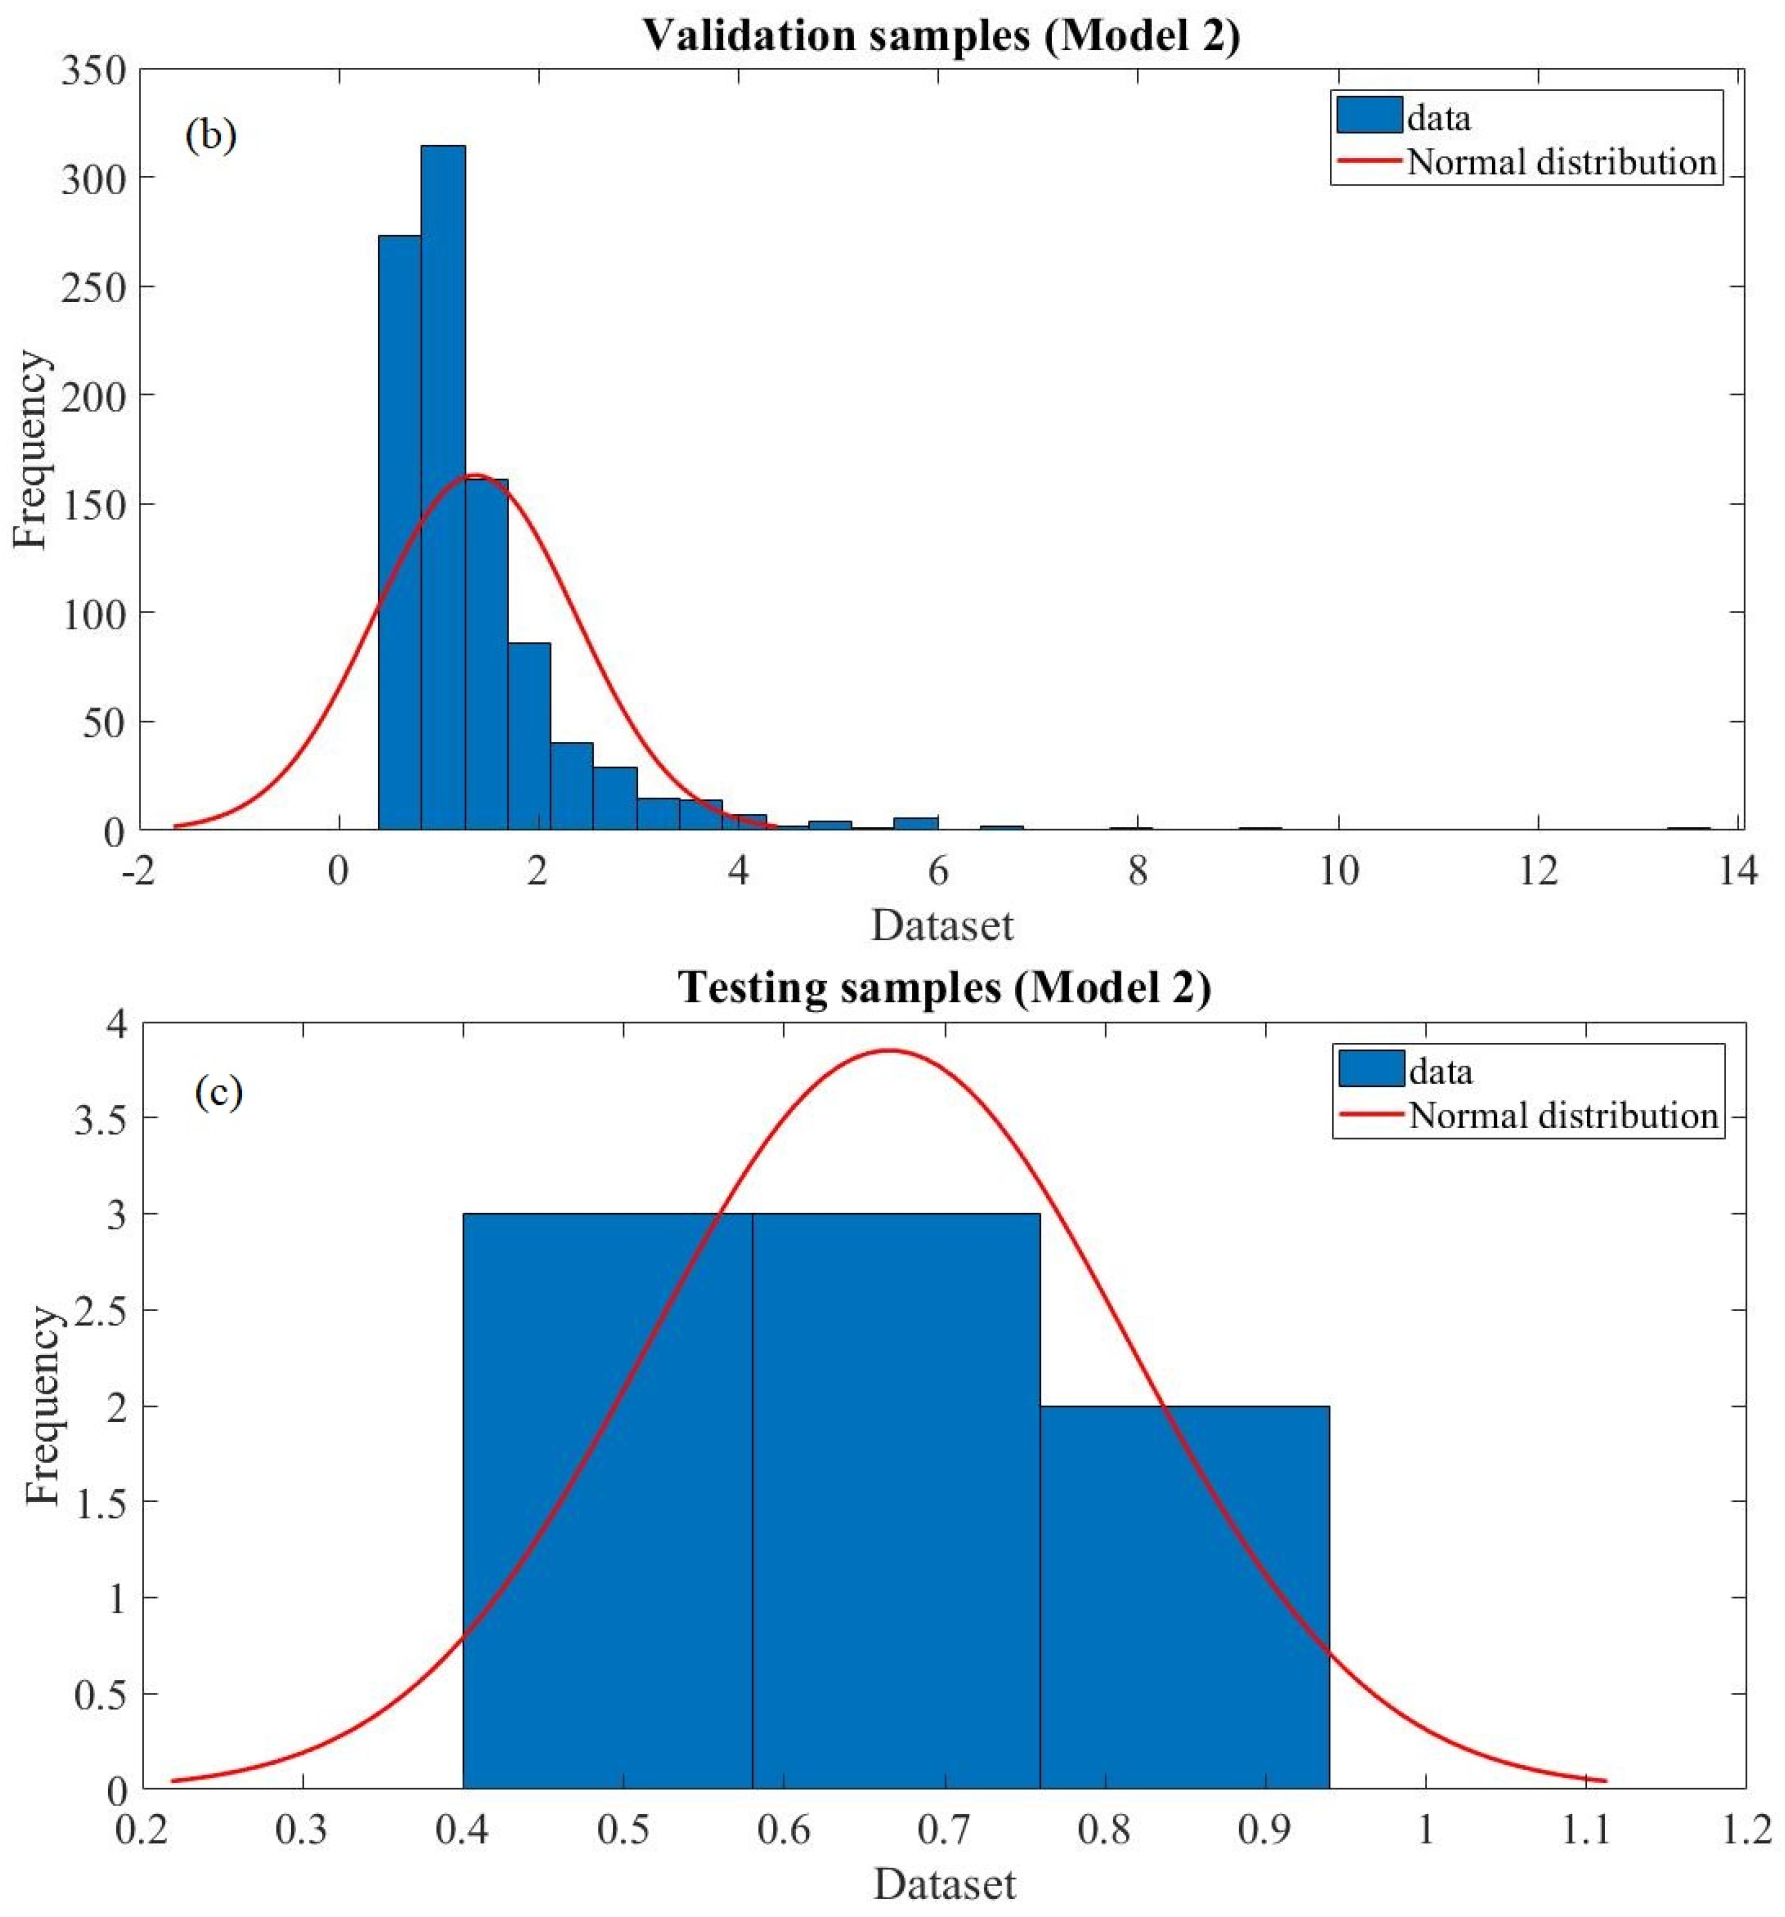
Figure 2 and
Figure 3 show the distributions of basic input features among the training, validation and test sets of the developed ANN models. Here, the distributions of input features are compared using frequency histograms. The figures show that the partitioning process preserves the statistical properties of the original dataset by maintaining similar distributions for the training, validation and test subsets. This indicates that the developed models are well represented and compatible with a generalizable dataset. Moreover, it is also verified that the diversity of data points in each subset is preserved and subset allocation is random.
To rigorously evaluate the empirical distribution profiles of the operational parameters, statistical normality tests (Lilliefors/Shapiro–Wilk) were performed across all input and target features. The results confirmed that key independent and dependent parameters exhibit statistically significant deviations from a standard normal distribution (
p < 0.05). Specifically, in the T-I MLP dataset (N = 85), temperature (T, stat = 0.1590,
p = 0.0010) and activation loss (V
act, stat = 0.1066,
p = 0.0183) displayed significant departure from normality, while current density (i,
p = 0.1260), stack voltage (V,
p = 0.5000), and ohmic loss (V
ohm,
p = 0.1879) aligned relatively closer to Gaussian profiles. Similarly, in the P-I MLP dataset (N = 51), pressure (P, stat = 0.3918,
p = 0.0010) deviated sharply from normality, whereas current (I,
p = 0.4594) and stack voltage (V,
p = 0.1177) exhibited moderate symmetry. Because MLP architectures are non-parametric statistical learning algorithms, strict Gaussian normality of input–output spaces is not a requisite constraint for high-fidelity mapping. Therefore, the normal distribution curves overlaid on the dataset histograms in
Figure 2 and
Figure 3 do not denote a mathematical curve-fitting objective or an implicit parametric assumption. Instead, they function strictly as a standardized visual reference baseline to highlight skewness, modal density, and empirical kurtosis. Furthermore, overlaying this identical reference across the partitioned training, validation, and test subsets visually validates that the random data split preserved the underlying non-normal profile uniformly without introducing sampling bias.
While the dataset utilized in this study comprises 136 instances, it is noted that this volume is consistent with high-fidelity computational surrogate modeling requirements where data is derived from validated physical models. To rigorously mitigate the risk of overfitting associated with smaller datasets, a three-way random partitioning strategy (70% training, 15% validation, and 15% testing) was strictly implemented. The inclusion of a dedicated validation set ensured that the network parameters were optimized based on error convergence rather than memorization. Furthermore, the high correlation coefficients and low Mean Squared Error (MSE) values achieved across both models indicate that the ANN architectures successfully captured the underlying electrochemical patterns without overfitting the training samples.
Determining the optimal number of neurons in the hidden layer of MLP networks poses a significant challenge in ANN development, as no universally accepted or systematic method exists for this purpose. This challenge introduces a degree of uncertainty that often complicates the design process. To address this issue, a strategy commonly employed in the literature was adopted. Multiple network models were constructed, each with a varying number of neurons in the hidden layer, and their performance was meticulously evaluated. Following a comprehensive comparative analysis of these models, those with 15 and 13 neurons in their respective hidden layers were identified as the most effective configurations, based on their superior performance metrics. These configurations were ultimately selected for the final ANN models to ensure optimal predictive accuracy and computational efficiency.
To facilitate the non-linear mapping of input data to output predictions, distinct transfer functions were employed within the ANN architecture. Specifically, the hyperbolic tangent sigmoid (TanSig) transfer function was implemented in the hidden layers to introduce non-linearity, enabling the network to capture complex patterns in the dataset. For the output layers, the linear transfer function (Purelin) was utilized to provide a continuous and unbounded output range, which is essential for accurate regression-based predictions. The mathematical formulations of the selected transfer functions are presented below to provide a theoretical foundation for their usage [
22].
These transfer functions were strategically chosen to optimize the network’s learning dynamics and enhance the predictive accuracy of the developed ANN models.
Regarding the implementation specifics, the network weights and biases were initialized using a random initialization strategy to ensure a diverse starting point for the optimization process. The training phase was executed using the backpropagation algorithm, which iteratively minimizes the MSE by propagating gradients through the hidden layers. To prevent overfitting and ensure robust generalizability, a stopping criterion was implemented where training is terminated upon the convergence of the validation error to a stable minimum value. Furthermore, the computational cost of the proposed dual-modular framework was minimized by utilizing a modular architecture, allowing for efficient training even with high-fidelity datasets. The sensitivity of the models to operational fluctuations was rigorously addressed through the physical analysis presented in
Section 5.2, confirming the models’ capacity to handle non-linear interactions across varying temperatures and pressures.
In this section, the “framework” denotes the systematic approach utilized for the development and execution of machine learning models aimed at forecasting the behavior of PEMEs. This framework incorporates essential phases of data processing, ANN architecture design, model training, and performance assessment to guarantee a methodical and replicable methodology. The machine learning framework employs a modular architecture, consisting of two separate MLP models, each designed for various prediction goals based on particular input–output correlations. The design approach follows a consistent methodology, first with data pretreatment and partitioning, and then with iterative model optimization via hyperparameter tweaking. A comprehensive assessment of various network topologies guarantees that the final models attain maximal predicted accuracy while preserving computational efficiency. This framework integrates scientifically established concepts in ANN creation, including the selection of suitable activation functions (TanSig and Purelin), data-partitioning methodologies, and model validation mechanisms. The framework utilizes a structured modeling methodology to guarantee the robustness, generalizability, and applicability of the created ANN models to extensive PEME system evaluations.
5. Results and Discussion
This section provides a detailed exploration of the physical and predictive performance characteristics of PEMEs, focusing on the interplay between thermodynamic and kinetic parameters influencing operational dynamics. The following subsections present a dual approach to evaluating PEME performance. The first subsection emphasizes a physical analysis based on experimental data to assess the impact of operational parameters, such as temperature and pressure, on performance metrics. The second subsection focuses on validating and analyzing the predictive capabilities of machine learning models developed for simulating PEMEs behavior. By integrating experimental insights with machine learning predictions, this study aims to establish a robust framework for improving the design and operation of PEMEs. The results presented herein underscore the critical role of temperature and pressure regulation, as well as the effectiveness of ANN models, in advancing PEMEs technology.
5.1. Physical Analysis
The physical performance of the PEME is governed by a complex interplay of thermodynamic and kinetic factors, as established in the foundational data provided by Abhishek et al. [
20]. A primary observation is the significant impact of operating temperature on the cell’s polarization characteristics. Specifically, as the temperature rises from 280 K to 360 K, a steady decrease in total cell voltage is observed, such as the reduction from 1.65 V to 1.39 V recorded at a current density of 0.5 A/cm
2. As the temperature rises from 280 K to 360 K, there is a steady decrease in total cell voltage, which indicates a direct improvement in the cell’s operational efficiency. This enhancement is largely attributed to the reduction in ohmic resistance at higher temperatures, which accelerates electrochemical processes and leads to a higher exchange current density, thereby minimizing voltage losses. Under atmospheric pressure conditions, increasing the temperature from 280 K to 363 K results in a total cell voltage reduction from 2.0985 V to 1.7332 V.
A detailed examination of the irreversible losses reveals that temperature fluctuations most strongly affect activation polarization and ion transport within the electrolyte. Quantitative analysis at a current density of 1.0 A/cm
2 confirms that activation overpotential is the dominant loss component, contributing approximately 0.35 V, whereas ohmic and concentration losses account for only 0.15 V and 0.02 V, respectively. At elevated temperatures, the kinetics of electrochemical reactions, specifically water splitting and recombination, are significantly improved. This leads to a notable reduction in activation overpotential, as the increased reaction rates at both the anode and cathode facilitate more efficient charge transfer. Furthermore, while rising temperatures also decrease ohmic resistance by enhancing the ionic conductivity of the electrolyte and reducing resistance at the electrode–electrolyte interfaces, the magnitude of this reduction is secondary to the decrease in activation overvoltage. Consequently, activation overvoltage is identified as the dominant component influencing total cell voltage across varying thermal conditions. The influence of operating pressure on cell performance, while recognized, is confirmed to be significantly less substantial than thermal effects. According to the parameters established by Abhishek et al. [
20], elevating the operating pressure from 1 atm to 200 atm at a constant temperature of 310 K induces only a marginal voltage increase of approximately 0.05 V. While the broader numerical boundaries of the source model can extend to 200 atm (yielding a 0.07 V increase), the current discussion and the subsequent performance visualizations are strategically focused on the interval of 1 atm to 100 atm. This ensures technical consistency between the physical baseline descriptions and the high-fidelity predictive results presented in the following sections, confirming that pressure effects remain secondary to thermal influences.
From an electrochemical perspective, the substantial reduction in activation overpotential at elevated temperatures is directly linked to the decrease in the Gibbs free energy barrier required for the water-splitting reaction at the catalyst–electrolyte interface. As thermal energy increases, the exchange current density at both the anode and cathode is enhanced, facilitating more efficient charge transfer and reducing kinetic resistance. Simultaneously, the increase in temperature promotes higher ionic mobility within the Nafion-based polymer electrolyte, which leads to superior proton conductivity and a corresponding decline in ohmic losses. Regarding pressure effects, while a rise in operating pressure according to the Nernst equation slightly increases the reversible cell potential, thereby explaining the marginal voltage rise observed, it also influences gas solubility and bubble dynamics at the electrodes. The developed ANN models, by achieving near-perfect predictive metrics, effectively capture these intricate electrochemical interactions, translating the underlying physical laws of proton transport and reaction kinetics into high-fidelity computational signals.
5.2. Validation of Machine Learning Model
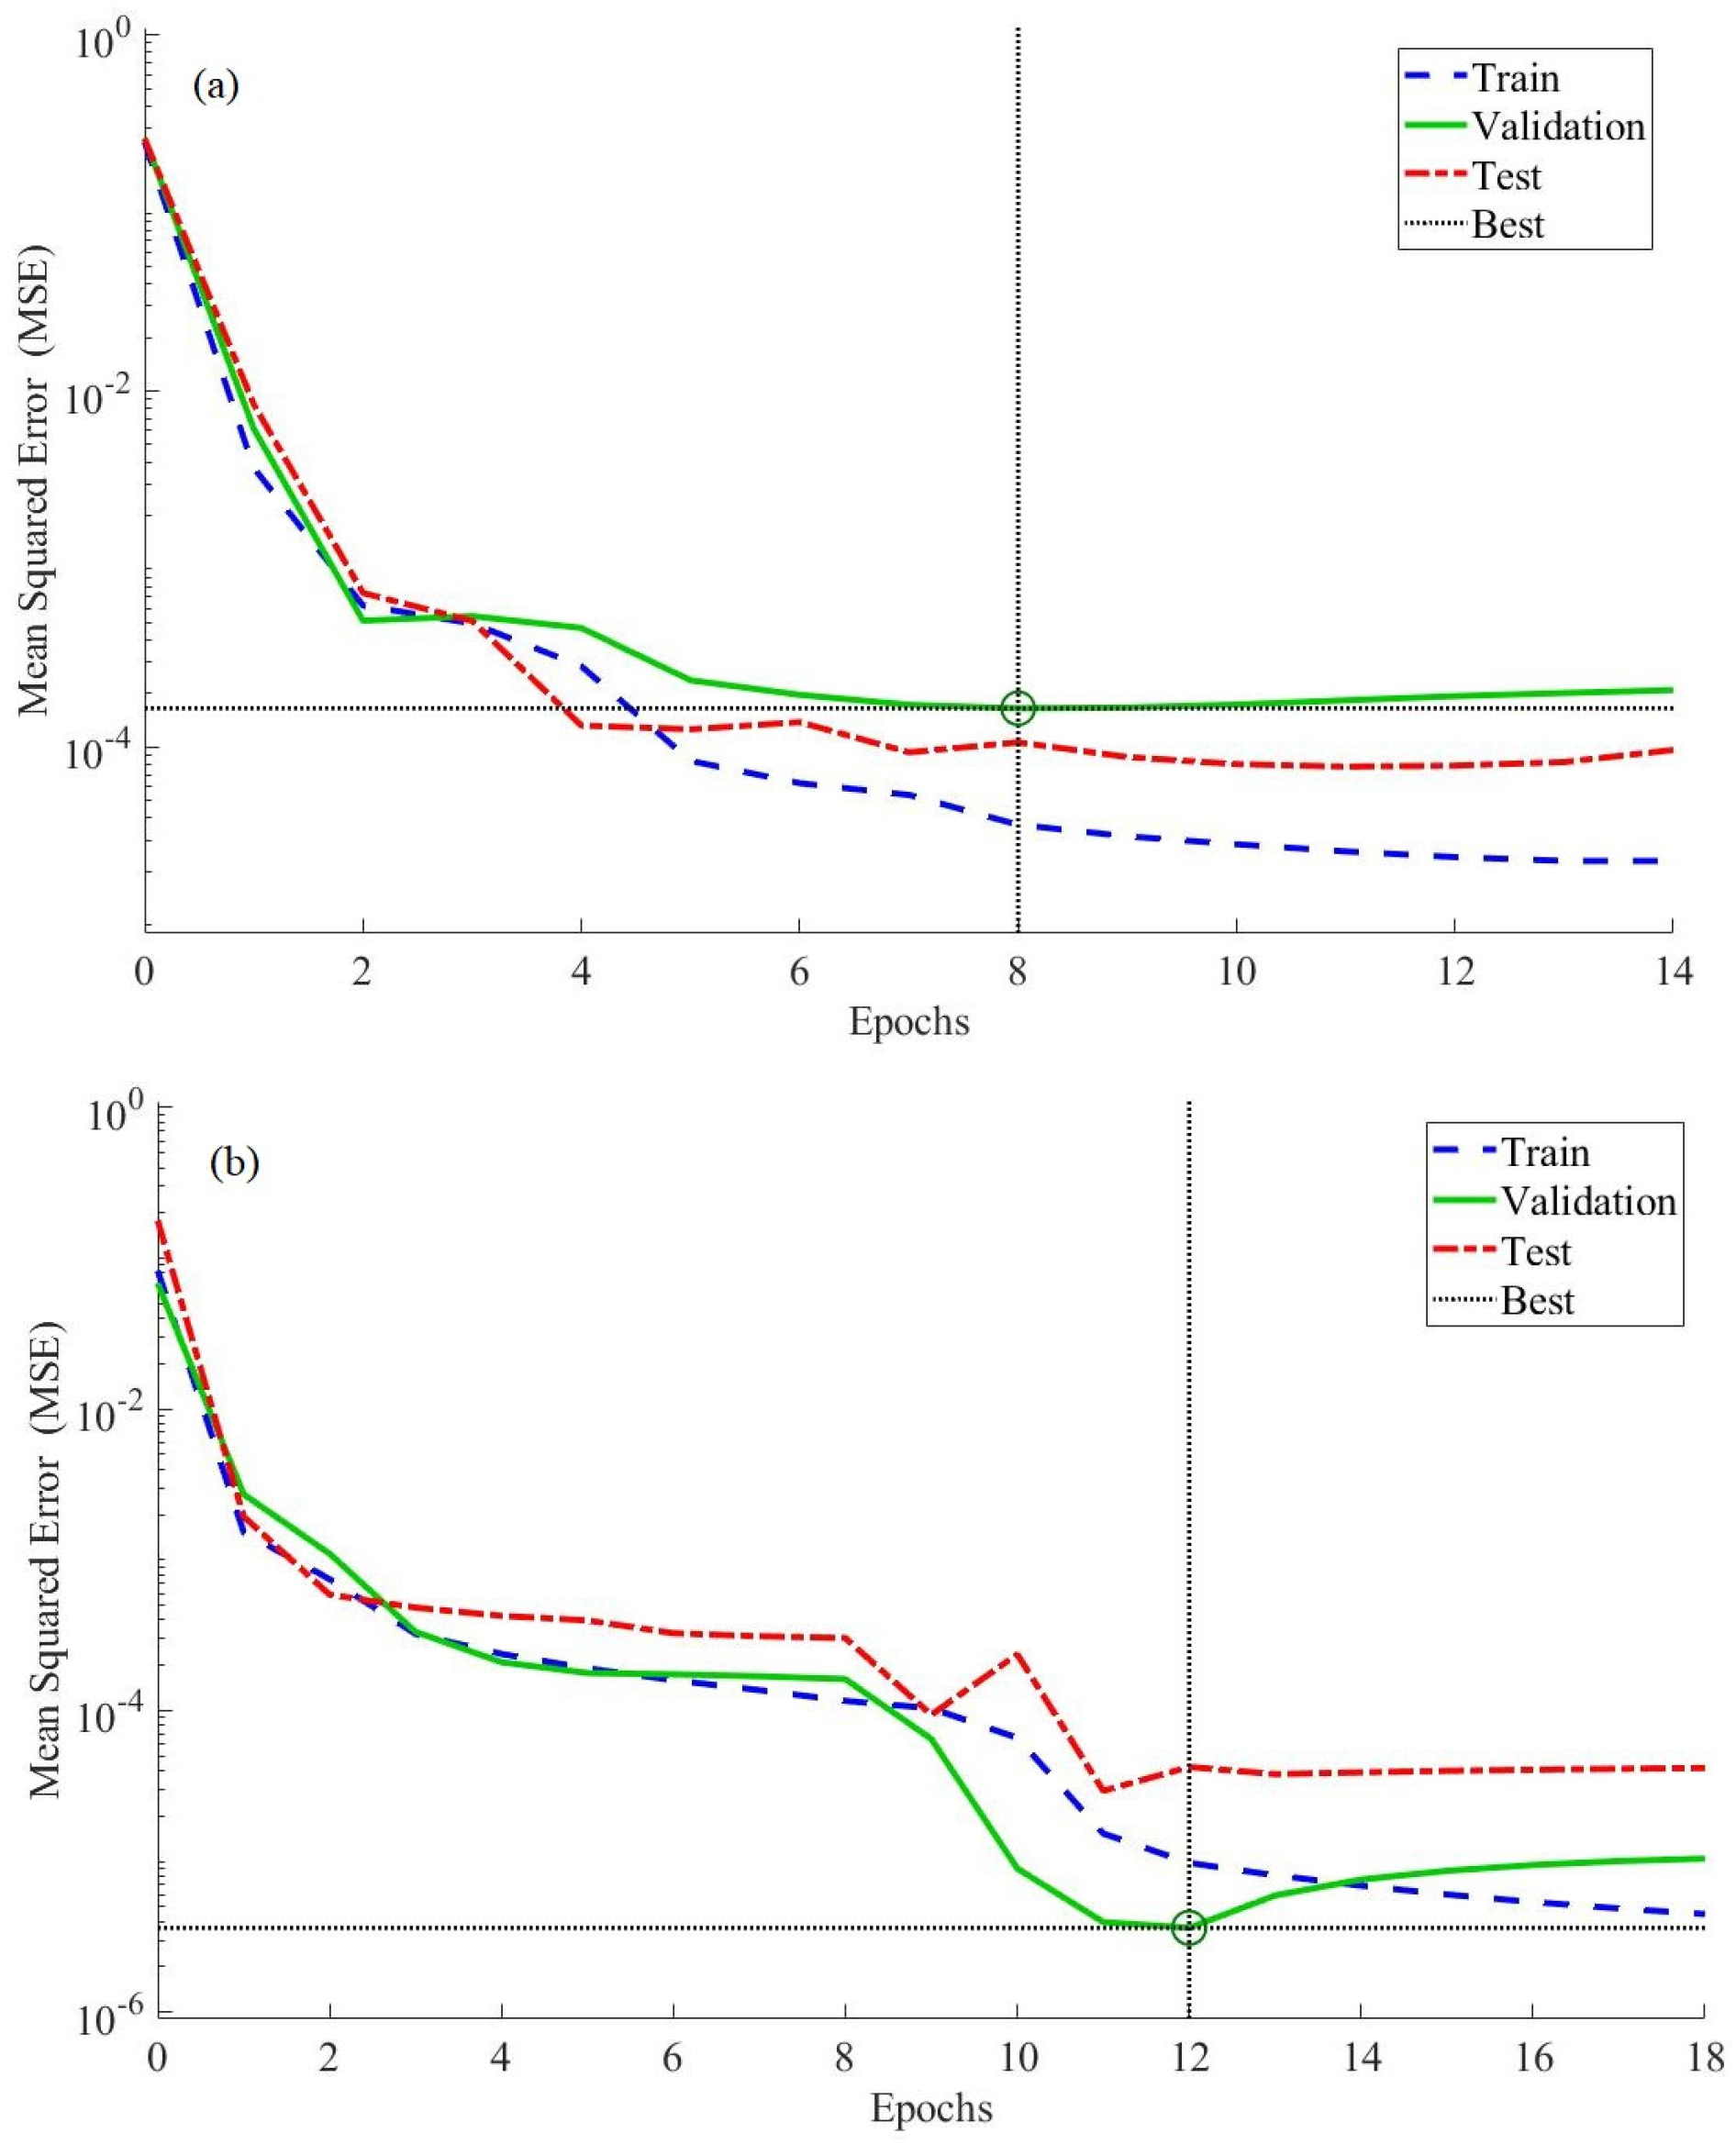
Prior to conducting a performance analysis of the developed ANN models, it is essential to evaluate the training and learning accuracies to ensure optimal training conditions. This preliminary assessment validates the models’ training effectiveness and their predictive reliability. The training data from both MLP models was meticulously analyzed, with
Figure 4 depicting the MSE evolution over the training epochs. This figure illustrates the reduction in the error metric as training progresses, highlighting the model’s learning trajectory.
In an MLP architecture, the data flows through the input layer, hidden layers, and finally to the output layer, with the primary aim of minimizing the difference between the predicted and target values. Backpropagation is utilized to optimize the model by adjusting weights and biases based on the computed errors. Initially, MLP models typically show high MSE due to unoptimized weights; however, ongoing training leads to parameter refinement and a decrease in MSE.
Figure 4 captures this decline, demonstrating the model’s ability to improve predictive accuracy, ultimately converging to a minimal error value, indicating optimal performance under the given dataset and training conditions.
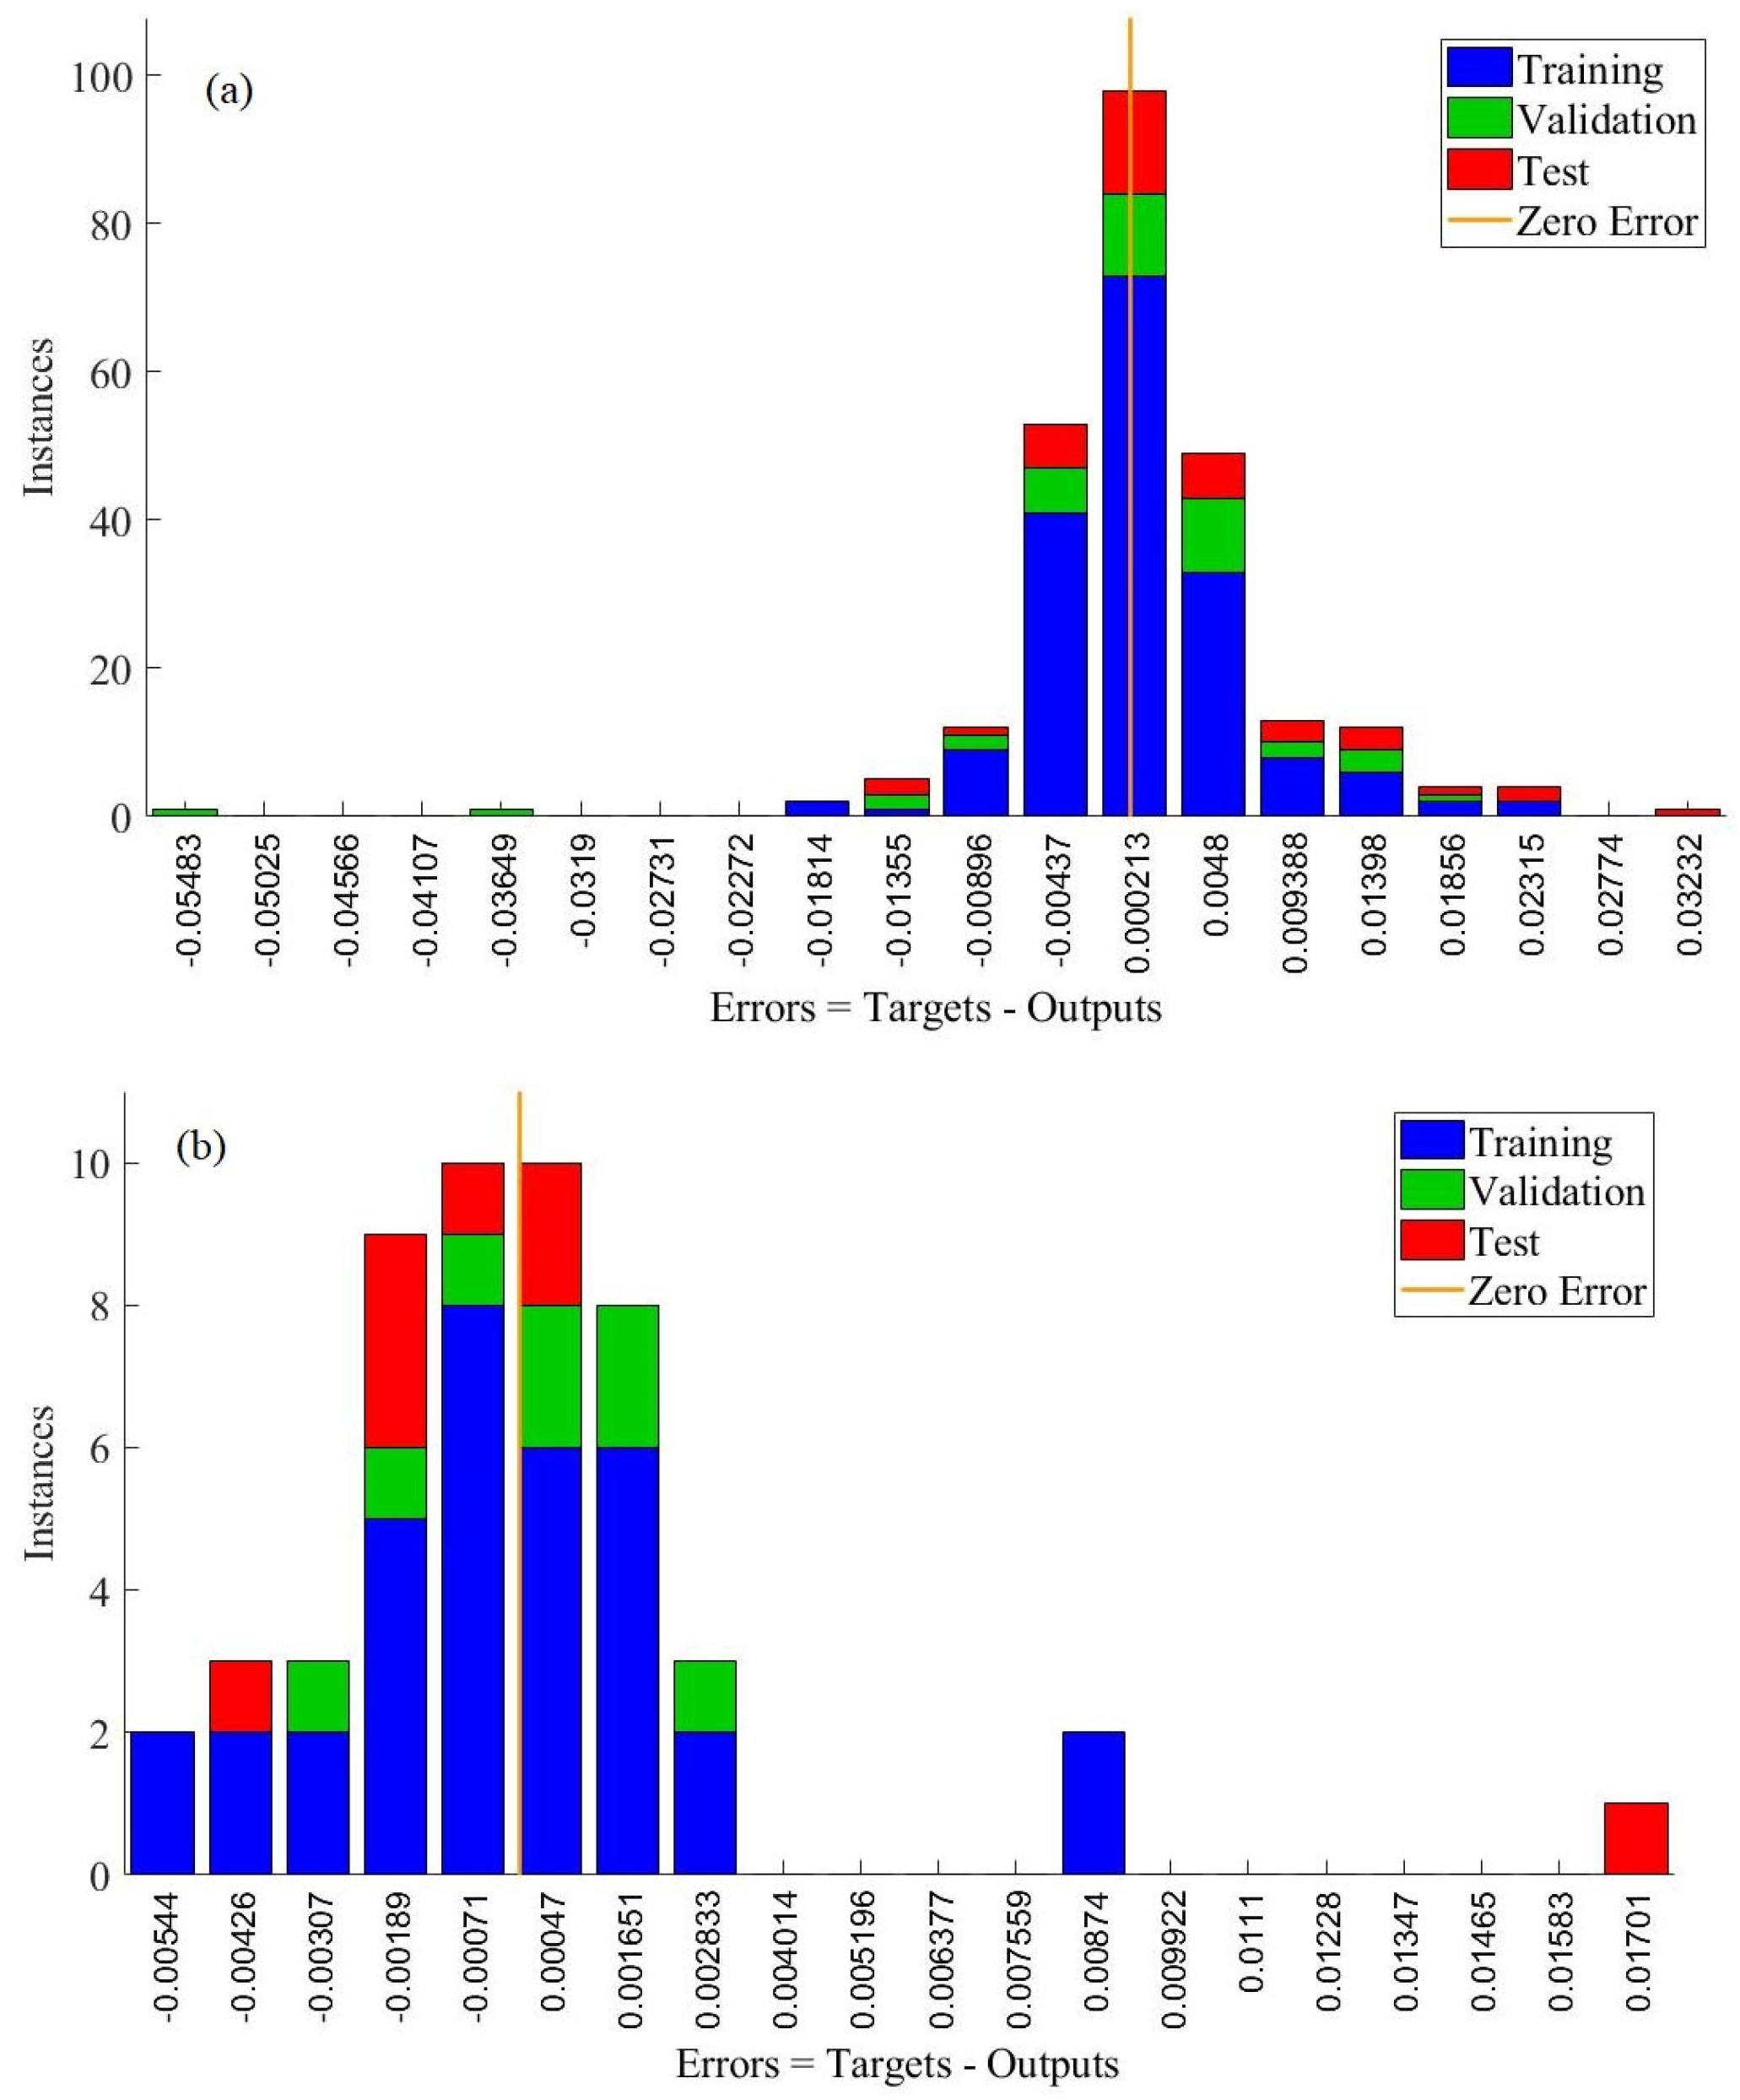
Additionally,
Figure 5 presents error histograms from the training stages, providing insights into model performance through the distribution of errors. A majority of errors cluster near the zero-error line, suggesting that predicted values closely align with actual target values, which reflects high precision. The low magnitude of errors reaffirms the models’ accuracy, indicating effective minimization of discrepancies between predicted and actual values without significant overfitting or underfitting. These findings confirm that the training of both ANN models was successful and optimal, leading to minimal error levels. The results in
Figure 4 and
Figure 5 validate the effectiveness of the training algorithms and the robustness of the designed network architectures, indicating readiness for subsequent validation and testing phases.
5.3. Performance Analysis of Machine Learning Model
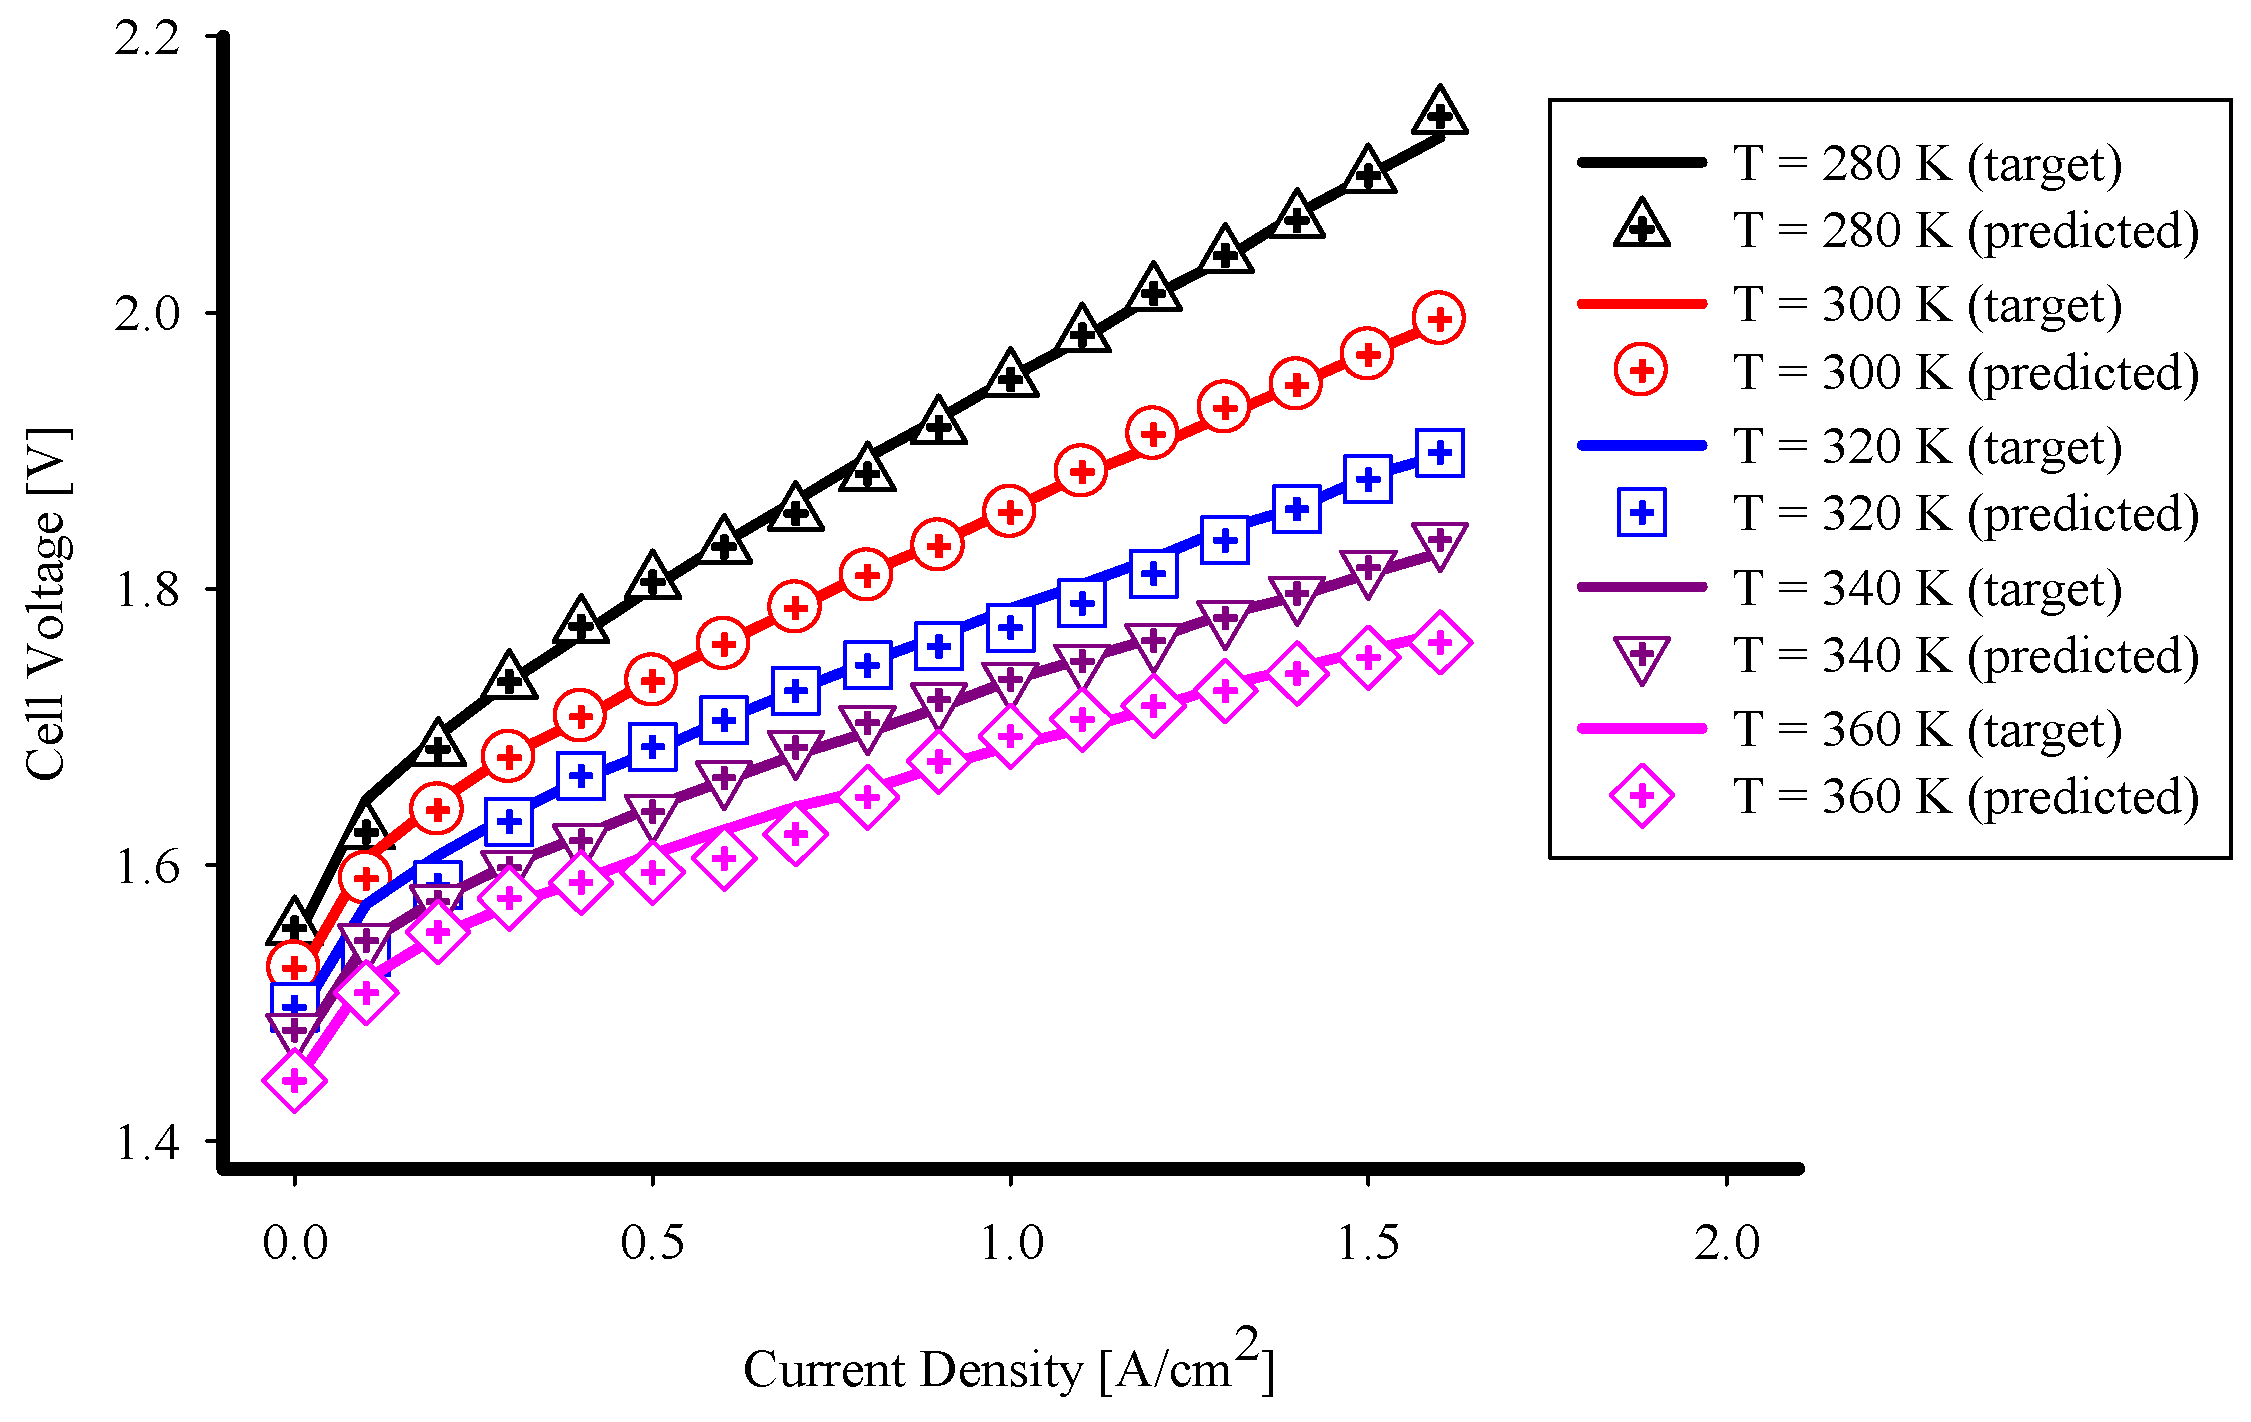
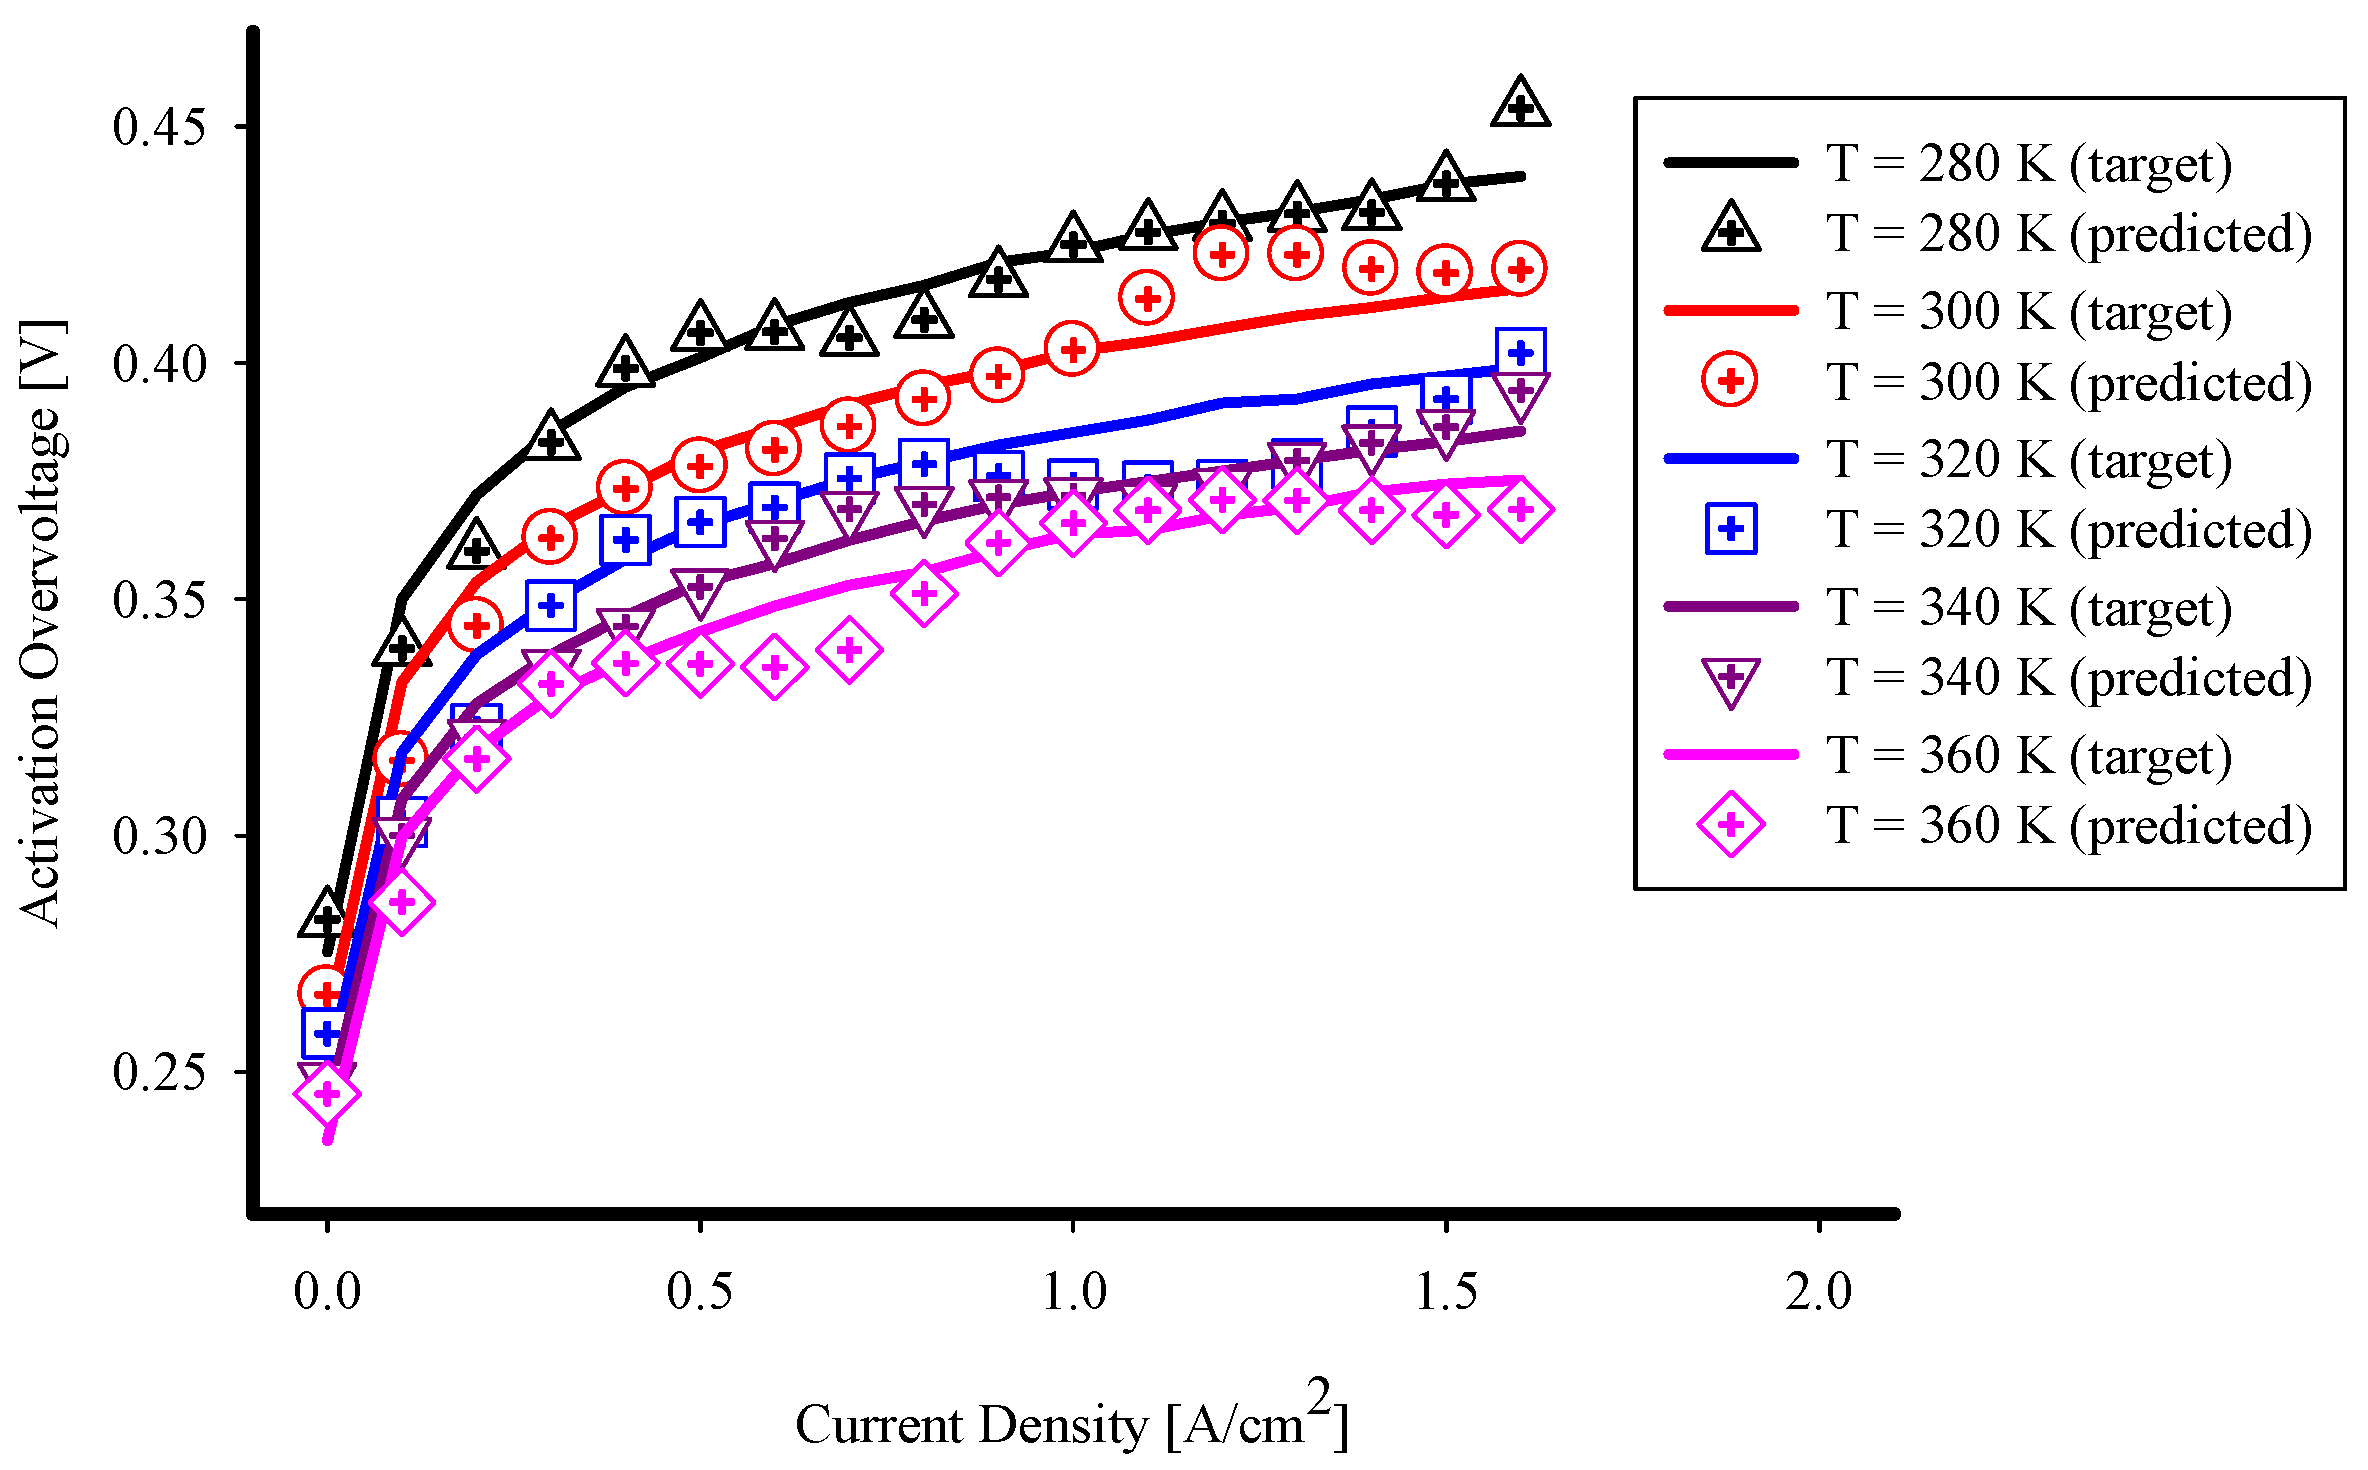
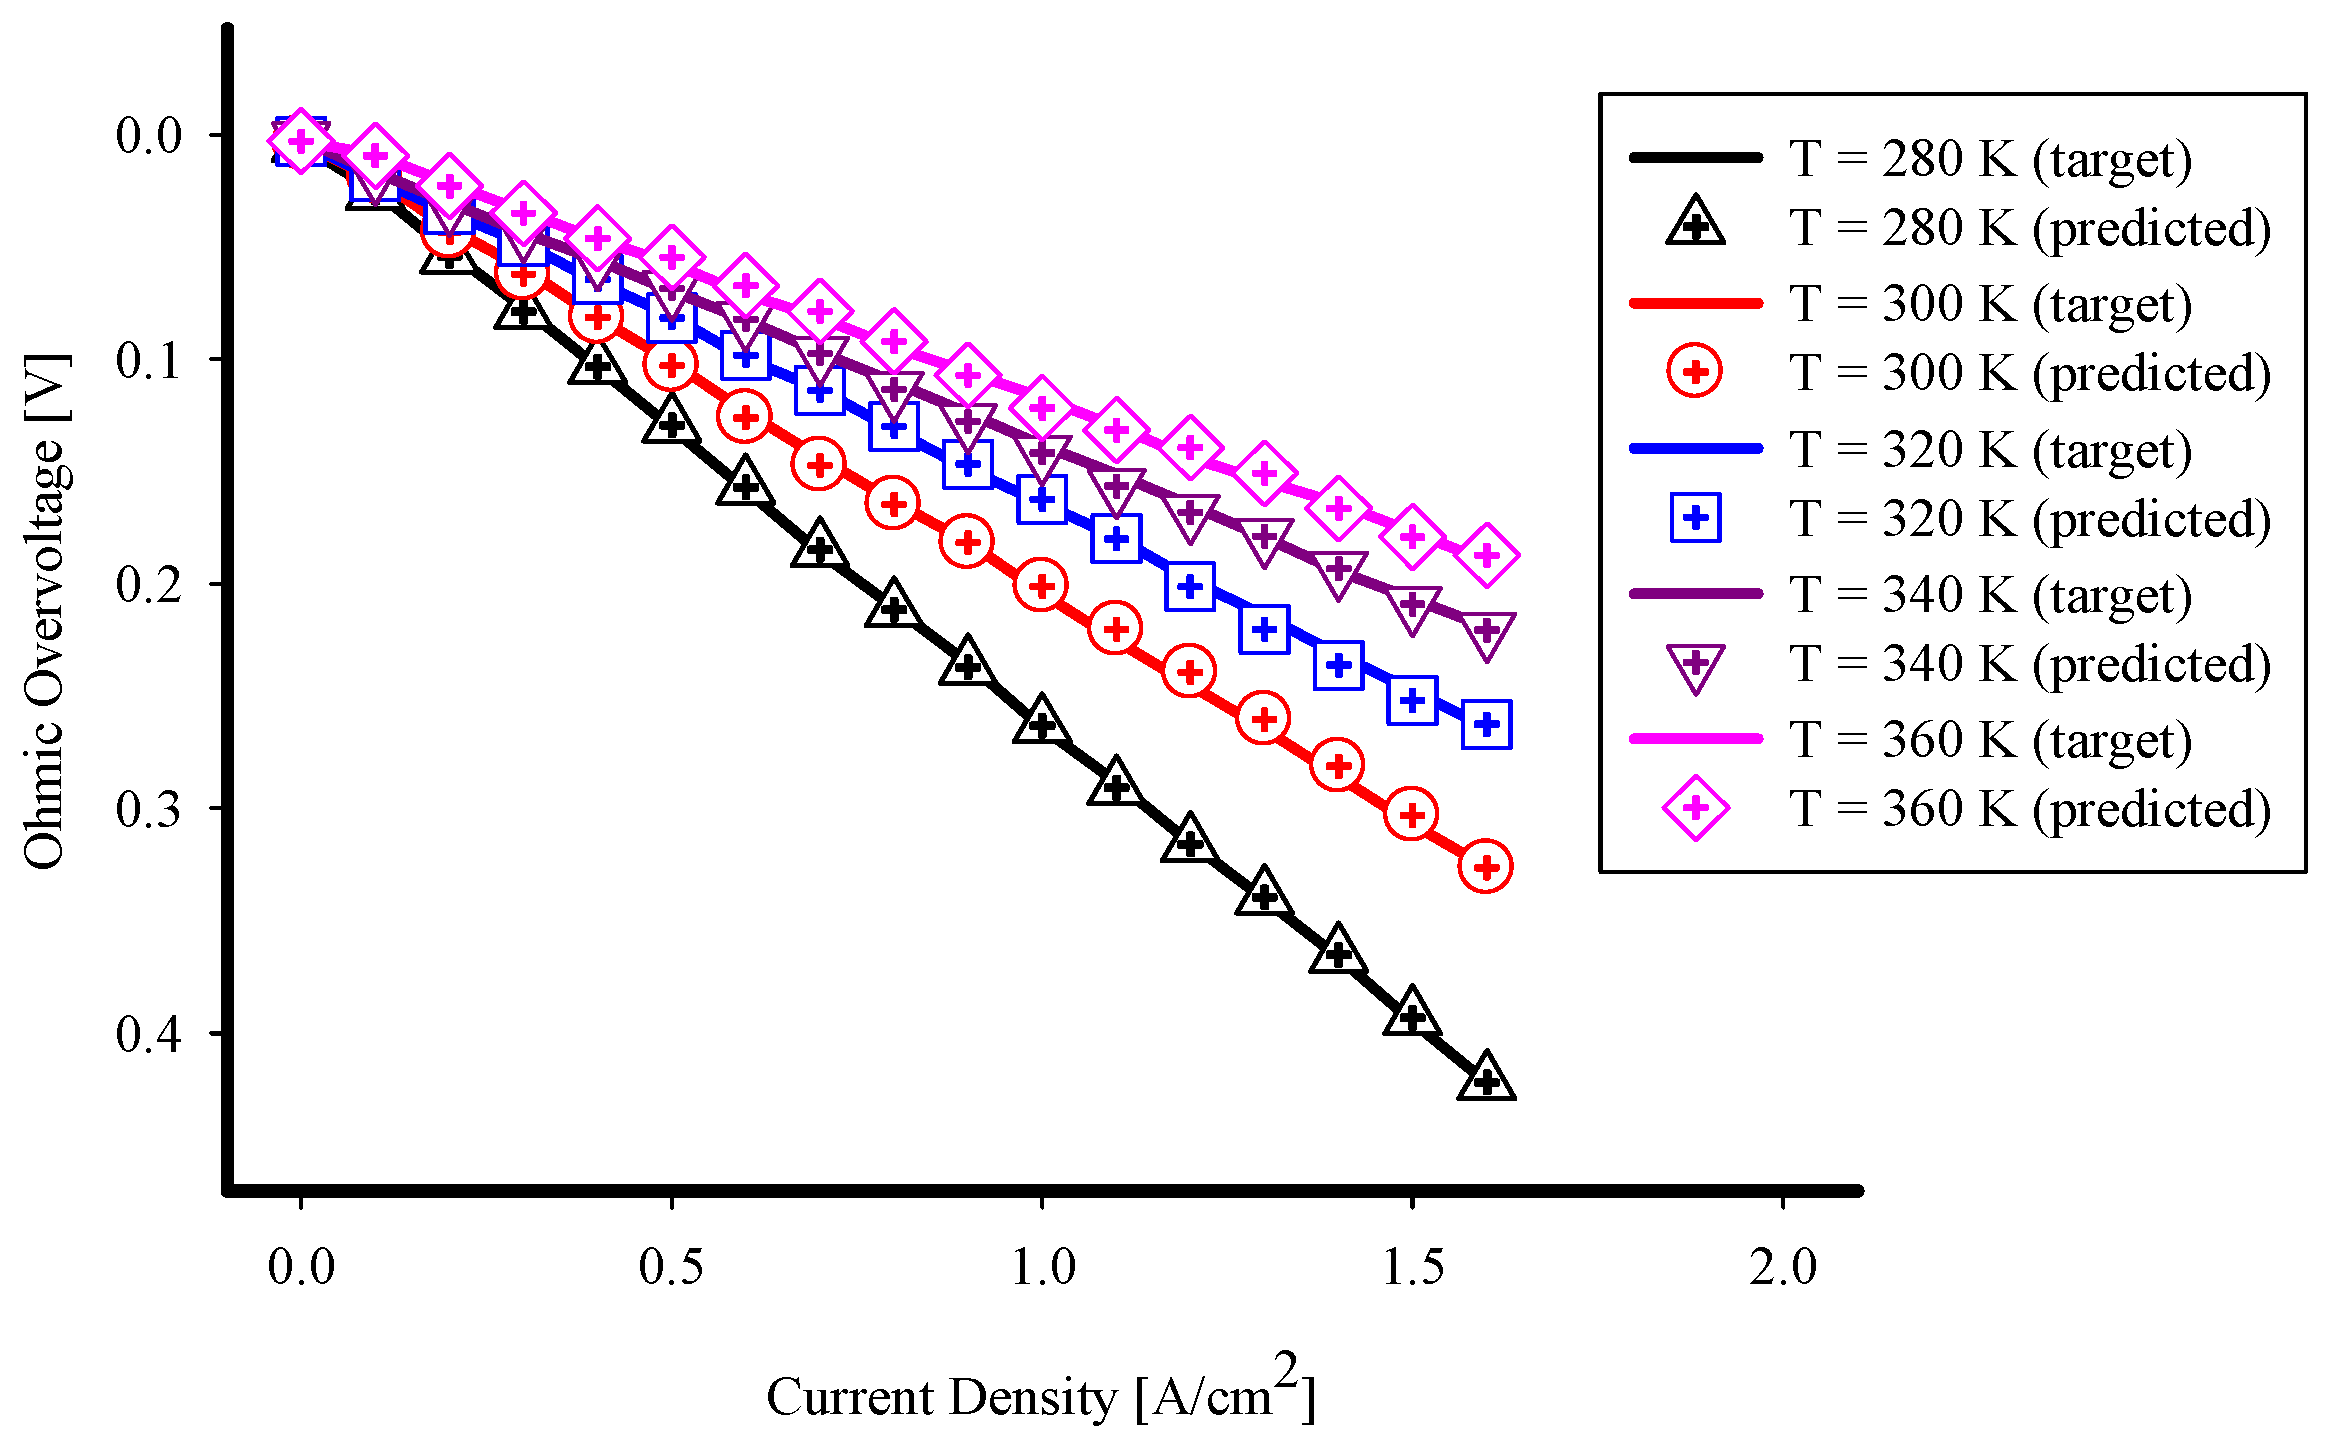
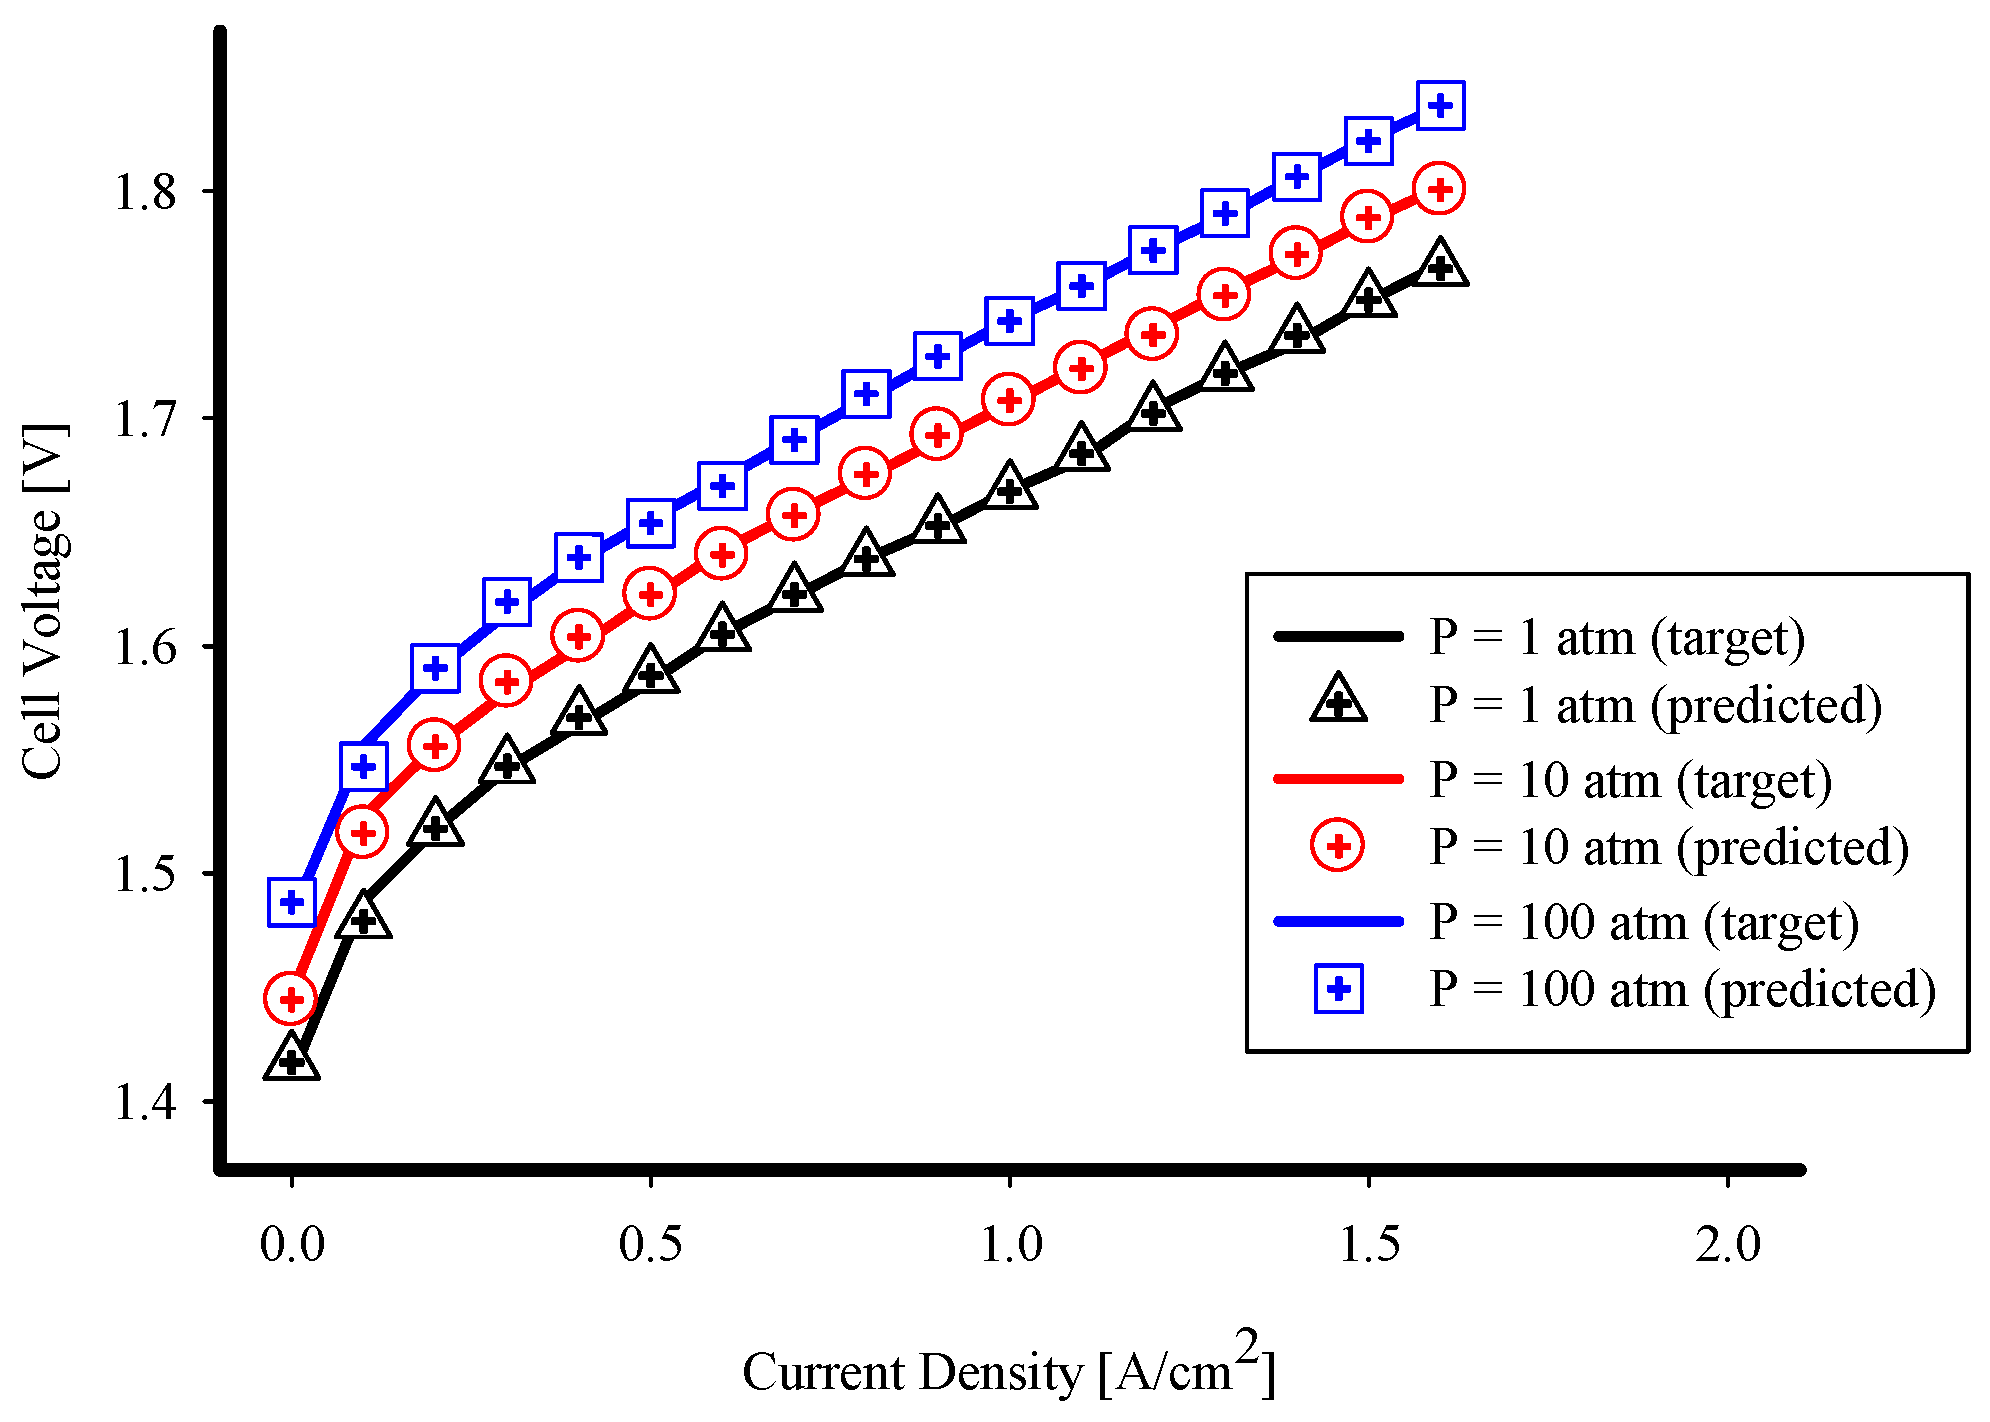
Following the successful verification of the training stages of the ANN models, the analysis of their prediction performance was initiated. This phase is essential for evaluating the capability of the network models to generalize their learned patterns to unseen data and to produce accurate predictions. The first step in this process involved a comparative analysis of the prediction values generated by each ANN model with the corresponding target values.
Figure 6,
Figure 7,
Figure 8 and
Figure 9 illustrate these comparisons for both network models, providing a visual representation of their predictive performance. A close examination of these figures reveals that the data points corresponding to the prediction values align closely with the graph lines representing the target values. This alignment indicates a strong agreement between the predicted and actual values across the dataset, reflecting the models’ ability to accurately replicate the underlying relationships in the data. The near-perfect compatibility observed in these comparisons underscores the precision of the ANN models in capturing and predicting the behavior of the system under investigation. This high degree of predictive accuracy is a testament to the robustness of the training methodologies employed and the suitability of the network architectures for the given application. The results depicted in
Figure 6,
Figure 7,
Figure 8 and
Figure 9 demonstrate that both developed ANN models possess exceptional predictive capabilities, validating their applicability for tasks requiring high precision. These findings confirm that the models are not only effective in training scenarios but are also capable of producing reliable predictions, a critical requirement for their successful application in scientific and engineering contexts.
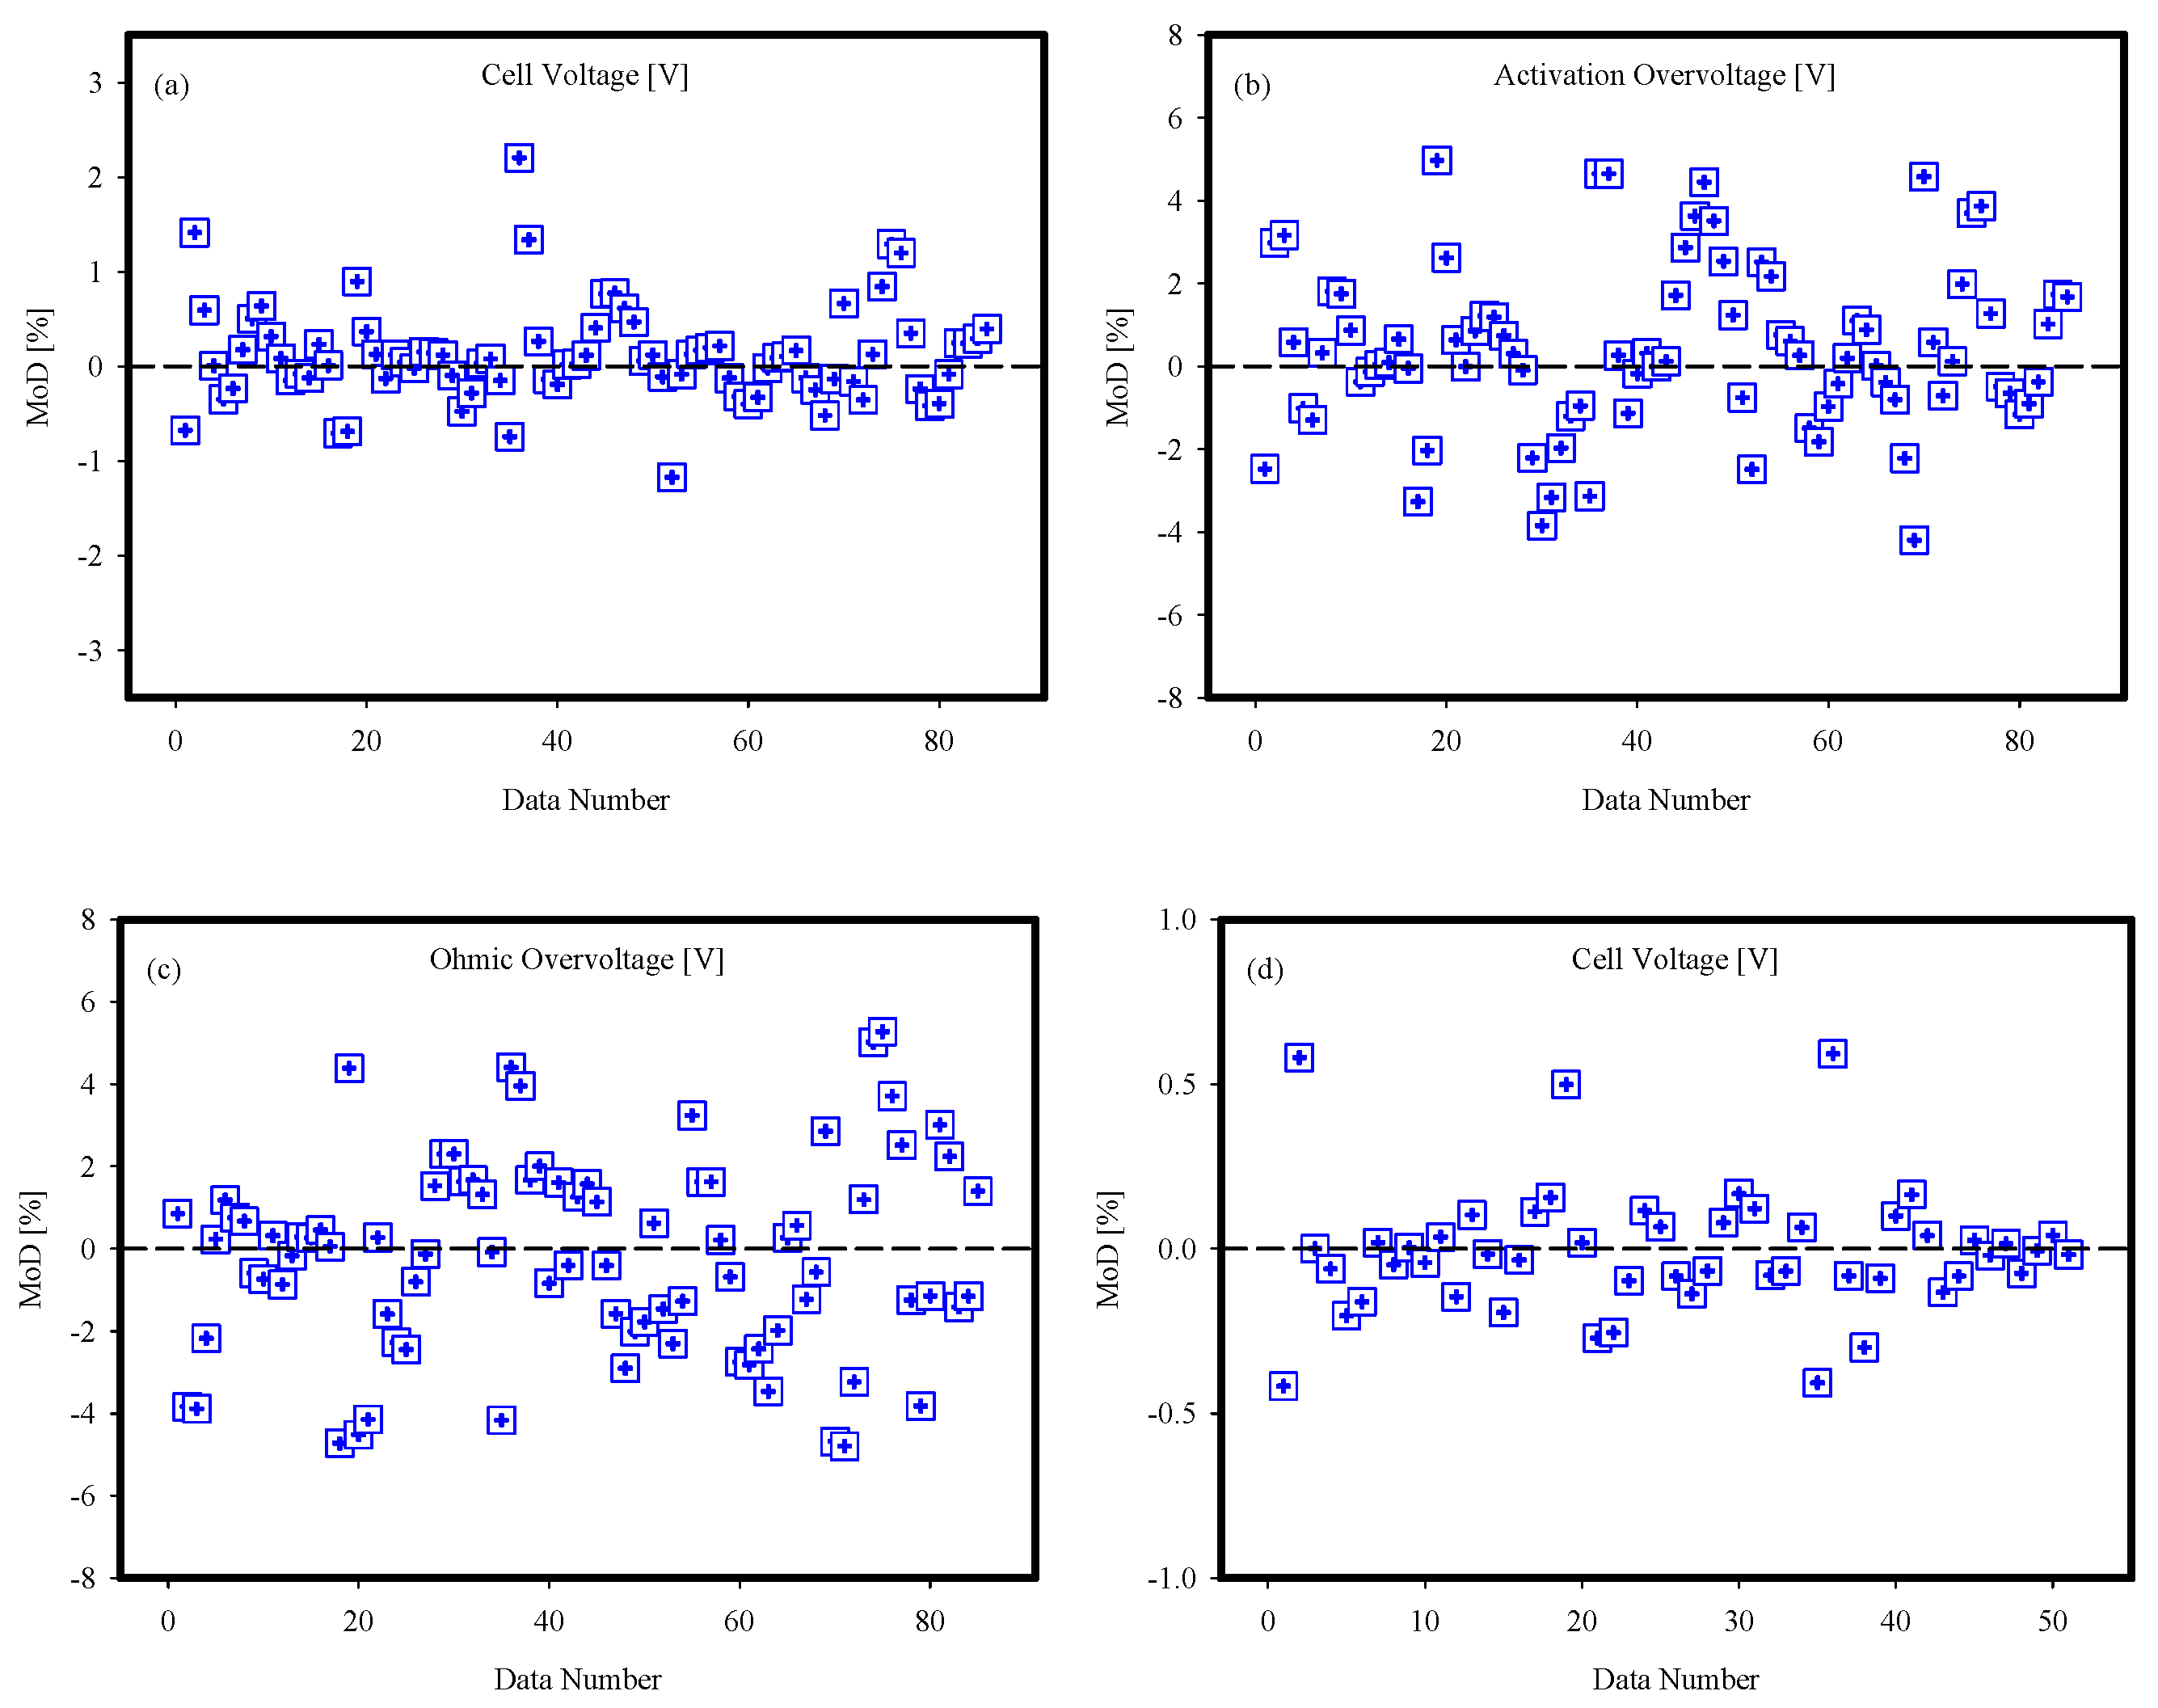
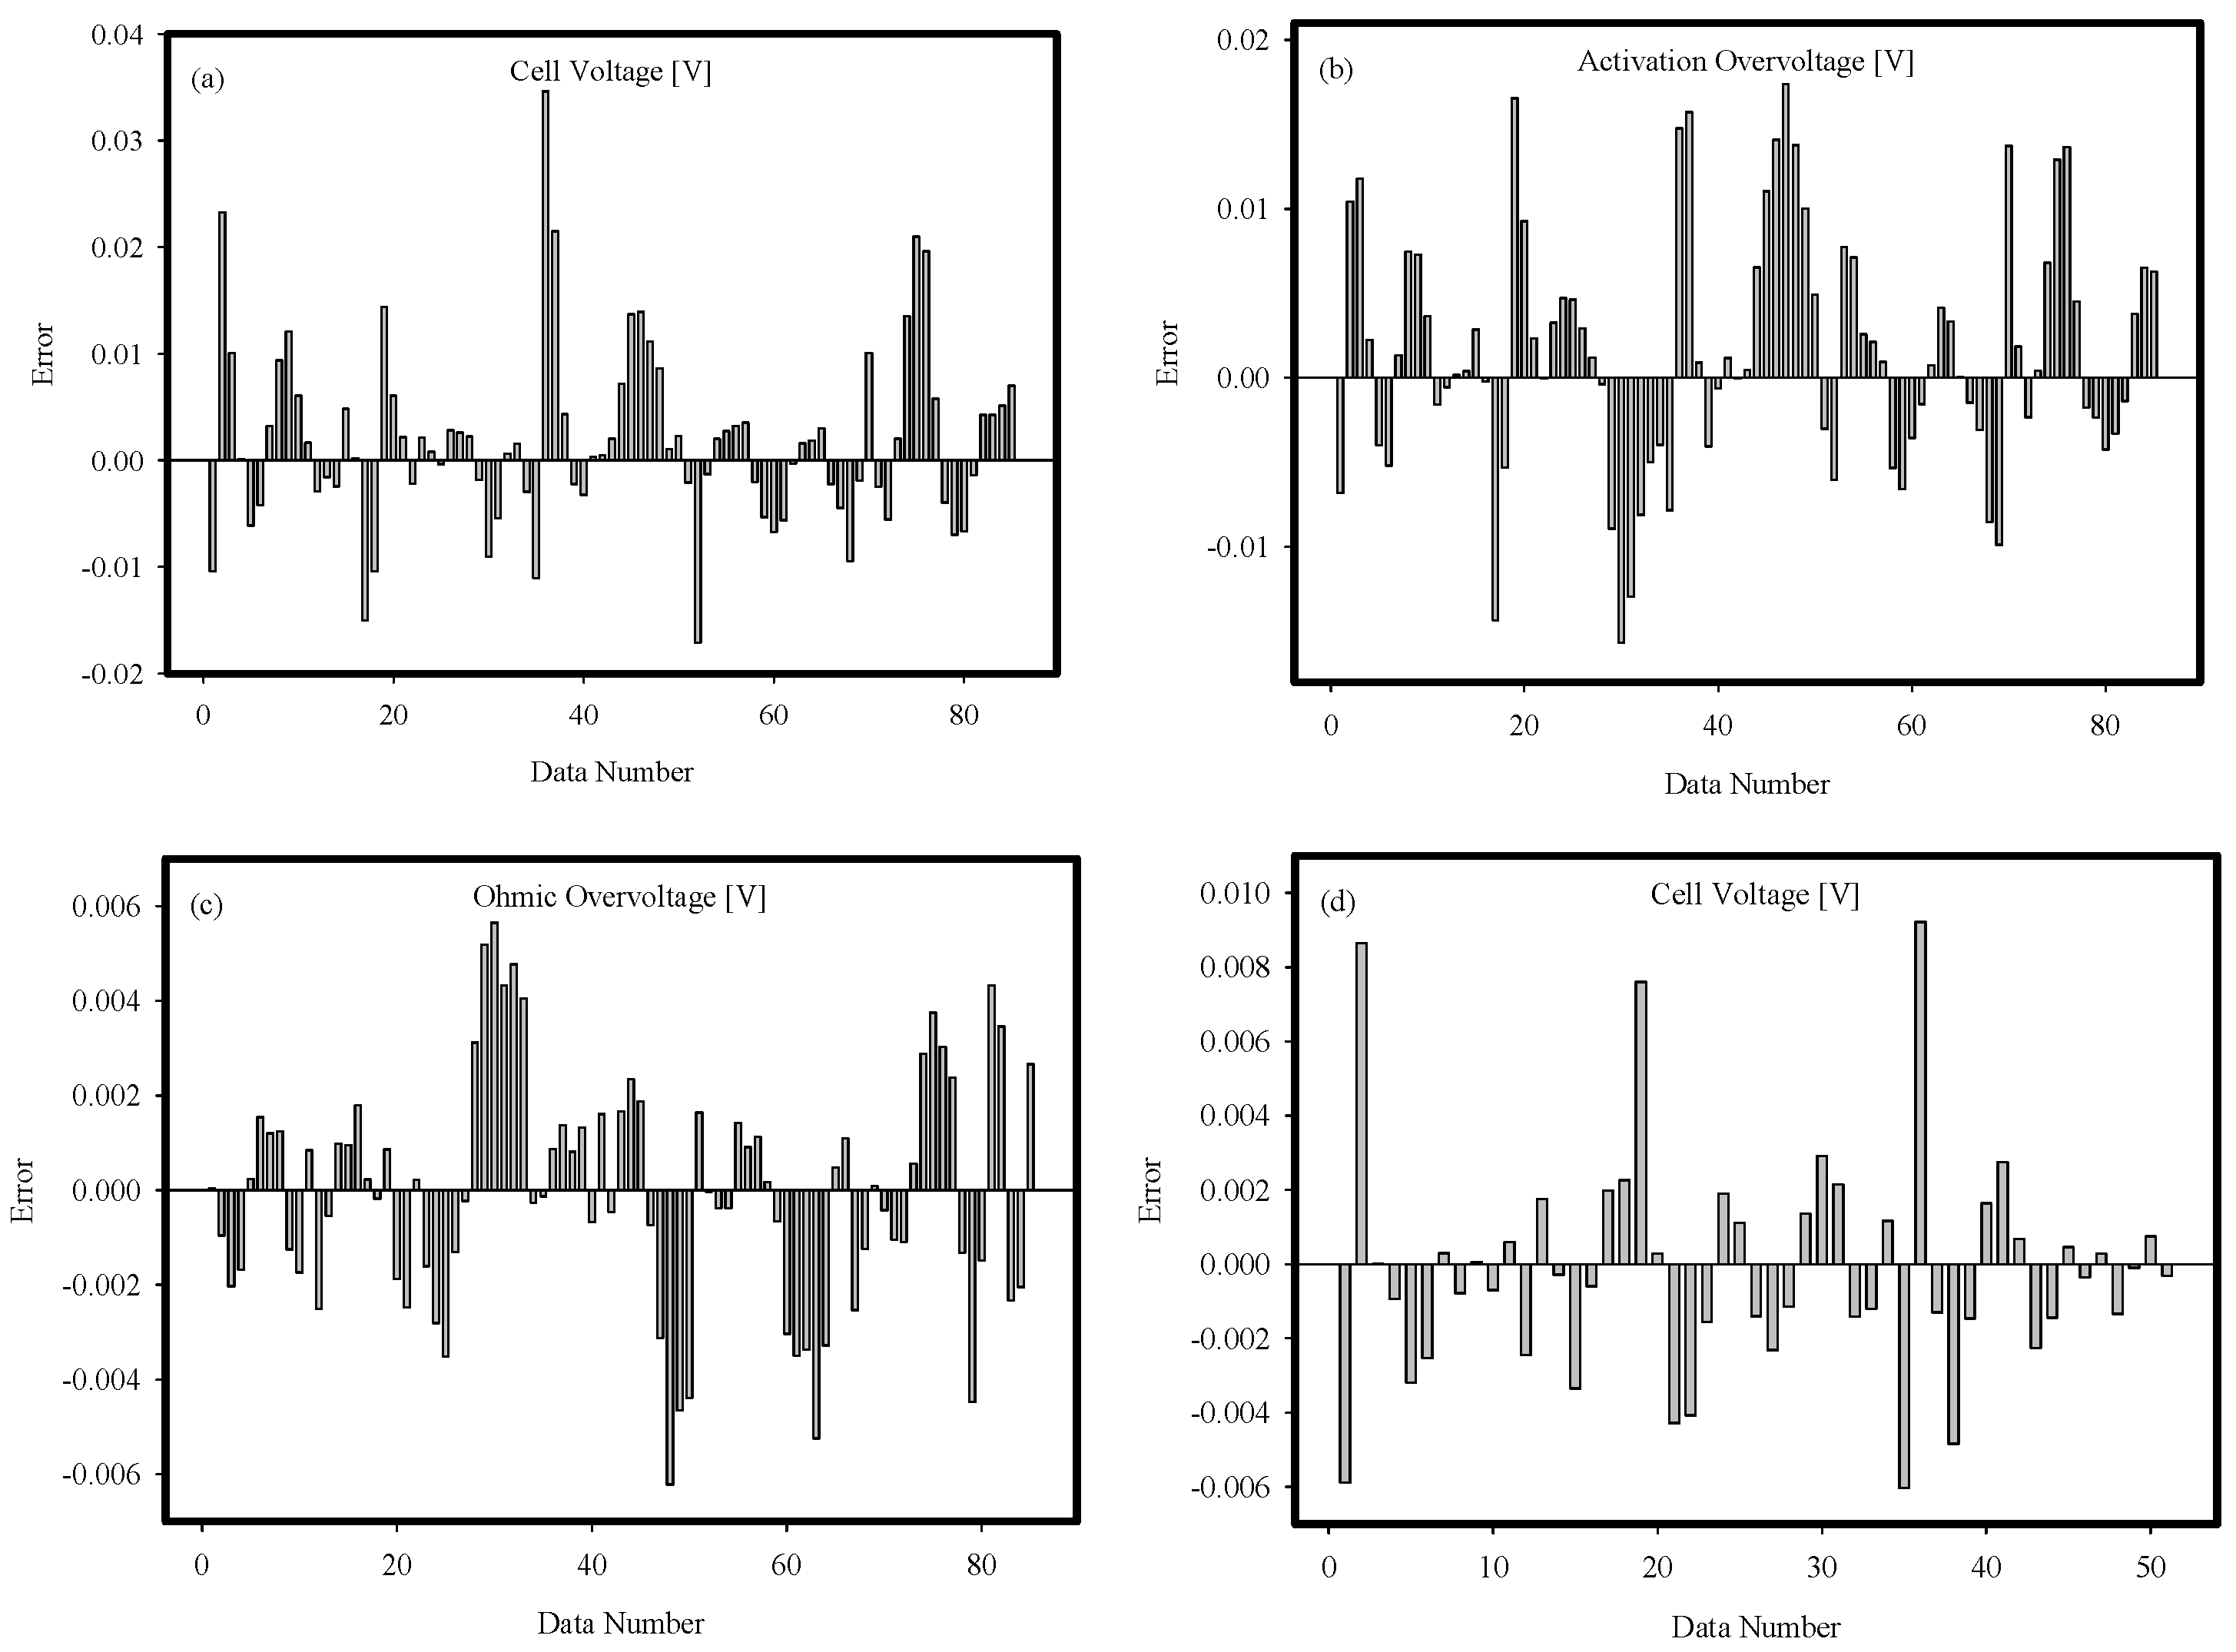
Following the comparative evaluation of target and predicted values, a detailed examination of the error metrics for the ANN models was conducted. This phase focused on assessing the deviation rates between the predicted values generated by the ANN models and the corresponding target values, thereby providing a quantitative measure of the models’ predictive accuracy. The calculated deviation rates for each data point are presented in
Figure 10, offering an insightful visualization of the models’ performance. An analysis of the distribution of data points representing the deviation rates reveals that they are predominantly situated near the zero-deviation line. This clustering signifies that the predictions closely approximate the target values, with minimal discrepancies. The average deviation rates for the two ANN models were calculated to be 0.11% and −0.01%, respectively, which further emphasizes the accuracy of the models. These exceptionally low average deviation rates underscore the reliability and precision of the developed networks. Additionally,
Figure 11 illustrates the differences between the predicted values and the target values for each data point. A review of this figure demonstrates that the discrepancies are consistently minor across the dataset, further validating the low error levels associated with the predictions. The term low error here means that the differences between the target values and the values obtained from the ANN model are very low. Here, the MoD value and the error values differ from each other. The MoD value indicates the proportional difference between the target values and the ANN estimates, while the error value indicates the difference between the target values and the values obtained from the ANN model. This consistency highlights the effectiveness of the ANN models in minimizing errors during prediction. The findings from these error analyses confirm that both ANN models are capable of generating predictions with remarkably low error margins. These results not only validate the robustness of the training and learning processes but also affirm the suitability of the network architectures for accurately modeling the complex system under study. This comprehensive error analysis provides strong evidence of the models’ potential for reliable application in predictive tasks within scientific and engineering domains.
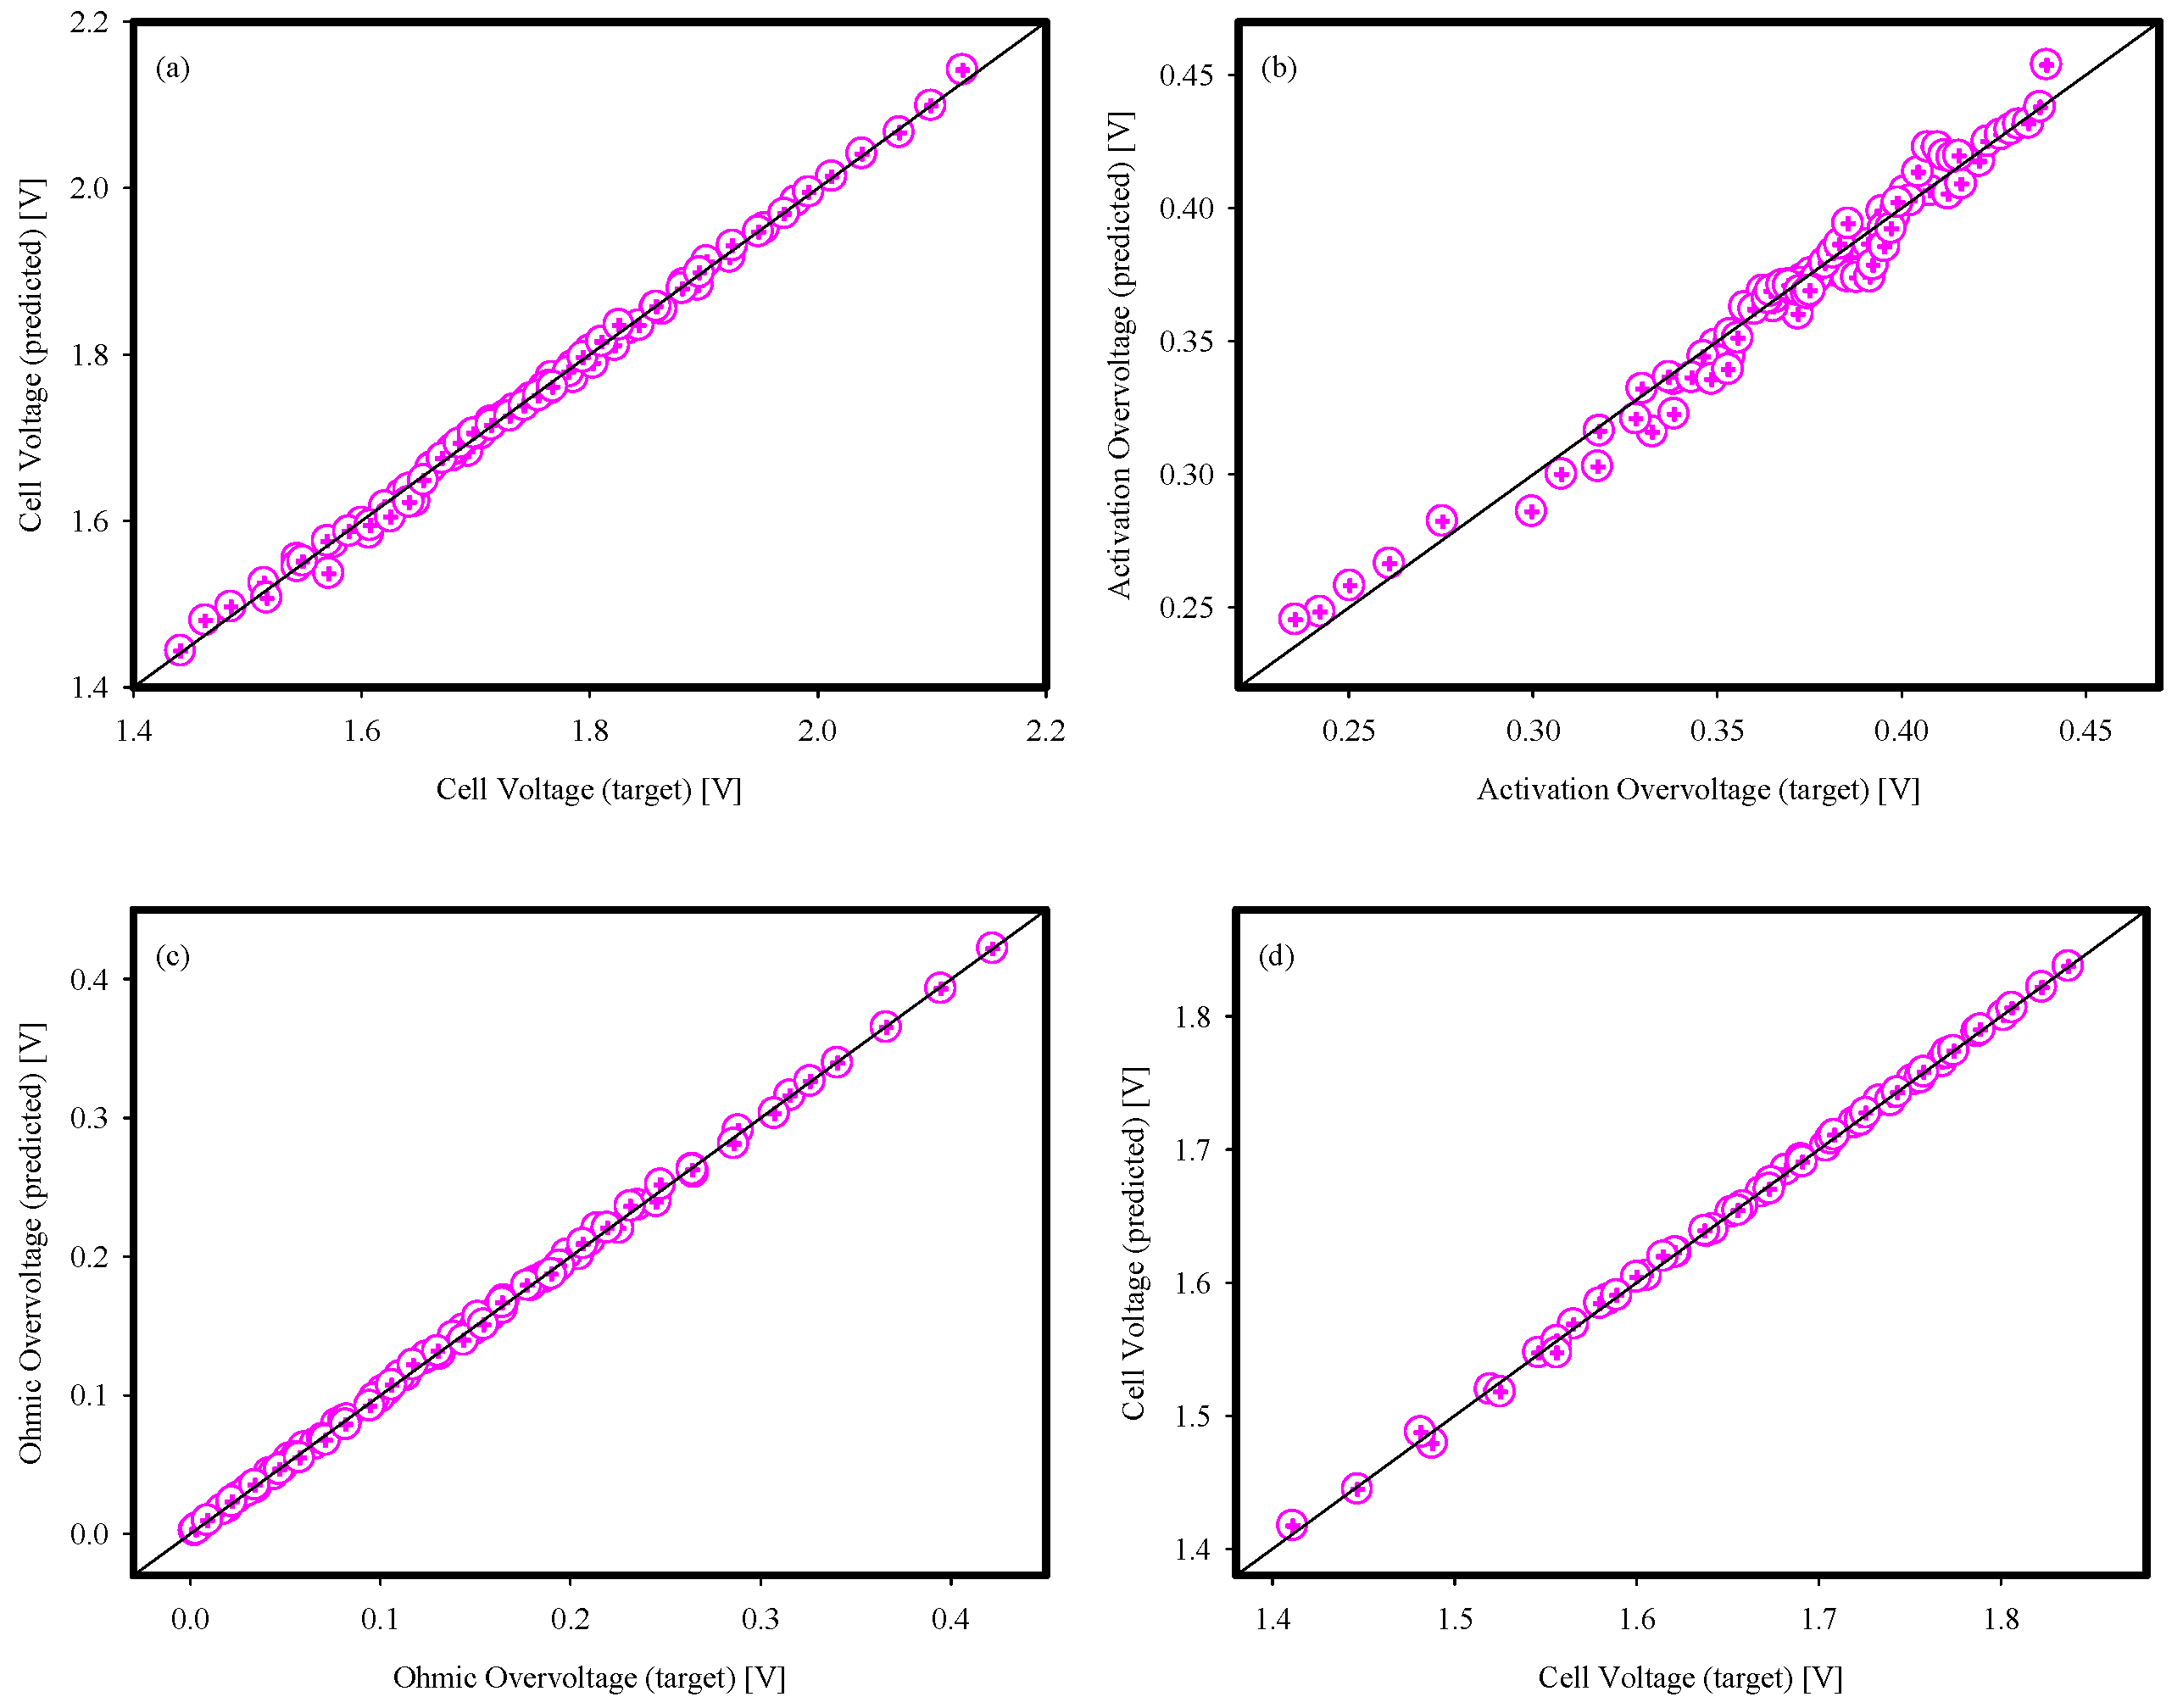
Figure 12 illustrates the d values, which serve as a quantitative measure for assessing the concordance between the observed target values and the predicted outputs generated by the ANN models. A detailed examination of the spatial distribution of data points corresponding to each output value reveals that the majority of data points are closely aligned along the 1:1 slope line, signifying a high level of agreement between the predicted and actual values. Furthermore, the performance evaluation metrics presented in
Table 3 underscore the reliability of the developed ANN models. Specifically, the d values for both ANN models are calculated to be 0.99, indicating an almost perfect match between predictions and observations. Complementary to these results, the MSE values are determined to be 3.66 × 10
−5 and 9.75 × 10
−6, respectively, further emphasizing the models’ capability to minimize prediction errors. These notably low MSE values highlight the effectiveness of the proposed ANN models in capturing the underlying patterns of the data with minimal deviation. In addition, the R values for the ANN models are computed as 0.99996 and 0.99958, respectively. The proximity of these R values to the theoretical maximum of 1 reinforces the models’ ability to deliver highly accurate predictions.
Such results demonstrate the robustness and precision of the developed ANN models in modeling the performance of PEMEs. From an engineering perspective, the exceptional predictive fidelity achieved by these models has significant practical implications for the lifecycle optimization of PEME systems. In industrial hydrogen production, high-precision computer surrogates eliminate the need for frequent and expensive high-frequency characterization, such as electrochemical impedance spectroscopy, which is often data-scarce and time-consuming. By providing real-time estimation of activation and ohmic overpotentials, the proposed framework enables grid operators and energy managers to monitor stack health and mitigate degradation risks more effectively. This capability is particularly vital for the integration of hydrogen multi-energy systems into smart grids, where reliable performance baselines support risk-aware low-carbon optimization and enhance overall grid stability. Consequently, the developed methodology serves as a critical computational tool for accelerating the transition toward scalable and sustainable hydrogen production infrastructures.
To further justify the selection of the MLP architecture, a comprehensive benchmarking study was quantitatively conducted against five established regression methodologies: Logistic Regression, Random Forest, Gradient Boosting, Support Vector Machines (SVMs), and LightGBM. For the T-I MLP Model, the proposed architecture achieved an MSE of 3.66 × 10⁻⁵ (R2 = 0.99996), which is approximately 521 times lower than the best-performing alternative, Gradient Boosting (MSE: 0.0191, R2 = 0.9159). For the P-I MLP Model, the reliability gap was even more substantial; while the proposed MLP maintained an MSE of 9.75 × 10⁻⁶ (R2 = 0.99958), alternative ensemble and kernel methods such as Random Forest (MSE: 0.0695) and SVM (MSE: 0.1112) exhibited significantly higher error rates, with Gradient Boosting demonstrating poor alignment (R2 = 0.1666). These quantitative metrics confirm that the developed dual-modular framework is uniquely capable of capturing the intricate, non-linear electrochemical dynamics of PEMEs with superior precision and robustness compared to standard regression methodologies.
However, it is explicitly acknowledged that these exceptionally high correlation coefficients and minimal error metrics primarily reflect the process of function fitting to a deterministic numerical framework derived from a validated mathematical model [
20]. This modeling task is inherently less complex than predicting real-world experimental data, where sensor inaccuracies, environmental fluctuations, and stochastic noise introduce significant operational variability. The inherent lack of stochastic noise and measurement uncertainties in the synthetic dataset allows the MLP architectures to achieve near-perfect mapping of the underlying electrochemical relationships. Consequently, while the framework demonstrates exceptional precision in capturing the underlying physical logic of the baseline simulation, the current results are presented as a high-fidelity computational benchmark and computer surrogate rather than a direct predictor of raw empirical stack performance. The development of such high-fidelity predictive surrogates is strategically consistent with recent advancements in hydrogen energy systems, including risk-aware low-carbon optimization strategies, the implementation of PINNs for the aging characterization of electrochemical components, and investigations into the coupled effects of transport characteristics and voltage losses in large-area proton exchange membrane technologies [
25,
26,
27].
The scalability of the suggested methodology is mainly due to three essential features. The modular architecture of the ANN framework guarantees adaptability to diverse PEME configurations, facilitating uncomplicated adjustments to align with variations in design and operating characteristics. The generated models exhibit robust generalization capabilities, as seen by their excellent predicted accuracy across several test situations, facilitating their application to diverse datasets and real-world electrolyzer systems. Third, the optimization of hyperparameters and data-partitioning techniques decreases computing complexity, facilitating efficient model training and execution. While these qualities suggest a foundational potential for scalability, it is recognized that the current methodology is based on a controlled numerical study. The transition to industrial applications would require further validation against larger empirical datasets and diverse PEME configurations to account for real-world operational variability. Therefore, the framework is presented as a scalable computational benchmark that requires extensive external validation before it can be considered ready for direct industrial implementation.
Regarding generalization capability, the proposed modular framework serves as a scalable benchmark for PEME performance. However, it is recognized that the current models are trained on data derived from the specific theoretical modules established by Abhishek et al. [
20]. Consequently, while internal generalizability is confirmed through a 15% hold-out test subset, the direct application to diverse industrial or experimental PEM electrolyzers may require fine-tuning or transfer learning. The established methodology provides the computational infrastructure necessary for such scaling, although the transition to real-world industrial environments remains a focal point for future validation phases.
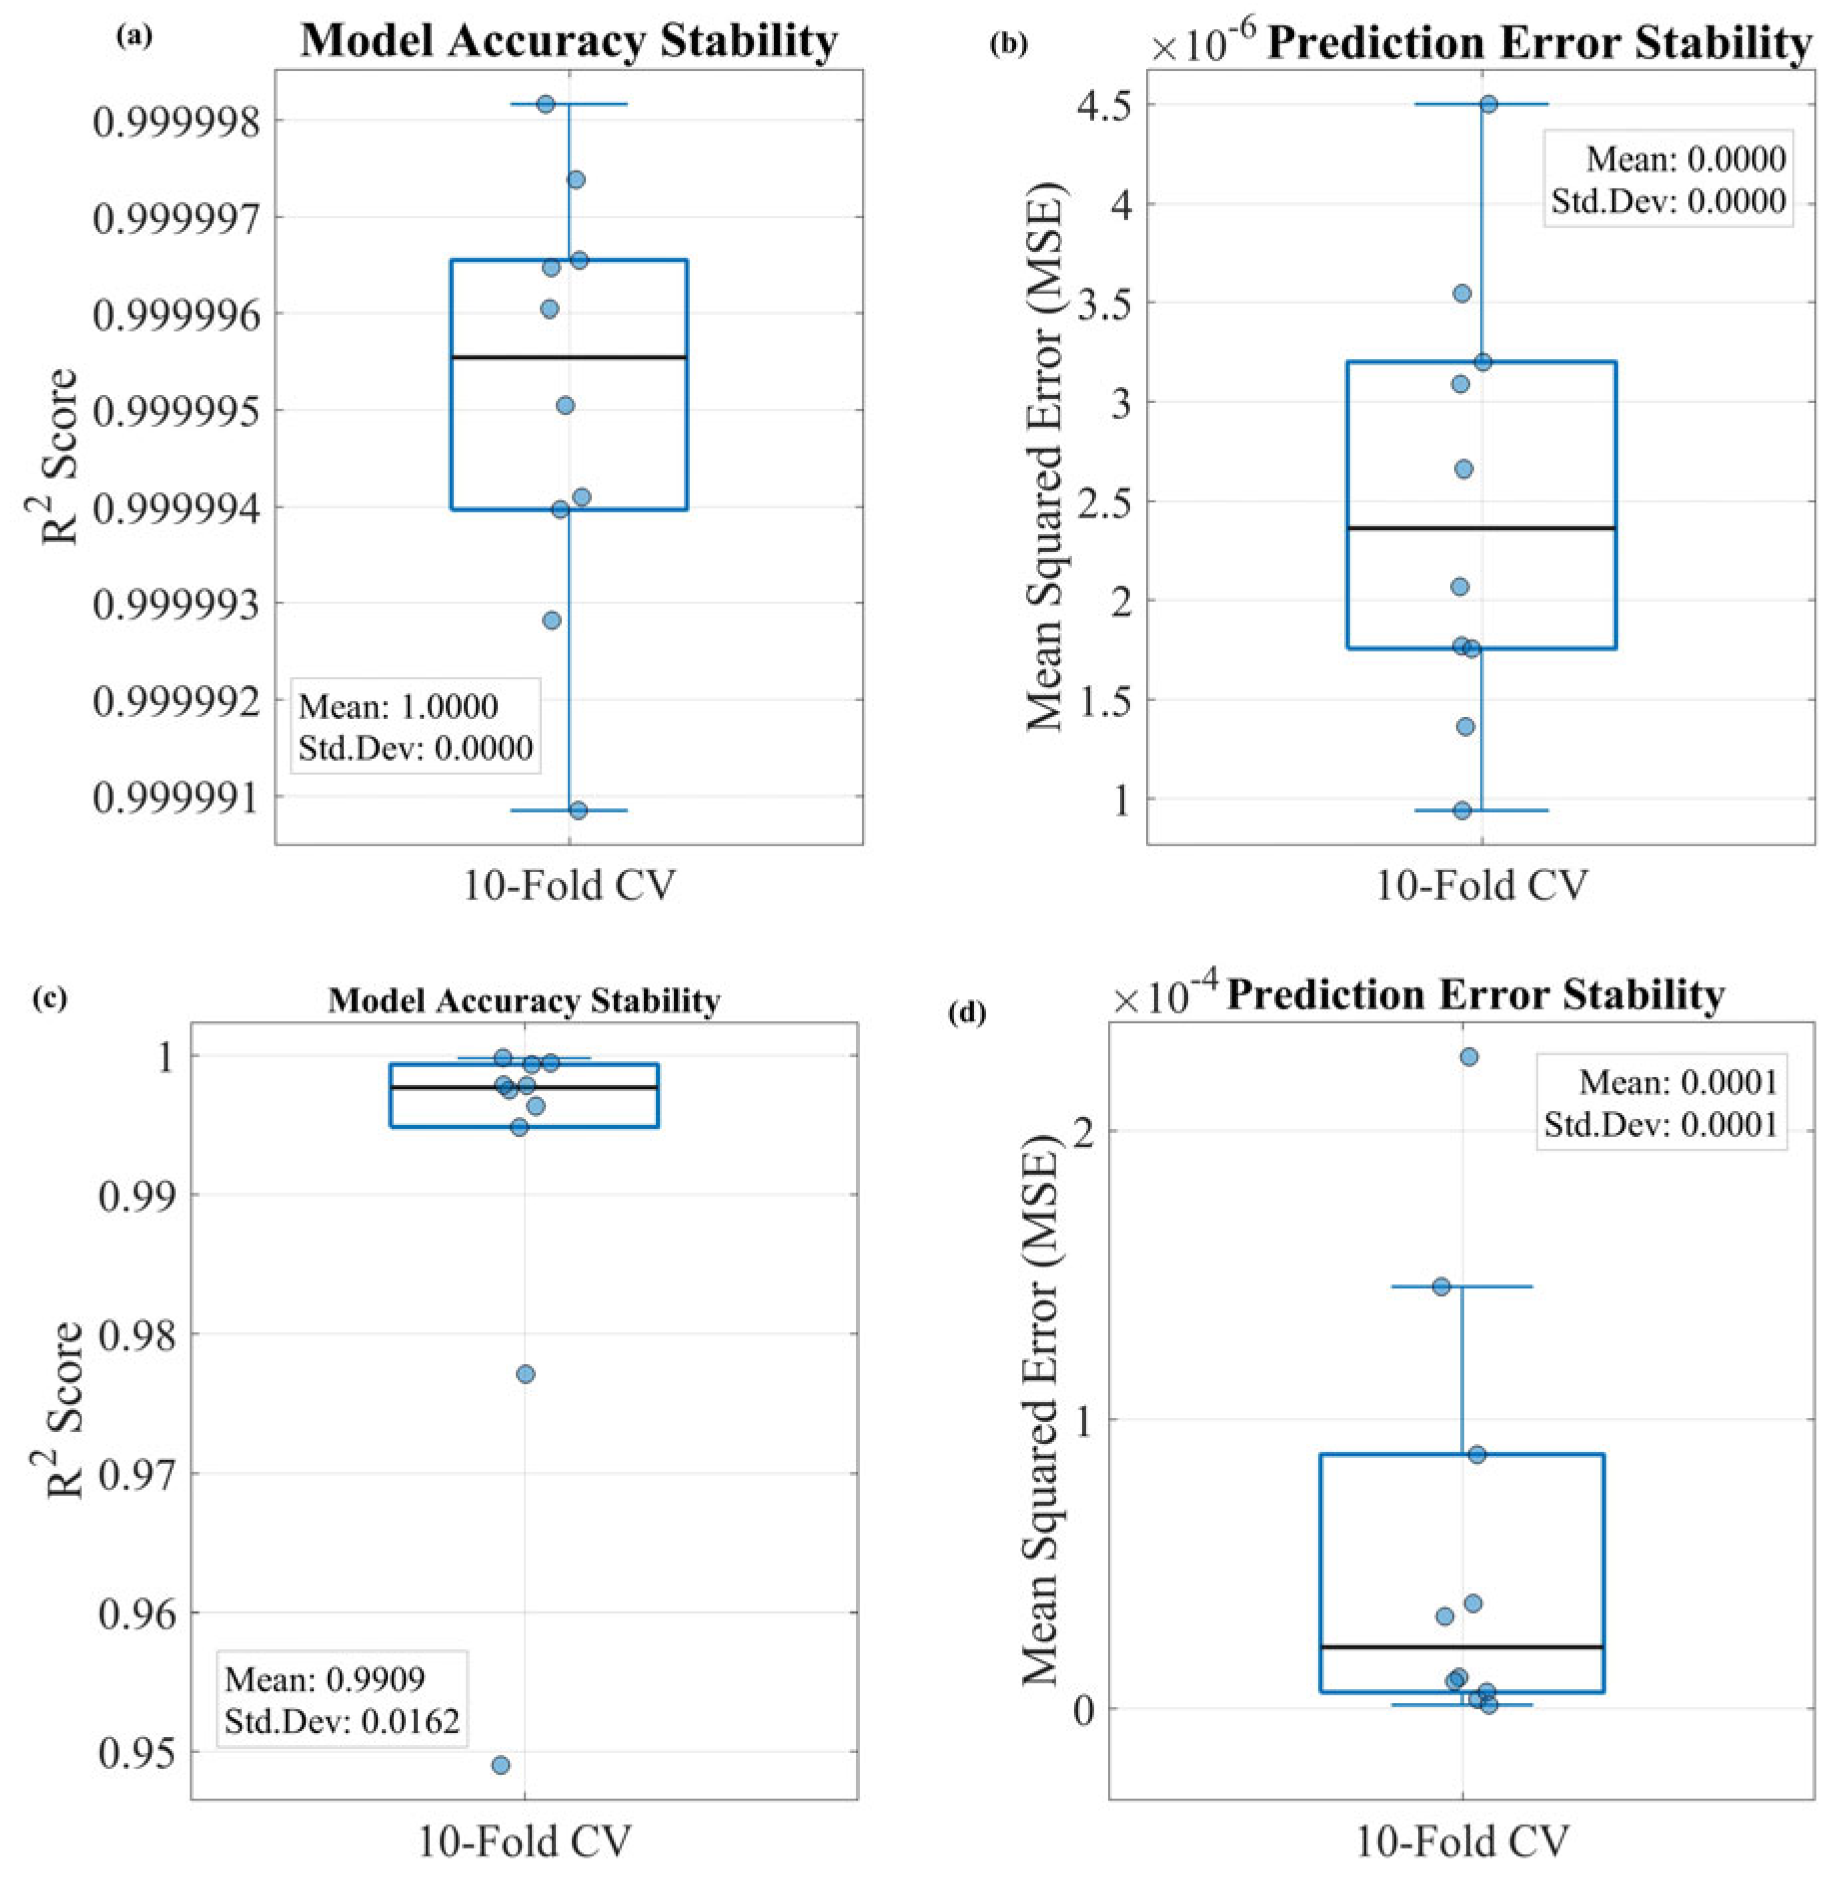
To ensure that the reported high accuracy was not a result of random chance during data partitioning and to enhance the statistical significance of the findings, a 10-fold cross-validation procedure was implemented for both ANN models. This rigorous validation technique allows for a more comprehensive assessment of model stability by iteratively testing the architecture on multiple distinct subsets of the foundational data. As illustrated in
Figure 13, the box plots for Model Accuracy Stability (R
2) and Prediction Error Stability (MSE) confirm the exceptional reliability of the proposed framework. For the T-I MLP Model, the correlation coefficient remained remarkably stable, with values consistently exceeding 0.99999 across all ten folds, while the MSE was maintained within a narrow interval of 1.0 × 10
−6 to 4.0 × 10
−6. For the P-I MLP Model, despite the smaller sample size, cross-validation yielded a mean R
2 of 0.9909 and a mean MSE of approximately 0.0001, effectively mitigating the concerns regarding random errors associated with data splitting. These results demonstrate that the dual-modular MLP architecture functions as a robust computational surrogate that maintains high-fidelity performance across various training and validation combinations, thereby reinforcing the scientific credibility of this study’s conclusions.
To address potential concerns regarding data leakage and to explain the origin of the exceptionally high predictive performance metrics (R
2 > 0.999, MSE < 10
−5), the complete data-processing and model-building pipelines were thoroughly audited. First, strict pipeline isolation was enforced during data preprocessing. Normalization-scaling parameters (minimum and maximum bounds) were computed strictly from the training subset alone. These parameters were subsequently applied to transform the validation and test subsets independently, ensuring that feature distribution properties of the test set never contaminated the training phase. Second, the extraordinary predictive fidelity is attributed to both physical and data-driven characteristics inherent to the system: (i) Deterministic data characteristics: The target dataset originates from validated electrochemical numerical simulations governed by deterministic thermodynamic and kinetic equations (such as the Nernst relationship, Butler–Volmer activation kinetics, and Ohmic transport resistance). Unlike experimental field data subject to stochastic noise and measurement artifacts, numerical physics-based PEME data exhibits highly smooth, continuous, and non-chaotic functional manifolds. (ii) Optimal architecture mapping: The multi-layer perceptron (MLP) network, structured with 15 hidden neurons and non-linear activation functions, provides sufficient non-linear functional capacity to perfectly learn the smooth multi-variable polarization behavior without underfitting or over-parameterization. Third, the robustness against data leakage and dataset-partitioning bias was further verified through the 10-fold cross-validation analysis (
Figure 13). Cross-validation yielded consistently high-performance metrics across all unseen folds (R
2 > 0.999, MSE < 10
−5), confirming that the model generalizes seamlessly across independent data splits rather than capitalizing on a localized sampling anomaly.