Article

Lithology-Dependent Fracture Propagation in Ultra-Large True-Triaxial Hydraulic-Fracturing Experiments


1
Unconventional Petroleum Research Institute, China University of Petroleum (Beijing), Beijing 102249, China
2
Oil and Gas Technology Research Institute, PetroChina Huabei Oilfield Company, Renqiu 062500, China
*
Author to whom correspondence should be addressed.
Processes 2026, 14(16), 2647; https://doi.org/10.3390/pr14162647
Submission received: 18 July 2026 / Revised: 9 August 2026 / Accepted: 13 August 2026 / Published: 19 August 2026
(This article belongs to the Section Energy Systems)

Abstract

Tight reservoirs commonly exhibit low permeability and pronounced lithological heterogeneity, resulting in complex interactions among far-field stress, local structural weakness, and fluid-driven fracture propagation. In this study, four non-replicated 2 m × 2 m × 1 m physical-model specimens representing tight glutenite, tight sandstone, and No. 3 coal rock from the Huabei Oilfield were investigated using an ultra-large true-triaxial hydraulic-fracturing system. Surface-fracture observations, microseismic monitoring, and high-frequency wellhead-pressure measurements were integrated to compare fracture responses under lithology-specific combinations of injection rate, fluid viscosity, perforation configuration, and stress state. The tested glutenite cases exhibited branched or localized fracture patterns depending on the combined treatment configuration; the sandstone case was dominated by a throughgoing main fracture approximately aligned with the principal-stress direction; and the coal-rock case showed extensive participation of bedding and cleat systems. These morphological differences were accompanied by distinct pressure and microseismic signatures, indicating different pathways of hydraulic-energy redistribution and fracture activation. For the two glutenite cases, the combined change from a single-perforation configuration at 0.5 m3/min to three helical perforations at 120° and 0.7 m3/min was associated with a 42.2% larger microseismic-derived stimulated reservoir volume (SRV). Taken together, these responses indicate a shift from stronger far-field-stress-controlled localization in the comparatively uniform sandstone to progressively greater local structural control by heterogeneous interfaces in glutenite and by bedding/cleat discontinuities in coal rock. Because each configuration was represented by a single specimen and several experimental variables changed simultaneously among cases, the observed differences are interpreted as case-specific mechanistic trends rather than statistically established universal relationships. The results show the value of combining fracture morphology, microseismic spatial evolution, and pressure dynamics for interpreting lithology-dependent fracture propagation in ultra-large physical models and for developing qualitative, lithology-adapted hydraulic-fracturing concepts.

1. Introduction

Tight reservoirs are important targets for unconventional hydrocarbon development, but their efficient exploitation remains challenging because low porosity and permeability commonly coexist with strong lithological and structural heterogeneity. In the target intervals of the Huabei Oilfield, tight glutenite, tight sandstone, and coal-bearing formations occur over large vertical intervals and may alternate frequently. Typical porosity is approximately 2–8%, and permeability is commonly lower than 1 × 10⁻¹⁵ m2. Natural productivity is therefore limited, and hydraulic fracturing is required to create or reactivate connected flow pathways [1,2].
Hydraulic-fracture propagation in such reservoirs reflects competition among the far-field stress field, local mechanical heterogeneity, pre-existing structural planes, and hydraulic energy supplied to the fracture system. With increasing burial depth, the magnitude and anisotropy of in situ stress may increase, strengthening the tendency of newly created fractures to propagate along mechanically favorable directions. At smaller spatial scales, however, grains, cemented interfaces, bedding planes, and natural fractures perturb the local stress field and modify the resistance encountered by an advancing fracture tip. Multiple simultaneously active fractures may further redistribute stress through fracture–fracture interaction. Consequently, fracture growth in heterogeneous tight reservoirs cannot be described solely by the far-field principal stresses; it results from a dynamic competition between stress-controlled localization and structurally controlled diversion, branching, or reactivation.
Laboratory experiments, numerical simulations, and field monitoring have provided complementary insights into hydraulic-fracture propagation. Conventional small-scale laboratory tests are effective for investigating fundamental initiation and propagation mechanisms under controlled stress conditions [3,4], while numerical approaches such as FEM, DEM, BEM, and peridynamic methods have clarified fracture interaction, diversion, and propagation in heterogeneous or naturally fractured media [5,6,7,8]. Field-scale microseismic monitoring can characterize the spatial extent and temporal evolution of stimulated regions, although the interpretation of small branches and individual activated structural planes remains uncertain [9,10]. Recent studies have further addressed fluid–rock interaction, acoustic-emission and true-triaxial fracture responses, coal and layered-rock propagation, and heterogeneous fracture networks [11,12,13,14,15,16,17,18,19]. Other recent work has examined perforation-controlled propagation and related fracture-evolution mechanisms [20,21,22,23,24,25].
Within the scope of these studies, three issues remain particularly relevant to the present experiments. First, conventional core-scale specimens provide limited propagation distance and contain fewer large heterogeneities or structural planes within a single test volume. Second, comparisons among markedly different reservoir lithologies under a common ultra-large true-triaxial framework remain relatively limited. Third, surface-fracture morphology, microseismic spatial evolution, rupture type, and injection-pressure dynamics are often interpreted separately even though their correspondence can help distinguish localized fracture advance from distributed branching or structural-plane activation. Accordingly, the present study examines four representative 2 m × 2 m × 1 m hydraulic-fracturing cases involving tight glutenite, tight sandstone, and No. 3 coal rock. The working hypotheses are that (i) lithological heterogeneity and pre-existing structural planes are associated with distinguishable fracture and microseismic spatial patterns; (ii) in the two glutenite cases, the combined use of more initiation sites and a higher injection rate is associated with a more spatially distributed fracture response; and (iii) lithology-dependent fracture-growth behavior is reflected consistently in post-test morphology, microseismic activity, and pressure evolution. Because each treatment configuration was tested once and several variables changed among cases, the objective is to identify internally consistent mechanistic trends rather than to establish universal single-factor criteria.

2. Materials and Methods

2.1. Microseismic Event Location and Rupture-Type Classification

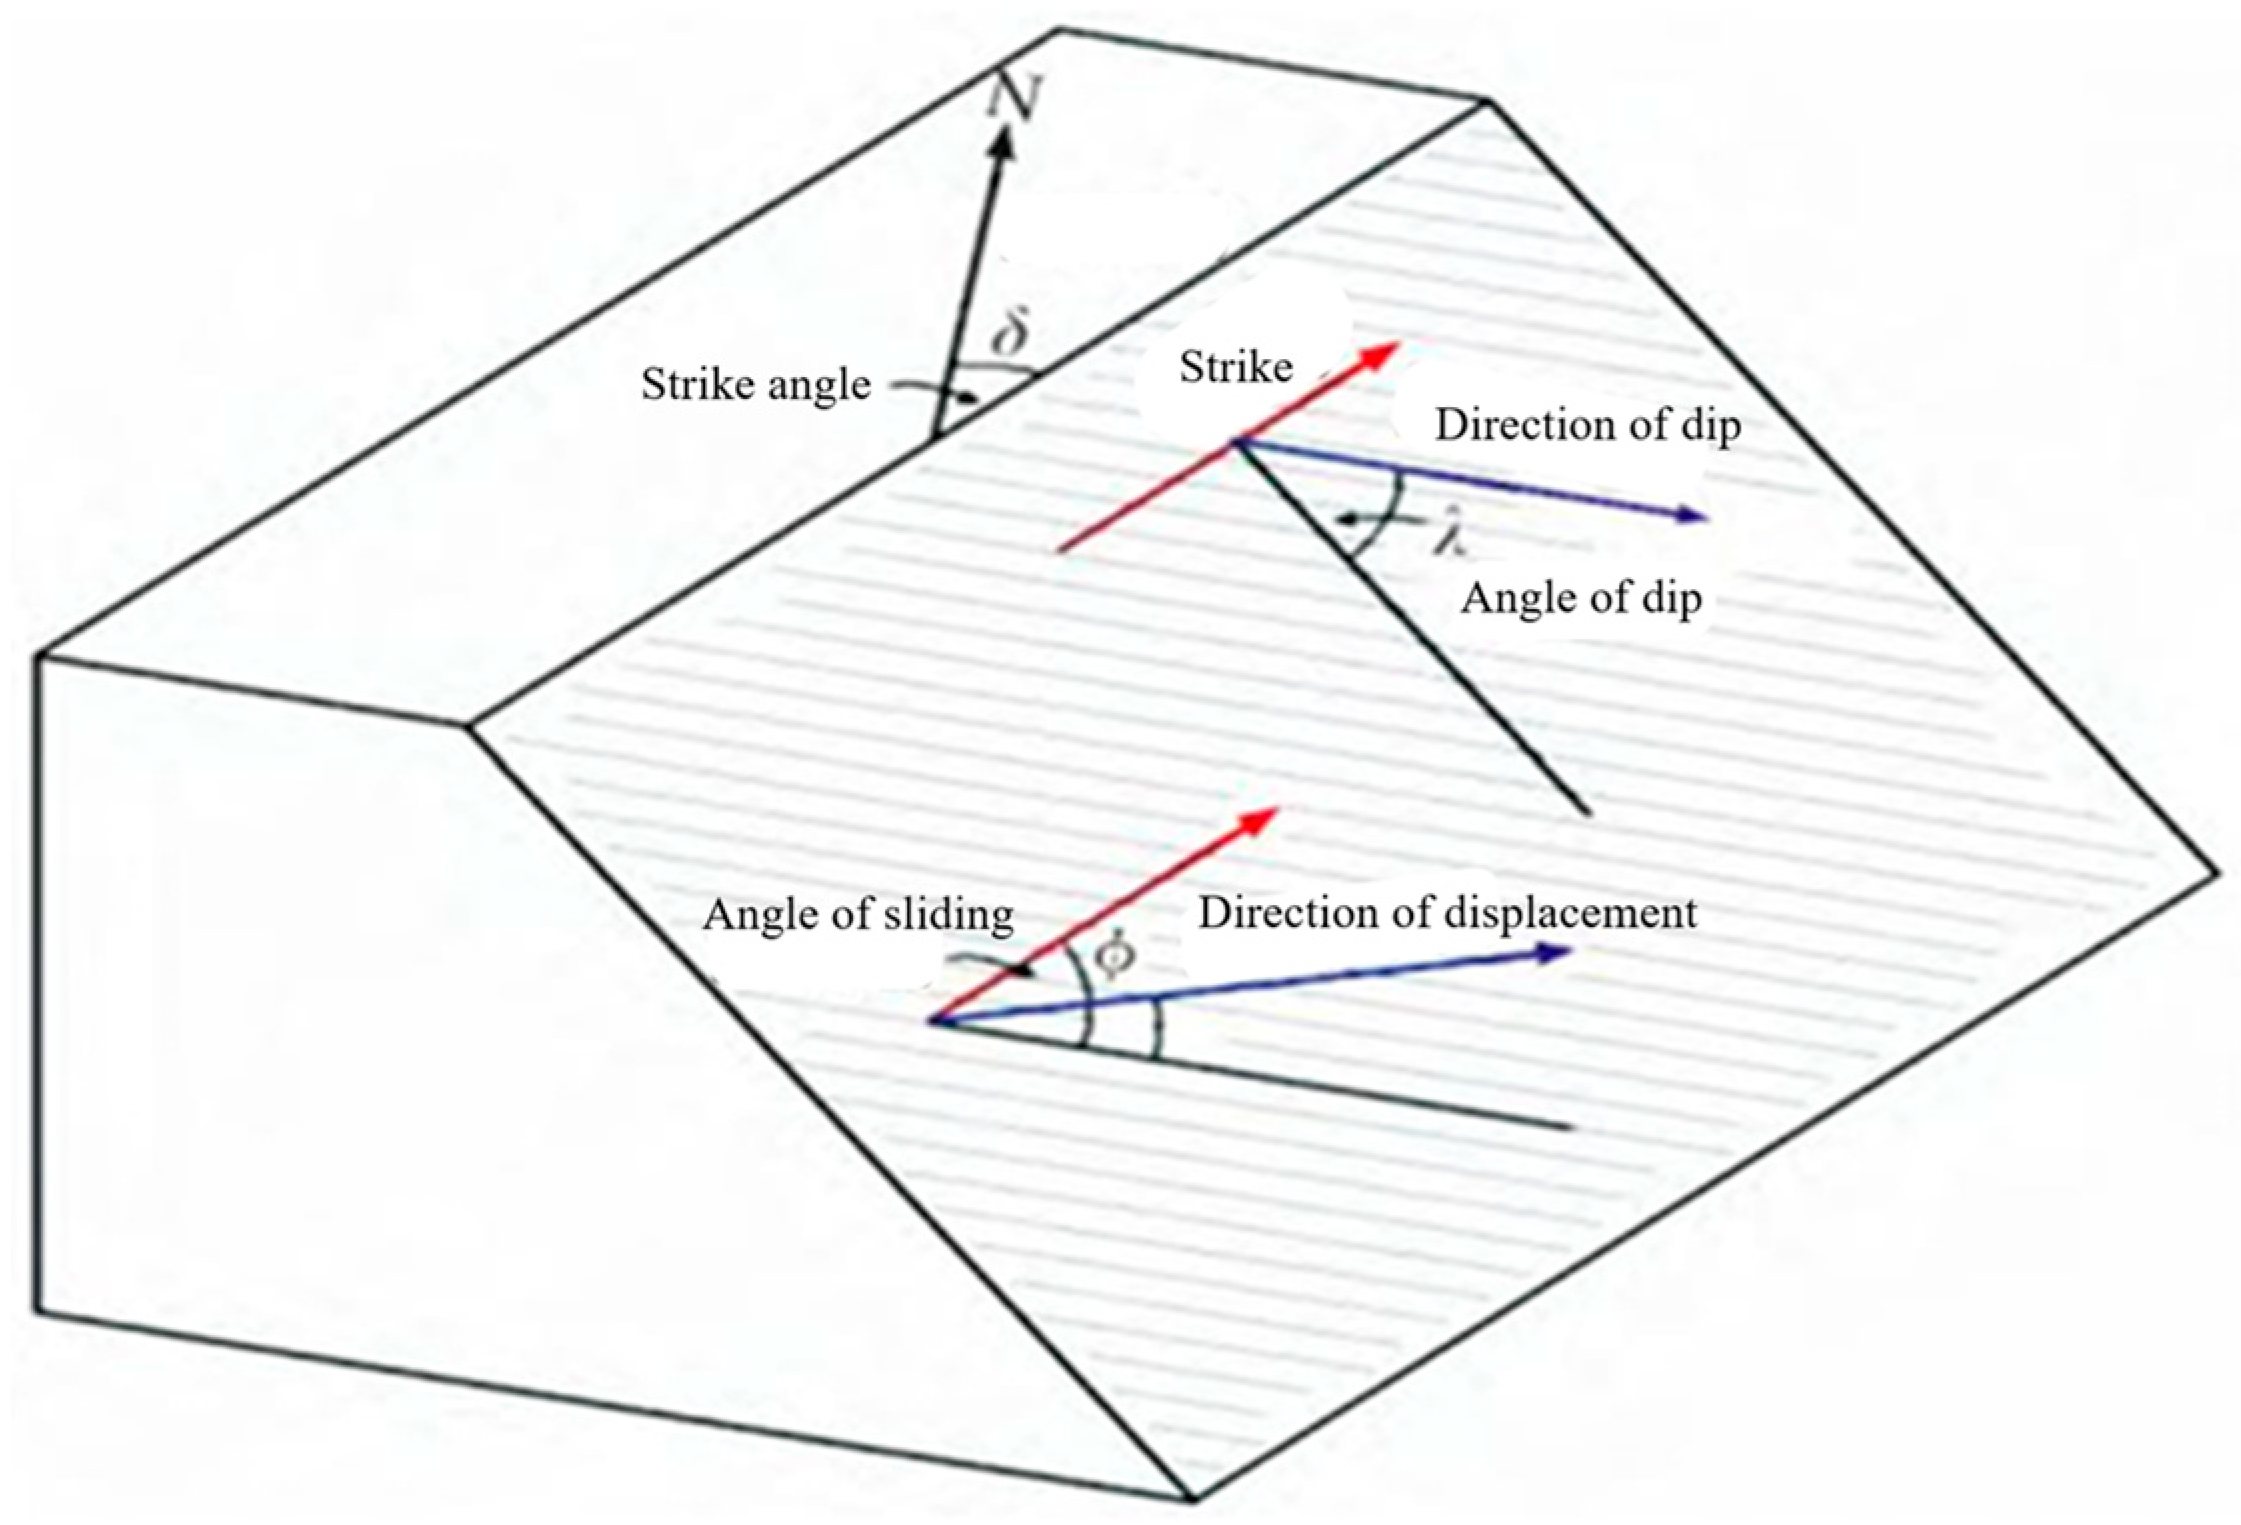
Rock rupture during hydraulic fracturing releases transient elastic waves that can be recorded as microseismic or acoustic-emission signals [9,12]. In the experiments, multiple sensors were arranged on the specimen surface. Event locations were determined from arrival-time differences and the adopted wave-velocity model using an Eikonal-equation-based positioning procedure. Signal characteristics were then processed using the original full moment-tensor inversion workflow to classify events into tensile- and shear-dominated categories, thereby providing a descriptive indicator of rupture behavior during fracture propagation. The relationship among fault-plane parameters and the seismic moment tensor is illustrated in Figure 1. Complete records of sensor bandwidth, sensitivity, event-level quality-control thresholds, and source-location uncertainty are not available in the retained experimental records. Accordingly, the present analysis does not assign statistical significance to small differences in rupture-type percentages and treats the microseismic results primarily as comparative spatial and temporal observations.
The full moment-tensor inversion can be expressed in matrix form as follows
M   =   M 0 M x x M x y M x z M y x M y y M y z M z x M z y M z z
where M0 is the seismic moment and Mxx, Mxy and the other terms are moment-tensor components. The rupture attributes were obtained from their relationships with the fault-plane parameters, including strike angle δ, dip angle φ, and slip angle λ. Tensile-type events are interpreted as being consistent with opening deformation, whereas shear-type events may reflect relative sliding along cemented interfaces, bedding planes, cleats, or grain boundaries. Because the retained records do not allow an independent reconstruction of the original inversion uncertainty, these classifications are used qualitatively rather than as precise statistical measures of lithology-dependent rupture partitioning.
M x x   =   sin δ cos λ sin 2 φ     sin 2 δ sin λ sin 2 φ M y y   =   sin δ cos λ sin 2 φ     sin 2 δ sin λ cos 2 φ M z z   =   sin 2 δ sin λ M x y   =   sin δ cos λ cos 2 φ   +   sin 2 δ sin λ sin 2 φ M x z   =   cos δ cos λ cos φ     cos 2 δ sin λ sin φ M y z   =   cos δ cos λ sin φ     cos 2 δ sin λ cos φ

2.2. Microseismic Event-Cloud Processing and SRV Estimation

Microseismic event locations were used to estimate stimulated reservoir volume (SRV) [10]. In the original processing workflow, the event cloud was treated using surface elements, three-dimensional Delaunay triangulation, and a minimum-volume enclosing-ellipsoid procedure. The positioning objective was based on the Eikonal equation, and the resulting event-cloud geometry was used to obtain the SRV values reported in this study. Because the retained data do not contain the event-level coordinates, event-selection metadata, or location-error records required for independent reprocessing, the reported SRV outputs are interpreted only as comparative geometric indicators among the four tested cases rather than as statistically validated absolute volumes.
1 v ( θ ) 2   =   τ x 2   +   τ z 2 t 4   =   t 1   +   2 ( l / v ( θ ) ) 2     t 3 t 2 2 O ( X )   =   1 2 X     X P T C X 1 X     X P + 1 2 d o b s     d c a l c T C D 1 d o b s     d c a l c
Here, v(θ) is the phase velocity of the seismic wave, in m/s; θ is the phase angle of seismic-wave propagation, in degrees; τ is the travel time, in s; t1, t2, and t3 are the travel times at three vertices of the same grid; t4 is the travel time at an unknown vertex; l is the grid size, in m; t0 is the a priori event occurrence time; and XP is the mean of the prior data. The microseismic-derived SRV used in this paper represents the spatial envelope of detectable fracture-related deformation. In coal rock, this envelope may include both newly created fractures and reactivated bedding or cleat systems. It should therefore not be interpreted as the volume of newly created or effectively propped fractures. A formal uncertainty propagation or confidence interval cannot be reconstructed from the retained dataset, and this limitation is considered explicitly in the Discussion.
The microseismic-derived SRV definition adopted here is consistent with field-scale microseismic SRV in the limited sense that both use the spatial distribution of detected seismic events to delineate the extent of stimulated or deforming rock [10]. However, the resulting volume depends on the event-selection and geometric-envelope procedure and should not be regarded as a unique physical fracture volume. Alternative envelope definitions may produce different absolute values for the same event cloud. Because the archived event-level data are unavailable for retrospective reprocessing, the original Delaunay/ellipsoidal workflow was retained to preserve internal consistency among the four cases rather than to demonstrate that it is superior to other SRV reconstruction methods. Accordingly, the SRV values are used only for relative cross-case comparison and are not directly equated with field-scale propped or conductive fracture volume.

2.3. Experimental Materials

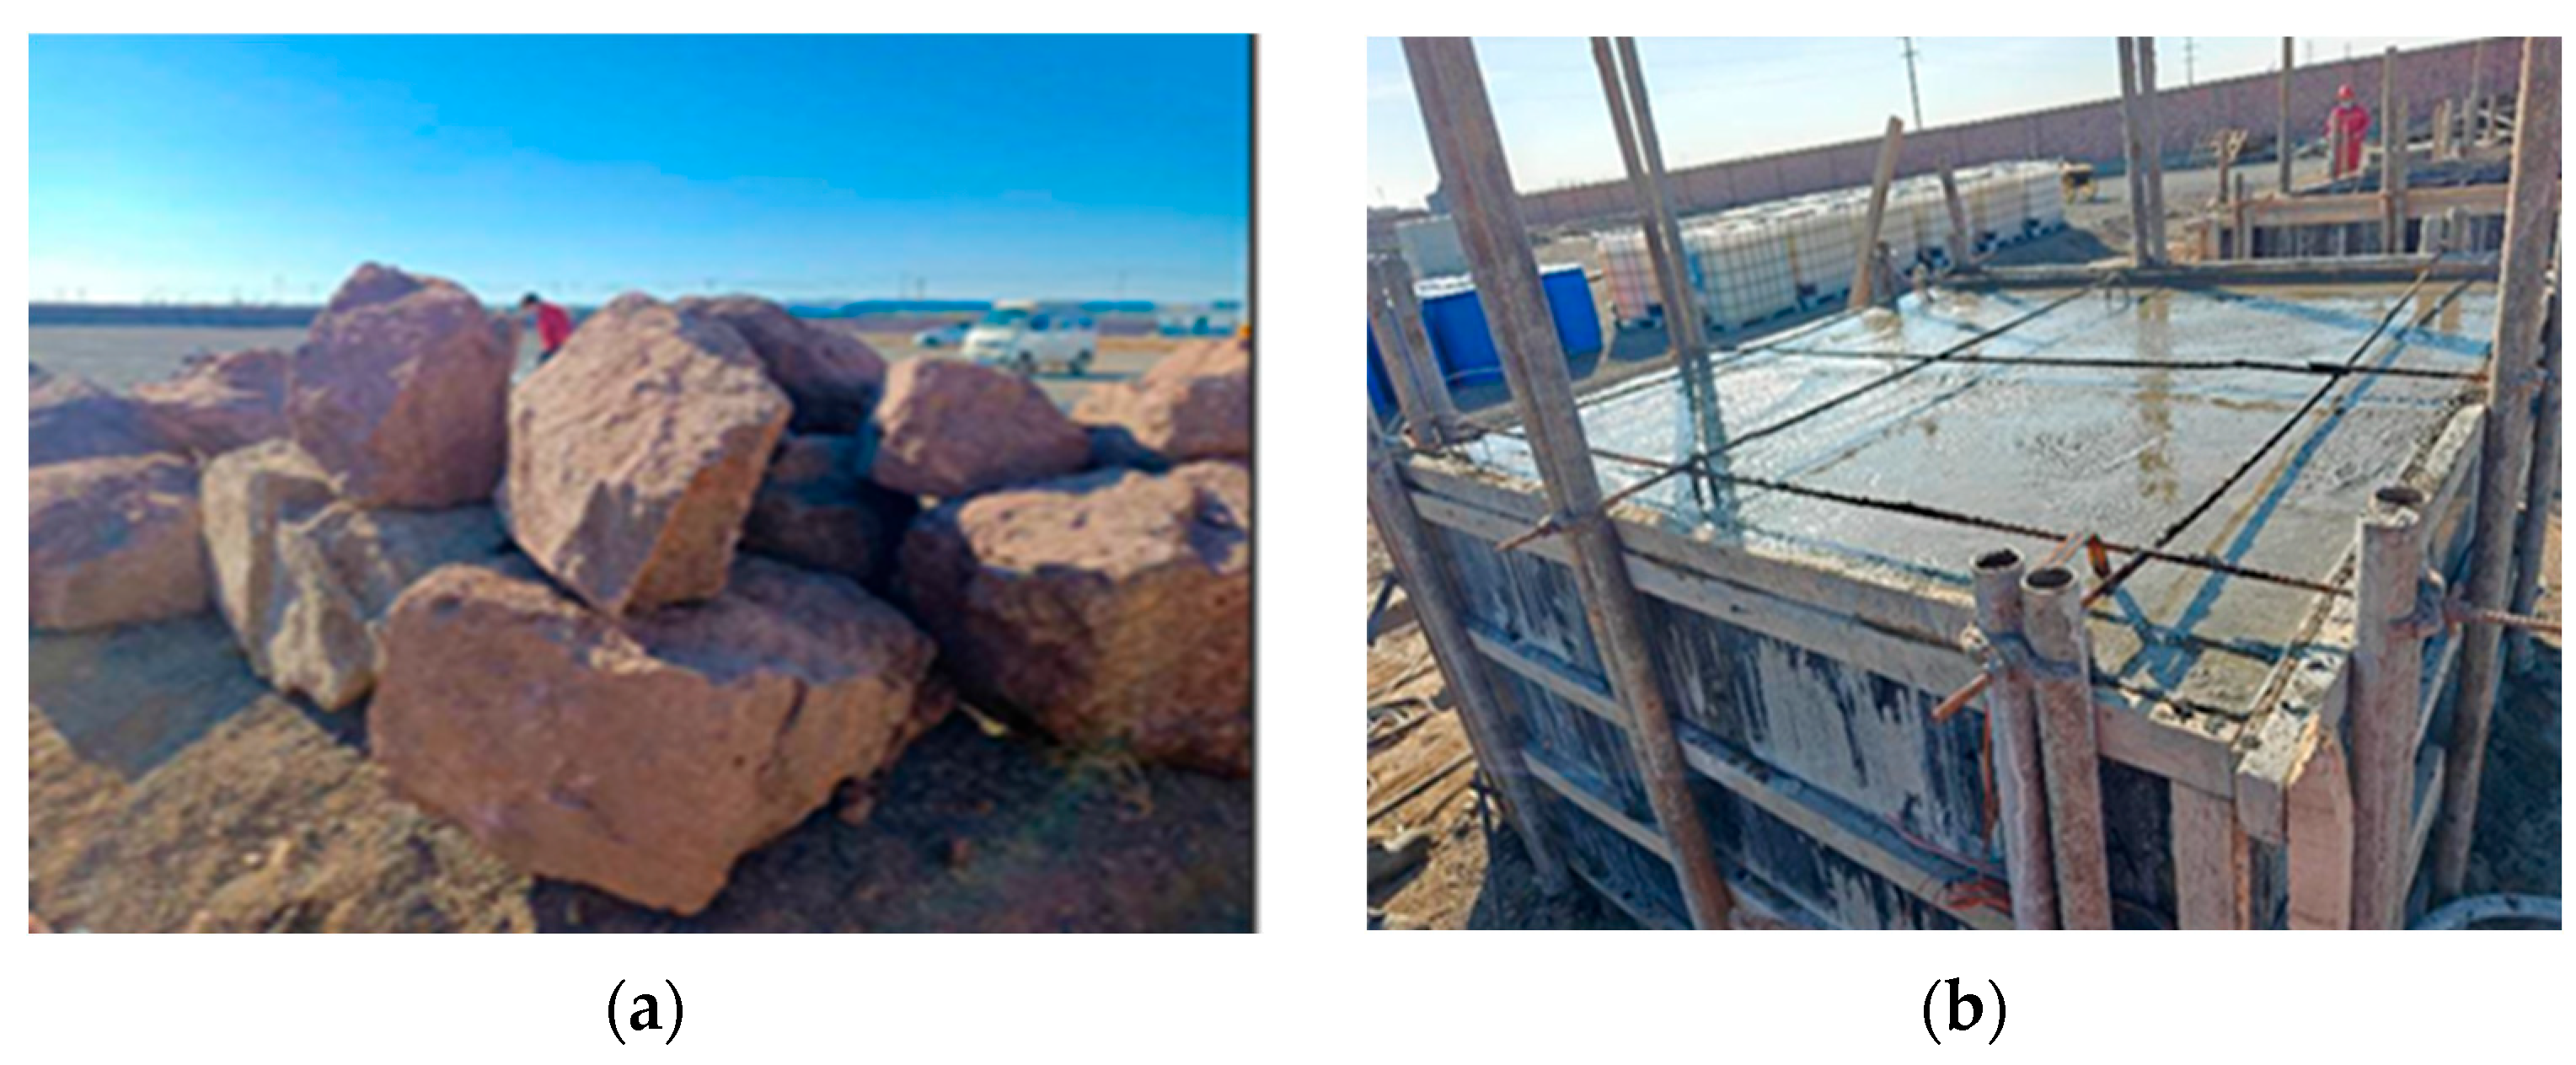
Four ultra-large physical-model specimens with dimensions of 2 m × 2 m × 1 m were prepared to reproduce representative lithological structures and field-inspired conditions of target tight reservoirs. The workflow included outcrop selection, block cutting, artificial cement shaping where required, standardized curing, and macroscopic quality inspection (Figure 2). The specimen set included two tight-glutenite blocks, one tight-sandstone block, and one No. 3 coal-rock block, covering the principal lithologies considered in the Huabei Oilfield [13,14]. The retained experimental records do not contain a complete set of companion measurements for UCS, Young’s modulus, Poisson’s ratio, tensile strength, fracture toughness, density, and permeability for all four ultra-large specimens. These quantities are therefore not reconstructed from literature values, and the interpretation avoids quantitative claims based on unmeasured mechanical-property differences.
The tight-glutenite specimens contained approximately 65% quartz, 20% feldspar, and 15% lithic fragments. They were artificially cemented using P.O42.5R high-strength cement with a water–cement ratio of 0.4 and cured for 28 days to form a heterogeneous large block containing cemented interfaces. The tight-sandstone specimen contained approximately 75% quartz, 15% feldspar, and 10% clay minerals; its grains were well sorted and comparatively uniformly cemented. The No. 3 coal-rock specimen had bedding spacing of approximately 1–3 mm and orthogonal face and butt cleats; because natural structural planes were well developed, the block was directly cut and shaped without artificial cementation. Quality inspection confirmed that the specimens were intact and had no visible macroscopic cracks, cavities, or debonding zones before testing.
Water-based fracturing fluids were used at two nominal viscosity levels. The low-viscosity cases used approximately 5 mPa·s fluid, whereas the tight-sandstone case used approximately 40–45 mPa·s fluid. The proppant was 40/70-mesh quartz sand. The sand ratio was 5% for the tight-glutenite and coal-rock cases and 10% for the tight-sandstone case. The retained experimental records do not contain the rheometer model, test temperature, or shear-rate history needed for a complete rheological characterization; therefore, the reported viscosities are treated as nominal experimental set values and no independent viscosity law is inferred from the present dataset.

2.4. Construction of the Simulated Cased-And-Perforated Wellbore

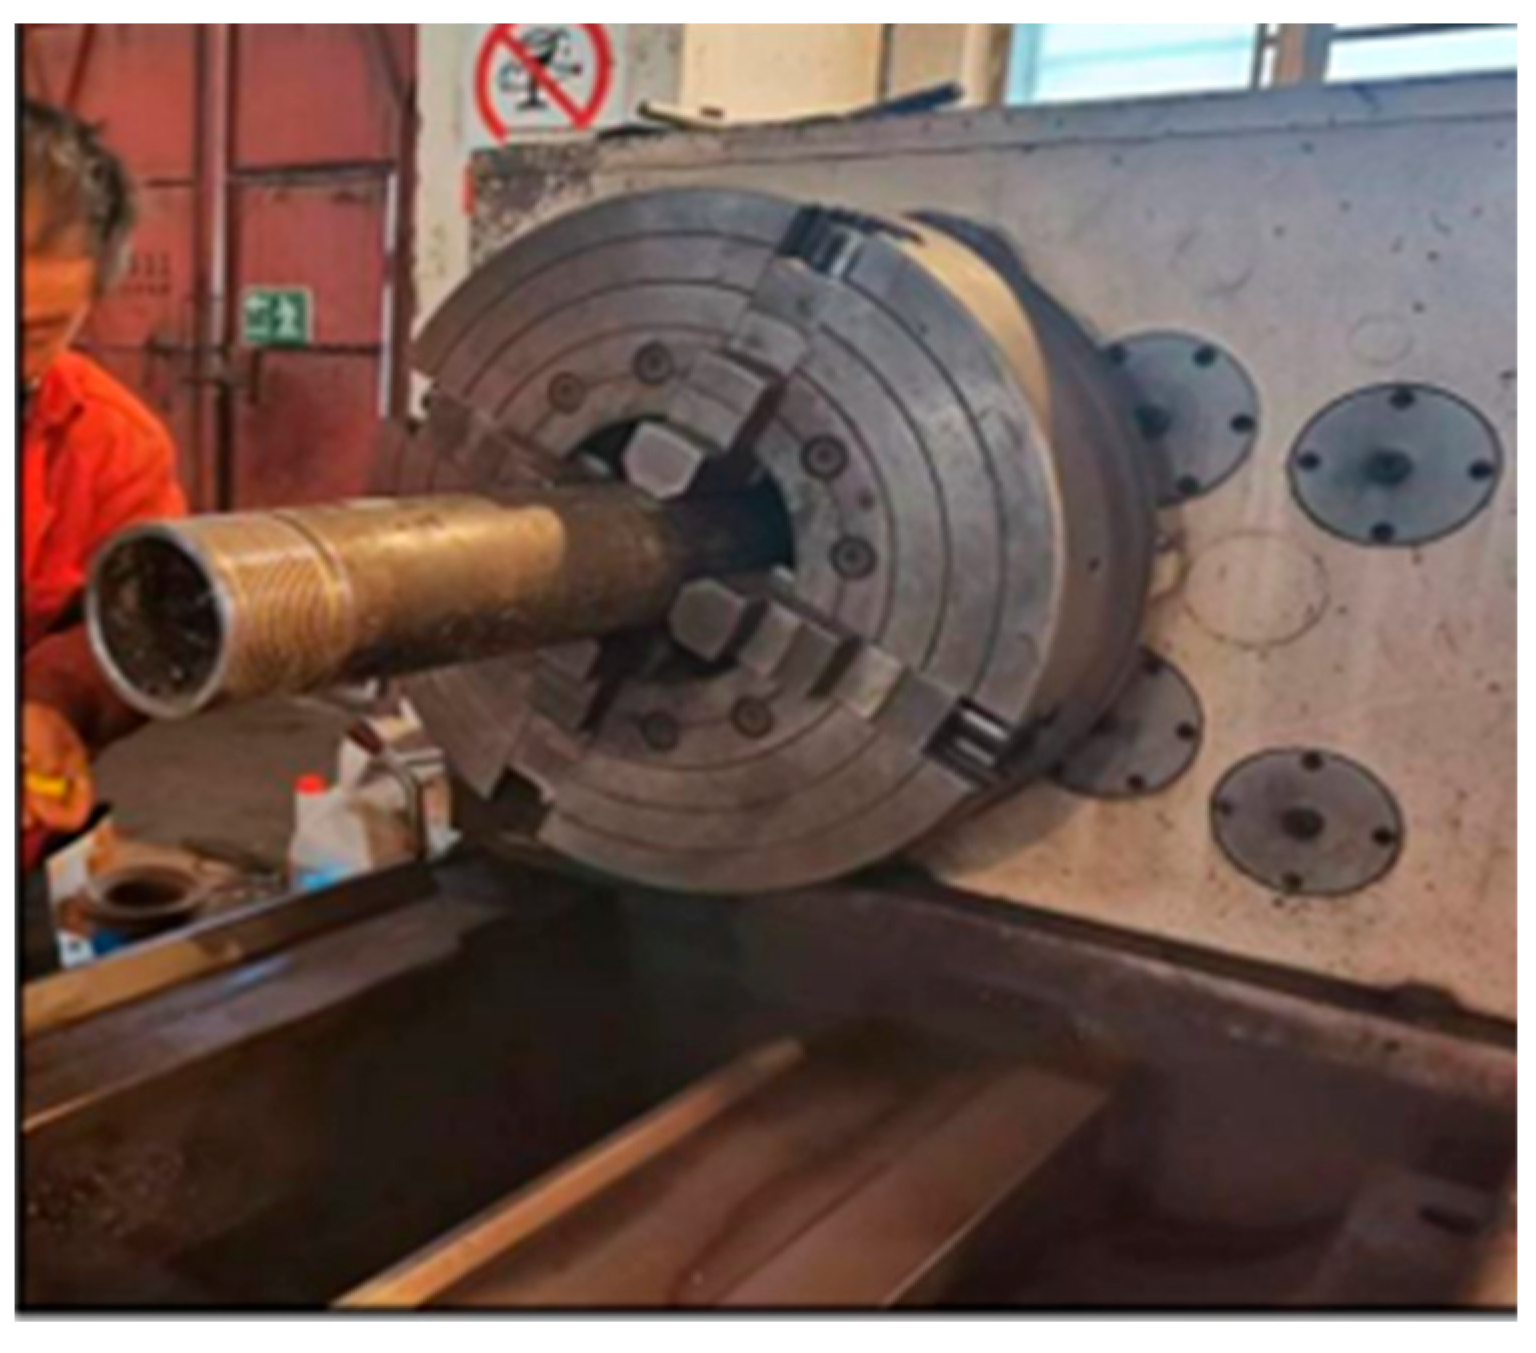
Four simulated wellbore–perforation configurations were constructed with reference to field-inspired fracturing practices and the relevant hydraulic-fracturing design specification [26]. Casing sections used in the field were cut as simulated wellbores, and both ends were polished to ensure sealing performance during high-pressure connection (Figure 3). Tight-glutenite Specimen 1 and tight-sandstone Specimen 3 used three helical perforations with a 120° phasing angle, providing several circumferential initiation locations. Tight-glutenite Specimen 2 used a single perforation aligned with the maximum horizontal principal-stress direction. The coal-rock specimen used two opposed horizontal perforations with a 180° phasing angle to represent a contrasting configuration adapted to the layered coal structure. Because the retained records do not contain a complete scaling derivation for perforation geometry, the present study treats these schemes as field-inspired experimental configurations rather than as a validated geometrically scaled representation of field perforations. Table 1 lists perforation parameters used in the ultra-large true-triaxial tests.
Table 1. Perforation parameters used in the ultra-large true-triaxial tests.
No.LithologyWellbore DiameterNo. of PerforationsPhasing AnglePerforation DiameterSpacing
1Tight glutenite139.7 mm3120 deg8 mm6.7 cm
2Tight glutenite139.7 mm1-8 mm-
3Tight sandstone (Sulige Su 75)114.3 mm3120 deg8 mm6.7 cm
4No. 3 coal rock139.7 mm2180 deg8 mm-
Note: “-” indicates that no applicable axial perforation spacing was retained in the archived experimental record.
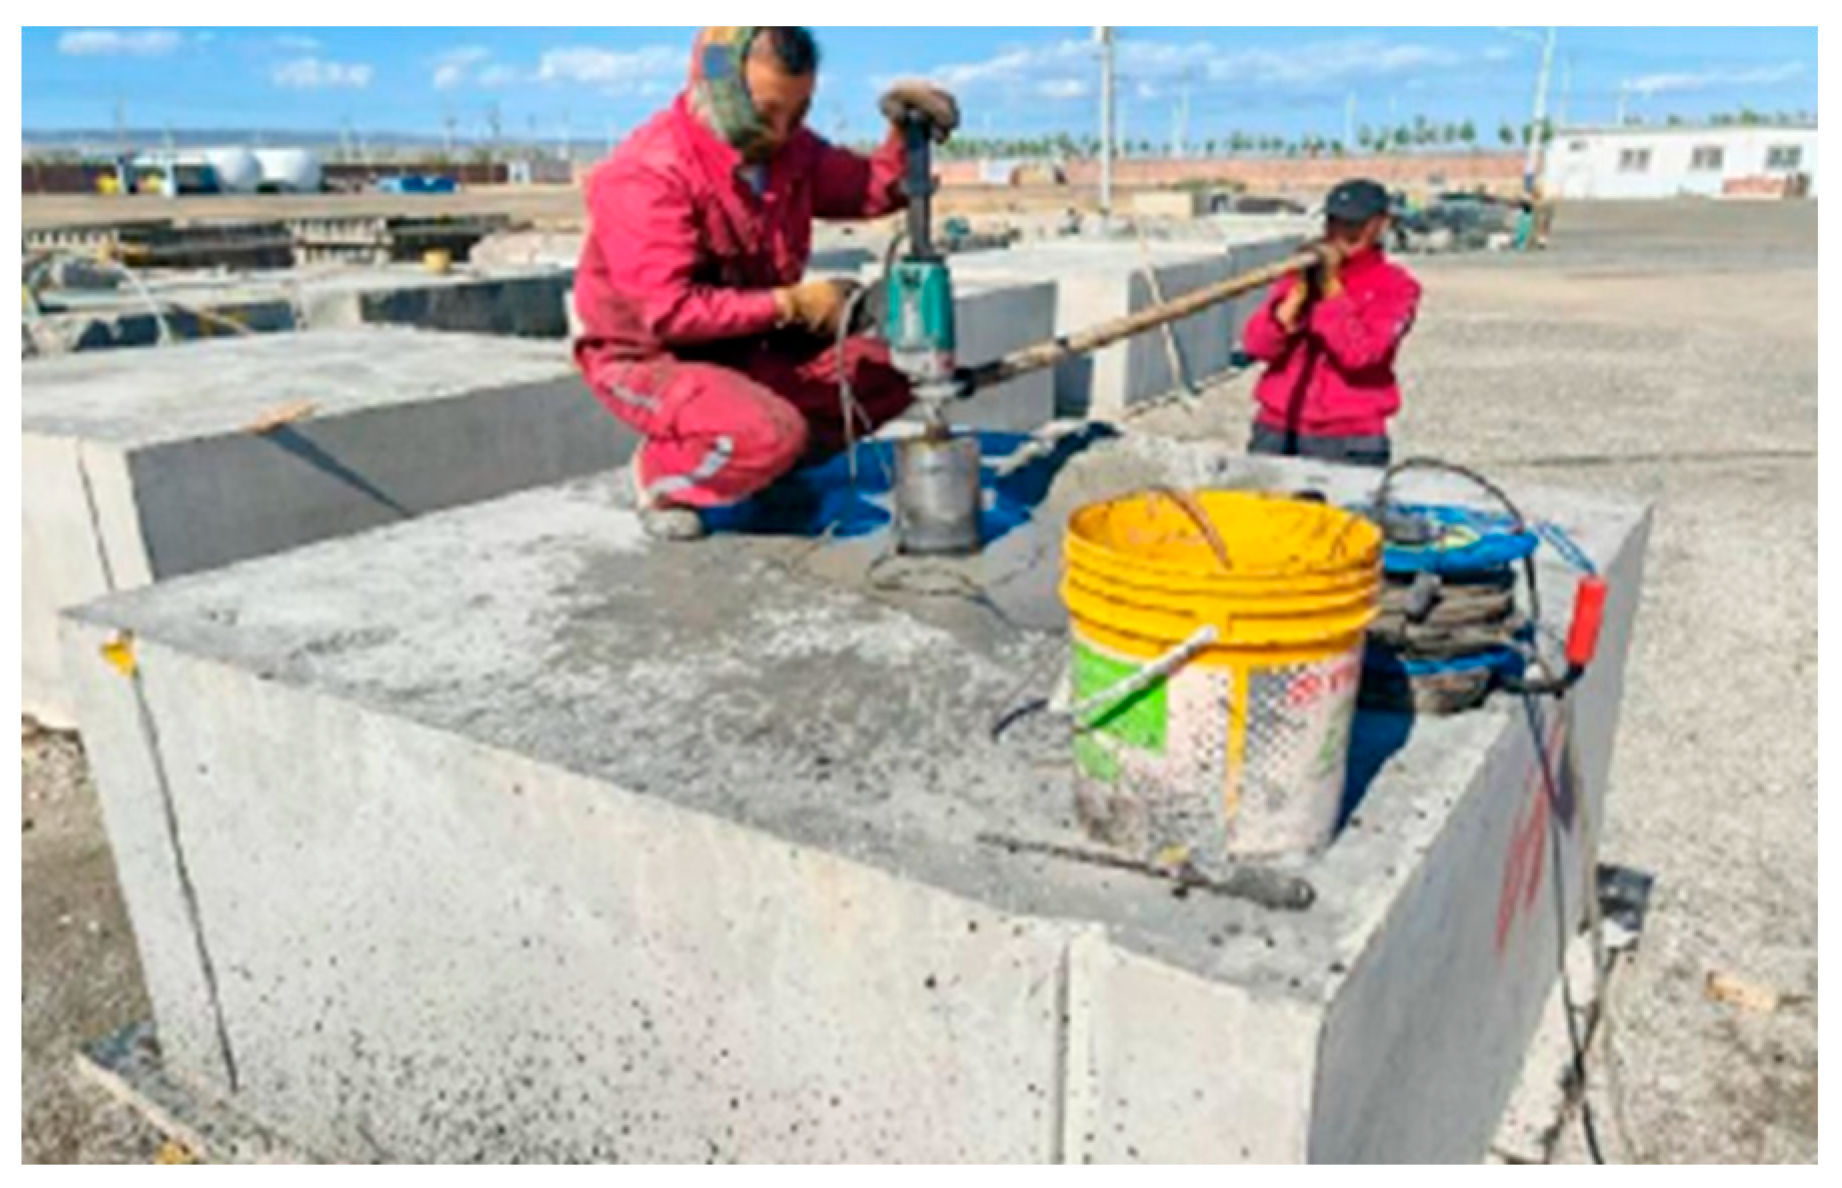
A drilling simulation was conducted at the center of the 2 m × 2 m surface. Oil-well cement was injected into the annulus between the wellbore and the drilled hole to ensure complete filling. After cementing, the specimens were cured for seven days until the cement sheath reached the required strength (Figure 4) [27]. The wellbore and perforation orientations were recorded relative to the applied principal-stress directions for interpretation of the post-fracturing morphology.

2.5. Experimental Apparatus and Monitoring System

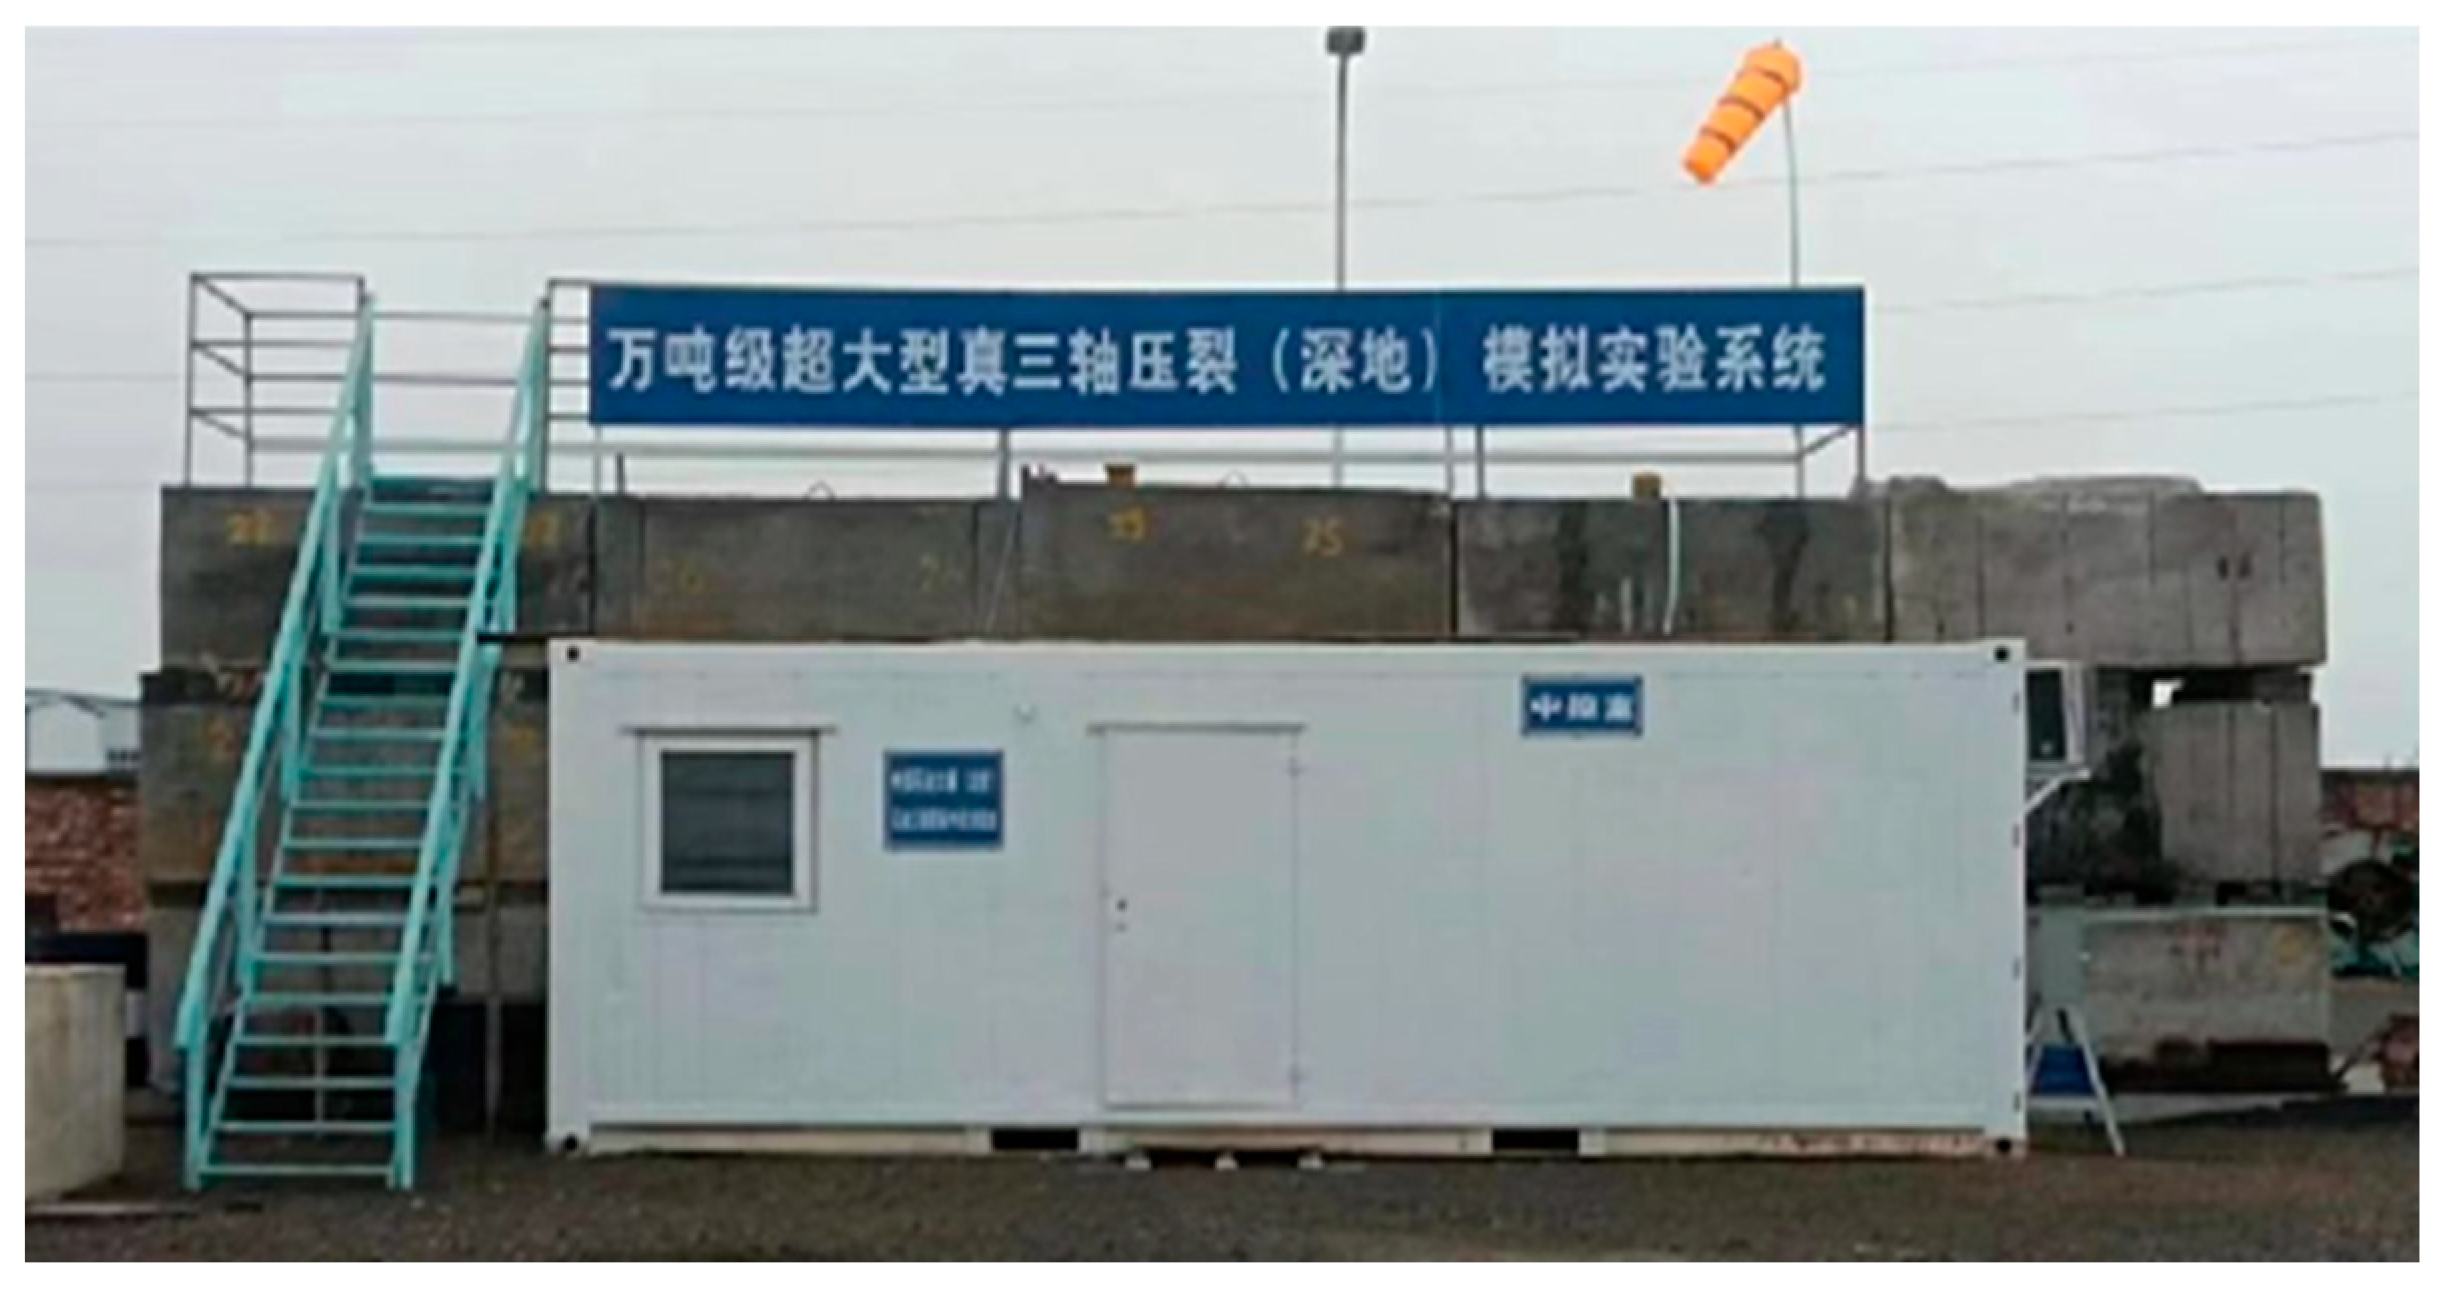
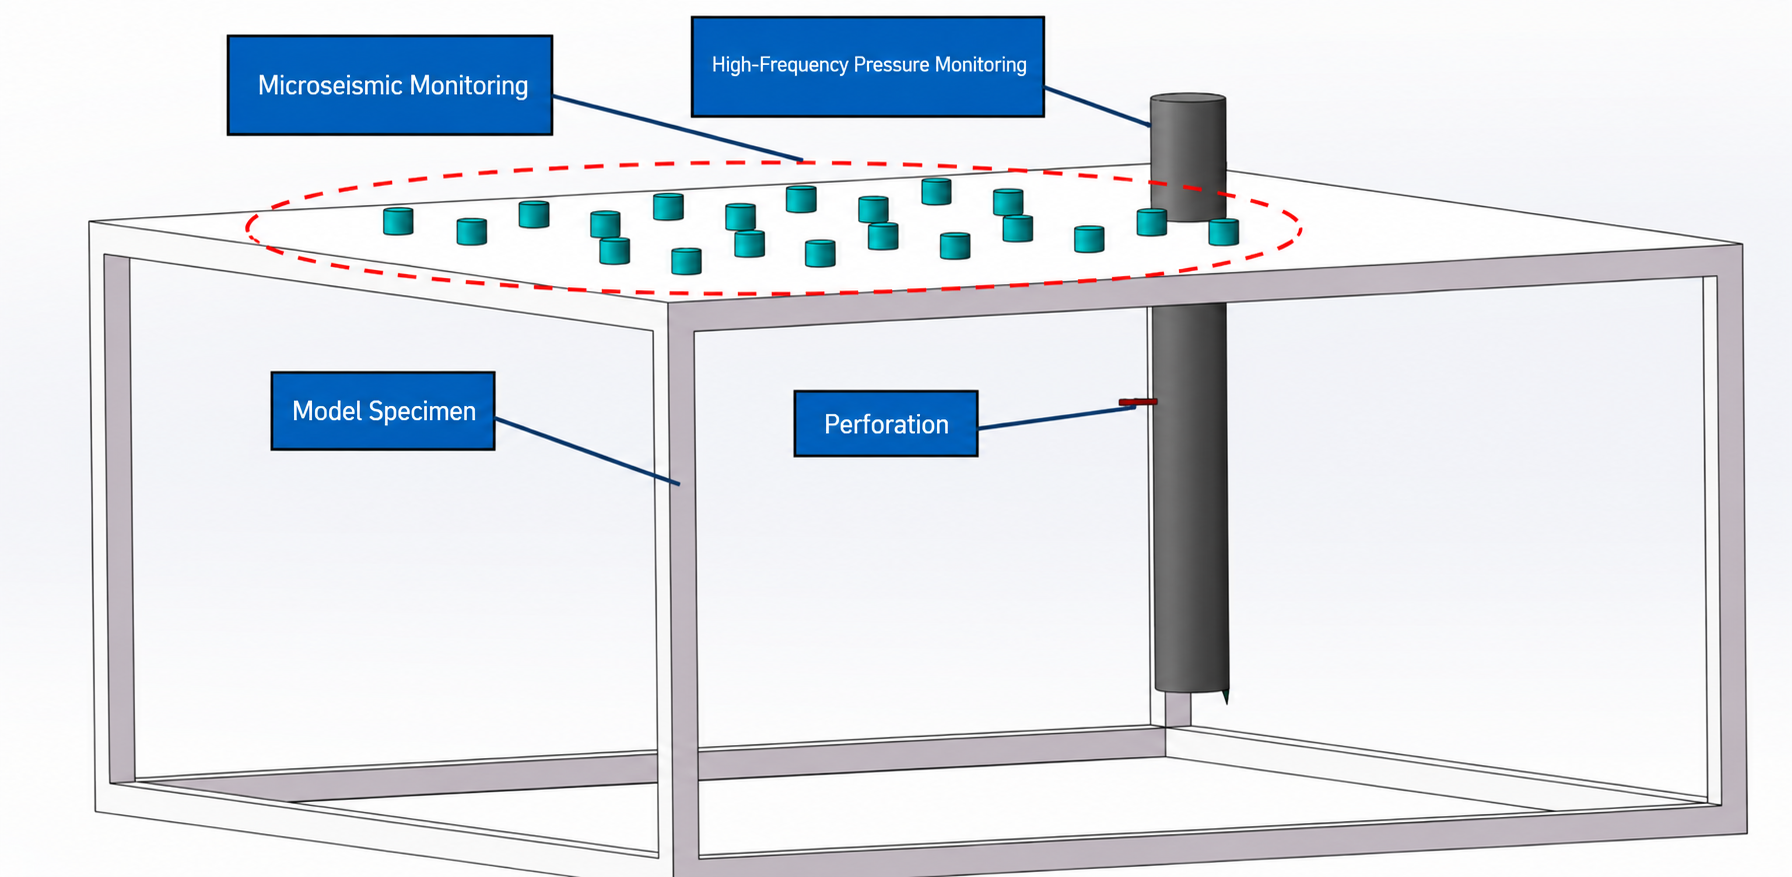
The experiments were conducted using a self-developed 10,000-ton ultra-large true-triaxial hydraulic-fracturing simulation system (Figure 5). To capture fracture development, a monitoring system integrating microseismic/acoustic-emission acquisition, high-frequency pressure acquisition, and post-test surface observation was used (Figure 6). The retained records do not contain all manufacturer-specific loading-system accuracy and boundary-compliance specifications; consequently, the analysis is limited to the directly reported loading conditions and observed fracture responses.
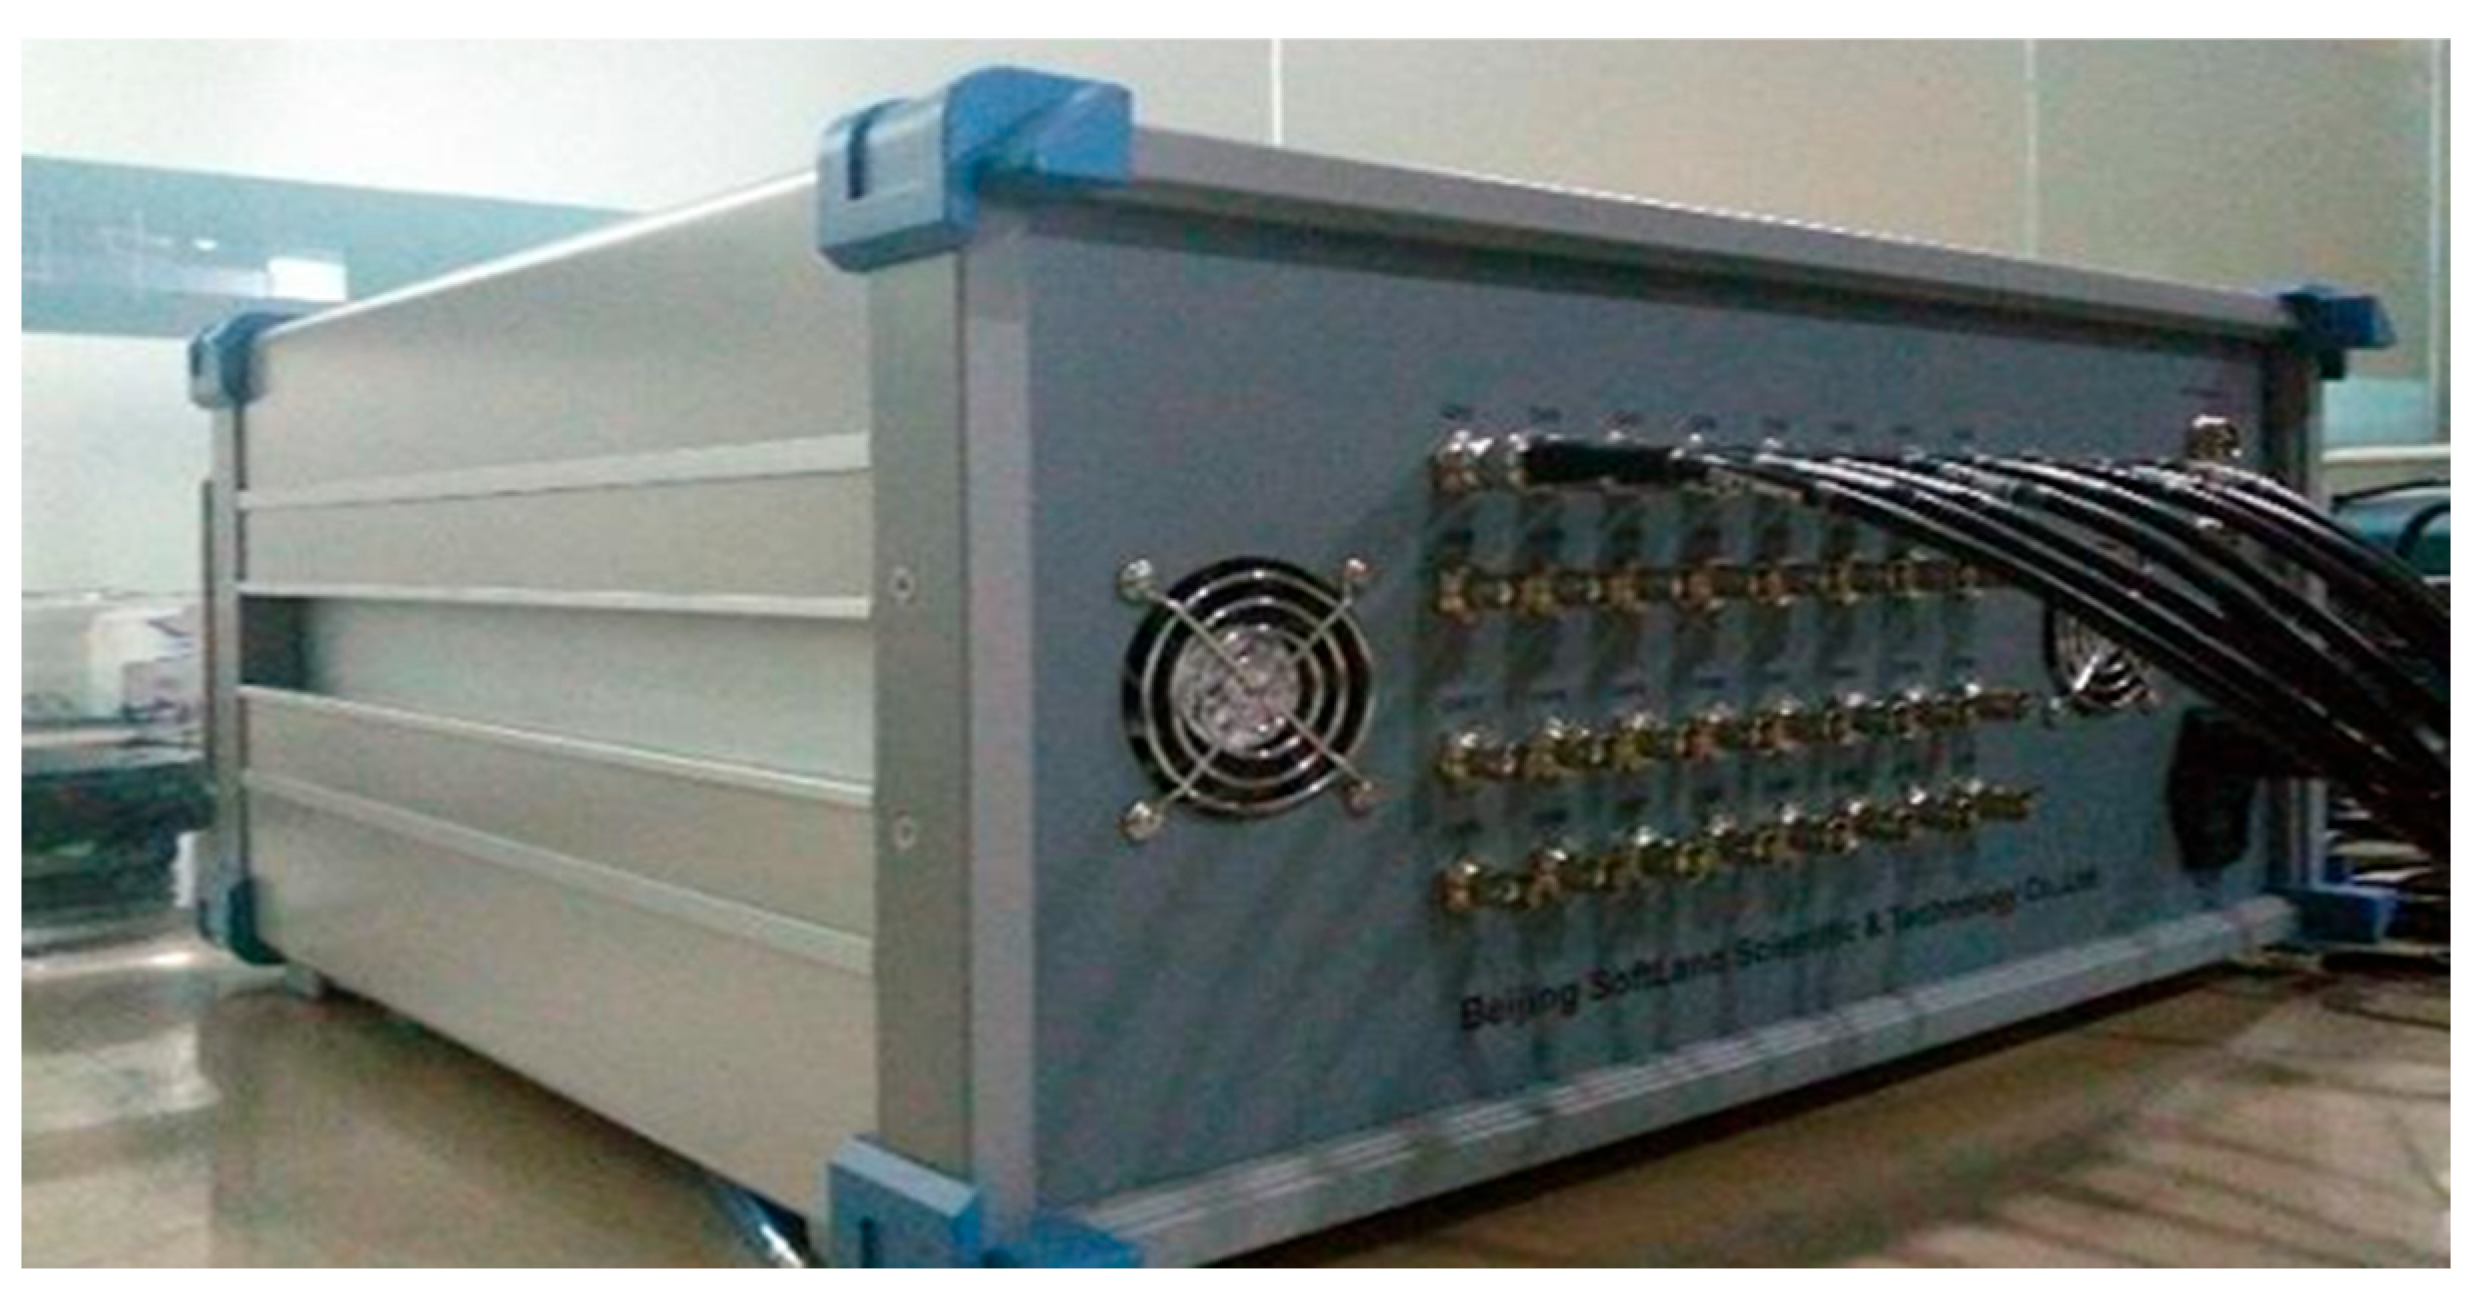
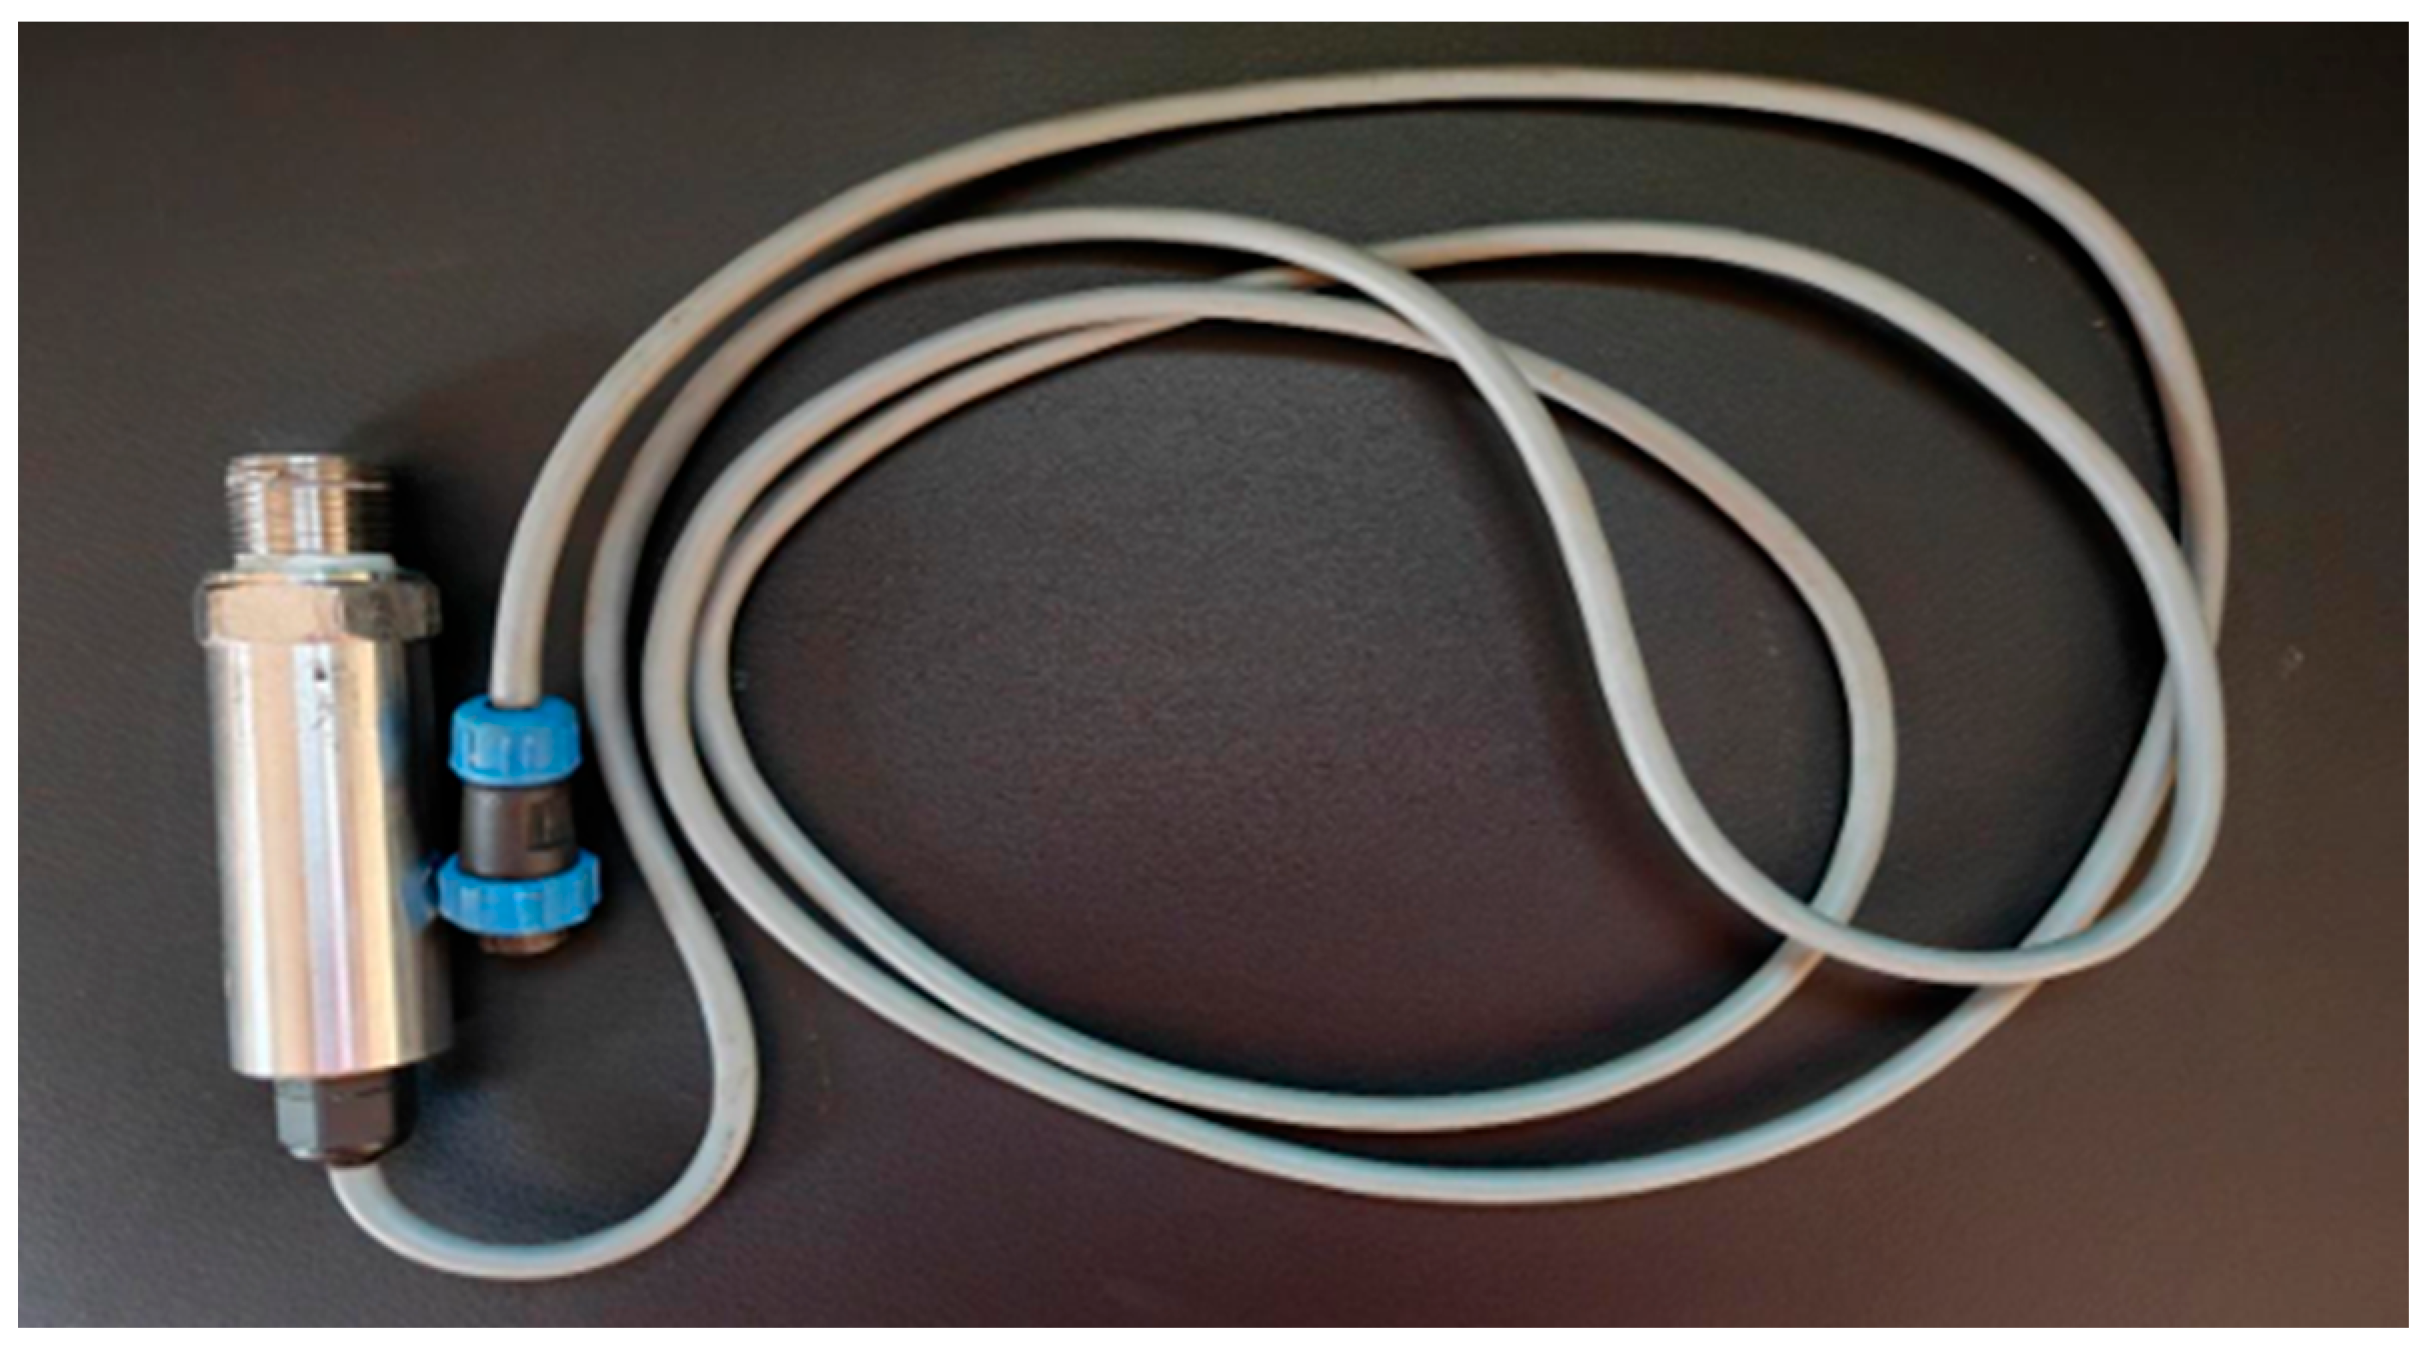
The microseismic system consisted of a 32-channel acoustic-emission acquisition unit and 24 probes mounted on the specimen surface with a coupling agent. The system recorded rupture-induced signals in real time, inverted source coordinates using arrival-time differences, and classified rupture type through the original moment-tensor processing workflow (Figure 7). The pressure system used a 1000 Hz high-frequency pressure sensor installed at the simulated wellhead (Figure 8). After fracturing, high-resolution photographs were taken to document surface-fracture morphology and orientation. Because the retained dataset does not preserve complete sensor-frequency, sensitivity, calibration, or absolute location-accuracy records for a full uncertainty analysis, these limitations are explicitly considered when interpreting microseismic source types and SRV.

2.6. Experimental Design and Procedure

Four comparative ultra-large true-triaxial hydraulic-fracturing cases were designed to represent lithology-specific, field-inspired treatment configurations. The experimental scheme is summarized in Table 2. The cases differed in lithology and, depending on the configuration, also differed in horizontal stress difference, injection rate, fluid viscosity, perforation geometry, and sand ratio. Therefore, the experiments do not constitute a complete single-factor or factorial design. Cross-case differences are interpreted as responses of the tested parameter combinations, and independent effects of variables that changed simultaneously are not quantitatively separated. This limitation is particularly important for the two tight-glutenite cases, because Specimen 1 used three helical perforations and a injection rate of 0.7 m3/min, whereas Specimen 2 used a single perforation and a injection rate of 0.5 m3/min.
Each specimen was lifted into the pressure chamber by a 50-ton crane and fixed using a dedicated constraint system. The high-pressure pipeline, fracturing pump, fluid tank, and simulated wellbore were connected and sealed. A water-injection pressure-hold test was conducted at 10 MPa for 30 min to verify sealing. Microseismic probes and the pressure sensor were then deployed. Three-dimensional stresses were applied according to the target reservoir conditions, with a vertical stress of 12–14 MPa and a horizontal principal-stress difference of 5–9 MPa [15,16]. The nominal loading rate was 0.5 MPa/min, and the specimen was held for 1 h after reaching the target stress state. The retained procedure record does not specify the exact sequential or simultaneous loading order for all three principal stresses; accordingly, no mechanistic interpretation is based on loading-path details beyond the reported target stresses and loading rate. Fracturing fluid was then injected at the designed rate. Microseismic and pressure data were acquired continuously until a significant pressure drop together with the observed reduction in rupture activity indicated fracture breakthrough. Finally, the specimen was unloaded and photographed for post-fracturing fracture analysis.

3. Results

3.1. Qualitative Surface-Fracture Morphology and Descriptive Branch Index

Post-fracturing surface observations showed marked differences among the four tested cases. Because the retained materials include post-test photographs but not a complete digital fracture-trace dataset suitable for calculation of fracture density, surface area, tortuosity, or connectivity, the present section intentionally treats surface morphology as qualitative. A normalized branch number N/Nmax is retained as a simple descriptive index, where N is the observed branch number and Nmax is the maximum branch number among the four tests. It should not be interpreted as a complete quantitative measure of fracture-network complexity. The dimensionless injection rate is retained only for descriptive comparison as Q* = Q/Q0, with Q0 = 0.7 m3/min.

3.1.1. Tight Glutenite

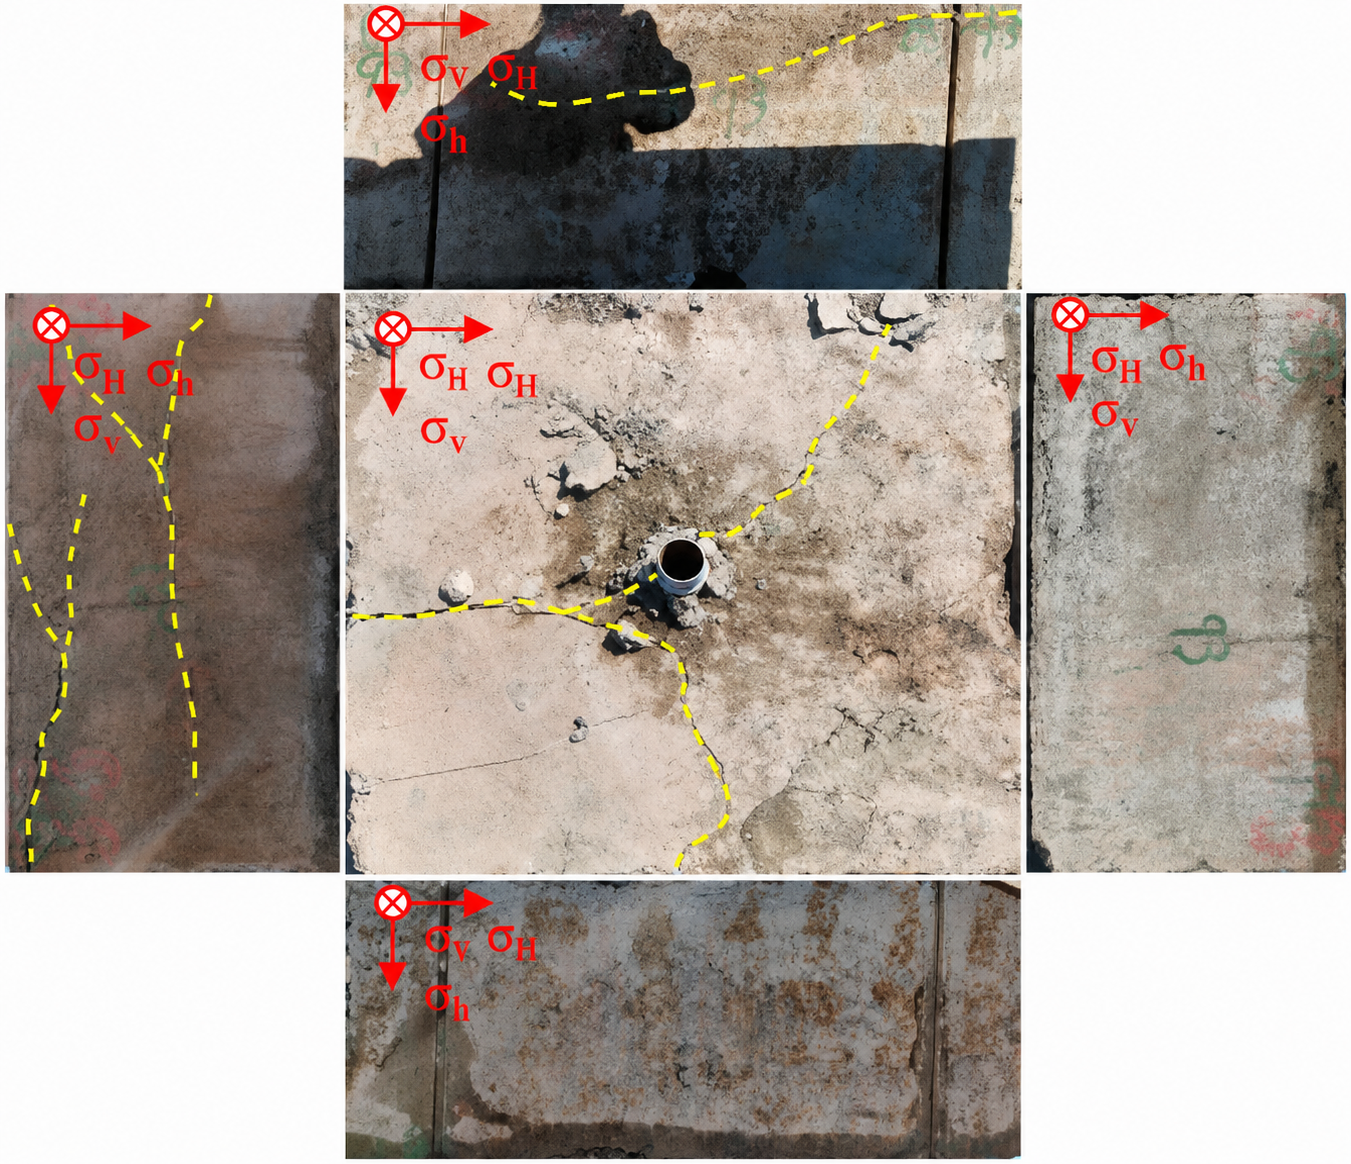
In tight-glutenite Specimen 1 (three perforations, Q* = 1.0), fractures showed a spatially distributed pattern containing intersecting transverse and longitudinal traces. Two main fractures radiated from the wellbore on the top surface, and five secondary fractures were observed on two side surfaces. The fracture pattern provided multiple connected pathways [17], and the normalized branch number was 1.0, the highest among the tested cases (Figure 9). These observations describe the final surface morphology but do not by themselves isolate the individual effects of injection rate or perforation number.
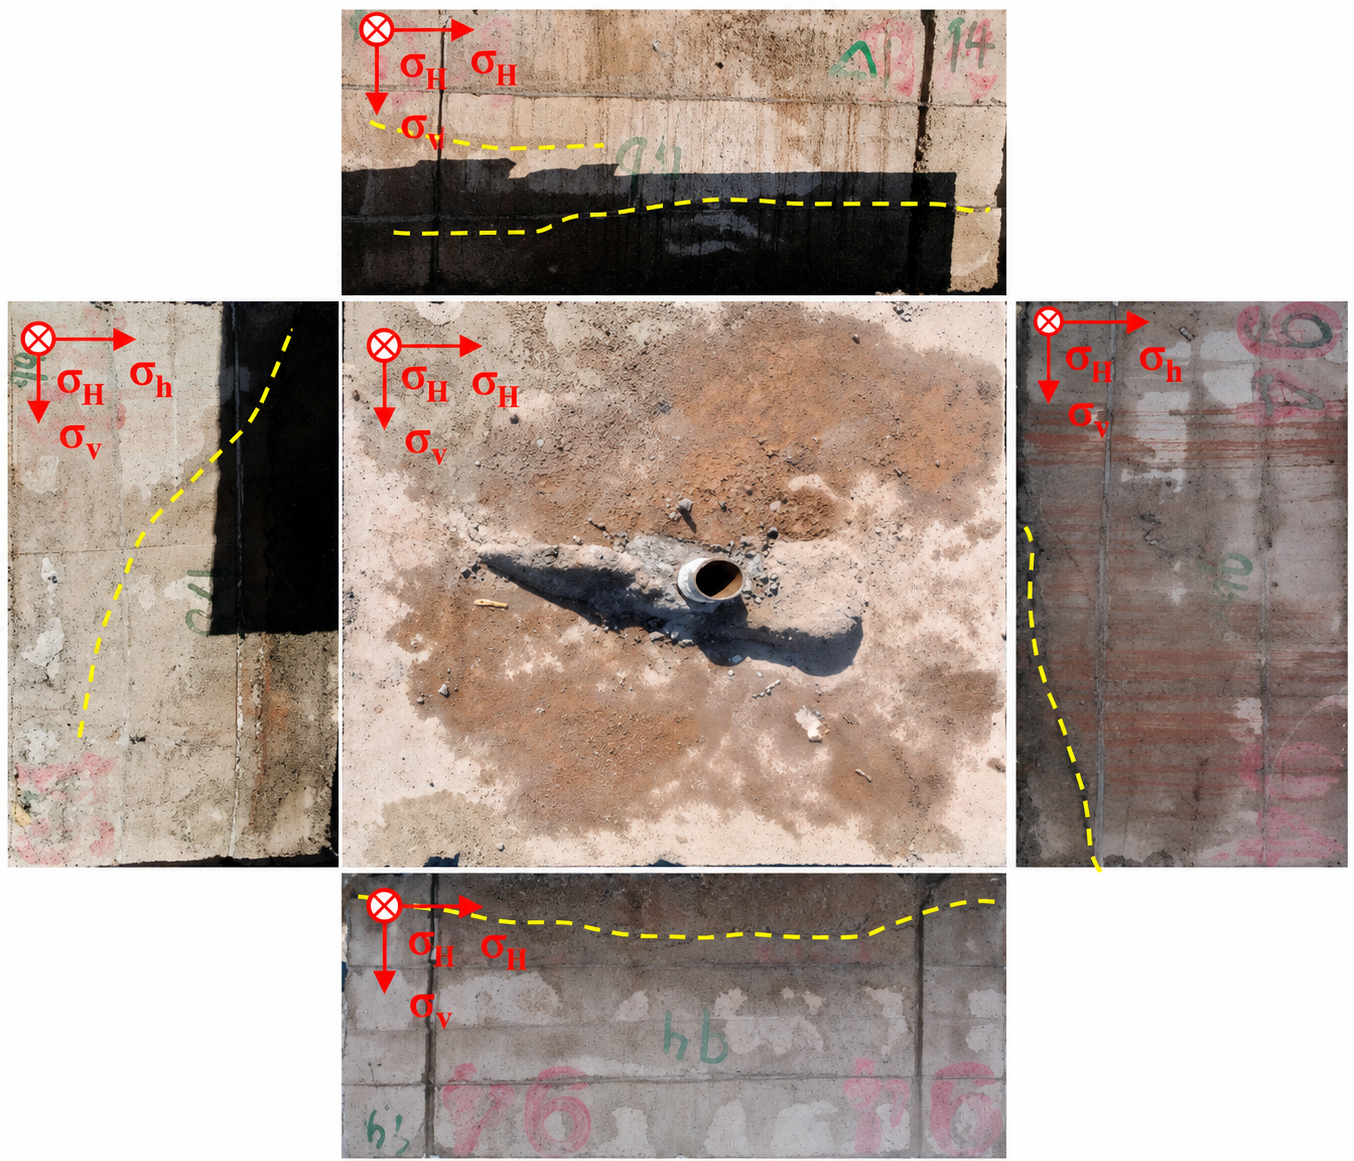
In Specimen 2 (one perforation, Q* = 0.71), the fracture pattern was dominated by a unidirectional throughgoing fracture. Fractures were present on all side surfaces, but only three short secondary fractures were observed. Local deflection occurred in heterogeneous regions, while extensive branching was absent. The normalized branch number was 0.6, corresponding to a more localized fracture pattern than that of Specimen 1 (Figure 10).
The contrast between the two glutenite specimens is interpreted as a response to the combined change in perforation configuration and injection rate. The three-perforation/0.7 m3/min configuration provided more potential initiation locations and greater fluid supply than the single-perforation/0.5 m3/min configuration, and it was associated with broader surface branching. Because these two variables changed simultaneously, the present experiments cannot determine the separate contribution of each factor or establish a universal transition criterion.

3.1.2. Tight Sandstone

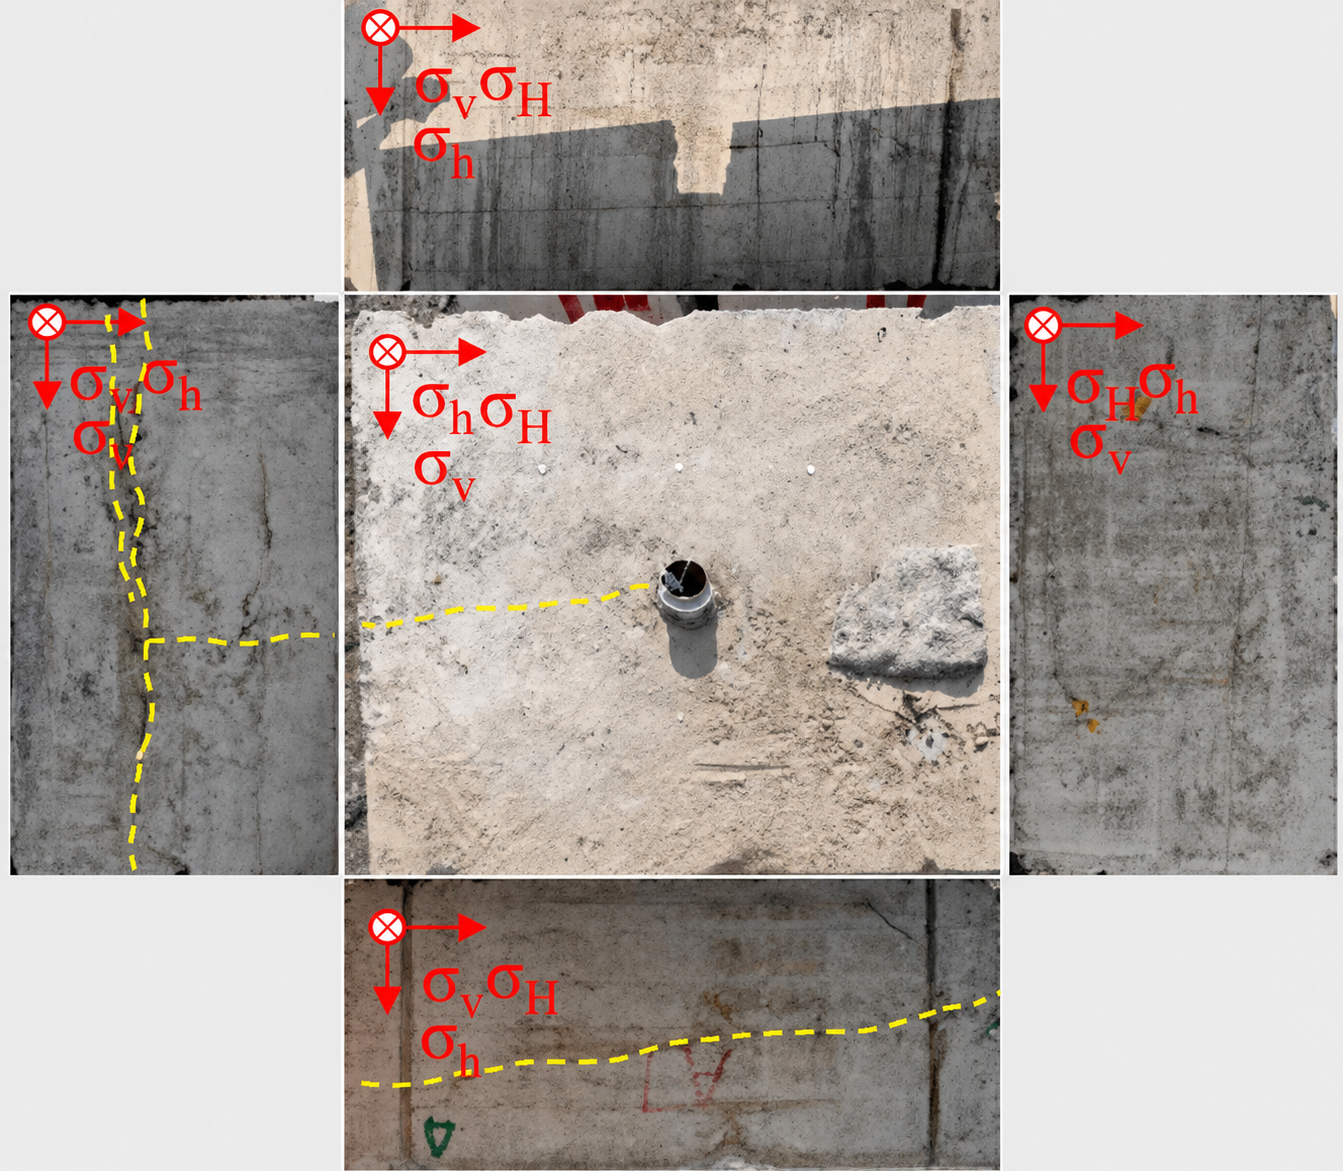
The tight-sandstone specimen exhibited a comparatively localized fracture pattern. One throughgoing main fracture formed on the top surface and only three secondary fractures appeared on two side surfaces. The dominant propagation direction was approximately consistent with the maximum horizontal principal-stress direction and showed limited macroscopic diversion or branching. The normalized branch number was 0.6 (Figure 11). Under this tested configuration, the fracture system therefore remained dominated by a major stress-aligned pathway.
The sandstone case combined a comparatively uniform lithological structure with high-viscosity fluid and the highest injection rate among the four tests. The observed main-fracture-dominated morphology is consistent with stress-controlled localization, but the independent effects of fluid viscosity, injection rate, and material properties cannot be isolated from this single case. Accordingly, the revised interpretation does not use the previously reported permeability-variation coefficient as a quantitative mechanistic argument and does not attribute the fracture pattern to viscosity alone.

3.1.3. Coal Rock

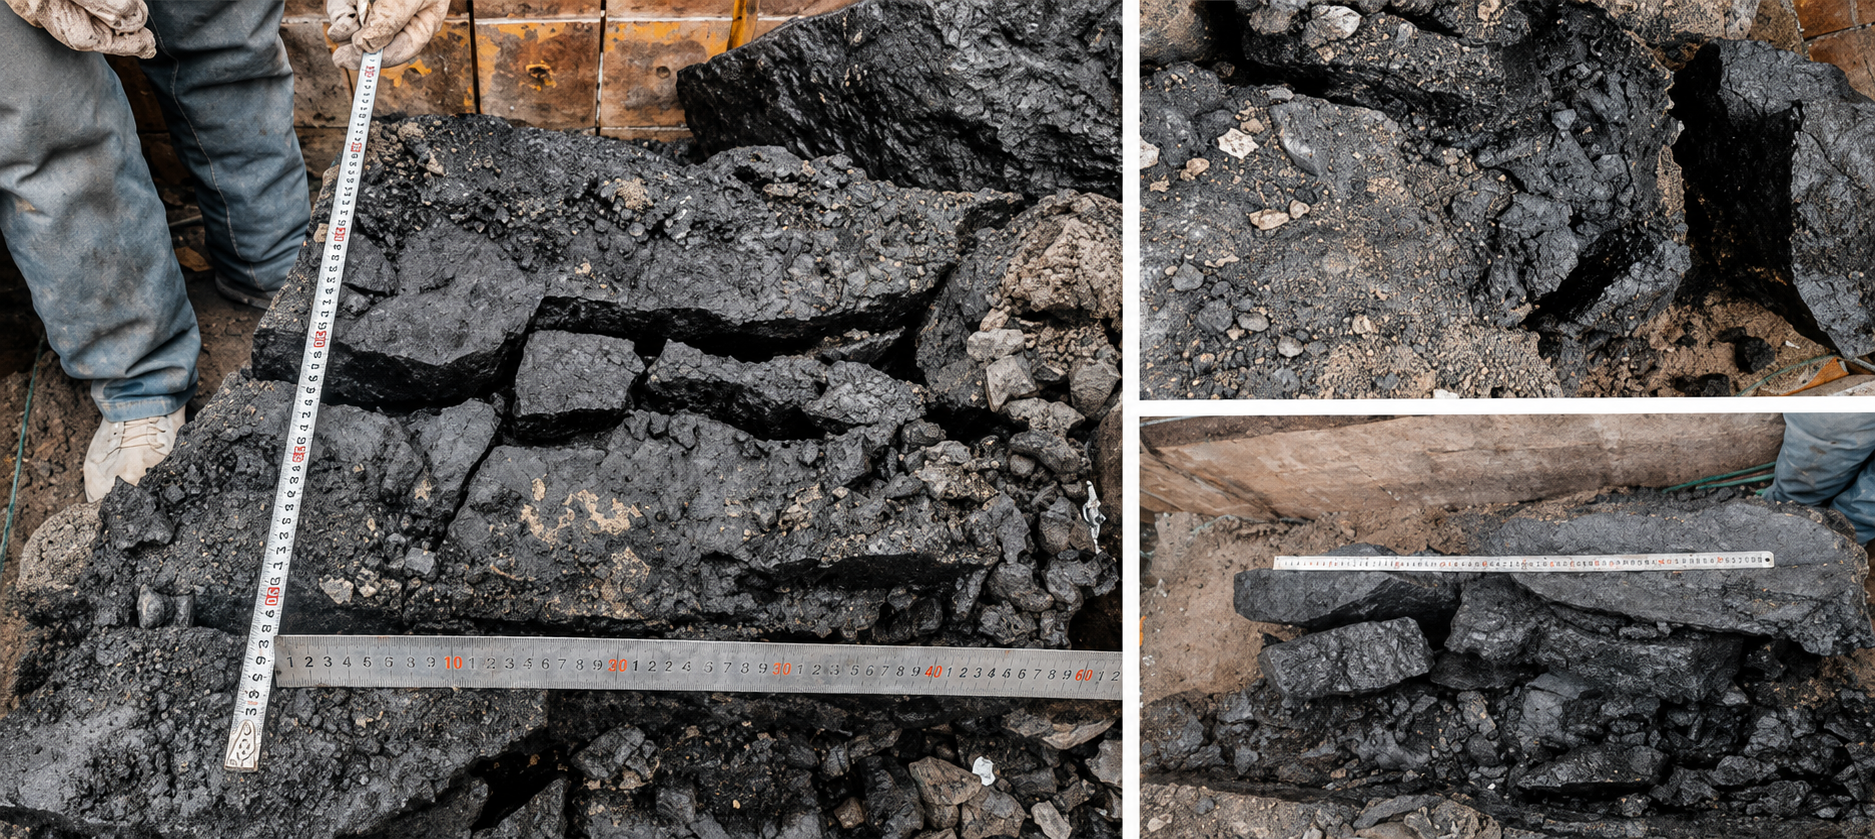
The No. 3 coal-rock specimen contained abundant bedding and cleat systems and developed a composite pattern in which the hydraulic fracture interacted extensively with pre-existing structural planes [14,18]. After the main fracture approached bedding, several traces propagated along bedding and connected with cleat-related paths, producing multiple secondary fractures and interlayer connections (Figure 12). The surface morphology therefore indicates substantial participation of pre-existing discontinuities during stimulation.
Bedding and cleats provide mechanically weak or preferential pathways in coal rock. Under the tested low-viscosity condition, fluid could access these structural planes and promote opening or slip. However, the retained observations do not distinguish quantitatively between newly created fracture area, tensile reopening of existing planes, and shear reactivation. The coal-rock morphology is therefore described as a composite hydraulic-fracture–structural-plane system rather than as a purely newly generated fracture network.

3.2. Microseismic Characteristics of Fracture Development

3.2.1. Rupture-Type Characteristics

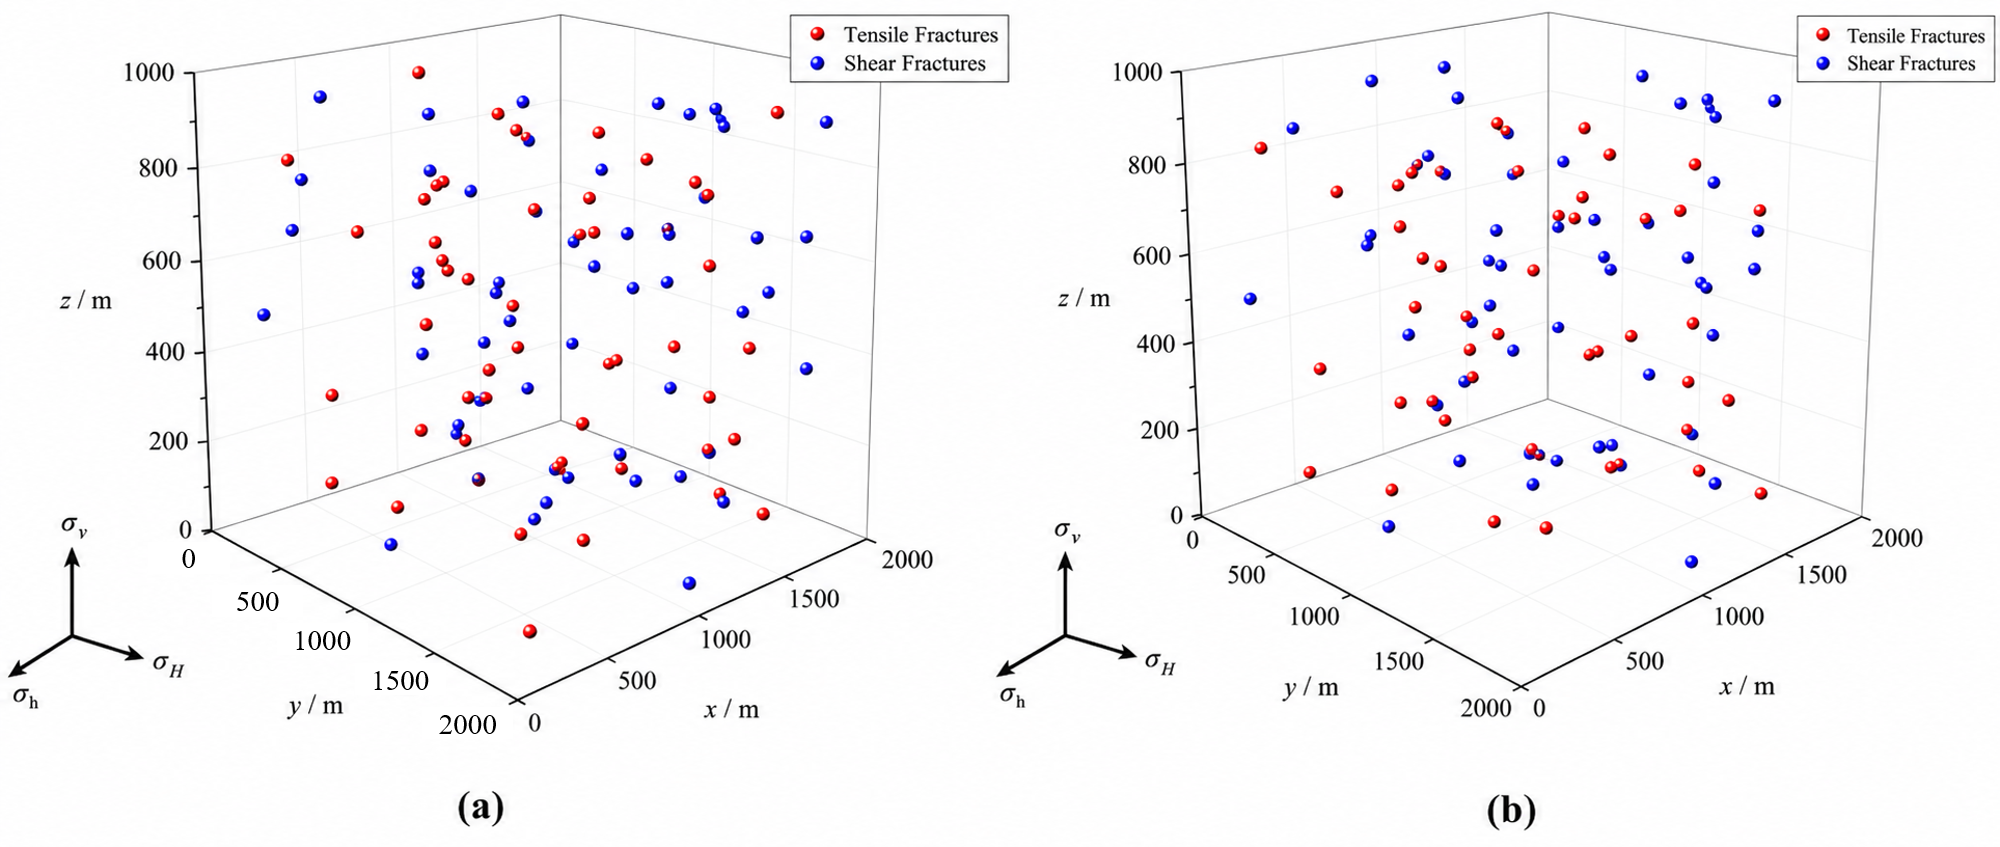
All specimens exhibited mixed tensile–shear rupture. Tensile events accounted for 51.5–52.4% of all classified events, while shear events accounted for 47.6–48.5%. The two tight-glutenite specimens showed tensile/shear proportions of 51.5%/48.5% and 51.7%/48.3%, respectively (Figure 13). Because the differences among all four cases are less than one percentage point and the available records do not contain the uncertainty information required for a formal significance test, these proportions are interpreted as broadly balanced tensile and shear contributions rather than as statistically distinct lithology-dependent ratios.
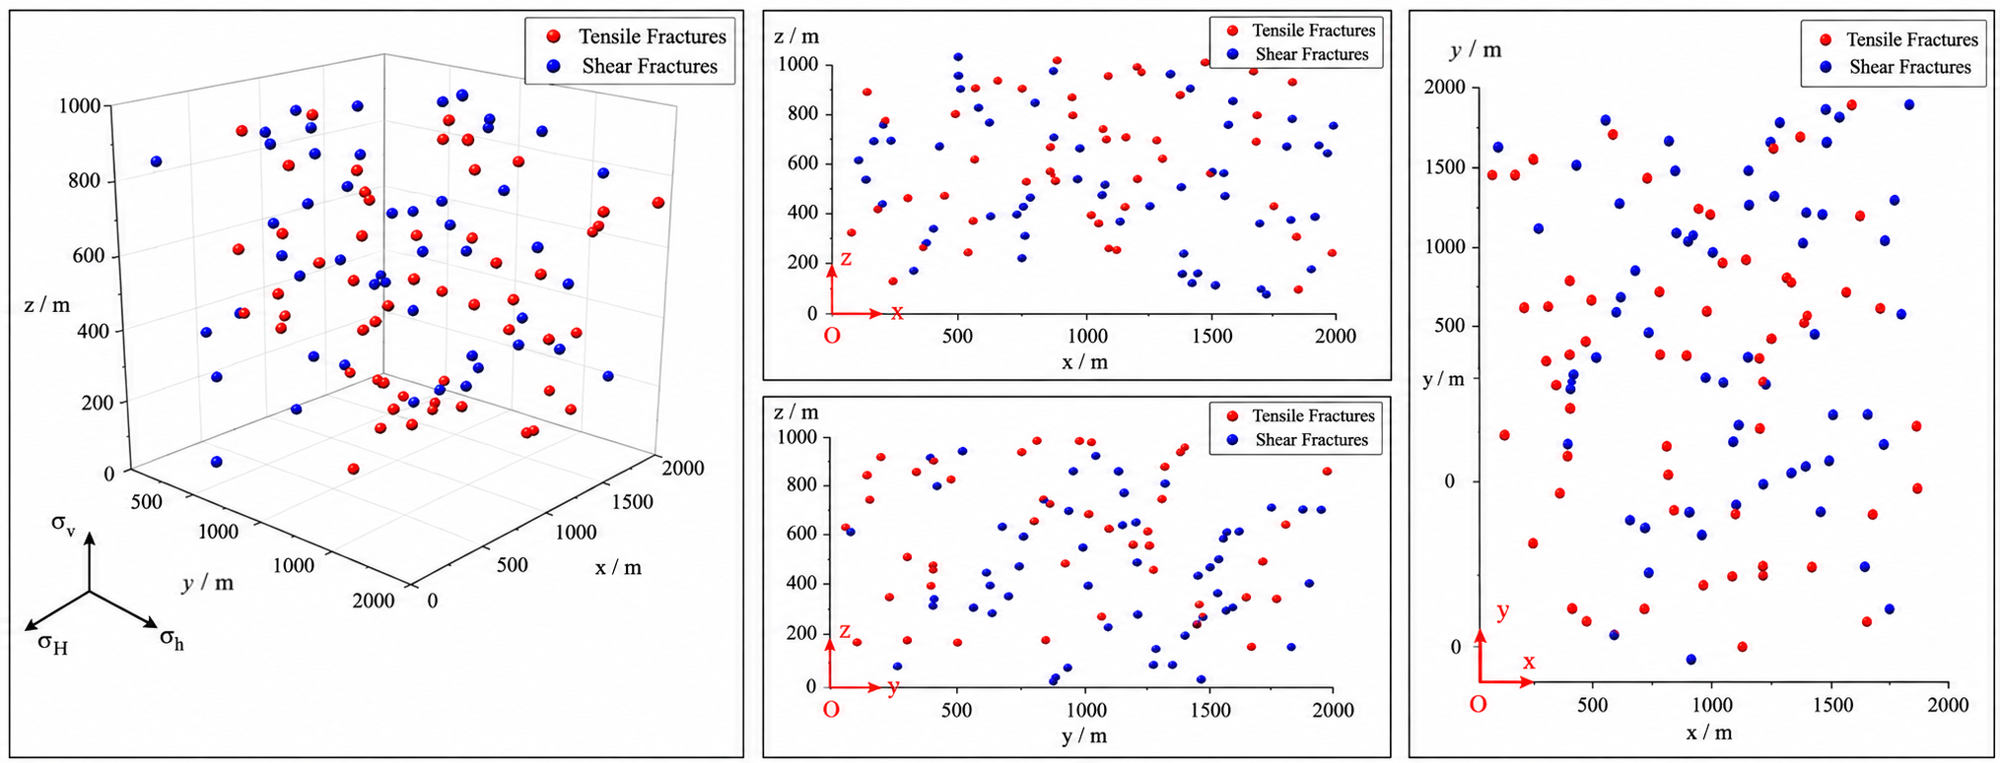
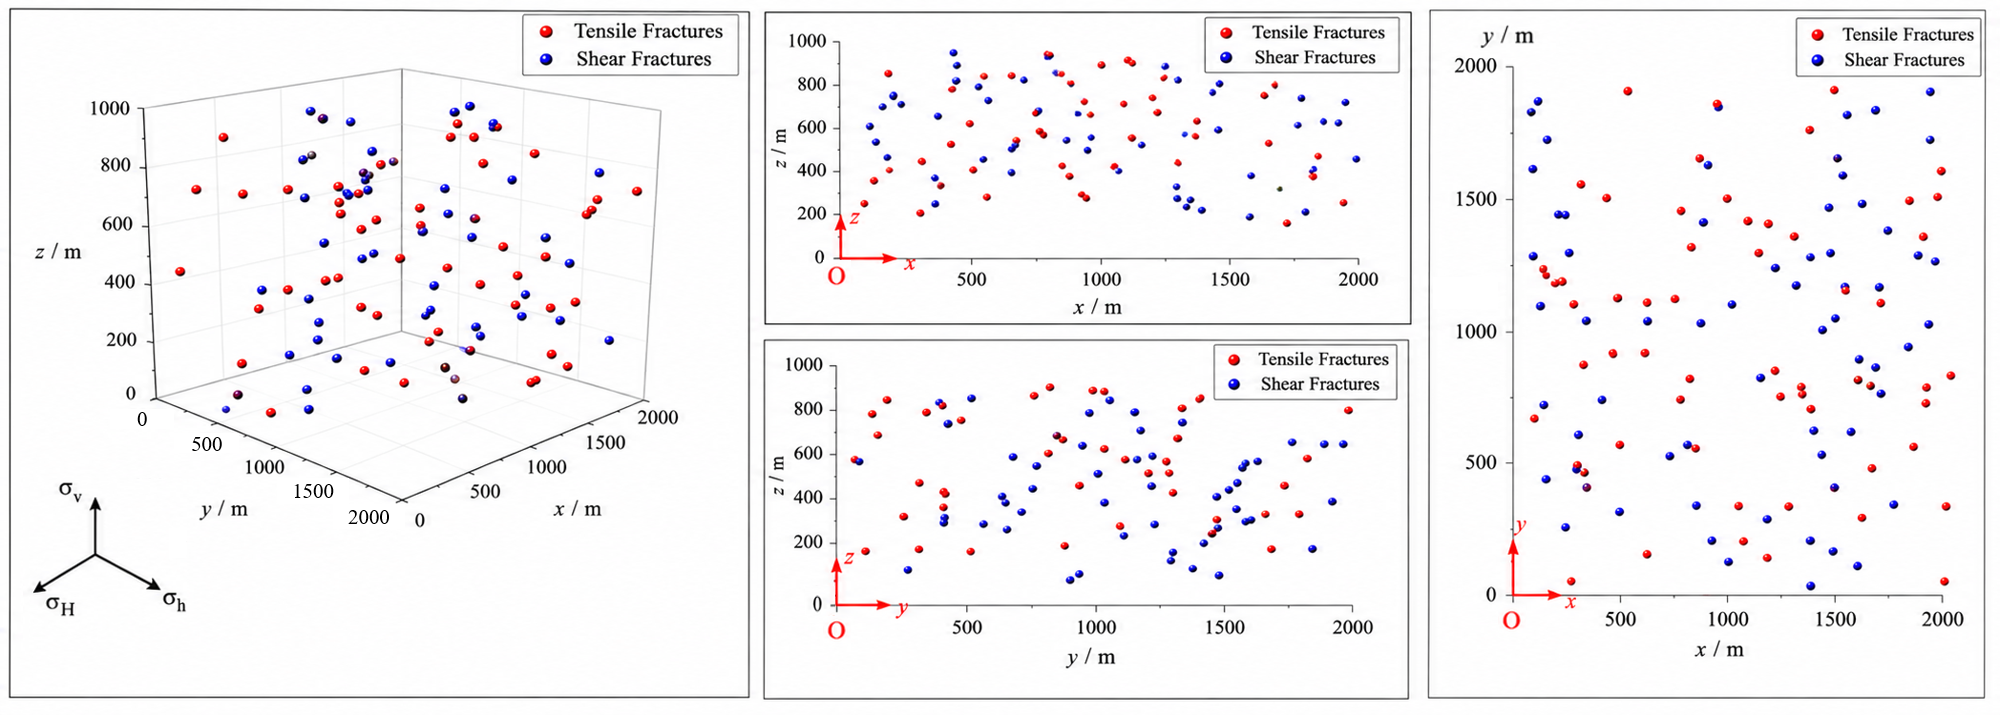
In tight sandstone, tensile and shear events accounted for 52.4% and 47.6%, respectively (Figure 14). In coal rock, the corresponding proportions were 51.5% and 48.5% (Figure 15). These small differences are not used to rank fracture complexity. Instead, rupture type is used as complementary information: tensile-type events are consistent with opening-related deformation, whereas shear-type events may reflect sliding along cemented interfaces, bedding, cleats, or grain boundaries. The more diagnostically useful difference among the cases lies in the spatial organization of microseismic activity.

3.2.2. Spatial Distribution of Microseismic Events

The spatial distribution of microseismic events showed clear qualitative differences among the tested cases. In tight-glutenite Specimen 1, events were diffusely distributed in three-dimensional space and covered a broad region, consistent with the branched surface morphology. In tight-glutenite Specimen 2, events were concentrated in a belt along the dominant fracture, indicating stronger spatial localization. In tight sandstone, events were likewise concentrated near the main fracture, consistent with a localized propagation path. In coal rock, events extended through the specimen and exhibited a beaded distribution associated with bedding, reflecting participation of bedding and cleat systems. Because event-level coordinates are not available for independent reanalysis, clustering indices, event-density statistics, and other spatial metrics cannot be reconstructed reliably; the present interpretation is therefore limited to the spatial patterns preserved in the original microseismic plots.

3.3. Pressure–Microseismic Response Characteristics

3.3.1. Tight Glutenite

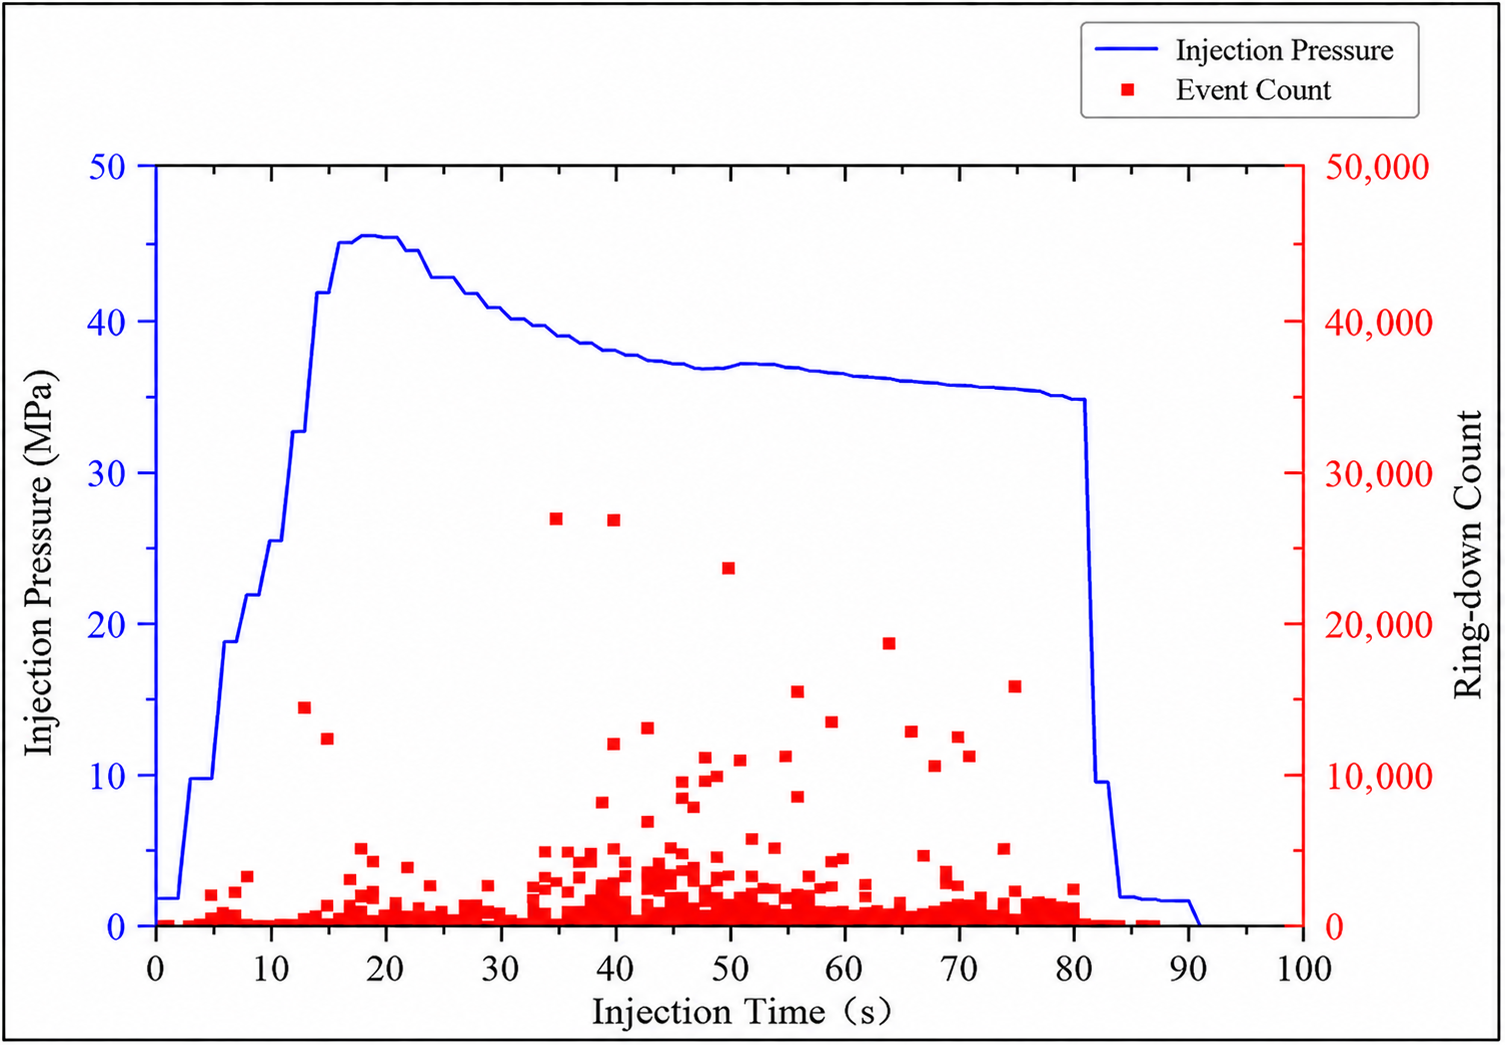
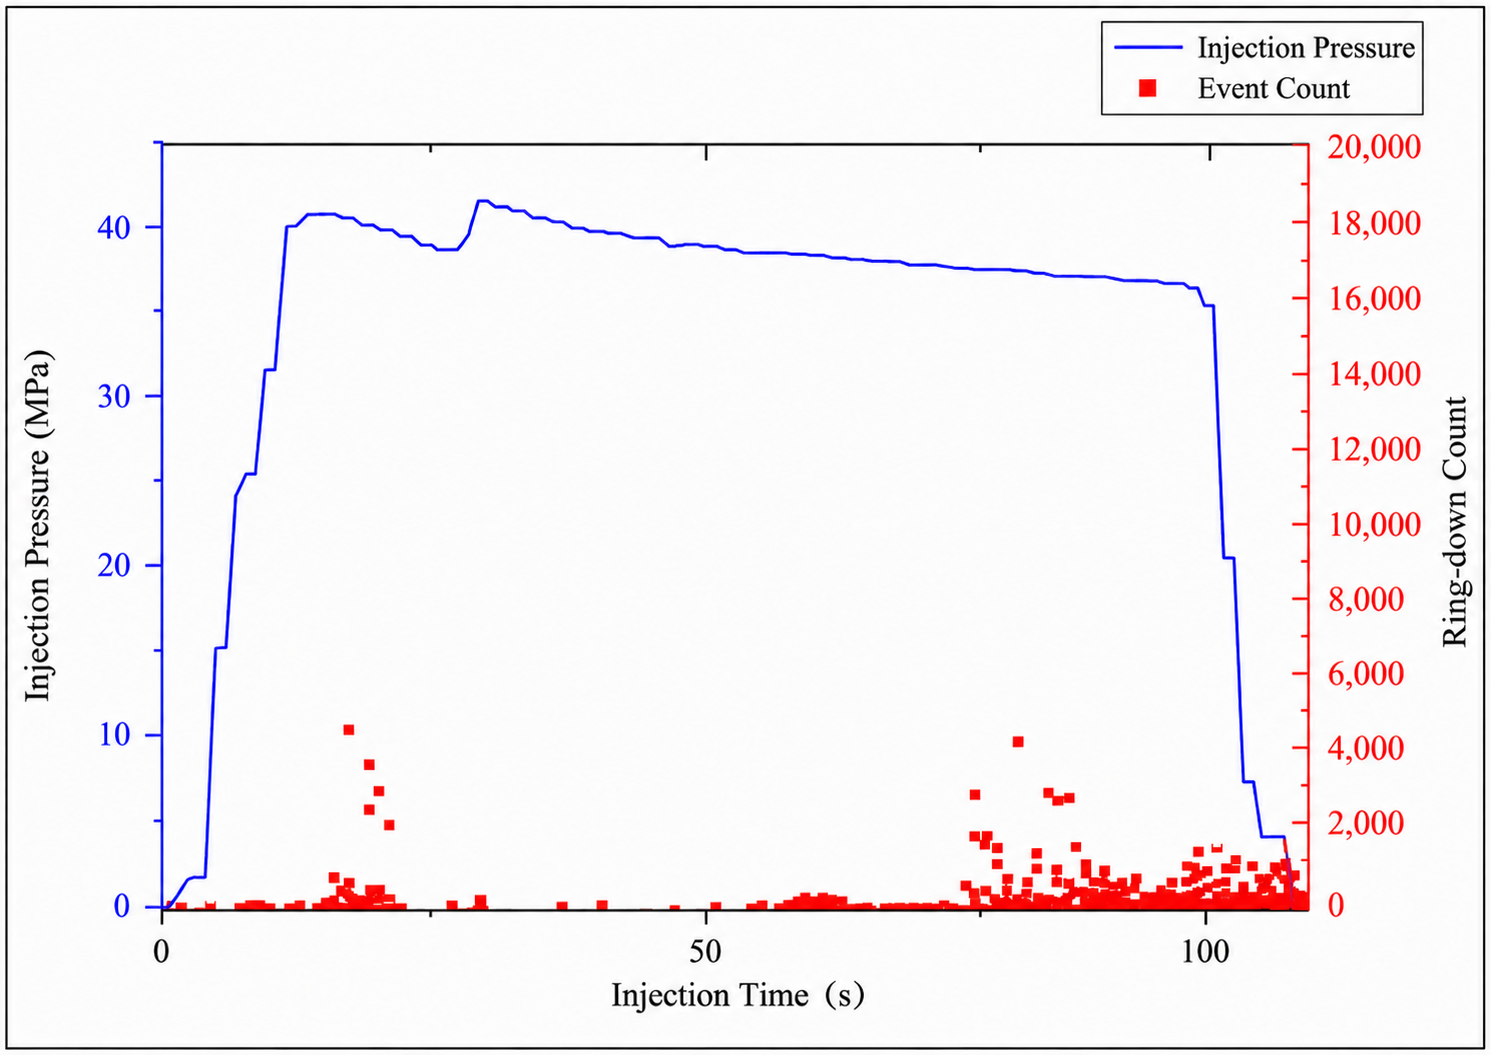
The pressure curve of tight-glutenite Specimen 1 (three perforations, 0.7 m3/min) was comparatively smooth, with an initiation pressure of approximately 35 MPa, a peak pressure of approximately 42–45 MPa, and pressure fluctuations generally lower than 3 MPa (Figure 16). Considered together with the diffuse microseismic distribution and branched surface morphology, this low-fluctuation response is consistent with hydraulic energy being distributed among several active pathways rather than repeatedly accumulating in a single localized propagation zone.
Figure 16. Ring-down counts and injection-pressure curve of tight-glutenite Specimen 1.
Processes 14 02647 g016
In Specimen 2 (one perforation, 0.5 m3/min), the pressure curve showed a double-peak pattern (Figure 17). The first peak of approximately 38 MPa occurred near fracture initiation, followed by a slight pressure decrease during early propagation. Pressure then increased again to about 40 MPa before decreasing after renewed extension and breakthrough. The second pressure build-up is interpreted as a temporary increase in propagation resistance rather than being assigned specifically to failure of a particular mineral grain. The localized microseismic pattern and double-peak pressure response together indicate a more intermittent advance of a dominant fracture than in Specimen 1.
Figure 17. Ring-down counts and injection-pressure curve of tight-glutenite Specimen 2.
Processes 14 02647 g017

3.3.2. Tight Sandstone

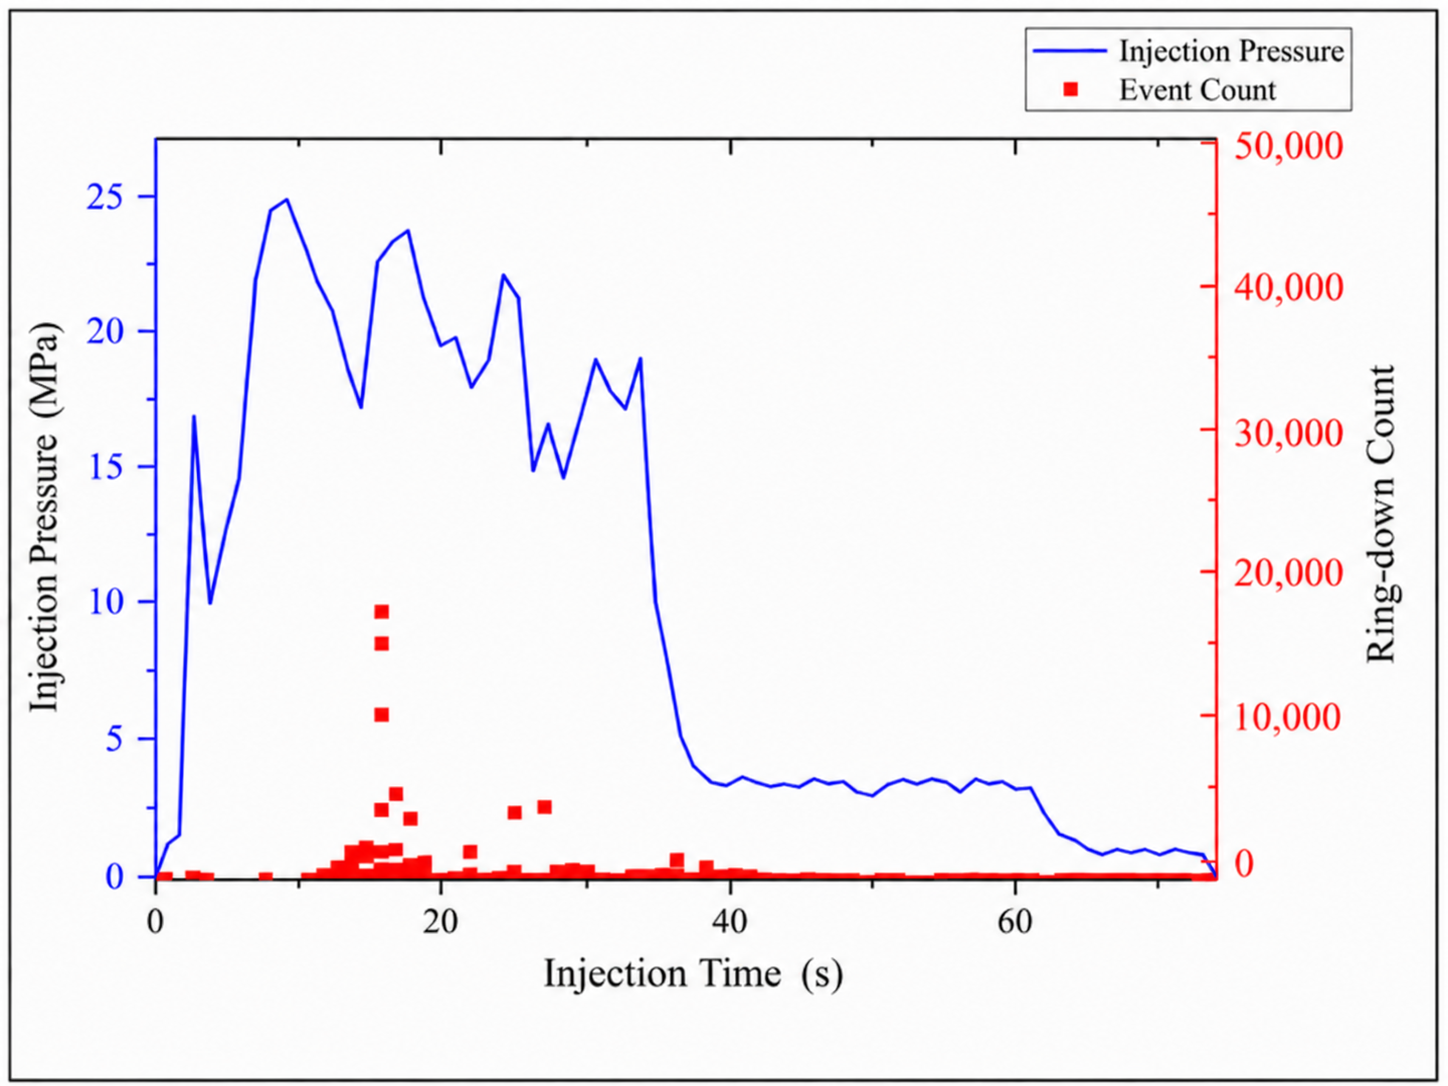
The tight-sandstone pressure curve exhibited multi-peak oscillation, with an initiation pressure of approximately 30 MPa, a maximum pressure of approximately 50 MPa, and pressure drops of about 8–10 MPa between major peaks (Figure 18). Repeated pressure accumulation and release occurred while the microseismic events remained spatially concentrated near the dominant fracture. This correspondence is consistent with the episodic advance of a localized fracture: pressure accumulated as propagation resistance increased and was released when the fracture extended through a resistant region. The interpretation is based on the combined pressure, microseismic, and post-test observations rather than on pressure variation alone.
Figure 18. Ring-down counts and injection-pressure curve of tight-sandstone Specimen 3.
Processes 14 02647 g018

3.3.3. Coal Rock

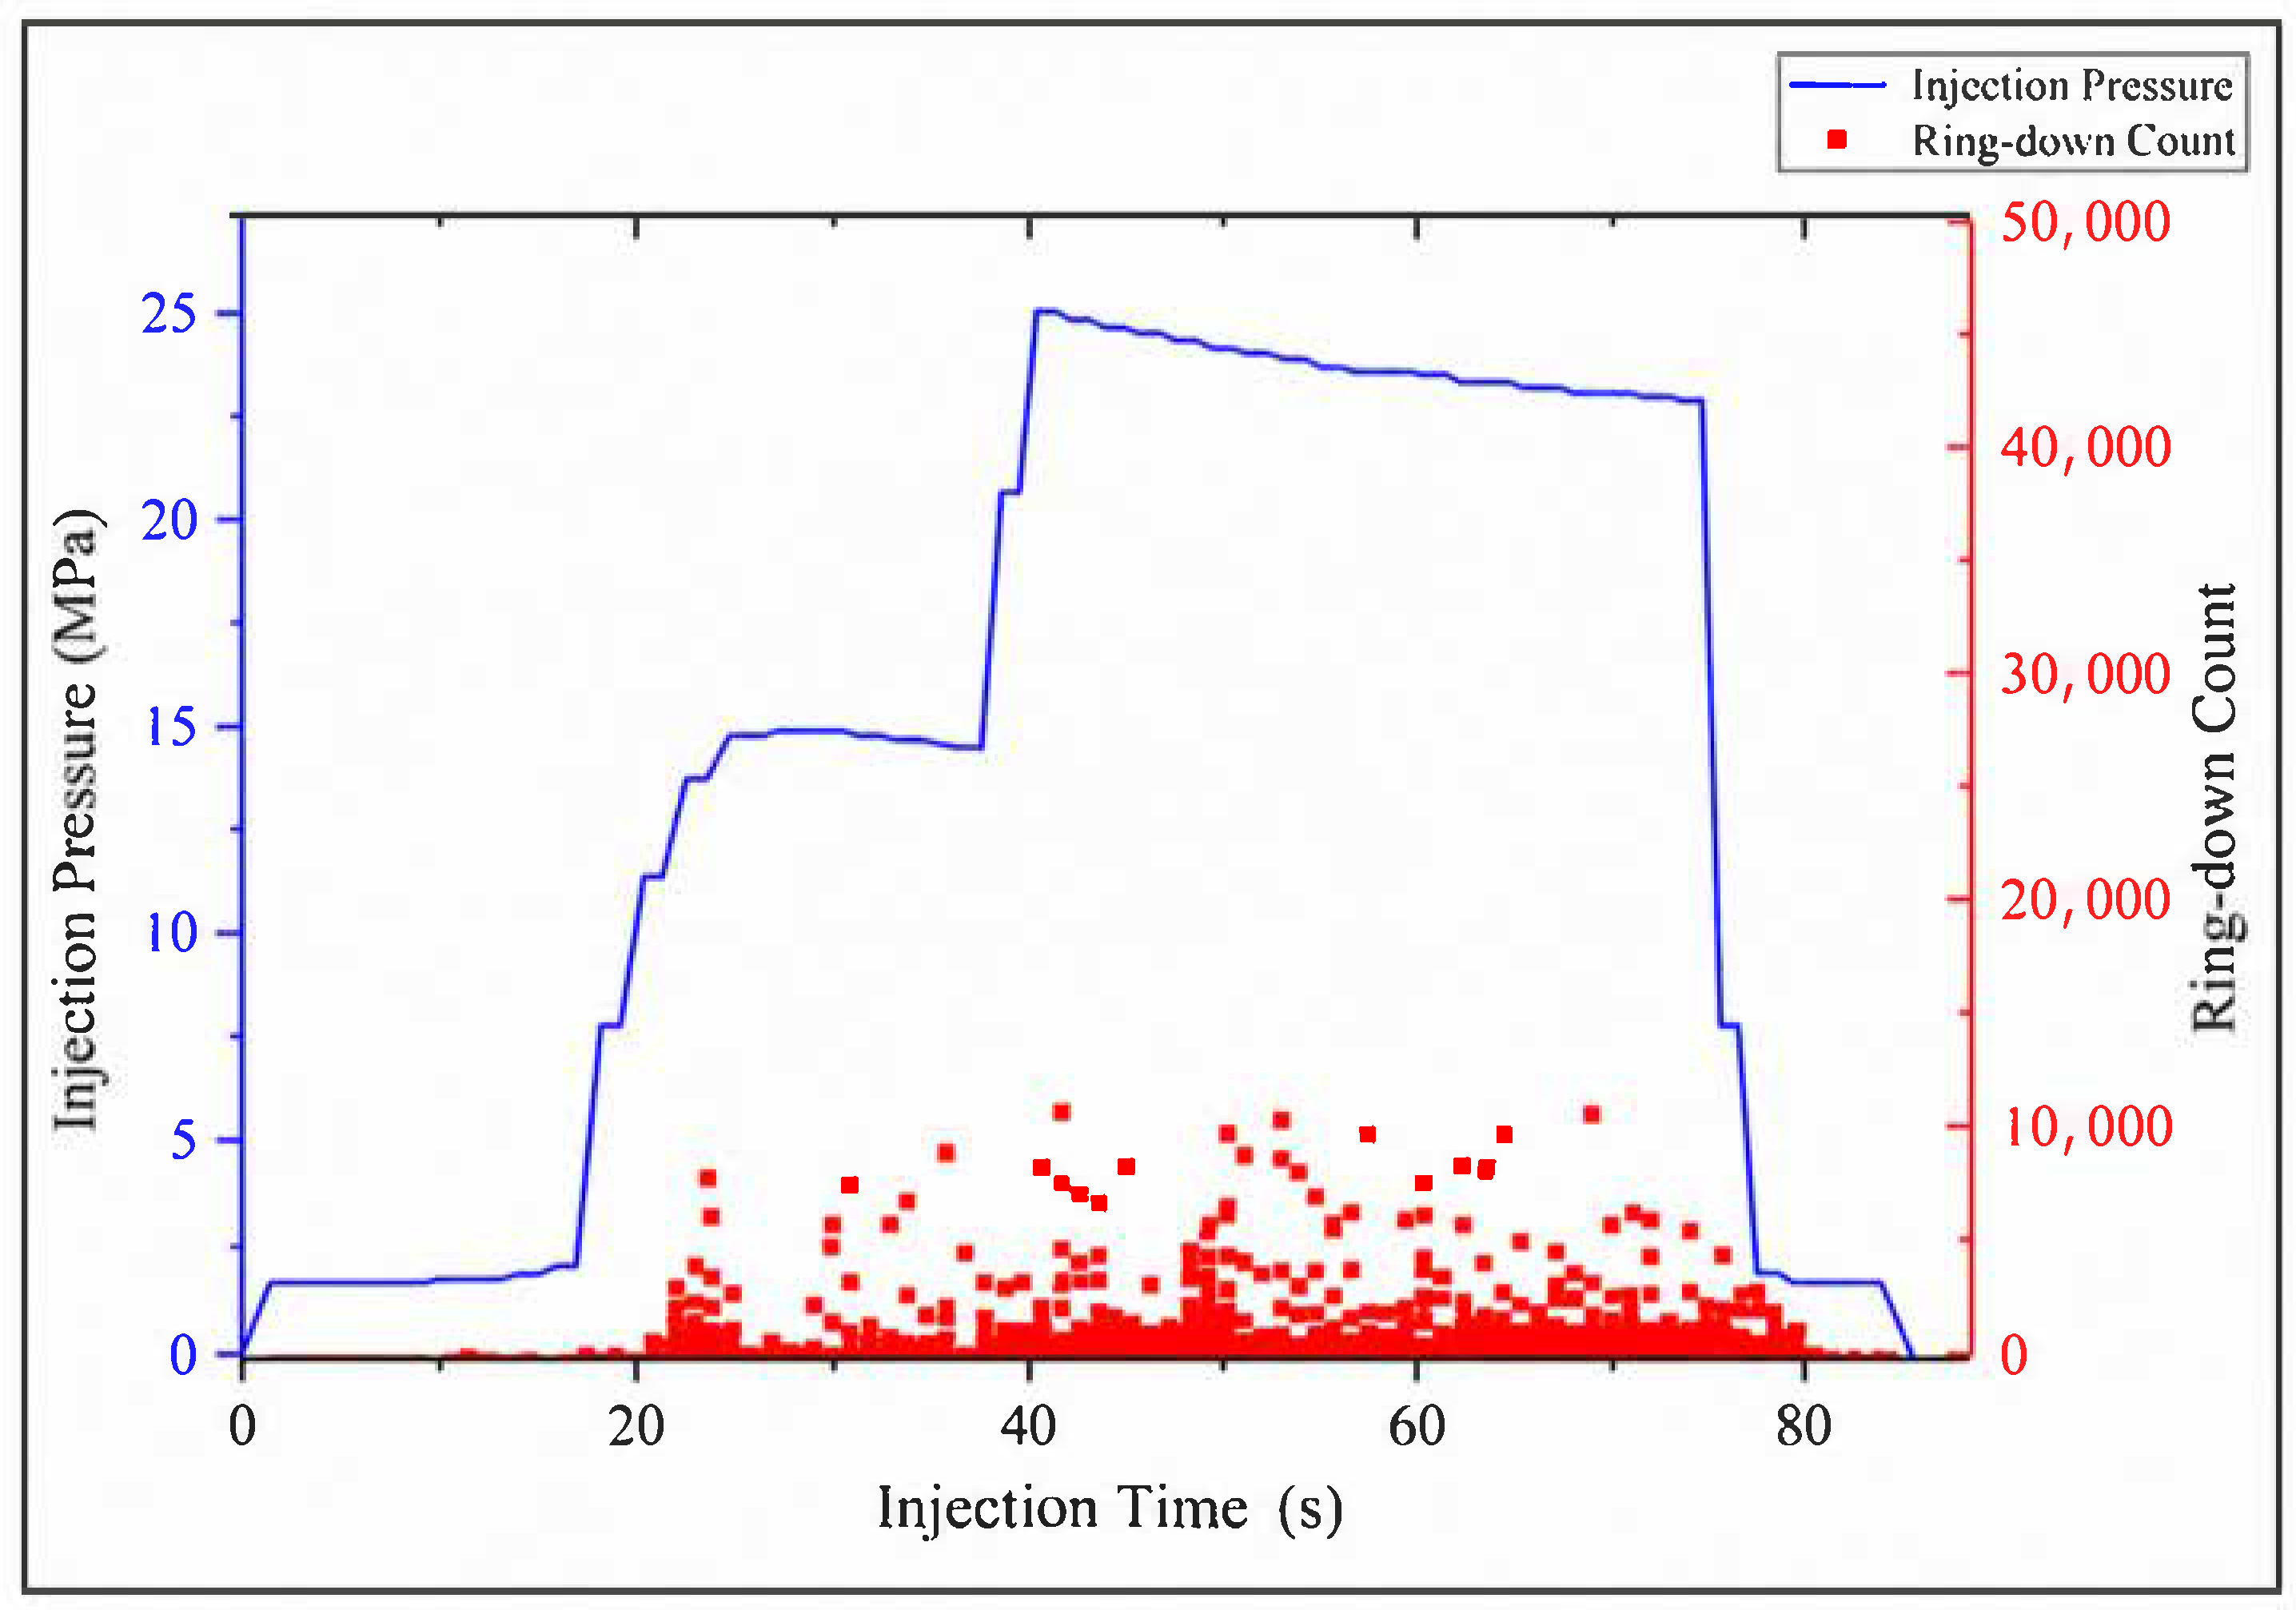
The coal-rock pressure curve showed a stepwise response, with an initiation pressure of approximately 25 MPa and a maximum pressure of 25.3 MPa, followed by a gradual decrease to 22.4 MPa (Figure 19). Individual pressure steps were approximately 3–5 MPa and lasted about 1–2 min. The stepwise pressure evolution, continued rupture activity, and bedding-associated microseismic distribution are consistent with staged activation of structural planes: pressure accumulated before local instability and was partially released after opening or slip, after which hydraulic loading continued toward another region.
The principal pressure-response parameters extracted from Figure 16, Figure 17, Figure 18 and Figure 19 are summarized in Table 3 for direct cross-case comparison.
Figure 19. Ring-down counts and injection-pressure curve of the coal-rock specimen.
Processes 14 02647 g019

3.4. Microseismic-Derived Stimulated Reservoir Volume

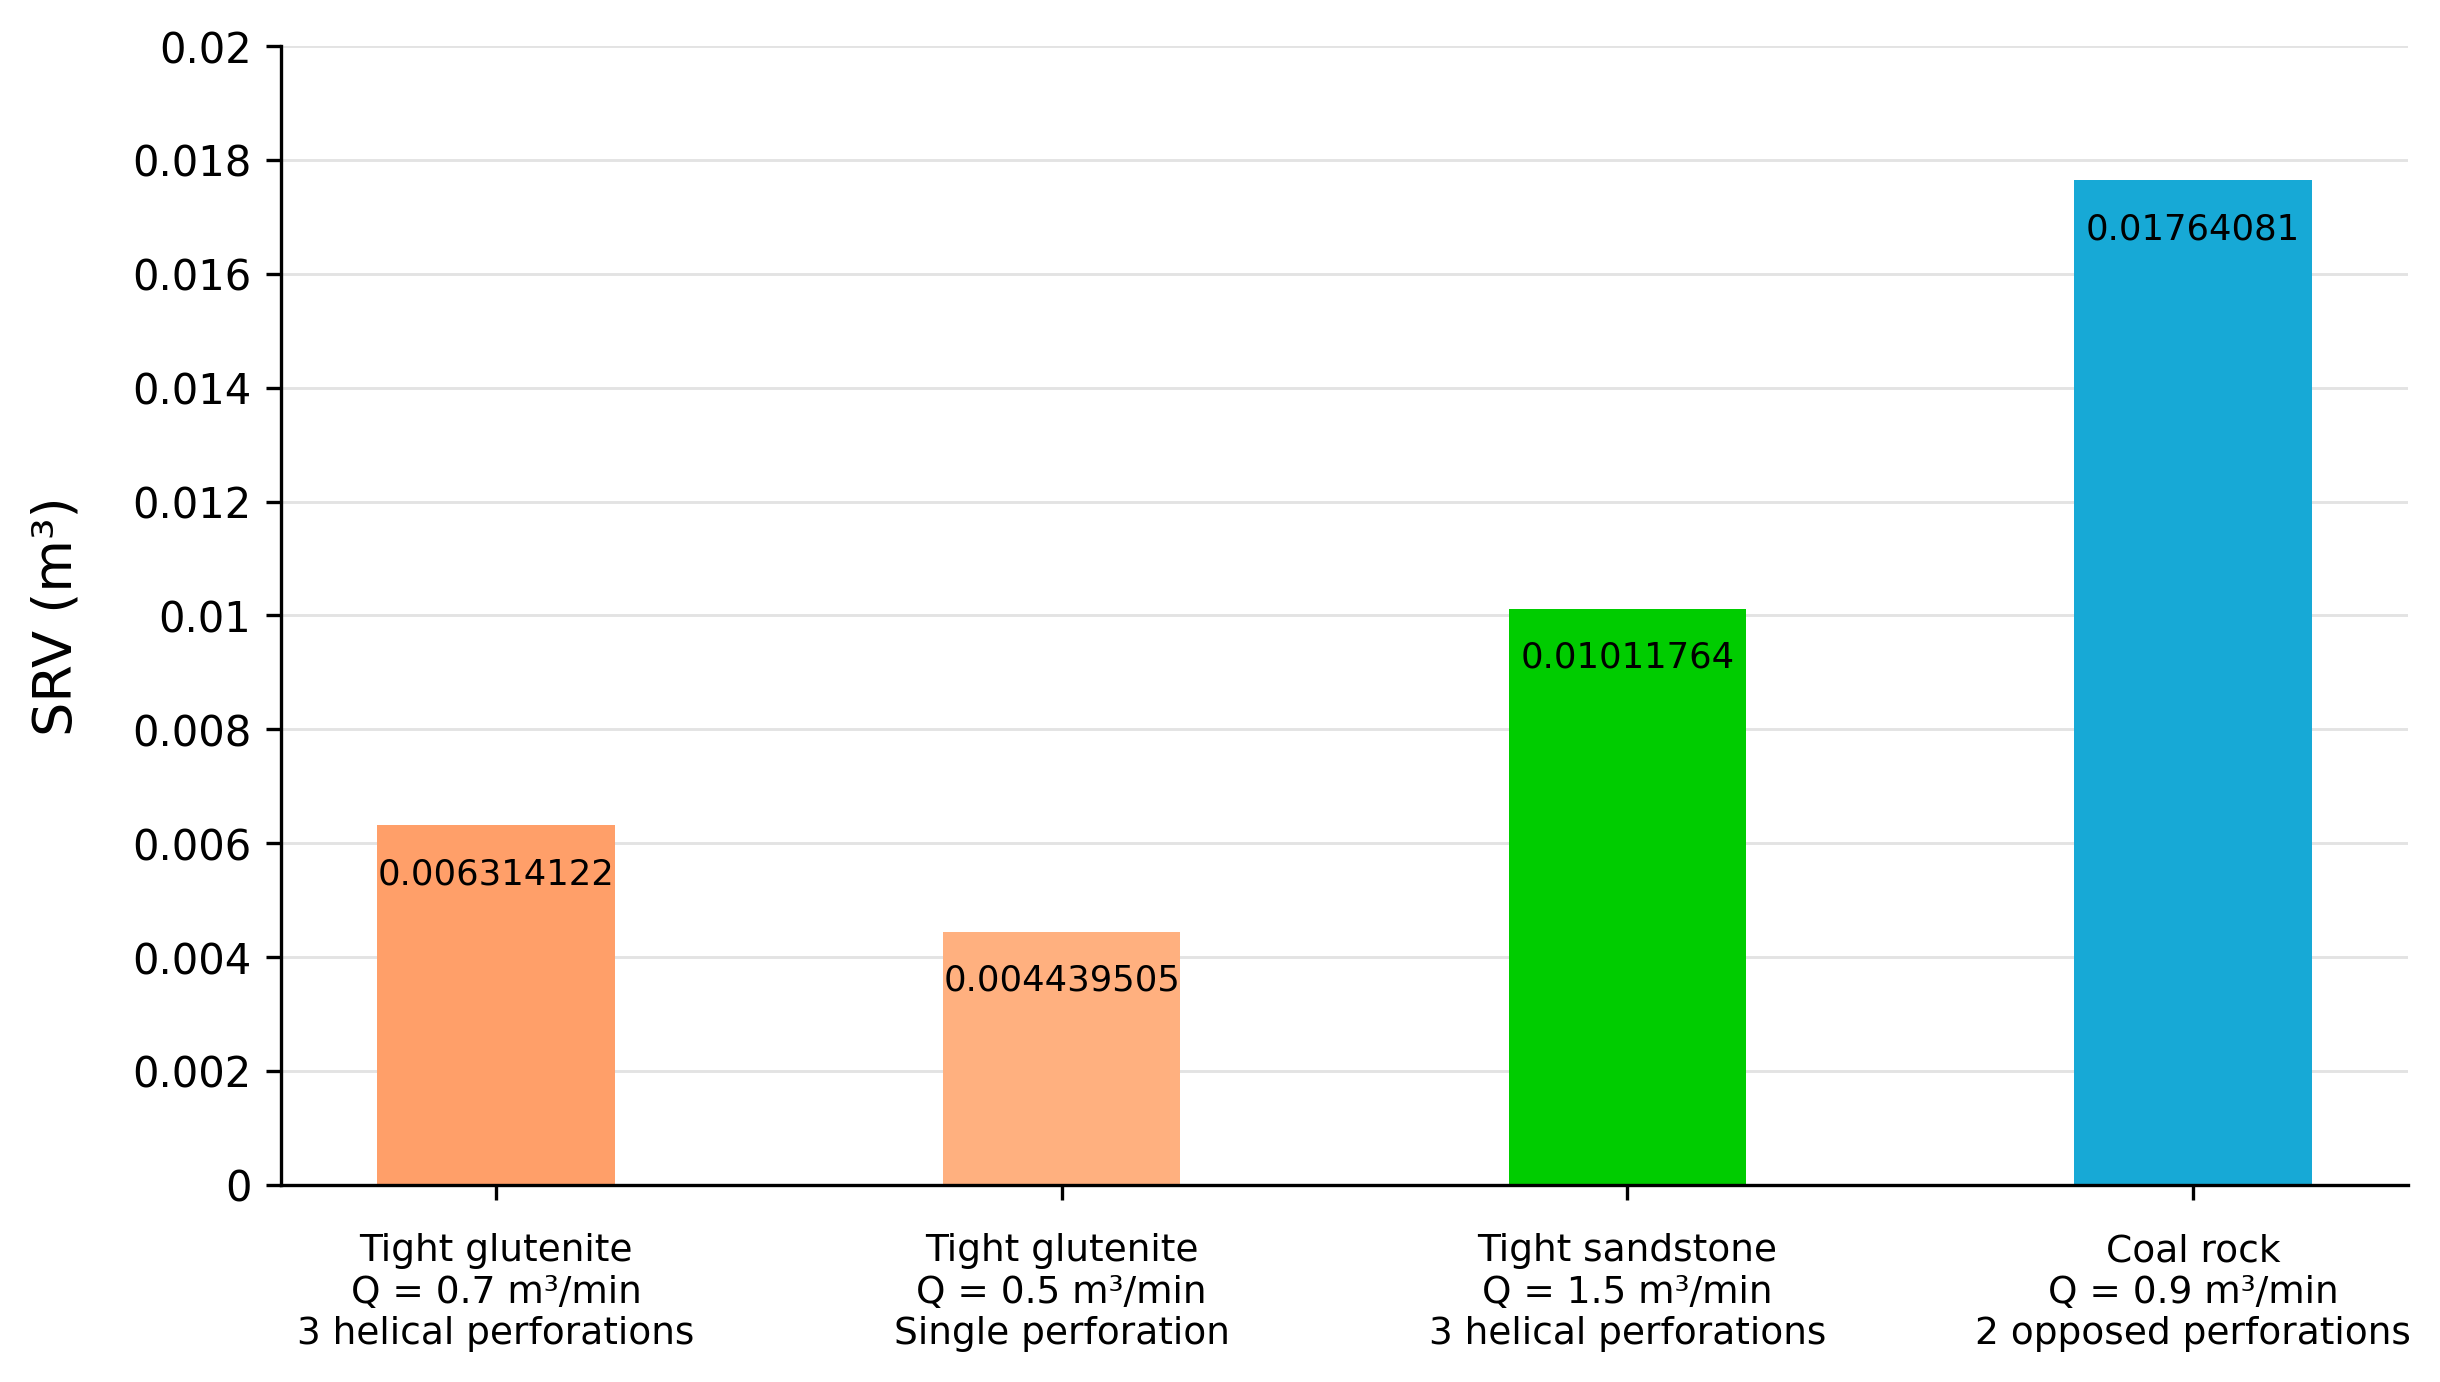
SRV was calculated from the original microseismic event-cloud processing and normalized as V* = V/Vmax. The four reported SRV values are treated as comparative geometric indicators because event-level uncertainty cannot be reconstructed from the retained dataset. Coal rock produced the largest microseismic-derived SRV of 0.01764081 m3 (V* = 1.0), compared with 0.006314122 m3 (V* = 0.36) for tight-glutenite Specimen 1, 0.004439505 m3 (V* = 0.25) for tight-glutenite Specimen 2, and 0.01011764 m3 (V* = 0.57) for tight-sandstone Specimen 3 (Figure 20). The large coal-rock envelope is consistent with widespread activation of bedding and cleat systems and should not be interpreted as an equivalent volume of newly created or effectively propped hydraulic fracture.
For the two tight-glutenite cases, the calculated SRV increased from 0.004439505 m3 in Specimen 2 to 0.006314122 m3 in Specimen 1, corresponding to a case-to-case increase of 42.2%. However, injection rate and perforation configuration changed simultaneously: the rate increased from 0.5 to 0.7 m3/min while the configuration changed from one perforation to three helical perforations. The 42.2% difference therefore cannot be attributed quantitatively to injection rate alone and instead represents the combined response of the tested configurations. Similarly, the sandstone case used the highest injection rate (1.5 m3/min) but did not produce the largest SRV, showing that injection rate by itself is not sufficient to explain the cross-lithology SRV ranking. Because each configuration was tested once, these differences are descriptive and no replicate-based confidence intervals or statistical significance are claimed. Table 4 lists Summary of observed fracture and microseismic characteristics of the four tested cases.
Table 4. Summary of observed fracture and microseismic characteristics of the four tested cases.
LithologyQ*Rupture Type (Tensile/Shear)Microseismic DistributionObserved Fracture PatternV*
Tight glutenite (Specimen 1)1.0051.5%/48.5%DiffuseNetwork fracture0.36
Tight glutenite (Specimen 2)0.7151.7%/48.3%Belt-likeSingle-fracture dominated0.25
Tight sandstone (Specimen 3)2.1452.4%/47.6%ConcentratedStable main fracture0.57
Coal rock (Specimen 4)1.2951.5%/48.5%Beaded along beddingComposite fracture1.00

4. Discussion

4.1. Lithology-Dependent Competition Between Far-Field Stress and Local Structural Control

To aid cross-case comparison, injection rate and SRV are presented in normalized form as Q* = Q/Q0 and V* = V/Vmax, where Q0 = 0.7 m3/min and Vmax = 0.01764081 m3. These normalized quantities are used only for visualization and descriptive comparison; they are not universal scaling parameters and do not constitute a specimen-size scaling law. The combined surface-fracture, microseismic, and pressure observations indicate that the four cases can be interpreted in terms of competition between far-field stress control and local structural control.
In tight glutenite, mixed grains and cemented interfaces produce spatially variable propagation resistance, so local heterogeneity can perturb an otherwise stress-controlled fracture path. Specimen 1 exhibited broader branching, a diffuse microseismic distribution, and a larger SRV than Specimen 2. These differences are consistent with the combined three-perforation/0.7 m3/min configuration activating more spatially distributed pathways than the single-perforation/0.5 m3/min configuration. Because both rate and perforation geometry changed, the data support a coupled configuration effect but not an isolated rate threshold or perforation threshold.
In tight sandstone, the comparatively uniform mineral assemblage and cementation were associated with a dominant stress-aligned main fracture, spatially concentrated microseismic activity, and large pressure oscillations. In coal rock, bedding and cleats provided preferential structural pathways, and the stimulated event cloud included extensive structural-plane participation. These observations support a conceptual distinction between stress-controlled localization in the sandstone case and stronger structure-controlled diversion or reactivation in the glutenite and coal-rock cases. The available data do not permit quantitative fracture-mechanics parameters such as fracture toughness or interface strength to be assigned to these mechanisms.
The present observations are broadly consistent with previous hydraulic-fracturing experiments conducted at different scales. Core-scale sandstone studies commonly report preferential fracture extension controlled by the principal-stress field [3,4], whereas larger true-triaxial experiments provide greater spatial opportunity for fracture diversion, branching, and interaction with heterogeneous structures [17,19]. Similarly, the pronounced participation of bedding and cleats observed in the present coal-rock specimen agrees with recent true-triaxial and layered-rock studies showing that pre-existing structural planes can redirect hydraulic fractures or undergo hydraulic reactivation [13,14,18,20]. These consistencies support the proposed stress-versus-structure interpretation, while the present four-case dataset does not permit quantitative comparison of fracture toughness, interface strength, or energy-dissipation parameters.

4.2. Interpretation of Fluid-Viscosity Effects Under the Tested Conditions

Fluid viscosity can influence pressure transmission, viscous pressure loss, leakoff, and access to narrow discontinuities. However, viscosity was not independently varied within each lithology in the present experimental program. Therefore, the four tests cannot establish an isolated causal relationship between viscosity and fracture architecture. Under the tested sandstone condition, the 40–45 mPa·s fluid was associated with a localized main fracture, whereas the glutenite and coal-rock cases used approximately 5 mPa·s fluid and showed greater participation of heterogeneous interfaces or natural structural planes. These observations are consistent with common mechanistic expectations for fluid mobility and pressure maintenance, but they remain confounded by simultaneous differences in lithology, rate, stress state, perforation configuration, and sand ratio. The present study therefore supports only a qualitative concept of lithology–fluid compatibility and does not define universal optimum viscosity ranges.

4.3. Coupled Effects of Injection Rate and Perforation Configuration

Injection rate and perforation configuration jointly influence hydraulic loading by controlling both the rate of fluid supply and the spatial distribution of potential initiation sites [20,21,22]. The two glutenite experiments provide a comparison between two combined configurations. Specimen 1, with three helical perforations and an injection rate of 0.7 m3/min, exhibited broader surface branching, a more diffuse microseismic pattern, and an SRV 42.2% larger than Specimen 2, which used one perforation and a flow rate of 0.5 m3/min. The observations are therefore consistent with enhanced spatial activation in the multi-perforation/higher-rate case.
Nevertheless, the 42.2% SRV difference does not quantify an independent injection-rate effect or an independent perforation-number effect because the two variables changed simultaneously. The present data support the more limited conclusion that the combined availability of multiple initiation locations and increased hydraulic supply was associated with more distributed fracture development in the tested glutenite specimens. Additional factorial experiments would be required to separate the individual contributions and interactions of these variables.

4.4. Coupled Pressure–Microseismic Evidence for Fracture-Growth Mechanisms

The pressure and microseismic observations provide complementary evidence for different fracture-growth behaviors. In glutenite Specimen 1, comparatively moderate pressure fluctuations coincided with broadly distributed microseismic activity and extensive surface branching, suggesting that hydraulic energy was distributed among several active pathways. In glutenite Specimen 2, a double-peak pressure response accompanied a more localized event cloud, consistent with temporary increases in propagation resistance during the advance of a dominant fracture.
The sandstone specimen exhibited pronounced pressure accumulation and release together with spatially concentrated microseismic activity, which is consistent with episodic extension of a localized main fracture. Coal rock exhibited a stepwise pressure response and continued microseismic activity associated with bedding-related event distributions, consistent with staged structural-plane activation. Thus, the most robust distinction among the tested cases is not the less-than-one-percentage-point difference in tensile/shear event fraction, but the combined relationship among pressure history, spatial event distribution, and final fracture geometry.

4.5. Implications of the Ultra-Large Experimental Domain

The 2 m × 2 m × 1 m specimens provide a substantially larger propagation domain than conventional laboratory cores. Although the present study did not include a systematic specimen-size series and therefore cannot establish a quantitative scale law, the enlarged domain allows fractures to propagate over longer distances; interact with more grains, cemented interfaces, bedding planes, or cleats; and develop multiple active paths before encountering an external boundary. It also provides more spatial room for interaction among fractures initiated from multiple perforations and for microseismic activity to be resolved over a broader volume. These features explain why ultra-large experiments can reveal complex fracture–structure interactions that may be difficult to observe in small cores. However, they should be regarded as implications of the enlarged experimental domain rather than as direct proof of a specimen-size scaling effect.
Relative to conventional core-scale specimens [3,4], the enlarged propagation distance also provides more spatial room for stress redistribution around multiple active fracture tips and for the fracture-process region to develop before being truncated by an external boundary. In heterogeneous specimens, hydraulic energy may consequently be distributed among main-fracture extension, secondary branching, interface deformation, and structural-plane reactivation over a larger experimental domain. The present study did not directly measure fracture-process-zone dimensions or energy dissipation; therefore, these effects are proposed as mechanistic implications of the enlarged domain rather than quantified scale effects.

4.6. Engineering Implications

The experimental observations suggest that hydraulic-fracturing design should account for the dominant structural characteristics of the target lithology rather than applying a single treatment concept to all reservoir types. In heterogeneous glutenite, a configuration that provides multiple initiation opportunities together with sufficient hydraulic supply may favor a more spatially distributed stimulated region. In comparatively uniform tight sandstone, fracture development may remain dominated by a major stress-aligned pathway, making main-fracture extension and conductivity important objectives. In coal rock, bedding and cleat systems can form a substantial component of the stimulated region, so treatment design should consider the activation and connection of pre-existing structural planes. These implications are qualitative and should not be interpreted as direct field-design thresholds because laboratory stresses, specimen boundaries, fluid systems, perforation dimensions, and structural scales differ from field reservoirs.

4.7. Limitations and Future Work

Several limitations must be considered. First, only four ultra-large specimens were tested, and each configuration was represented by a single specimen; experimental repeatability and statistical variability therefore cannot be quantified. Second, multiple variables changed among cases, including lithology, stress difference, viscosity, injection rate, perforation configuration, and sand ratio, so most single-factor effects cannot be separated. Third, only one specimen size was investigated, and the study therefore does not establish a specimen-size scaling law. Fourth, the retained experimental records do not contain complete event-level microseismic coordinates, source-location uncertainty, sensor calibration records, companion mechanical-property measurements, or rheological test metadata required for a retrospective uncertainty analysis. The reported SRV and rupture-type results are consequently interpreted as comparative indicators rather than statistically validated absolute quantities. Future work should use replicate specimens, independently controlled parameter series, multiple specimen sizes, event-level microseismic uncertainty analysis, and three-dimensional fracture reconstruction or coupled numerical modeling to quantify these effects.

5. Conclusions

This study compared fracture development in four ultra-large true-triaxial hydraulic-fracturing cases using post-test surface morphology, microseismic observations, pressure evolution, and microseismic-derived SRV. Within the limitations of the non-replicated and multi-variable experimental design, the principal conclusions are as follows.
  • The tested lithologies exhibited distinctly different fracture architectures. Tight glutenite showed either distributed branching or a localized dominant fracture depending on the tested configuration; tight sandstone was dominated by a throughgoing, approximately stress-aligned main fracture; and coal rock showed extensive interaction between hydraulic fractures and bedding/cleat systems. These observations are consistent with different balances between far-field stress control and local structural heterogeneity. This finding indicates that lithological structure should be characterized before selecting treatment parameters intended either to promote fracture complexity or to maintain a dominant conductive fracture.
  • Pressure and microseismic observations provided complementary evidence for the final fracture patterns. The distributed glutenite case showed comparatively moderate pressure fluctuations and broad microseismic activity; the localized sandstone case showed pronounced pressure-accumulation–release cycles with concentrated events; and coal rock showed stepwise pressure evolution together with bedding-associated rupture activity. The combined pressure–microseismic response is therefore more informative for distinguishing fracture-growth behavior than the small differences in tensile/shear event percentages alone.
  • For the two tight-glutenite cases, the three-helical-perforation/0.7 m3/min configuration produced an SRV of 0.006314122 m3, 42.2% larger than the 0.004439505 m3 value for the single-perforation/0.5 m3/min configuration. Because perforation configuration and injection rate changed simultaneously, this difference represents a combined configuration effect and cannot be attributed quantitatively to either variable alone. Accordingly, injection rate and perforation configuration should be considered jointly when designing stimulation strategies for strongly heterogeneous reservoirs.
  • The coal-rock case produced the largest microseismic-derived SRV (0.01764081 m3), but this envelope includes deformation associated with reactivated bedding and cleat systems. Microseismic-derived SRV in structurally complex media should therefore be interpreted as the spatial extent of detectable stimulation or deformation rather than as the volume of newly created or effectively propped fracture.
  • The ultra-large experimental domain provides space for long-distance fracture propagation and interaction with heterogeneous structures, but the present study does not establish a quantitative scale law because only one specimen size was used. More generally, each configuration was tested once and several variables changed among cases; the reported relationships should therefore be regarded as mechanistically supported case trends rather than universal critical criteria. Replicate, factorial, multi-size, and event-level uncertainty studies are required for quantitative generalization.

Author Contributions

Conceptualization, N.L. and X.M.; methodology, N.L., G.L. and L.X.; investigation, N.L., G.L., L.X. and C.L.; data curation, N.L. and X.W.; formal analysis, N.L. and X.M.; visualization, L.X. and X.W.; writing—original draft preparation, N.L.; writing—review and editing, X.M. and G.L.; supervision, X.M.; project administration, G.L. and C.L. All authors have read and agreed to the published version of the manuscript.

Funding

This research received no external funding.

Data Availability Statement

The original contributions presented in this study are included in the article. Further inquiries can be directed to the corresponding author.

Acknowledgments

The authors acknowledge the technical support provided during the ultra-large true-triaxial hydraulic-fracturing experiments.

Conflicts of Interest

Authors Ning Li, Guohua Liu, Liu Xu, Changjun Long, and Xin Wang were employed by the Oil and Gas Technology Research Institute, PetroChina Huabei Oilfield Company. The remaining author declares that the research was conducted in the absence of any commercial or financial relationships that could be construed as a potential conflict of interest.

Abbreviations

The following abbreviations are used in this manuscript:
BEMBoundary element method
DEMDiscrete element method
FEMFinite element method
SRVStimulated reservoir volume
AEAcoustic emission

References

  1. Wang, Y.; Lu, Y.; Li, Y.; Wang, X.; Yan, X.; Zhang, Z. Progress and application of hydraulic fracturing technology in unconventional reservoir. Acta Pet. Sin. 2012, 33, 149–158. [Google Scholar] [CrossRef]
  2. Warpinski, N.R.; Teufel, L.W. Influence of Geologic Discontinuities on Hydraulic Fracture Propagation. J. Pet. Technol. 1987, 39, 209–220. [Google Scholar] [CrossRef] [Scilit]
  3. Chitrala, Y.; Moreno, C.; Sondergeld, C.; Rai, C. An experimental investigation into hydraulic fracture propagation under different applied stresses in tight sands using acoustic emissions. J. Pet. Sci. Eng. 2013, 108, 151–161. [Google Scholar] [CrossRef] [Scilit]
  4. He, J.; Lin, C.; Li, X.; Zhang, Y.; Chen, Y. Initiation, propagation, closure and morphology of hydraulic fractures in sandstone cores. Fuel 2017, 208, 65–70. [Google Scholar] [CrossRef] [Scilit]
  5. Lecampion, B.; Bunger, A.; Zhang, X. Numerical methods for hydraulic fracture propagation: A review of recent trends. J. Nat. Gas. Sci. Eng. 2018, 49, 66–83. [Google Scholar] [CrossRef] [Scilit]
  6. Li, R.; Yi, X.; Wang, T.; Lu, H.; Jiang, X.; Jiang, W.; Wang, H.; Sun, L.; Shang, D.; Wang, Z. Numerical simulation of hydraulic fracturing for low permeability reservoirs based on particle flow code-discrete element method. Pet. Sci. Bull. 2022, 7, 576–583. [Google Scholar] [CrossRef]
  7. Dong, Z.; Shen, Y. Numerical simulation of hydraulic fracture propagation behaviors in bedding shale. J. Eng. Geol. 2025, 33, 1712–1722. [Google Scholar] [CrossRef]
  8. Zhuang, X.; Zhou, S.; Sheng, M.; Li, G. On the hydraulic fracturing in naturally-layered porous media using the phase field method. Eng. Geol. 2020, 266, 105306. [Google Scholar] [CrossRef] [Scilit]
  9. Maxwell, S.C.; Urbancic, T.I.; Steinsberger, N.; Zinno, R. Microseismic Imaging of Hydraulic Fracture Complexity in the Barnett Shale. In Proceedings of the SPE Annual Technical Conference and Exhibition, San Antonio, TX, USA, 29 September–2 October 2002; p. SPE-77440-MS. [Google Scholar] [CrossRef]
  10. Mayerhofer, M.J.; Lolon, E.P.; Warpinski, N.R.; Cipolla, C.L.; Walser, D.W.; Rightmire, C.M. What Is Stimulated Reservoir Volume? SPE Prod. Oper. 2010, 25, 89–98. [Google Scholar] [CrossRef] [Scilit]
  11. Huang, L.; Liao, X.; Fan, M.; Wu, S.; Tan, P.; Yang, L. Experimental and numerical simulation technique for hydraulic fracturing of shale formations. Adv. Geo-Energy Res. 2024, 13, 83–88. [Google Scholar] [CrossRef] [Scilit]
  12. Liang, T.; Fu, H.; Liu, Y.; Xiu, N.; Yan, Y. On the determination method of rupture mechanism in acoustic emission used in hydraulic fracturing fracture propagation. J. Exp. Mech. 2019, 34, 358–364. [Google Scholar] [CrossRef]
  13. Li, B.; Wang, N.; Cui, J.; Shi, Z.; Zhi, G.; Wang, Z. Experimental study on guided hydraulic fracturing of low-permeability coal rock reservoirs under true triaxial conditions. J. Min. Sci. Technol. 2025, 10, 936–948. [Google Scholar] [CrossRef]
  14. Dong, G.; Wang, Z.; Ren, X.; Guo, W. Fracture propagation behavior in coal hydraulic fracturing and impact mitigation effectiveness evaluation. J. China Coal Soc. 2026, 51, 30–56. [Google Scholar] [CrossRef]
  15. He, Y.; He, J.; Zhang, Y.; Mao, T.; Zheng, B.; Li, S.; Li, X. Triaxial stress dynamics during hydraulic fracturing and the correlation with fracture distribution. J. Eng. Geol. 2025, 33, 1723–1735. [Google Scholar] [CrossRef]
  16. Tan, P.; Chen, Z.-W.; Huang, L.-K.; Zhao, Q.; Shao, S.-R. Evaluation of the combined influence of geological layer property and in-situ stresses on fracture height growth for layered formations. Pet. Sci. 2024, 21, 3222–3236. [Google Scholar] [CrossRef] [Scilit]
  17. Lu, J.; Lin, B.; Jin, Y.; Meng, H.; Wang, Z. 3D visualization characterization methodology of true triaxial hydraulic fractures: A case study of conglomerate specimen. Pet. Drill. Tech. 2025, 53, 97–108. [Google Scholar] [CrossRef]
  18. Ma, J.; Li, X.; Zhang, J.; Yao, Q.; Chong, Z.; Yang, S.; Yuan, Y. The study on the propagation laws of hydraulic fractures in coal measure strata under true triaxial conditions. J. Min. Strat. Control Eng. 2025, 7, 043027. [Google Scholar] [CrossRef]
  19. Wang, H.; Yin, B.; Wang, Y.; Xu, X.; Zhao, S.; Zhao, F.; Shi, X.; Wang, G. Fluid-solid coupling mechanisms in the evolution of hydraulic fracture networks in large-scale true triaxial tight sandstone. Chin. J. Rock. Mech. Eng. 2026, 45, 1723–1739. [Google Scholar] [CrossRef] [Scilit]
  20. Gu, M.-Z.; Sheng, M.; Zhuang, X.-Y.; Li, X.-Y.; Li, G.-S. The influences of perforating phase and bedding planes on the fracture deflection in laminated shale. Pet. Sci. 2024, 21, 1221–1230. [Google Scholar] [CrossRef] [Scilit]
  21. Yang, P.; Zou, Y.; Zhang, S.; Li, J.; Zhang, X.; Ma, X.; Yang, L. Propagation characteristics of multiple clusters of fractures in fully coupled wellbore-perforation-fracture fracturing. Pet. Explor. Dev. 2025, 52, 1199–1210. [Google Scholar] [CrossRef]
  22. Shi, X.; Yang, Y.-Y.; Kong, X.-W.; Gao, Q.; Jiang, S.; Mao, H.-J. Experimental study of hydraulic fracture propagation with multi-cluster in-plane perforations in a horizontal well. Pet. Sci. 2024, 21, 3258–3270. [Google Scholar] [CrossRef] [Scilit]
  23. Zhao, H.-F.; Luo, J.-L.; Li, X.-J.; Yao, W.-J.; Ji, L.; Zhen, H.-B. Experimental investigation into the fracture propagation behavior of horizontal well multi-stage and multi-cluster fracturing within the roof of crushed soft coal seams. Pet. Sci. 2025, 22, 4682–4713. [Google Scholar] [CrossRef] [Scilit]
  24. Yang, R.; Lu, M.; Li, A.; Cheng, H.; Jing, M.; Huang, Z.; Li, G. Fracture propagation and fatigue damage mechanisms in pulse hydraulic fracturing of deep coal. Pet. Explor. Dev. 2025, 52, 948–958. [Google Scholar] [CrossRef]
  25. Tang, M.; Zhang, G.; Zhang, M. Experiment on spatial distribution characteristics of fracture network from 3D multi-horizontal well hydraulic fracturing. Rock. Soil Mech. 2025, 46, 2449–2458. [Google Scholar] [CrossRef]
  26. SY/T 5289-2016; Methods for Fracturing Design, Treatment and Post-Fracturing Effect Evaluation of Oil, Gas and Water Wells. National Energy Administration of China: Beijing, China, 2016. Available online: https://std.samr.gov.cn/hb/search/stdHBDetailedCNF?id=8B1827F1C635BB19E05397BE0A0AB44A (accessed on 9 August 2026).
  27. GB/T 17671-1999; Method of Testing Cements—Determination of Strength (ISO Method). State Bureau of Quality and Technical Supervision of China: Beijing, China, 1999. Available online: https://openstd.samr.gov.cn/bzgk/std/newGbInfo?hcno=7AD06455D640C969669ACAEEB4AB1762 (accessed on 9 August 2026).
Figure 1. Schematic relationship between fault-plane parameters and the seismic moment tensor.
Processes 14 02647 g001
Figure 2. Preparation of ultra-large physical-model specimens: (a) outcrop sampling; (b) shaping and curing of the model specimen.
Processes 14 02647 g002
Figure 3. Machining of the simulated wellbore from field casing.
Processes 14 02647 g003
Figure 4. Simulated drilling and cementing operation.
Processes 14 02647 g004
Figure 5. Ten-thousand-ton ultra-large true-triaxial hydraulic-fracturing simulation system.
Processes 14 02647 g005
Figure 6. Monitoring layout for the ultra-large true-triaxial hydraulic-fracturing simulation test.
Processes 14 02647 g006
Figure 7. Microseismic monitoring equipment.
Processes 14 02647 g007
Figure 8. High-frequency pressure sensor used for wellhead pressure acquisition.
Processes 14 02647 g008
Figure 9. Post-fracturing surface morphology of tight-glutenite Specimen 1. The major specimen surface is 2 m × 2 m; yellow dashed lines indicate visually identified fracture traces, and red arrows indicate the applied principal-stress directions.
Processes 14 02647 g009
Figure 10. Post-fracturing surface morphology of tight-glutenite Specimen 2. The major specimen surface is 2 m × 2 m; yellow dashed lines indicate visually identified fracture traces, and red arrows indicate the applied principal-stress directions.
Processes 14 02647 g010
Figure 11. Post-fracturing surface morphology of tight-sandstone Specimen 3. The major specimen surface is 2 m × 2 m; yellow dashed lines indicate visually identified fracture traces, and red arrows indicate the applied principal-stress directions.
Processes 14 02647 g011
Figure 12. Post-fracturing surface morphology of the No. 3 coal-rock specimen. The ruler provides a physical scale for the observed fractures; bedding and cleat-controlled fracture traces are visible in the post-fracturing specimen.
Processes 14 02647 g012
Figure 13. Microseismic event distributions in the two tight-glutenite specimens: (a) Specimen 1, Q* = 1.0; (b) Specimen 2, Q* = 0.71.
Processes 14 02647 g013
Figure 14. Microseismic event distribution in the tight-sandstone specimen.
Processes 14 02647 g014
Figure 15. Microseismic event distribution in the coal-rock specimen.
Processes 14 02647 g015
Figure 20. Comparison of microseismic-derived SRVs among the four tested specimens. The bars represent the originally reported point estimates; error bars are not shown because event-level location uncertainty and replicate-based variability cannot be reconstructed from the archived dataset.
Processes 14 02647 g020
Table 2. Experimental scheme.
No.LithologyHorizontal Stress Difference (MPa)ProppantInjection Rate (m3/min)Perforation SchemeFluid Viscosity (mPa·s)Sand Ratio
1Tight glutenite940/70 mesh quartz sand0.7Three helical perforations; 120° phasing55%
2Tight glutenite940/70 mesh quartz sand0.5One perforation along σH55%
3Tight sandstone (Sulige Su 75)740/70 mesh quartz sand1.5Three helical perforations; 120° phasing40–4510%
4No. 3 coal rock540/70 mesh quartz sand0.9Two opposed horizontal perforations along σH; 180° phasing55%
Note: The experiments were conducted under true-triaxial loading rather than conventional axisymmetric confinement; therefore, a single “confining pressure” is not applicable. The retained records provide the case-specific horizontal principal-stress difference shown above and an overall vertical-stress range of 12–14 MPa. Complete case-specific values of σH and σh and companion mechanical-property and permeability measurements are not available in the archived dataset and are therefore not reconstructed.
Table 3. Descriptive pressure-response parameters of the four tested cases.
LithologyInitiation Pressure (MPa)Maximum/Characteristic Peak Pressure (MPa)Characteristic Pressure VariationPressure-Response Pattern
Tight glutenite (Specimen 1)3543<3 MPaComparatively smooth
Tight glutenite (Specimen 2)3840Two major peaksDouble peak
Tight sandstone (Specimen 3)30408–10 MPa between major peaksMulti-peak oscillation
Coal rock (Specimen 4)2525.33–5 MPa per stepStepwise
Disclaimer/Publisher’s Note: The statements, opinions and data contained in all publications are solely those of the individual author(s) and contributor(s) and not of MDPI and/or the editor(s). MDPI and/or the editor(s) disclaim responsibility for any injury to people or property resulting from any ideas, methods, instructions or products referred to in the content.