1. Introduction
The efficient development of coalbed methane (CBM), as an important unconventional natural gas resource, is of great strategic significance for optimizing the energy structure and ensuring coal mine safety. The southern Qinshui Basin, as China’s largest commercial CBM base, has developed a fairly mature set of techniques for shallow and medium-depth CBM development through years of exploration and production. However, as development extends into deep strata and structurally complex areas, the main coal seams exhibit marked productivity disparities: in the same block, 80.6% of the wells in the 3# coal seam of the Permian Shanxi Formation are high-yielding, whereas less than 50% of those in the 15# coal seam of the Carboniferous Taiyuan Formation are high-yielding, and the latter are generally characterized by high water production and low gas production. The underlying mechanism of this variation remains unclear, which severely restricts the effective development of CBM wells.
The productivity of CBM wells is mainly influenced by multiple factors, including geological conditions, drilling and completion engineering, fracturing treatments, and fluid-drainage management [
1,
2,
3,
4]. Research on geological factors largely focuses on the fundamental role of static reservoir parameters—such as coal seam thickness, gas content, permeability, and in situ stress—in controlling productivity, and sweet spots are delineated based on resource potential [
5,
6,
7,
8]. However, even within the same sweet spot, notable productivity variations are common during actual development, and this is closely related to the subsequent engineering performance [
9,
10,
11,
12]. Drilling studies show that increasing the horizontal section length and improving the coal seam encounter rates can effectively ensure high and stable production of horizontal wells, but more sidetracking raises the risk of connecting with water-bearing zones and tends to induce high water production [
13]. In fracturing engineering, extreme-volume fracturing—which creates complex fracture networks through large pumping rates, large fluid volumes, and staged multi-cluster perforations, and features high sand ratios and high operational efficiency—has become an effective means of achieving high yields in deep CBM reservoirs. Nevertheless, this technology also has clear limitations in structurally complex areas: multi-cluster fractures often fail to extend evenly, and sharp pressure fluctuations and proppant placement difficulties are common during treatments, leading to unsatisfactory stimulation results [
14,
15,
16,
17,
18]. In drainage practice, an excessively fast initial drawdown rate tends to damage the reservoir, causing permeability to gradually decrease, which restricts the subsequent water-drainage and gas-production performance [
19,
20]. These studies confirm that optimization of engineering parameters significantly influences CBM productivity, but most focus only on the correlation between individual parameters and productivity, while overlooking the controlling effect of the degree of matching between engineering parameters and geological conditions on productivity performance. In particular, why the same fracturing and drainage treatments yield distinctly different productivity responses in the 3
# and 15
# coal seams within the same block remains unclear, as there is currently a lack of systematic comparative studies from an engineering-geology matching perspective.
To address the reasons for excessive water production in CBM wells, researchers have developed various methods to diagnose produced-water sources. These primarily include hydrochemical analysis, principal component analysis coupled with Bayesian discriminant analysis, and water-influx characteristic diagnostics adapted from water-drive gas reservoirs. The hydrochemical analysis, by analyzing the dynamic evolution of the ionic compositions and total dissolved solids in produced water, can elucidate the water–rock coupling productivity mechanisms and qualitatively fingerprint the origins of fluids [
21,
22]. This method has high analytical precision and a clear geological mechanism, and can clearly reveal the physicochemical evolution laws of multiphase fluids in the formation at a fundamental level. However, it is highly dependent on intensive field sampling and lengthy laboratory analysis cycles, and cannot achieve continuous dynamic monitoring throughout the entire production and drainage process. The coupling of principal component analysis and Bayesian discriminant analysis integrates multi-dimensional datasets—including well logging, hydrochemical parameters, and early production dynamics—to construct robust water-source identification models for multi-coal seam systems, thereby enabling the quantitative differentiation between end-member (single) and mixed fluid origins [
23,
24]. This method overcomes the limitations of a single indicator, offers a more comprehensive evaluation dimension, and can precisely diagnose the dynamic contribution ratio of each water-bearing layer in the co-production well. However, it relies highly on the completeness of statistical samples and has poor generalization and regional transferability. In addition, water-influx characteristic diagnostics adapted from water-drive gas reservoirs leverage readily available production data—such as cumulative gas production, water production rates, and water–gas ratios—for real-time production tracking, thereby enabling researchers to invert the timing and intensity of exogenous water influx [
25,
26,
27]. While this methodology directly leverages routinely and continuously monitored field data—offering high operational practicality, low cost, and temporal continuity—its analytical workflows rely heavily on empirical charts for qualitative inferences. Consequently, it lacks unified quantitative evaluation metrics, making it highly challenging to effectively disentangle the actual contributions of mixed fluid origins under severe interlayer interference.
In summary, although these methods offer varied technical routes and a solid theoretical foundation for water-source identification and reservoir dynamic evaluation in CBM wells across geological, statistical, and routine production-dynamic dimensions, and demonstrate good application value, they have limitations when dealing with complex multi-source water mixing or severe interlayer interference [
28,
29,
30]. In particular, these methods are costly, poor in timeliness, highly dependent on large statistical samples, or unable to achieve quantitative tracking across the entire well lifetime. The production indicator curve diagnostic method fills this gap, as it enables the construction of diagnostic curves using only routine production data, elucidating the reservoir elastic energy release mechanism and fluid production dynamics [
31]. However, the indicator curve literature has centered almost exclusively on vertical wells. Few studies have focused on the morphological evolution of characteristic curves and their quantitative relationship with productivity under complex seepage conditions in horizontal wells.
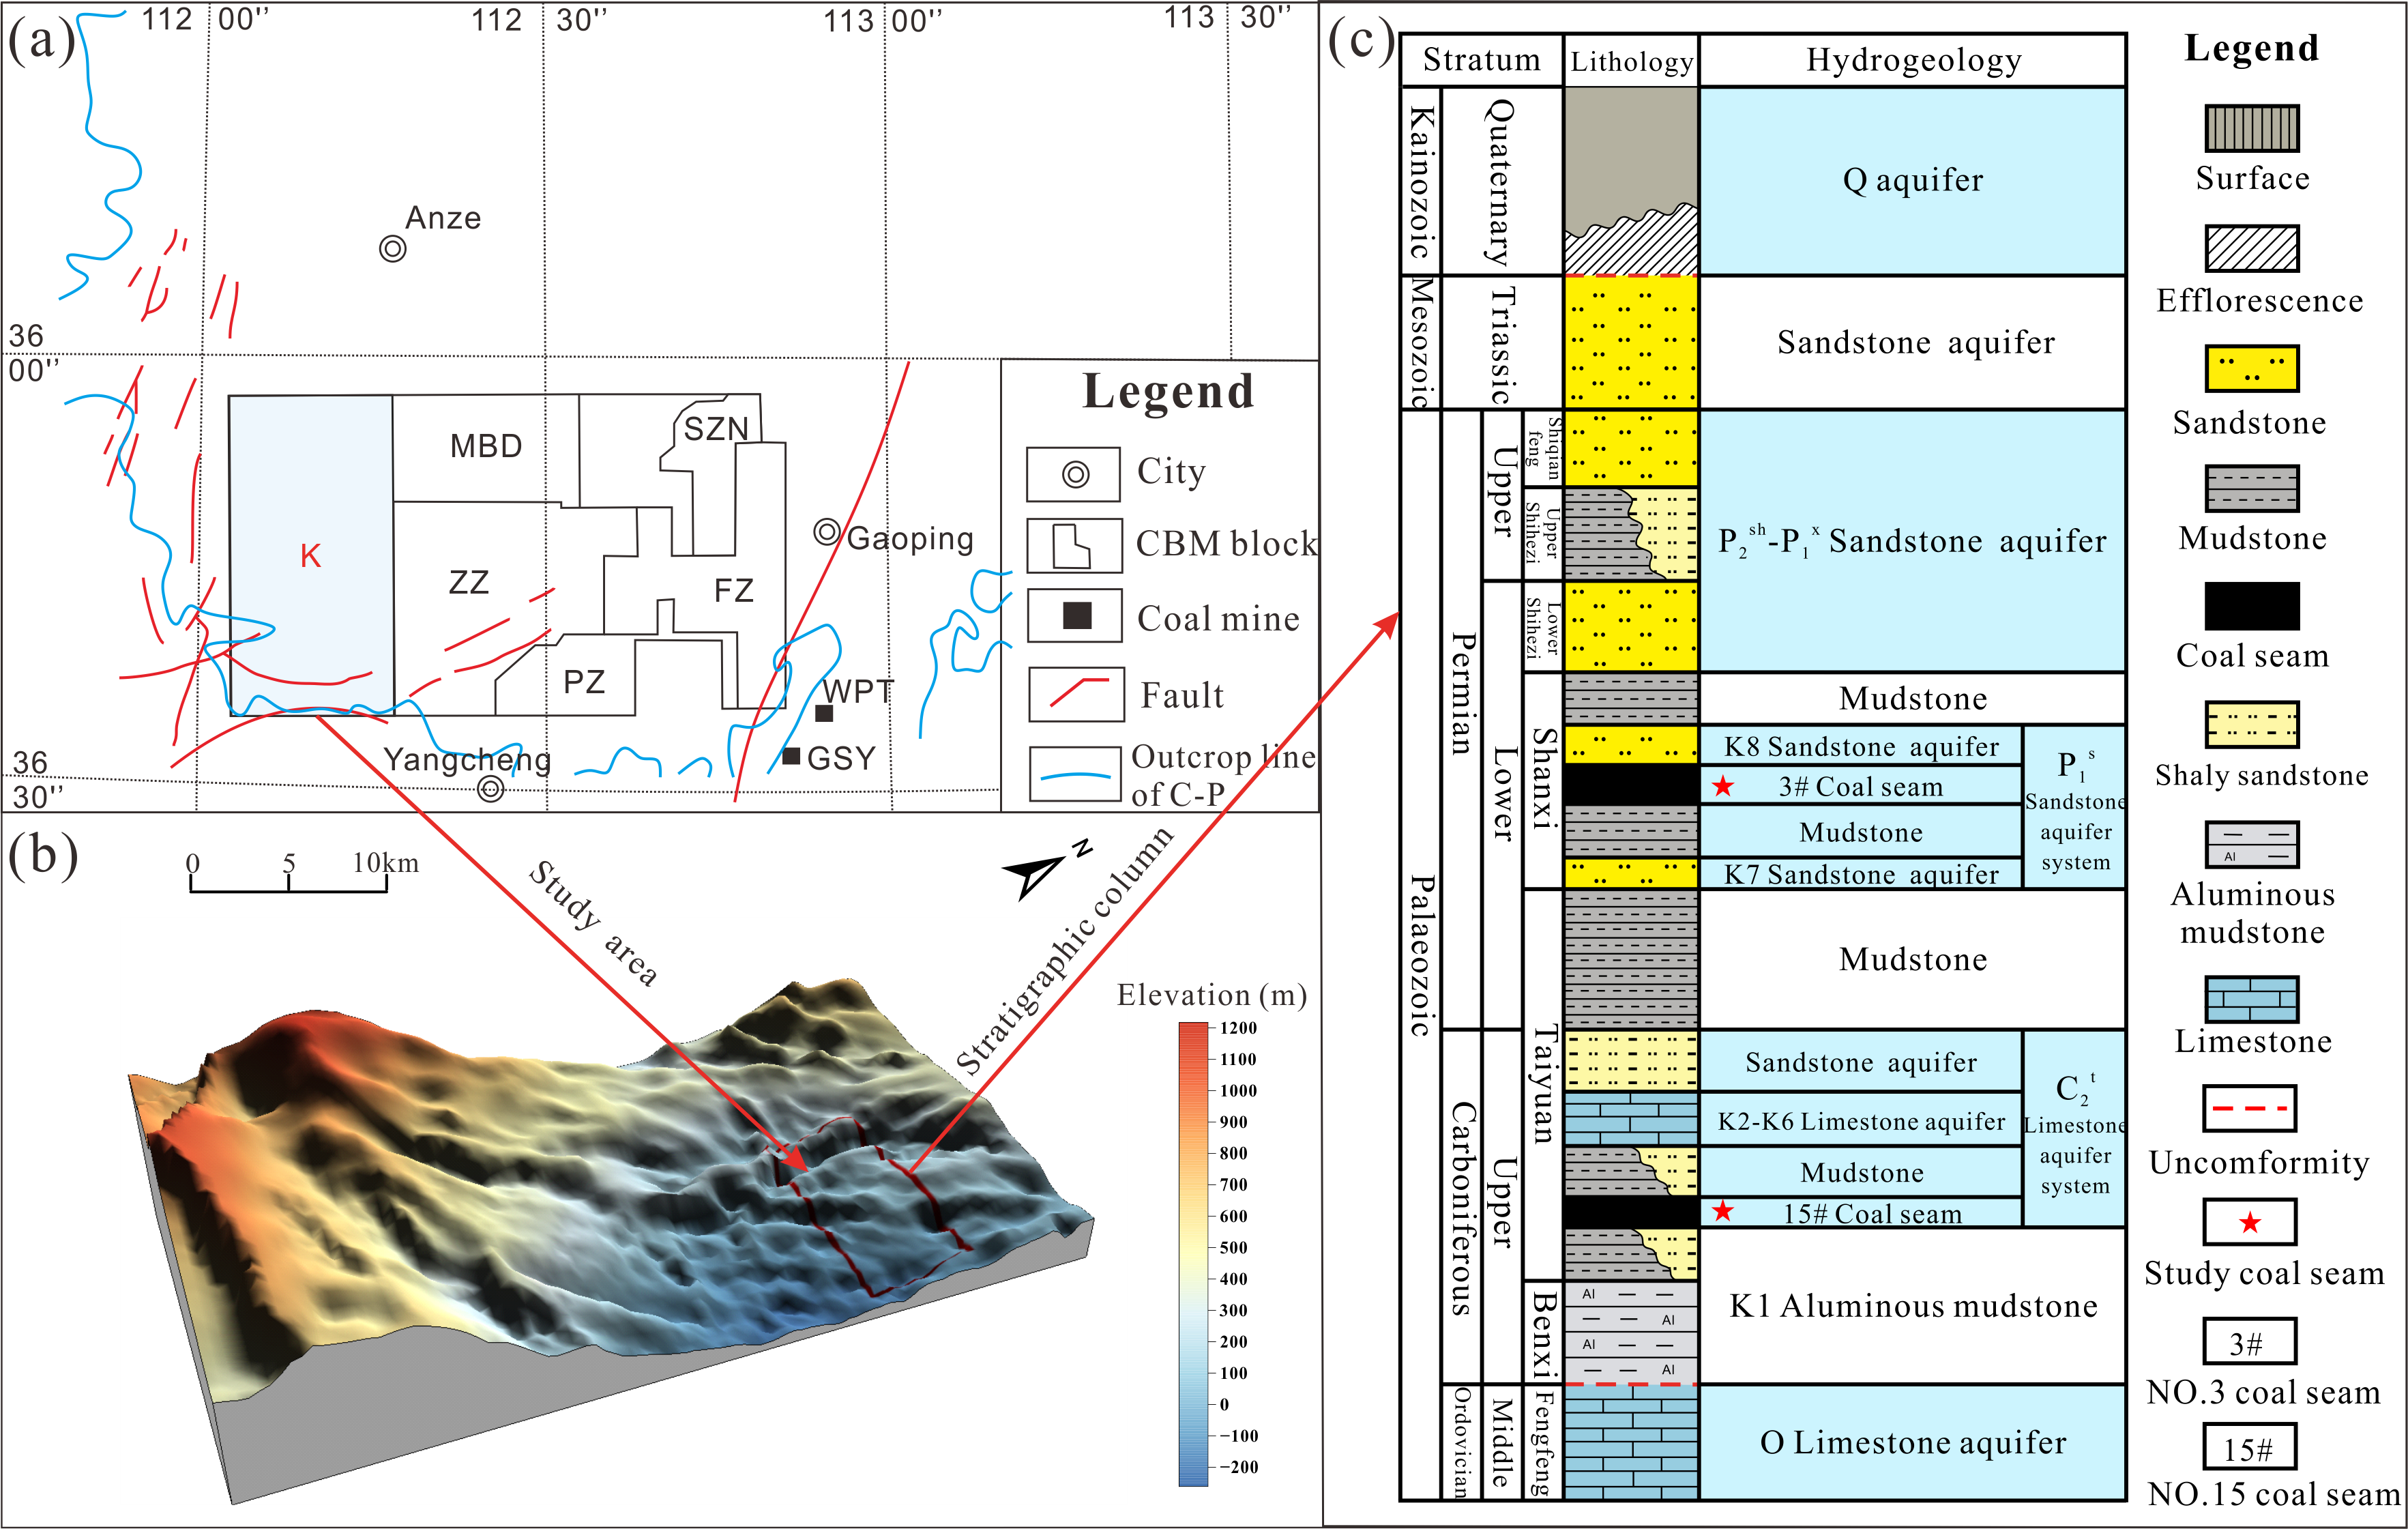
With this in mind, the present study centers on horizontal CBM wells drilled in the 3# and 15# coal seams within the northern extent of Block K. By integrating correlation analysis of engineering parameters with an improved dynamic diagnostic method based on production indicator curves, we aim to uncover the key factors behind the productivity variation between the two seams. Specifically, this work evaluates reservoir pressure drawdown efficiency, characterizes the intensity of exogenous water interference, and in doing so furnishes a theoretical foundation and technical support for the differentiated development of analogous blocks.
3. Analysis of the Causes of Productivity Variation
To reveal the dominant mechanism behind the productivity variation between the 3# and 15# coal seams in the northern part of Block K, and to identify suitable engineering parameters, this study systematically compared the drilling, fracturing, and drainage parameters of the two coal seams. We introduced a metric called “300-day cumulative gas production per fracturing section” as the productivity evaluation index, and examined the correlation between each engineering parameter and productivity. This metric is defined as the cumulative gas production within 300 days of a single well divided by the number of fracturing sections, and is used to represent the average productivity contribution of each fracturing section of a horizontal well within 300 days. The 300-day window was selected because most wells in this area have only about 365 days of production history, and some have even less; a longer time window would exclude too many wells, while a shorter time window would only capture the early flowback-influenced phase and fail to reflect stable production performance. The purpose of adopting this metric is twofold. First, a fixed 300-day window avoids the problems that come with different production durations across wells. Second, normalizing by the number of sections removes the interference of operational strategy from the assessment, so the results better reflect how efficiently engineering parameters translate into gas production and reduce potential interference from non-geological factors.
3.1. Drilling Analysis
The drilling parameters statistically analyzed are the effective horizontal section length, coal seam drilling encounter rate, and sidetracking frequency. Among them, the effective horizontal section length determines the spatial contact extent between the wellbore and the coal seam, and is a geometric indicator of the gas supply range; the coal seam drilling encounter rate reflects the trajectory accuracy of the wellbore in the target coal seam, and is a key parameter for evaluating geosteering efficacy; the sidetracking frequency indirectly reflects the frequency of engineering problems such as deviation from the target layer or entering non-target layers during the drilling process, and can be used to infer the complexity of the coal seam geological conditions. The three factors jointly constitute the comprehensive evaluation system for drilling engineering quality from the three dimensions of “spatial contact range, trajectory control precision, and operational difficulty”.
In comparison with the 3
# coal seam, horizontal wells targeting the 15
# seam exhibit a reduction in the average effective horizontal section length, dropping from 871 m to 798 m; the average coal seam drilling encounter rate similarly falls from 97% to 92%, while the average sidetracking frequency increases from 0.32 to 1.57 (
Figure 4). This indicates that drilling quality is inferior in the 15
# coal seam relative to the 3
# coal seam. In the complex structural area, the wellbore trajectory is prone to deviate from the coal seam, which not only significantly raises the sidetracking frequency, but also reduces the drilling encounter rate, ultimately resulting in the severe shortening of the effective horizontal section length [
35].
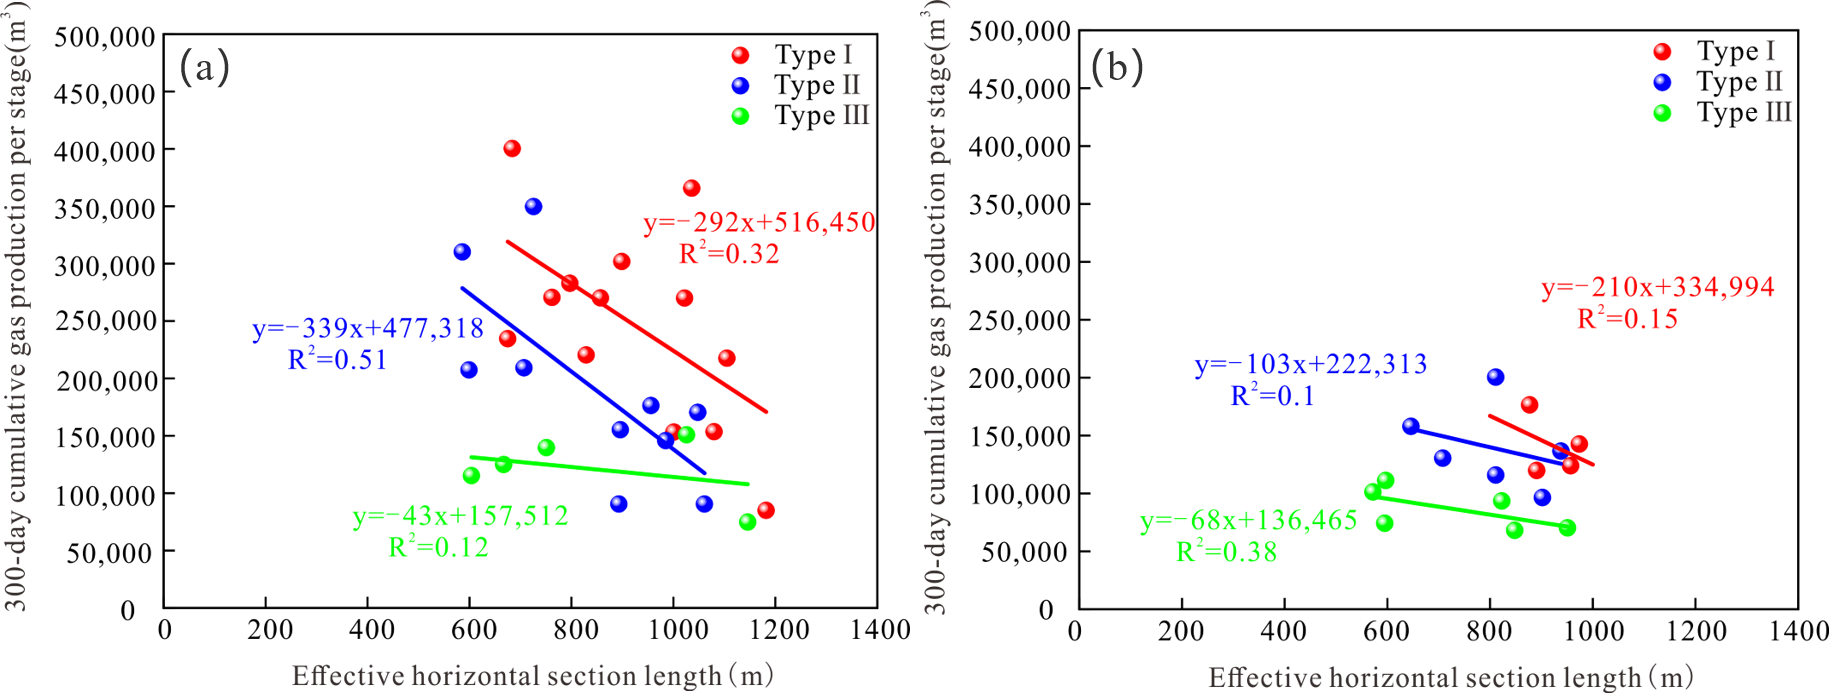
A comparative analysis of the correlation between the effective horizontal section length and the 300-day cumulative gas production per fracturing section reveals distinct trends between the two coal seams and among the three well types (
Figure 5). For the 3
# coal seam, Type I and Type II wells both exhibit relatively significant negative correlations, while Type III wells show only a weak negative correlation. For the 15
# coal seam, all three well types also display negative correlations, but the strength of the correlation decreases successively, with Type I wells showing the most pronounced negative correlation and Type III wells the weakest. These results indicate that blindly pursuing greater horizontal lengths is prone to attenuating stimulation energy at the far end of the wellbore; furthermore, it escalates the probability of intercepting localized heterogeneous fractures, ultimately rendering these intervals unproductive stimulation zones.
3.2. Fracturing Analysis
In the fracturing phase of CBM horizontal wells, stimulation uses two main methods: plug-and-perforation completion technique (plug-and-perf) and bottom packer drag block setting procedure (bottom packer drag). Specifically, plug-and-perf uses pump-down bridge plugs together with perforation. After the plug is set at a chosen depth, stage-wise multi-cluster perforation (predominantly three clusters per section) is carried out along the interval above the plug. Then high-rate fracturing is done, featuring high operational efficiency and the capacity for large-scale volume fracturing. In the other method, bottom packer drag starts by setting the bottom packer; subsequently, the tubing string is pulled upward stage by stage to execute single-cluster perforation and fracturing. Upon completing each treatment stage, the packer must be unseated, relocated to the adjacent interval, and reset. This operational routine introduces relatively higher procedural complexity and constrains the stimulation scale per section.
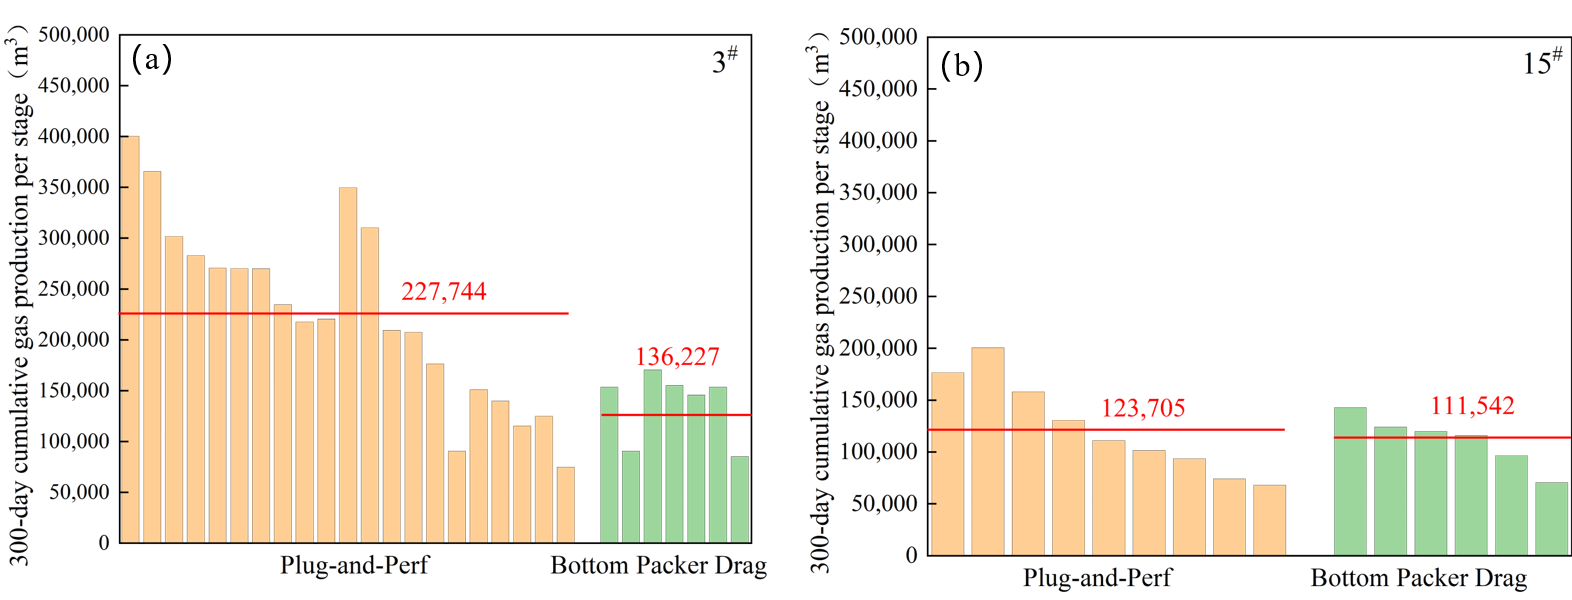
Specifically, for wells stimulated via plug-and-perf within the 3
# coal seam, the 300-day cumulative gas production per fracturing section (averaging 227,744 m
3) is much higher than that of wells treated via bottom packer drag (averaging 136,227 m
3), with the former yielding approximately 1.7 times that of the latter. In the 3
# seam, large-scale plug-and-perf fracturing is significantly superior to the small-scale bottom packer drag approach (
Figure 6a). Regarding the 15
# coal seam, the average 300-day cumulative gas production per fracturing section shows no distinct difference between the two fracturing modes. This demonstrates that both approaches achieve similar productivity performance in the 15
# coal seam, and large-scale plug-and-perf fails to exhibit its superiority (
Figure 6b).
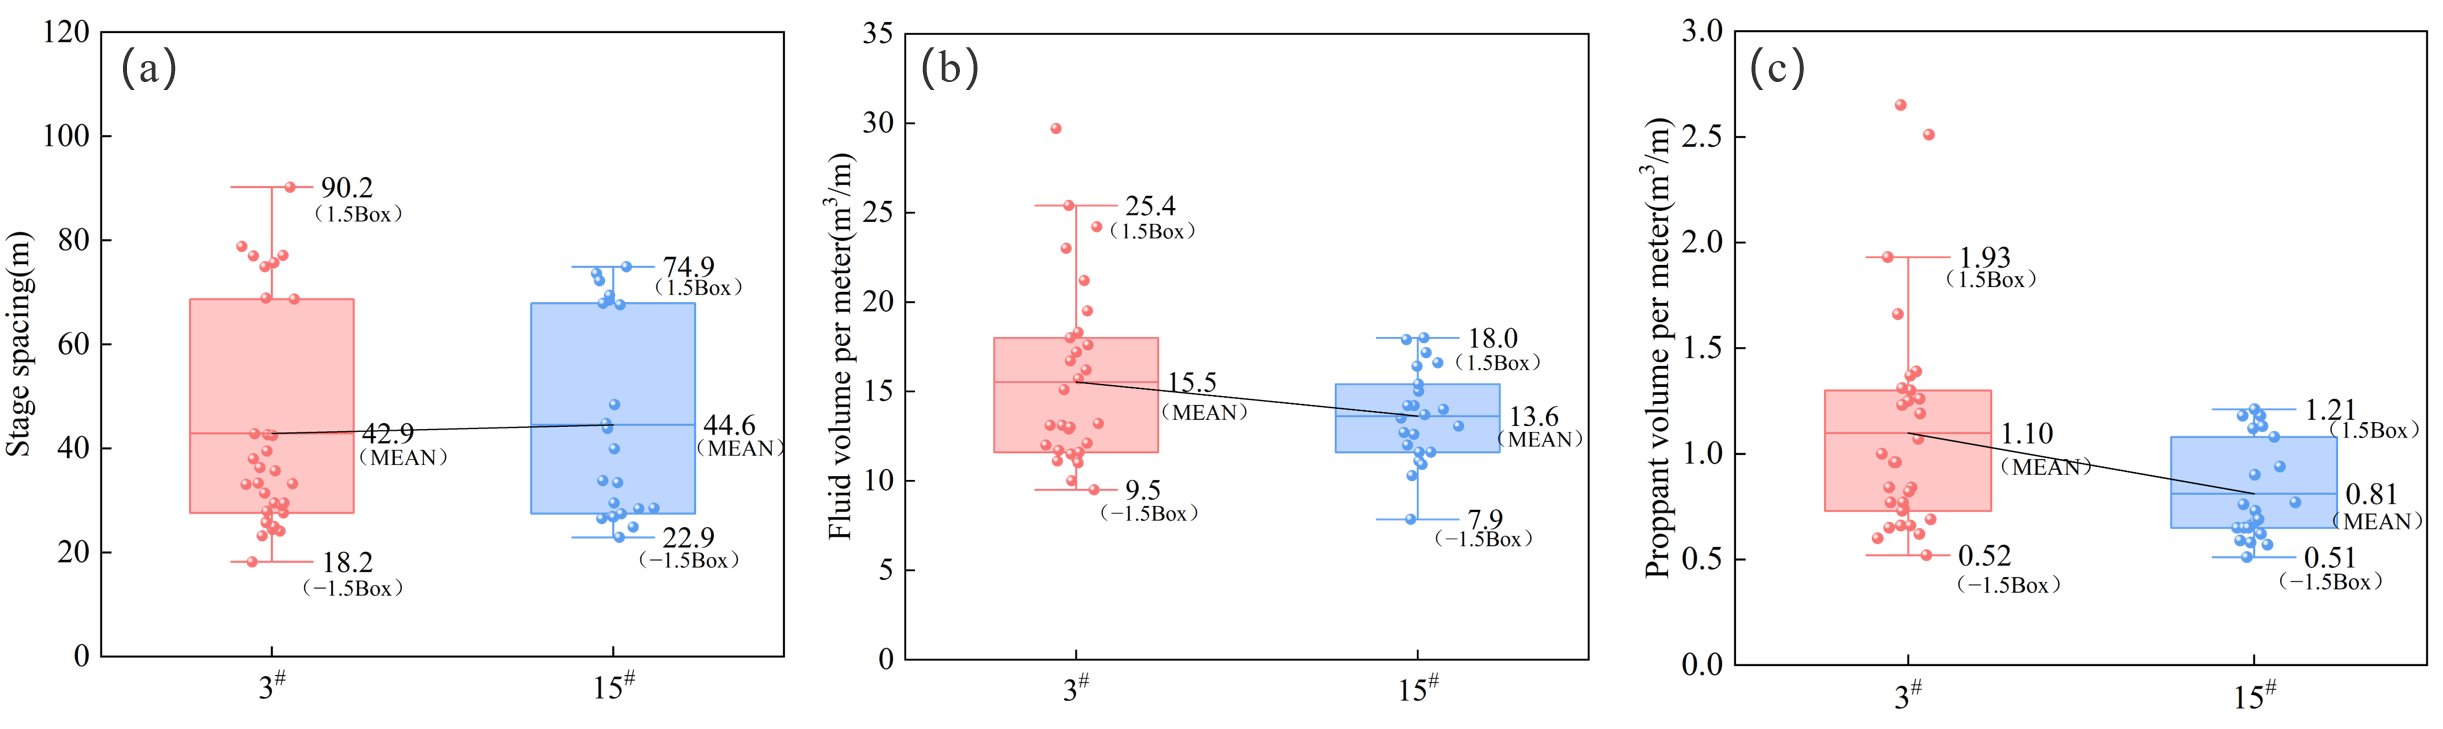
Fracturing parameters analyzed here are section spacing, fluid volume per meter, and proppant volume per meter. For each, section spacing represents the lateral density of the fracture stimulation, which is the key parameter for fracture network density; fluid volume per meter represents the fluid injection intensity, which determines the extent of fracture extension and stimulated reservoir volume; and proppant volume per meter represents the proppant placement intensity that ultimately determines the sustained performance of fracture conductivity. Taken together, these three parameters constitute a comprehensive evaluation system for fracturing engineering quality from the three dimensions of “treatment density, injection intensity, and proppant support intensity”.
For the fracture parameters of the two coal seams, the section spacing in the 3
# coal seam is comparable to that of the 15
# coal seam (averaging 42.9 m and 44.6 m, respectively), which shows that the two seams were designed with roughly the same treatment density. Fluid volume and proppant volume per meter in the 3
# coal seam are higher than those in the 15
# coal seam, showing that a more conservative fracturing scale was generally used for the 15
# coal seam. This is because of the structural complexity of the 15
# seam; during construction, the fracturing scale was controlled more cautiously to keep fractures from extending too far into water zones or damaging the reservoir (
Figure 7).
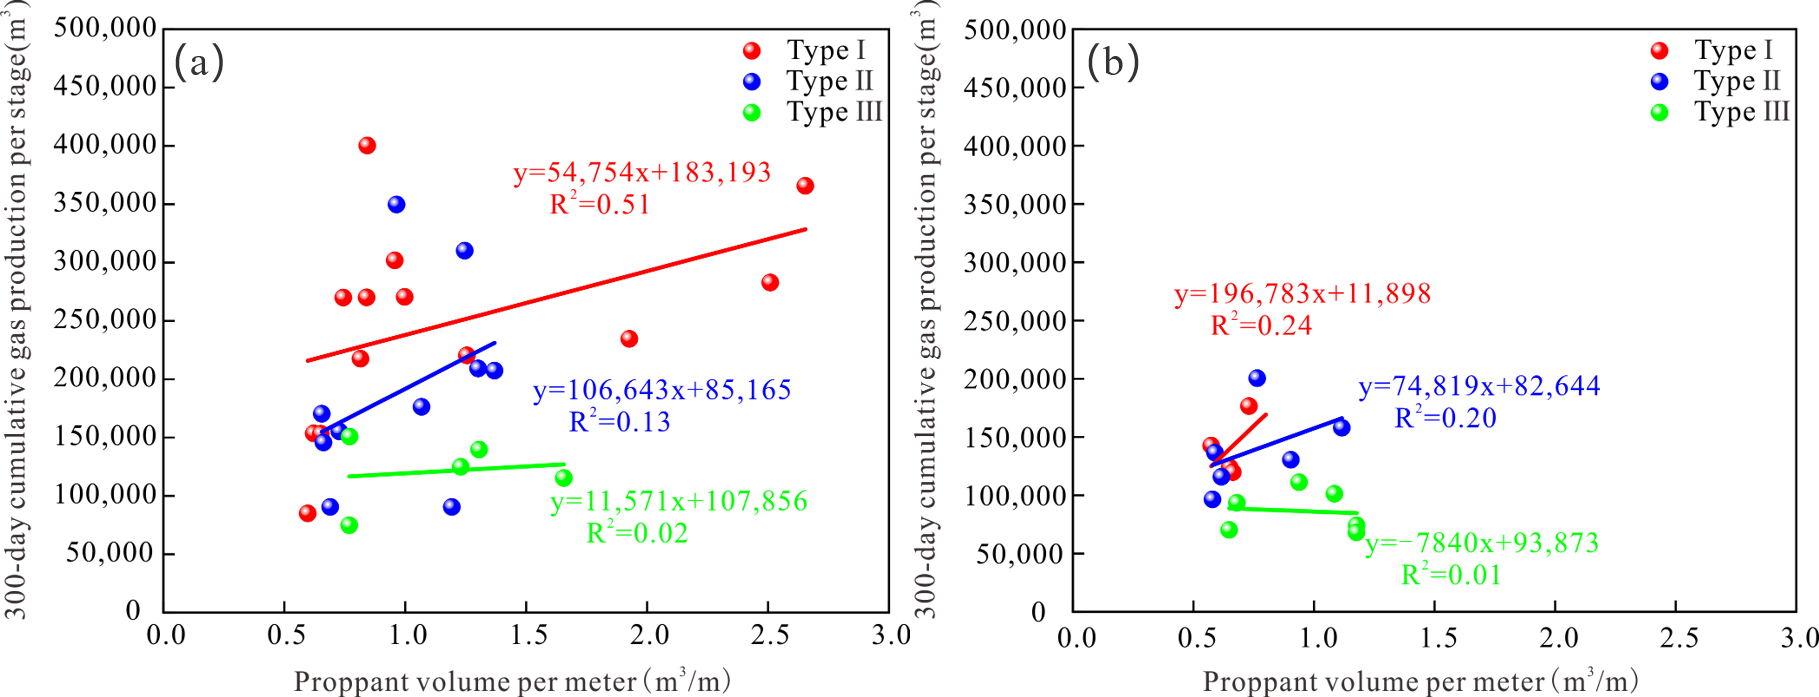
Within both coal seams, the proppant volume per meter of high-yielding wells (encompassing Type I and Type II) exhibits a distinct positive correlation with productivity; that is, production capacity rises steadily with increasing proppant placement intensity. This implies that more proppant helps build a more efficient propped fracture network and boost long-term fracture conductivity, which promotes productivity. By contrast, Type III wells exhibit no clear correlation between proppant volume per meter and reservoir productivity, with data points highly scattered—a mix of both “low-proppant, low-yield” and “high-proppant, low-yield” cases. This suggests that in structurally complex zones, the existing fracturing treatments do not match the geological conditions well enough, and simply scaling up stimulation does little to fix the productivity problems of Type III wells (
Figure 8).
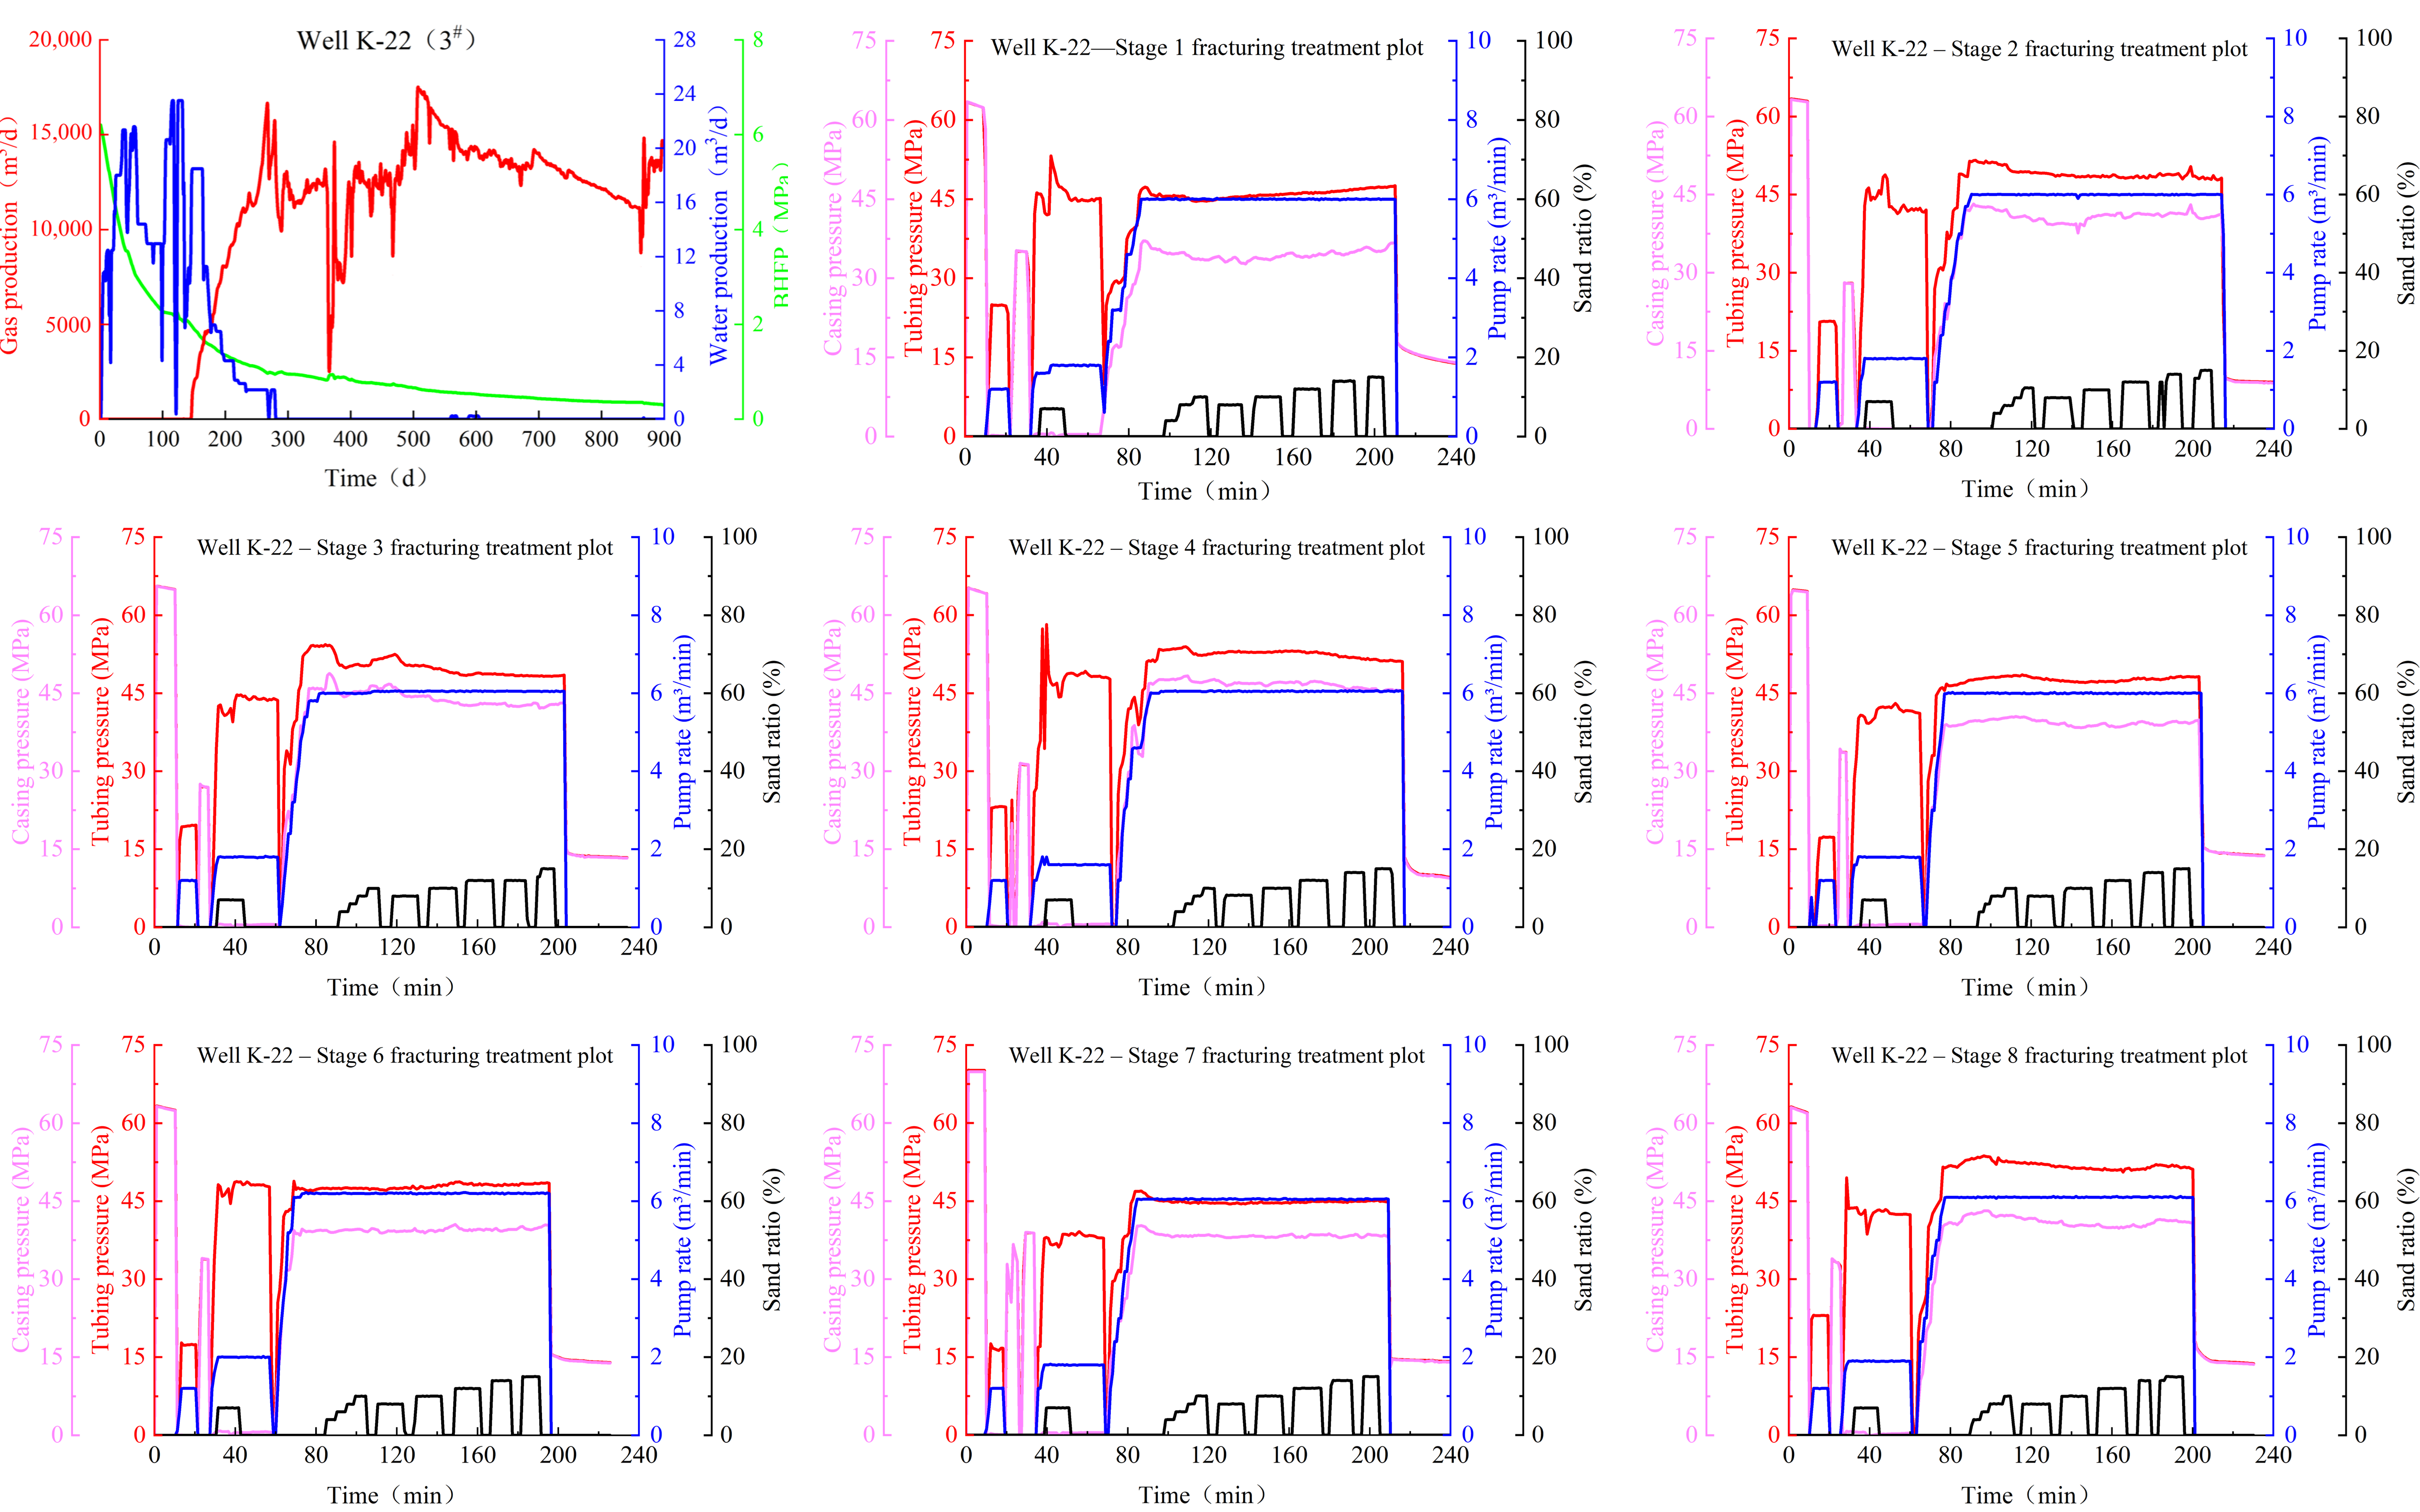
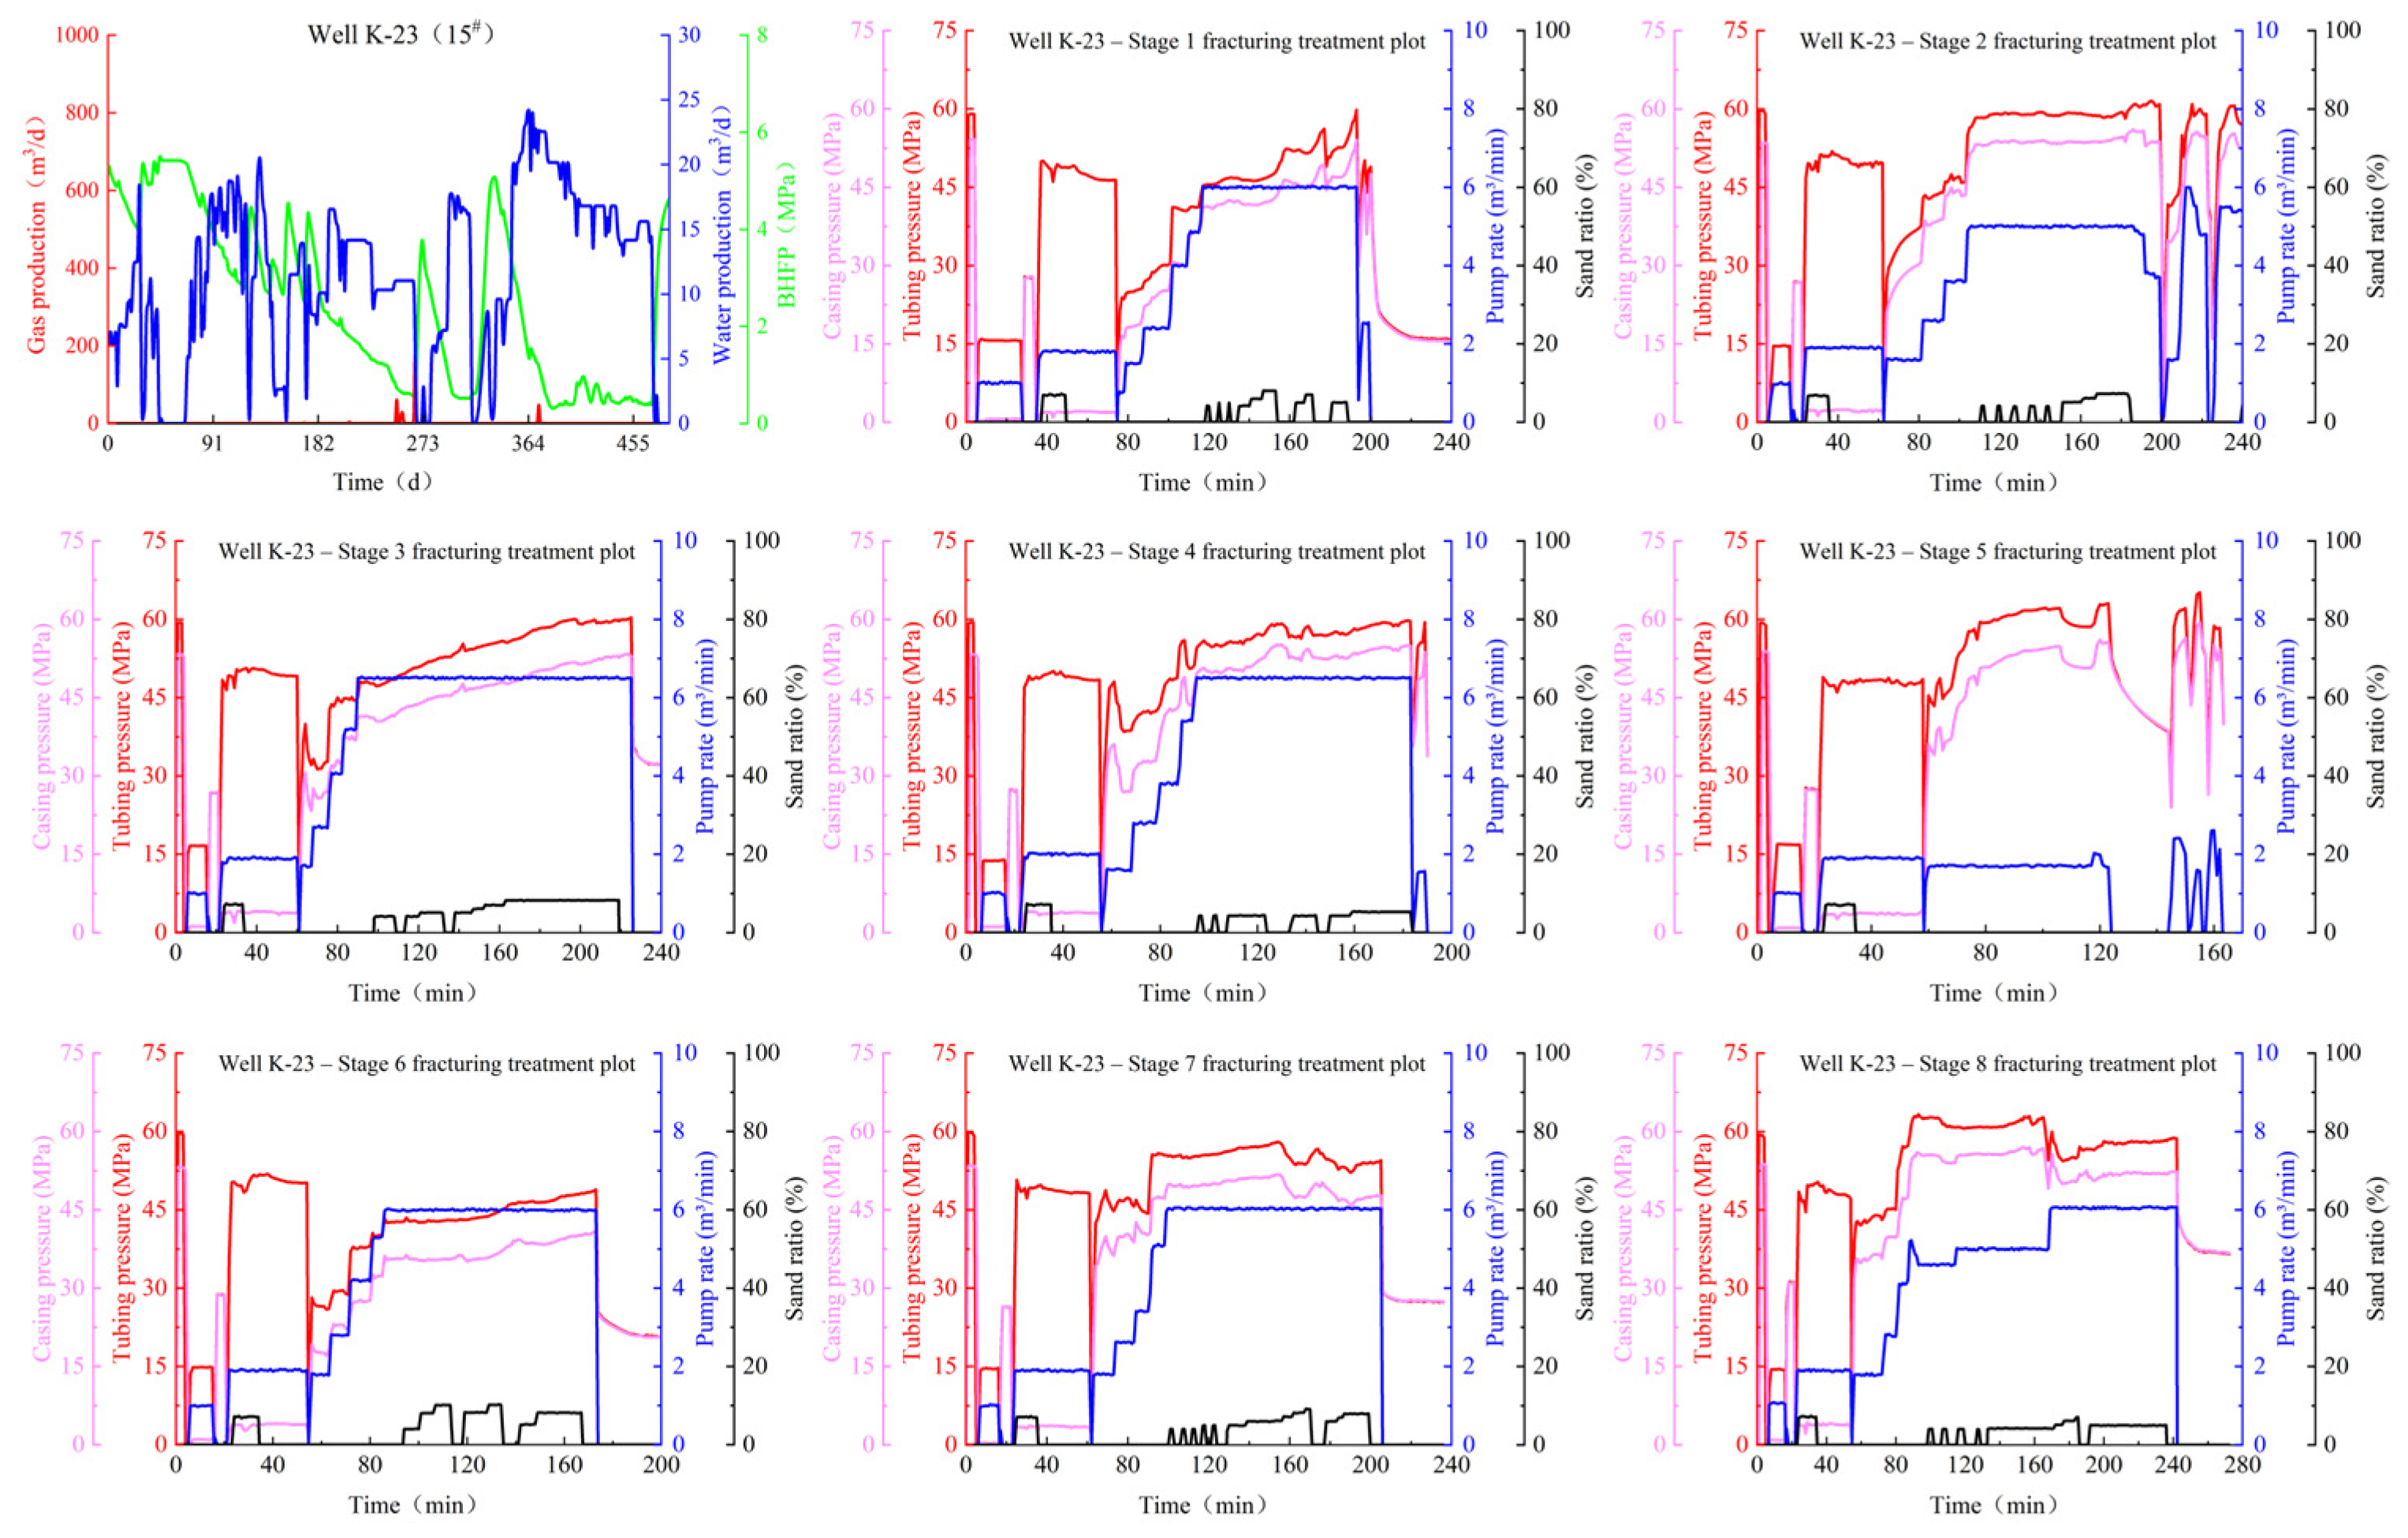
Comparative analysis of typical fracturing treatment curves reveals high operational stability during the stimulation of well K-22 (Type I) in the 3
# coal seam. During the proppant pumping stage, the treatment curves across sections 1 to 8 always show a classic “stepped rise followed by a plateau” profile with steady treatment pressure and minimal fluctuations. In contrast, well K-23 (Type III) in the 15
# coal seam experienced sharp sudden surges and drops in treatment pressure, with a maximum fluctuation magnitude larger than 10 MPa. According to hydraulic fracturing theory, steady treatment pressure reflects a balanced transport of fluid and proppant within the fracture, which drives the fracture to propagate into an ideal long and wide geometry; conversely, frequent pressure fluctuations indicate the breakdown of this balance, which is usually caused by strong coal heterogeneity, complex fracture geometry, or local plugging [
36]. Consequently, well K-22 shows a favorable “production ramp-up followed by stabilization” profile during later drainage, while the poor stimulation of well K-23 constrains its daily gas yield to a chronically low level with severe and frequent fluctuations in water discharge (
Figure 9 and
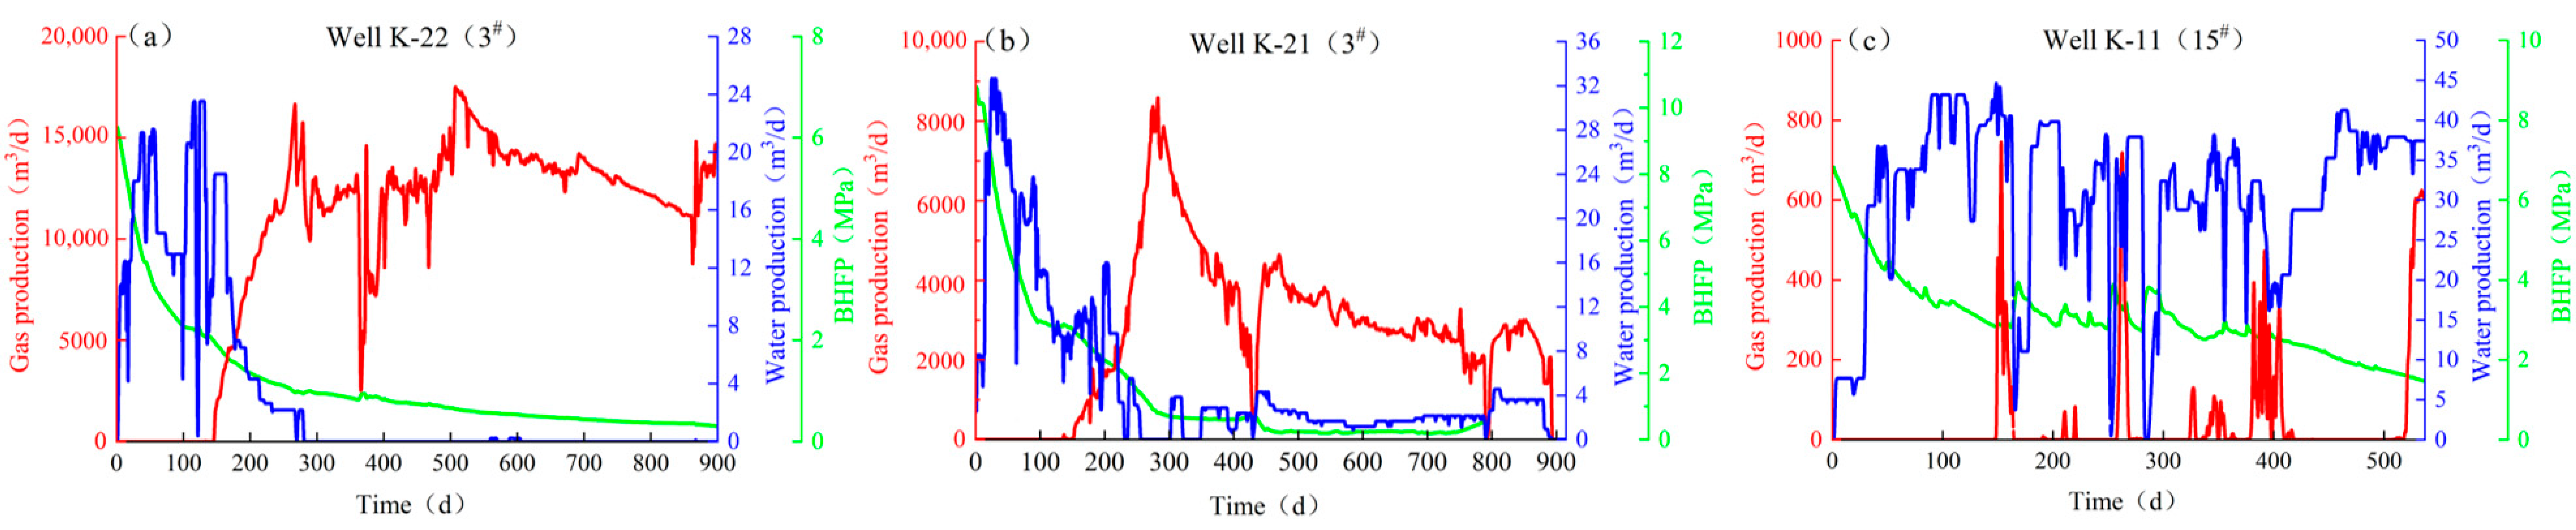
Figure 10).
3.3. Drainage Analysis
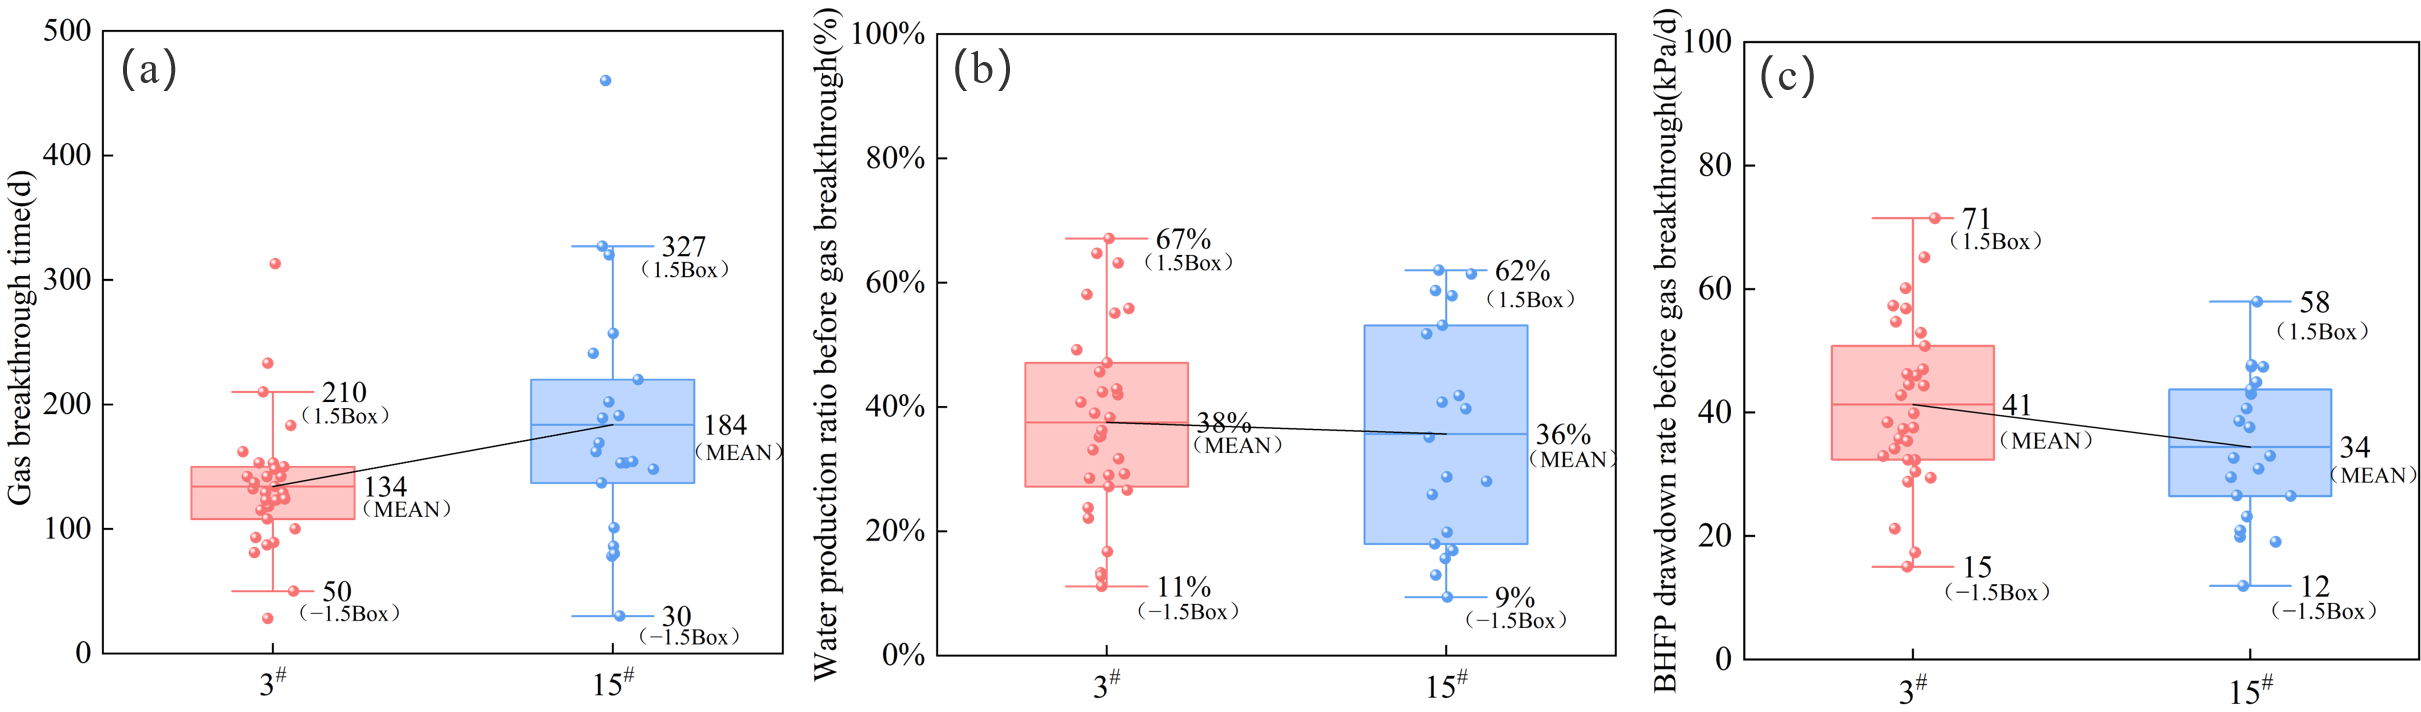
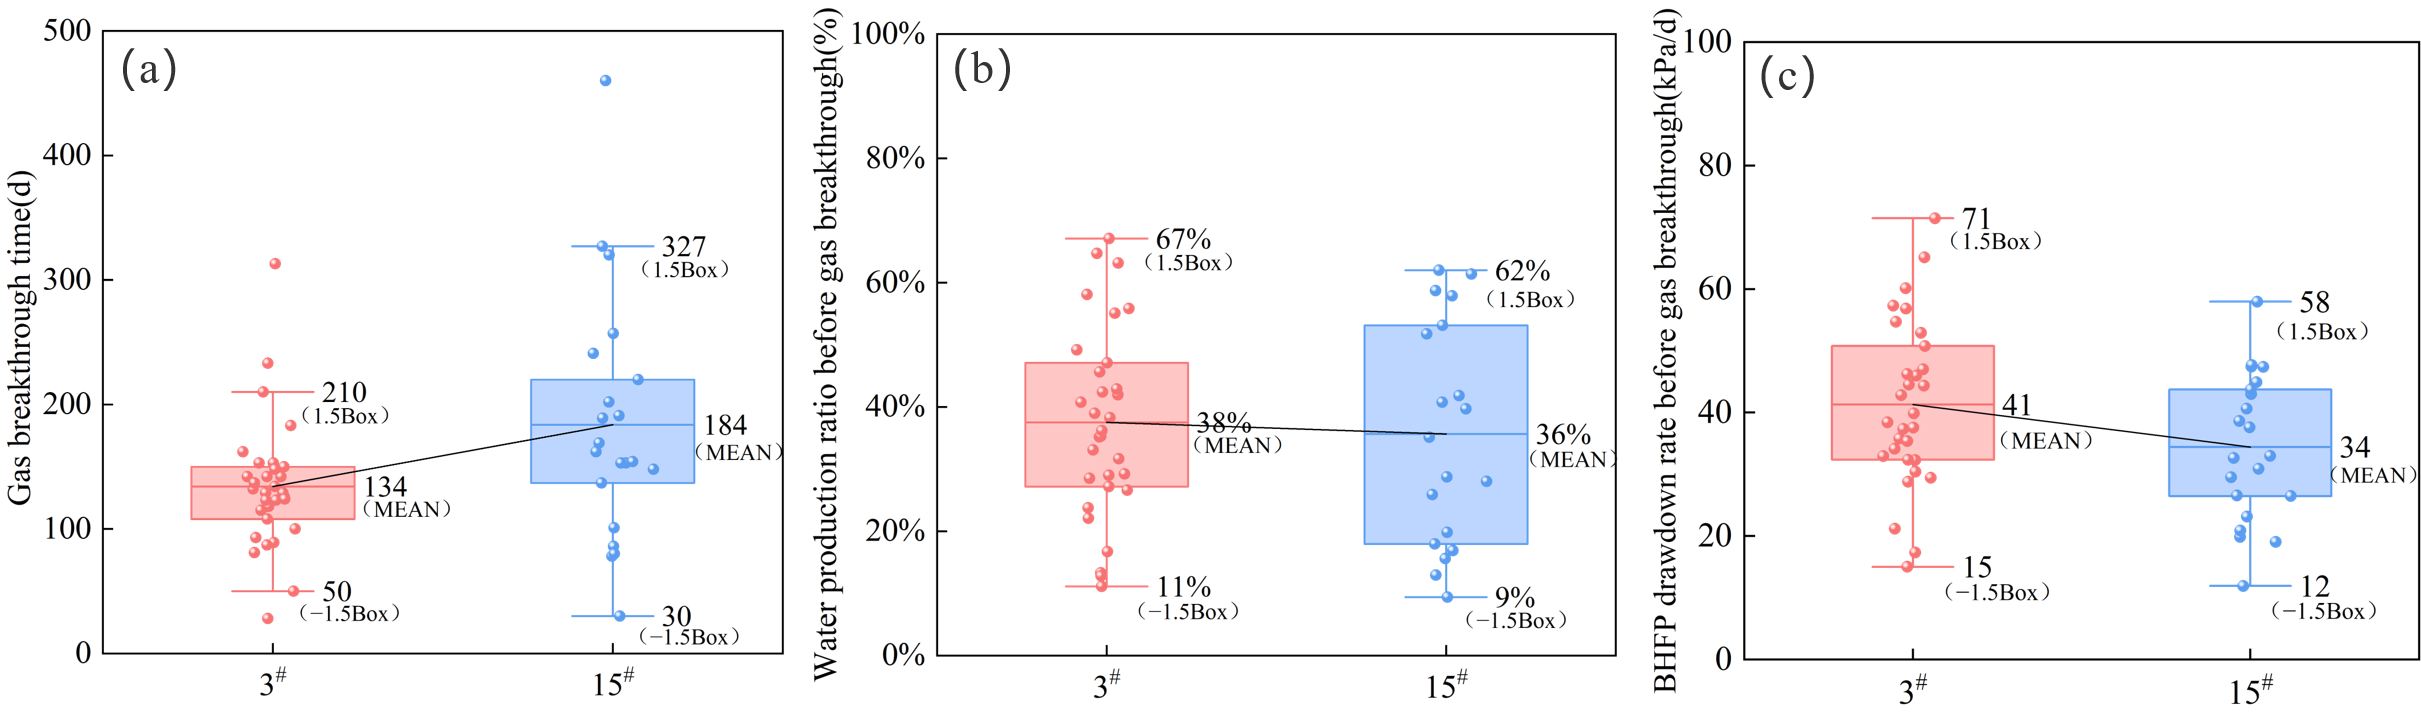
The drainage parameters analyzed are respectively the gas production time, the water production ratio before gas production, and the bottom-hole flowing pressure (BHFP) drawdown rate before gas production. The gas production time represents the duration required for the coal seam pressure to draw down to the critical desorption pressure during the initial drainage phase, and is a key measure of drainage efficiency; the water production ratio before gas production represents the water production proportion during this phase and helps assess coal seam water-bearing properties and depressurization via water discharge; and the BHFP drawdown rate before gas production is a key measure of early depressurization intensity, which directly reflects the intensity of the drainage strategy and greatly affects gas production rate. Taken together, these three parameters constitute an evaluation system for drainage engineering quality from the three dimensions of “depressurization efficiency, water production characteristics, and depressurization intensity”.
Although the water production ratio before gas production remains largely similar between the two coal seams, the 15
# seam has a longer average gas production time—50 days later than the 3
# seam—along with a 7 kPa/d drop in the BHFP drawdown rate before gas production (
Figure 11). This extended duration and a more gradual BHFP drawdown rate indicate that a more conservative and stabilizing drainage control was applied in the 15
# coal seam.
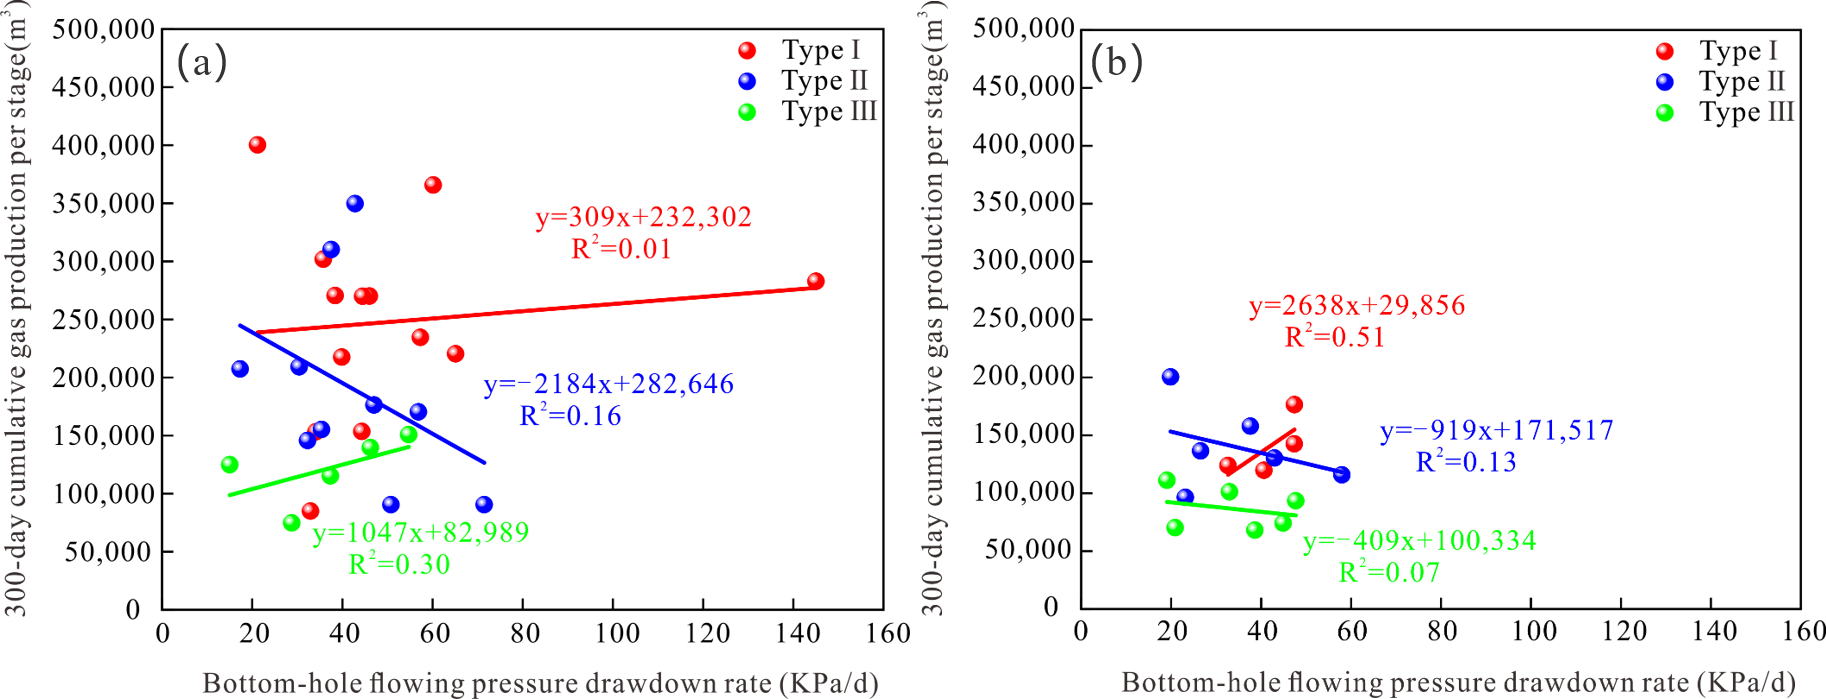
Among the high-yielding wells, the BHFP drawdown rate before gas production shows no discernible correlation with productivity across both coal seams; however, within the Type III wells, the two coal seams demonstrate starkly contrasting response behaviors (
Figure 12). Specifically, the BHFP drawdown rate within the 3
# coal seam is positively correlated with productivity, indicating that these wells still have potential to achieve productivity by unleashing localized elastic energy during the initial water production phase; whereas the BHFP drawdown rate within the 15
# coal seam shows no discernible correlation with productivity, suggesting that its gas productivity constraints are largely dictated by the inherent geological conditions, rendering operational adjustments to the drainage control scheme relatively ineffective. Fundamentally, the core philosophy of a drainage control scheme lies in the careful regulation of water discharge rates and BHFP drawdown rates; this is intended to balance the coal seam damage with the matrix shrinkage effect to promote a permeability rebound, extend well life, and improve recovery, rather than simply maximizing the drawdown rate [
37].
3.4. Comprehensive Discussion
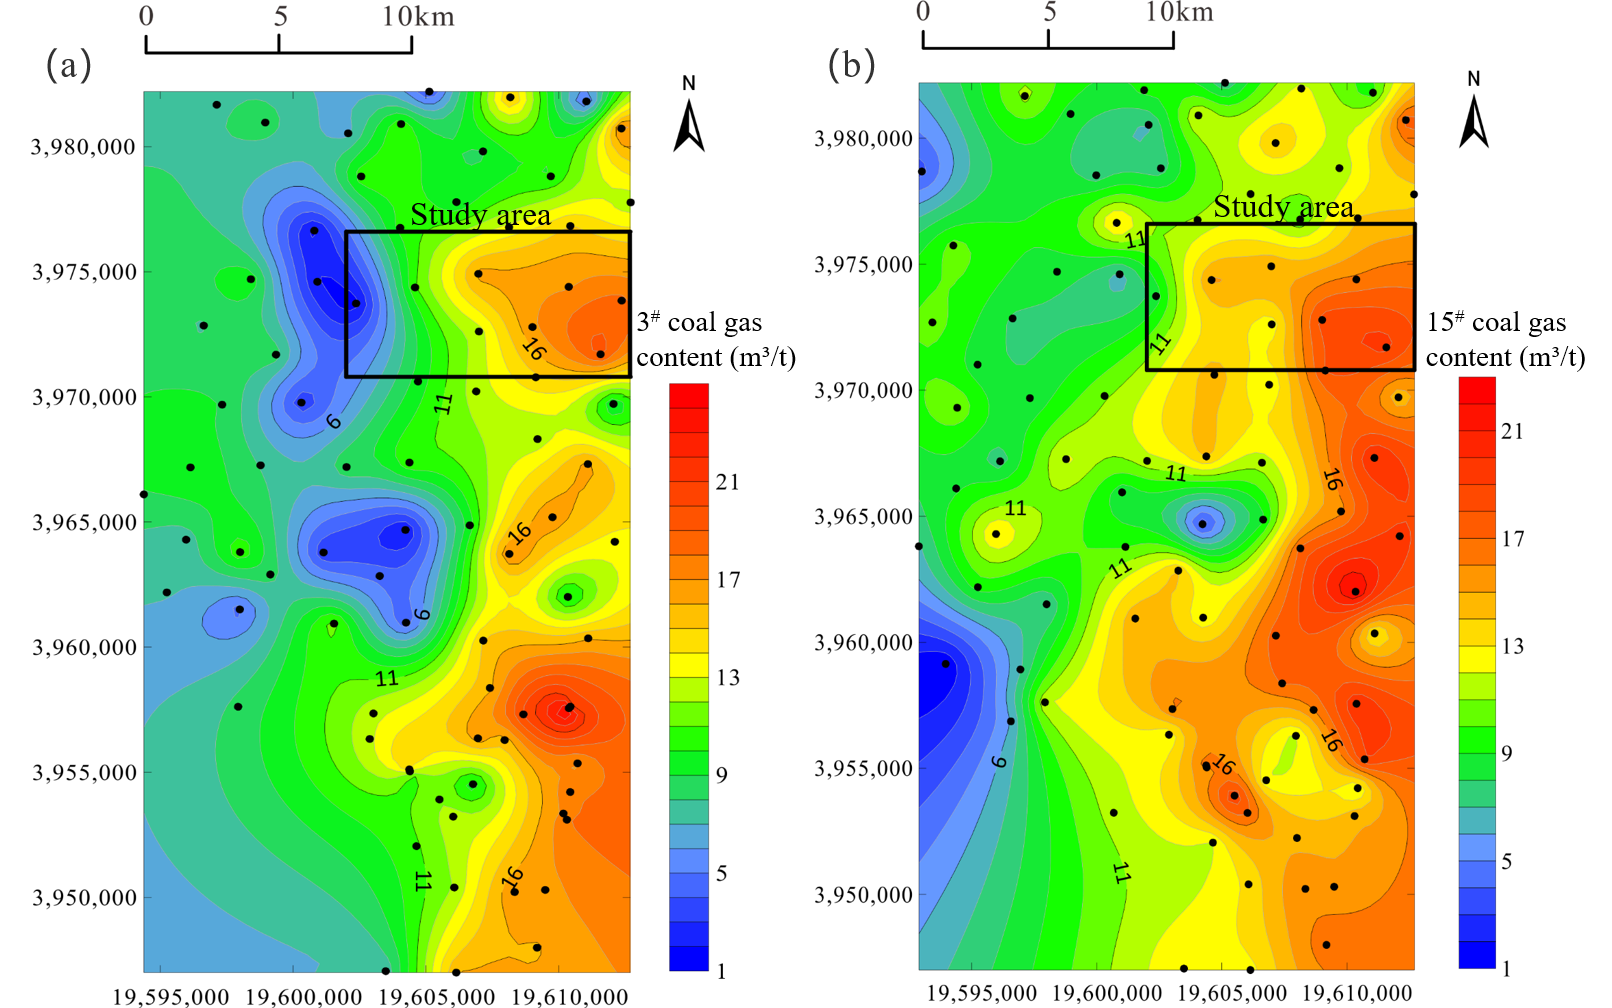
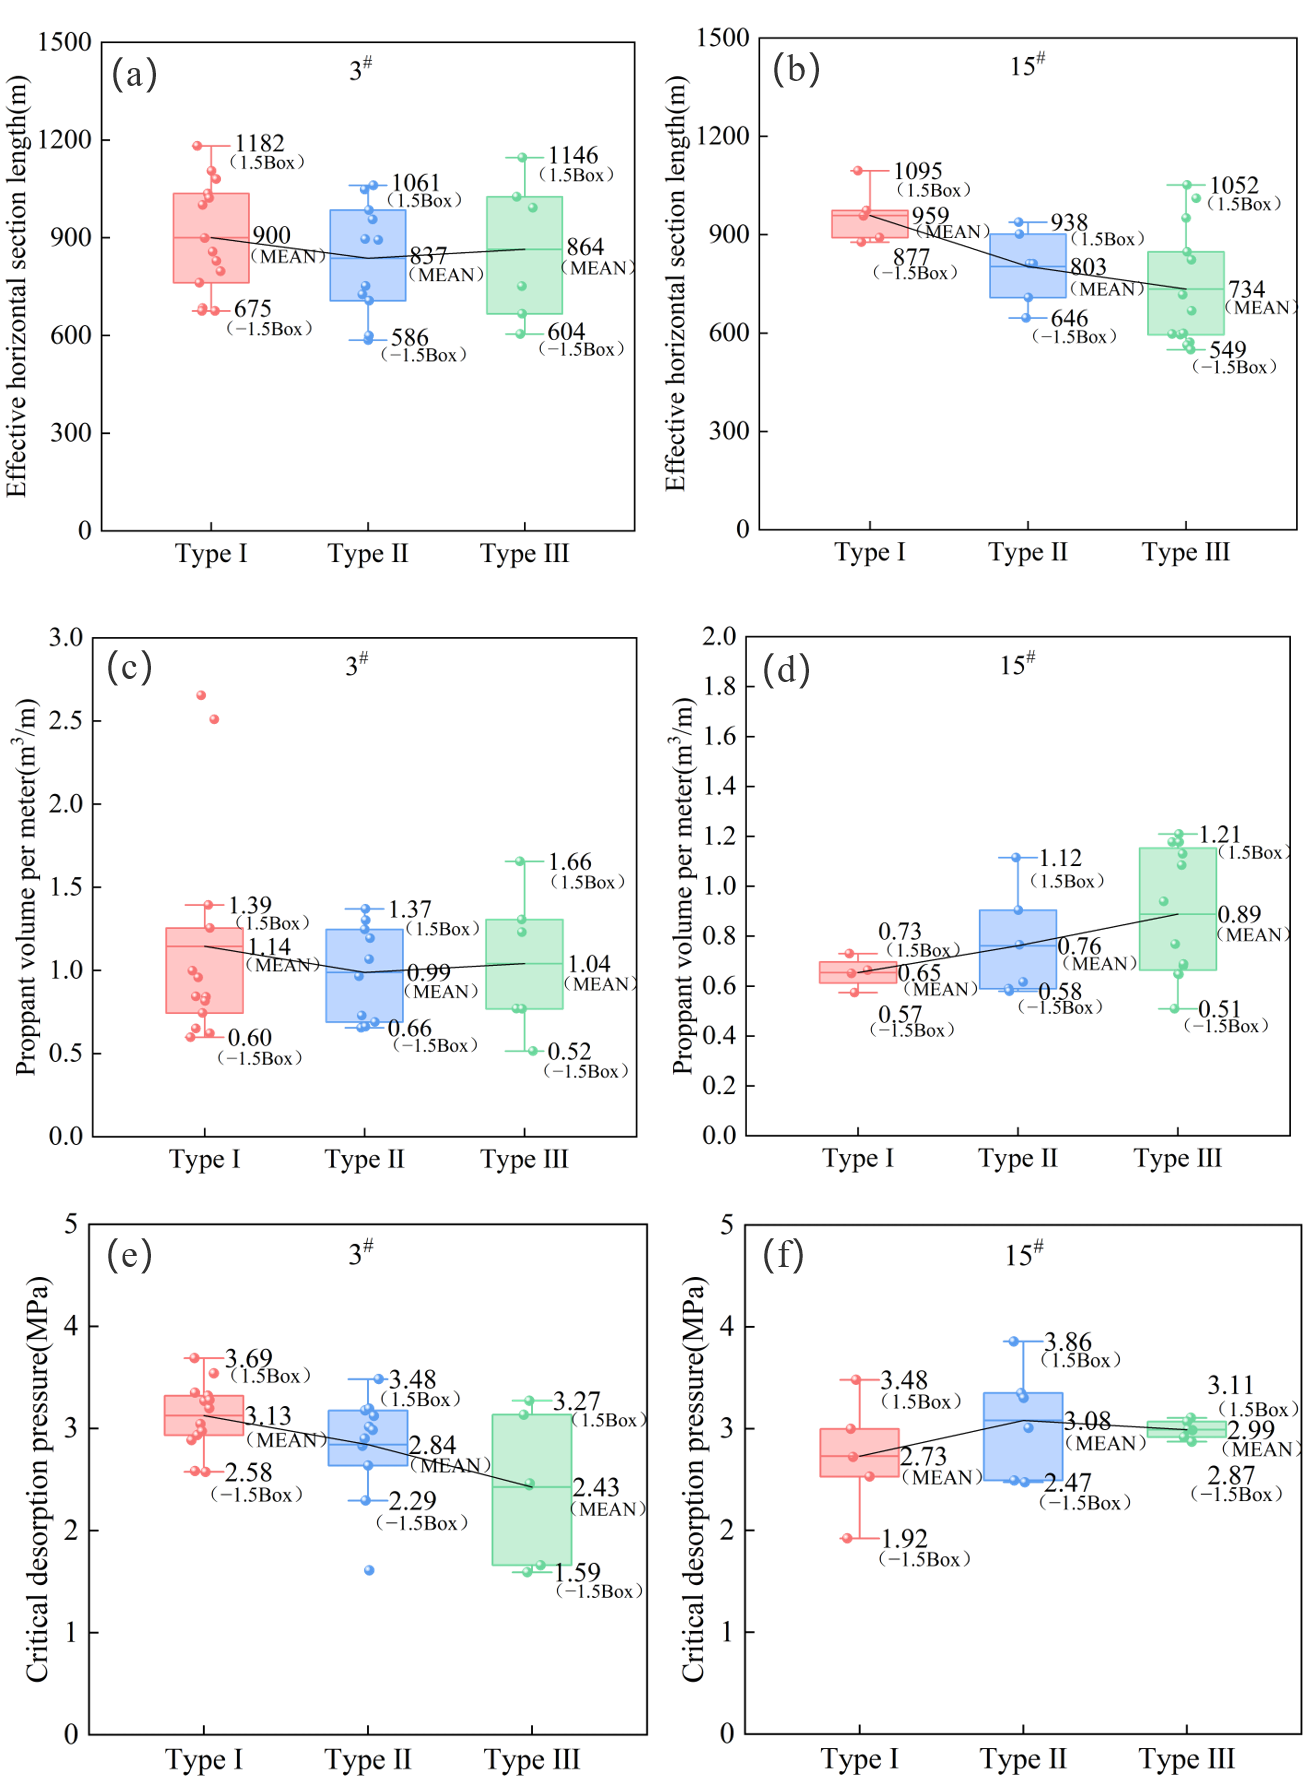
Through a lateral comparison of key parameters within the study area, the horizontal section lengths and proppant volumes per meter across various well types in the 3
# coal seam remain fundamentally uniform; however, the critical desorption pressure exhibits distinct discrepancies (
Figure 13). This indicates a high degree of compatibility between the operational engineering parameters and the coal seam’s geological conditions; nevertheless, variations in resource endowment emerge as the primary geological factor governing the heterogeneity in CBM productivity, thereby manifesting a pronounced “geological sensitivity”. The magnitude of critical desorption pressure directly governs the initial gas production rate of CBM wells, and its variations between deep and shallow coal seams significantly influence the effectiveness of hydraulic fracturing stimulation [
38]. The quality of resource endowment often dictates the upper limit of CBM recoverability, rather than relying solely on engineering stimulation intensity [
39]. By contrast, the critical desorption pressure across different well types within the 15
# coal seam exhibits no discernible variations; however, the effective horizontal section lengths of the Type III wells are severely restricted and despite maintaining a high proppant volume per meter, these operations fail to deliver the desired gas production performance. This “high-investment, low-yield” result also reinforces the previous argument that the current fracturing stimulation cannot yet be precisely matched to the geological conditions of the 15
# coal seam, exhibiting a pronounced “engineering-constrained” characteristic. Comparative studies on multilayered CBM reservoirs have similarly revealed that deep coal seams with intense structural deformation tend to exhibit poor fracturing performance, and the non-uniform placement of proppant in complex fracture networks can significantly reduce the overall fracture permeability [
40,
41].
A comprehensive synthesis integrating the entire process of drilling, fracturing stimulation, and drainage shows that the productivity of the 3
# coal seam is largely controlled by objective geological conditions, with high engineering conversion efficiency. Consequently, the future development focus should be on finding resource-rich areas with high critical desorption pressures, coupled with high-intensity engineering interventions to maximize productivity. By comparison, the productivity bottleneck of the 15
# coal seam is largely constrained by complex geological configurations, which cause severe wellbore trajectory deviations and pronounced fracture network heterogeneity; hence, blind expansion of the fracturing scale and operational intensity not only does not expand the effective stimulated reservoir volume, but instead increases the risk of operational failure, while the room for drainage optimization is also significantly constrained. Therefore, the subsequent development strategy for the 15
# coal seam must shift toward a “precision-oriented” pathway; the core objective must focus on elevating the coal seam encounter rate within complex geological configurations while tailoring targeted stimulation techniques to the intensely heterogeneous coal seams, thereby tangibly enhancing the effective productivity of individual fracturing sections. This precision-oriented approach is consistent with recent research directions on targeted stimulation of heterogeneous coal reservoirs [
42].
4. Analysis of Production Indicator Curves
Although correlation analyses based on static engineering parameters have elucidated the engineering factors underlying the productivity discrepancies between the two coal seams, fluid production during drainage is inherently a dynamic and evolving process; consequently, static evaluations remain inadequate for quantitatively diagnosing the real-time suppression intensity exerted by the invasion of exogenous water on gas well productivity. In view of this, this study focuses on the dynamic drainage process by establishing a quantitative diagnostic chart based on production indicator curves, aiming to precisely identify the origins of produced water in horizontal wells traversing the 3# and 15# coal seams and to quantitatively measure the interference intensity exerted by exogenous water on actual productivity, thereby explaining the root mechanisms causing the stark productivity disparities between the two coal seams from a dynamic seepage perspective.
4.1. Method Establishment
The production indicator curve method quantitatively characterizes the coal seam’s elastic energy release mechanisms and fluid production dynamics by establishing a relationship between cumulative fluid production and production pressure difference. Unlike conventional reservoirs, coal seams have fundamental fluid production variations due to their specific adsorption/desorption properties, but at the single-phase drainage and pressure drawdown stage, both systems release elastic energy via fluid production to drive pressure reduction, thereby sharing similar physical processes. Consequently, this method can be effectively deployed to diagnose water production dynamics during the initial drainage stage of CBM wells. As the drainage process progresses, once the coal seam pressure drops below the critical desorption pressure, gas desorption and production cause the drainage behavior to transition to a gas–water two-phase flow regime, where the reduction in elastic energy release from the fluid directly causes a distinct slope inflection in the production indicator curve. On this basis, the dynamic drainage process can be clearly categorized into a single-phase water flow stage largely driven by the elastic energy release of formation water, and a subsequent gas–water two-phase flow stage driven by gas desorption.
Since this block is dominated by horizontal wells, compared with ordinary vertical wells or multiple layers of commingled production wells, these horizontal wells feature significantly extended reservoir contact intervals and far more intricate fracture networks, thereby inherently complicating their water production sources and pressure propagation mechanisms. Consequently, during the practical application of production indicator curves, the cumulative water production is scaled to the unit section length in order to avoid effects of variations in effective horizontal wellbore length, and then a dynamic relationship curve is constructed between normalized cumulative water production and BHFP drawdown. Using the slope variation characteristics of this new curve in the coordinate system, we can not only quantitatively characterize the elastic release behavior of reservoir-derived water during the early drainage stage, but also accurately identify the inflection point and recharge characteristics of exogenous water intrusion during the middle and late stages.
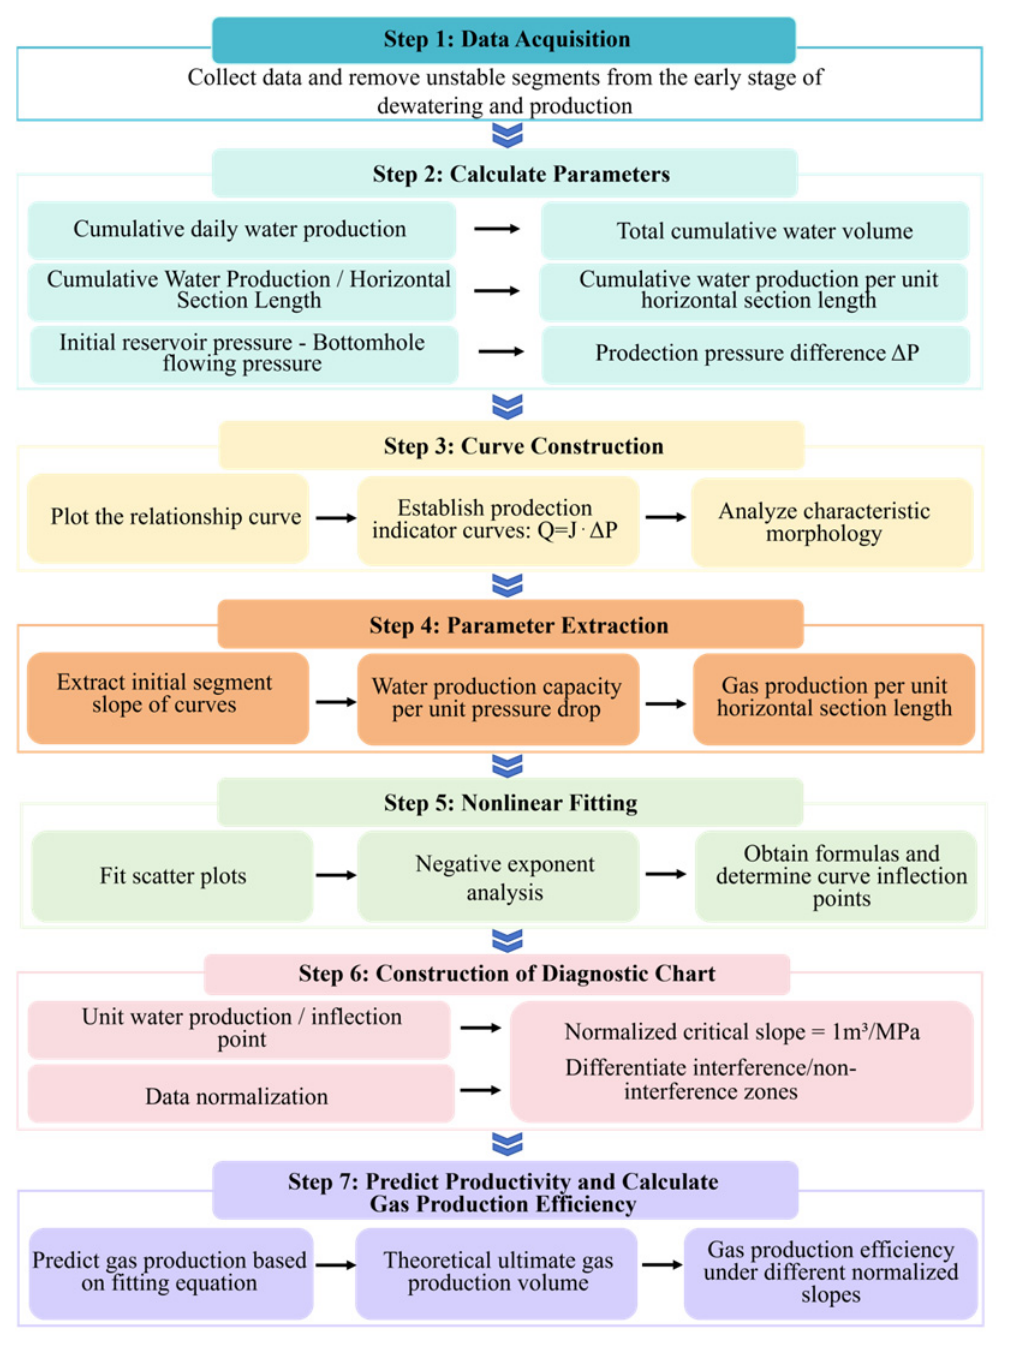
The specific analytical workflow is structured as follows: (1) Compile the full-lifecycle production data of the target wells; exclude unstable data segments from the nascent drainage stages to minimize non-geological artifacts induced by fracturing fluid flowback and equipment commissioning. (2) Calculate the screened cumulative water production, divide it by the effective length of the horizontal section to obtain the cumulative water production per unit section length, and calculate the production pressure difference as the difference between the initial reservoir pressure and the real-time BHFP (Equation (1)). (3) Plot the cumulative water production per unit section length against the production pressure difference data on a rectangular coordinate system to establish the production indicator curve capturing the dynamic water production–pressure drawdown coupling (Equation (2)); the morphologic characteristics of this curve serve as the core basis for diagnosing drainage mechanisms. (4) Extract the initial linear slope of the indicator curve (water production capacity per unit drawdown) to characterize the initial water production efficiency; simultaneously, introduce the average gas production per unit section length as the productivity evaluation criterion to eliminate scale effects induced by variations in horizontal wellbore length. (5) Perform non-linear fitting between the water production capacity per unit pressure drawdown and the average gas production per unit section length for all wells; derive the curvature equation for the fitted curve and calculate the first derivative of this curvature equation to identify the stationary point; this stationary point, representing the maximum curvature, is the inflection point of the fitted curve, beyond which the curve flattens out and stays at a low level. (6) Normalize the water production capacity per unit drawdown before gas production by dividing the abscissa value of the inflection point of the corresponding coal seam, thereby unifying the critical slope at 1 m
3/MPa. On this basis, the diagnostic chart is explicitly partitioned into an interference zone (slope > 1) and a non-interference zone (slope < 1) [
26]. (7) Calculate the theoretical ultimate gas production from the fitted regression where the water production capacity per unit drawdown approaches zero, which physically represents the idealized maximum gas production at which the water production capacity per unit drawdown disappears; divide the predicted gas production by this theoretical limit to yield the gas production efficiency, thereby constructing the final diagnostic chart capable of both exogenous water interference identification and productivity prediction. The complete workflow can be viewed below (
Figure 14).
where
(MPa) is the initial reservoir pressure;
(MPa) is the real-time BHFP;
(MPa) is the production pressure difference; and
(
) is the cumulative water production per unit section length.
4.2. Morphologic Characteristics of Production Indicator Curves
Based on the morphologic characteristics of the production indicator curves, horizontal wells within the study area can be divided into two types: upward-convex and downward-concave. These two distinct curve profiles exhibit significantly disparate gas and water production dynamics, thereby reflecting different drainage mechanisms and reservoir response characteristics.
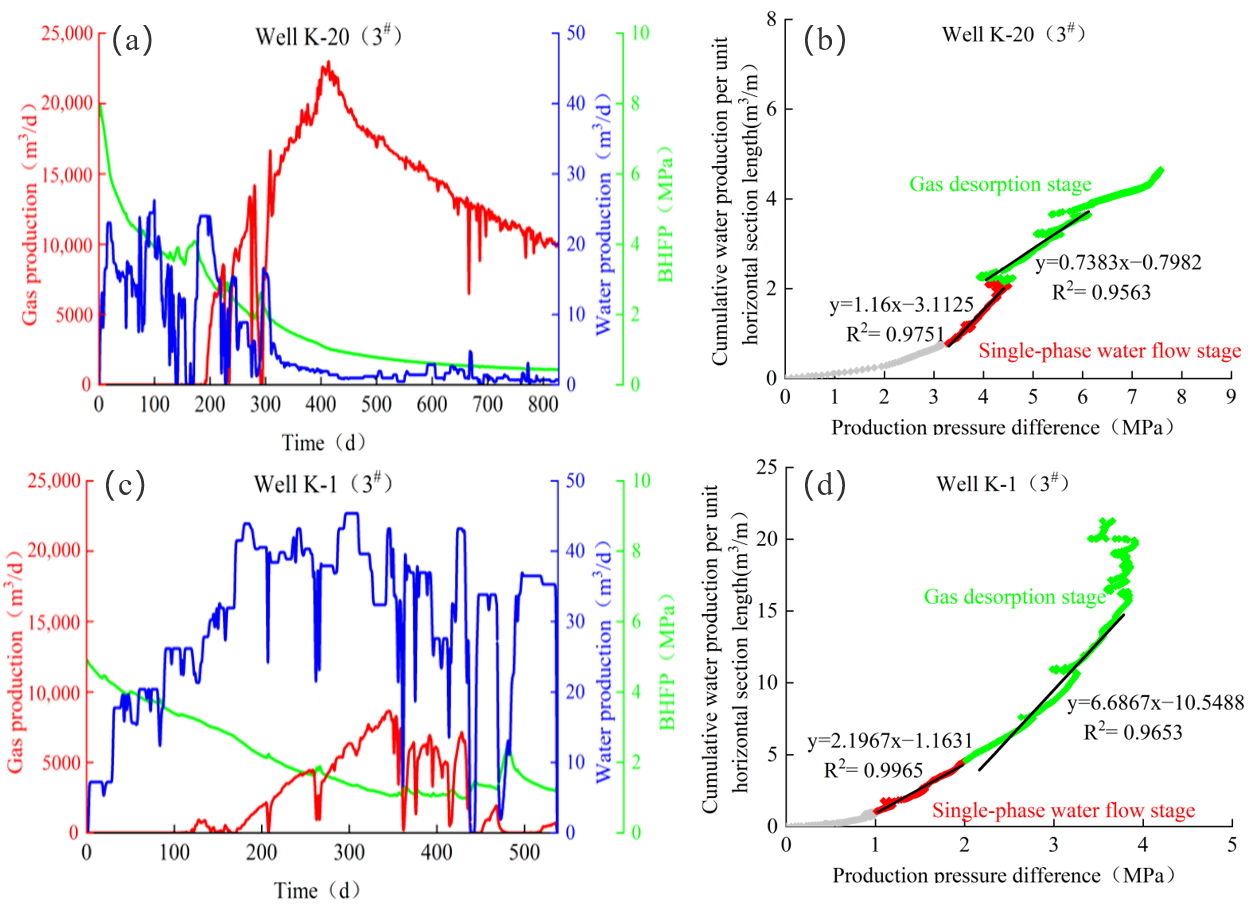
(1) The upward-convex morphology is an observed feature of Type I wells, manifested as a pronounced deceleration in cumulative water production growth after gas production (
Figure 15a,b). The corresponding production dynamics exhibit a sharp decline in water production post-gas production, synchronously accompanied by a rapid surge in gas production that sustains a high level over the long term. This transition indicates that the drainage process has shifted from the water-dominated elastic-drive stage progressively to the gas-dominated desorption-driven stage. Massive gas desorption and production drastically suppress water relative permeability, suppressing subsequent water production capacity under identical pressure drawdown conditions. Thus, the upward-convex morphology not only reflects robust reservoir sealing and the highly efficient release of elastic energy during pressure drawdown, but also serves as a diagnostic physical response indicating the effective expansion of the near-wellbore pressure drawdown funnel and continuous, sustained gas desorption.
(2) The downward-concave morphology primarily shows up in Type III wells, characterized by a trajectory where cumulative water production exhibits accelerated growth with the increase in production pressure difference (
Figure 15c,d). The corresponding production dynamics reveal that, after gas production, water production remains persistently high, while gas production stays suppressed and fails to release effectively. This morphologic trajectory visually reflects the severe dynamic interference of exogenous water invasion on reservoir depressurization: the recharge from exogenous water not only perpetually replenishes the reservoir energy, impeding the conversion of drainage into effective pressure drawdown, but also radically suppresses gas desorption and production.
4.3. Comparative Discussion and Results
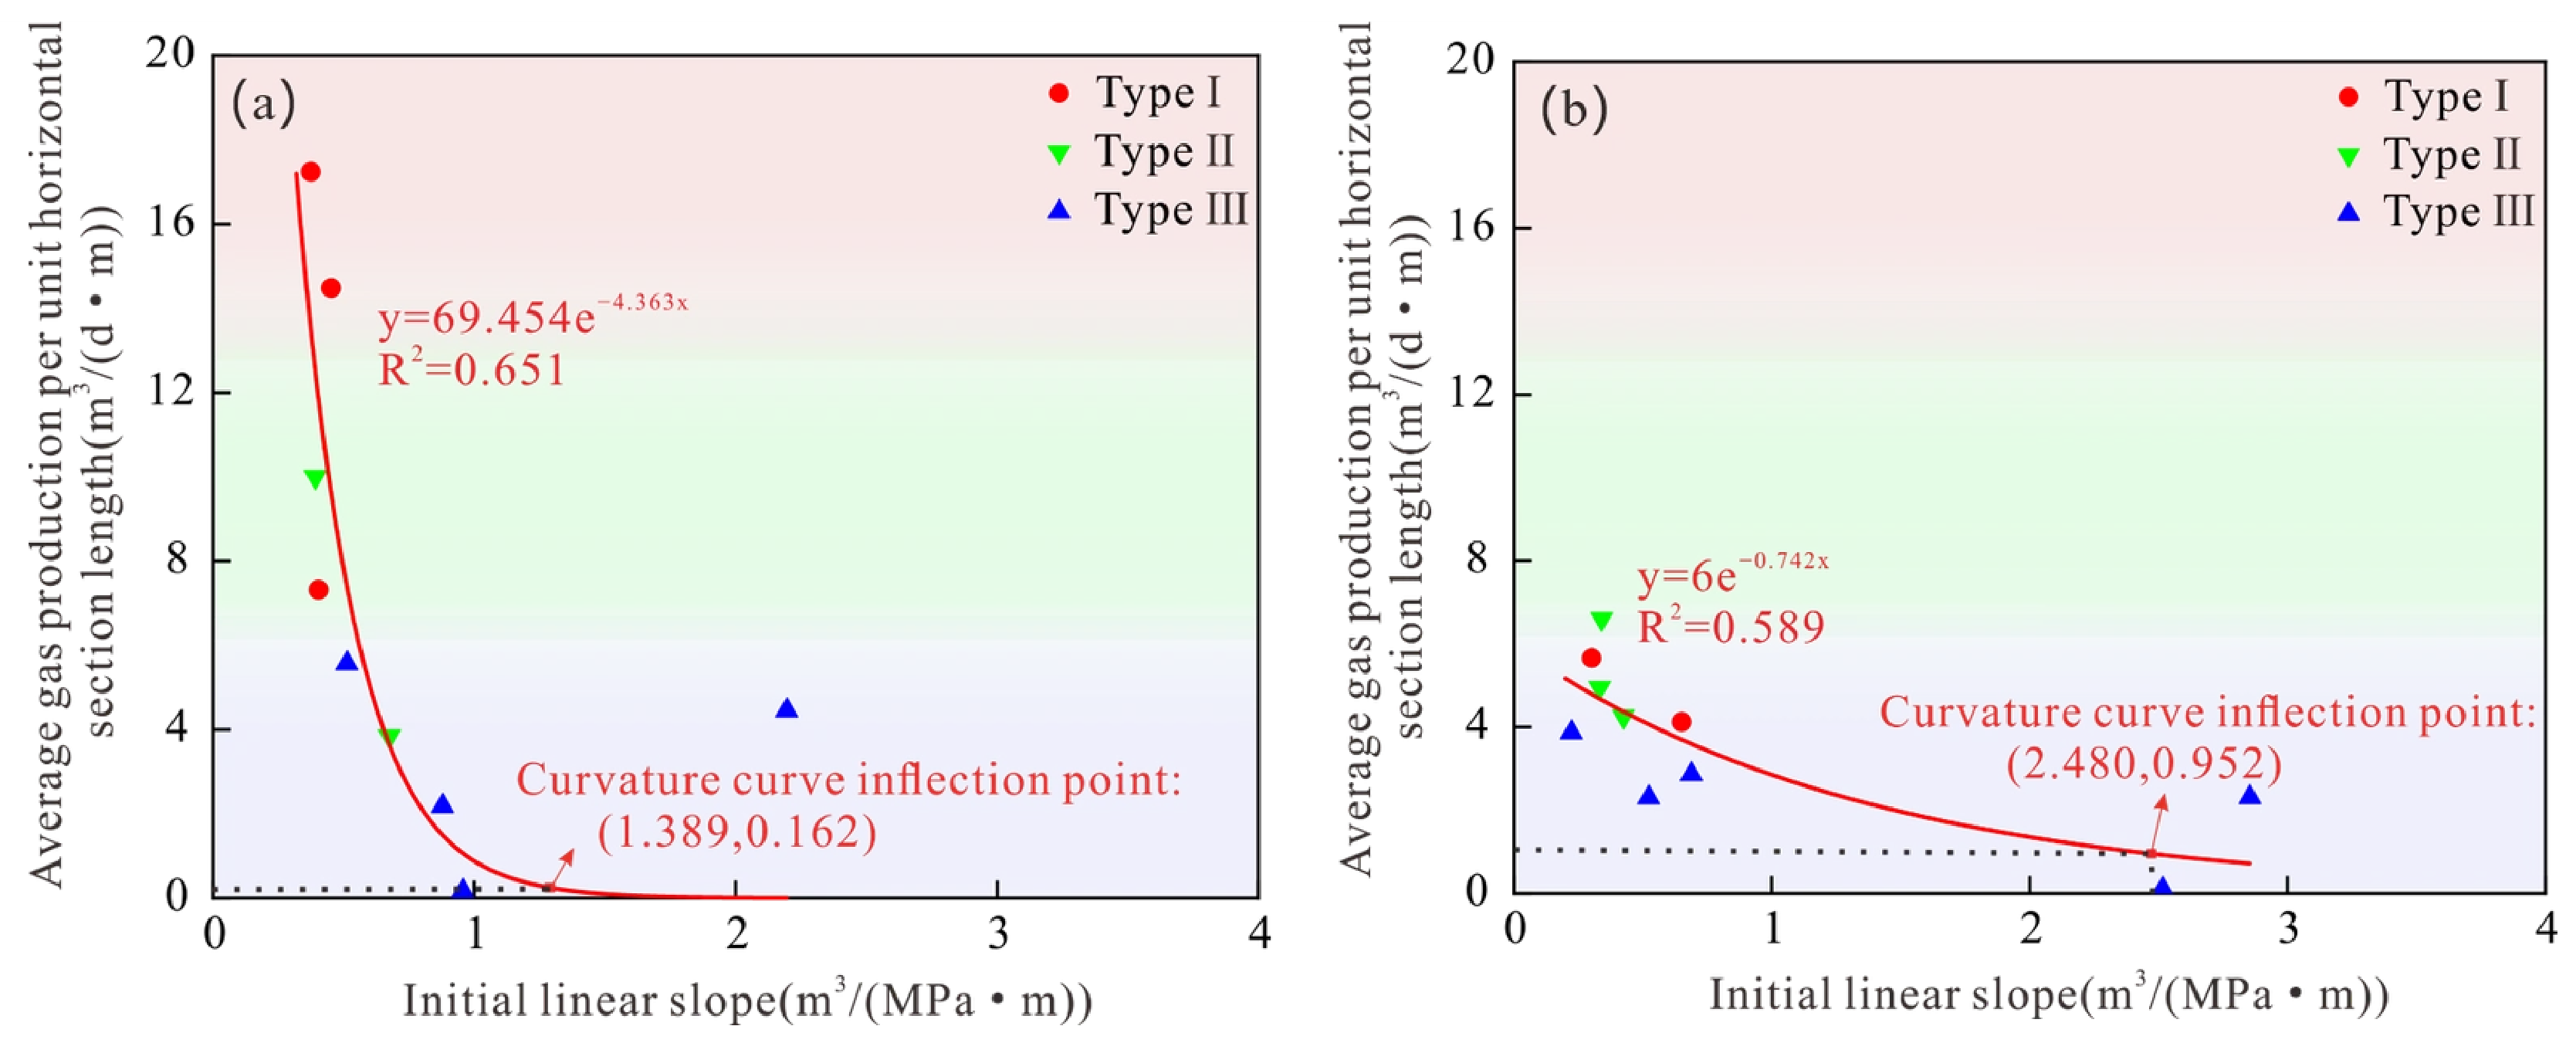
Based on the established method, nonlinear fitting of the water production capacity per unit pressure drawdown against the average gas production per unit length of the horizontal section yields negative exponential equations for the two coal seams (
Figure 16). The fitting results for the 3
# and 15
# coal seams are given below.
Differentiating Equation (3) with respect to
yields the sensitivity of gas production to water production capacity:
Further calculating the curvature
:
Setting the derivative of curvature to zero to solve for the coordinates of the maximum curvature point, which is the inflection point of the fitted curve:
Correspondingly, the 15
# coal seam is as follows:
where
W (m
3/(MPa·m)) is the water production capacity per unit horizontal section length at per unit pressure drawdown;
T (m
3/(d·m)) is the average gas production per unit horizontal section length;
W3 (m
3/(MPa·m)) and
W15 (m
3/(MPa·m)) are the critical thresholds for ultimate interference identification of the 3
# and 15
# coal seams, respectively (i.e., the water production capacity per unit pressure drawdown at the inflection point); and
T3 (m
3/(d·m)) and
T15 (m
3/(d·m)) are the average gas production per unit horizontal section length at the inflection point of the 3
# and 15
# coal seams, respectively.
According to the comparative results of the fitting curves and the inflection points for the two coal seams, the theoretical ultimate gas production of the 3
# coal seam is much higher than that of the 15
# coal seam, yet its critical interference threshold and proportion of critical gas production are lower. This indicates that the 3
# coal seam is more sensitive to water production interference; once the water production capacity per unit pressure drawdown exceeds the critical threshold, gas production promptly drops from efficient release to a depressed level. In contrast, the productivity of the 15
# coal seam is primarily constrained by its baseline gas production capacity. Even in the absence of exogenous water interference, its gas production can hardly match that of the 3
# coal seam (
Table 2).
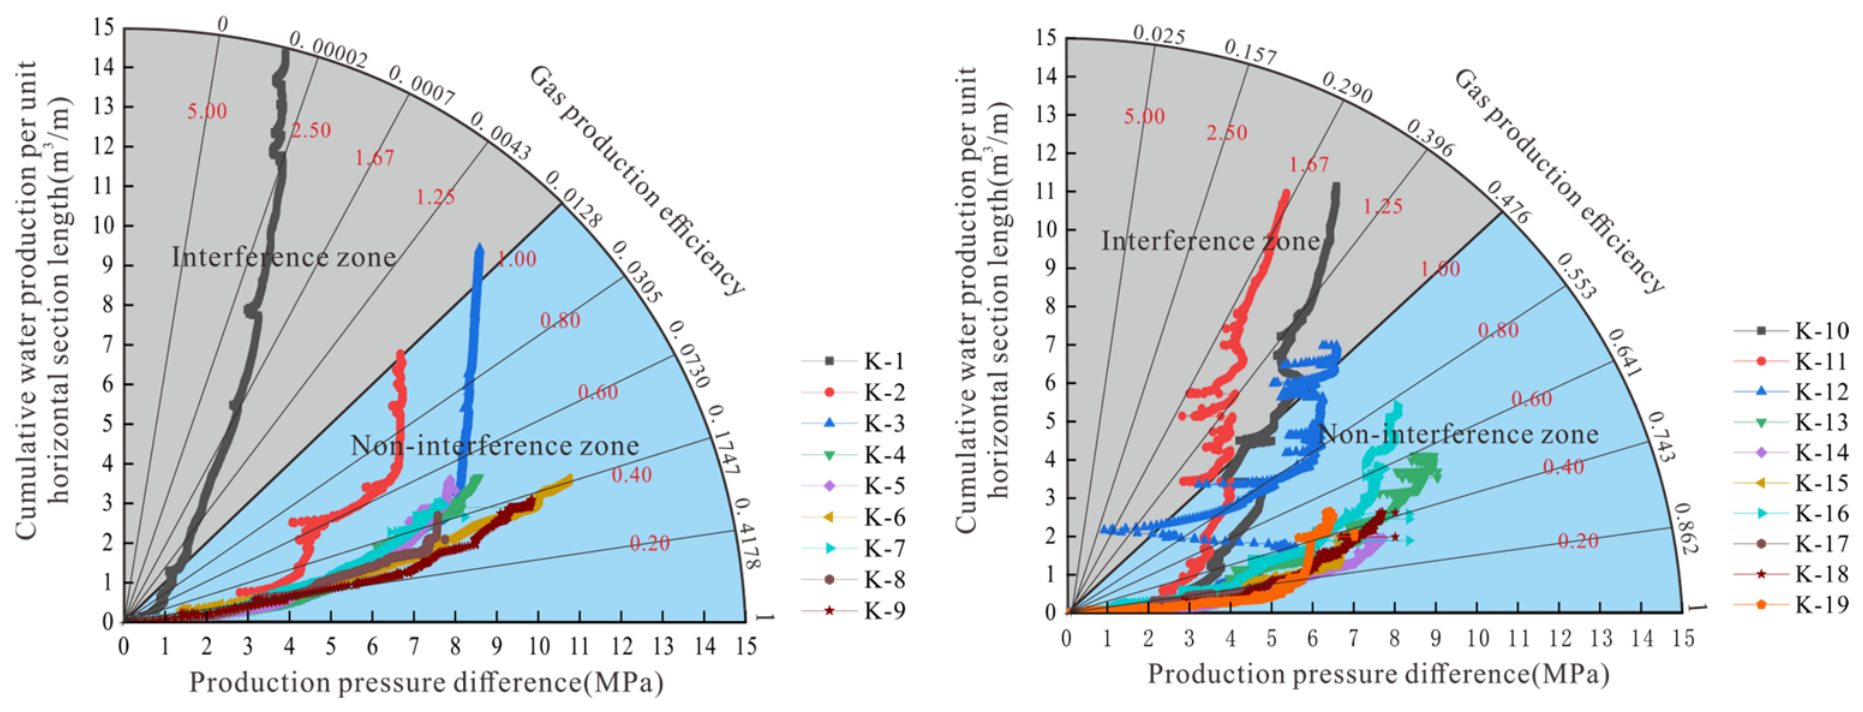
Based on the fitting equations, the gas production efficiencies corresponding to different normalized slopes were calculated; consequently, the CBM wells of both coal seams exhibit distinct trajectory behaviors on the diagnostic chart (
Table 3 and
Table 4 and
Figure 17). Most wells in the 3
# coal seam are clustered within the non-interference zone; however, a few wells are exceptions. Specifically, two typical wells, K-2 and K-3, evolved smoothly along the low-slope zone during the initial drainage stage; in the mid-to-late stages, their trajectory curves deflected upward, infinitely approaching or even crossing the critical interference line, depressing their late-stage gas production efficiency to below 0.0128. Meanwhile, well K-1 entered the interference zone with a high slope during the initial drainage stage and remained there continuously, representing a typical configuration of continuous replenishment by strong exogenous water. By comparison, the trajectory curves of the 15
# coal seam are predominantly downward-concave, and certain wells gradually migrate from the non-interference zone into the interference zone. For the typical wells represented by K-10, K-11, and K-12, their curves generally exhibit continuous deviation or sawtooth-like fluctuations, which reflect frequent gas–water alternating interference within the fracture network under continuous exogenous water recharge. This phenomenon occurs because the continuous influx of exogenous water replenishes reservoir energy and maintains high water saturation near the wellbore; intermittent gas production attempts are repeatedly suppressed by sudden water breakthroughs, causing the trajectory to oscillate or deviate continuously on the diagnostic chart, while the BHFP also exhibits frequent upward and downward fluctuations in response to the alternating gas–water production. Additionally, the highly heterogeneous fracture networks in the 15
# seam exacerbate these fluctuations, as preferential flow paths cause uneven pressure propagation and localized gas–water competition.
In summary, the diagnostic chart systematically and quantitatively demonstrates the disparities between the 3# and 15# coal seams in productivity potential, interference sensitivity, and gas production efficiency. The 3# coal seam has an exceptionally high productivity ceiling. Although its low critical interference threshold makes it highly sensitive to water invasion, exogenous water influx occurs only locally during actual development, and the 3# coal seam still maintains high-efficiency gas production as a whole. For the 15# coal seam, its relatively low baseline for theoretical ultimate gas production causes its fitted efficiency on the chart to appear artificially high. The persistent deviation and fluctuations of its typical well trajectories provide a direct visualization of the continuous influx of exogenous water under high pressure drawdown, which induces frequent gas–water alternating interference within the fractures. This intense dynamic interference prevents the 15# coal seam from establishing an effective pressure drawdown, fundamentally limiting its productivity.
5. Conclusions
(1) At the same structural location, the productivity variation between CBM wells in the 3# and 15# coal seams hinges on the compatibility between engineering parameters and geological conditions. The 3# coal seam reservoir converts large-scale stimulation and initial drainage into high gas yields with high conversion efficiency. In contrast, heavily limited by strong heterogeneity, the 15# coal seam faces challenging well trajectory control and poor stimulation results; under these circumstances, simply increasing engineering efforts through longer horizontal sections or higher fracturing intensities fails to translate into actual gas output.
(2) The production indicator curve diagnostic chart provides a quantitative diagnosis of water interference intensity and production behavior under complex seepage regimes in horizontal wells, revealing a sharp contrast in productivity behavior between the two seams. The 3# coal seam has a high potential productivity ceiling but is highly sensitive to water interference, operating overall as a relatively closed, elastically driven system. In contrast, the productivity bottleneck of the 15# coal seam is constrained by its low theoretical ultimate gas production and strong exogenous water invasion, which keeps it from building up effective pressure drawdown and steady gas output.
(3) The integrated evaluation of engineering parameters and production data demonstrates that future development of complex multi-coal seams must shift from blindly expanding operational scales toward differentiated engineering design and finer drainage control based on dynamic water-interference response. The 3# coal seam, though intrinsically sensitive to exogenous water, is generally free from strong water influx except in localized cases, and thus achieves high yield with well-matched engineering parameters. In contrast, the 15# coal seam, due to poor geological conditions, shows low engineering-reservoir compatibility, and intensive operations tend to induce water intrusion without delivering expected output. Accordingly, high-intensity stimulation is recommended for geologically favorable seams like the 3# seam, whereas for heterogeneous seams like the 15# seam, priority should be given to trajectory control, tailored fracturing, and refined drainage management to mitigate water interference and enhance effective production per fracturing section.