Article

Caprock Sealing Capacity in the South Sea Shelf Basin, Offshore Korea: Evidence from MICP and XRD Analyses of Drill Cuttings


1
Department of Energy and Mineral Resources Engineering, Dong-A University, Busan 49315, Republic of Korea
2
Domestic Business Development Department, Korea National Oil Corporation, Ulsan 44538, Republic of Korea
*
Author to whom correspondence should be addressed.
Processes 2026, 14(15), 2515; https://doi.org/10.3390/pr14152515
Submission received: 22 June 2026 / Revised: 30 July 2026 / Accepted: 3 August 2026 / Published: 5 August 2026
(This article belongs to the Section Petroleum and Low-Carbon Energy Process Engineering)

Abstract

Evaluating the sealing integrity of caprocks is critical for ensuring the long-term safety and containment efficiency of geological hydrocarbon reservoirs and CO2 storage systems. In this study, we evaluated the caprock sealing capacity of the South Sea continental shelf using drill cutting samples collected from six wells across four structural blocks. Representative caprock intervals, consisting primarily of fine-grained sedimentary rocks, were identified based on well data and lithofacies information. Mercury Injection Capillary Pressure (MICP) analyses were performed to characterize pore structure and capillary sealing behavior. Results indicate that nanopores (<1 μm) dominate the pore system; however, pore size distributions exhibit significant heterogeneity. While B well samples displayed unimodal nanopore distributions, other wells showed bimodal or broad multiscale structures. As a result, MICP-derived Hg-air breakthrough pressures (Pb) varied considerably, ranging from 75 to 283 MPa. Notably, samples G-1 and J5-4 exhibited sealing capacities capable of retaining CO2 column heights exceeding 5052 m, whereas sample J1-1 showed the lowest sealing performance. In the B well, a clear depth-dependent trend was observed: as depth increased from 2480 m to 3685 m, the critical pore diameter decreased from 13.66 nm to 7.57 nm, and breakthrough pressure increased from 95 MPa to 171 MPa. Subsequent quantitative XRD analysis, corrected for drilling-induced contamination, revealed that these deeper intervals are characterized by clay-rich (50.85–63.19%) and relatively ductile mineralogical compositions. These findings suggest that burial-related compaction within a consistently clay-rich, relatively ductile matrix may contribute to pore-throat refinement and enhanced relative capillary sealing capacity in the B well. Overall, the caprocks of the South Sea continental shelf show significant potential for geological hydrocarbon and CO2 storage, though the observed spatial and depth-dependent heterogeneity underscores the necessity of well-specific site characterization.

1. Introduction

The global shift toward carbon neutrality and the persistent demand for hydrocarbons have elevated the strategic importance of geological storage. Consequently, evaluating the sealing integrity of sedimentary basins is essential for both optimizing carbon capture and storage (CCS) and ensuring the secure management of hydrocarbon reservoirs. Deep offshore sedimentary basins have garnered significant attention as promising settings for geological CO2 storage, particularly where saline aquifers are overlain by hydraulically effective and mechanically stable caprocks [1]. While active assessments of storage potential are underway for saline aquifers and depleted hydrocarbon fields, the ongoing necessity of fossil fuels underscores the importance of reassessing the hydrocarbon potential of domestic sedimentary basins. Accordingly, the South Sea shelf Basin has emerged as a strategic region for the integrated evaluation of both hydrocarbon exploration and geological CO2 storage potential. The long-term stability of both hydrocarbon accumulations and geological CO2 storage systems relies critically on the sealing performance of the overlying caprock [2,3,4,5]. Typically composed of fine-grained sedimentary rocks such as shale, mudstone, and claystone, caprocks restrict upward fluid migration through low permeability and high capillary resistance. However, their sealing capacity is highly variable, influenced by pore structure, mineralogical composition, compaction, fracture development, and sedimentary heterogeneity. Therefore, quantitative evaluation of caprock sealing characteristics is essential for both robust petroleum system analysis and secure CO2 storage site design [6]. In addition to capillary sealing capacity, pressure buildup during CO2 injection may induce fault reactivation and seismicity, which should be considered in site-specific CO2 storage assessments [7]. The South Sea continental shelf, including the Jeju Basin, has been extensively investigated for hydrocarbon exploration through seismic surveys and drilling. Previous studies have also evaluated the geological CO2 storage potential of offshore formations, including the PZ-1 exploration well in the southern continental shelf of Korea [8,9]. While significant data regarding basin structure, stratigraphy, reservoir distribution, and storage potential exist, research has primarily focused on structural interpretation, reservoir characterization, and storage capacity assessment. Although several studies have evaluated onshore domestic basins [10], quantitative assessments of caprock sealing properties such as capillary behavior and maximum allowable fluid column heights for offshore basins remain limited. Furthermore, the reliance on drill cuttings rather than continuous cores in offshore operations has historically constrained experimental investigations into caprock behavior, leaving a knowledge gap regarding the systematic comparison of sealing capacities across diverse stratigraphic intervals in this region. Mercury Injection Capillary Pressure (MICP) analysis serves as a robust experimental method for quantifying caprock sealing behavior by characterizing the pore-size distribution, porosity, permeability, and breakthrough pressure [11,12]. These parameters can be converted into allowable oil-brine and CO2-brine column heights, providing a quantitative basis for assessing the maximum buoyancy pressure that caprocks can sustain over geological timescales [13,14,15]. In this study, we systematically evaluate the caprock sealing capacity of the South Sea continental shelf. First, we identified representative caprock intervals from six wells across four structural blocks by integrating lithofacies, stratigraphic architecture, and well log data. Using drill cutting samples from these intervals, we conducted MICP analysis to characterize pore structures and assess capillary sealing performance. Our findings reveal pronounced heterogeneity in sealing capacity across the study area; notably, the B well exhibits a distinct depth-dependent trend, where decreasing critical pore diameter and increasing breakthrough pressure suggest enhanced sealing performance in deeper intervals. To understand the underlying controls of this trend, we performed quantitative X-ray diffraction (XRD) analysis on B well samples, corrected for drilling-related artifacts, to investigate the relationship between mineralogical composition, particularly clay content and brittleness, and observed sealing enhancement. By integrating MICP-derived sealing characteristics with mineralogical and geomechanical properties, this study provides a comprehensive evaluation of caprock integrity. The results establish a robust geological foundation for assessing both CO2 storage potential and hydrocarbon resource management in the South Sea continental shelf.

2. Study Area and Caprock Samples

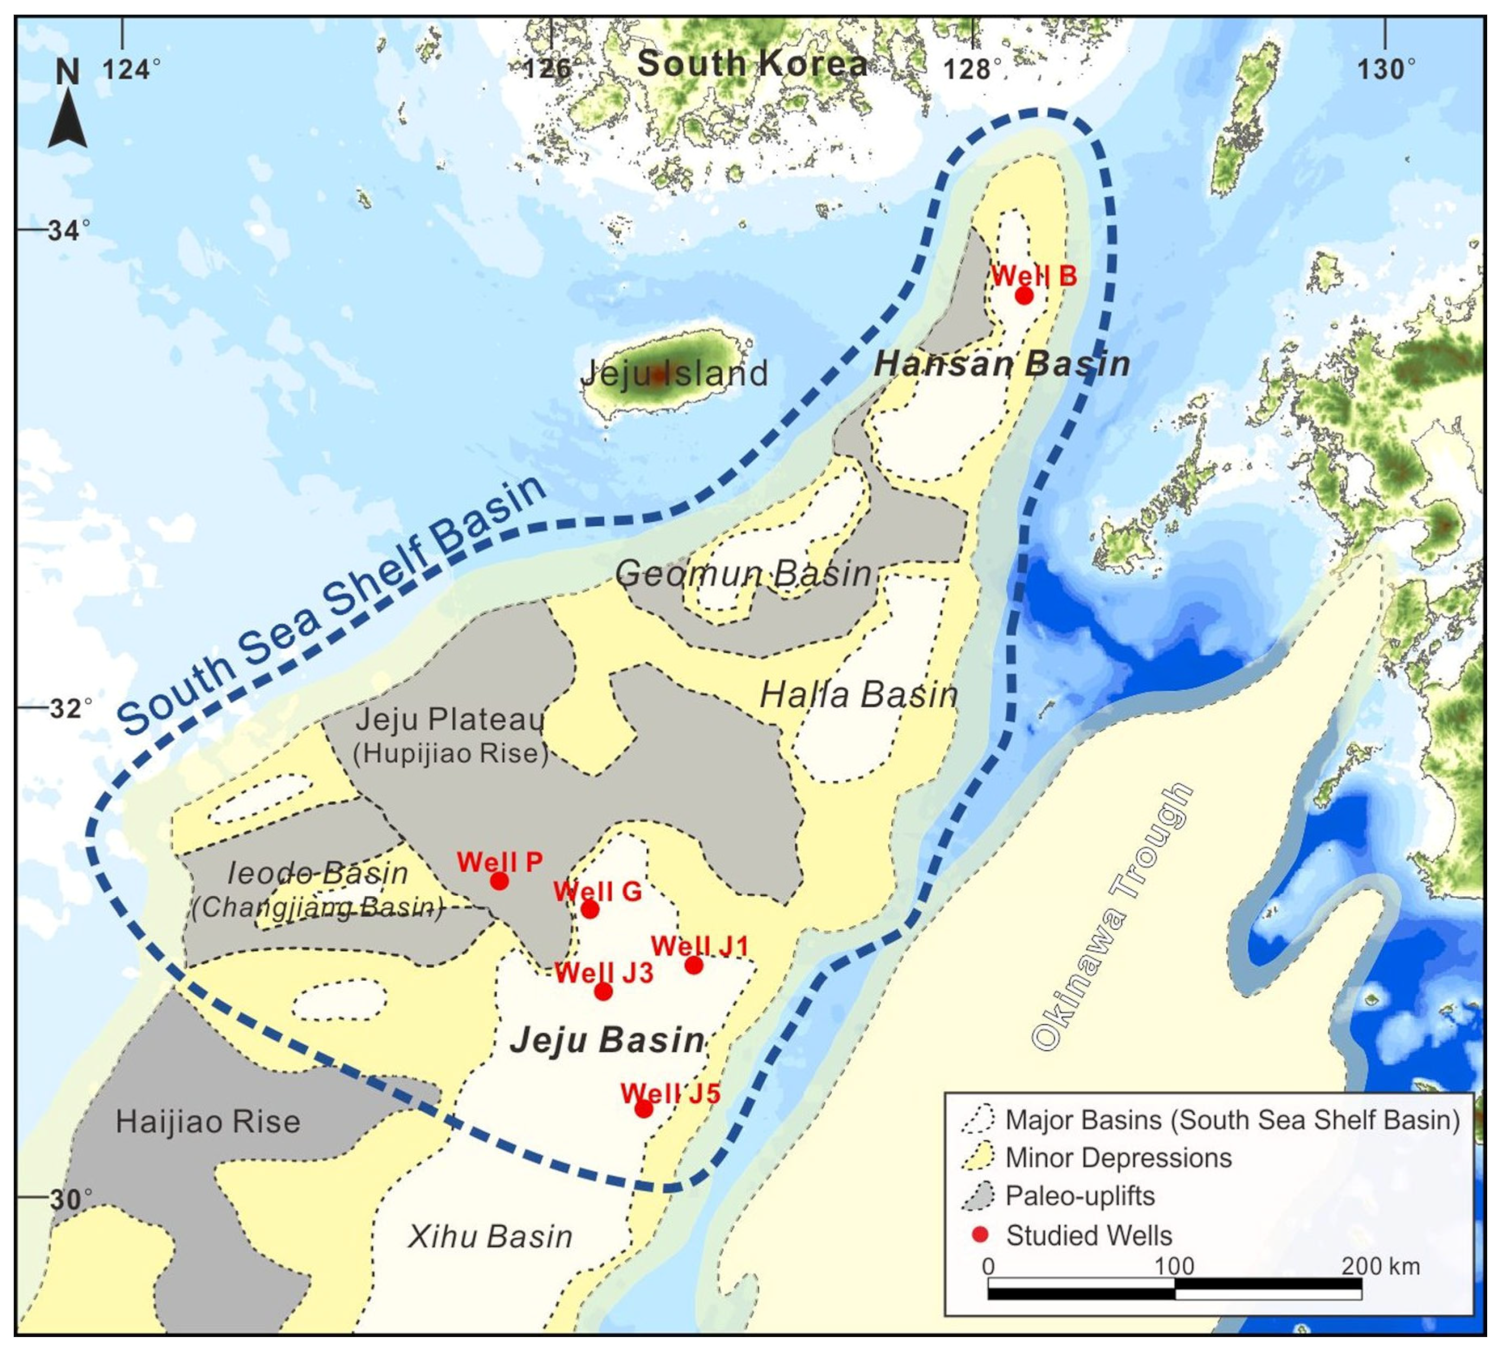
In the South Sea Shelf Basin, fine-grained lithologic units, primarily shales and mudstones, were identified as potential caprocks based on their low permeability and stratigraphic continuity [2,3]. To delineate these intervals, we conducted a comprehensive analysis of lithologic and well-log data from nine wells provided by the Korea National Oil Corporation (KNOC), applying standard criteria for caprock identification [12,16]. Based on this analysis, representative caprock intervals were identified across six wells: P, G, J1, J3, J5, and B. The identified intervals are as follows: 829 to 940 m in the P well, 850 to 1750 m in the G well, 947 to 1553 m in the J1 well, 1010 to 2000 m in the J3 well, 1000 to 1900 m in the J5 well, and 2200 to 4100 m in the B well (Figure 1). The South Sea Shelf Basin comprises the Jeju, Ieodo, Halla, Geomun, and Hansan basins. Among the investigated wells, G, J1, J3, and J5 are located within the Jeju Basin, B is located within the Hansan Basin, and P is situated on the Jeju Plateau, which represents a basement high. The different colors in Figure 1 represent these geological and structural subdivisions, thereby providing the regional geological context of the investigated wells. Although potential caprock intervals were also identified in the O, J2, and J4 wells, these were excluded from further experimental analysis due to the unavailability of drill cutting samples.
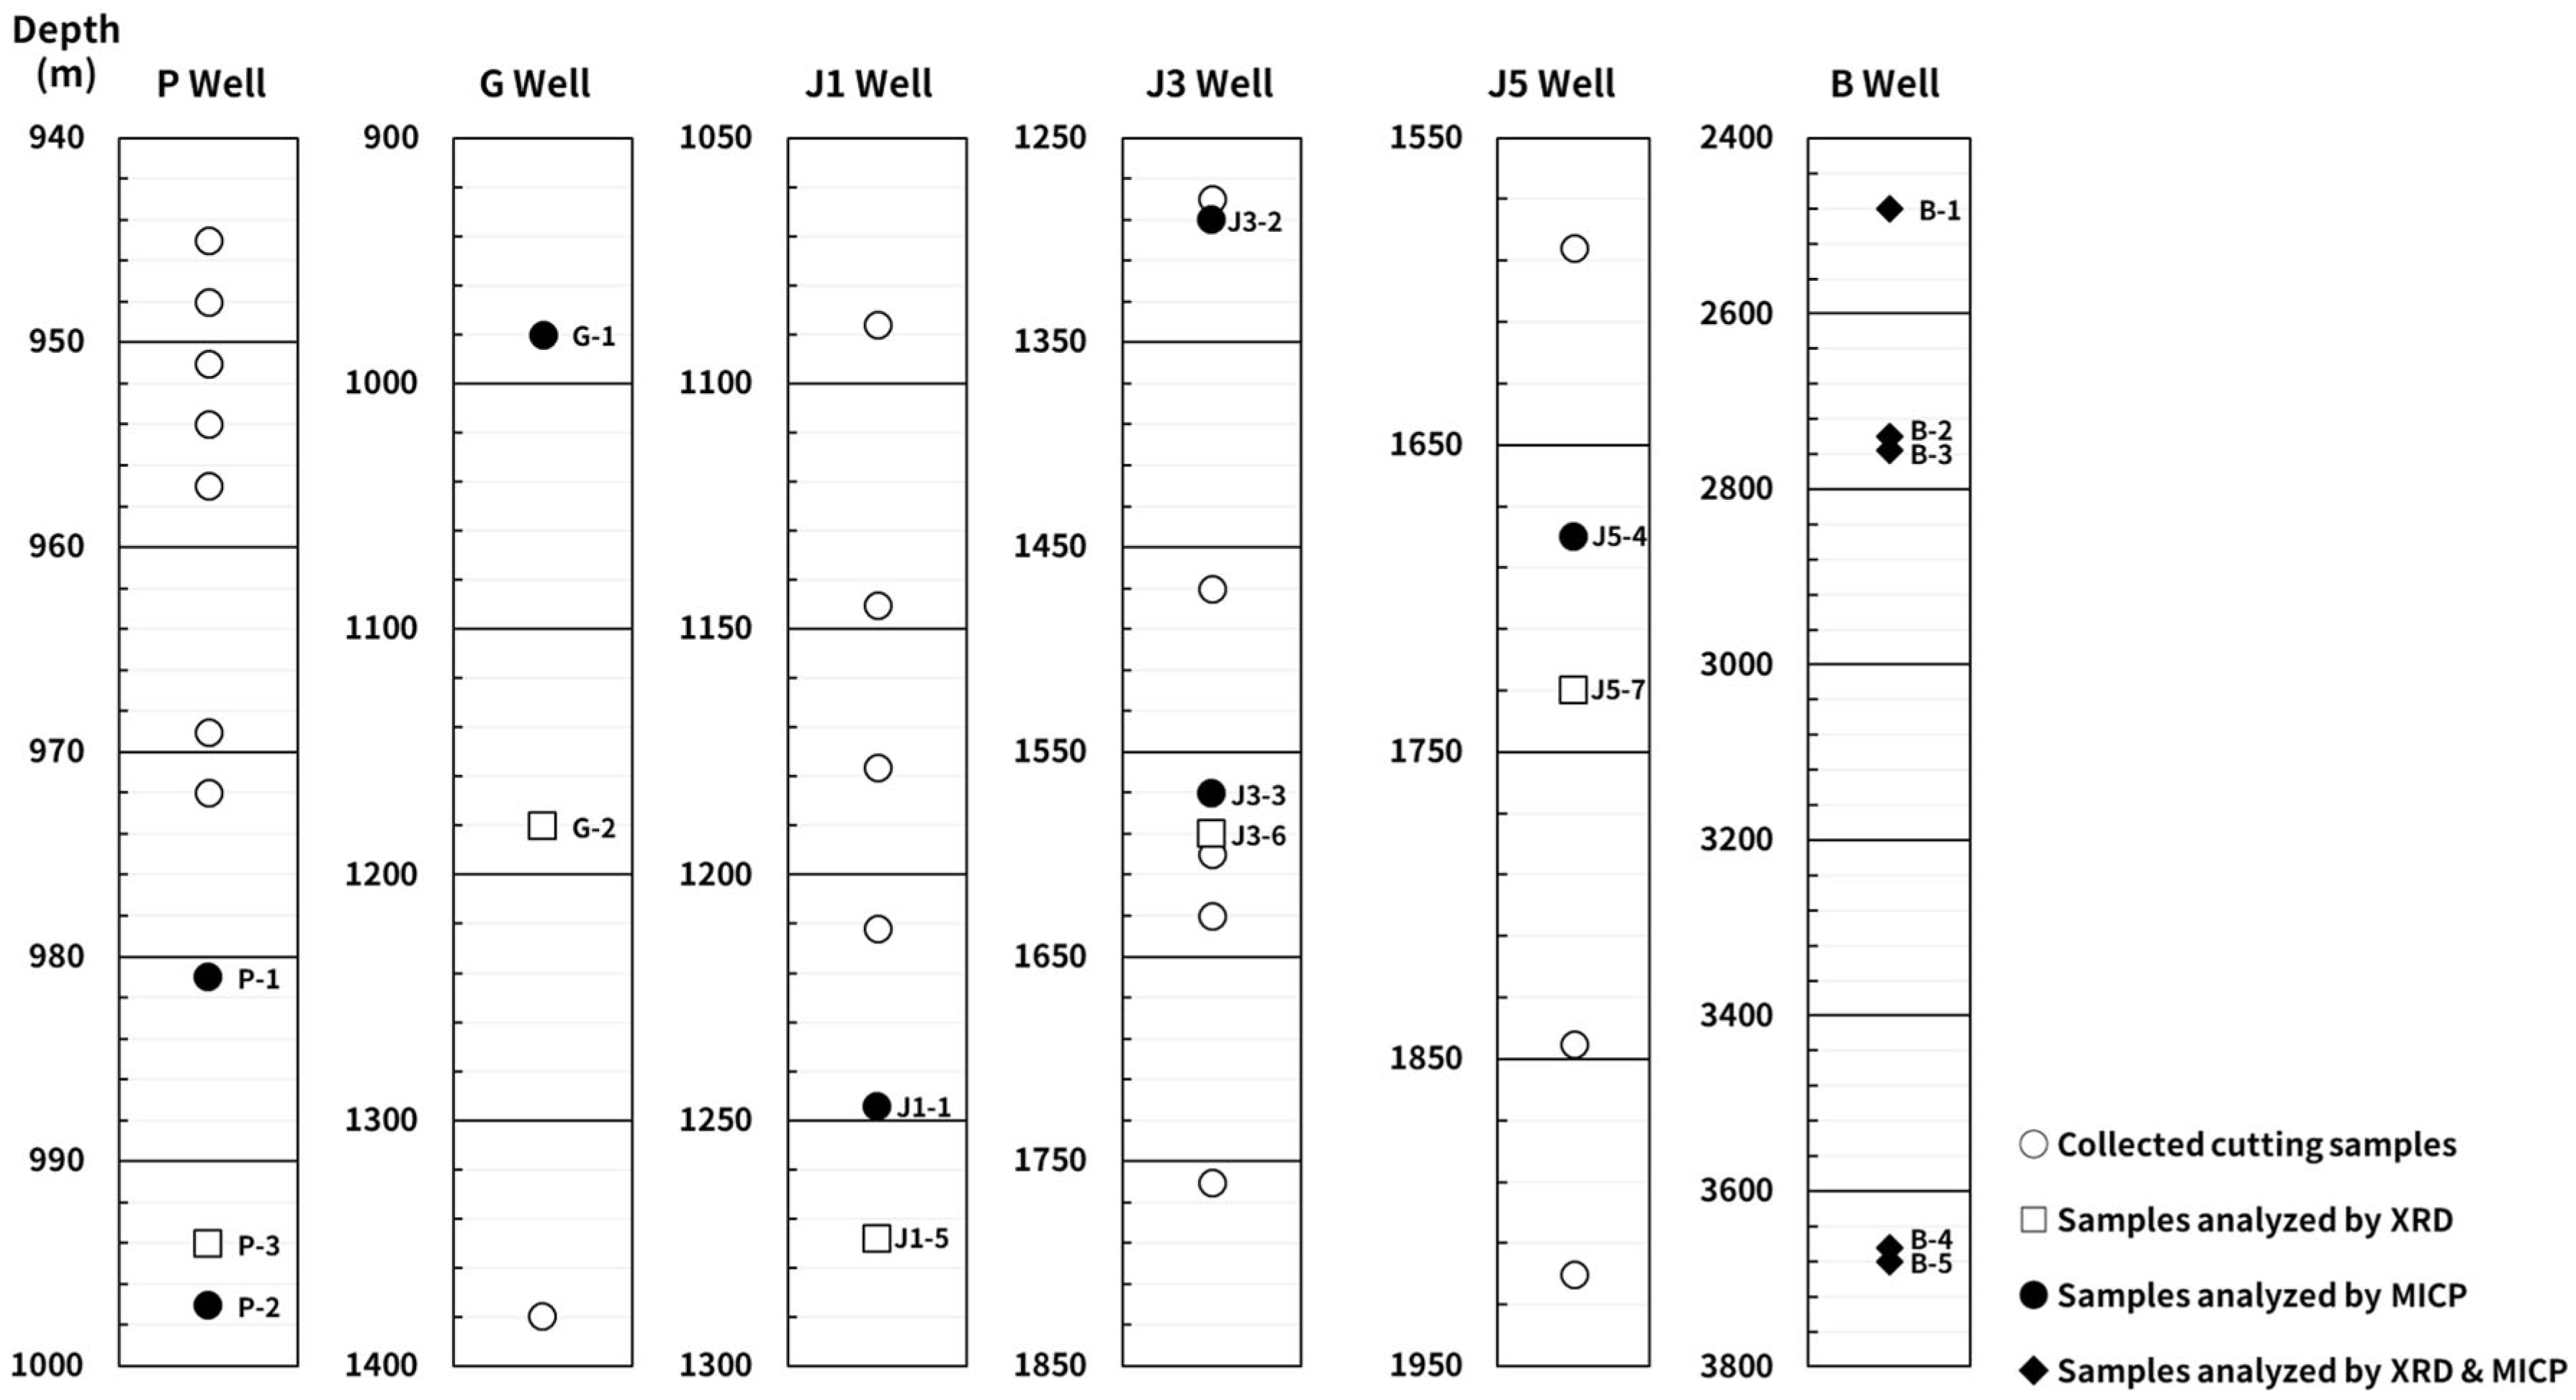
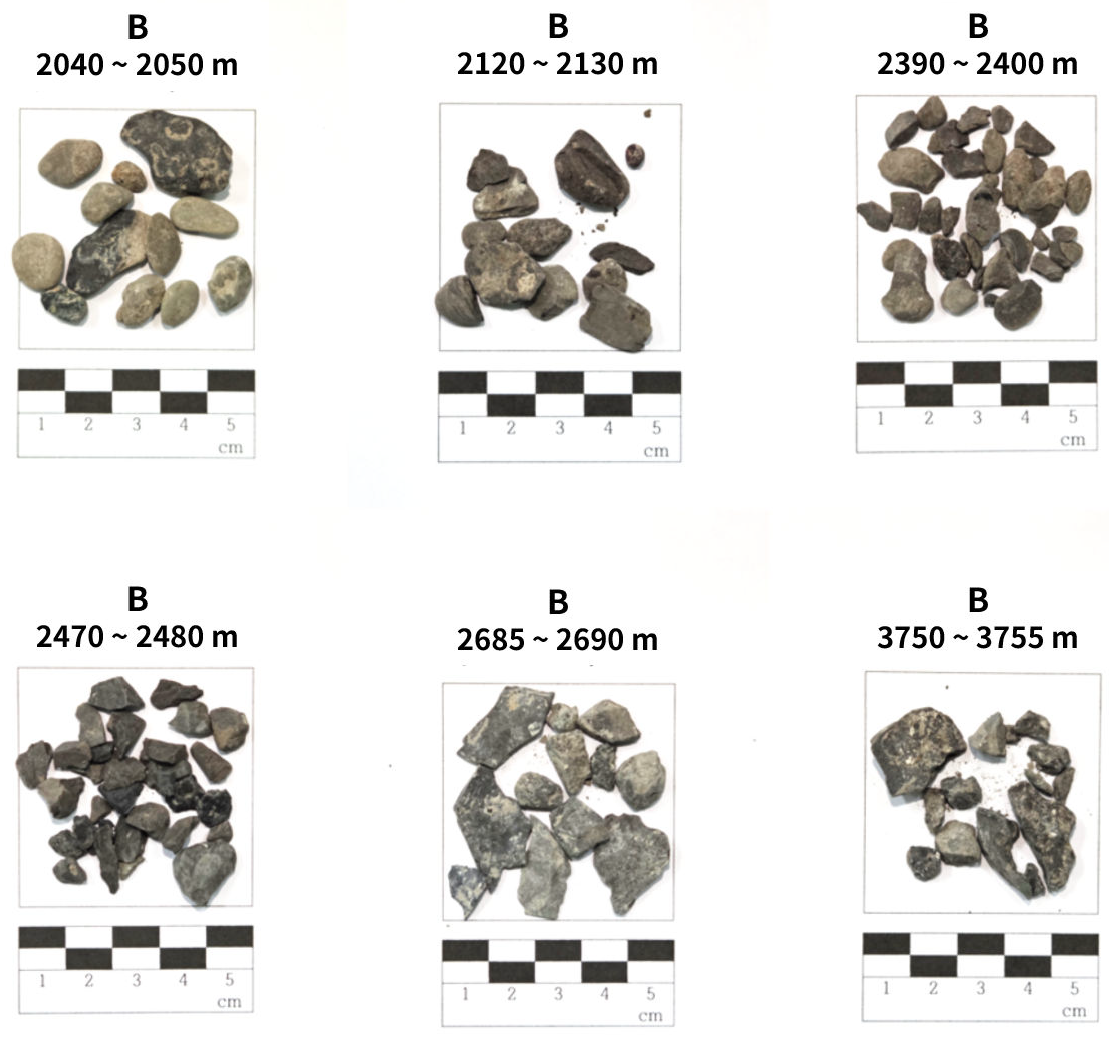
Drill cutting samples archived at the Korea National Oil Corporation and the core center of the Korea Institute of Geoscience and Mineral Resources were used in this study. Based on the caprock intervals identified above, cuttings were collected from six wells (P, G, J1, J3, J5, and B) in the South Sea Shelf Basin, and samples were secured from multiple depths within the caprock interval of each well. Specifically, 10 cutting samples were obtained from the approximately 945–997 m interval in the P well; 3 from the G well; 6 from the J1 well; 9 from the J3 well; and 5 depth-specific cutting samples each from the J5 and B wells. Thus, multiple drill-cutting samples were collected to represent the caprock interval of each well, and their vertical distribution is shown in Figure 2. Within the B well, specific depths in the sandy siltstone and mudstone interval were selected first, and the corresponding drill-cutting samples were subsequently subjected to MICP and XRD analyses. Because the B well provided the most extensive depth-specific drill-cutting dataset, XRD analysis was focused on this well to investigate depth-dependent mineralogical variations under comparable sampling conditions. The B well provided sufficient depth-specific samples and showed a consistent depth-dependent sealing trend, making it the most suitable target for detailed MICP and XRD analyses. Representative drill-cutting samples collected from the B well at different depth intervals are shown in Figure 3.
The collected drill-cuttings were initially inspected for preservation status and washing quality; samples exhibiting severe degradation or potential contamination were excluded from the analysis. To ensure the reliability of the caprock sealing evaluation, we preferentially selected depths containing a sufficient abundance of mudstone fragments. Subsequently, representative samples for Mercury Injection Capillary Pressure (MICP) analysis were selected from one or more depths per well. Furthermore, at specific depths, samples containing mixed mineral fragments were intentionally included to examine the influence of non-mudstone components on pore structure and capillary characteristics, thereby providing a more comprehensive assessment of the actual caprock sealing capacity.

3. Analytical Methods

3.1. Mercury Injection Capillary Pressure (MICP) Analysis

Mercury Injection Capillary Pressure (MICP) testing was conducted to quantitatively evaluate the pore structure characteristics and sealing capacity of caprock samples from the South Sea continental shelf [11,12]. The recovered drill-cutting samples were screened to a size fraction of 1–4 mm, dried, and subsequently evacuated to ensure the complete removal of moisture prior to mercury intrusion. During the analysis, mercury, a non-wetting fluid, was injected into the samples in a stepwise manner up to a maximum pressure of approximately 414 MPa. The intrusion volume was recorded at each pressure increment to characterize the pore-throat distribution. The pore-throat radius was calculated from the intrusion data using the Washburn equation [17], which is derived from the Young-Laplace equation [18,19].
P c = 2 γ cos θ r
where Pc is capillary pressure (psi), γ is the surface tension of mercury (dyne/cm), θ is the contact angle (°), and r is the pore-throat radius (μm). Because the Washburn equation assumes a constant contact angle and mercury surface tension irrespective of pore size, its direct application to nanopores (<5 nm) may introduce systematic error in the derived pore-throat radius [20]. The resulting capillary pressure mercury saturation curves were utilized to determine porosity, permeability, and pore size distributions ranging from the nanometer to micrometer scale, providing essential insights into caprock sealing behavior. Key capillary parameters were interpreted as follows: the pore entry pressure (Pe) represents the minimum pressure for initial mercury intrusion; the displacement pressure (Pd), defined at 10% mercury saturation, indicates the transition to continuous migration [2]; and the breakthrough pressure (Pb), the critical pressure establishing a continuous mercury pathway, serves as a primary indicator of sealing capacity. Since MICP measurements were obtained in the Hg–air system, the measured capillary pressures were scaled to the assumed CO2–brine and oil–brine fluid systems using interfacial-tension and contact-angle ratios based on Young–Laplace capillary scaling [2,12,21]. (Equation (2)):
P c , b r i n e / C O 2 = P c , a i r / H g σ b r i n e / C O 2 cos θ b r i n e / C O 2 σ b r i n e / H g cos θ b r i n e / H g
where P c , b r i n e / C O 2 and P c , a i r / H g denote the capillary pressures of the reservoir fluid system and the air-mercury system, respectively. σ and θ represent the interfacial tension and contact angle of the respective systems. Based on the converted pressures (Pe, Pd, Pb), the maximum allowable fluid column heights ( H C O 2 ( o i l ) ) were calculated from the capillary buoyancy equilibrium relationship [12,21]:
H C O 2 ( o i l ) = P C O 2 / b r i n e ( o i l / b r i n e ) g ( ρ b r i n e ρ C O 2 o i l )
where g is gravitational acceleration (m/s2), and ρ b r i n e  and  ρ C O 2  are the densities of brine and CO2 (kg/m3), respectively. The calculated column heights served as quantitative indicators for evaluating well-specific caprock sealing capacity and facilitating interwell comparisons. Furthermore, effective porosity, determined by the mercury-invaded pore volume and specific pore-throat size distributions were analyzed to establish pressure constraints for safe CO2 injection. Consistent with established capillary sealing principles, a higher proportion of nanopore-dominated throats is indicative of increased capillary resistance and, consequently, superior sealing performance. To ensure the accuracy of these evaluations, fluid system conversions were performed using the parameters summarized in Table 1 [22], which include the interfacial tensions (σ) and contact angles (θ) for both the Hg-air and CO2-brine systems, along with the respective fluid densities. Given that subsurface conditions characterized by elevated pressure, temperature, and CO2 saturation may shift the caprock wettability from strongly water-wet toward intermediate states, the contact angle ( θ B r i n e / C O 2 ) was varied from 0° to 60° [23,24]. This range allows for a robust sensitivity analysis, evaluating how potential wettability alterations impact the calculated breakthrough pressures and the maximum allowable CO2 column heights. This approach provides a more conservative and comprehensive assessment of caprock integrity under dynamic reservoir conditions. It should be noted that the CO2-brine breakthrough pressures reported in this study are not direct measurements obtained by injecting CO2 into water-saturated intact core plugs. Rather, they are MICP-derived estimates converted from the Hg-air system using assumed CO2-brine fluid properties and wettability conditions. Therefore, the calculated values are most appropriately interpreted as comparative indicators of capillary sealing capacity among the investigated intervals. Their absolute magnitudes may vary depending on the applicability of the scaling relationship, as well as on in situ effective stress, brine chemistry, CO2 phase behavior, and rock-fluid wettability.

3.2. Quantitative X-Ray Diffraction (XRD) Analysis

To investigate the intrinsic mineralogical composition of the caprock and evaluate its potential geomechanical behavior, quantitative X-ray diffraction (XRD) analysis was performed on the B well samples. The B well was specifically selected because the MICP results revealed a distinct depth-dependent trend, characterized by a progressive decrease in critical pore diameter and a simultaneous increase in breakthrough pressure with depth.
Furthermore, the B well provided multiple depth-specific samples across a wide burial interval, making it suitable for investigating mineralogical controls on depth-dependent sealing behavior. The drill cutting samples were ground into fine powders (particle size ∼10 μm) to minimize preferred orientation effects and ensure a random distribution of mineral grains during analysis. Quantitative XRD analysis is based on Bragg’s Law [25], which relates the diffraction of X-rays from crystal lattice planes to the spacing of these planes:
n λ = 2 d s i n θ
where n is an integer (the order of reflection), λ is the wavelength of the incident X-ray, d is the interplanar spacing of the crystal lattice, and θ is the angle of incidence. The mineralogical quantification was performed through full-pattern fitting to derive the precise weight fractions of the constituent minerals. Quantitative phase determination via full-pattern fitting has been shown to provide more reliable clay mineral abundances than single-reflection approaches, particularly for illite- and smectite-rich assemblages [26]. Furthermore, to address potential drilling-related artifacts, the XRD data were processed to reduce the potential influence of mixed-layer clay minerals that may have been introduced by drilling mud. The resulting normalized mineral fractions are therefore interpreted as sensitivity-corrected estimates of the caprock mineralogical composition rather than unequivocal representations of the in situ mineralogy.

3.3. Geomechanical Evaluation: Brittleness Index (BI) Calculation

Based on the quantified mineral fractions obtained from XRD analysis, the brittleness index (BI) was calculated to assess the geomechanical characteristics and fracture susceptibility of the caprock matrix. Following established empirical models [27,28], the BI was determined by the weight fraction of brittle minerals relative to the total mineral composition:
B I M 1 = W Q W Q + W C + W C l
B I M 2 = W Q + W C + W F W Q + W C + W F + W C l
where WQ, WC, WF, and WCl denote the weight fractions (%) of quartz, carbonate minerals (calcite and dolomite), feldspar, and clay minerals, respectively, obtained from quantitative XRD analysis. Quartz, carbonates, and feldspars are generally classified as brittle minerals due to their relatively high elastic moduli and low plastic deformability, whereas clay minerals are regarded as ductile constituents because of their capacity for plastic deformation and deformation accommodation. This behavior is consistent with the reported threshold in clay mineral mass fraction (~1/3) that separates sealing (ductile) shales from brittle shales [29]. Therefore, the brittleness index represents the relative abundance of brittle framework-forming minerals compared with ductile, clay-rich components and serves as a proxy for the mechanical behavior of the caprock. Higher mineralogical BI values indicate relatively greater compositional tendencies toward brittle behavior, whereas lower values indicate relatively more clay-rich and potentially ductile compositional tendencies. These indices were used as first-order proxies and do not directly quantify in situ fracture susceptibility, fracture-network development, or self-sealing behavior. By integrating these BI values with the pore-structure parameters derived from MICP, this study evaluates the potential for fracture-induced leakage versus capillary-controlled sealing within the South Sea continental-shelf caprocks.

3.4. Integration of Mineralogical and Pore Structure Data

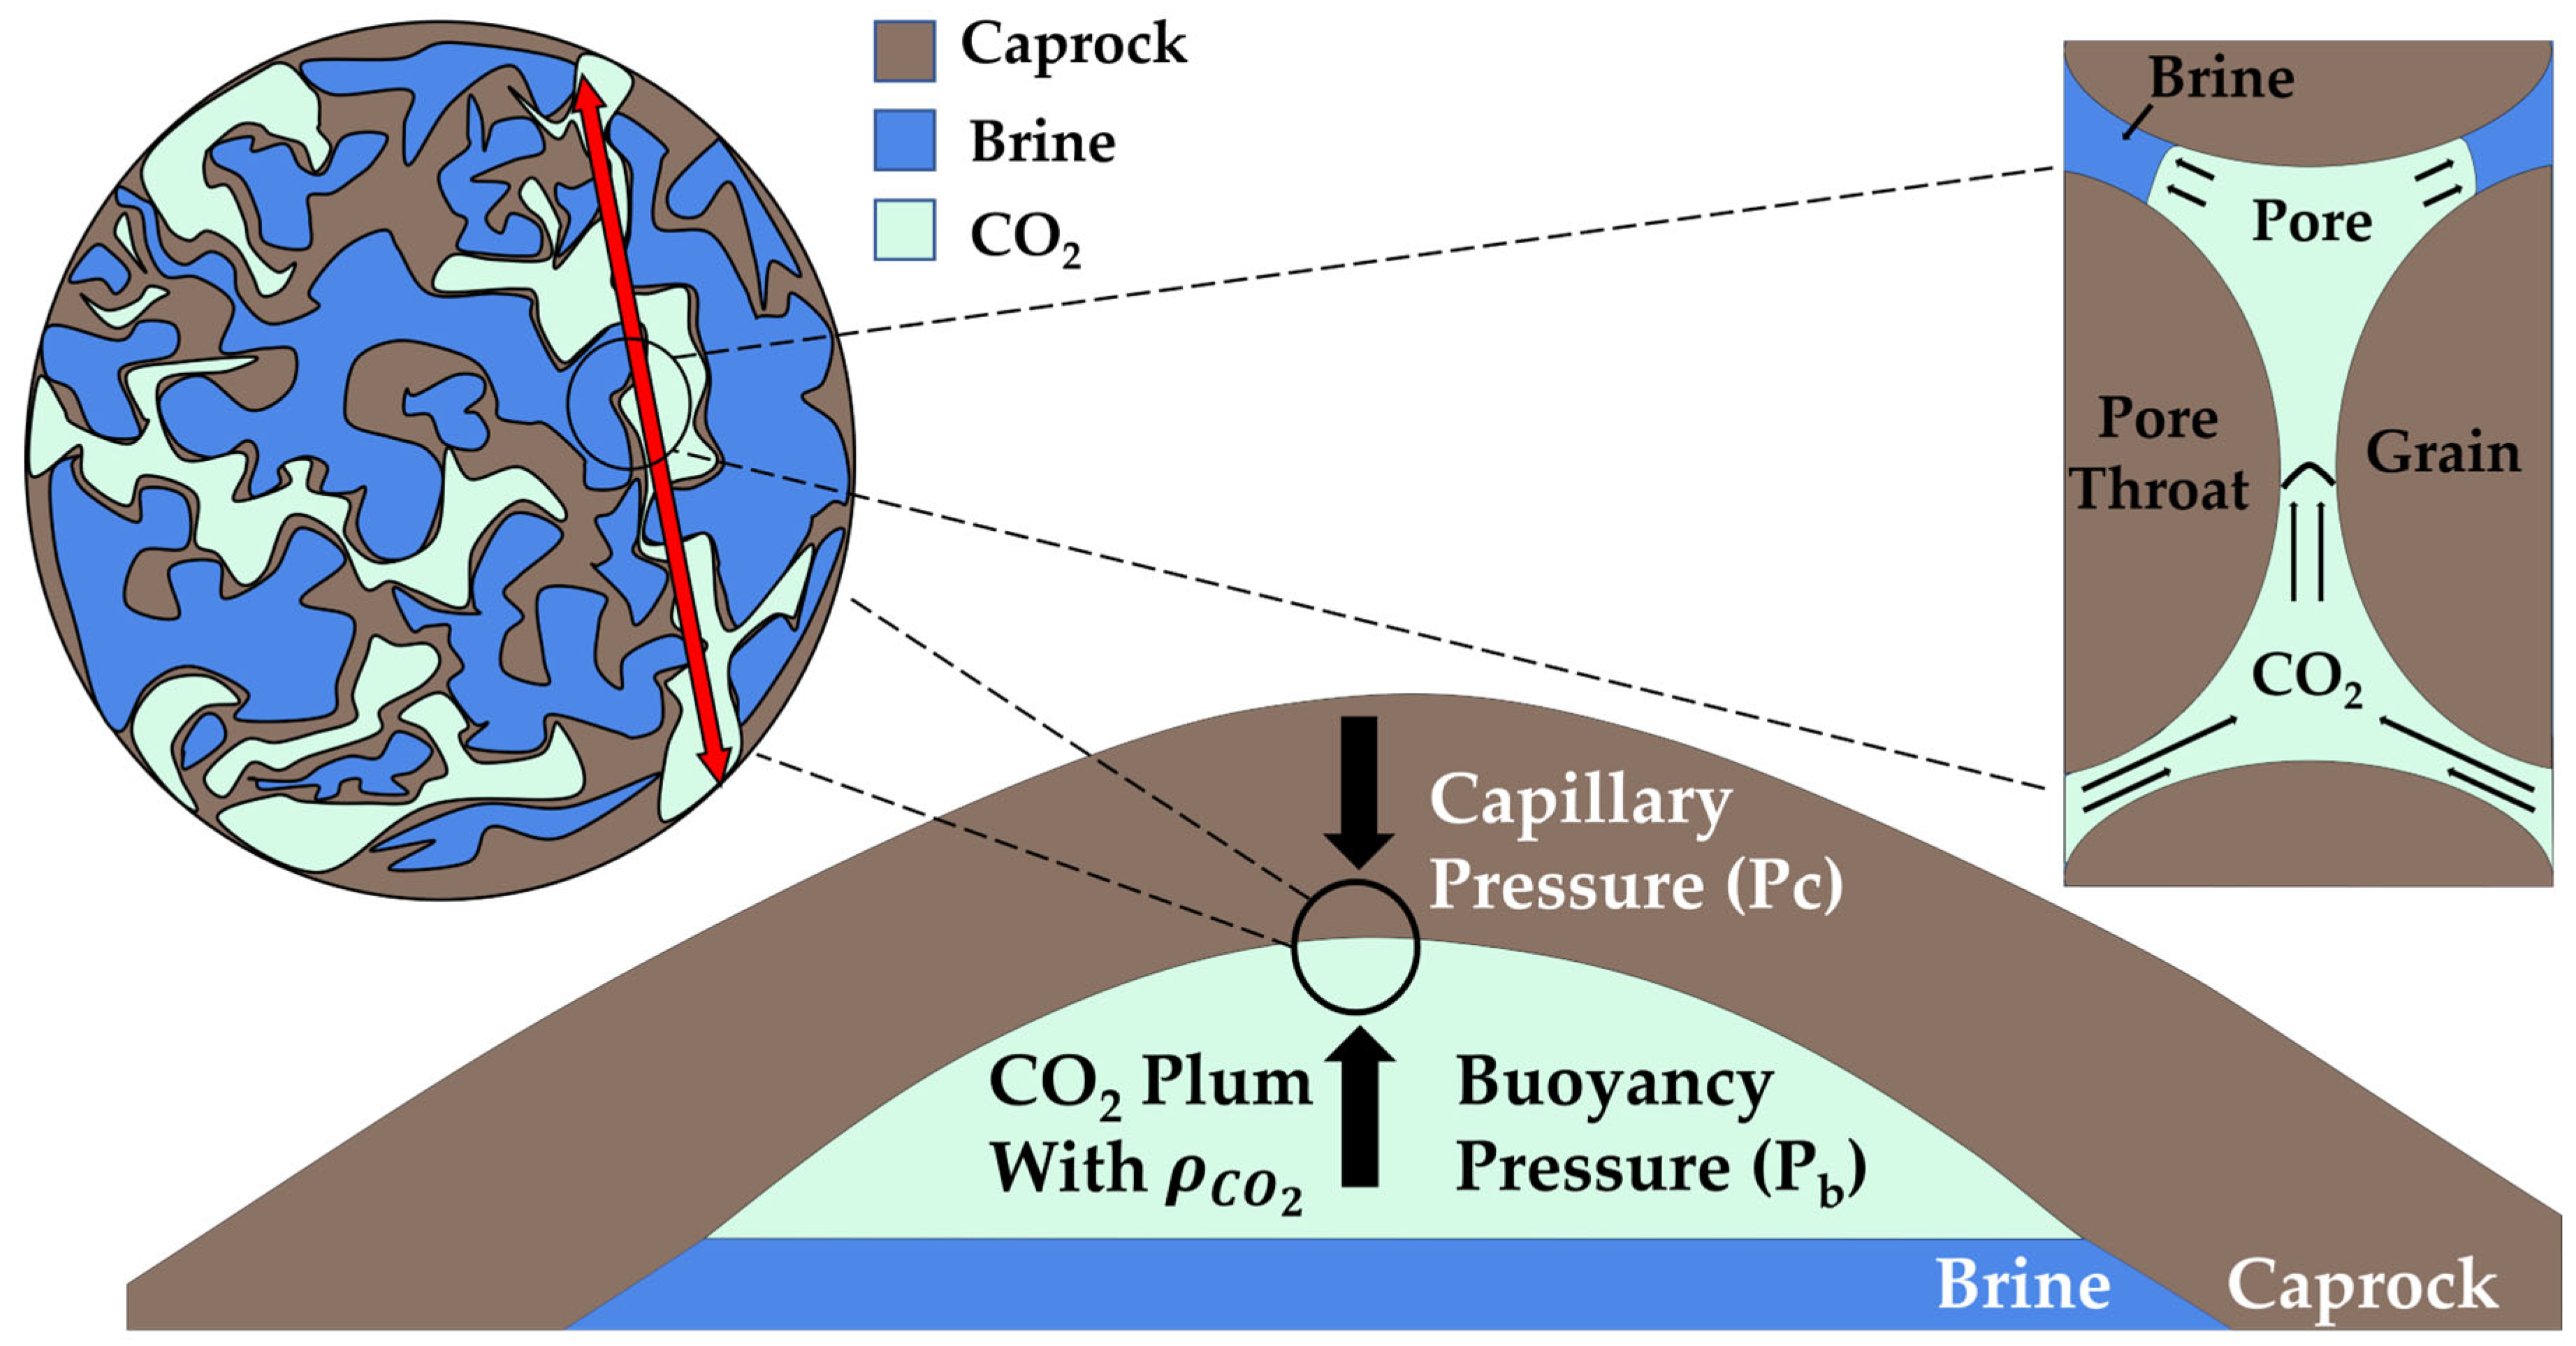
The calculated BI values served as proxies for evaluating matrix ductility and fracture susceptibility under elevated reservoir pressures during CO2 injection. By integrating mineralogical composition and brittleness characteristics with MICP-derived pore structures and capillary sealing behaviors, we investigated the underlying geological controls on the observed sealing enhancement. Specifically, this integrated approach allowed us to correlate the depth-dependent shifts in pore-throat geometry with variations in clay mineral content and ductility. Clay minerals generally possess platy particle morphology and large specific surface areas, promoting the development of small pore-throats and enhanced capillary resistance. Previous studies have shown that mineralogical composition and diagenetic processes, including compaction, cementation, dissolution, and clay-mineral transformation, can modify pore-throat size, pore connectivity, and capillary sealing behavior in fine-grained rocks and shale caprocks [30]. In particular, compaction- and cementation-driven pore-throat densification has been directly linked to enhanced breakthrough pressure in argillaceous caprocks [31]. We hypothesize that burial-related compaction within the clay-rich mineralogical matrix of the B-well intervals may contribute to pore-throat refinement and higher MICP-derived breakthrough pressures. Previous studies have shown that CO2-rock interactions and associated mineralogical responses may vary with rock composition and diagenetic conditions [32]. These CO2-rock interactions, including mineral dissolution and precipitation, have been extensively documented across laboratory and simulation studies of CO2-brine-rock systems [33]. However, because clay content and brittleness index do not exhibit strictly monotonic trends with depth (Table 2), the present dataset does not demonstrate a single mineralogical mechanism for the observed depth-dependent sealing trend. The observed depth-dependent MICP trend is consistent with pore-throat refinement in the deeper B-well intervals, potentially associated with burial-related compaction within a clay-rich matrix. This integrated analysis provides a preliminary framework for examining the relationships among mineralogical composition, pore-throat characteristics, and relative capillary-sealing behavior in the South Sea continental shelf. The fundamental sealing mechanism is governed by the force balance between the buoyancy of the CO2 column and the capillary resistance of the caprock, as illustrated in Figure 4 [2,12,21]. In addition to matrix capillary resistance, fault-related leakage pathways, fault reactivation, and diagenetic modification may influence the effective sealing capacity of caprocks [34,35,36].

4. Results: Petrophysical Characterization and Sealing Capacity Evaluation

4.1. Pore Size Distribution

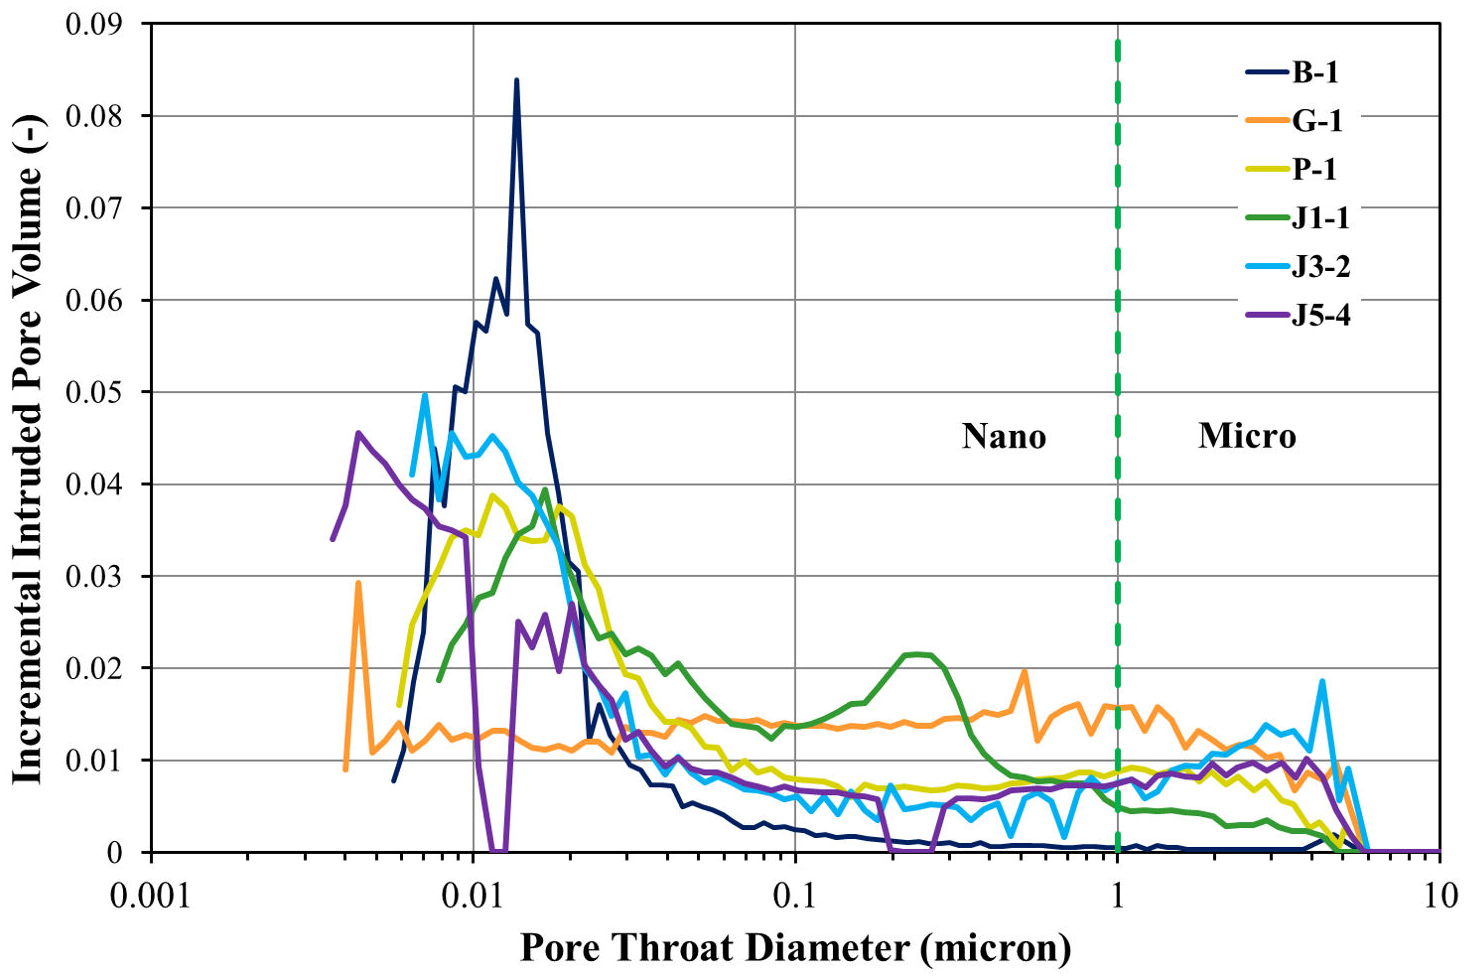
The B well samples demonstrate a consistent dominance of nanopores across all depth intervals (Figure 5). The B-1 sample exhibits a unimodal pore-size distribution concentrated within the 0.005–0.1 μm range, with a distinct peak near 0.015 μm. This structure, characterized by nanopore dominance and relatively high homogeneity, is consistent with the pore characteristics commonly observed in fine-grained caprocks exhibiting strong sealing capacity. While the B-2 through B-5 samples also show nanopore dominance, their distributions display subtle variations. Specifically, the peak positions in B-2 and B-3 shift slightly toward finer pore sizes (approximately 0.007–0.01 μm), and the distributions appear broader, suggesting an increase in pore-size spectrum complexity. In the deeper B-4 and B-5 intervals (up to 3685 m), the pore size distributions remain unimodal but show broader peaks, reflecting a more compact pore structure potentially resulting from increased burial depth and compaction. In contrast, samples from the P and G wells exhibit pronounced multiscale pore structures. The P-1 sample displays a distinct bimodal pattern, with a primary nanopore peak near 0.01 μm and a secondary micropore peak in the 1–3 μm range, suggesting two distinct pore populations. The P-2 sample exhibits a continuous, gradual distribution across the 0.01–5 μm interval, indicating a complex, interconnected network of pores of varying sizes. Similarly, G-1 displays a broad distribution spanning 0.01–5 μm, with a significant contribution from both nanopores (<0.01 μm) and micropores (0.5–2 μm), confirming a high degree of structural heterogeneity. The J-well samples also demonstrate nanopore dominance (<1 μm), yet exhibit marked variability in distribution morphology. The J1-1 sample follows a bimodal distribution with peaks at 0.02 μm and 0.2 μm. The J3-2 sample is primarily nanopore dominated but contains minor micropore populations (4–5 μm), whereas J3-3 appears to be the most homogeneous of the J-well samples, with pore sizes tightly concentrated within the 0.007–0.03 μm range. Conversely, J5-4 exhibits the highest heterogeneity and structural complexity, with overlapping peaks spanning the entire 0.003–5 μm range. These findings highlight the significant spatial and depth-dependent heterogeneity of caprock pore systems across the South Sea continental shelf, emphasizing the necessity of well-specific assessments for reliable storage-site evaluation.

4.2. Capillary Pressure Analysis

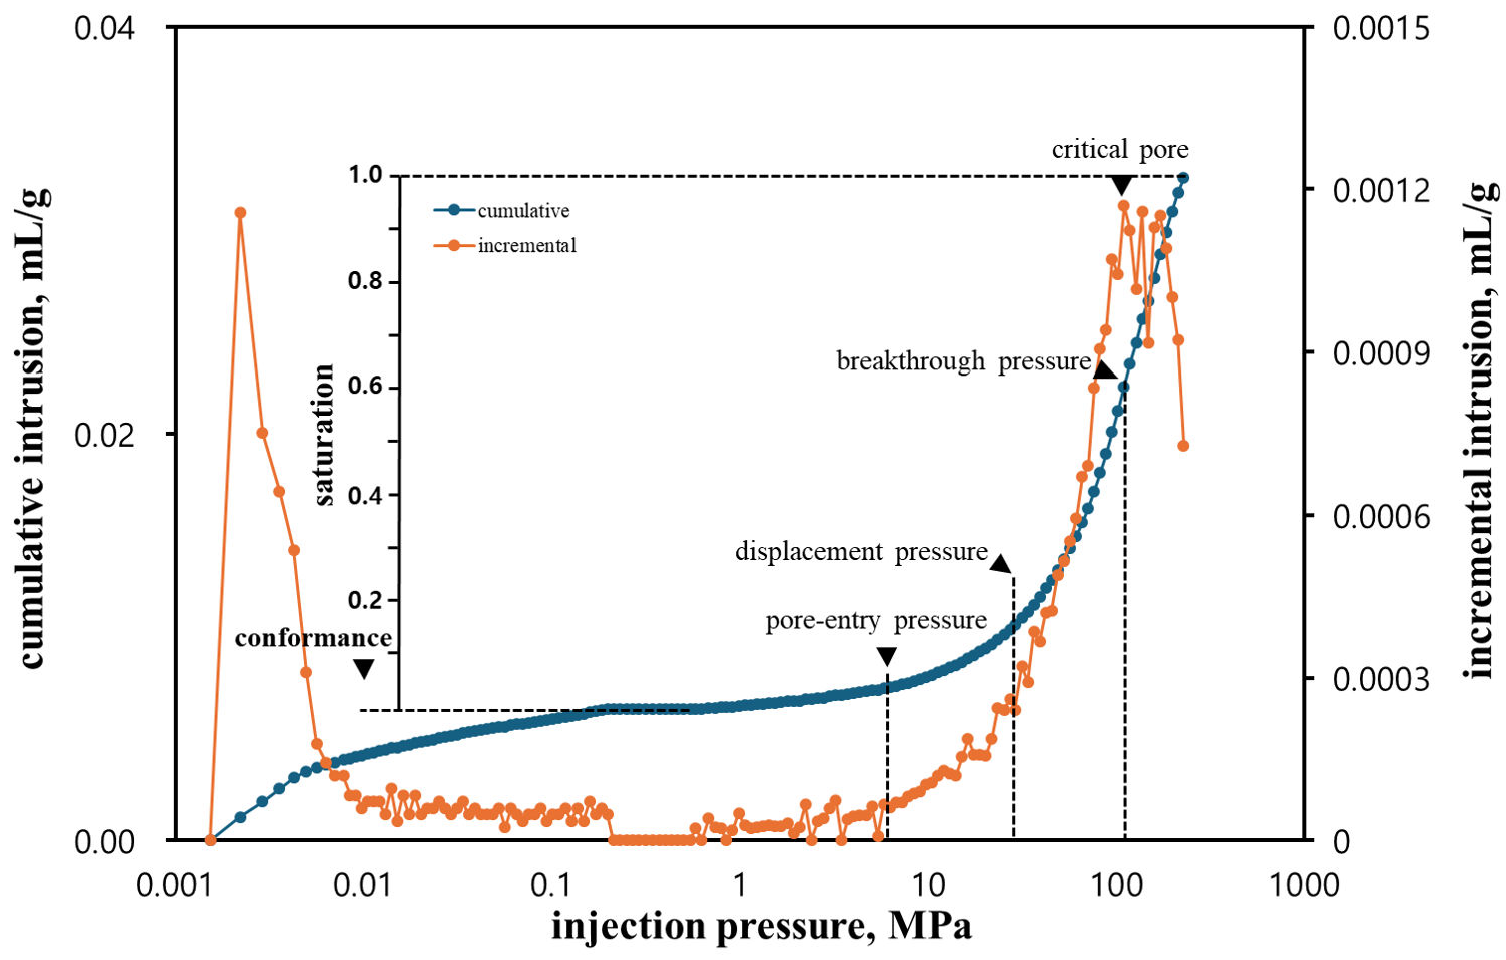
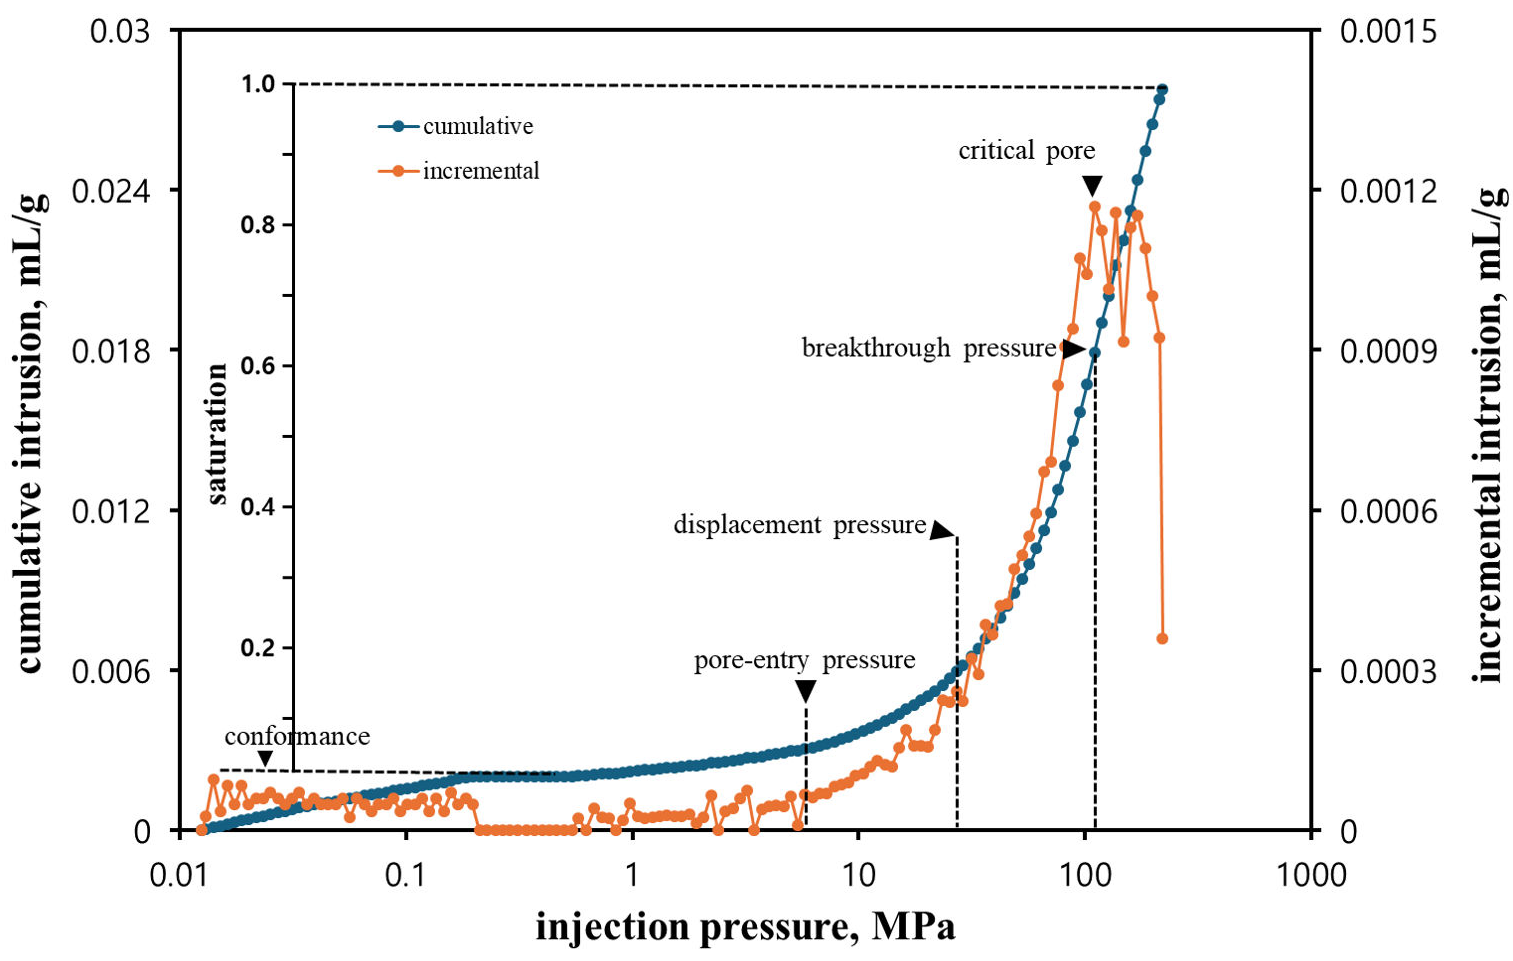
Initial mercury intrusion at low pressures, characterized by large incremental volumes, was identified as the conformance interval (Figure 6). This phase reflects the filling of surface irregularities and gaps between cutting fragments rather than true pore-throat invasion; thus, it was excluded from subsequent petrophysical evaluations (Figure 7) [10].
The B-2 sample exhibits a characteristic curve typical of fine-grained caprocks with strong sealing capacity. The estimated pore entry pressure (Pe) of ~6 MPa indicates a relatively delayed onset of mercury intrusion compared with samples exhibiting lower Pe values. However, the displacement pressure (Pd) of ~27 MPa and the MICP-derived breakthrough pressure (Pb) of ~110 MPa indicate relatively high capillary resistance within the present comparative dataset. Analysis of samples from the B well (B-1 through B-5) reveals a clear depth-dependent trend in capillary sealing performance. As depth increases, the MICP-derived Hg-air Pb values consistently rise, reaching a maximum of 171 MPa in the deepest B-5 sample. This depth-dependent trend is consistent with progressive pore-throat refinement associated with burial-related compaction; however, the present cutting-based dataset does not independently establish compaction as the sole controlling mechanism.
Figure 6. MICP curve of the B-2 sample showing the relationship between cumulative and incremental mercury intrusion and injection pressure, along with key petrophysical parameters, including conformance, pore entry pressure (Pe), displacement pressure (Pd), and breakthrough pressure (Pb).
Processes 14 02515 g006
Figure 7. MICP injection curve of the B-2 caprock sample illustrating the determination of pore entry pressure (Pe), displacement pressure (Pd), and breakthrough pressure (Pb).
Processes 14 02515 g007
Samples from the P and G wells exhibit performance variations consistent with these findings. P-1 and P-2 show an upward trend in Pb with depth (109 MPa and 132 MPa, respectively). Notably, G-1 exhibits one of the highest MICP-derived Hg-air Pb values among the analyzed samples (283 MPa), indicating high relative capillary resistance within the present comparative framework. Collectively, the results suggest that burial depth, lithological heterogeneity, and pore-throat characteristics may influence the MICP-derived capillary sealing behavior of the South Sea continental shelf caprocks.
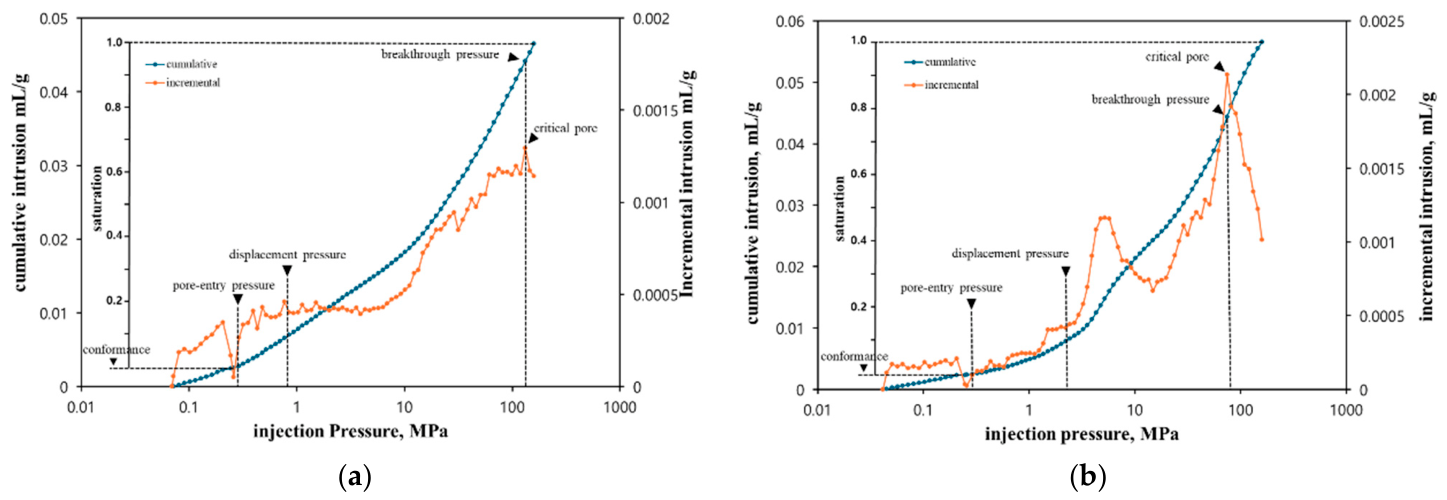
Based on the analysis of the J-well samples, while all are dominated by nanoscale pores, their sealing capacities vary significantly. The J1-1 sample has a pore entry pressure of 0.3 MPa and an MICP-derived breakthrough pressure of 75 MPa, indicating relatively lower capillary resistance among the analyzed samples (Figure 8b). Samples J3-2 and J3-3 demonstrate intermediate sealing characteristics, with pore entry pressures of 0.2 MPa and 0.3 MPa and breakthrough pressures of 176 MPa and 160 MPa, respectively. The J5-4 sample shows the highest level of capillary sealing capacity in the JDZ block, with a pore entry pressure of 0.2 MPa and a breakthrough pressure of 283 MPa, comparable to the G-1 sample.

4.3. Permeability Estimation and Sealing Performance Assessment

To obtain screening-level estimates of air permeability from the MICP data, an empirical relationship based on mercury intrusion parameters was applied [15]. The estimated values were interpreted comparatively because permeability may be influenced by pore geometry and heterogeneity beyond characteristic pore-throat size [37]:
k a i r = a ( S H g P c , a i r / H g ) m a x c
where kair is the estimated air permeability (mD), a is an empirical constant (339), SHg is the mercury saturation (%), Pc is the capillary pressure (psi), and ( S Hg / P c , air / Hg ) m a x c represents the maximum ratio of mercury saturation to capillary pressure along the mercury intrusion curve. The exponent c is 1.691. It should be noted that this empirical model, originally derived from regression analysis of carbonate and sandstone samples, tends to overestimate permeability when applied to extremely low-permeability lithologies such as shales. Dedicated capillarity and permeability compilations for mudrocks confirm that porosity–permeability correlations calibrated on sandstones and carbonates do not transfer reliably to fine-grained lithologies [38]. The 12 analyzed samples exhibit significant heterogeneity in pore structure and capillary characteristics, leading to wide variations in sealing capacity. While the MICP-derived air-permeability estimates are generally low (<1 mD), J3-2 and G-1 show relatively higher estimated values of 11.05 mD and 9.00 mD, respectively. These values may reflect heterogeneity in the analyzed cutting assemblage, including contributions from coarser-grained fragments or accessible larger pores. A critical observation from this study is the divergence between permeability and capillary sealing capacity. For instance, the G-1 sample maintains a high breakthrough pressure (Pb ∼283 MPa) despite its relatively high permeability, indicating that capillary sealing integrity remains robust even when average flow capacity is elevated. Conversely, the J5-4 sample exemplifies a high-integrity caprock with both low permeability and high Pb. These findings demonstrate that evaluating caprock sealing capacity based solely on permeability measurements is insufficient. To accurately assess the integrity of CO2 storage sites and manage long-term leakage risks, it is essential to integrate permeability data with comprehensive capillary characteristics, including pore entry (Pe), displacement (Pd), and breakthrough pressures (Pb).

4.4. Calculation of Maximum Allowable CO2 Column Height

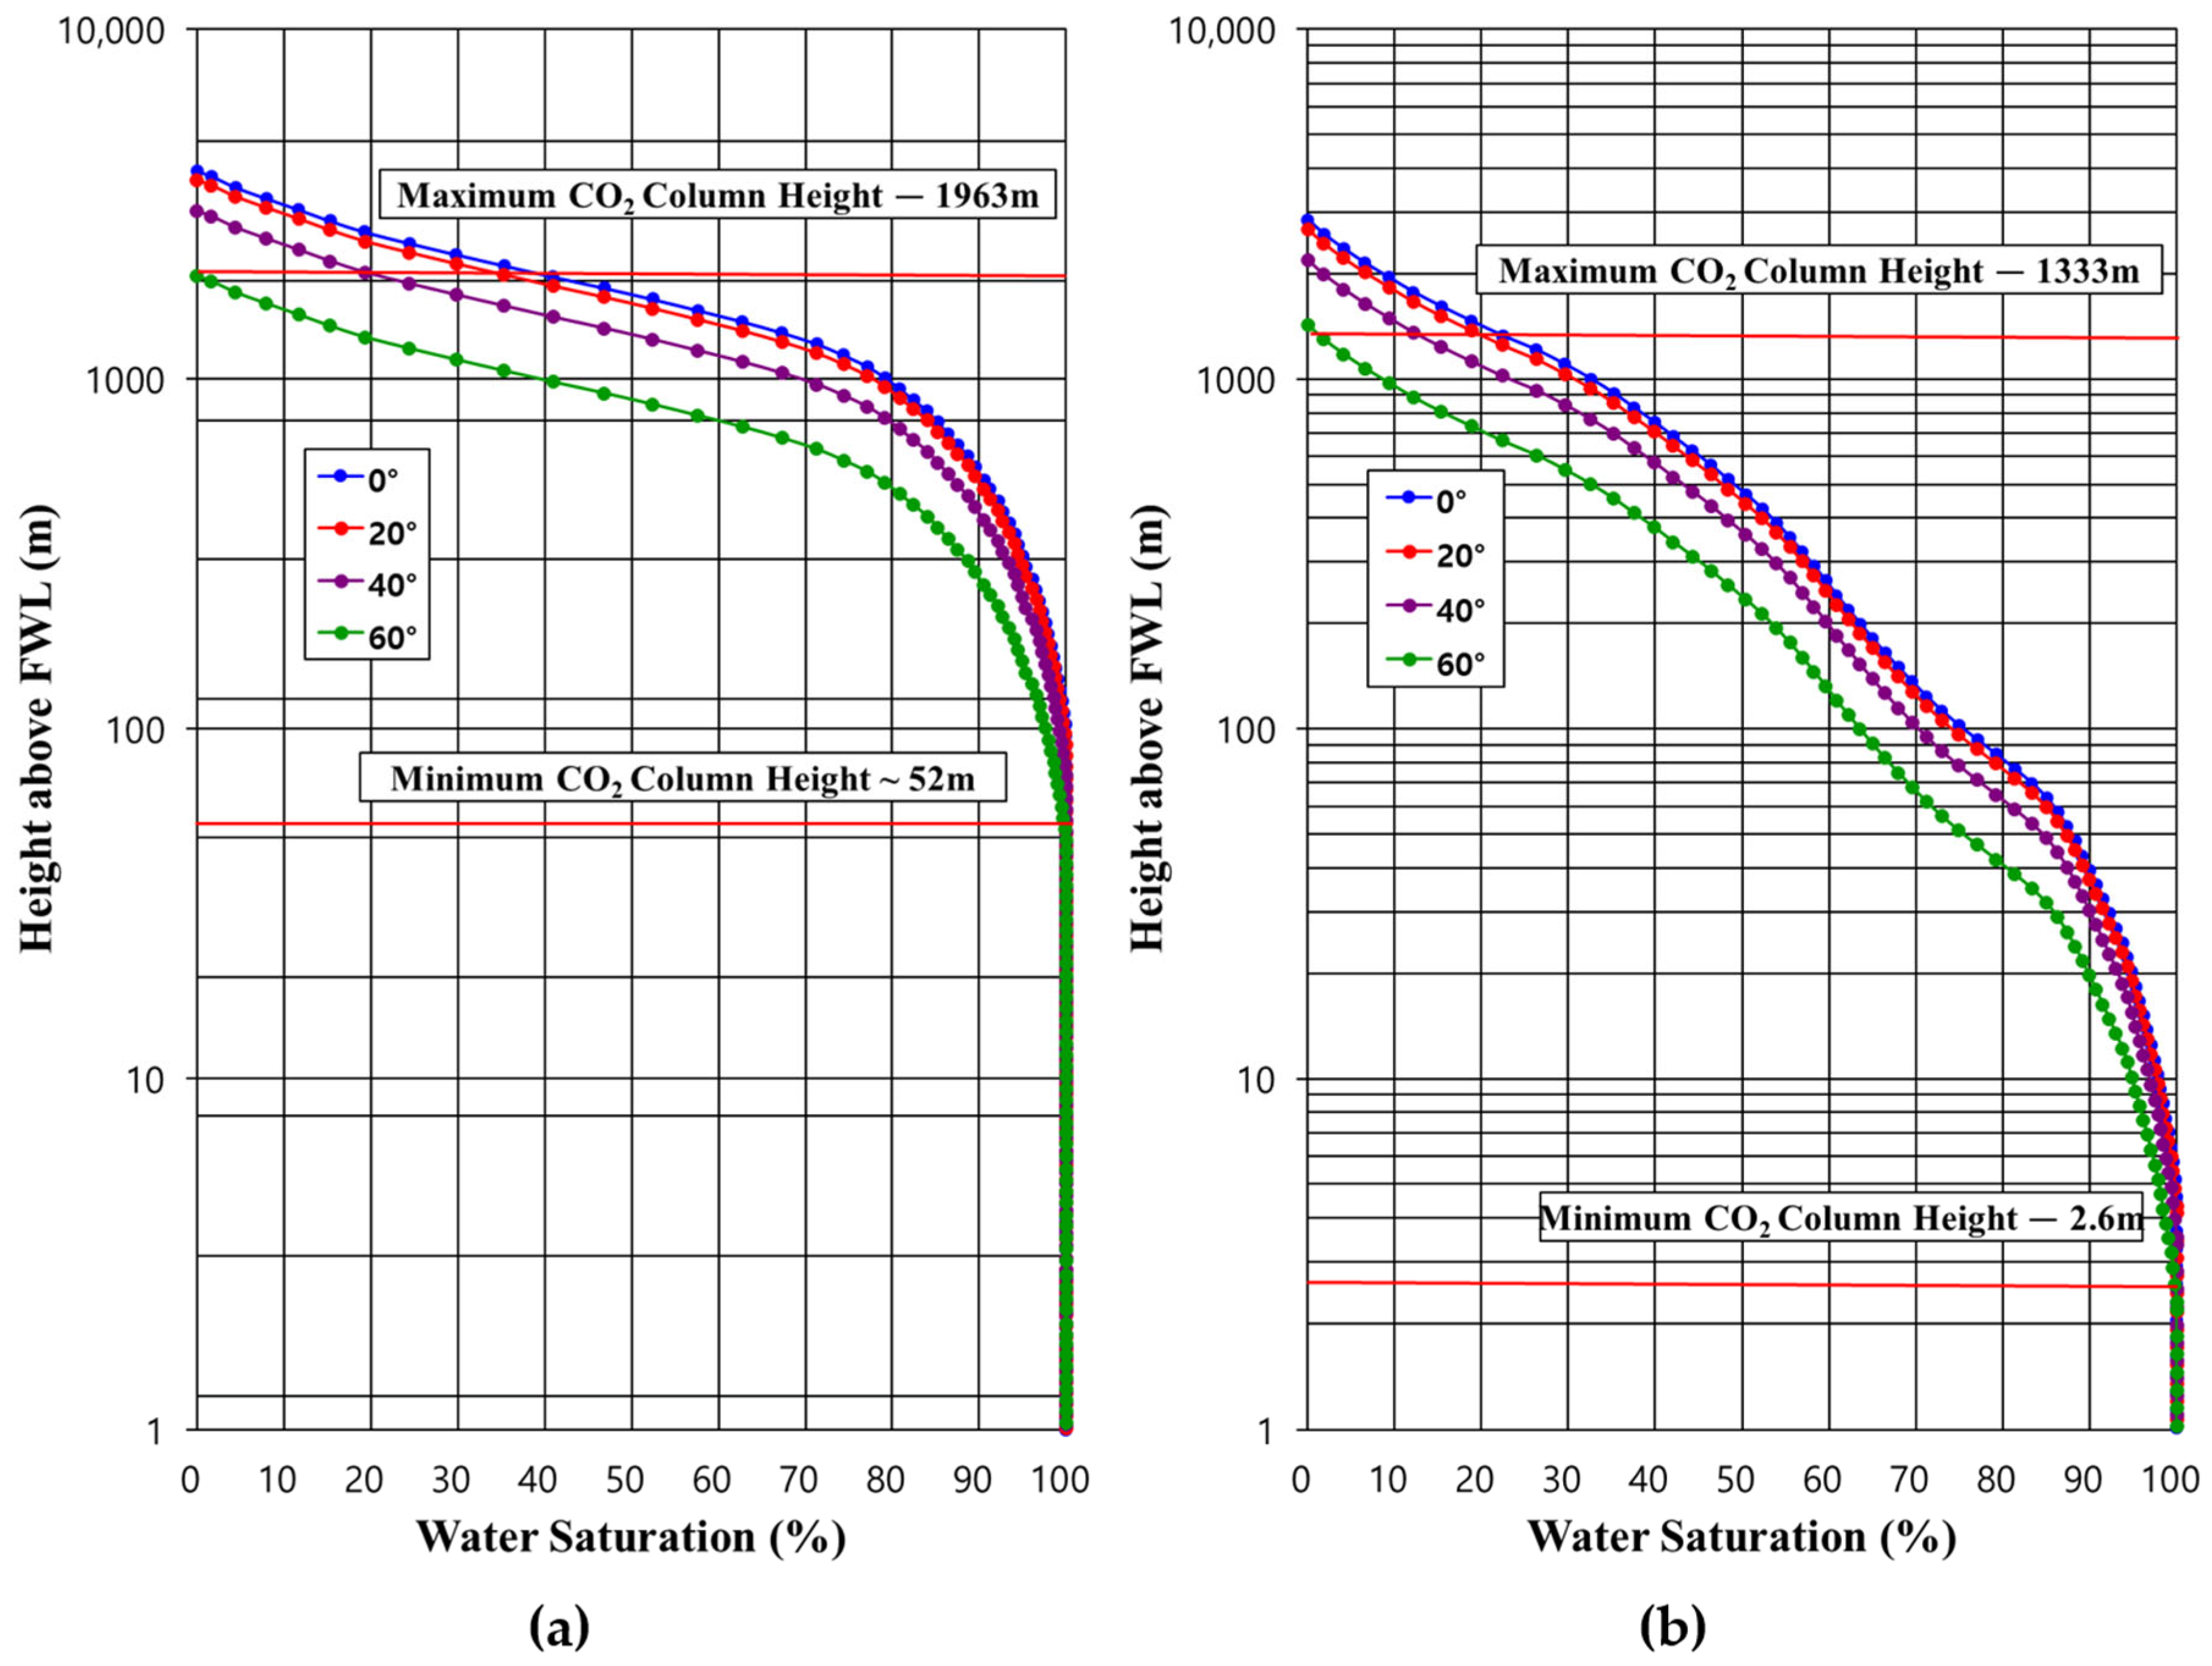
To assess the long-term containment efficiency of the studied caprocks, MICP data were converted to reservoir conditions for the CO2-brine system and reinterpreted as Free Water Level (FWL)-water saturation curves. This analysis evaluated the impact of wettability variations by applying contact angles of 0°, 20°, 40°, and 60° [12,15].
The B-1 sample yielded a maximum allowable CO2 column height of approximately 1694 m at a 0° contact angle. Its FWL-water saturation curve shows a rapid decrease in water saturation at low capillary pressures, followed by a stabilized plateau, indicating that although initial buoyancy increases induce some fluid entry, the fine-grained internal pore network effectively prevents long-term leakage. In the B well, a clear depth-dependent trend was observed, with maximum allowable CO2 column heights increasing from 1694 m in the B-1 sample to approximately 1963 m in the B-2 and B-3 samples (Figure 9a), 2275 m in the B-4 sample, and reaching a maximum of 3056 m in the deepest B-5 sample. This progression is consistent with enhanced relative capillary resistance in the deeper B-well intervals, potentially associated with burial-related compaction and pore-throat refinement.
Analysis of the P and G wells further supports the significance of depth and lithology. The P-1 and P-2 samples yielded intermediate column heights of 1950 m and 2359 m, respectively. Notably, the G-1 sample exhibited the highest MICP-derived maximum allowable CO2 column height (5052 m) among the analyzed samples under the assumed CO2–brine fluid properties and wettability conditions. Among the J-well samples, sealing capacities varied significantly (range: 1333–5052 m). The J1-1 sample showed the lowest MICP-derived maximum allowable CO2 column height (1333 m) among the analyzed samples (Figure 9b). In contrast, J3-2 and J3-3 exhibited intermediate potentials (3141 m and 2856 m), while the J5-4 sample matched the excellent performance of G-1 with a column height of ~5052 m. Overall, the South Sea continental shelf caprocks show pronounced heterogeneity in sealing capacity, with maximum allowable CO2 column heights spanning 1333–5052 m. Within the present MICP-derived comparative framework, G-1 and J5-4 exhibited the highest Pb-based capillary-resistance indicators among the analyzed samples. This FWL-water saturation-based framework provides a critical quantitative foundation for comparing caprock integrity across diverse geological settings and for optimizing site selection for future geological carbon sequestration projects.

4.5. Quantitative XRD Analysis and Geomechanical Characterization

To investigate the intrinsic mineralogical controls on the depth-dependent sealing behavior observed in the MICP results, quantitative X-ray diffraction (XRD) analysis was performed on the B well drill cuttings. Initial raw data indicated a significant presence of mixed-layer clay (17.6–40.8%). Because bentonite-based drilling mud may contribute mixed-layer clay to archived cutting samples, this fraction was treated as a potential drilling-related component rather than being assumed to represent only the intrinsic mineralogical composition of the caprock. To evaluate the potential effect of this drilling-related component on the inferred framework mineralogy, the mixed-layer clay fraction was excluded, and the remaining mineral components were normalized to 100% (Table 2).
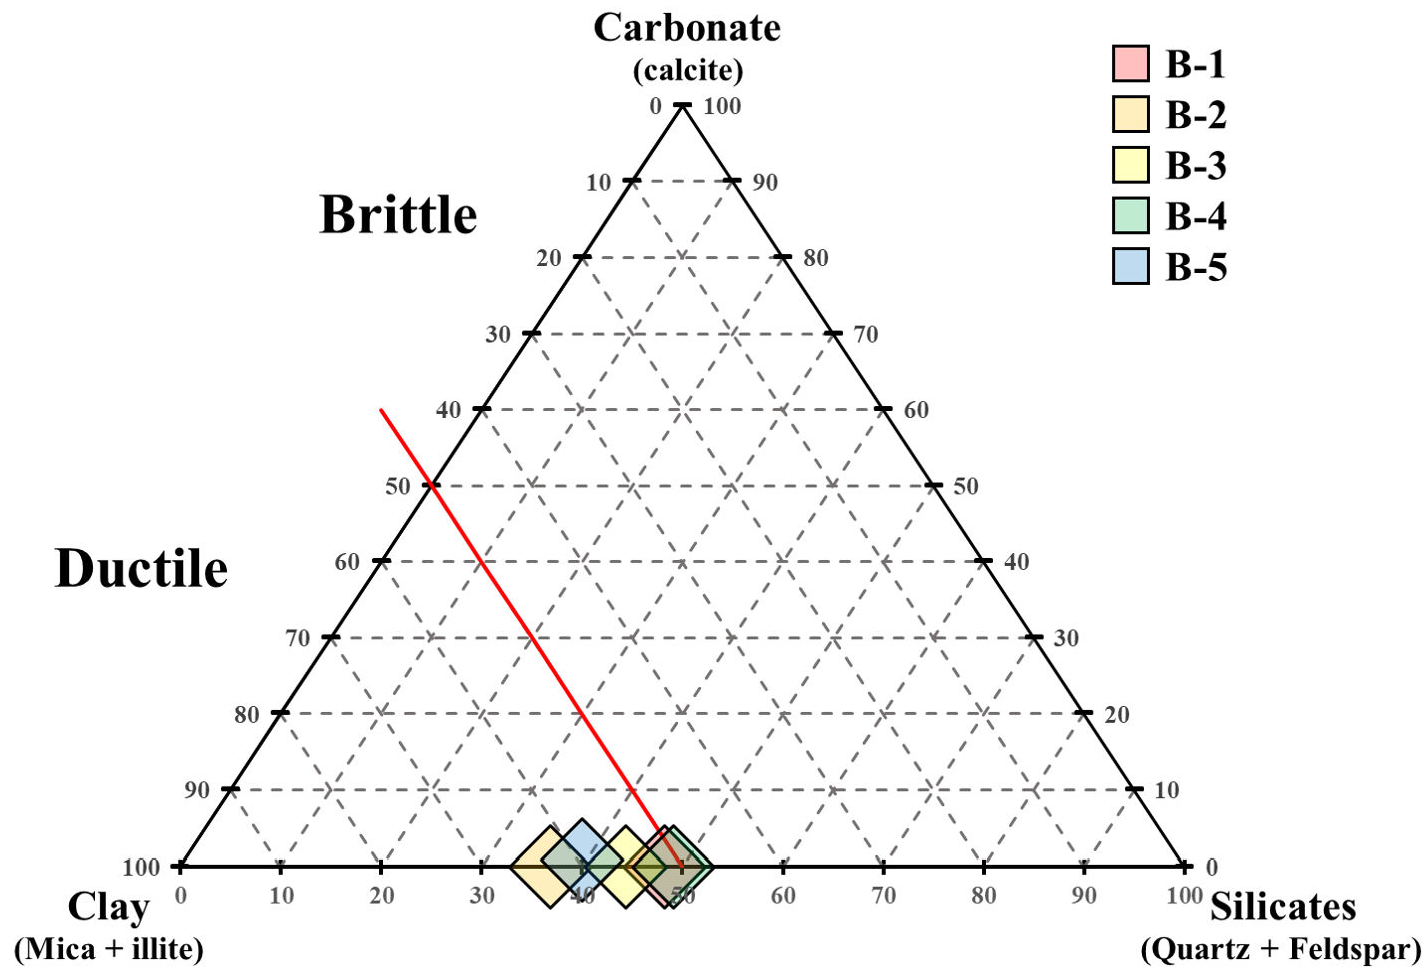
The corrected mineralogical compositions confirm that the B well caprocks are clay-dominant, with total clay content (primarily mica/illite and chlorite) ranging from 50.85% (B-4) to 63.19% (B-2). This clay-rich nature is consistent with the nanopore-dominated pore structures observed in the MICP analysis, supporting the development of a ductile matrix favorable for sealing. Quartz and feldspar contents range from 26.22 to 35.44% and 9.04–13.71%, respectively, while carbonates are negligible, with trace calcite (0.7%) found only in B-5.
As illustrated in the ternary diagram (Figure 10), all samples plot firmly within the ductile mineralogical domain. In Figure 10, the red line represents an operational mineralogical reference boundary at 50 wt.% clay used to visualize the relative clay-rich versus silicate-rich character of the B-well samples. This boundary is not interpreted as a universal mechanical failure threshold; rather, the mineralogical brittleness indices are used as first-order proxies for relative compositional tendencies toward brittle or ductile behavior [28,29,30,39]. Based on these corrected fractions, the brittleness indices (BIM1, BIM2) were calculated to assess fracture susceptibility (Table 2). BIM1 values range from 0.29 to 0.41, while BIM2 values range from 0.37 to 0.49. Sample B-4, having the highest quartz and feldspar content, exhibits the highest brittleness, suggesting a higher potential for brittle deformation or microfracture development under elevated CO2 injection pressures. Conversely, sample B-2, with its highest clay content (63.19%), shows the lowest brittleness, reflecting a relatively more ductile mineralogical composition that may be favorable for deformation accommodation and reduced fracture susceptibility. This comparative analysis demonstrates the critical necessity of correcting for drilling-induced artifacts when evaluating mineralogy from drill cuttings. The sensitivity-corrected dataset indicates that the B-well caprocks possess a generally clay-rich and relatively ductile composition, which is compatible with the fine pore-throat structures and enhanced MICP-derived capillary resistance observed in the deeper intervals.

5. Discussion: Comparative Evaluation of Sealing Capacity and Fluid-System Effects

5.1. Maximum Allowable CO2 Column Height
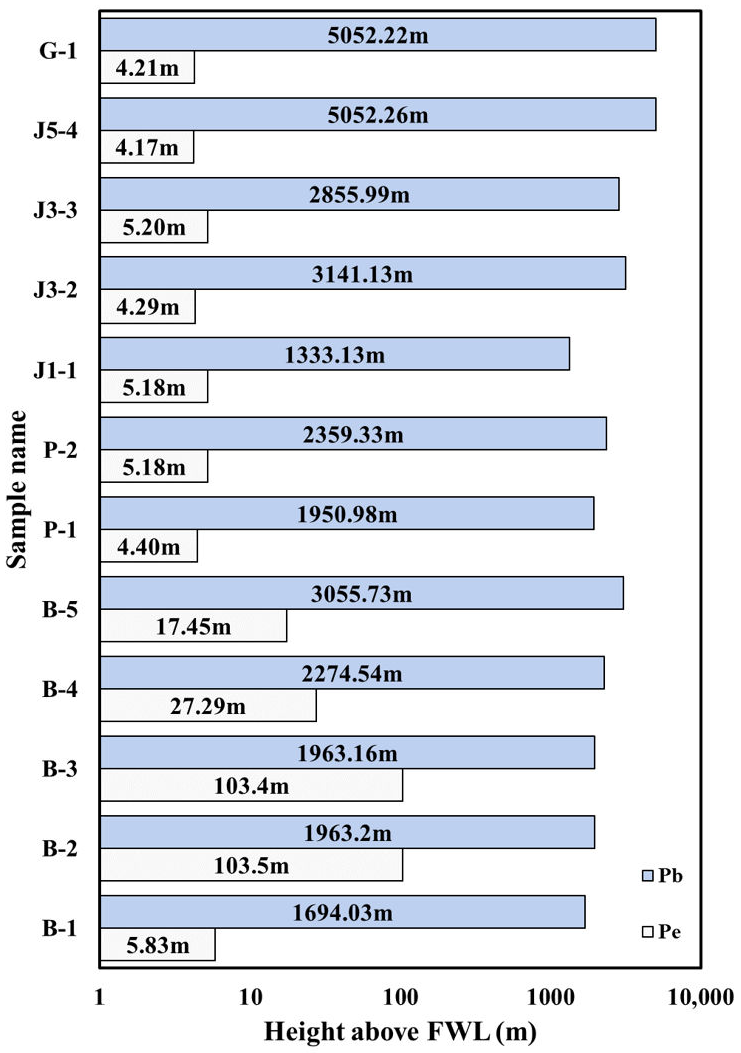
We compared the maximum allowable CO2 column heights for the 12 drill-cutting samples at a contact angle of 0°, derived from FWL-water-saturation analysis (Figure 11). Across all samples, the calculated CO2 column height increased sharply as the reference pressure shifted from pore entry pressure (Pe) to the operationally defined MICP breakthrough pressure (Pb). Whereas Pe reflects the onset of non-wetting-phase invasion, Pb represents a later stage of mercury intrusion through the connected pore system; therefore, the Pb-based values provide an additional comparative indicator of capillary resistance rather than a direct in situ CO2-brine breakthrough threshold [16]. The CO2 column heights estimated at Pe range from 4.17 to 103.50 m. Notably, B-2 and B-3 exhibit higher column heights of approximately 103 m, indicating greater resistance to initial pressure, whereas most other samples (4.17 to 27.29 m) were more susceptible to initial fluid entry. At the breakthrough stage (Pb), however, the storage potential varied widely from 1333.13 to 5052.26 m. In the B well, CO2 column height increased consistently with depth (from 1694.03 to 3055.73 m), consistent with enhanced relative capillary resistance potentially associated with burial-related compaction and pore-throat refinement. In contrast, the J3 well showed non-linear behavior, suggesting that local stratigraphic heterogeneity and mineralogical variations override simple depth-dependent compaction effects. Overall, G-1 and J5-4 represent the most robust sealing intervals, with CO2 column heights of approximately 5052 m, whereas J1-1 (1333.13 m) is identified as a potentially vulnerable sealing interval.
Figure 11. Comparison of maximum allowable CO2 column heights for all analyzed caprock samples, calculated based on pore entry pressure (Pe) and breakthrough pressure (Pb).
Processes 14 02515 g011
Previous studies have evaluated caprock sealing capacity using MICP-derived capillary pressure data; however, the reported maximum allowable CO2 column heights vary depending on the capillary pressure criterion adopted for the analysis. For example, a study of the Tuscaloosa Marine Shale reported maximum allowable CO2 column heights of approximately 20–260 m based on mercury entry pressure (Pe) using MICP analyses [15]. In the present study, the estimated CO2 column heights at Pe range from 4.17 to 103.50 m, which are of a comparable order of magnitude.
A further comparison can be made with the Mercia Mudstone Group in the United Kingdom, for which mineralogical, petrological, and mercury injection porosimetry analyses reported potential supercritical CO2 column heights of approximately 70–540 m [40]. In that study, clay-rich, illite-bearing samples exhibited smaller mean pore-throat diameters and higher threshold capillary entry pressures than coarser-grained samples containing abundant pore-filling carbonate and gypsum cements. The Pe-based values obtained in the present study (4.17–103.50 m) overlap the lower part of the Mercia range but are generally lower. This agreement in the association between fine-grained, clay-rich character and capillary resistance is consistent with the nanopore-dominated pore systems observed in several South Sea Shelf Basin samples. However, the lower Pe-based estimates in the present study may reflect lithological heterogeneity, differences in pore-throat connectivity and mineralogical composition, contrasting burial and diagenetic histories, and the use of drill-cuttings rather than intact core samples. These comparisons indicate that clay abundance alone does not determine caprock performance; rather, sealing capacity depends on the combined effects of pore-throat architecture, mineralogical composition, diagenetic modification, and sample representativeness.
In addition, this study further evaluates breakthrough pressure (Pb), yielding substantially larger maximum allowable CO2 column heights (1333–5052 m). Because Pb represents the capillary threshold after complete penetration of the connected pore network, whereas Pe represents the onset of non-wetting phase invasion, these two criteria should not be directly compared. The Pb-based evaluation therefore provides an additional comparative perspective on capillary resistance beyond the initial entry-pressure criterion [41]. Nevertheless, the CO2 column heights calculated in this study should be interpreted as MICP-derived, CO2-brine-scaled estimates rather than direct measurements of the maximum sustainable CO2 column height. The conversion from the Hg-air system to the CO2-brine system is based on assumed interfacial tension and contact-angle values and may be influenced by reservoir temperature, pressure, brine composition, mineralogical heterogeneity, and in situ effective stress. Accordingly, the calculated values are most useful for relative comparison among wells and depth intervals, whereas their absolute magnitudes require validation through direct CO2-brine displacement experiments on water-saturated intact core plugs [41,42].

5.2. Maximum Allowable Oil Column Height

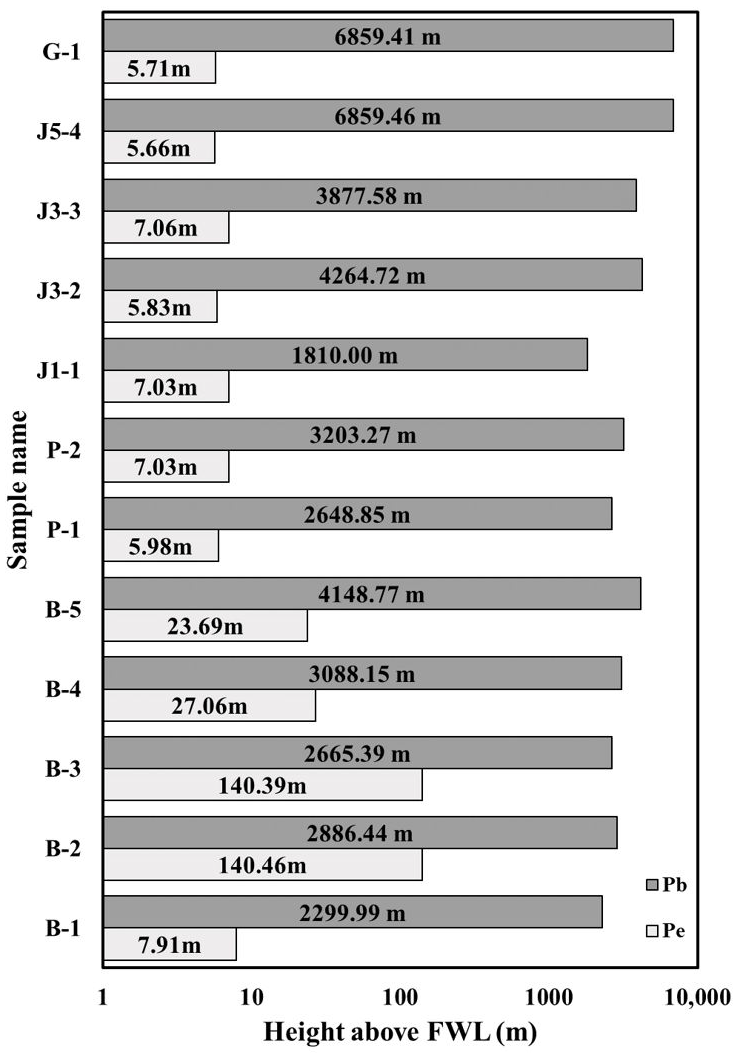
We further estimated the maximum allowable oil column height by applying a contact angle of 45° to simulate the oil-brine system, utilizing the fluid system conversion and capillary buoyancy equilibrium relationships defined in Equations (2) and (3), respectively (Figure 12). Under reservoir conditions, oil density generally varies between 0.70 and 1.0 g/cm3 [43], and the ρ o i l = 0.85 g/cm3 adopted in this study corresponds to the median of this range, which is well substantiated by the representative fluid density spectrum (0.5–1.0 g/cm3) established by [2]. The brine–oil interfacial tension varies with crude-oil composition, brine chemistry, temperature, and pressure [44]. For the present sensitivity-based calculation, a value of σ b r i n e / O i l = 25 dyne/cm was adopted as an assumed input parameter; therefore, the resulting oil-column heights should be interpreted as model-based comparative estimates rather than unique reservoir-specific predictions [2,22]. Furthermore, although reservoir rocks are conventionally considered water-wet [45], actual subsurface reservoirs can exhibit mixed-wettability or oil-wet states over geological timescales [46]. Therefore, it should be noted that the completely water-wet assumption (θ = 0°) always provides the theoretical maximum column height, making our choice of an intermediate contact angle of 45° a more realistic and conservative baseline for caprock sealing evaluation (Table 3). The results reveal a clear increase in containment capacity from the pore entry pressure stage (Pe; 5.66–140.46 m) to the breakthrough pressure stage (Pb; 1810.00–6859.46 m), indicating that capillary resistance increases substantially as fluids penetrate the entire pore network rather than only the initial pore-throats.
Figure 12. Comparison of maximum allowable oil column heights for all analyzed caprock samples, calculated based on pore entry pressure (Pe) and breakthrough pressure (Pb).
Processes 14 02515 g012
Table 3. Physical properties utilized for the oil-brine fluid system conversion of MICP data, including interfacial tension (σ), contact angle (θ), and fluid density (ρ).
Parameter ρ o i l σ b r i n e / O i l θ b r i n e / O i l
Unitg/cm3dyne/cmDegree
Value0.852545
Although the oil-brine calculation provides an additional perspective on multiphase capillary sealing behavior, these estimates are likewise derived from MICP data and depend on the assumed fluid properties and wettability conditions. The methodological implications and limitations of MICP-based fluid-system conversion are discussed in the following section.

5.3. Methodological Implications and Limitations of MICP-Derived CO2-Brine Threshold Pressure

The MICP-derived capillary-pressure data used in this study provide a practical framework for evaluating pore-throat structure and comparing the relative sealing capacity of caprock intervals where intact core material is unavailable. By applying the same MICP procedure and consistent CO2-brine fluid-property assumptions to all drill-cutting samples, the present analysis identifies substantial spatial and depth-dependent heterogeneity in the South Sea Shelf Basin. The MICP-derived Hg-air breakthrough pressures (Pb) range from 75 to 283 MPa. After conversion to the assumed CO2-brine fluid system, the corresponding Pb-based maximum allowable CO2 column heights range from 1333 to 5052 m. These results are therefore useful for relative ranking of the investigated intervals, identifying G-1 and J5-4 as high-sealing-capacity candidates and J1-1 as a comparatively lower-capacity interval.
However, MICP-derived threshold pressures should not be considered equivalent to directly measured CO2-brine breakthrough pressures. In MICP analysis, mercury intrusion is performed in an Hg-air system, and the resulting capillary pressures are subsequently converted to CO2-brine conditions through the Young-Laplace/Washburn scaling relationship. This conversion requires assumed values for the CO2-brine interfacial tension and rock-brine-CO2 contact angle. In the present study, an interfacial tension of 26 dyne/cm and a contact angle range of 0–60° were applied to account for possible wettability variations under subsurface CO2 storage conditions [17,18,19,22,23].
Recent comparative experiments have demonstrated that MIP-derived CO2 drainage estimates can differ substantially from direct gas-water/brine threshold-pressure measurements. For example, Soomro et al. [41] reported direct threshold pressures of 0.40 and 0.24 MPa for two core samples under a confining pressure of 15 MPa, whereas the corresponding MIP-derived CO2 drainage estimates were 0.10 and 0.05 MPa, respectively. This comparison demonstrates that a simple conversion of MIP data may not fully reproduce the capillary displacement behavior of a CO2-brine system under stress-controlled conditions.
Several factors may cause discrepancies between MICP-derived estimates and direct CO2-brine measurements, including differences in interfacial tension, wettability, fluid-displacement dynamics, pore accessibility, and effective-stress-dependent pore-throat geometry between the Hg-air and CO2-brine systems. In addition, CO2-brine-rock interactions can induce mineral dissolution and precipitation that modify pore-size distribution and pore connectivity and potentially alter caprock sealing behavior over time [47]. This is consistent with recent syntheses that document how post-injection CO2 leakage risk is governed by coupled geochemical, geomechanical, and monitoring considerations over the storage lifecycle [48]. An additional source of uncertainty in the present study is the use of drill-cuttings rather than intact core plugs. Cuttings provide an important practical alternative where continuous core is unavailable and can support spatially extensive screening of caprock intervals; however, their representativeness must be evaluated carefully. Bensing et al. [49] specifically examined whether cuttings can reliably predict caprock porosity, highlighting the need to assess the correspondence between cuttings and core-based properties before cuttings are used as substitutes for intact material. Complementary comparisons of porosity and permeability between drill cuttings and preserved cores, specifically for mudrock caprocks, further support cautious interpretation of cuttings-derived petrophysical data [50].
In the present study, drill cuttings were screened to a 1–4 mm size fraction, and the low-pressure conformance interval associated with surface irregularities and inter-fragment voids was excluded from the MICP interpretation. Nevertheless, drilling-induced damage, loss of original rock fabric and bedding orientation, possible mixing of lithological fragments, and residual inter-fragment voids may influence the measured intrusion behavior. Therefore, the present MICP results should be interpreted as comparative estimates of capillary sealing behavior among the investigated intervals, rather than as direct equivalents of intact-core CO2-brine breakthrough properties. Future direct comparison of matched cuttings and core plugs from the same stratigraphic intervals would be particularly valuable for calibrating the present cuttings-based framework.
Accordingly, the Pe- and Pb-based column heights presented here should be regarded as comparative, MICP-derived estimates of capillary sealing capacity rather than direct in situ limits of CO2 containment. Future work should prioritize direct CO2-brine breakthrough tests using water-saturated intact cores from representative caprock intervals, conducted under reservoir-relevant temperature, pore pressure, and effective stress conditions. Such experiments would enable calibration of the MICP-derived estimates and improve confidence in the absolute CO2 column heights inferred for the South Sea Shelf Basin [41,42].

6. Conclusions

By integrating Mercury Injection Capillary Pressure (MICP) and quantitative X-ray diffraction (XRD) analyses, this study evaluated the pore structure and capillary sealing characteristics of caprock drill cuttings collected from six wells in the South Sea Shelf Basin. The main findings are summarized as follows:
  • Caprock Sealing Characteristics from Drill Cuttings: The analyzed caprocks are characterized by predominantly nanopore-dominated pore systems and considerable spatial variability in capillary sealing performance. The observed variations indicate that pore structure, together with mineralogical characteristics, should be evaluated to achieve a more comprehensive assessment of caprock sealing quality.
  • Depth-Dependent Sealing Evolution: In the B well, capillary sealing performance generally improved with increasing burial depth, accompanied by progressive pore-throat refinement within a clay-rich mineralogical matrix. These observations are consistent with a possible contribution of burial-related compaction to the observed depth-dependent sealing trend; however, the present cutting-based dataset does not establish compaction as the sole controlling mechanism.
  • Implications for CO2 Storage Assessment: The combined application of MICP and quantitative XRD analyses demonstrates that drill cuttings provide a practical framework for the preliminary regional screening and comparative evaluation of caprock sealing quality where continuous core samples are unavailable. The MICP-derived CO2 column heights presented in this study are comparative estimates based on laboratory capillary pressure measurements and assumed fluid properties. Therefore, they should not be interpreted as direct predictions of field-scale storage capacity or allowable CO2 injection limits.

Author Contributions

C.L.: Manuscript writing, MICP testing, and data analysis; H.M.: Manuscript writing and caprock sealing capacity analysis; S.P.: Selection of caprock intervals by borehole and acquisition of drilled rock fragment samples; S.B.: Selection of caprock intervals by borehole and acquisition of drilled rock fragment samples; D.S.L.: Manuscript writing and caprock sealing capacity analysis. All authors have read and agreed to the published version of the manuscript.

Funding

The Korea National Oil Corporation (KNOC) is the official funding agency for this study; however, no specific grant or funding number is associated with this project.

Data Availability Statement

The datasets analyzed during the current study are proprietary assets of the Korea National Oil Corporation (KNOC) and are not publicly available due to corporate confidentiality policies. For further inquiries regarding the data, please contact the representatives from KNOC: Seik Paik and Sungin Bae.

Acknowledgments

This work was supported by Korea National Oil Corporation (KNOC) as part of the geological and geophysical evaluation of the South Sea of Korea.

Conflicts of Interest

Authors Seik Paik and Sungin Bae were employed by the “Domestic Business Development Department, Korea National Oil Corporation”. The remaining authors declare that the research was conducted in the absence of any commercial or financial relationships that could be construed as a potential conflict of interest. The authors declare that this study received funding from “the KNOC major research project”. The funder was not involved in the study design, collection, analysis, interpretation of data, the writing of this article, or the decision to submit it for publication.

References

  1. Li, J.; Chen, J.; Peng, J.; Ma, Y.; Gan, Q. Investigation of the Sealing and Mechanical Stability of Cap Rock for Offshore CO2 Sequestration in Saline Aquifers. Energies 2025, 18, 6033. [Google Scholar] [CrossRef]
  2. Schowalter, T.T. Mechanics of Secondary Hydrocarbon Migration and Entrapment. AAPG Bull. 1979, 63, 723–760. [Google Scholar] [CrossRef]
  3. Bjørlykke, K. Petroleum Geoscience: From Sedimentary Environments to Rock Physics; Springer: Berlin/Heidelberg, Germany, 2010. [Google Scholar] [CrossRef]
  4. Song, J.; Zhang, D. Comprehensive Review of Caprock-Sealing Mechanisms for Geologic Carbon Sequestration. Environ. Sci. Technol. 2013, 47, 9–22. [Google Scholar] [CrossRef] [PubMed]
  5. Chen, B.; Li, Q.; Tan, Y. Caprock Sealing for Geologic CO2 Storage: Research Advances, Challenges and Prospects. J. Rock Mech. Geotech. Eng. 2026, 18, 335–363. [Google Scholar] [CrossRef]
  6. Fjær, E.; Holt, R.M.; Horsrud, P.; Raaen, A.M. Petroleum Related Rock Mechanics, 2nd ed.; Elsevier: Amsterdam, The Netherlands, 2008. [Google Scholar] [CrossRef]
  7. Zoback, M.D.; Gorelick, S.M. Earthquake Triggering and Large-Scale Geologic Storage of Carbon Dioxide. Proc. Natl. Acad. Sci. USA 2012, 109, 10164–10168. [Google Scholar] [CrossRef] [PubMed]
  8. Shin, S.Y.; Kang, M.; Shinn, Y.J.; Cheong, S. Assessment of CO2 Geological Storage Capacity for Basalt Flow Structure around PZ-1 Exploration Well in the Southern Continental Shelf of Korea. Econ. Environ. Geol. 2020, 53, 33–43. [Google Scholar] [CrossRef]
  9. Lee, G.H.; Lee, B.; Kim, H.-J.; Lee, K.; Park, M.-H. The Geological CO2 Storage Capacity of the Jeju Basin, Offshore Southern Korea, Estimated Using the Storage Efficiency. Int. J. Greenh. Gas Control 2014, 23, 22–29. [Google Scholar] [CrossRef]
  10. Kim, S.-O.; Wang, S.; Lee, M. Evaluation of Hydrogeologic Seal Capacity of Mudstone in the Yeongil Group, Pohang Basin, Korea: Focusing on Mercury Intrusion Capillary Pressure Analysis. Econ. Environ. Geol. 2020, 53, 23–32. [Google Scholar] [CrossRef]
  11. Katz, A.J.; Thompson, A.H. Prediction of Rock Electrical Conductivity from Mercury Injection Measurements. J. Geophys. Res. 1987, 92, 599–607. [Google Scholar] [CrossRef]
  12. Daniel, R.F.; Kaldi, J.G. Evaluating Seal Capacity of Cap Rocks and Intraformationasl Barriers for CO2 Containment. In Carbon Dioxide Sequestration in Geological Media—State of the Science; Grobe, M., Pashin, J.C., Dodge, R.L., Eds.; American Association of Petroleum Geologists: Tulsa, OK, USA, 2009. [Google Scholar] [CrossRef]
  13. Busch, A.; Alles, S.; Gensterblum, Y.; Prinz, D.; Dewhurst, D.N.; Raven, M.D.; Stanjek, H.; Krooss, B.M. Carbon Dioxide Storage Potential of Shales. Int. J. Greenh. Gas Control 2008, 2, 297–308. [Google Scholar] [CrossRef]
  14. Krevor, S.; Blunt, M.J.; Benson, S.M.; Pentland, C.H.; Reynolds, C.; Al-Menhali, A.; Niu, B. Capillary Trapping for Geologic Carbon Dioxide Storage—From Pore-Scale Physics to Field-Scale Implications. Int. J. Greenh. Gas Control 2015, 40, 221–237. [Google Scholar] [CrossRef]
  15. Lohr, C.D.; Hackley, P.C. Using Mercury Injection Pressure Analyses to Estimate Sealing Capacity of the Tuscaloosa Marine Shale in Mississippi, USA: Implications for Carbon Dioxide Sequestration. Int. J. Greenh. Gas Control 2018, 78, 375–387. [Google Scholar] [CrossRef]
  16. IEA Greenhouse Gas R & D Programme; Bason, D.; Nourollah, H.; De Morton, S.; Watson, M.; Petho, G.; Maffeis, I.; Rieger, M.; O’Brien, G. Geological Storage of CO2: Seal Integrity Review; IEAGHG: Cheltenham, UK, 2024. [Google Scholar] [CrossRef] [PubMed]
  17. Washburn, E.W. The Dynamics of Capillary Flow. Phys. Rev. 1921, 17, 273–283. [Google Scholar] [CrossRef]
  18. Laplace, P.S. Traité de Mécanique Céleste; de l’Imprimerie de Crapelet: Paris, France, 1799. [Google Scholar]
  19. Young, T., III. An Essay on the Cohesion of Fluids. Philos. Trans. R. Soc. 1805, 95, 65–87. [Google Scholar] [CrossRef]
  20. Wang, S.; Javadpour, F.; Feng, Q. Confinement Correction to Mercury Intrusion Capillary Pressure of Shale Nanopores. Sci. Rep. 2016, 6, 20160. [Google Scholar] [CrossRef] [PubMed]
  21. Watts, N.L. Theoretical Aspects of Cap-Rock and Fault Seals for Single- and Two-Phase Hydrocarbon Columns. Mar. Pet. Geol. 1987, 4, 274–307. [Google Scholar] [CrossRef]
  22. Min, H.; Lee, C.; Lee, D. Assessment of Sealing Capacity of Caprock Candidate Formations for Each Borehole in the South Sea Continental Shelf. J. Geol. Soc. Korea 2026, 62, 135–147. [Google Scholar] [CrossRef]
  23. Arif, M.; Al-Yaseri, A.Z.; Barifcani, A.; Lebedev, M.; Iglauer, S. Impact of Pressure and Temperature on CO2-Brine-Mica Contact Angles and CO2-Brine Interfacial Tension: Implications for Carbon Geo-Sequestration. J. Colloid Interface Sci. 2016, 462, 208–215. [Google Scholar] [CrossRef] [PubMed]
  24. Khan, M.J.; Mahmood, S.M.; Alakbari, F.S.; Siddiqui, N.A.; Ridha, S.; Shafiq, M.U. Rock Wettability and Its Implication for Caprock Integrity in CO2–Brine Systems: A Comprehensive Review. Energy Fuels 2024, 38, 19966–19991. [Google Scholar] [CrossRef]
  25. Bragg, W.H.; Bragg, W.L. The Reflection of X-Rays by Crystals. Proc. R. Soc. A 1913, 88, 428–438. [Google Scholar] [CrossRef]
  26. Zhou, X.; Liu, D.; Bu, H.; Deng, L.; Liu, H.; Yuan, P.; Du, P.; Song, H. XRD-based quantitative analysis of clay minerals using reference intensity ratios, mineral intensity factors, Rietveld, and full pattern summation methods: A critical review. Solid Earth Sci. 2018, 3, 16–29. [Google Scholar] [CrossRef]
  27. Jarvie, D.M.; Hill, R.J.; Ruble, T.E.; Pollastro, R.M. Unconventional Shale-Gas Systems: The Mississippian Barnett Shale of North-Central Texas as One Model for Thermogenic Shale-Gas Assessment. AAPG Bull. 2007, 91, 475–499. [Google Scholar] [CrossRef]
  28. Lai, J.; Wang, G.; Huang, L.; Li, W.; Ran, Y.; Wang, D.; Zhou, Z.; Chen, J. Brittleness Index Estimation in a Tight Shaly Sandstone Reservoir Using Well Logs. J. Nat. Gas Sci. Eng. 2015, 27, 1536–1545. [Google Scholar] [CrossRef]
  29. Bourg, I.C. Sealing Shales versus Brittle Shales: A Sharp Threshold in the Material Properties and Energy Technology Uses of Fine-Grained Sedimentary Rocks. Environ. Sci. Technol. Lett. 2015, 2, 255–259. [Google Scholar] [CrossRef]
  30. Katsube, T.J.; Williamson, M.A. Effects of Diagenesis on Shale Nano-Pore Structure and Implications for Sealing Capacity. Clay Miner. 1994, 29, 451–461. [Google Scholar] [CrossRef]
  31. Jia, W.; Du, G.; Bian, C.; Dang, W.; Dong, J.; Wang, H.; Zhu, L.; Wen, Y.; Pan, B. Characteristics of Pore—Throat Structures and Impact on Sealing Capacity in the Roof of Chang 73 Shale Oil Reservoir, Ordos Basin. Minerals 2026, 16, 12. [Google Scholar] [CrossRef]
  32. Gaus, I. Role and Impact of CO2—Rock Interactions during CO2 Storage in Sedimentary Rocks. Int. J. Greenh. Gas Control 2010, 4, 73–89. [Google Scholar] [CrossRef]
  33. Khan, M.N.; Siddiqui, S.; Thakur, G.C. Recent Advances in Geochemical and Mineralogical Studies on CO2–Brine–Rock Interaction for CO2 Sequestration: Laboratory and Simulation Studies. Energies 2024, 17, 3346. [Google Scholar] [CrossRef]
  34. Wiprut, D.; Zoback, M.D. Fault Reactivation, Leakage Potential, and Hydrocarbon Column Heights in the Northern North Sea. In Norwegian Petroleum Society Special Publications; Elsevier: Amsterdam, The Netherlands, 2002; Volume 11, pp. 203–219. [Google Scholar] [CrossRef]
  35. Lu, J.; Milliken, K.; Reed, R.M.; Hovorka, S. Diagenesis and Sealing Capacity of the Middle Tuscaloosa Mudstone at the Cranfield Carbon Dioxide Injection Site, Mississippi, USA. Environ. Geosci. 2011, 18, 35–53. [Google Scholar] [CrossRef]
  36. Newell, P.; Martinez, M.J. Numerical assessment of fault impact on caprock seals during CO2 sequestration. Int. J. Greenh. Gas Control 2020, 94, 102890. [Google Scholar] [CrossRef]
  37. Garcia, X.; Akanji, L.T.; Blunt, M.J.; Matthai, S.K.; Latham, J.P. Numerical Study of the Effects of Particle Shape and Polydispersity on Permeability. Phys. Rev. E 2009, 80, 021304. [Google Scholar] [CrossRef] [PubMed]
  38. Busch, A.; Amann-Hildenbrand, A. Predicting capillarity of mudrocks. Mar. Pet. Geol. 2013, 45, 208–223. [Google Scholar] [CrossRef]
  39. Mews, K.S.; Alhubail, M.M.; Barati, R.G. A Review of Brittleness Index Correlations for Unconventional Tight and Ultra-Tight Reservoirs. Geosciences 2019, 9, 319. [Google Scholar] [CrossRef]
  40. Armitage, P.J.; Worden, R.H.; Faulkner, D.R.; Aplin, A.C.; Butcher, A.R.; Espie, A.A. Mercia Mudstone Formation caprock to carbon capture and storage sites: Petrology and petrophysical characteristics. J. Geol. Soc. 2013, 170, 119–132. [Google Scholar] [CrossRef]
  41. Soomro, A.N.; Anioł, Ł.; Kudasik, M.; Dąbrowski, K.; Nagy, S. Comparative analysis of capillary threshold pressure measurement techniques: Mercury intrusion porosimetry vs. innovative measuring tool for carbon storage. Front. Energy Res. 2025, 13, 1518424. [Google Scholar] [CrossRef]
  42. Vespo, V.S.; Messori, A.; Musso, G. Threshold capillary pressure of caprocks for CO2 storage: Numerical insight on the dynamic and residual method. Int. J. Greenh. Gas Control 2024, 135, 104135. [Google Scholar] [CrossRef]
  43. Danesh, A. PVT and Phase Behaviour of Petroleum Reservoir Fluids; Elsevier: Amsterdam, The Netherlands, 1998; Volume 47, pp. 1–388. [Google Scholar] [CrossRef]
  44. Karolytė, R.; Johnson, G.; Yielding, G.; Gilfillan, S.M.V. Fault Seal Modelling—The Influence of Fluid Properties on Fault Sealing Capacity in Hydrocarbon and CO2 Systems. Pet. Geosci. 2020, 26, 481–497. [Google Scholar] [CrossRef]
  45. Vavra, C.L.; Kaldi, J.G.; Sneider, R.M. Geological Applications of Capillary Pressure: A Review. AAPG Bull. 1992, 76, 840–850. [Google Scholar] [CrossRef]
  46. Treiber, L.E.; Owens, W.W. A Laboratory Evaluation of the Wettability of Fifty Oil-Producing Reservoirs. SPE J. 1972, 12, 531–540. [Google Scholar] [CrossRef]
  47. Mouzakis, K.M.; Navarre-Sitchler, A.K.; Rother, G.; Bañuelos, J.L.; Wang, X.; Kaszuba, J.P.; Heath, J.E.; Miller, Q.R.S.; Alvarado, V.; McCray, J.E. Experimental Study of Porosity Changes in Shale Caprocks Exposed to CO2-Saturated Brines I: Evolution of Mineralogy, Pore Connectivity, Pore Size Distribution, and Surface Area. Environ. Eng. Sci. 2016, 33, 725–735. [Google Scholar] [CrossRef]
  48. Zhu, Y.; He, Z.; Wang, H.; Liu, Y. CO2 leakage in geologic carbon storage: A review of its impacts and detection. Chem. Eng. J. 2025, 523, 168423. [Google Scholar] [CrossRef]
  49. Bensing, J.P.; Misch, D.; Skerbisch, L.; Hujer, W.; Gumpenberger, T. Cuttings vs Cores: Are Cuttings a Reliable Predictor of Caprock Porosity? Geoenergy Sci. Eng. 2026, 257, 214180. [Google Scholar] [CrossRef]
  50. Bin Sazali, W.M.L.; Busch, A. Comparison of Porosity and Permeability from Drill Cuttings and Core Samples for Mudrocks: A Proof of Concept Study. In Proceedings of the SPE Asia Pacific Oil and Gas Conference and Exhibition, Adelaide, Australia, 17–19 October 2022; p. SPE-210755-MS. [Google Scholar] [CrossRef]
Figure 1. Regional map showing the locations of the six studied wells within the South Sea Shelf Basin. White, yellow, and gray regions indicate the major basins, minor depressions, and paleo-uplifts, respectively.
Processes 14 02515 g001
Figure 2. Vertical distribution of drill-cutting samples within the identified caprock intervals of six wells in the South Sea continental shelf. Symbols indicate samples collected and analyzed by MICP and/or XRD.
Processes 14 02515 g002
Figure 3. Photographs of representative drill cutting samples collected from the B well at different depth intervals.
Processes 14 02515 g003
Figure 4. Conceptual model of caprock sealing mechanism based on the balance between buoyancy and capillary pressure (the red arrow indicates CO2 breakthrough through the caprock pore system).
Processes 14 02515 g004
Figure 5. Pore-throat size distribution curves for representative caprock samples from each studied borehole, illustrating variations in pore structure characteristics and the overall dominance of nanopores (<1 μm).
Processes 14 02515 g005
Figure 8. Comparative MICP injection curves of two distinct caprock samples: (a) sample P-2 and (b) sample J1-1. The plots demonstrate differences in mercury intrusion behavior and the resulting petrophysical parameters, including pore entry pressure (Pe), displacement pressure (Pd), and breakthrough pressure (Pb).
Processes 14 02515 g008
Figure 9. Sensitivity analysis of maximum allowable CO2 column height as a function of contact angle (θbrine/CO2 = 0–60°) demonstrating the impact of wettability variations on caprock sealing capacity for (a) caprock sample B-3 and (b) caprock sample J1-1.
Processes 14 02515 g009
Figure 10. Ternary diagram illustrating the mineralogical classification of B well caprock samples based on relative weight fractions of clay, carbonate, and silicates.
Processes 14 02515 g010
Table 1. Physical properties utilized for the fluid system conversion of MICP data, including interfacial tensions (σ), contact angles (θ), and fluid densities ( ρ ).
Parameter σ b r i n e / C O 2 σ a i r / H g θ b r i n e / C O 2 θ a i r / H g ρ b ρ C O 2
Unitdyne/cmdyne/cmDegreeDegreeg/cm3g/cm3
Value264850–601401.050.65
Table 2. Mineralogical composition (weight %) and calculated brittleness indices (BIM1, BIM2) for B well caprock samples derived from quantitative XRD analysis.
BoreholeB Well
Mineral CompositionSample NameB-1B-2B-3B-4B-5
CalciteSemi-Quant (%)----0.70
Quartz34.8626.2235.3635.4427.38
Feldspar13.3710.589.0413.7112.17
ClayS51.7863.1955.6050.8559.52
Brittleness Index (BIM1)0.400.290.390.410.31
Brittleness Index (BIM2)0.480.370.440.490.40
Disclaimer/Publisher’s Note: The statements, opinions and data contained in all publications are solely those of the individual author(s) and contributor(s) and not of MDPI and/or the editor(s). MDPI and/or the editor(s) disclaim responsibility for any injury to people or property resulting from any ideas, methods, instructions or products referred to in the content.