1. Introduction
Biomass is the Renewable Energy Source (RES) with the greatest potential to contribute to global energy needs and to the fight against the climate crisis [
1]. Advanced biofuels derived from feedstocks that do not compete with food and feed, such as agricultural and forest residues and biogenic wastes, are a promising, sustainable and environmentally friendly alternative to fossil fuels. Their contribution is especially important to the decarbonisation of hard-to-abate sectors [
2], while valorization of low-value hard-to-utilise waste streams also enhances the circular economy. In the face of global energy challenges, efficient and flexible conversion pathways, adaptable to volatile feedstock supply and product demand, have a key role in achieving decarbonization. A flexible concept able to switch between the co-production of biochar and synthetic natural gas (SNG) and the maximisation of SNG production, offers a strategic response to feedstock and price uncertainty.
Gasification is a key biomass conversion technology in which syngas, the main process output, can serve as feedstock for the synthesis of products, including liquid and gaseous biofuels such as synthetic natural gas. Most importantly, gasification is a viable option for valorising challenging biogenic feedstocks, such as agricultural residues and biowastes, into value-added energy carriers or chemicals [
3,
4]. Moreover, because both syngas production and its conversion into valuable chemicals and fuels are carried out at high temperatures, the excess heat can be recovered for district heating, industrial symbiosis, or electricity production, giving rise to highly efficient polygeneration schemes [
5]. Among the more interesting combinations of end products is the co-production of biochar together with syngas via gasification, although biochar can alternatively be produced through pyrolysis [
6,
7]. Biochar and syngas co-production through gasification has the potential to sequester carbon long-term and produce a high-quality syngas that is upgraded into bioproducts with negative carbon emissions. Yao et al. [
8] presented a kinetic-based mathematical model to simulate biomass gasification for the production of syngas and biochar, whereas Zhou presented a kinetic gasification model developed in Aspen Plus [
9]. At the system level, Wang and Jin [
10] explored the performance of a biomass gasification system co-producing biochar, heat, and electricity. A polygeneration system combining the production of biochar and SNG, however, has not yet been studied.
The global demand for natural gas is expected to rise over the coming decades, driven mainly by growing power generation from natural gas, the “transition fuel” of the decarbonisation era. Biomethane (or bio-SNG) can be produced through either anaerobic digestion or gasification [
11] and, when injected into the pipeline, can reduce the environmental footprint of a natural gas network. Although biogas upgrading is the commercially established route to biomethane [
12], the capacity of such plants is limited to a few MWth. Large-scale (tens or hundreds of MWth) bio-SNG production can instead be achieved through biomass gasification. Although many studies have addressed such biomass-to-SNG configurations, recent advances in key components of the process, such as the gasifier and the catalytic reformer, warrant further investigation at the system level. Moreover, the vast majority of these studies rely on woody biomass, for which its heating value, ash, and moisture contents are favourable for gasification.
Process simulation is a valuable tool for assessing novel biorefinery concepts. It allows the overall system performance to be evaluated in terms of energy and material efficiency and helps identify the critical design aspects for optimal operation. A range of simulation studies on SNG production through biomass gasification has been reported, proposing various concepts with respect to gasification technology, syngas cleaning, the use of external electrolytic H
2, and excess-heat utilisation; these are summarised in
Table 1.
The main objective of this study is to present novel gasification-based pathways for converting low-cost but challenging biogenic residues and waste streams, such as bark and Solid Recovered Fuel (SRF), into biomethane, biochar, and heat and to evaluate the overall process performance and energy efficiency. These novel thermochemical concepts are based on the capability of specific fluidized bed gasifiers to operate efficiently with a wide range of feedstocks, thereby enabling flexible operation through switching between different feedstock types according to their availability and the prevailing demand for biomethane, biochar, and heat. Particular attention is given to recent advances in syngas production enabled by innovative gasification strategies and the application of advanced catalysts for tar reforming, which allow for higher conversions and overall energy efficiencies. To date, the performance of these concepts has not been systematically evaluated at the integrated system level. To address this gap, several process configurations incorporating different operation modes and feedstocks are modelled and simulated in Aspen Plus in order to assess the influence of these key process parameters on the overall system performance, including SNG and biochar production, overall plant efficiency, and total carbon utilisation.
2. Materials and Methods
Within the European Union (EU)-funded FlexSNG project [
30], a flexible and cost-effective gasification-based process is being developed for the production of pipeline-quality bio-SNG, high-value biochar, and renewable heat from a wide variety of low-quality biomass residues and biogenic waste feedstocks. This flexibility refers to the ability of the plant to handle different feedstocks and to operate under various conditions as required. The gasification concept follows a “one plant, two modes” approach, in which the plant can switch between the co-production of biomethane, biochar, and heat (co-production mode) and the maximised production of biomethane and heat (maximization mode). The key idea is that a single plant can adapt to changes in market conditions (e.g., biochar demand) or in feedstock availability and price by switching operation mode, thereby maximising plant revenue throughout the year.
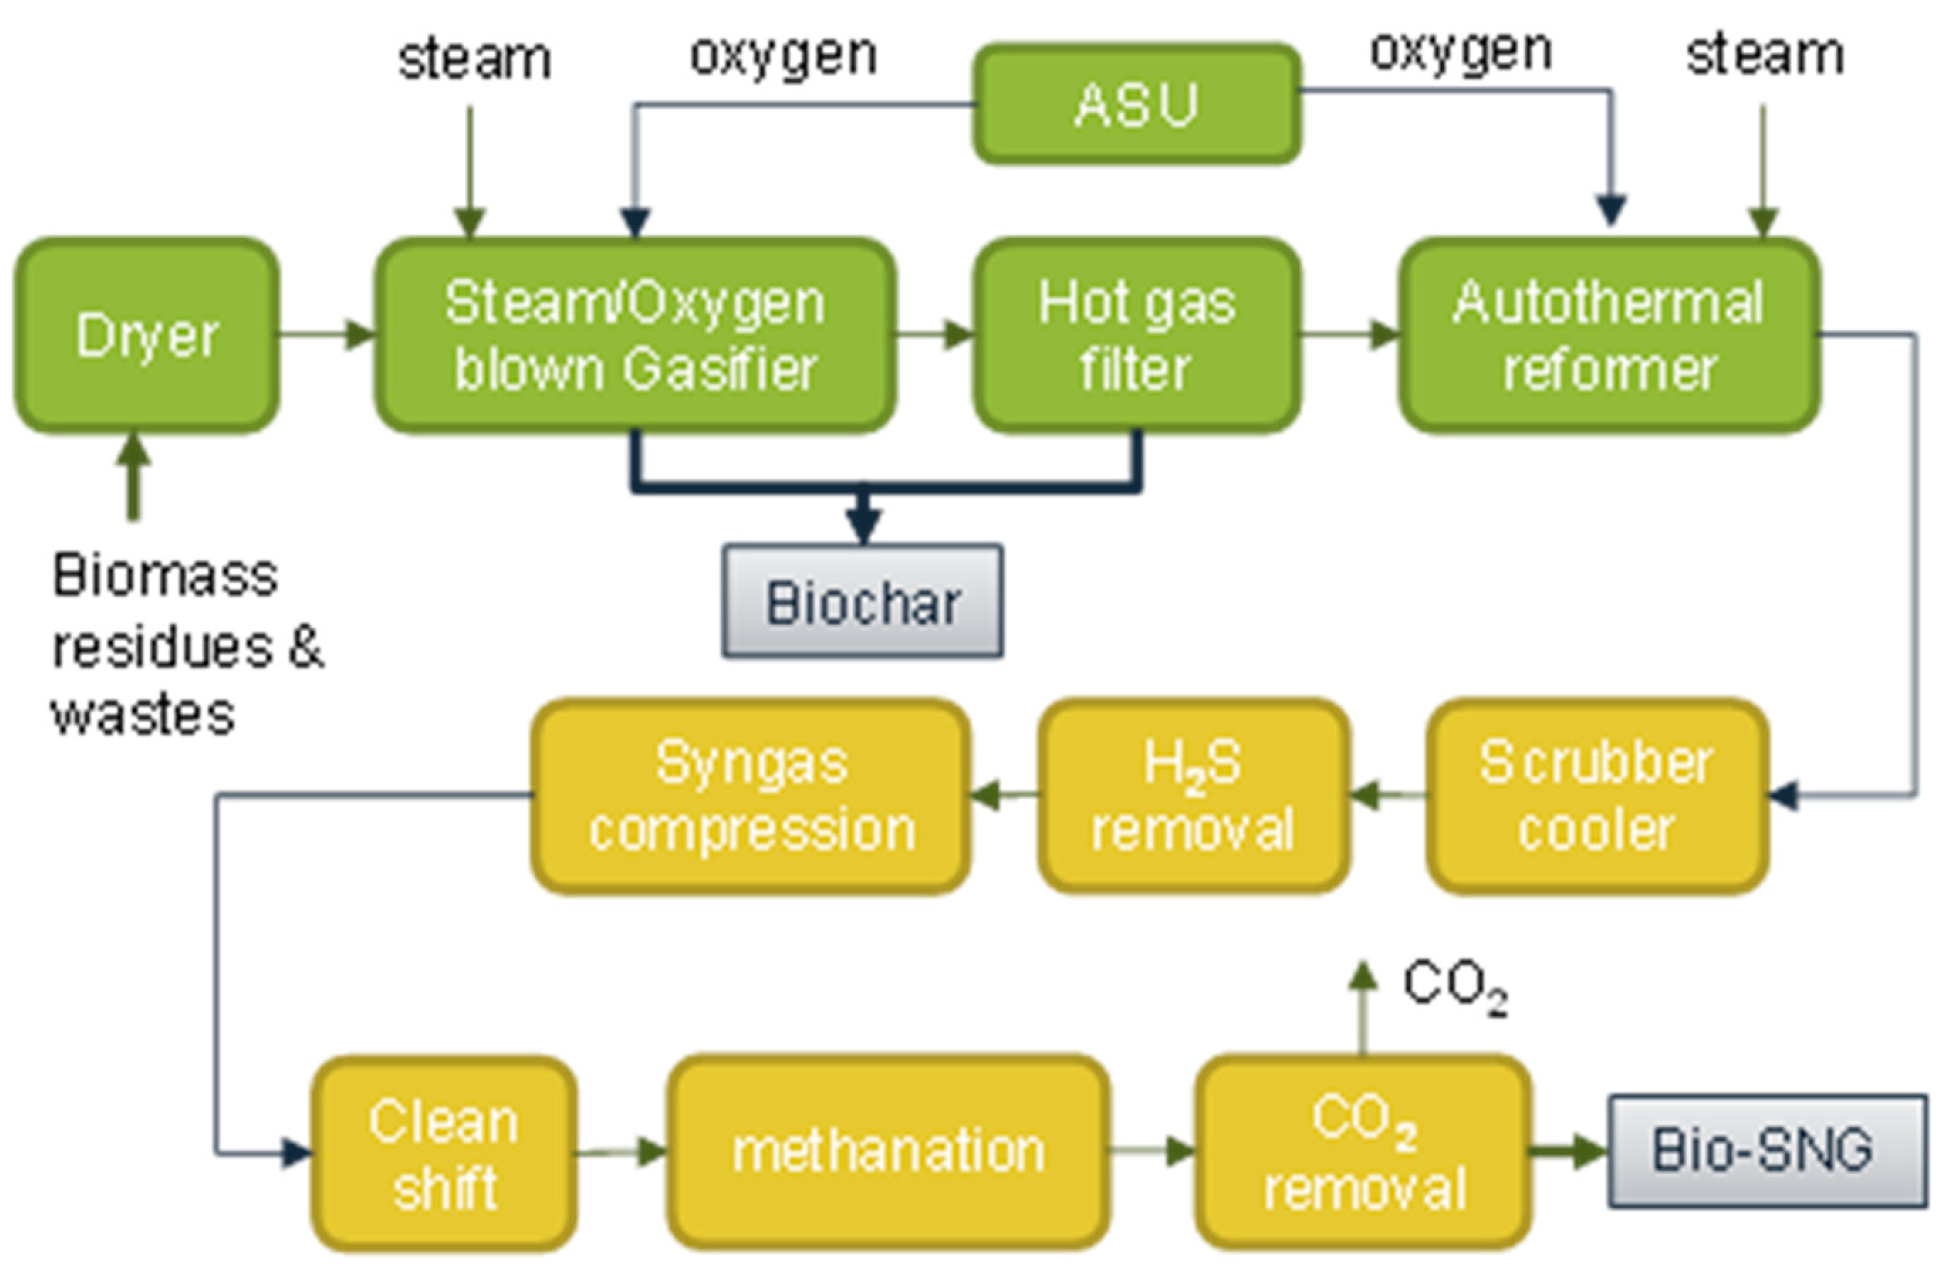
The overall system can be divided into three main parts. The first (the gasification part) comprises all steps for converting biomass into syngas and biochar, namely drying and pre-treatment, steam/O
2 gasification, removal of solids (ash and char) from the raw syngas by a ceramic gas filter, and tar removal in an Autothermal Reformer (ATR). The production of pure (99.5%
v/
v) oxygen in an Air Separation Unit (ASU) is also considered. The second part comprises the remaining syngas-cleaning steps (a two-stage water-scrubber cooler for NH
3 removal, and H
2S removal by activated carbon and ZnO adsorbents), the methanation process, and bio-SNG purification, in which water and CO
2 are removed. Where required, a shift reactor is placed between the syngas compressor and the methanation reactors to achieve a H
2/CO molar ratio of 3. This target of H
2/CO = 3 follows directly from the stoichiometry of CO hydrogenation (R1): operating the methanation process at this ratio maximises methane yield while minimising the unreacted CO or excess H
2 that would otherwise lower process efficiency [
31] and reduce the methane concentration in the final product stream after water and CO
2 removal.
The third part includes the heat exchangers network, recuperating excess heat to produce hot water and steam for further use either within the process or externally for district heating and to cover industry needs.
As noted above, feedstock and operation flexibility are key features of the FlexSNG plant, enabling its deployment in both rural and urban environments. On this basis, the three developed process configurations (concepts) are presented below.
In the biorefinery concept, the plant (
Figure 1) can be integrated with existing forest industries or agricultural sites, using their side streams as feedstock and supplying steam for industrial use. Such feedstocks have been widely considered in decarbonisation and circular-economy-based studies [
32] and are expected to yield biochar of good quality that can also be used for soil-amendment applications [
33]. More specifically, the biochars produced within the FlexSNG project are highly carbonised and structurally stable, with low H/C and O/C ratios, low volatile content (5–15%), and high fixed-carbon fractions, indicating good long-term stability and suitability for energetic and material uses. They also exhibit high specific surface areas (200–350 m
2/g, BET) with well-developed micro- and macroporosity, alkaline pH (9.5–10), and moderate water-holding capacity (140–170%). Heavy metals and PAHs levels are generally low and compliant with voluntary EBC/IBI standards, particularly for bottom-ash biochar, confirming overall material quality [
33]. All these support the biochar’s potential suitability in various applications, such as fuel, metallurgical processes, and carbon sequestration as a construction material.
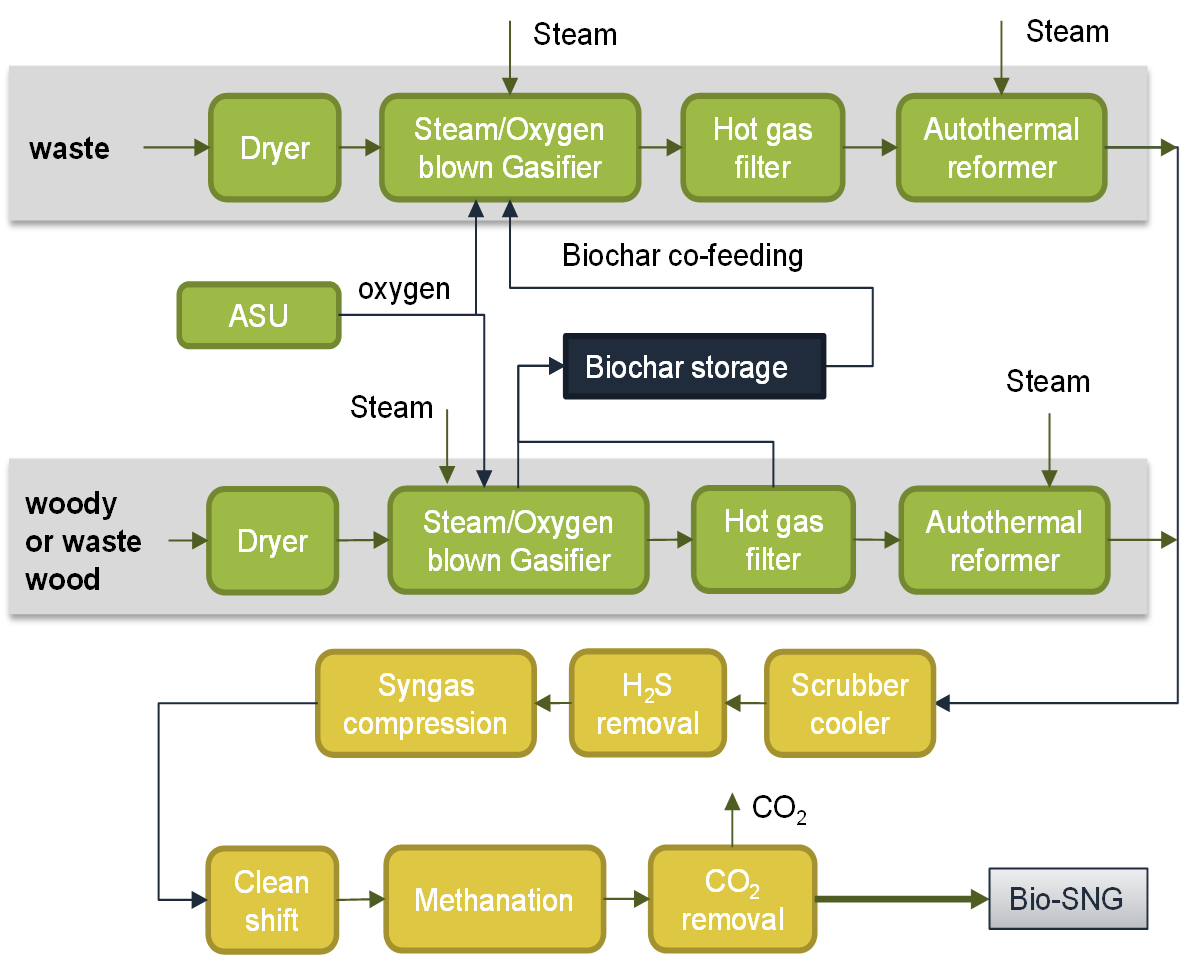
A city refinery plant (
Figure 2) can convert urban waste and biomass residues into high-value products in support of circular-economy strategies. The feedstock potential in urban areas consists of materials that are often difficult to recycle and are therefore poorly utilised. Examples of such materials are Municipal Solid Waste (MSW), demolition wood, the combustible fraction of construction waste, residues from parks and horticulture, and certain waste fractions from the surrounding industries and municipalities. This concept comprises either two gasification lines operating in two different modes or a single line capable of operating in both co-production and maximisation modes. In line 1 of the two-line design, woody biomass is gasified to produce syngas and biochar according to co-production-mode principles. In line 2, the biochar produced is co-gasified with waste to improve the gasification behaviour of hard-to-gasify waste such as MSW and SRF, yielding syngas (maximization mode). In the one-line design, a single line operates in two modes, with the co-production mode generating the biochar required by the maximisation mode for the co-gasification of waste feedstocks.
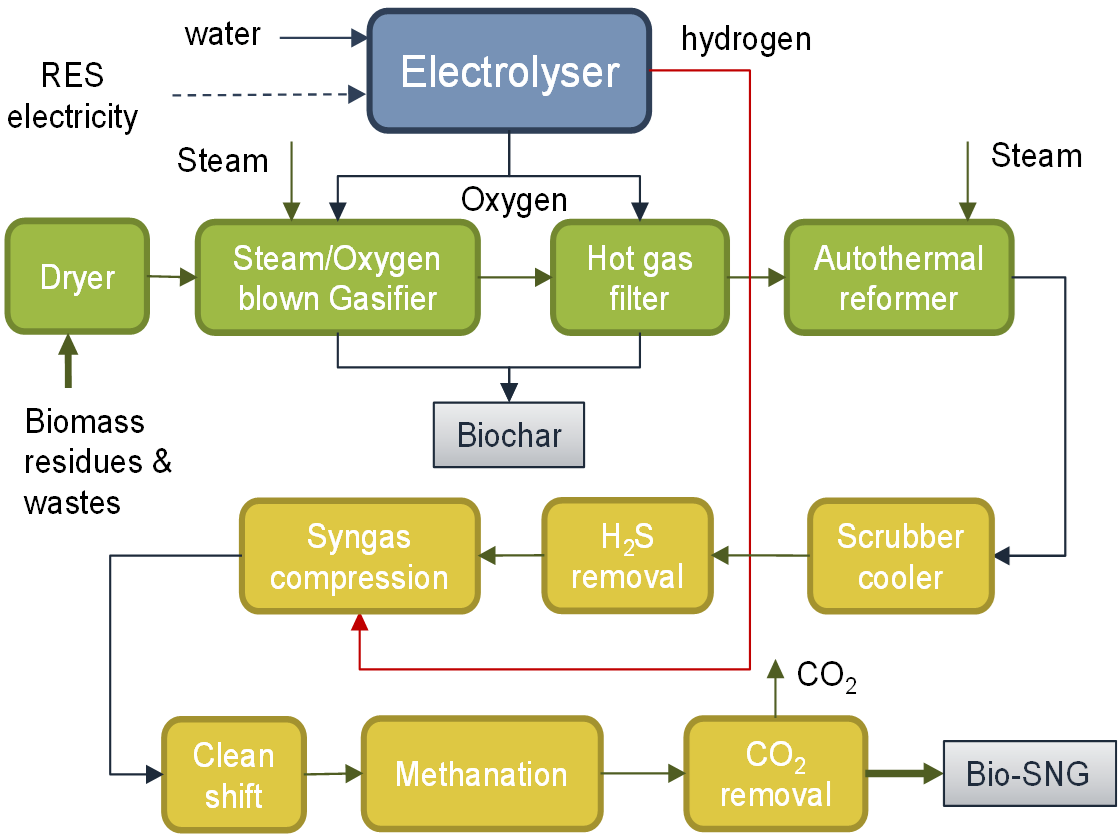
The hybrid concept couples the biorefinery concept with electrolysis (the hybrid plant,
Figure 3). This allows the plant to exploit the surplus low-cost electricity available in the grid (typically during summer) and to increase its carbon utilisation and biomethane output through hydrogen boosting, which in turn reduces the extent to which the Water Gas Shift (WGS) reaction is required.
In order to assess the performance improvements of the proposed concepts compared to other bio-SNG production pathways, a reference case study is introduced. This scenario is based on past studies [
18,
34] and represents a conventional scheme for converting biomass to SNG via gasification.
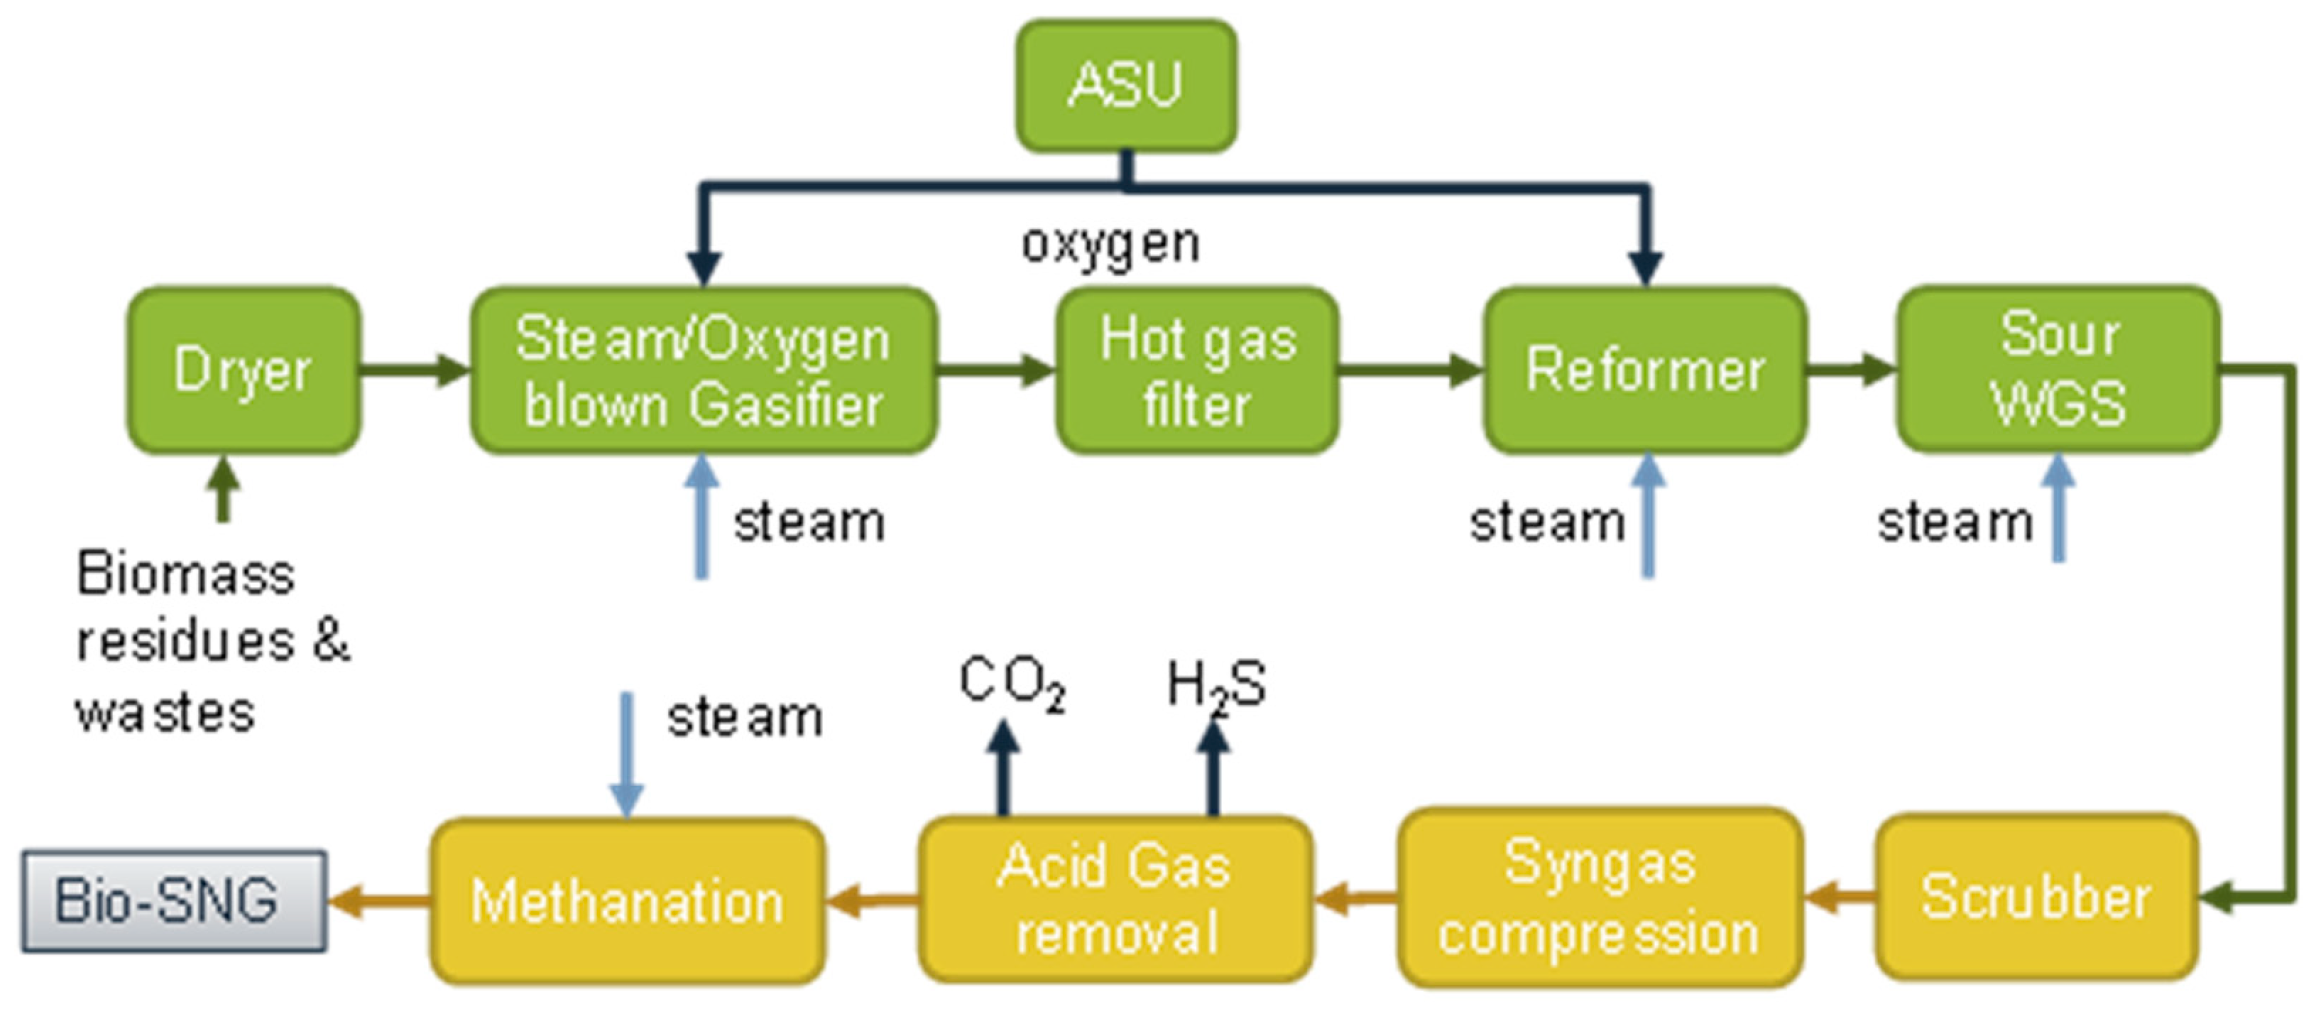
The main features that distinguish this reference case from the FlexSNG concepts described above are the different operating parameters and performance of the gasifier and reformer, the sour WGS, the removal of H2S and CO2 upstream of methanation by the Rectisol process, and the different configuration of the methanation and Heat Recovery Steam Generation (HRSG) systems. This case also assumes the production of electricity from the high-temperature excess heat available in this design so that the process can be partly self-sufficient in terms of electricity consumption.
The Aspen Plus V14.0 simulation software was used to model and perform simulation runs for each developed case study. The Redlich–Kwong–Soave equation-of-state method with Boston–Mathias modifications was used globally, and the IAPWS-95 property package was used for the HRSG system. The first part of the overall system, namely the gasifier and the ATR, was represented by a modified equilibrium model. This model combines equilibrium predictions from Gibbs free-energy minimisation for the main syngas species with experimentally derived parameters for the formation of non-equilibrium components, such as light hydrocarbons, tars, and impurities [
35]. The results from experimental campaigns [
36] on the gasification and gas-cleaning sections were used, together with empirical correlations, to derive the parameters governing non-equilibrium component formation and conversion in the scaled-up process under specific operating conditions. The experimental campaigns used mixtures of woody biomass, SRF, and biochar fed to the system operating at near atmospheric pressure with the gasifier at 850–900 °C, the filter at 550 °C, and the ATR approximately in the range of 800–950 °C. Process steps such as drying, filtration, and the HRSG system were modelled in a simplified manner that was nonetheless adequate for the present analysis. The main simulation parameters for gasification, filtration, and catalytic reforming are summarised in
Table 2, and further information on the reactor-modelling methodology is provided in
Appendix A.
To assess the gasifier model performance quantitatively, the Root Mean Square Error (RMSE) and the Normalised Root Mean Square Error (NRMSE) are introduced to calculate the differences between predicted and actual values of the major syngas species (CO2, CO, H2, CH4) after the gasifier and the reformer. While RMSE is the square root of the average of squared errors and assesses the absolute error, the NRMSE is a dimensionless statistical metric and expresses the relative error in %.
Two heat exchangers were used to model the cooling of the syngas after the gasifier and the ATR. Downstream of the reformer, a two-stage scrubber was modelled for NH
3 removal, giving an outlet gas temperature of 30 °C. Further downstream, activated carbon and guard beds provide bulk H
2S removal and final gas polishing; these were modelled in a simplified way by separating the undesired compounds [
18].
The methanation section used in the FlexSNG concepts is a highly efficient reactor system, followed by downstream CO
2 removal, that produces bio-SNG of very high quality [
37]. The specifications of the end-product streams were used to build a material-balance model based on a stoichiometric reactor, in which the WGS Reaction (R2) proceeds to the extent needed for the H
2/CO ratio to reach approximately 3, followed by the methanation Reaction (R1).
In this analysis, the catalyst is assumed to be active only for CO hydrogenation, with CO
2 acting mainly as a coolant to prevent the high-temperature spikes caused by the highly exothermic reaction involved [
38,
39]. For SNG upgrading, a combination of solvent-based technologies is employed to remove CO
2 in two steps [
40], following a methodology similar to that used for biogas upgrading [
41].
For heat integration, excess heat from the syngas cooling and methanation process is used for the production of medium-pressure steam (MP), low-pressure steam (LP), and hot water. More specifically, a closed water circuit operating at 60/90 °C is used for the dryer, and low-pressure steam is used at 350 °C for the gasifier, reformer, and methanation. Oxygen produced by the ASU or an electrolyser is heated to 200 °C by the syngas after the gasifier and the reformer for the gasification and reforming processes, respectively. The heat and mass balance at SNG production and upgrading step foresee that saturated steam can be produced at 17.3 barg while other available heat streams are from 62 °C to 40 °C and from 135 °C to 40 °C. MP saturated steam is used in the evaporator to produce LP saturated steam, which, in turn, is superheated from hot syngas up to 350 °C. The remaining heat content of the MP steam is used to heat water for district heating purposes. Lastly, the remaining low-temperature heat that has not been used at the drying unit is used to increase the flow rate of hot water at 60 °C, which will be used for low-temperature district heating networks. All heat exchangers have been designed with a 10 K minimum temperature approach.
For the hybrid case, in which an electrolyser is used for green hydrogen production, an alkaline electrolyser is assumed with a specific power consumption of 51.3 kWh per kg of H
2 produced [
42].
The examined cases are summarised in
Table 3, which lists the feedstock type, thermal input, concept, and mode of operation. These cases provide a comprehensive evaluation of the developed process schemes, as they cover all operation modes and a range of feedstocks. The feedstock specifications used in the modelling are given in
Table 4.
For the reference case (
Figure 4), the modelling approach and process specifications can be found in [
18]. More specifically, similarly to FlexSNG concept modelling, a simple approach was chosen for processes such as drying, the filter, and ASU. For the gasification part, modelling parameters for the gasifier and reformer were obtained from [
43], which were validated based on experimental runs with wood chips and forest residues. In this case, the gasifier was operated at a pressure of 3.5 bara instead of 1.5 bara. This difference in the operating pressure affects both the power duty for oxygen supply and the syngas composition, and therefore, different process parameters for the estimation of the non-equilibrium species are used [
43]. In the gas cleaning section, removal of CO
2 was done prior to methanation using Rectisol. The Rectisol unit and the refrigeration cycle were modelled in detail, with the Rectisol process being modelled by an absorber and two strippers, and they were based on the developed model presented in a previous study [
44]. The methanation process was modelled according to [
18]. Additionally, the high-temperature excess heat present in this scenario is utilised for power generation, which is not considered in FlexSNG concepts. However, this effect has been included in the result comparison between the reference case and FlexSNG cases. The feedstock used in the reference case was forest residue, so cases using bark were the most appropriate basis for comparison, but cases using straw and SRF provided useful data as well.
The following key technical performance indicators were used to evaluate the performance of the scenarios under investigation:
Thermal efficiency (η
thermal) expresses the effectiveness of biomass and H
2 (for hybrid cases) conversion into SNG.
SNG production efficiency (η
SNG) expresses the ratio of the overall chemical and electricity output that is converted into SNG.
Plant production efficiency (η
plant) expresses the ratio of the overall chemical and electricity output that is converted into all the desired end products, i.e., SNG, biochar, and useful heat. It is recognized that an exergy analysis would provide a more comprehensive thermodynamic evaluation by identifying the locations and magnitudes of irreversibilities within the investigated pathways [
45]. Nevertheless, the present study is intentionally limited to an energy-based assessment, which adequately addresses the objectives of comparing the under investigation pathways and evaluating their sensitivity to key process parameters. Extending the analysis to include exergy for all cases and sensitivity scenarios would considerably increase the scope and length of this manuscript and is therefore reserved for future investigation.
3. Results and Discussion
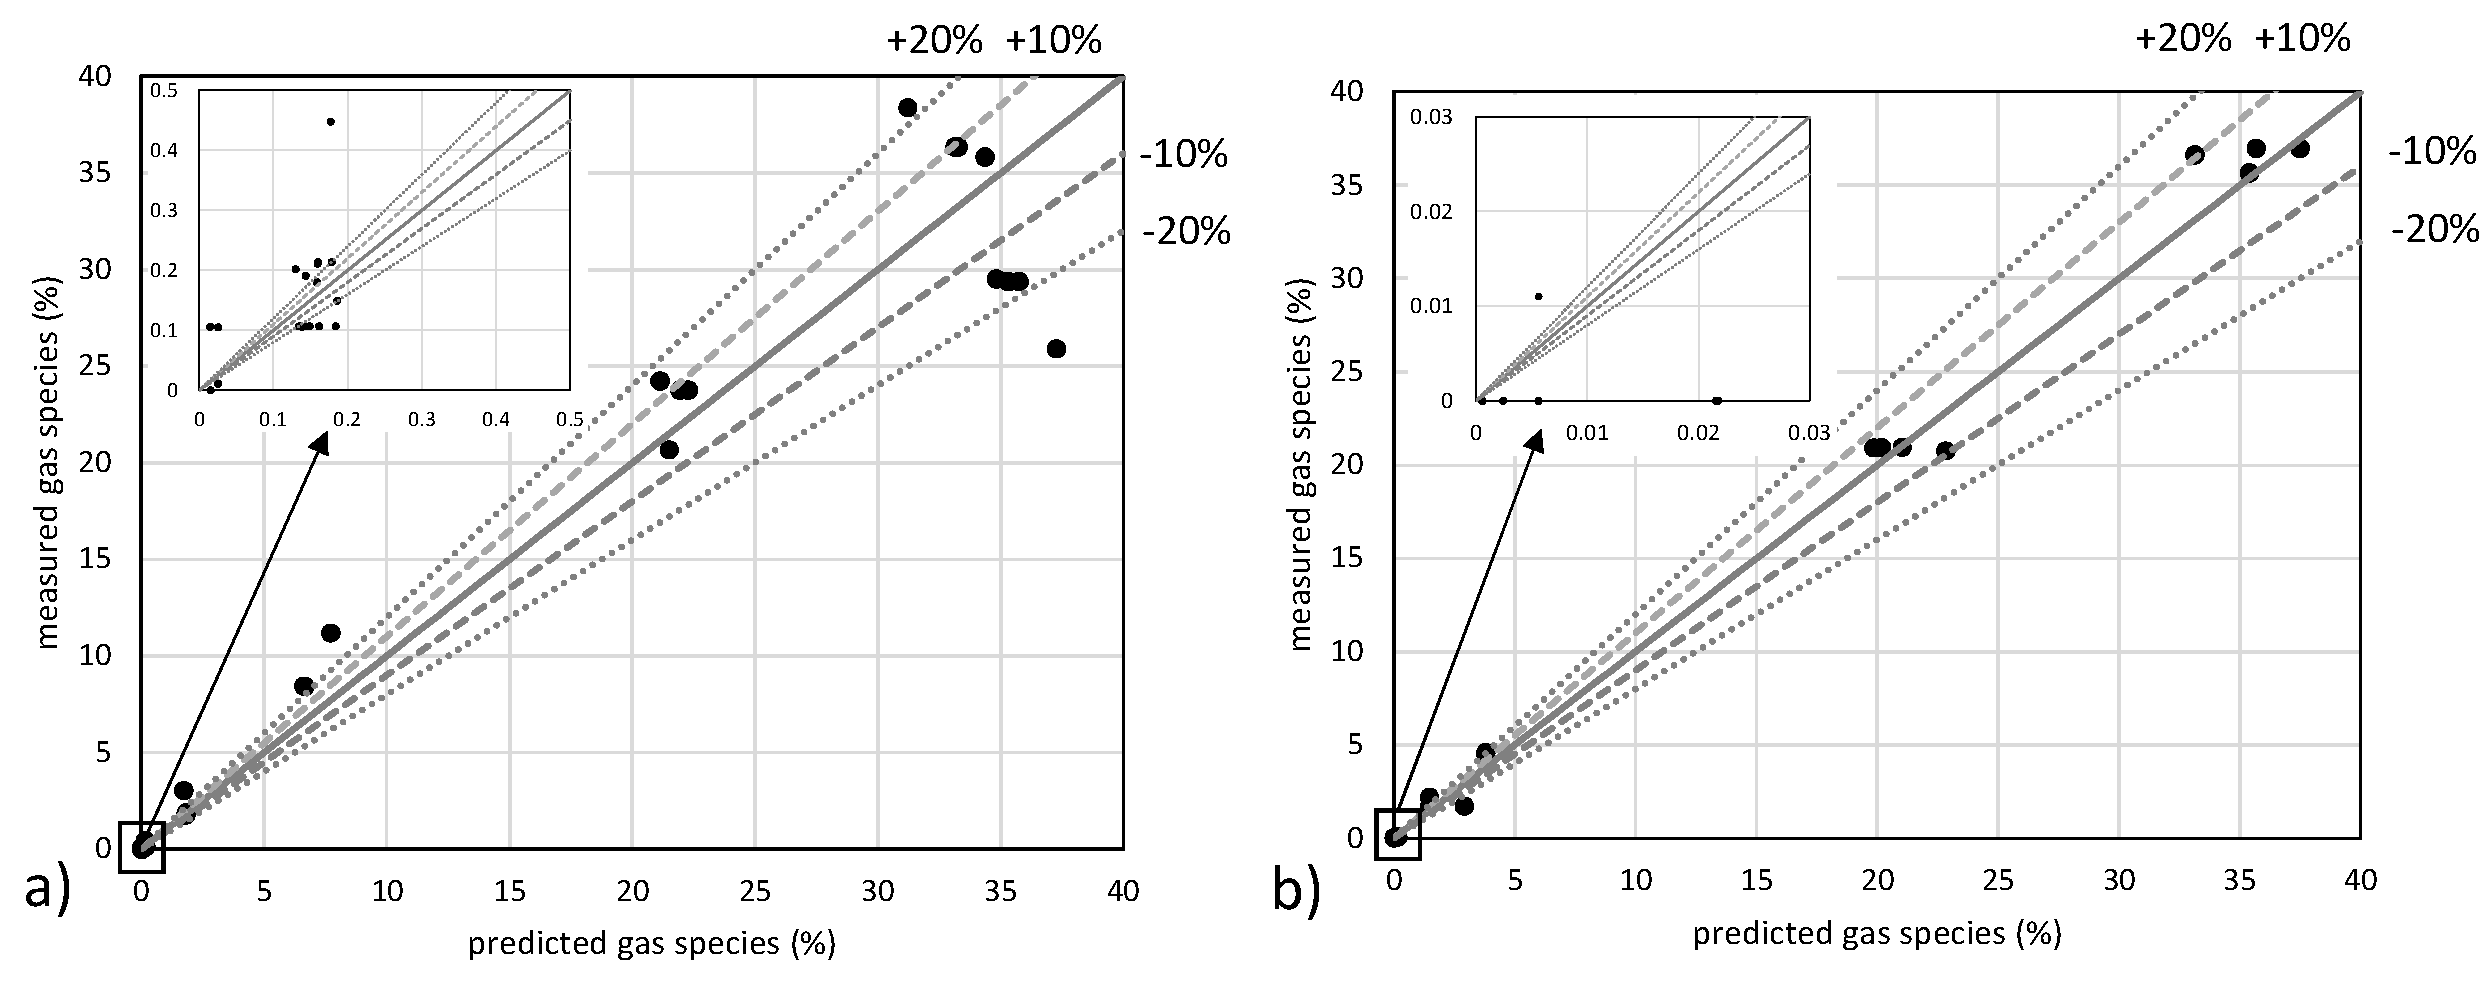
Figure 5 illustrates the agreement between the model predictions and the experimental data obtained from the pilot plant, after the gasifier and the reformer, for various feedstocks and operating conditions. Model validation was carried out using experimental runs with several feedstocks and with mixtures of woody biomass and SRF. Where dedicated parameters were not available, the model used the parameters from
Table 2 that best matched each feedstock employed in the pilot-plant run, which accounts for the points showing larger deviations. Despite the simplicity of the model and the use of generic parameters, only a few points exceed 20% deviation after the gasifier, while most predictions fall within the acceptable 10% deviation band after the reformer. Larger deviations after the gasifier are to be expected, given the limited ability of the modified equilibrium model to predict non-equilibrium compound formation across different feedstocks and operating conditions.
The results from the evaluation on the prediction accuracy of the gasification model are summarised in
Table 5. The metrics confirm that, after the reformer, the largest NRMSE is that of CH
4 at 13%, which is expected given that the model uses constant parameters and that the low CH
4 concentration amplifies the relative error, while its absolute deviation is 0.4. Despite this high value of NRMSE for CH
4 and considering that more that 90% of methane at the final SNG stream is produced at the methanator by CO hydrogenation, the impact of this discrepancy on the total CH
4 yield is less than 2%. The major syngas species (CO
2, CO, H
2) show good agreement after the reformer with the experimental data, with NRMSE values at approximately 3%. Considering the above, the present modified-equilibrium 0-D model can be used for a system-level comparison between six cases and a reference case, as the deviations propagating downstream to the product are expected to be low. The proposed model predicts the syngas composition of the gasifier and the reformer with fair accuracy. However, for more detailed assessments aiming to provide performance estimates for configurations with small differences, models that incorporate kinetic data and even Computational Fluid Dynamics (CFD) are necessary.
At this point, it is important to note some of the potential sources of bias and the limitations of the developed models. The high-temperature catalytic reformer drives the system closer to thermodynamic equilibrium (see
Figure 10 below), and the inclusion of a temperature approach to equilibrium compensates for part of the difference, but deviations in syngas composition between the predictions and the experimental data remain. The modelling approach considers the major syngas species together with representative compounds for the minor species, such as benzene and naphthalene for tars. Although common in the literature [
8,
16,
18], this introduces uncertainty. Its influence is reduced after the catalytic reformer, where almost all of the light hydrocarbons, tars, and other compounds are converted into syngas. In addition, the use of constant parameters to predict the formation of non-equilibrium compounds does not capture kinetics, hydrodynamics, and other factors, one of which is the variability in feedstock physicochemical properties. To mitigate this, representative feedstock compositions were used; moreover, the process can accommodate feedstocks with different physical properties, and the efficient, dedicated syngas-cleaning steps ensure stable plant operation. Other parameters, such as carbon conversion, reactor heat losses, and the general performance of the process units, were selected following typical approaches adopted in similar studies in the literature [
14,
18,
46]. While a detailed analysis of these factors lies beyond the scope of the present 0-D model, they should be examined in future work that investigates each case in greater depth.
Table 6 summarises the main stream flow rates of the examined cases. As expected, the highest SNG production occurs in the hybrid cases (5 and 6), owing to the considerable boost in CH
4 synthesis from the electrolytic hydrogen. The steam-to-biomass ratio was calculated for all cases and was found to increase relative to the reference case. It is highest for the SRF/biochar gasification case at 0.69, mainly because of the high steam requirement of SRF/biochar gasification. It is also worth noting that the steam-to-carbon (S/C) ratio calculated for the reforming process was below 1 for woody biomass cases (forest residues and bark). Given also the fact that no coke formation was observed during the experimental campaigns [
36], it is safe to say that the specific ATR technology offers the advantage of cracking the produced tars quite effectively with relatively low steam and oxygen requirements. In Case 4, the produced biochar from Line 1 (bark co-production) is insufficient for the requirements of Line 2 operation if both lines have the same feedstock heat input, and therefore, two lines were operated, with Line 1 having a greater heat input, but the feasibility of this design depends on feedstock availability. This configuration provides significant flexibility if a gasifier with a fixed capacity is considered able to operate in either Line 1 or Line 2 mode. In that case, Line 1 should operate more hours than Line 2 in order to secure the required amount of biochar for the operation of Line 2 at the same load, without the need for external biochar. A more detailed analysis of the operation planning for this concept should be conducted in a follow-up study.
The process simulations also indicated substantial flow rates of water effluents (wastewater) exiting both the process and cooling system. Regarding process wastewater, a treatment plant should be considered, with part of the treated water being reused in various process streams, such as steam generation, process water for syngas cleaning, or SNG conditioning. Considering that approximately 3% of the cooling water circulation rate needs to be replenished as makeup water after the cooling tower (in the absence of a large water body, such as the sea, near the plant), a fresh water supply on the order of 1000 m3/h is required for the cooling system. This may raise environmental concerns and should be carefully considered when determining the exact plant location, particularly for deployment in rural or urban settings.
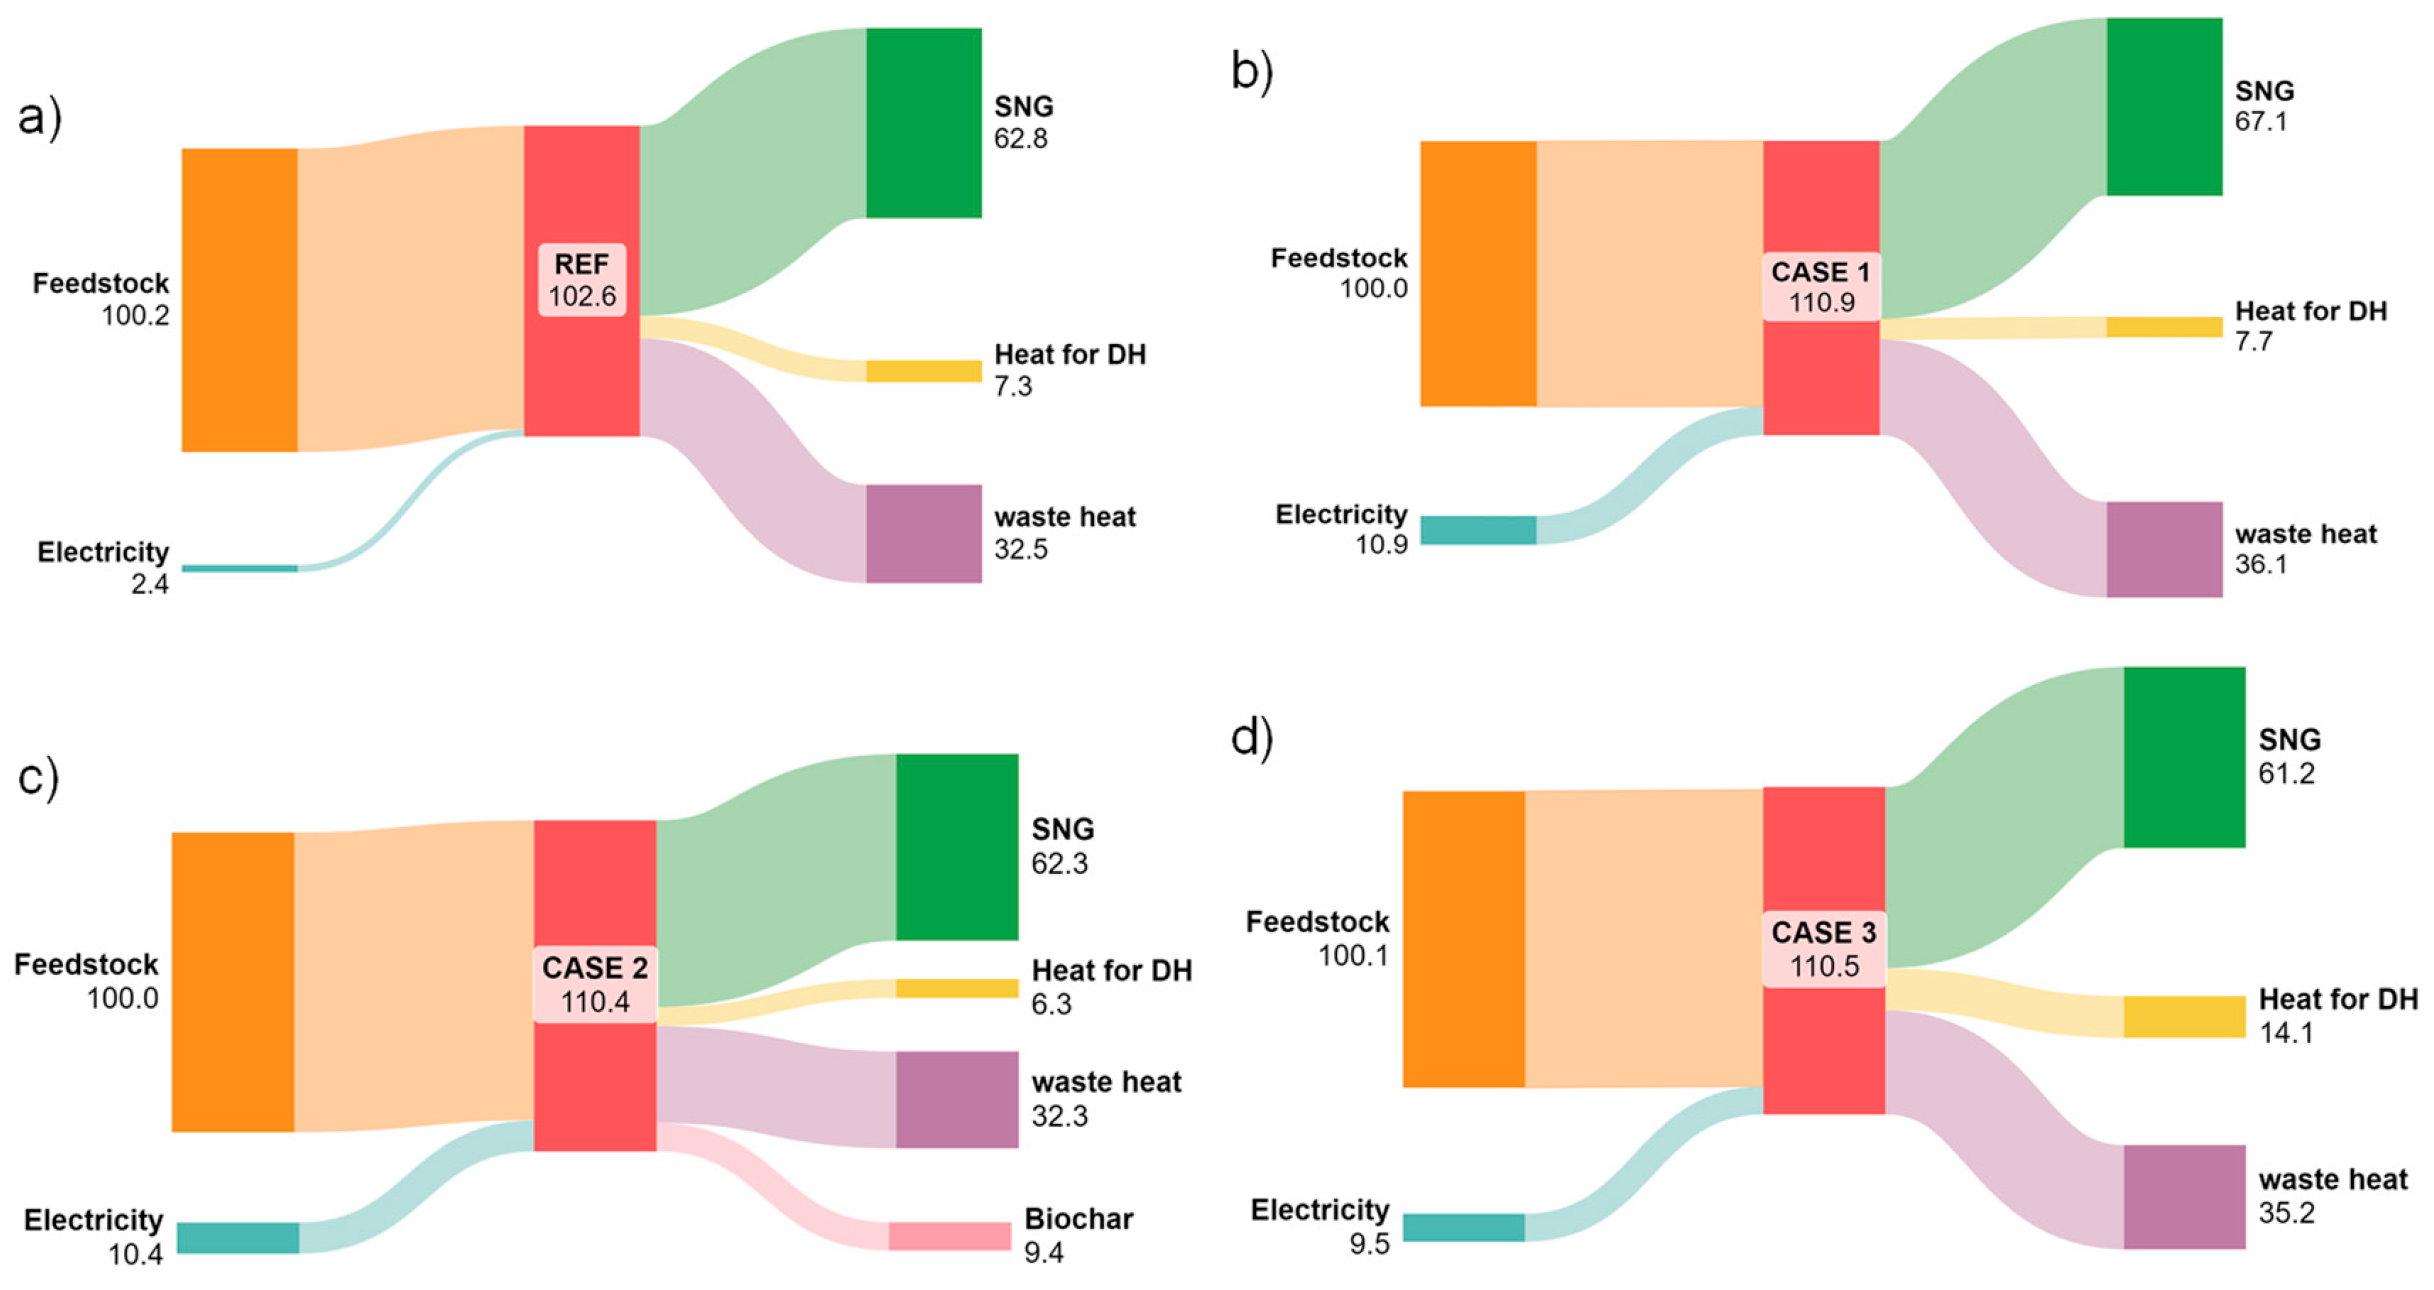
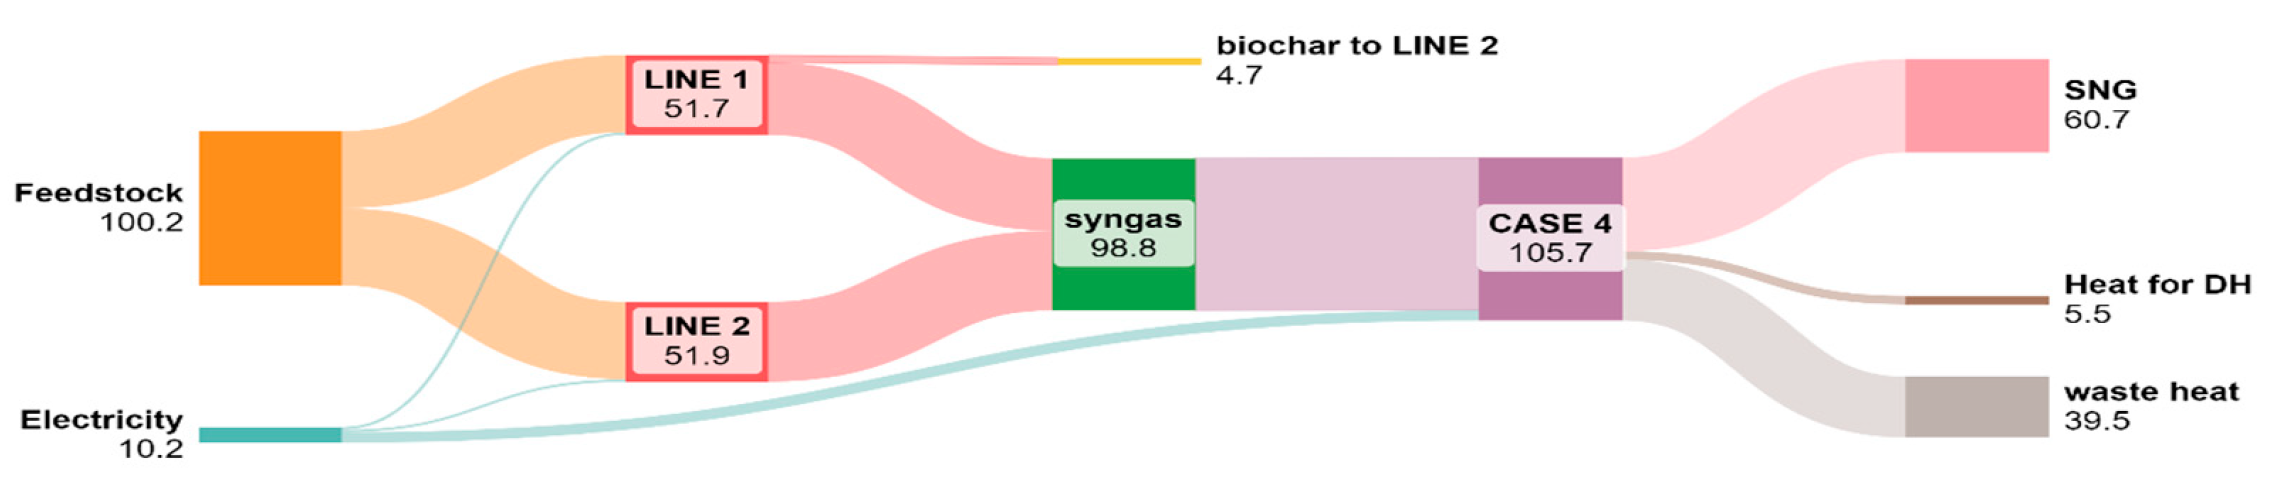
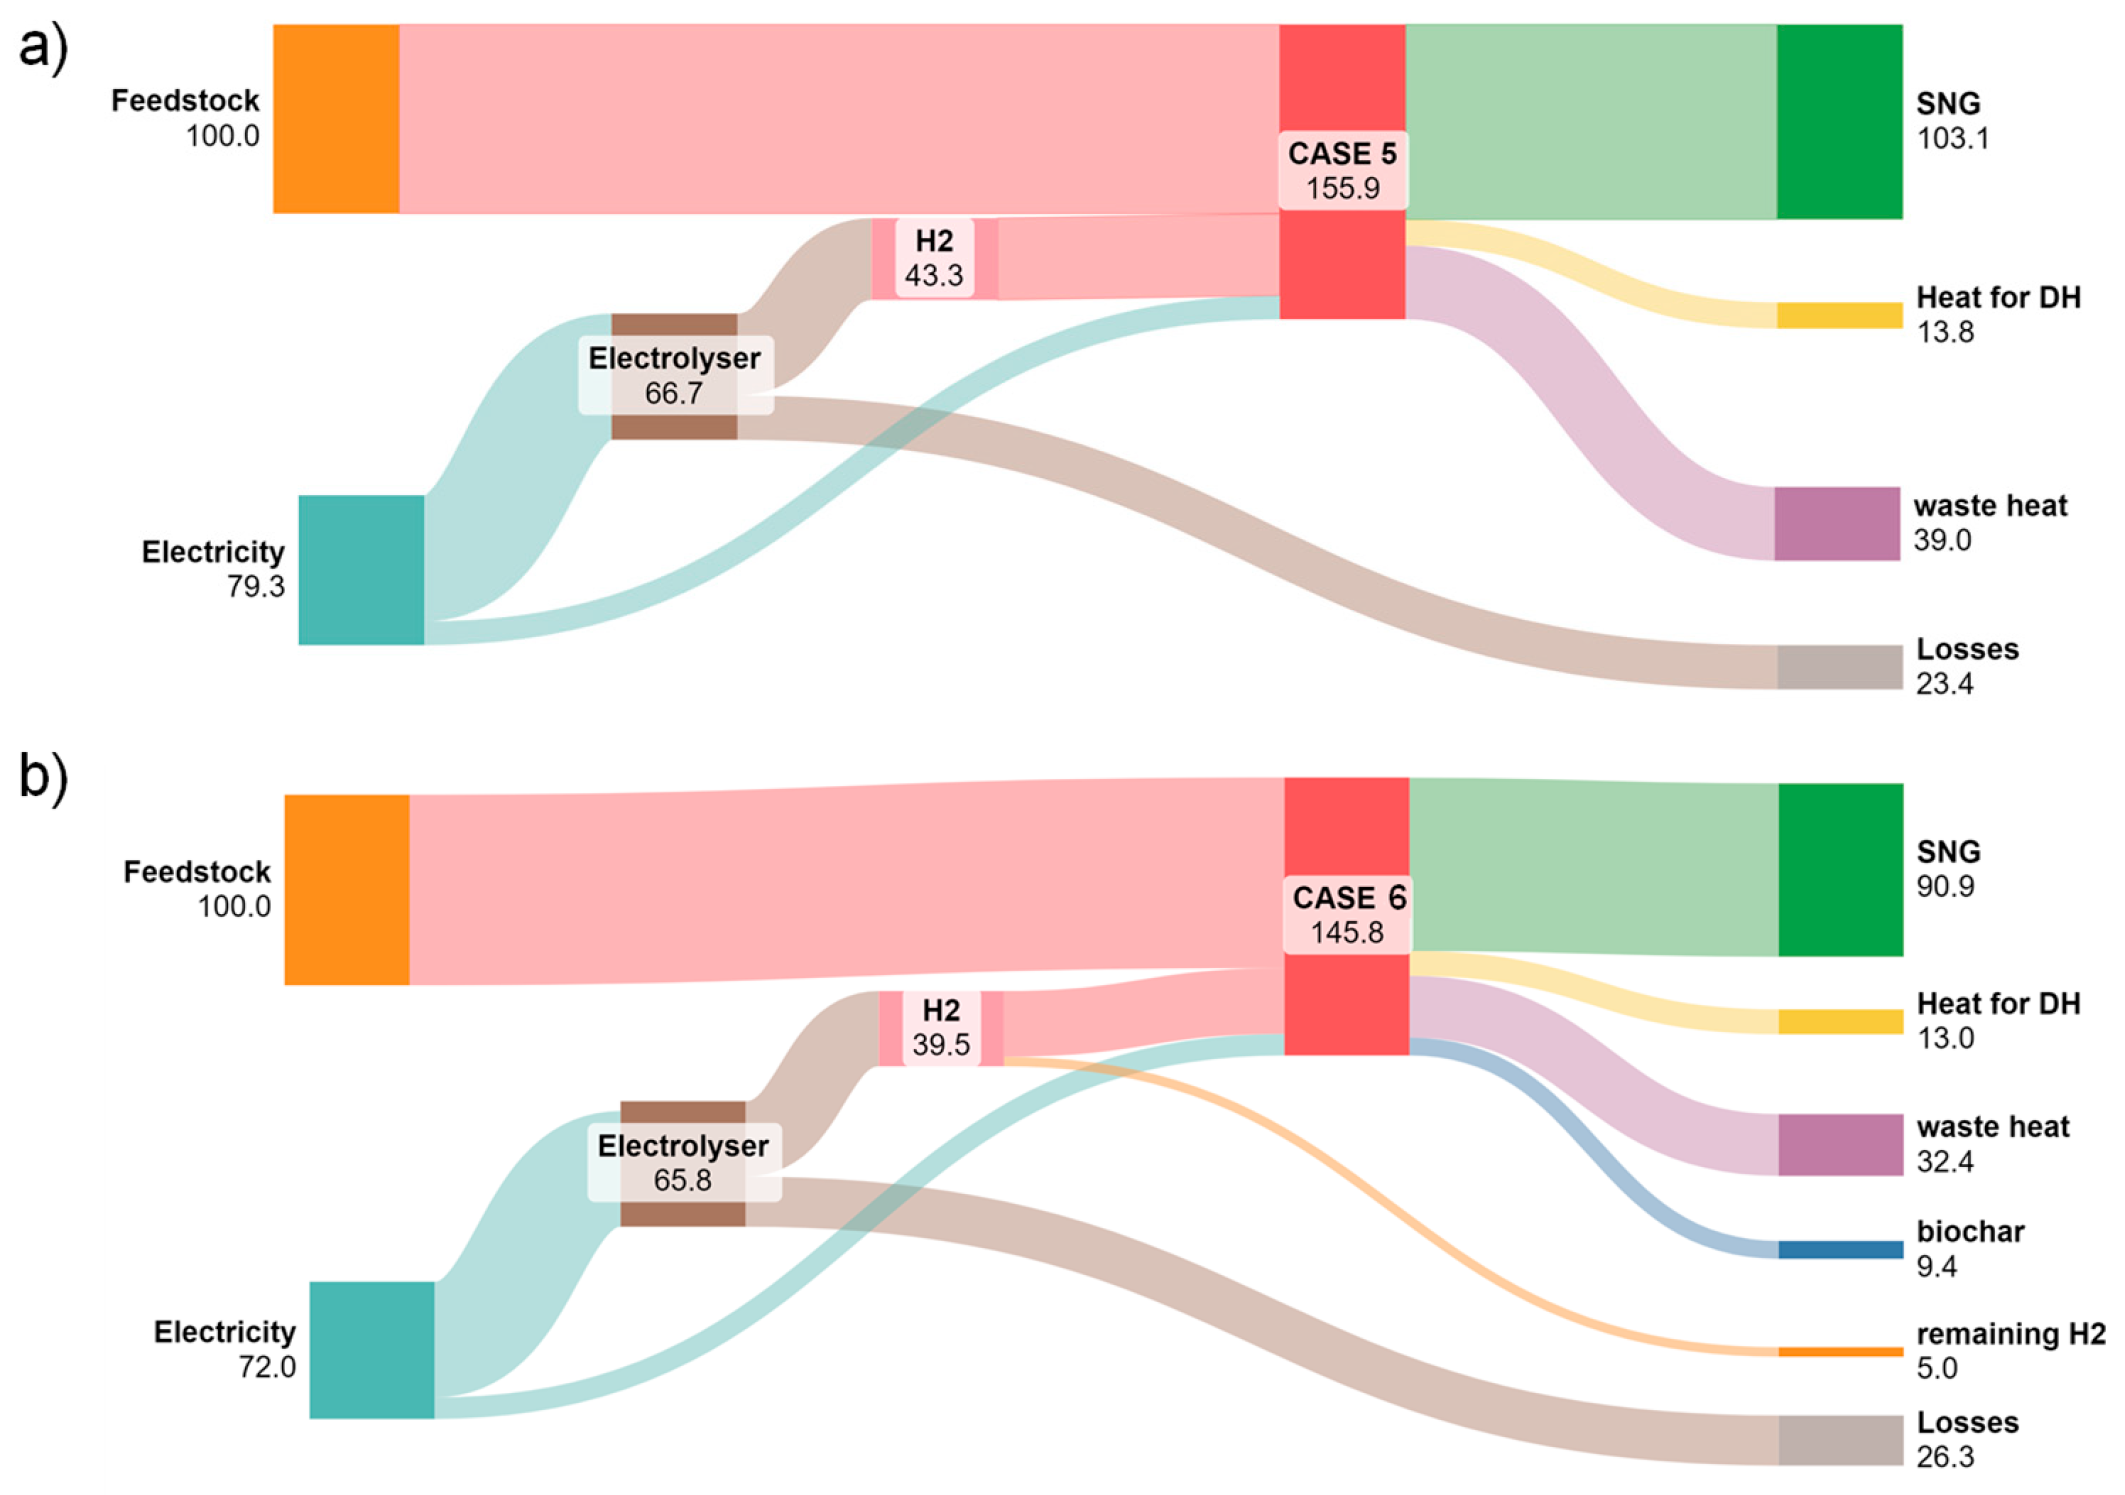
A schematic illustration of the main energy flows is given in the Sankey diagrams of
Figure 6,
Figure 7 and
Figure 8. The waste-heat streams also include heat losses occurring at various process steps, such as the gasifier and the reformer. Case 2 and Case 5, the cases in which biochar is among the products, show the lowest waste heat, that is, the lowest amount of energy that is either lost or left unutilised. Comparing Case 1 and Case 4, the two routes for maximising SNG production without the aid of electrolytic hydrogen, Case 1’s configuration leads to higher biomethane synthesis. It is worth mentioning that the electrolyser losses in Cases 5 and 6 (
Figure 8a,b) are considerable. However, these losses cannot be effectively utilised, as they correspond to low-enthalpy heat generated by overpotentials arising from various phenomena, including ohmic, activation, and concentration overpotentials.
A better understanding of the way that the produced heat is utilised or wasted is depicted in
Table 7, where the heat balance is indicative of Case 1. In total, 38.9 MW
th is produced and exploited for internal (drying and steam) and external use. Almost half of this is required for raw biomass drying, whereas 30% is used for steam generation, which will be used for the gasification and reforming process. A considerable amount of heat is released from the system as waste, the majority of which is generated at the SNG upgrading unit. The two-step CO
2 removal process based on chemical absorption is heat-demanding, and excess heat from solvent regeneration (condenser part) cannot be further utilised. A different approach for SNG purification using electrically driven processes or solvents with lower heat demands for regeneration would increase the total amount of net useful heat, and it is suggested as a future study.
Table 8 shows how C from the initial biomass feedstock is distributed along the outlet streams, biofuels, and CO
2 emissions. Apart from the hybrid cases, the majority of inlet carbon is converted into biogenic CO
2, a phenomenon that raises concerns for its potential utilisation given the fact that it is separated from the produced synthetic methane and can be obtained in a highly pure form. The lowest carbon utilisation is observed for Case 3, owing to the relatively low energy and carbon content of straw, which requires a larger fraction of available carbon to be fully oxidised to provide heat for gasification. The hybrid cases (5 and 6) show the highest carbon utilisation because the injected hydrogen brings the H
2/CO ratio to 3 upstream of the methanators so that no shift reaction is required and the CO produced is converted in its entirety to CH
4. It should be noted that, if the biochar produced in Cases 2 and 6 is used in applications such as construction materials or soil amendment rather than for energy, the long-term sequestration of the carbon it contains becomes possible, unlocking the potential for negative GHG emissions.
Table 9 summarises the key performance indicators obtained from the heat and mass balance calculations. In all cases, the plant heat input, expressed as the heat content of the initial biomass feedstock, is the same. Except for the straw case (Case 3), the gasifier heat input is higher because of the biomass’s pre-drying. Lower oxygen demands are observed in all cases than in the reference scenario. In co-production-mode cases, this is due to the lower gasification degree and the lower char conversion; in the maximization-mode cases, it is attributed to the improved performance of the ATR. This reduction in oxygen demand reduces both the electricity consumption of the ASU and its size, leading to lower operating and investment costs, respectively. Therefore, a detailed techno-economic analysis is necessary to verify whether this reduction in oxygen consumption and the elimination of the Rectisol process offset the costs of the new catalysts and the increased gas compression operations. Apart, of course, from the hybrid-mode cases, the remaining cases show a reduction in overall electricity consumption of between 5.9% and 15.8%, mainly because of the absence of the energy-intensive Rectisol process and of the ASU energy demand. It is worth noting that the gasifier in Cases 1–6 operates at 1.5 bara compared with 3.5 bara in the reference case, which results in higher syngas-compression duties; nevertheless, the overall energy consumption is still reduced. It should also be mentioned that the reference scenario converts a large amount of excess heat into electricity so that almost 80% of its electricity demand is covered internally; as a result, its specific external electricity demand is 0.038 kWhe per kWh of biofuel produced. For non-hybrid Cases 1–4, 0.15–0.16 kWh of electricity is required to produce 1 kWh of advanced biofuels, whereas this value is five times higher for hybrid Cases 5–6.
The proposed concepts improve the conversion efficiency of SNG production by 10% relative to the reference case. Although the gasification performance is kept as high as in the reference case, as shown by the CGE after the filter, part of this improvement is attributable to the better operation of the catalytic ATR. This is evidenced both by the higher CGE after the reformer and by the increased H2/CO ratio downstream of it. A further factor is the extensive conversion of CO to CH4, the WGS reaction being limited to the level required to reach H2/CO = 3.
An additional process simulation of the reference plant was performed, assuming a gasifier pressure of 1 bara (“Ref2”), in order to assess the potential impact of gasification operating pressure on overall plant performance. In this case, the performance indicators used to evaluate process efficiency, ηthermal, ηSNG, and ηplant, were calculated as 62.7%, 54.9%, and 71.4%, respectively. The thermal efficiency is essentially identical between the two cases (pressurized and atmospheric gasification), indicating that operating pressure has no significant impact on the overall conversion of biomass feedstock into methane. On the other hand, electricity demand is lower in the pressurized case (Ref) due to reduced syngas compression duties, resulting in a higher ηSNG. However, the overall plant efficiency (ηplant) is slightly higher for Ref2, since the produced electricity is nearly the same in both cases, while the heat available for district heating (DH) applications is approximately 3 MWth higher. This comparative analysis indicates that operating the reference case gasifier under atmospheric conditions yields slightly better overall performance, although its efficiency remains lower than that of Case 1.
The co-production modes exhibit higher overall conversion efficiency (
) than the corresponding maximization modes. In the non-hybrid configuration, switching from Case 1 to Case 2 increases plant efficiency by 3.4%, whereas the corresponding improvement in the hybrid configuration (Cases 5 and 6) reaches 6.4%. This difference is primarily attributed to the amount of waste heat generated in each case. In the co-production mode (Case 2), waste heat accounts for 37.8% of the SNG thermal output (
Figure 6c), compared with 53.8% in the maximization mode (Case 1;
Figure 6b). In the hybrid configuration, maintaining the desired H
2/CO ratio through the addition of electrolytic hydrogen (Cases 5 and 6) eliminates the need for the water-gas shift (WGS) reaction prior to methanation, which translates into more CO
2 that needs to be removed downstream, thereby substantially reducing waste heat during methane purification. Consequently, the combined effects of biochar co-production and electrolytic hydrogen addition lead to a greater reduction in waste heat and, in turn, a more pronounced improvement in overall plant efficiency.
In order to better evaluate the advances offered by the proposed concepts in terms of efficiency, they are benchmarked against similar studies from the literature.
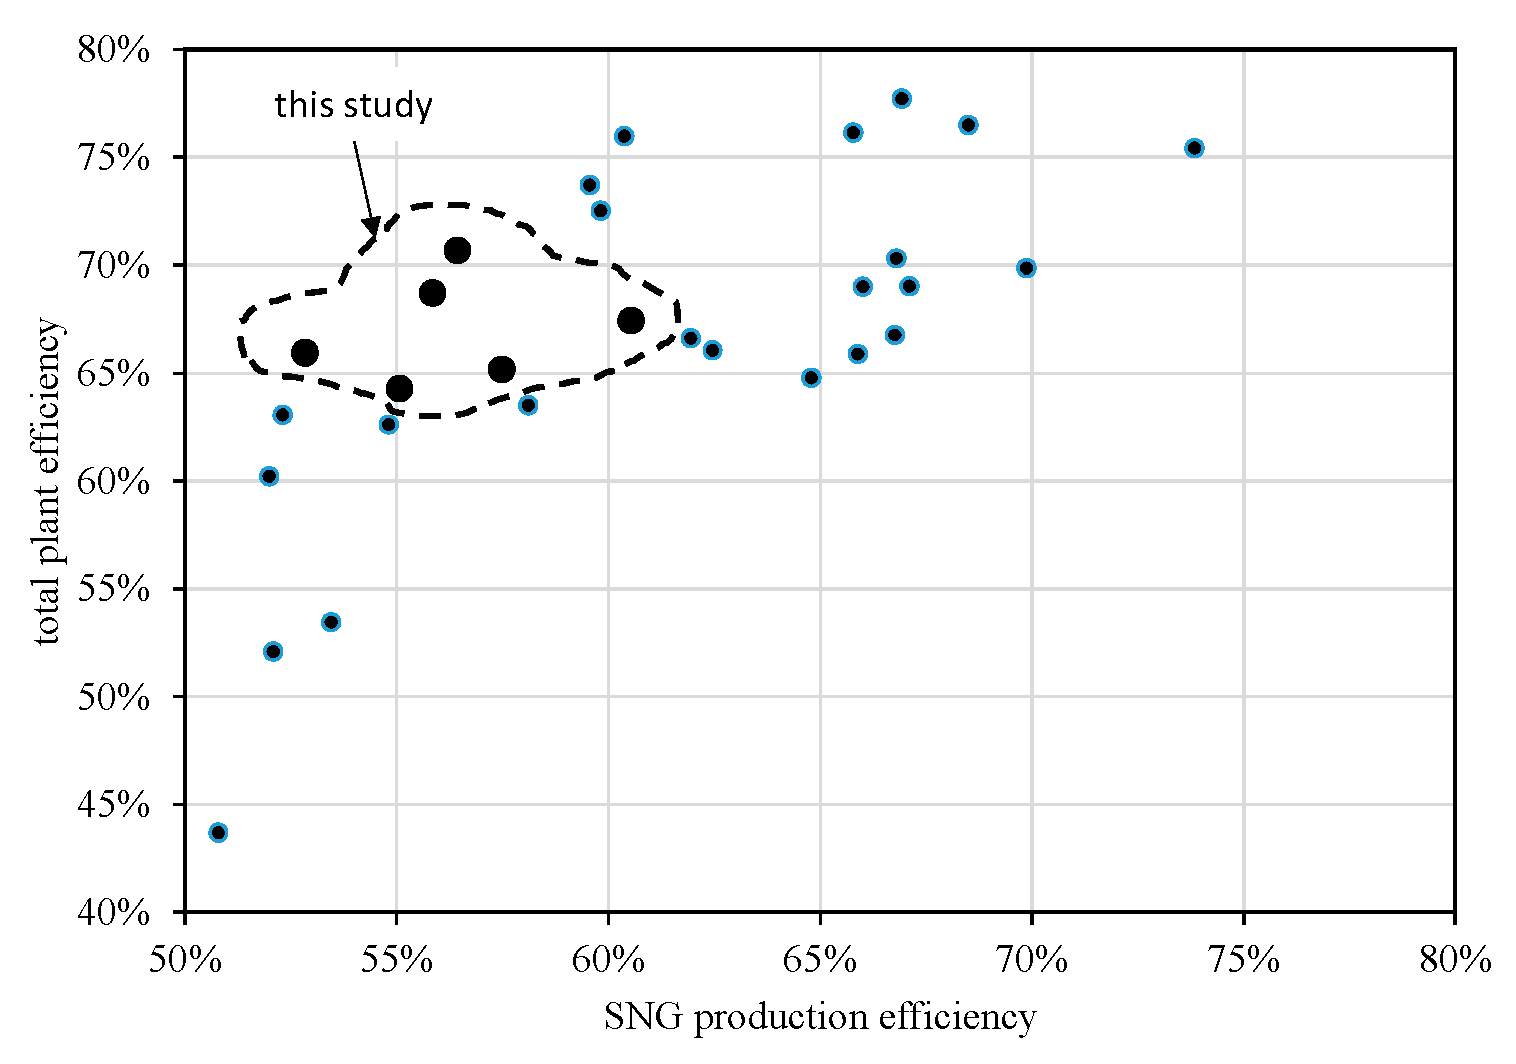
Figure 9 presents the SNG production efficiency and the plant efficiency of the studies listed in
Table 1, and it shows how the corresponding key performance indicators of the examined scenarios compare. All data from the reported studies have been normalized to an LHV basis and include all electricity demands along the whole process in order to benchmark them on a consistent basis and on equal terms. The proposed concepts have competitive overall plant efficiencies relative to the other studies. The η
SNG values, by contrast, are somewhat lower than those of most other studies, which can be attributed to (a) the relatively low H
2/CO ratio after the reformer, (b) the low quality of the feedstock in some cases, and (c) the co-production of biochar in a few scenarios, in which a considerable part of the chemical energy of the feedstock is directed to biochar production. It should also be noted that some of the reported studies do not produce SNG that meets natural-gas pipeline specifications [
16], while others employ less energy-intensive technologies for SNG upgrading [
14]. This indicates that there is scope to improve the proposed concepts, particularly by optimising heat recovery and reducing the heat and energy requirements along the process, which could be investigated in future work. As for the heat recovery optimization, as mentioned earlier, the adoption of low-energy and heat-demanding technologies for CO
2/CH
4 separation after methanation would improve overall plant efficiency considerably. Additionally, a pinch analysis of the heat exchanger network would further reduce the amount of unexploited heat.
A sensitivity analysis of some critical process parameters follows. Because the model depends strongly on parameters fitted to a specific operating point, the gasification and reforming models were benchmarked against the corresponding equilibrium-based models. As
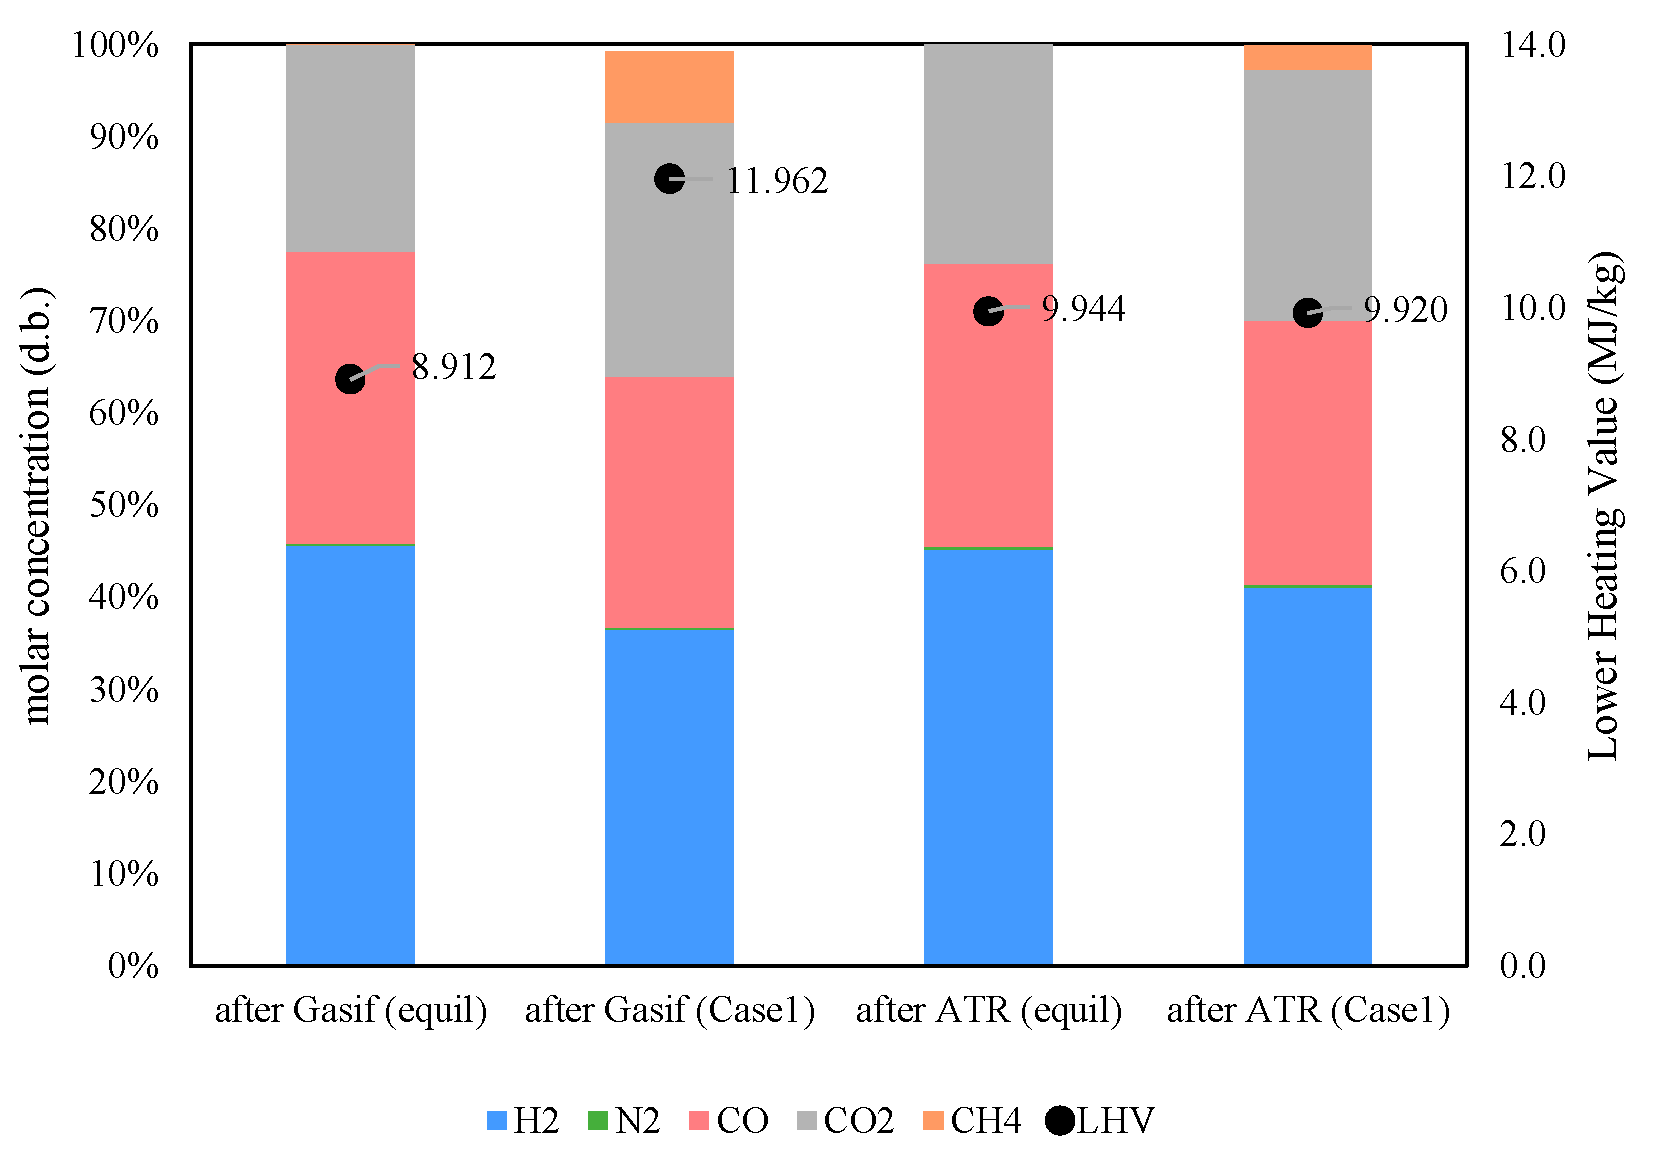
Figure 10 shows, the syngas composition and calorific value after the gasifier differ visibly from those obtained with an equilibrium-based model (RGIBBS), which precludes a meaningful sensitivity analysis of critical parameters such as the gasifier temperature and the steam-to-oxygen ratio. This could be achieved by expanding the model with additional experimental data and a broader range of tested conditions, thereby enabling the extraction of further factors governing the formation of non-equilibrium compounds. The ATR, by contrast, operates very close to equilibrium: The two syngas streams downstream of the ATR have very similar compositions, apart from the methane content, and almost the same LHV. This increases confidence in a parametric investigation of the ATR operating parameters, such as the syngas inlet temperature and the steam-to-oxygen (S/O) ratio, allowing robust and reliable conclusions to be drawn regarding the yields of the main components and the overall energy balance. The sensitivity analyses that follow were therefore carried out for Case 1.
Figure 10.
Main syngas species composition after gasification and after ATR.
Figure 10.
Main syngas species composition after gasification and after ATR.
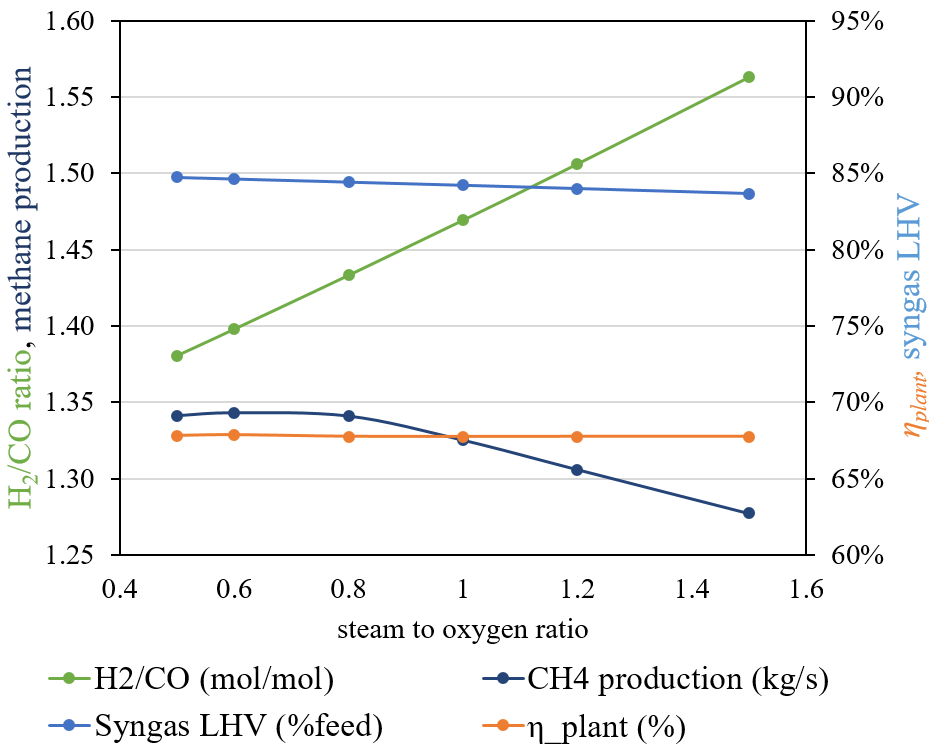
Figure 11 shows the effect of the S/O ratio at the ATR on syngas quality and plant performance. As the S/O ratio increases, the H
2/CO ratio rises while CH
4 production decreases slightly because more CO
2 is produced at the ATR at the expense of CO. This is also reflected in the small decrease in the syngas heat content: although more H
2 is produced, more CO must be oxidised to maintain autothermal conditions in the reactor.
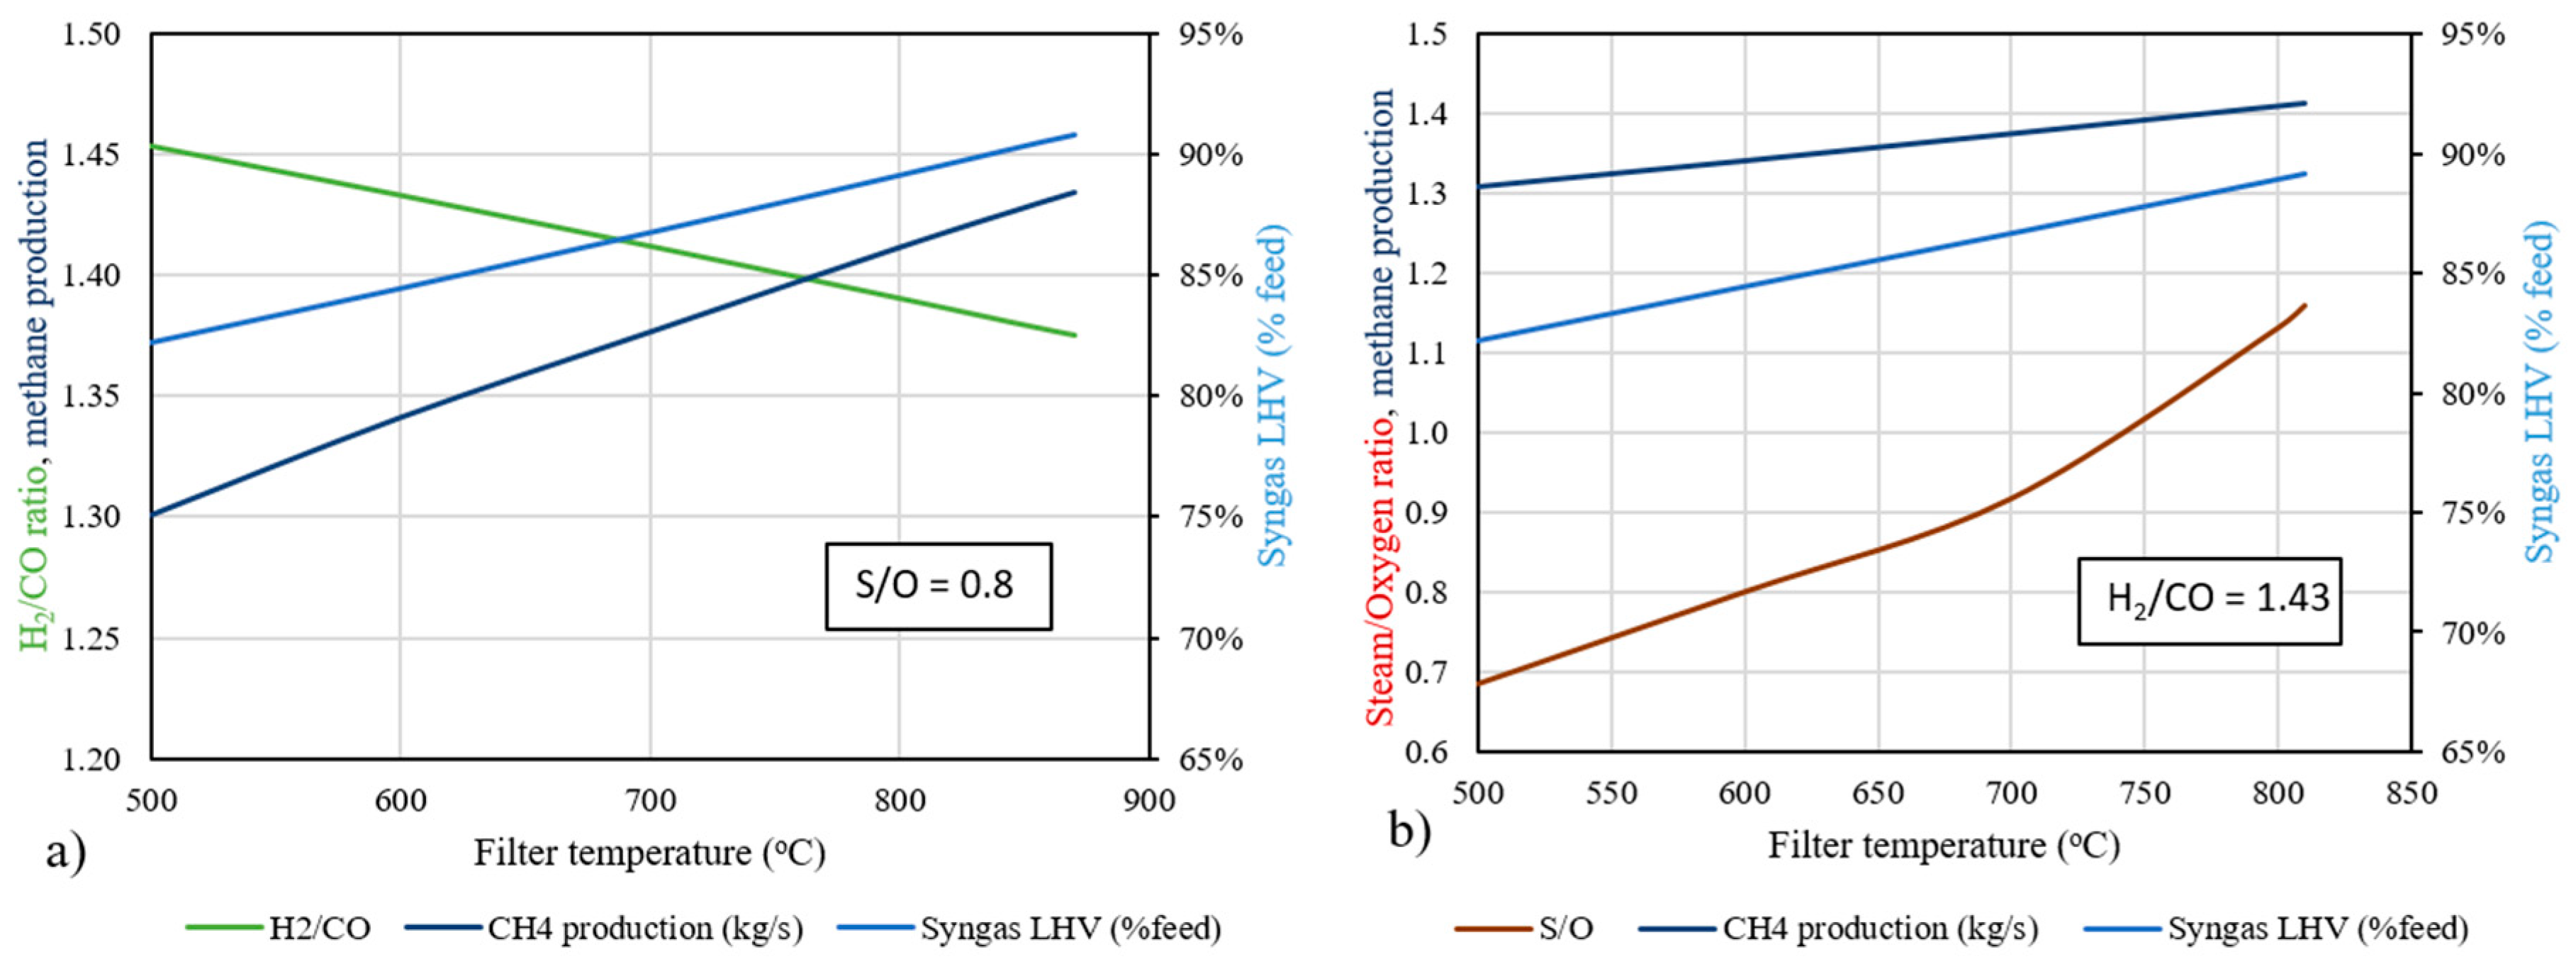
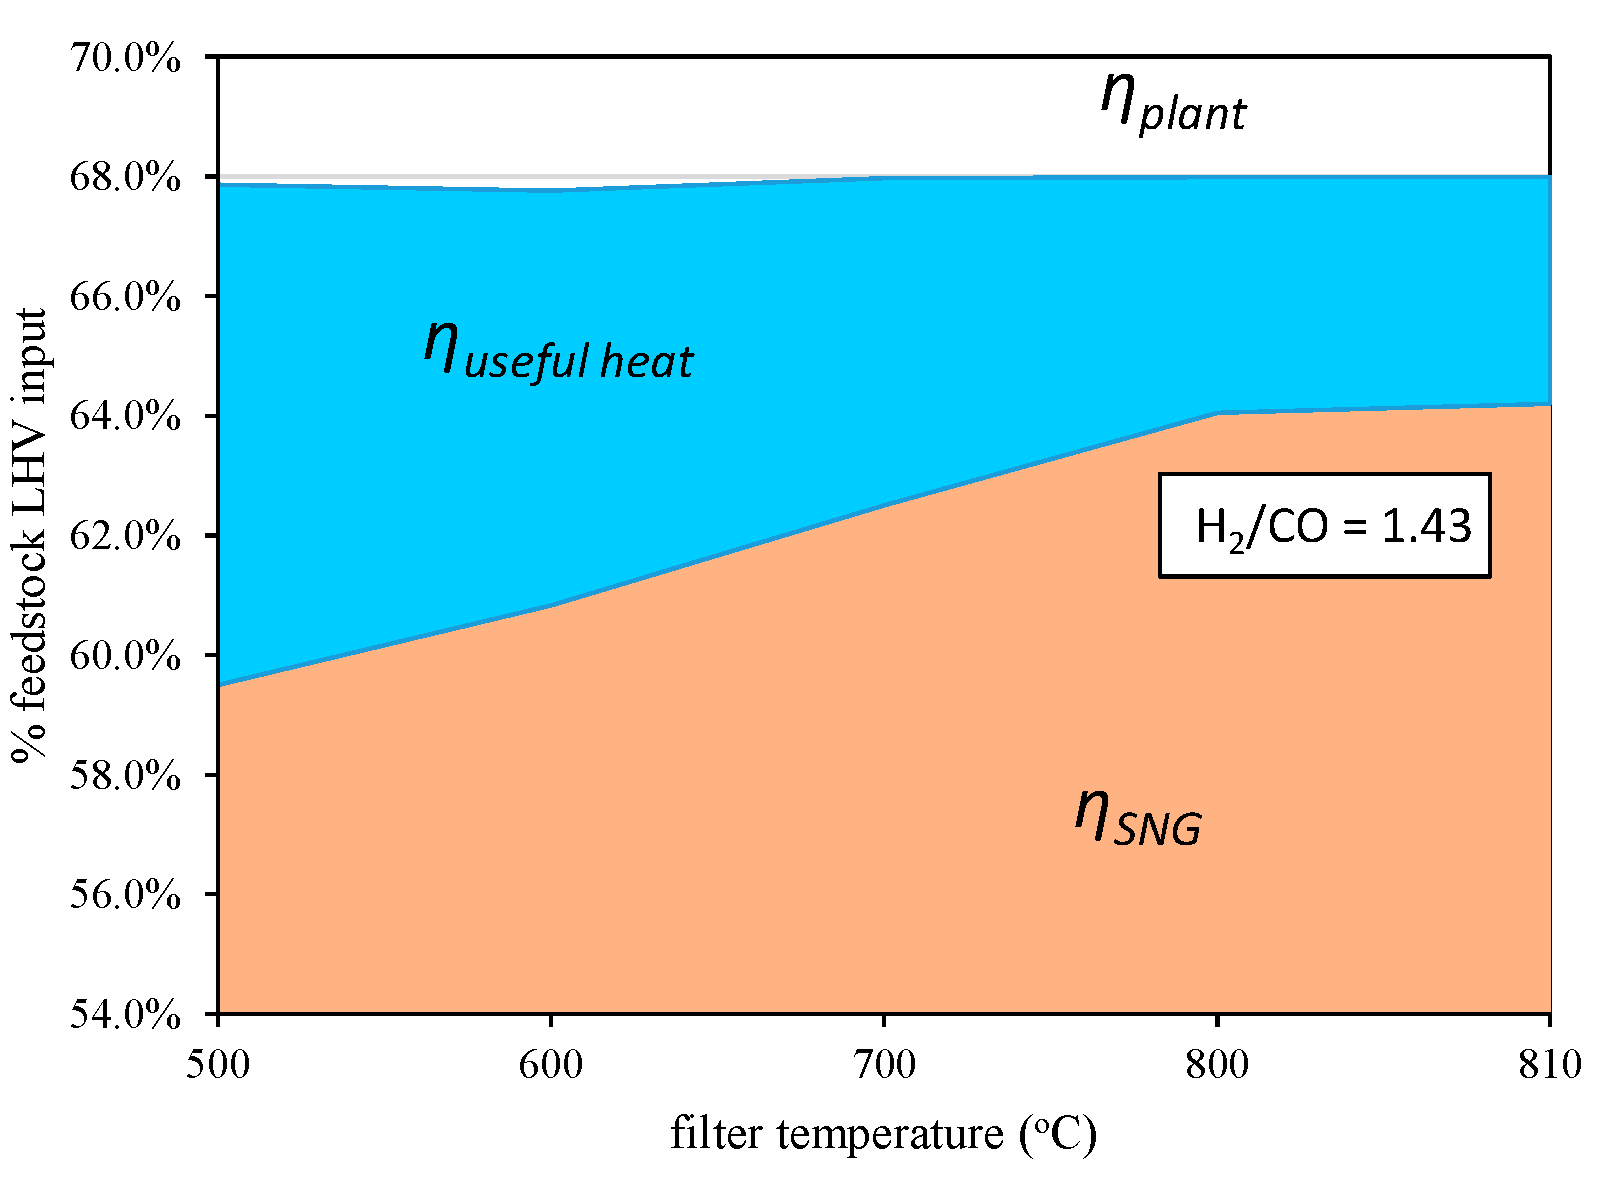
The effect of the filter temperature on the ATR and plant performance is also assessed. A higher syngas inlet temperature reduces the oxygen consumption required to maintain the ATR temperature at 870 °C (
Figure 12). As a result, less CO
2 is formed, which increases both the heating value of the reformate syngas and the methane production rate, whether the S/O ratio (
Figure 12a) or the H
2/CO ratio (
Figure 12b) is held constant.
As shown in
Figure 13, the SNG production efficiency increases up to 810 °C. As the syngas inlet temperature at the ATR is closer to the reformer operating temperature, less oxygen is needed to achieve autothermal conditions, which translates into more available syngas for methane synthesis. Above 810 °C, the heat available is insufficient to generate the steam required by the gasifier and the reformer. Accommodating this would require substantial modifications to the plant’s design, namely a different heat integration approach and a reduction in steam temperature from 350 °C to 275 °C. Because this altered configuration no longer represents the same process, it does not allow safe conclusions to be drawn about the process behavior in this temperature range. For this reason, the sensitivity analysis is limited to temperatures up to 810 °C. It should be noted that the overall plant efficiency remains stable at 68%, as the energy content of the biomass feedstock that is not converted into SNG can be recovered as useful heat. Nevertheless, the inclusion of the hot gas filter for ash and biochar removal, which is resistant to higher temperatures, can enhance SNG productivity by 7.5% and reduce overall electricity consumption by more than 1%.
Although the implementation of a high-temperature filter introduces additional capital costs compared with conventional lower-temperature filtration systems, mainly due to the requirement for advanced ceramic materials, high-temperature sealing systems, and enhanced thermal resistance, these costs must be evaluated against the improved process performance. In addition, operating the filter at elevated temperatures may lead to increased pressure losses and potentially higher maintenance requirements. However, the hot-filter configuration avoids significant cooling and reheating steps, thereby improving the thermal integration of the process and increasing SNG productivity by 7.5%. A detailed techno-economic assessment would be required to quantify the economic trade-off between the additional investment cost and improved process efficiency.
In the present work, the two operating modes (maximization and co-production) are represented as distinct operating points under stable conditions so that the dynamics of the transition between them fall outside the scope of the steady-state simulation. This switch raises some practical considerations, which are summarised below and flagged for a dedicated follow-up study.
For the thermal stabilization of the system during the transition from co-production to maximization, a coordinated shift of several coupled parameters occurs, since, for the bark cases, the gasification temperature is raised from 820 to 880 °C, the steam-to-oxygen ratio drops from 1.5 to 1.2 kg/kg, and carbon conversion increases from 90 to 98% (
Table 2). Since the fluidised bed carries a substantial thermal and material inventory, the ≈60 K increase propagates through the system with a finite time constant. The gasifier requires a period to reach higher temperatures under the revised O
2/steam feed, and the raw syngas composition and tar loading pass through a transient phase before the new steady state is reached. This transient, in turn, perturbs the ATR, which must sustain its outlet temperature (≈870 °C) under autothermal conditions, as well as the downstream methanation and CO
2 removal steps, for which their catalyst and solvent systems have their own stabilisation dynamics. Off-specification biomethane produced during the ramp might need to be diverted to a flare or auxiliary burner until pipeline-quality SNG is restored. The heat integration network rebalances as well, given that the waste heat differs markedly between the modes (37.8% of the SNG heat input in Case 2 against 53.8% in Case 1) so that steam generation and district heat delivery shift during the transition and the HRSG must accommodate the changing duty. Where the bed material also differs between modes (100% sand in co-production instead of a sand–dolomite mixture in maximisation mode), the associated bed-inventory drainage and make-up constitutes a discrete logistical operation that further lengthens the effective switching time.
Concerning biochar storage for the city refinery concept, the two modes are asymmetric with respect to biochar, which is a product in the co-production mode but a co-gasification feedstock in the maximisation mode. Hence, intermediate buffering is required to decouple the two in time. Silo storage is the natural solution, and it is sized to bridge the mismatch between production and consumption, but the biochar’s inherent properties make it prone to self-heating so that the storage design should provide temperature monitoring and, where appropriate, inert blanketing to manage the associated handling and safety risks.
Finally, a dedicated operation-planning study would formalise these aspects into an annual dispatch problem, determining the operating hours allocated to each mode to satisfy biochar self-sufficiency over the planning horizon without external biochar supply, to match the biomethane and biochar output to prevailing market demand and prices. The sizing of the biochar buffer would be a function of the switching frequency and the durations of each mode, aiming to minimize the number of switches. Moreover, the seasonal feedstock-supply logistics should be integrated, taking into account the intermittent availability of straw and the contractual supply of SRF. Such an analysis, formulated for instance as a scheduling optimisation, would establish the operational envelope within which the flexibility of the “one plant, two modes” concept can be realised in practice.






 ,
,