Article

A Comparative Study of a Single-Phase Immersion-Cooled Server with a Pin-Fin Heat Sink for Mitigation of the Flow Bypass Effect


Department of Mechanical Engineering, National Yang Ming Chiao Tung University, Hsinchu 300, Taiwan
*
Author to whom correspondence should be addressed.
Processes 2026, 14(13), 2209; https://doi.org/10.3390/pr14132209
Submission received: 20 May 2026 / Revised: 2 July 2026 / Accepted: 4 July 2026 / Published: 6 July 2026

Abstract

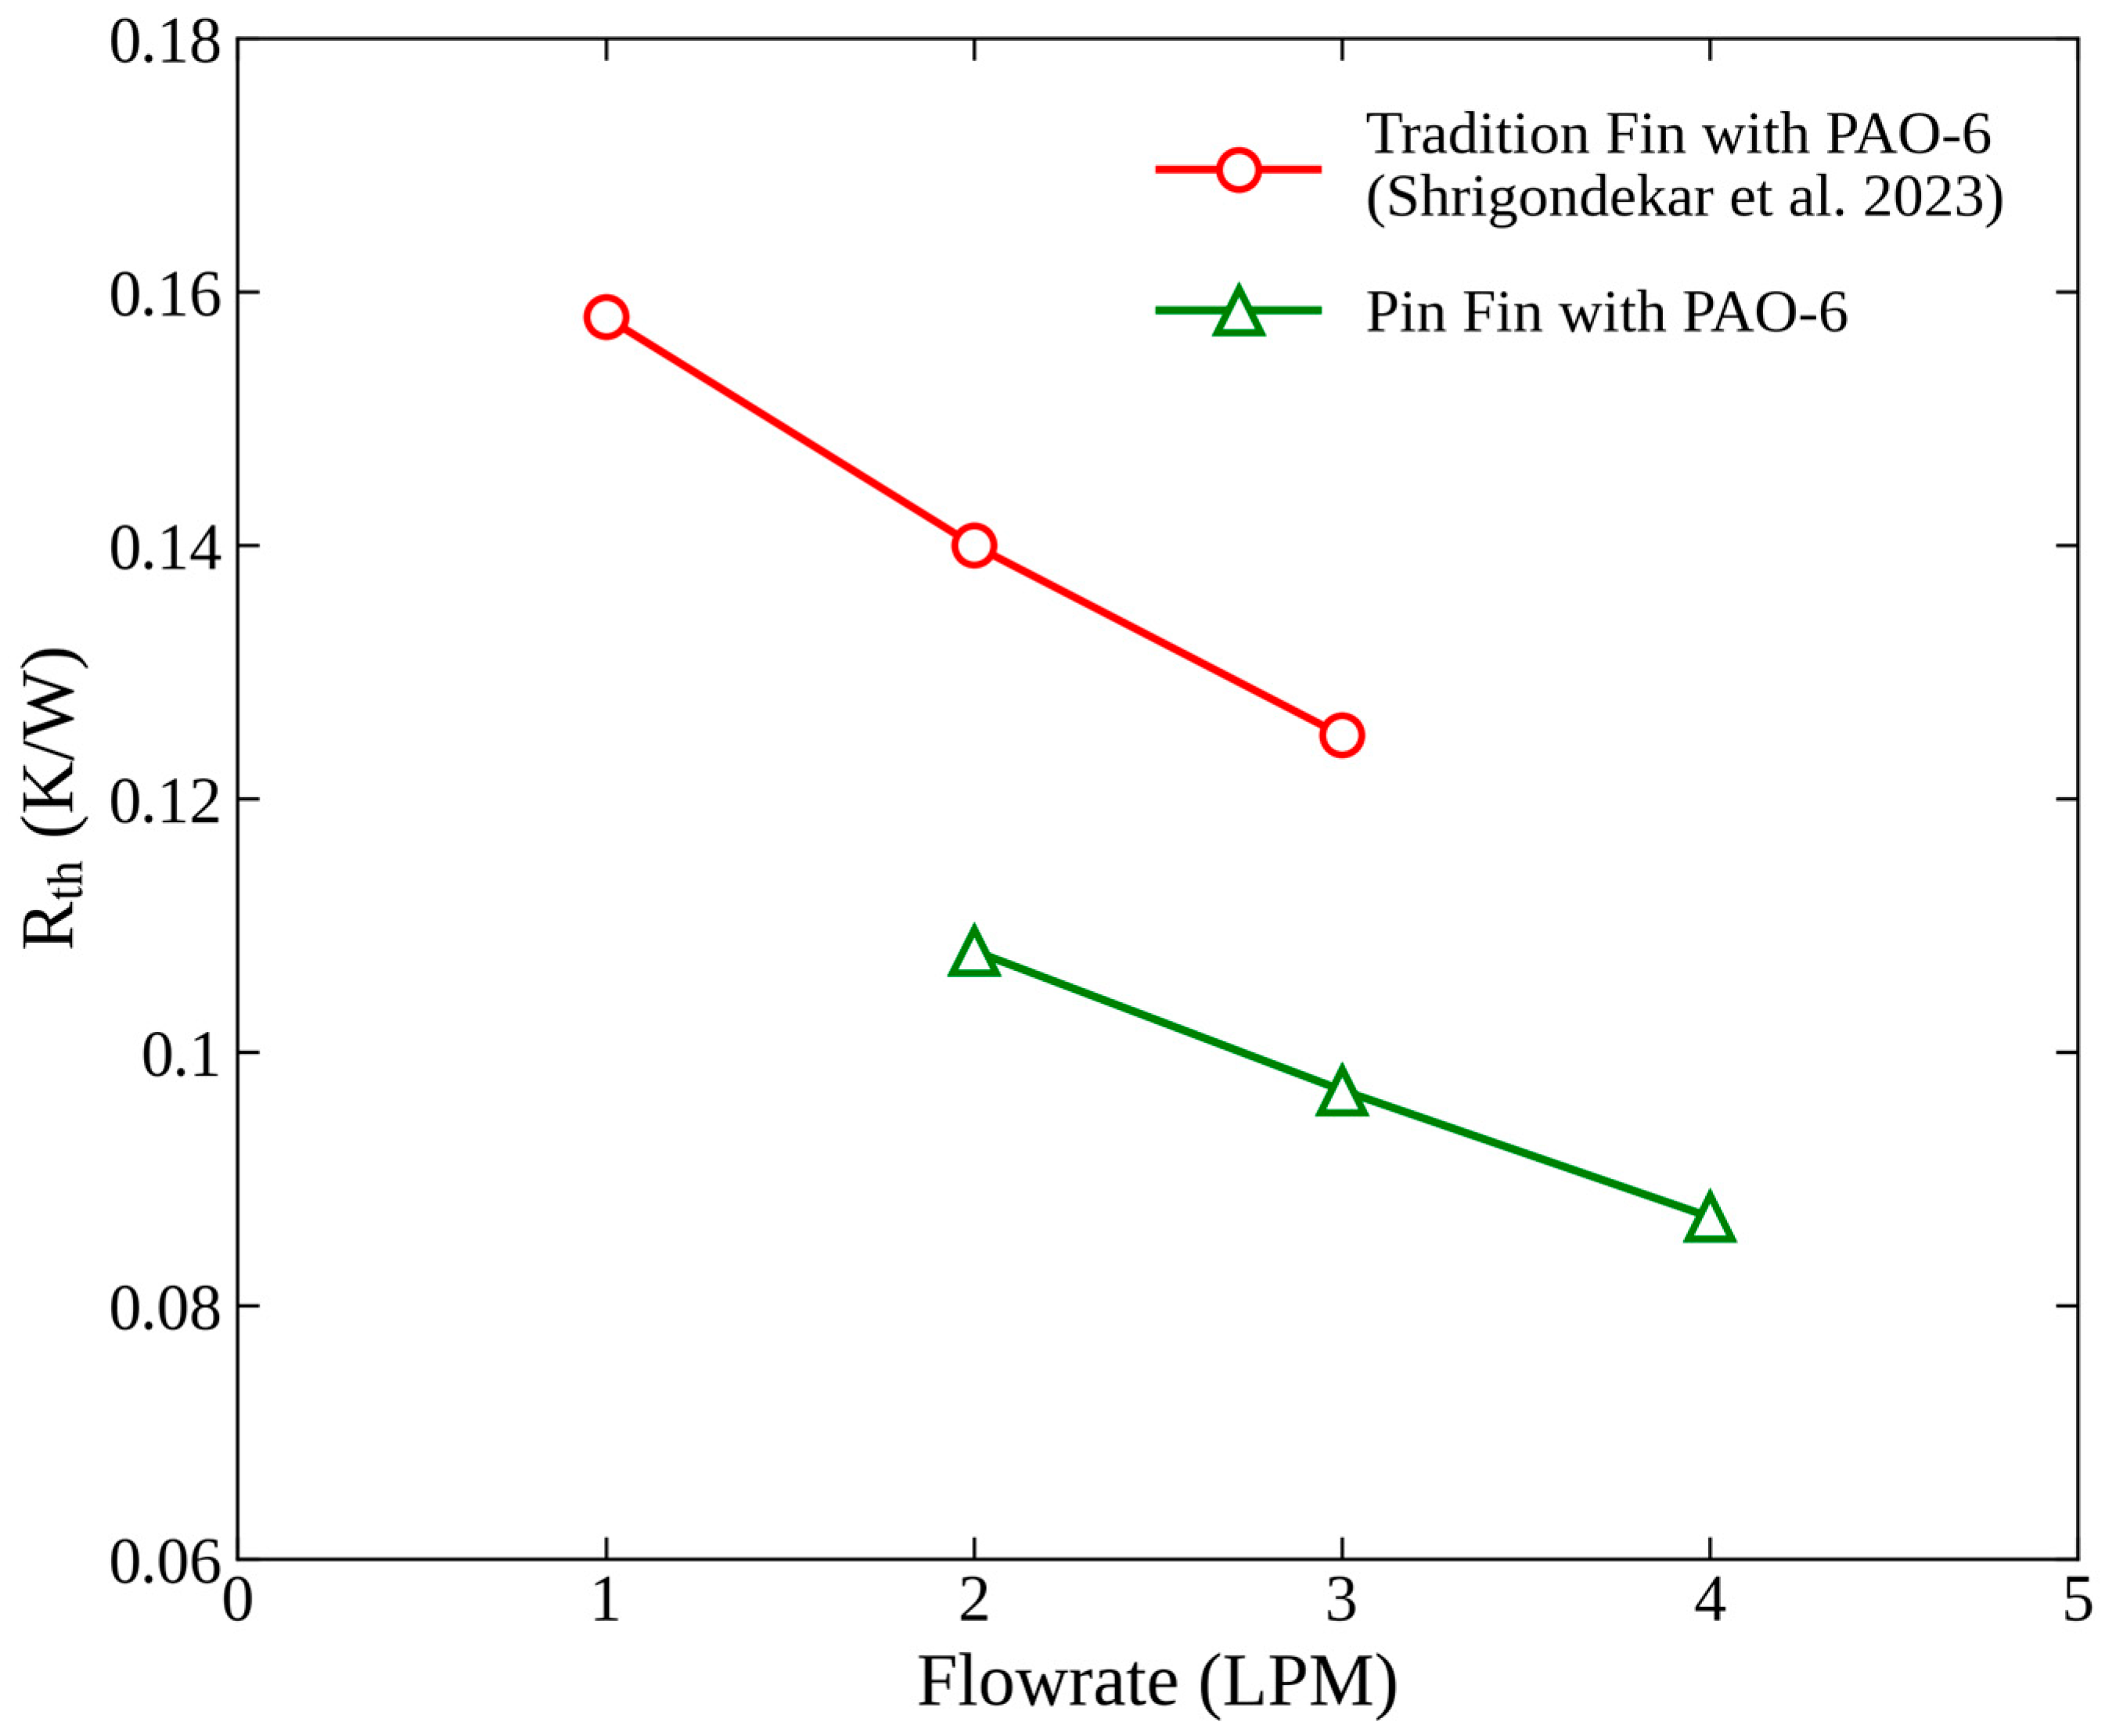
Single-phase oil immersion is a promising alternative to air cooling for high-power servers, but the high viscosity of dielectric fluids amplifies the bypass flow around the CPU heat sink via the adjacent random-access memory (RAM) channels, degrading thermal performance. A simplified hydraulic-thermal analysis shows that this bypass penalty cannot be eliminated by reducing the fin pitch of a rectangular-fin heat sink alone. A staggered pin-fin heat sink is therefore proposed, with pin diameter D, longitudinal pitch Sd, and transverse pitch St optimized by three-dimensional CFD using PAO-6. The optimum geometry is D = 2.8 mm, St = 6 mm, Sd = 8.45 mm. The heat sink is fabricated and tested in a commercial server at oil inlet temperatures of 30–45 °C and flow rates of 3–6 LPM. At 3 LPM, the pin-fin immersion server reduces the CPU thermal resistance by 22.29% relative to a rectangular-fin immersion server using the same oil, and by 38.37% relative to an air-cooled server. The partial Power Usage Effectiveness (pPUE) reaches 1.015, an 88.09% improvement over the air-cooled baseline (pPUE = 1.126), confirming that pin-fin geometries effectively mitigate the bypass penalty in single-phase oil immersion cooling.

1. Introduction

The widespread adoption of artificial intelligence, cloud computing, and big-data services has accelerated the growth of data-center infrastructure, making electricity consumption from data centers an increasingly important concern over the coming decade [1,2,3,4]. Within a typical air-cooled facility, approximately 40% of the electrical energy is consumed by the cooling infrastructure itself [5], and the reliability and computational performance of the IT equipment are tightly coupled to the effectiveness of the thermal management system [6,7]. As chip-level heat fluxes continue to rise, conventional air cooling must compensate for the low thermal conductivity of air through large extended-surface heat sinks and high-power fans, leading to high pumping power and acoustic emissions [8,9,10,11]. Liquid cooling, utilizing the higher heat capacity and thermal conductivity of working fluids, has accordingly become the mainstream solution for high-performance computing [12,13]. Among the available liquid-cooling options, including indirect cold-plate cooling, single-phase immersion, and two-phase immersion, single-phase oil immersion provides a favorable balance of heat-dissipation capability, system simplicity, capital cost, and operational stability [14,15,16]. Although two-phase immersion can yield more than 70% higher heat-removal capability than single-phase immersion, its cost is approximately five times that of the single-phase counterpart [17], and it is susceptible to pressure-drop oscillations and parallel-channel instabilities [18]. Consequently, single-phase oil-based immersion cooling has emerged as one of the most promising candidates for next-generation data-center cooling [19,20,21,22,23].
Server-level single-phase immersion cooling has been studied from three complementary perspectives: the selection of the dielectric coolant, the structural design of the tank and server, and the enhancement of component-level heat transfer. With respect to coolant selection, Eiland et al. [24] fully submerged a single server in mineral oil and varied the oil flow rate and inlet temperature, demonstrating that adequate CPU cooling can be sustained at inlet temperatures as high as 45 °C in combination with low oil flow rates, thereby identifying the potential of immersion cooling for low-energy data-center operation. Shinde et al. [25] performed similar tests on a server motherboard immersed in a synthetic dielectric fluid and reported up to a 16.83% reduction in total server power consumption relative to air cooling. Huang et al. [26] compared pump-driven and buoyancy-driven single-phase immersion tanks and showed that pump-driven operation lowers the average coolant temperature and the PUE relative to natural convection.
From the perspective of structural design, Wang et al. [27] employed a three-dimensional CFD model of a server to evaluate single-phase immersion cooling and used the model to optimize the tank and server architecture. Li et al. [28] modified the internal server structure by introducing baffles adjacent to the CPU to redistribute the pressure drop; a configuration with three baffles produced a measurable reduction in CPU temperature relative to the un-baffled case while incurring only a modest pressure-drop penalty. Muneeshwaran et al. [29] extended this work using FC-40 in a 1U platform and investigated the inlet/outlet port arrangement (T- and Z-configurations), the bypass effect, the suction-fan placement, and three heat-sink base designs (solid, vapor-chamber, and heat-pipe bases) over flow rates of 1–3 LPM and inlet temperatures of 15–35 °C. The T-configuration provided a 12.6% reduction in thermal resistance and a 0.5–2.8 °C reduction in CPU case temperature relative to the Z-configuration, while heat-pipe and vapor-chamber bases reduced the maximum case temperature from 60 °C (flat-plate base) to 56.7 °C and 55.2 °C, respectively.
For performance enhancement, Shrigondekar et al. [30] experimentally and numerically examined a 1U server using two dielectric working fluids, FC-40 and PAO-6, over a heat-load range of 100–600 W and a flow-rate range of 1–3 LPM. They reported that, for PAO-6, the thermal resistance of heat sinks with smaller fin pitch was 19–43% higher than that of heat sinks with larger fin pitch, an outcome they attributed directly to a more pronounced bypass of the highly viscous oil around the densely finned heat sink. Huang et al. [31] introduced localized jet impingement within the immersion tank and reported a 92.5% increase in the local Nusselt number and a 20 °C reduction in peak temperature, confirming that targeted, geometry-level interventions are an effective route to mitigating the viscosity-induced penalty. Across these related studies, two consistent observations emerge: the bypass of the working fluid around the heat sink severely degrades the heat-dissipation performance when the fluid viscosity is high, and the placement of components on the printed-circuit board, together with the resulting flow distribution, exerts a first-order influence on the thermal management of every component on the server [32]. Viscosity is therefore a pivotal property in oil immersion cooling [33], and the practical implication is that controlling the oil flow distribution at the server scale is essential for effective heat removal [34]. Optimizing the heat-sink geometry is a direct route to this goal [35].
From the perspective of performance enhancement and coolant flow mode, Huang et al. [26] compared pump-driven and buoyancy-driven single-phase immersion tanks and showed that pump-driven operation lowers the average coolant temperature and the PUE relative to natural convection. Huang et al. [31] introduced localized jet impingement within the immersion tank and reported a 92.5% increase in the local Nusselt number and a 20 °C reduction in peak temperature, confirming that targeted, geometry-level interventions are an effective route to mitigating the viscosity-induced penalty. Organized around coolant selection, structural design, and performance enhancement, these observations motivate the geometry-focused approach adopted here.
In the broader heat-transfer literature, staggered pin-fin geometries have been shown to outperform parallel rectangular fins under both forced convection and constrained-channel conditions [36,37,38,39,40,41,42,43], owing to their enhanced flow mixing, restart of the thermal boundary layer at each pin row, and more favorable trade-off between heat-transfer enhancement and pressure drop. Despite this maturity, the application of pin-fin heat sinks within single-phase oil-immersed servers has received limited attention, particularly regarding the interaction between pin-fin geometry and the bypass flow imposed by adjacent RAM channels. Most previous immersion-cooling experiments have either used simplified thermal-test-vehicle (TTV) boards or modified server structures, rather than complete production servers populated with multiple heat sources. The present study addresses this gap. Inlet and outlet ports were machined directly on the external chassis of a commercial server, and the server was immersed in PAO-6. A pin-fin heat sink was installed on the CPU, while the original rectangular-fin heat sinks were retained on the graphics processing units (GPUs). The pin-fin geometry was first optimized by a series of three-dimensional CFD simulations covering the pin diameter, longitudinal pitch, and transverse pitch. The optimized geometry was subsequently fabricated and evaluated experimentally under different oil inlet temperatures and flow rates. Its thermal performance was then assessed by comparing the pin-fin immersion server with a geometrically comparable rectangular-fin immersion server reported in the open literature and with the corresponding air-cooled server. The comparison further includes the partial Power Usage Effectiveness (pPUE) of all three systems.
The present study makes three contributions. First, a staggered pin-fin heat sink is applied and optimized inside a complete, commercially populated single-phase oil-immersed server, rather than a thermal-test-vehicle board or a modified structure as in most previous immersion experiments. Second, a simplified hydraulic-thermal model of the bypass flow is derived that explains why reducing the fin pitch of a rectangular-fin heat sink cannot remove the bypass penalty, and that motivates the pin-fin geometry. Third, the optimized heat sink is demonstrated experimentally in a real server with chassis-integrated oil ports, under controlled inlet-temperature and flow-rate conditions, and is benchmarked against both a rectangular-fin immersion server and an air-cooled server on the same platform.

2. Methodology

2.1. Definition of the System Thermal Resistance

Because the CPU is the dominant heat source in the server and usually experiences the highest local heat flux, the CPU-to-inlet thermal resistance is used as the primary performance metric in this study:
R t h = T c a s e T i n Q
where Tin is the fluid inlet temperature (°C), Tcase is the temperature measured at the geometric center of the CPU integrated heat spreader (°C), and Q is the electrical power dissipated by the CPU (W).

2.2. Governing Relations

The simplified analysis uses the standard heat-transfer and fluid-flow relations summarized below. The one-dimensional Fourier conduction equation is
Q = k A d T d x
Newton’s law of cooling and the bulk energy balance are written as
Q = h A Δ Τ
Δ T = T w T f
T f = T i n + T o u t 2
T o u t = T i n + Q c p ρ V ˙
where h is the convective heat-transfer coefficient (W/m2∙K), Tw is the average wetted-wall temperature, Tf is the mean bulk-fluid temperature, cp is the specific heat capacity (J/kg∙K), V ˙ is the volumetric flow rate (m3/s), and ρ is the fluid density (kg/m3).
Equation (3) is applied under steady-state, single-phase conditions, with h interpreted as the convective coefficient averaged over the wetted area and Tw approximated by the CPU case temperature. The constant-coefficient form used in the simplified analysis is valid in the fully developed laminar regime, which holds here because the estimated hydrodynamic and thermal entry lengths (0.2 to 2.4 mm) are short compared with the channel length (60 to 118 mm).
The Reynolds number based on the hydraulic diameter is
R e = ρ u c D h μ
where uc is the mean channel velocity (m/s), Dh is the channel hydraulic diameter (m), and μ is the dynamic viscosity (Pa∙s). The frictional pressure drop along a channel of length L is expressed as
Δ p = 4 L D h f 1 2 ρ u 2
where f is the Fanning friction factor. For laminar flow in a rectangular channel with an aspect ratio of approximately 0.25 to 0.35, the hydrodynamic entry length Lhy is estimated by
L h y = 0.08 D h R e

2.3. Simplified Analysis of the Bypass Flow at the CPU Heat Sink

Before deriving the bypass model, the following assumptions are adopted to obtain a tractable one-dimensional relation. The CPU heat sink and the RAM-side passages are treated as two parallel hydraulic paths connected between the same upstream and downstream regions. Entrance, exit, contraction, and expansion losses are neglected, so both paths experience the same pressure difference. The oil is treated as incompressible, fluid properties are evaluated at the operating bulk temperature, and the flows in both paths are taken to be laminar and hydrodynamically fully developed. Fin thickness is neglected only when deriving the closed-form dependence on fin spacing. The overall surface efficiency of the finned region is set to unity. Heat spreading and conduction resistances inside the heat sink are neglected, so the average wetted-wall temperature is approximated by the CPU case temperature, Tw ≈ Tcase. The fin-channel Nusselt number is treated as constant in the fully developed laminar regime.
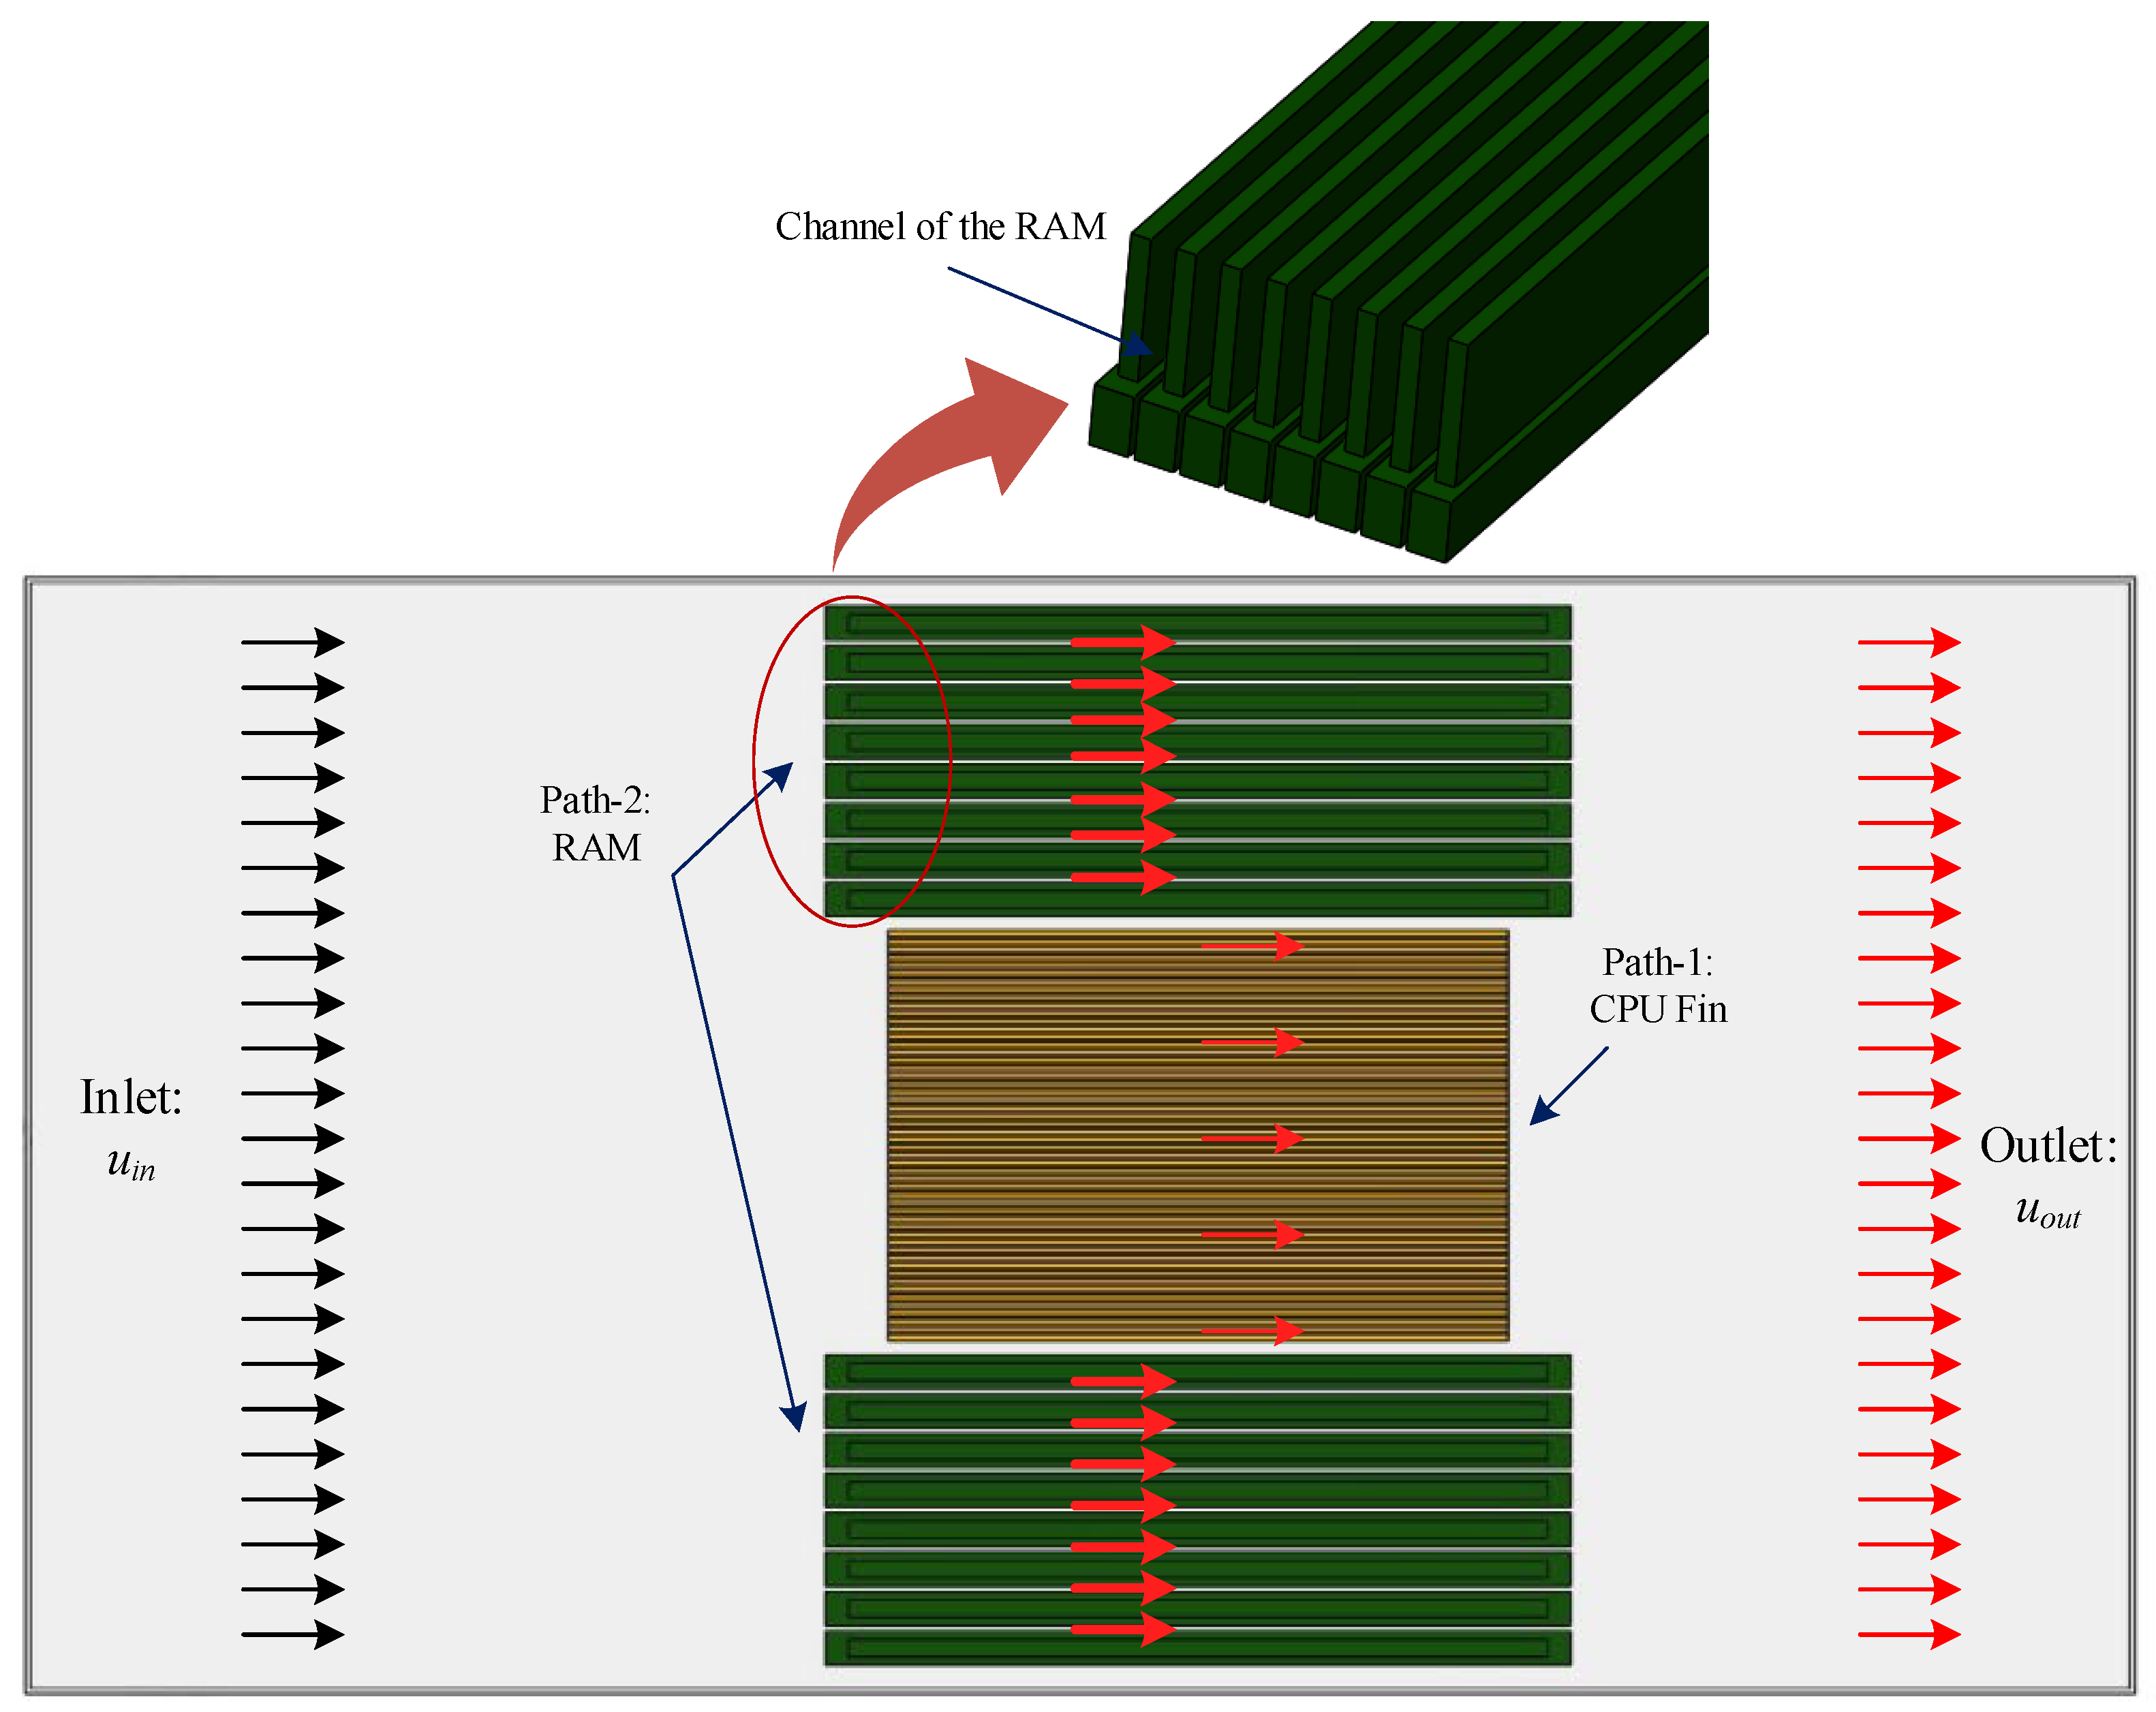
These assumptions are used to isolate the bypass effect caused by the motherboard layout. The high viscosity of dielectric oil increases the flow resistance of densely spaced rectangular fin channels, while the comparatively open passages around the RAM banks provide a lower-resistance route. The inlet flow is therefore idealized as splitting into two paths: path 1 through the CPU heat-sink channels and path 2 through the RAM-side passages. The flow-path model is shown in Figure 1. In this model, L is the streamwise heat-sink length, B is the heat-sink width, H is the fin height, xc is the fin spacing, LR is the RAM-channel length, A2 is the RAM-channel flow cross-sectional area, and Dh,R is the RAM-channel hydraulic diameter.
Let uf denote the mean fluid velocity in the fin channels, and uR denote the mean velocity in the RAM channels. With minor entrance and exit losses neglected, the two parallel paths are subjected to the same overall pressure difference:
Δ p f = Δ p R
For PAO-6 and the volumetric flow range considered here, 1 to 3 LPM, the Reynolds numbers in both the fin and RAM paths are of the order of 350 or lower. With channel lengths of 60 to 118 mm, Equation (9) gives hydrodynamic entry lengths of about 0.2 to 2.4 mm, which are much shorter than the corresponding channel lengths. The flow is therefore approximated as hydrodynamically fully developed. For laminar, fully developed flow in a rectangular channel of aspect ratio a*, the friction factor is [44]
f R e = 24 1 1.3553 a * + 1.9467 a * 2 1.7012 a * 3 + 0.9564 a * 4 0.2537 a * 5
Because the fin spacing is much smaller than the fin height, a* is small and Equation (11) approaches the parallel-plate limit,
f R e 24
Combining Equation (12) with Equation (8) gives Δ p = 48 μ L u / D h 2 for fully developed laminar flow. Applying this expression to the fin path and the RAM path, and then using Equation (10), gives
48 μ L u f D h , f 2 = 48 μ L u R D h , R 2
Thus, the RAM-channel velocity can be related to the fin-channel velocity as
u R = L L R D h , R D h , f 2 u f
The analytical model evaluates the viscosity at the mean bulk temperature and holds it constant along the channel. Because the predicted flow split depends on the ratio of the two parallel hydraulic resistances, in which the viscosity cancels Equation (14), it is insensitive to this assumption. The bulk oil temperature rise across the heat sink is of order 7 K at 3 LPM, giving a viscosity change of order 15% that affects only the absolute pressure drop. The temperature-dependent viscosity is retained in the numerical model.
Continuity of the total volumetric flow gives
V t o t a l = V f + V R = u f A 1 + u R A 2
where A1 and A2 are the flow cross-sectional areas of the CPU heat sink and the combined RAM channels, respectively. Under the zero-fin-thickness approximation, the flow area available in the fin region is the product of the heat-sink width and fin height:
A 1 = B H
Equation (16) defines A1 as the area perpendicular to the streamwise flow direction in the fin region, rather than as the heat-sink projected area L∙B. This definition is consistent with the use of uf in the pressure-drop expression and with the definition of A2 for the RAM path.
Substitution of Equations (14) and (16) into Equation (15), followed by solving for the volumetric flow rate through the CPU heat sink, gives
V f = V t o t a l B H / B H + L L R D h , R D h , f 2 A 2
The thermal part of the model follows from Equations (1) and (3) to (6). With Tw ≈ Tcase and with the mean bulk-fluid temperature in the CPU path written as T f = T i n + Q / 2 c p ρ V ˙ f , the heat balance becomes Q = h f A f T c a s e T f . Therefore,
T c a s e T i n + Q h f A f + Q 2 c p ρ V f
To show the influence of fin spacing explicitly, the fin pitch is taken to be equal to the spacing xc in the zero-fin-thickness limit. The number of fins is N = B/xc, and the wetted heat-transfer area includes both side surfaces of the fins and the exposed base area:
A f = 2 N L H + L B = L B 2 H x c + 1 = L B 2 t + 1
where t = H/xc and it is not the fin thickness. Approximating each fin passage as a rectangular channel gives the fin-channel hydraulic diameter as
D h , f = 2 H x c H + x c = 2 H t + 1
The fin-channel Nusselt number is defined as
N u f = h f D h , f k f
where kf is the thermal conductivity of the working fluid. If Nuf is treated as constant for the fully developed laminar comparison, the convective term in Equation (18) becomes
1 h f A f = 2 H N u f k f L B t + 1 2 t + 1
Substituting the flow split in Equation (17) and the convective term in Equation (22) into Equation (18), and then using Equation (1), yields the following expression for the total thermal resistance:
R t h = 2 H N u f k f L B t + 1 2 t + 1 + L A 2 D h , R 2 t + 1 2 8 c p ρ V ˙ t o t a l L R B H 3 + 1 2 c p ρ V t o t a l
Equation (23) is not a second definition of thermal resistance. Rather, it decomposes the same CPU-to-inlet thermal resistance Rth defined by Equation (1) under the assumptions of the simplified bypass model. Equation (23) separates the total thermal resistance into three contributions. The first term represents convection between the wetted fin surface and the oil. For a fixed-size heat sink, increasing t corresponds to reducing the fin spacing, which increases the available wetted area and lowers the convective resistance. The second term represents the bypass penalty caused by the flow split between the CPU heat sink and the RAM path. It varies as t + 1 / 2 because smaller fin spacing reduces the hydraulic diameter of the CPU path, increases its hydraulic resistance, and diverts a larger fraction of the total flow through the RAM path. The third term is the bulk heat-capacity contribution associated with the total server flow rate and is independent of the heat-sink geometry.
Equation (23) leads to two practical conclusions. First, the bypass penalty of a rectangular-fin heat sink cannot be removed by decreasing fin pitch alone. A smaller pitch lowers the convective resistance, but it also increases the bypass term, so only an optimum fin spacing can be obtained for a given motherboard layout. Second, the bypass penalty can be mitigated by using a fin geometry that provides strong local heat transfer without relying on extremely narrow continuous channels. A staggered pin-fin array is suitable for this purpose because it enhances wake-induced mixing and repeatedly interrupts the thermal boundary layer while maintaining an acceptable hydraulic penalty. This is the reason that a pin-fin heat sink is adopted for the experimental part of this study.

2.4. Experimental System

2.4.1. System Framework

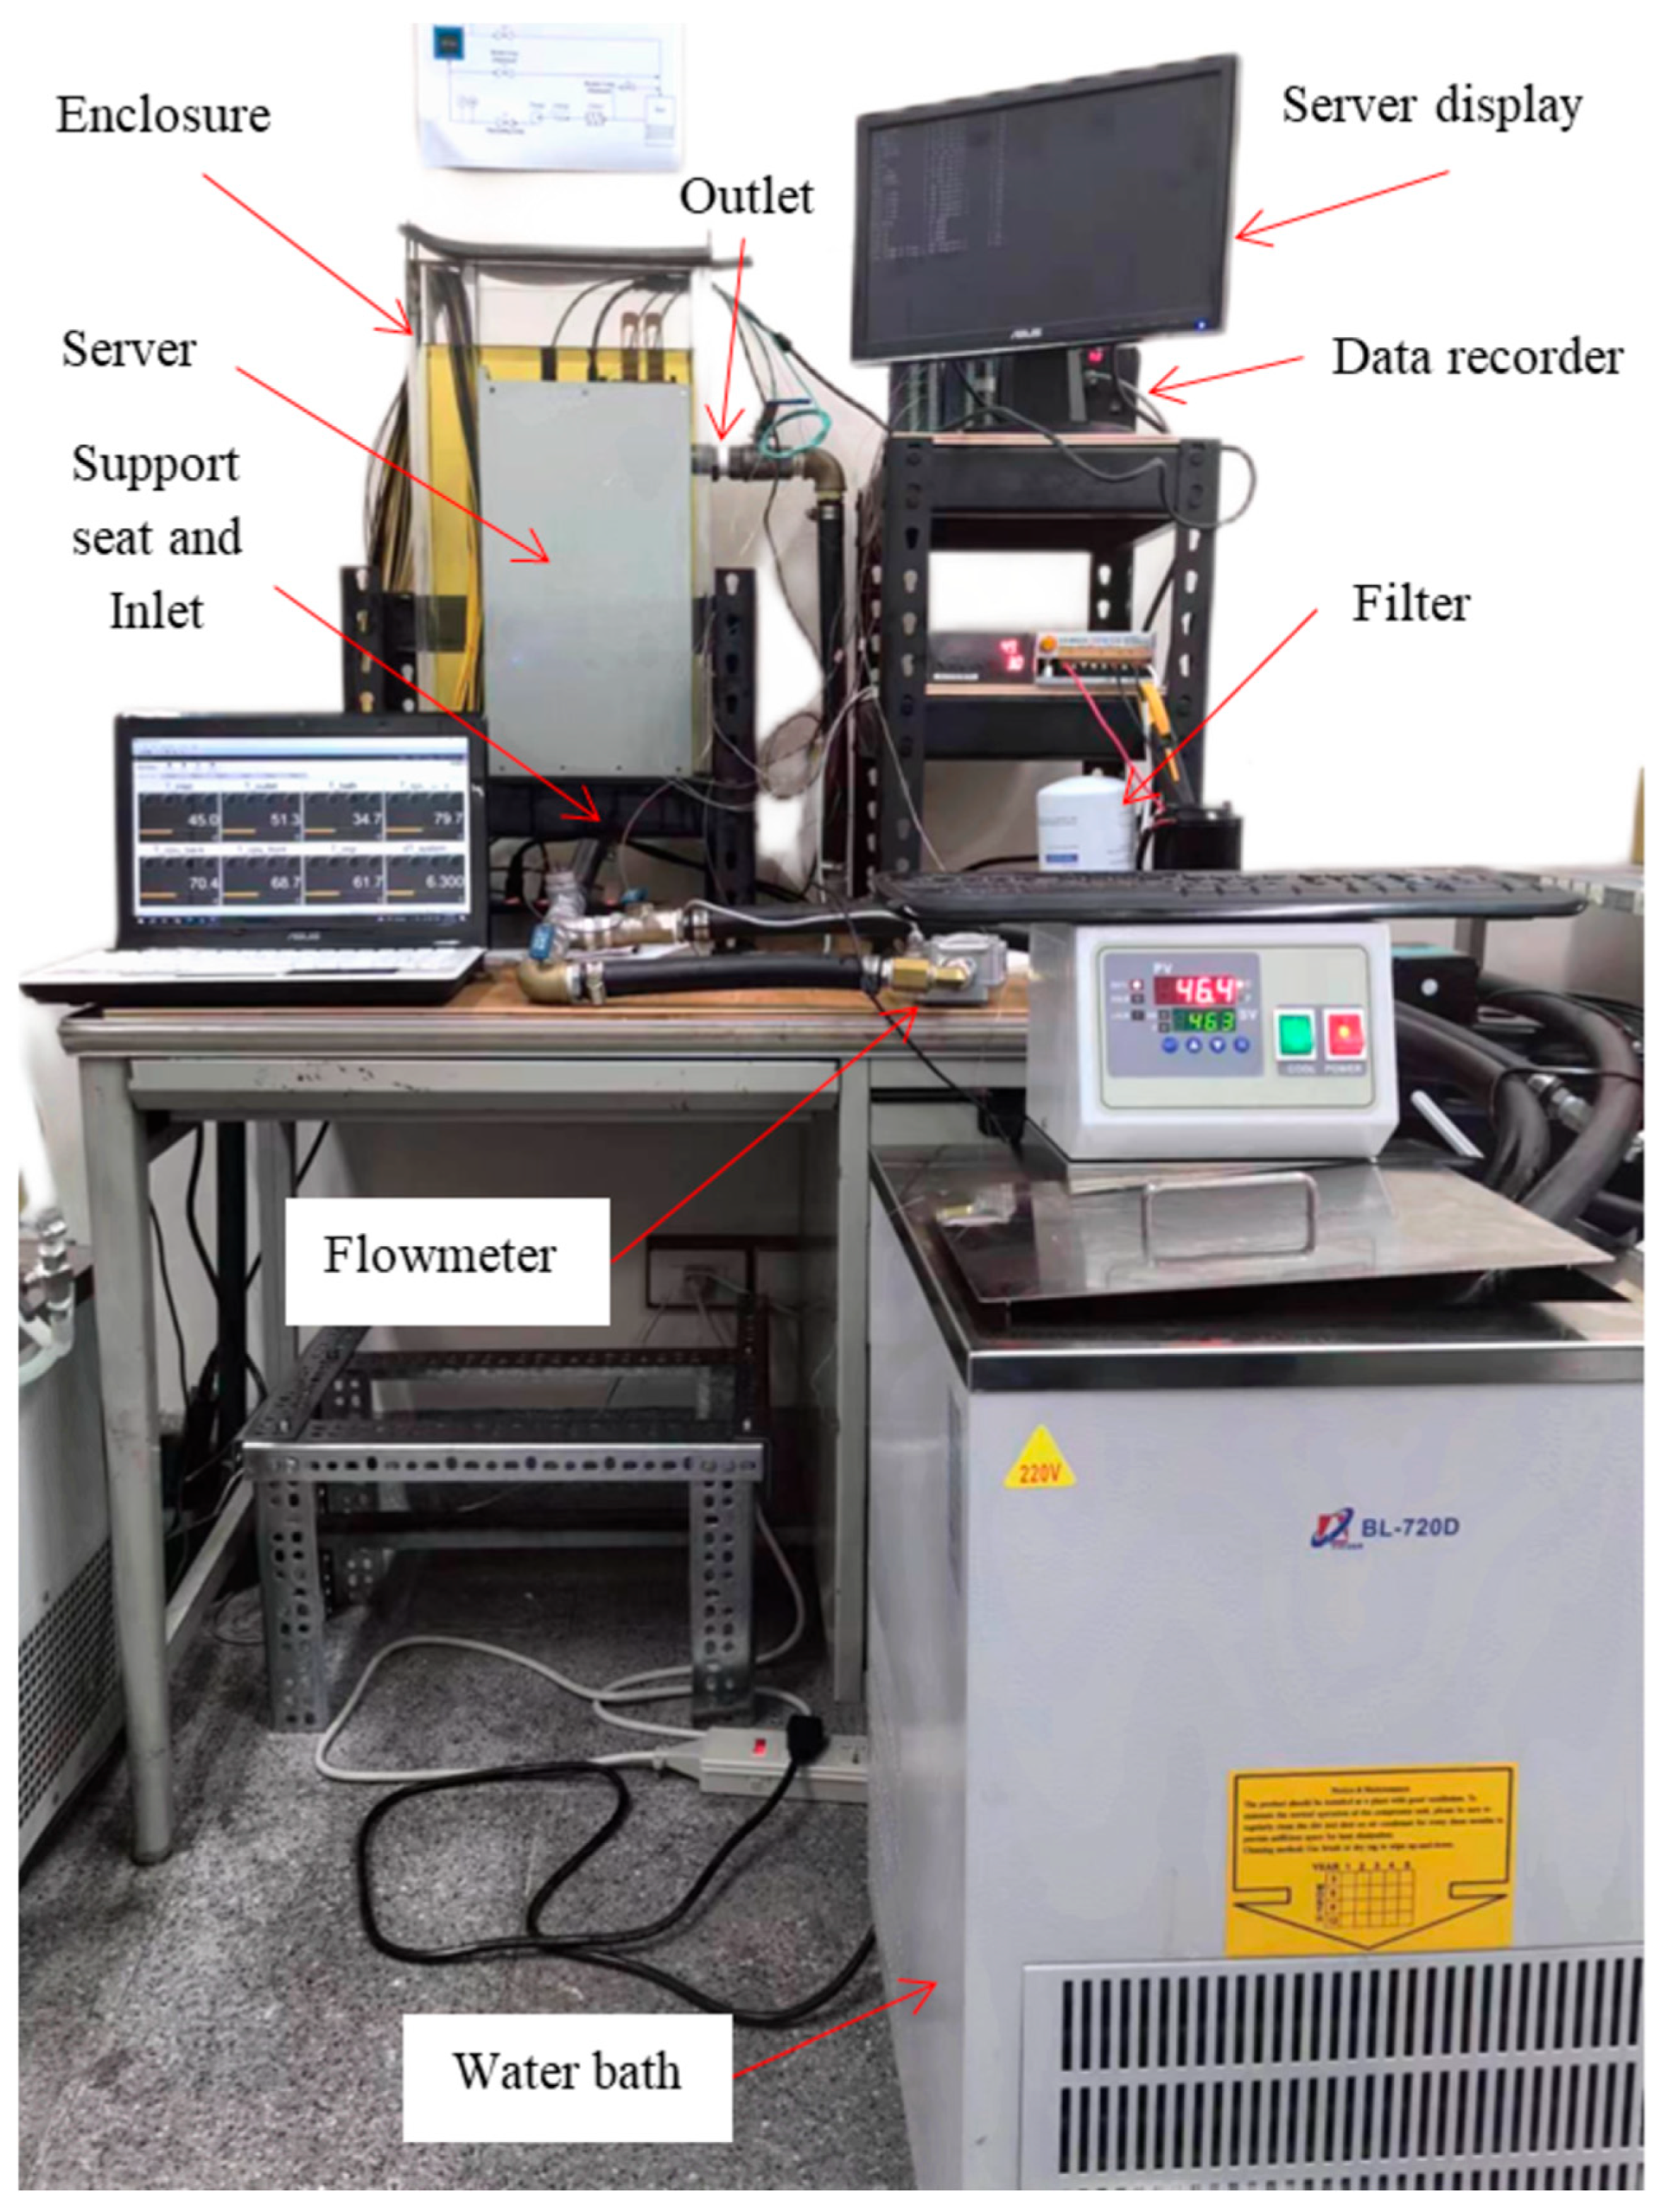
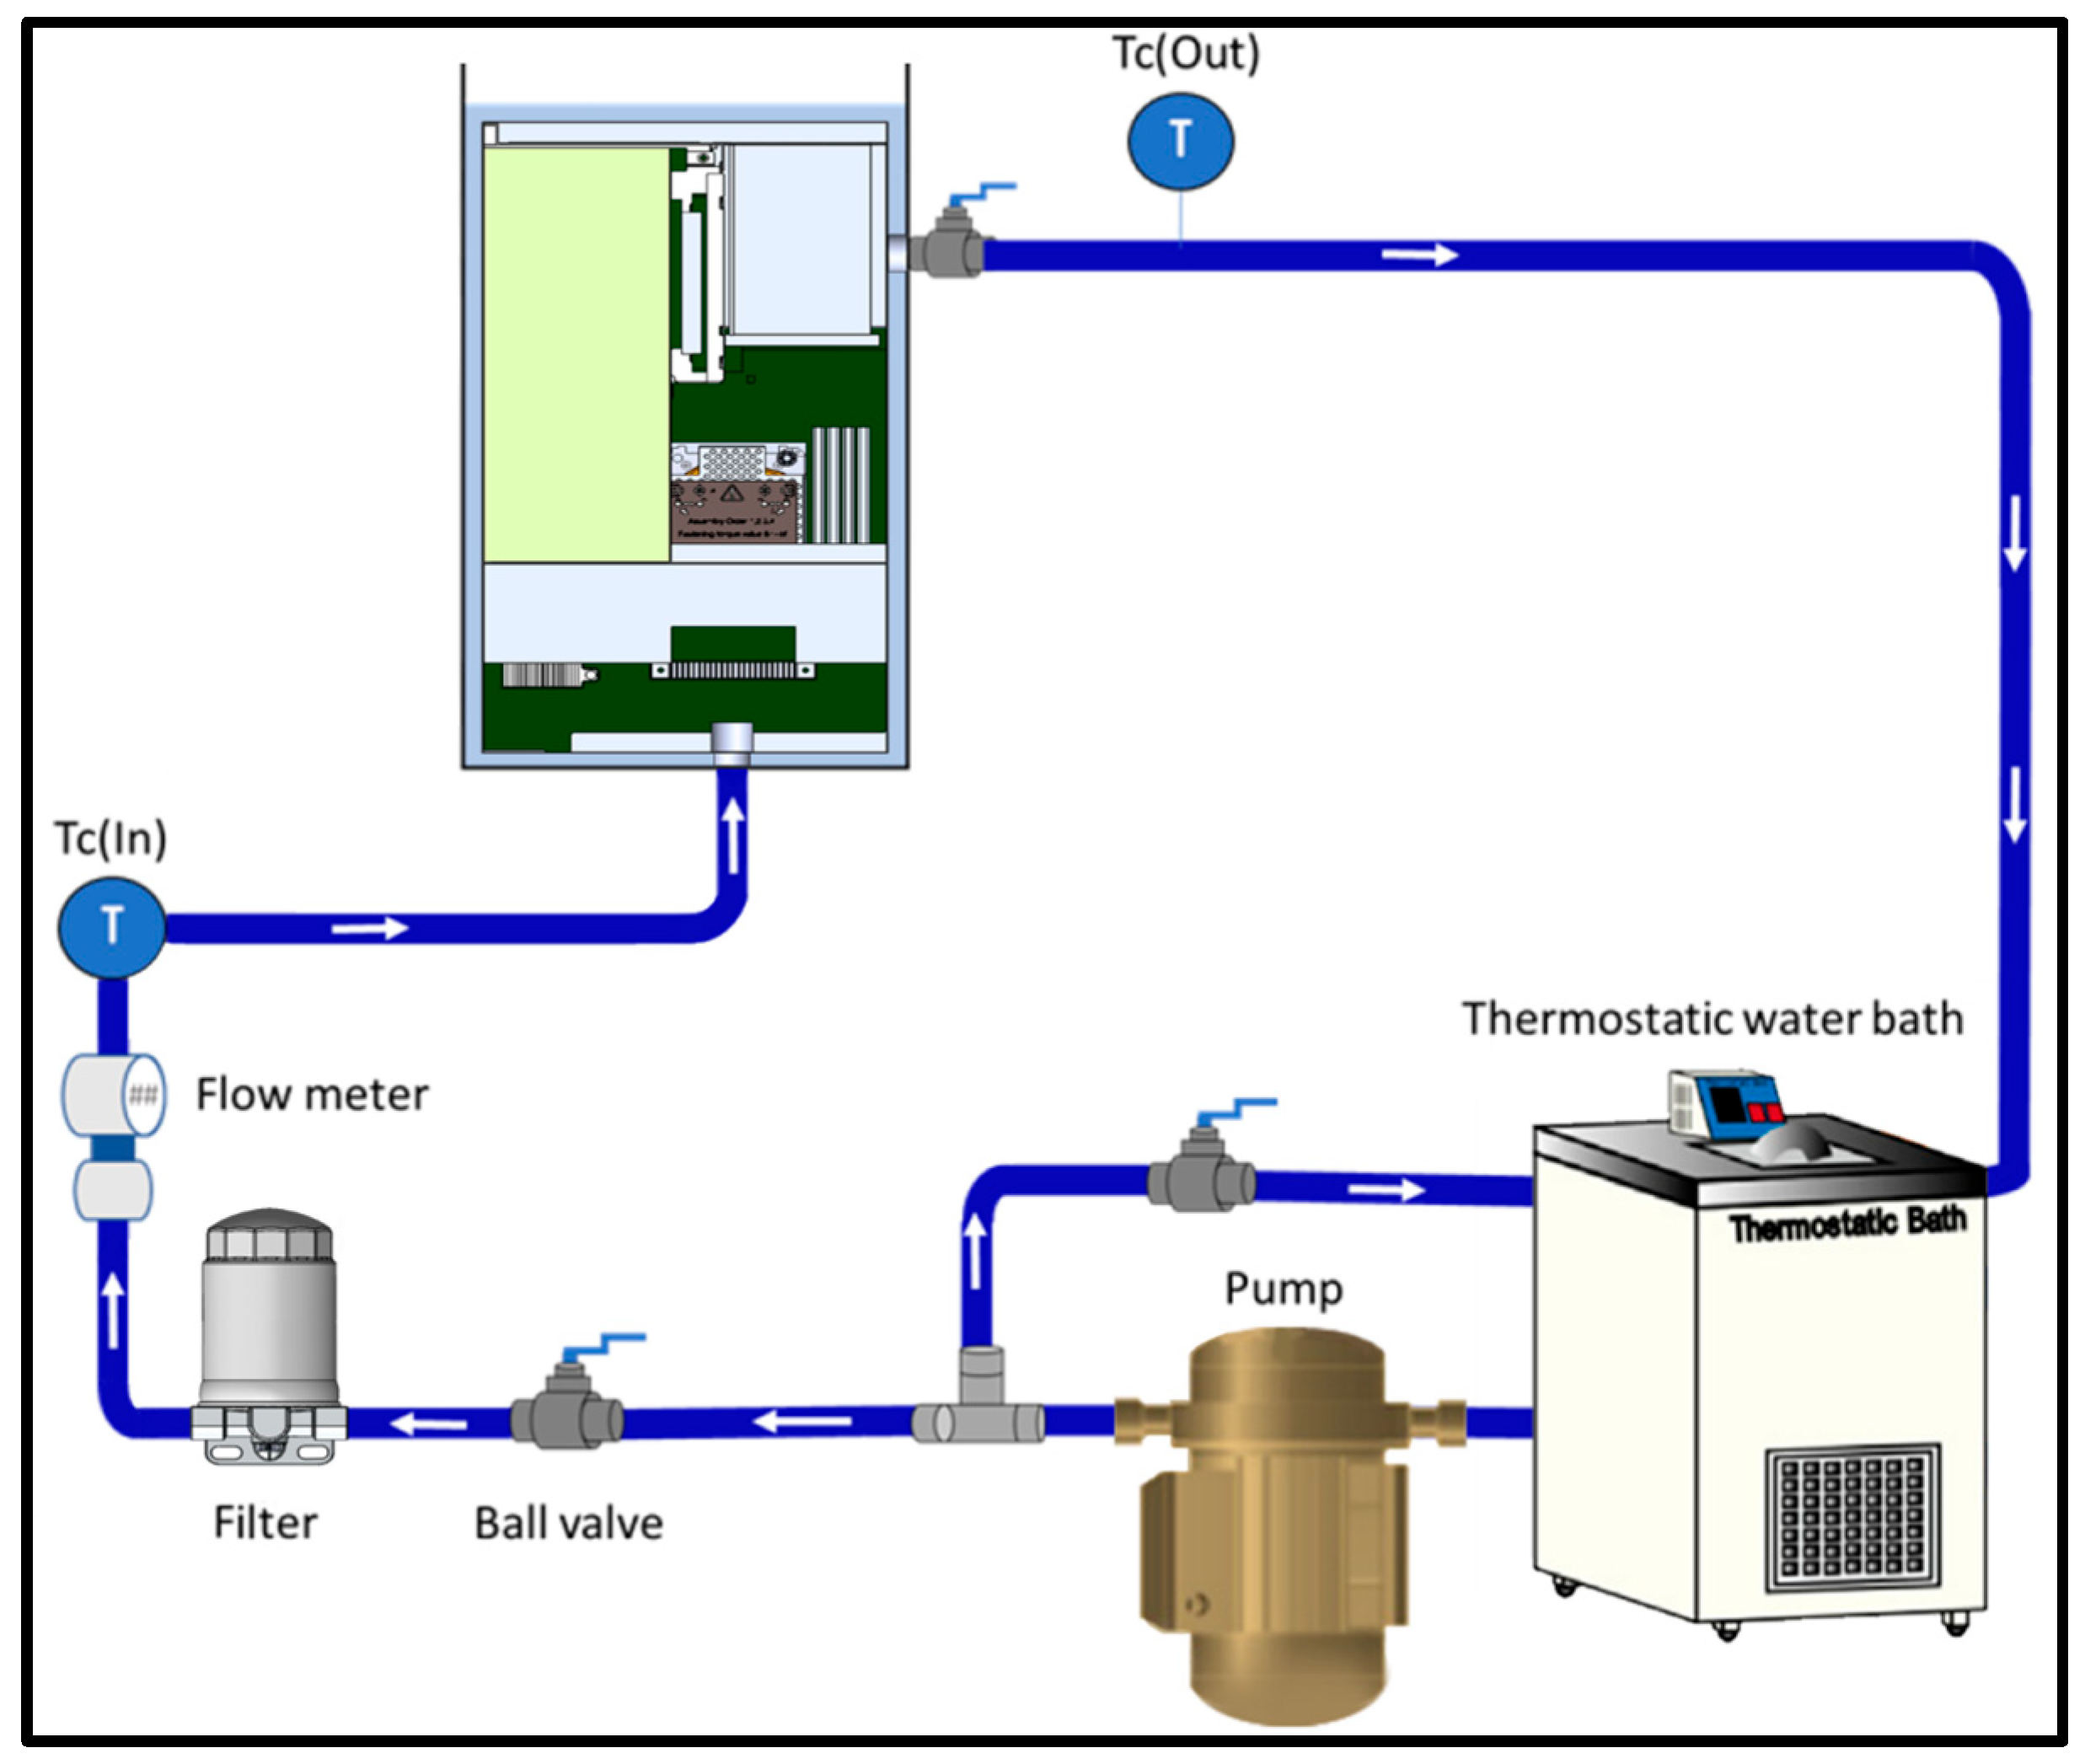
The single-phase oil-immersion test facility is shown schematically in Figure 2, and the assembled rig is shown in Figure 3. The test enclosure is a transparent acrylic tank with internal dimensions of 277.00 mm × 130.60 mm × 544.90 mm (length × width × height) and a wall thickness of 15 mm. The top of the tank is open to allow installation and removal of the server. The server is mounted on a hollow support seat fixed to the tank base by six screws. The lower end of the support seat is connected to the oil supply line, and a manually controlled ball valve at the inlet directs the oil toward the underside of the CPU heat sink to increase the portion of flow that reaches the CPU region.
The working fluid is supplied from a thermostatic bath maintained at 45 °C and is circulated by a 24 V DC gear pump (Brand: HP428/30 H 24 V DC). A particulate filter is installed upstream of the test section to protect the server. The inlet flow rate is measured by a positive-displacement flow meter (Piusi K400, range 0.17 to 30 LPM, accuracy ±0.5%), and the flow rate is adjusted by controlling the pump speed.
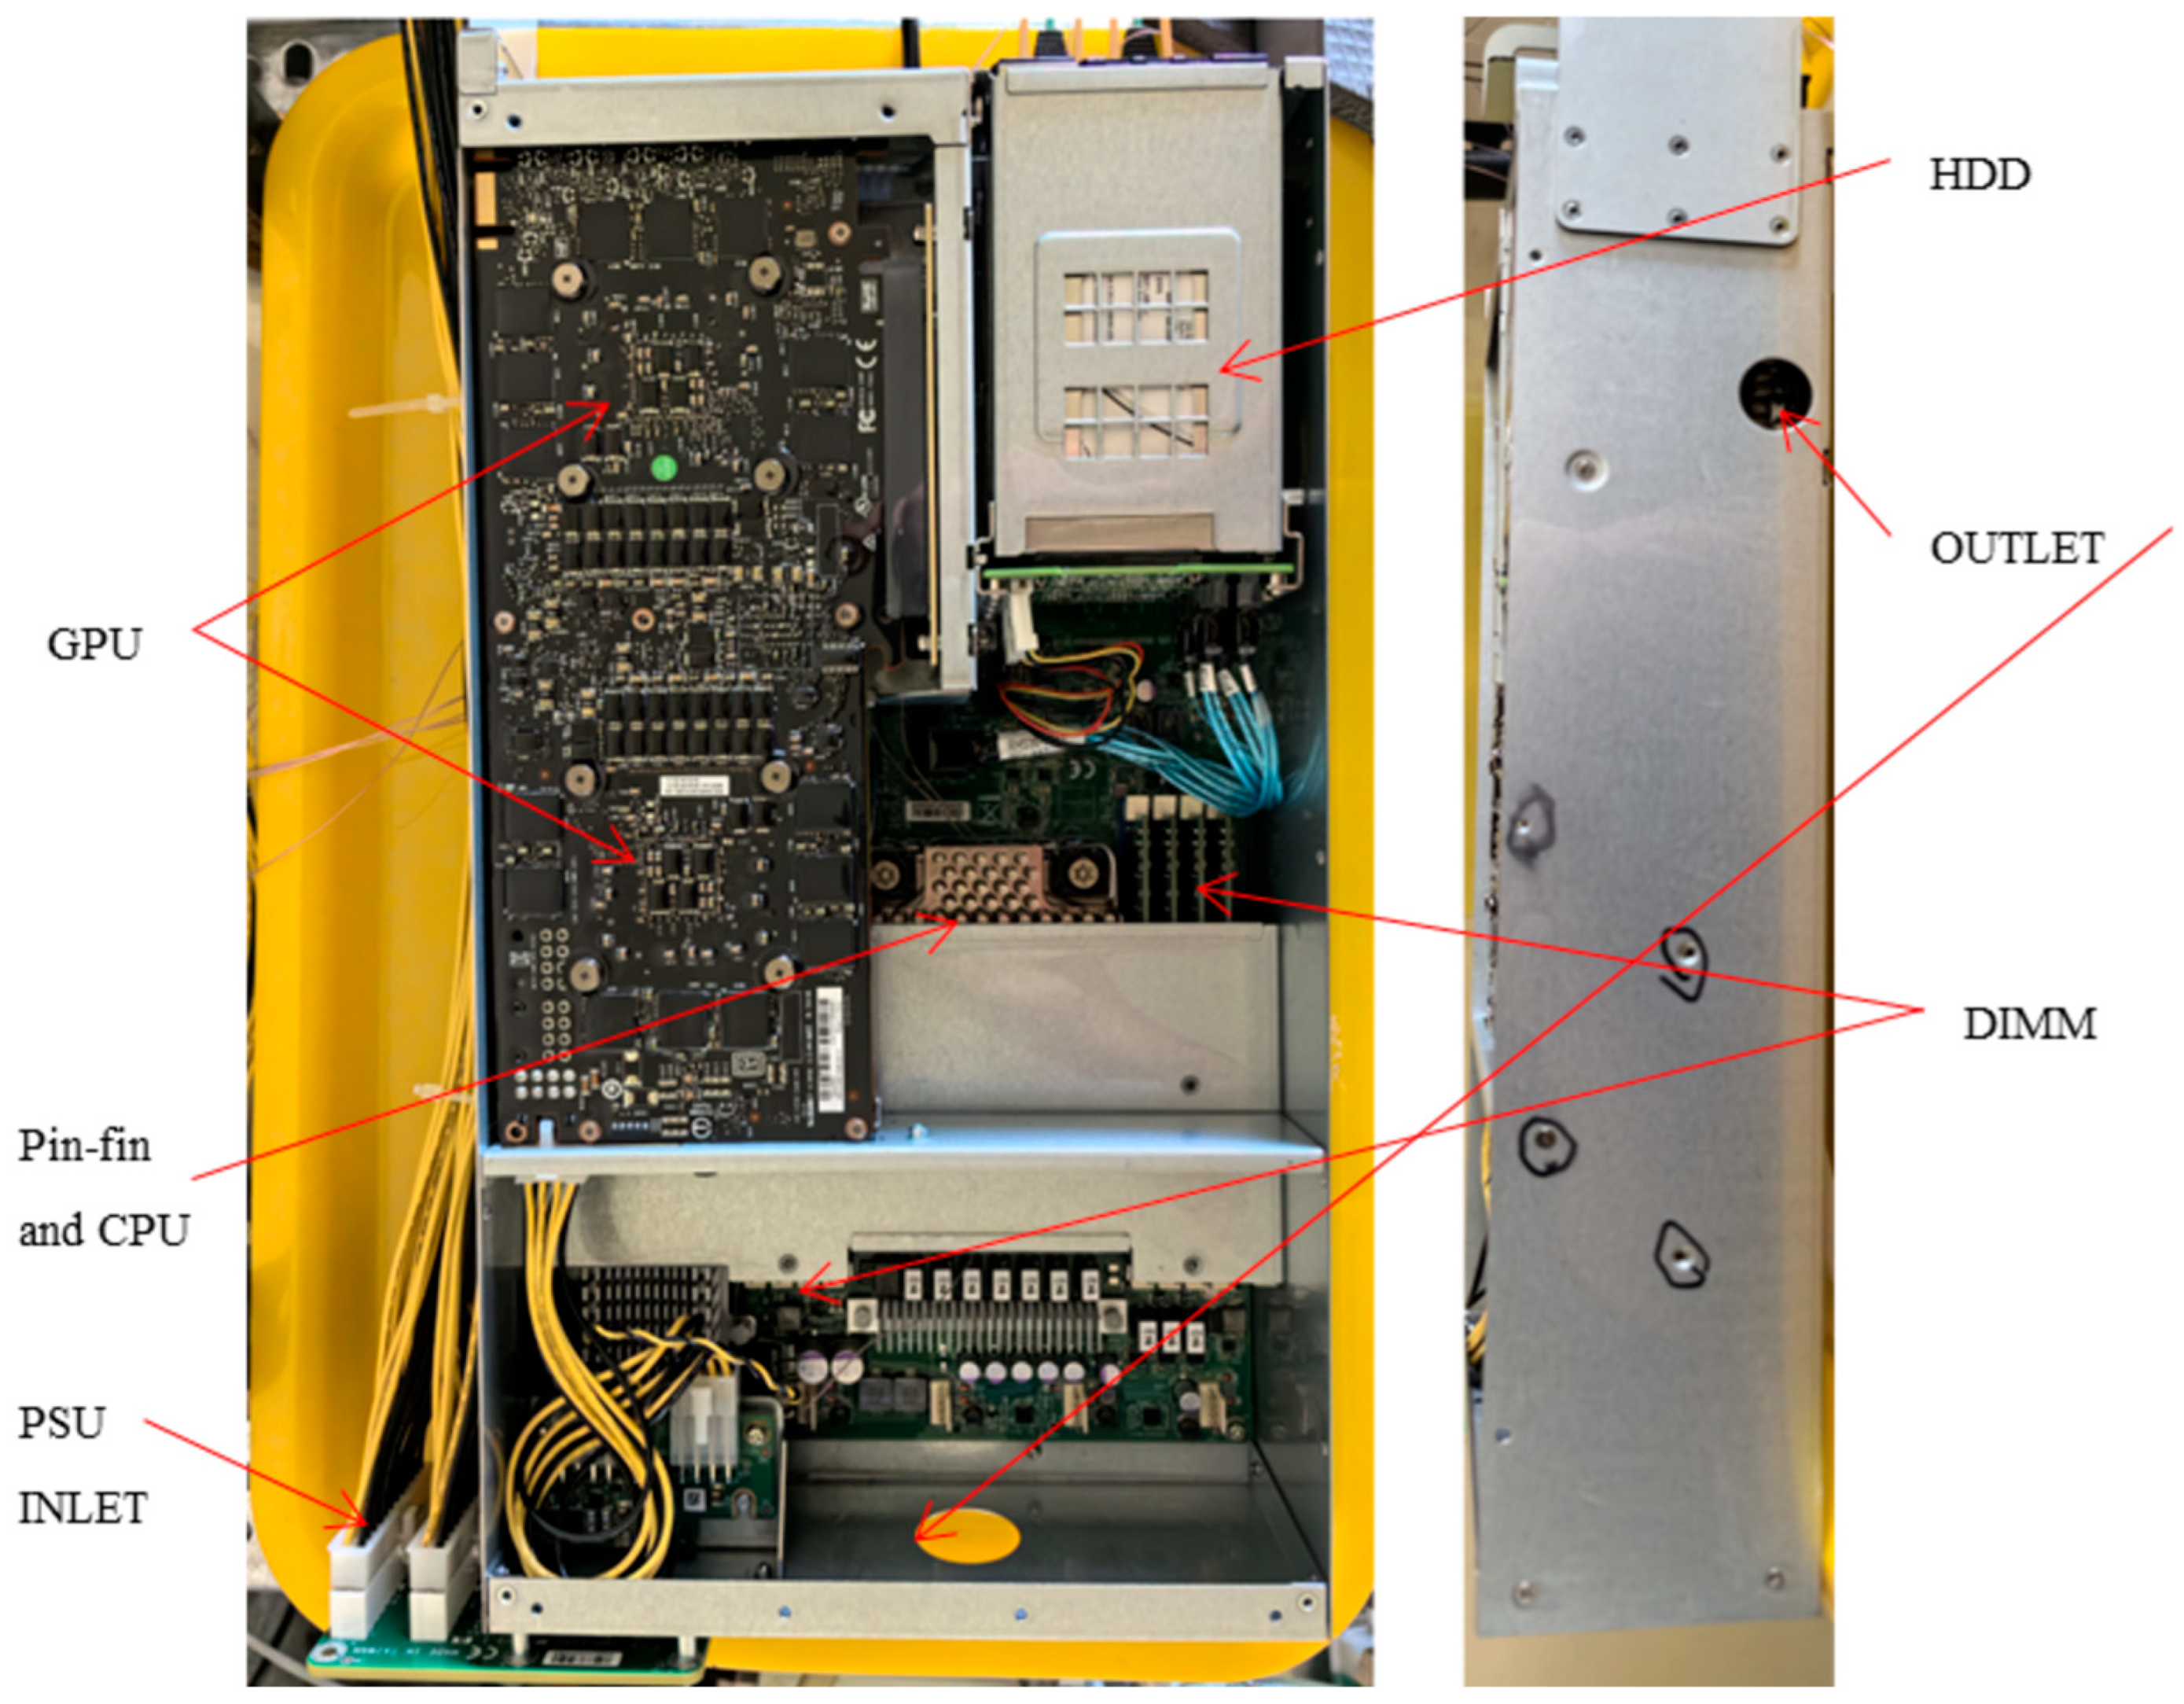
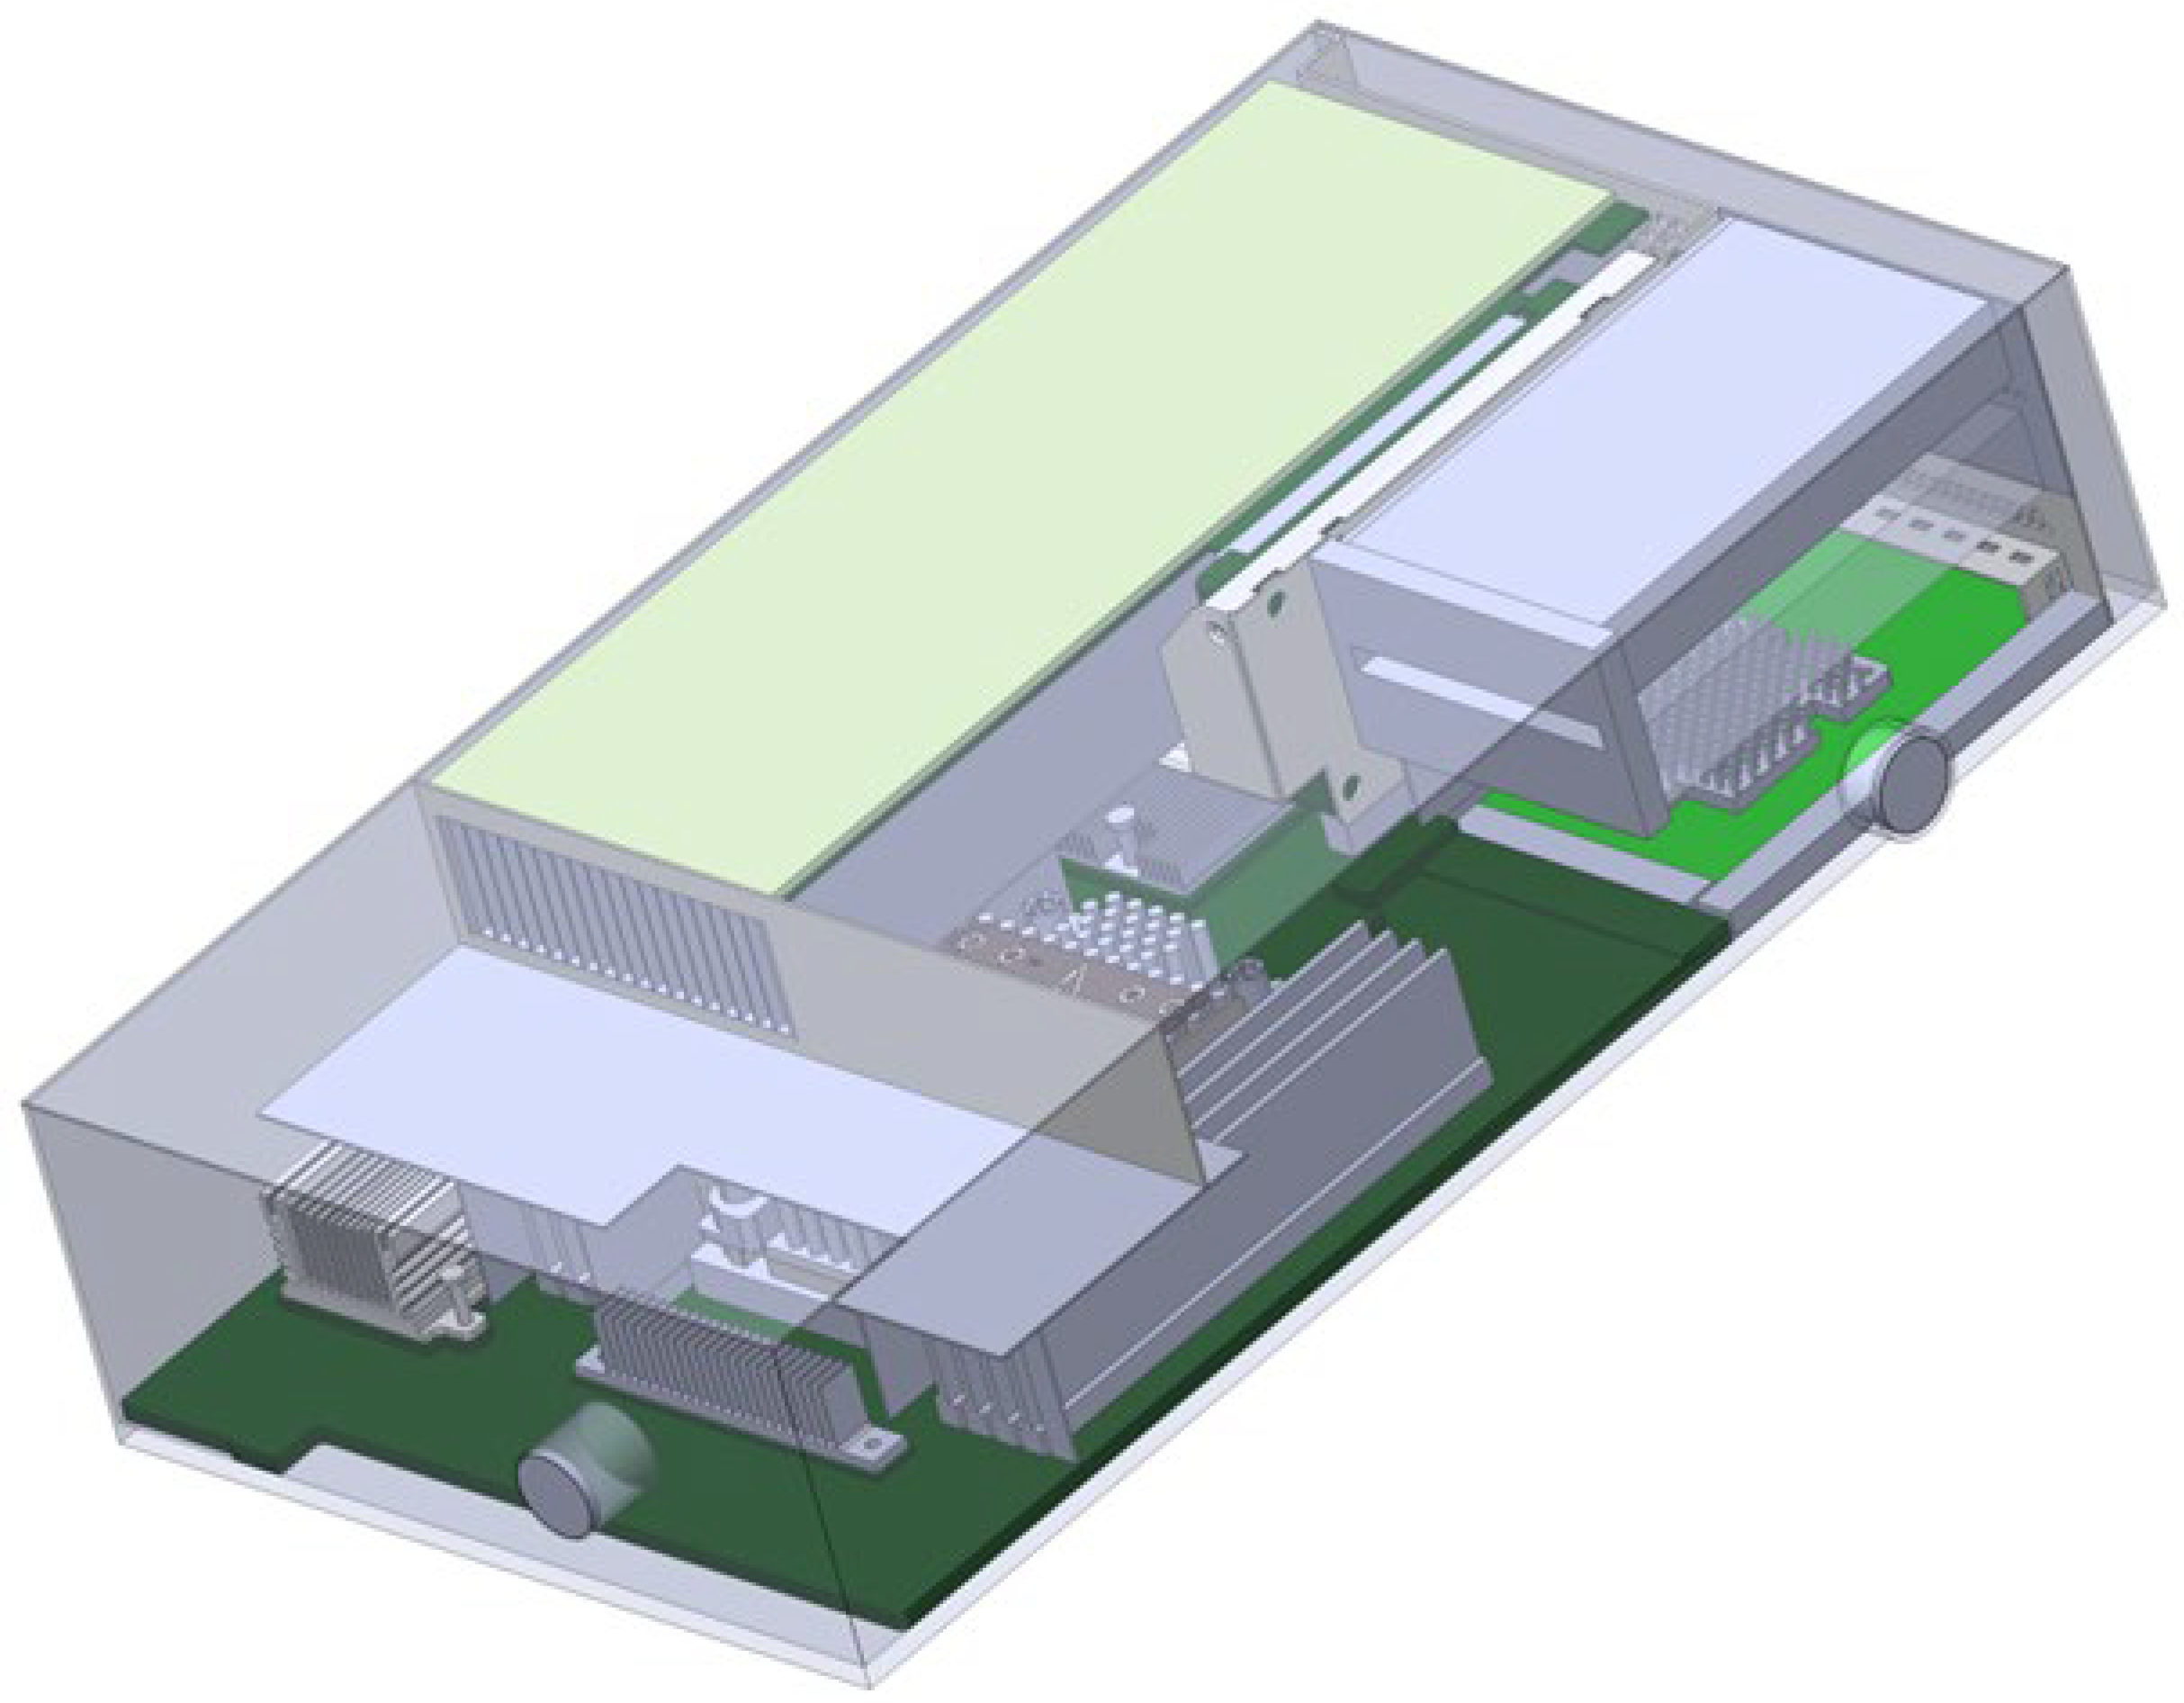
The test article is an E400 server from Lanner Electronics Inc., installed vertically in the immersion tank. Two 19.05 mm circular ports are machined on the front and right sides of the chassis and are used as the oil inlet and outlet, respectively, as shown in Figure 4. The server contains a 3rd-generation Intel® Xeon® scalable processor and two GPUs, and the original cooling fans are removed before immersion. To reduce the contact resistance between the CPU lid and the heat-sink base, the factory thermal interface material is replaced with a graphite TIM (thermal conductivity 28 W/m∙K; thickness 0.02 mm). The principal heat sources and their nominal powers are listed in Table 1.
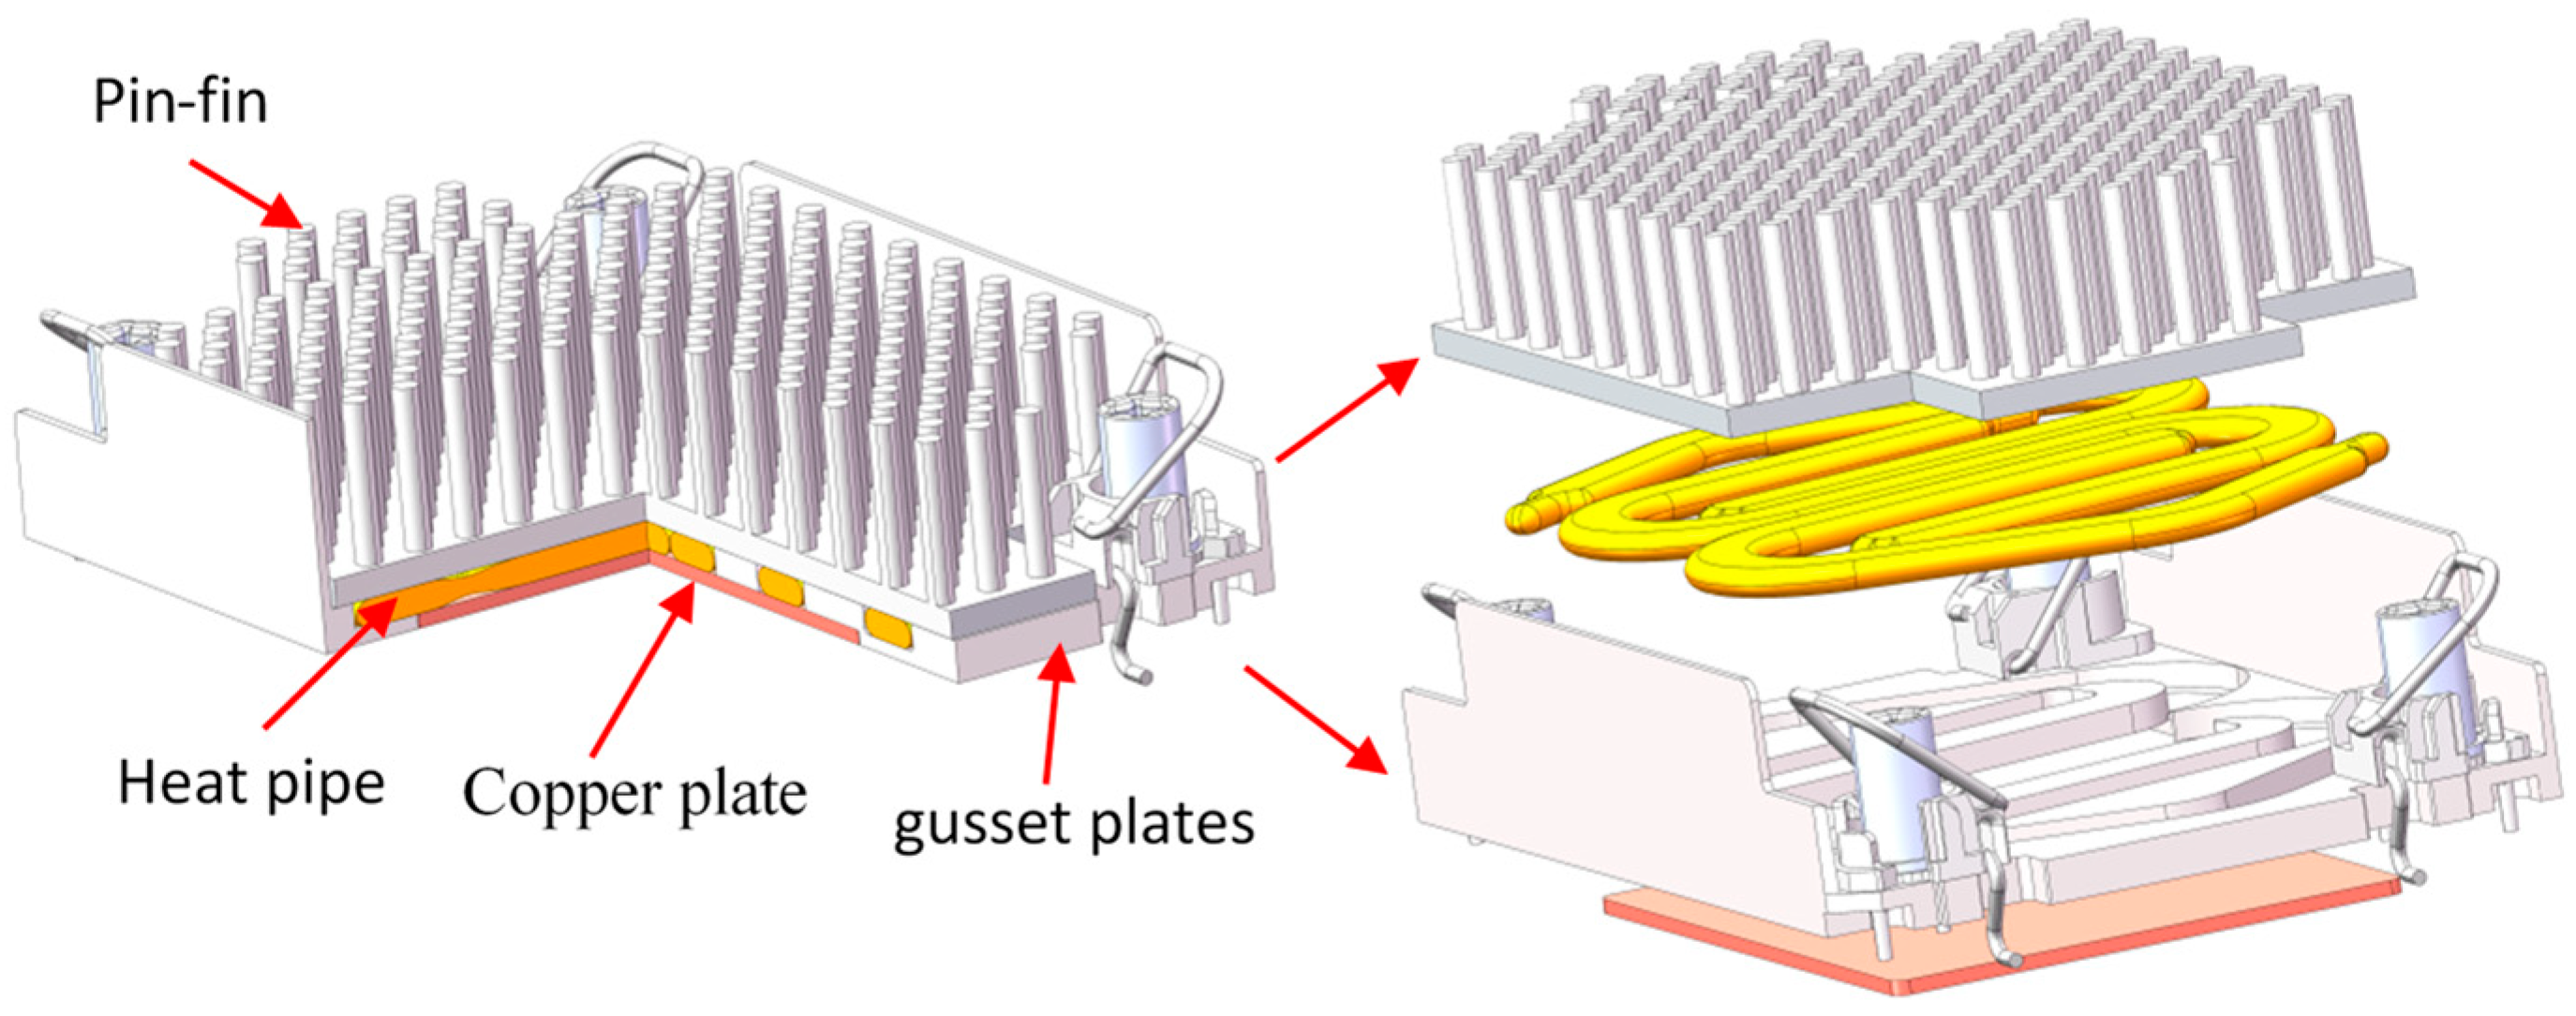
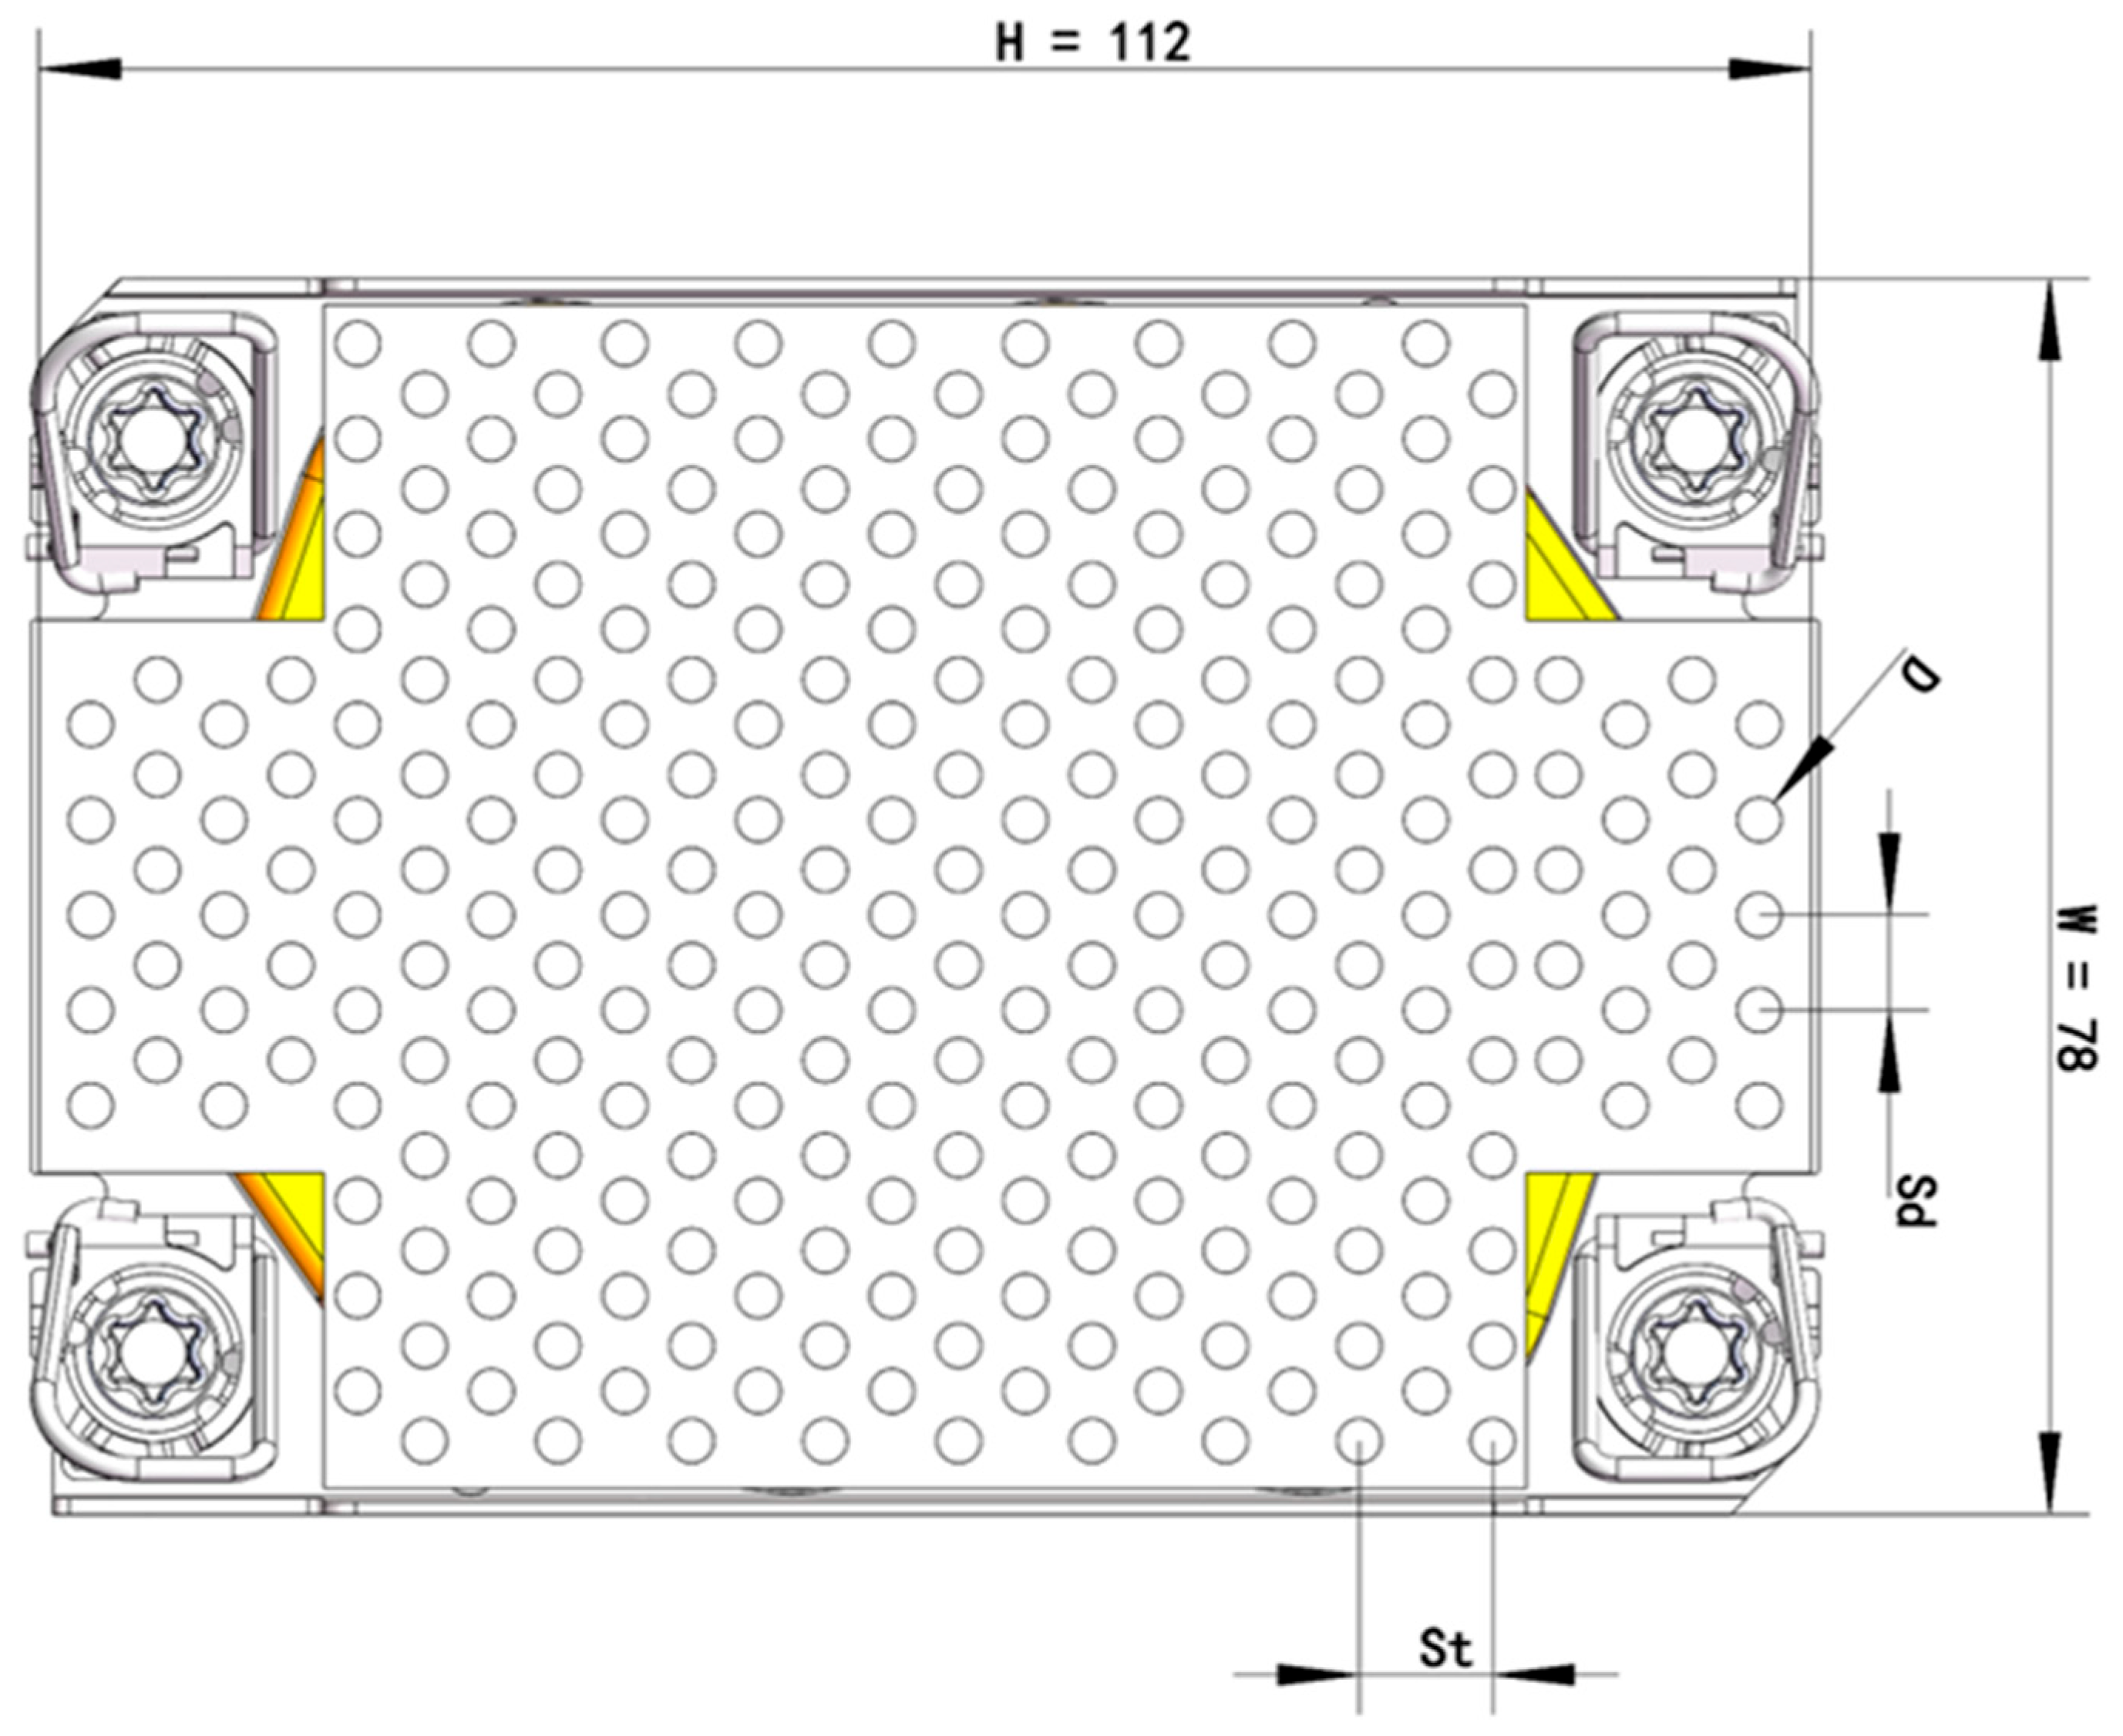
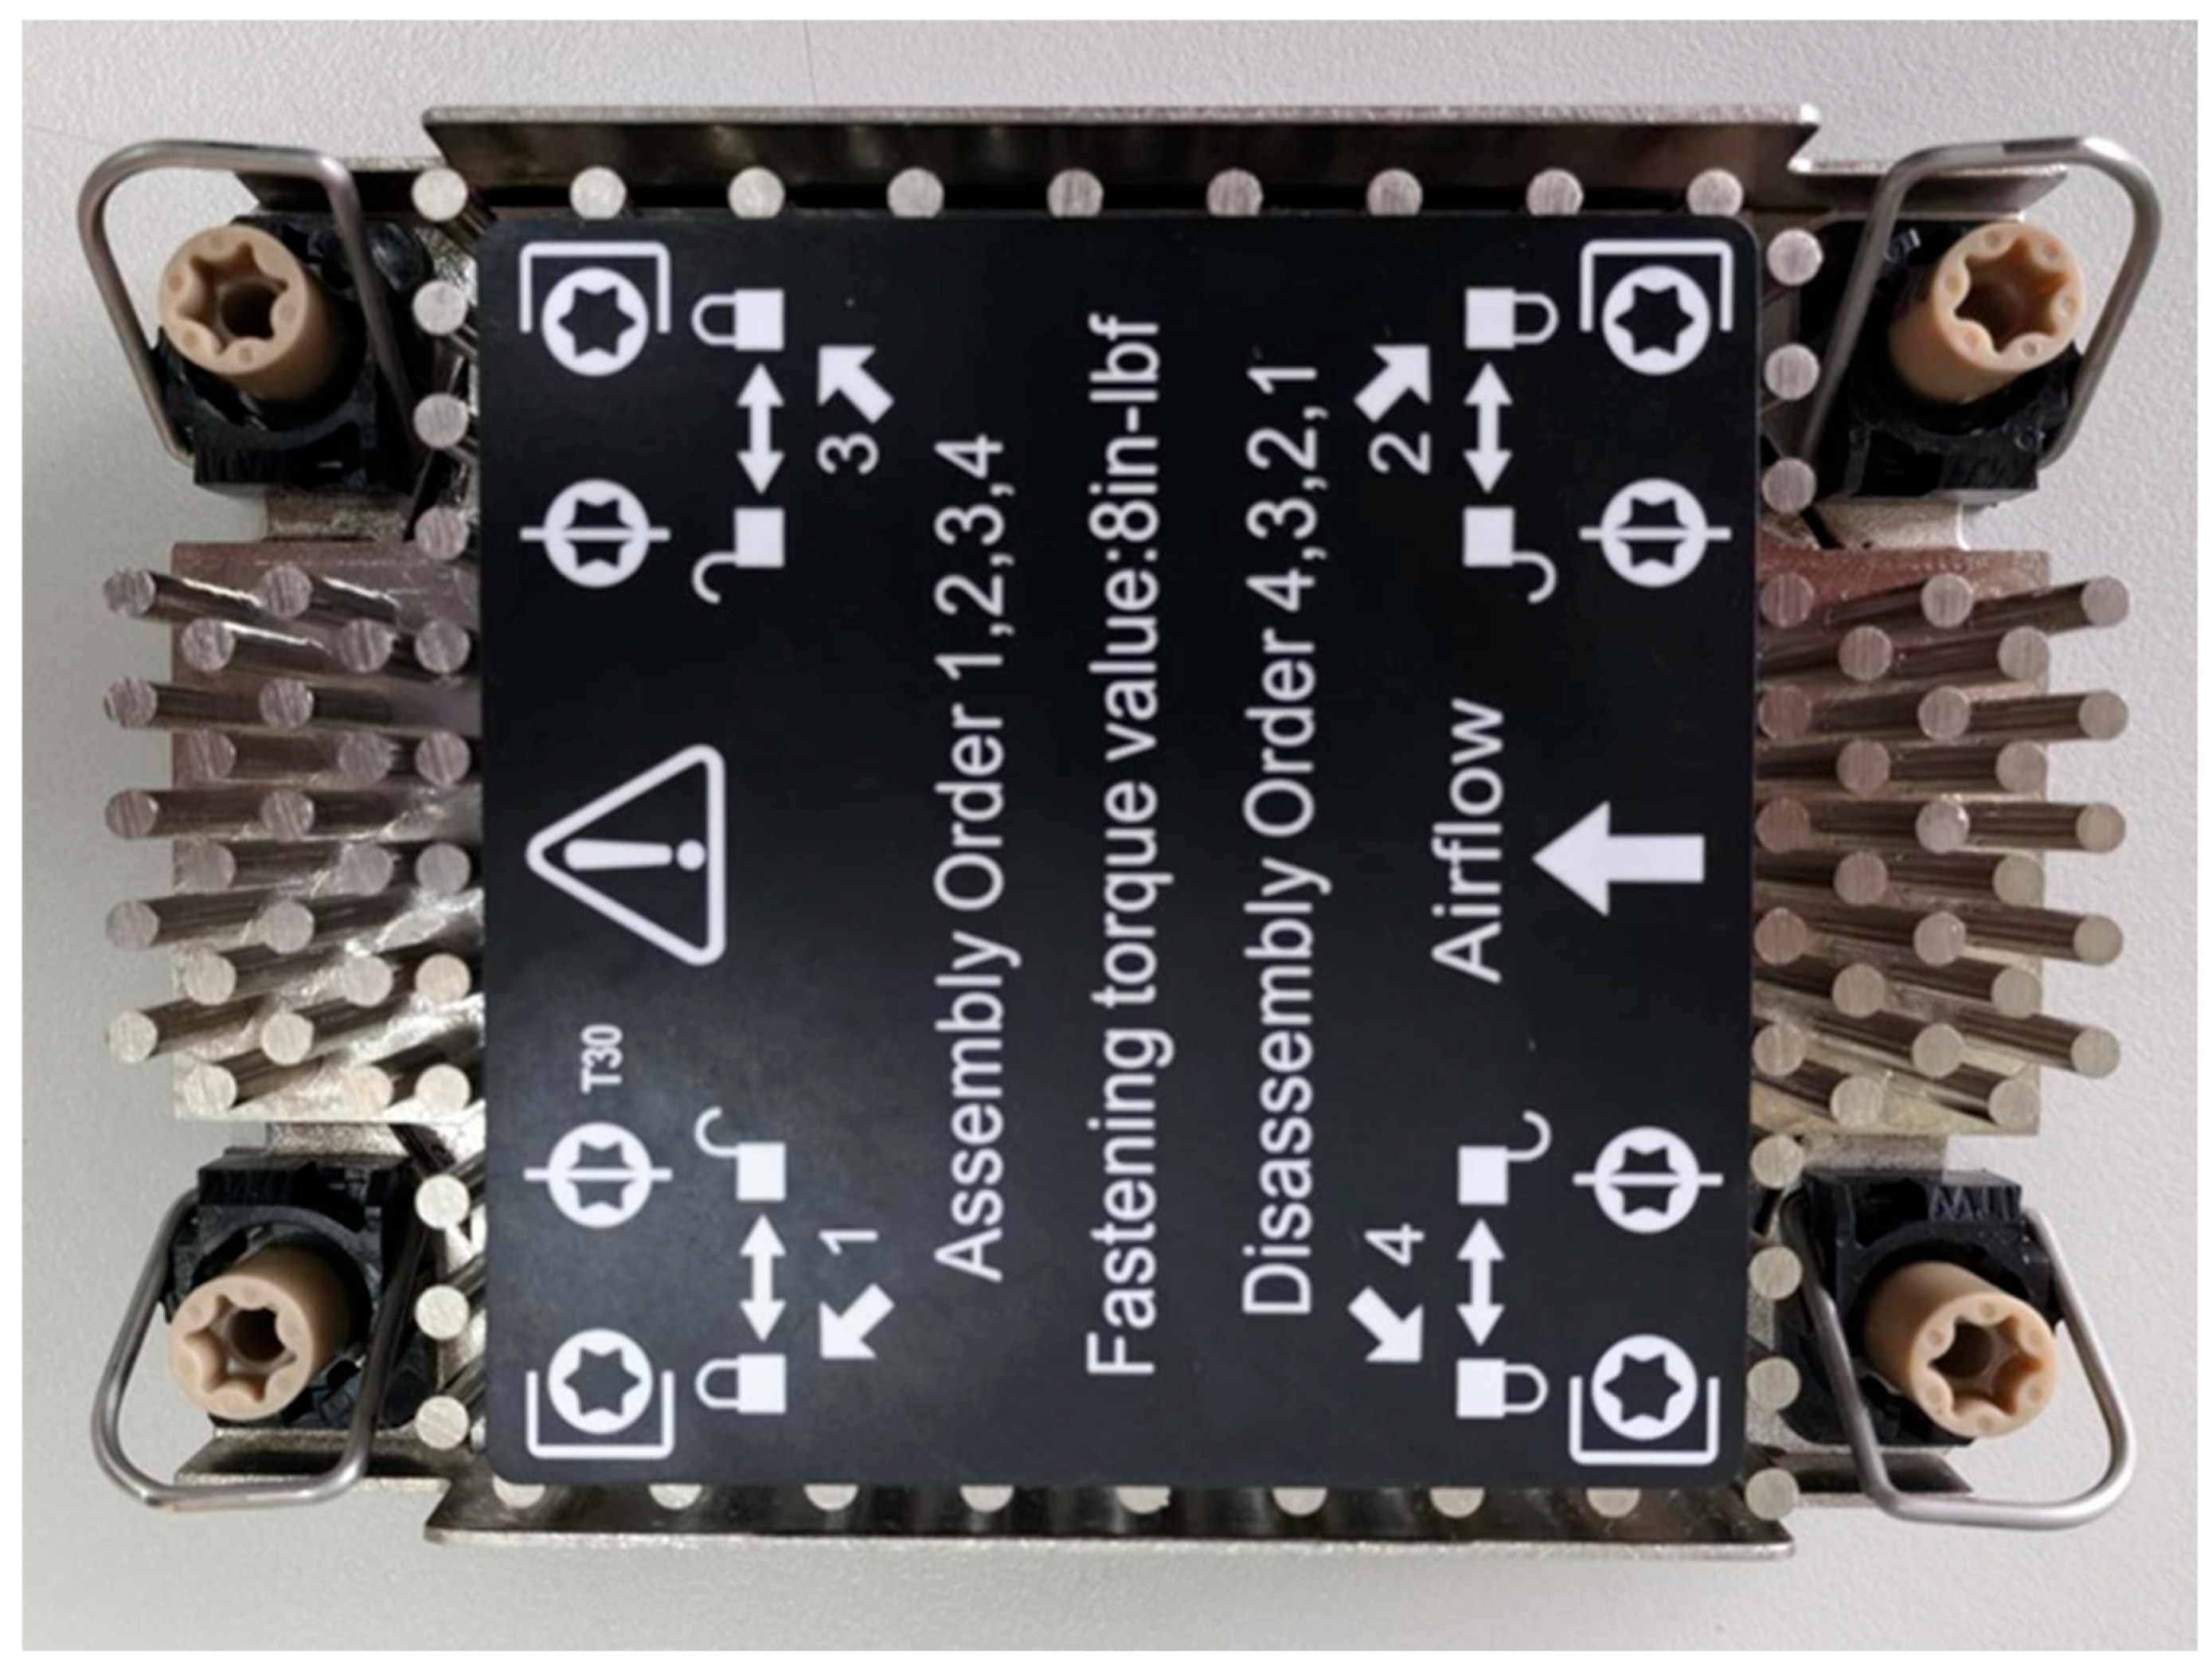
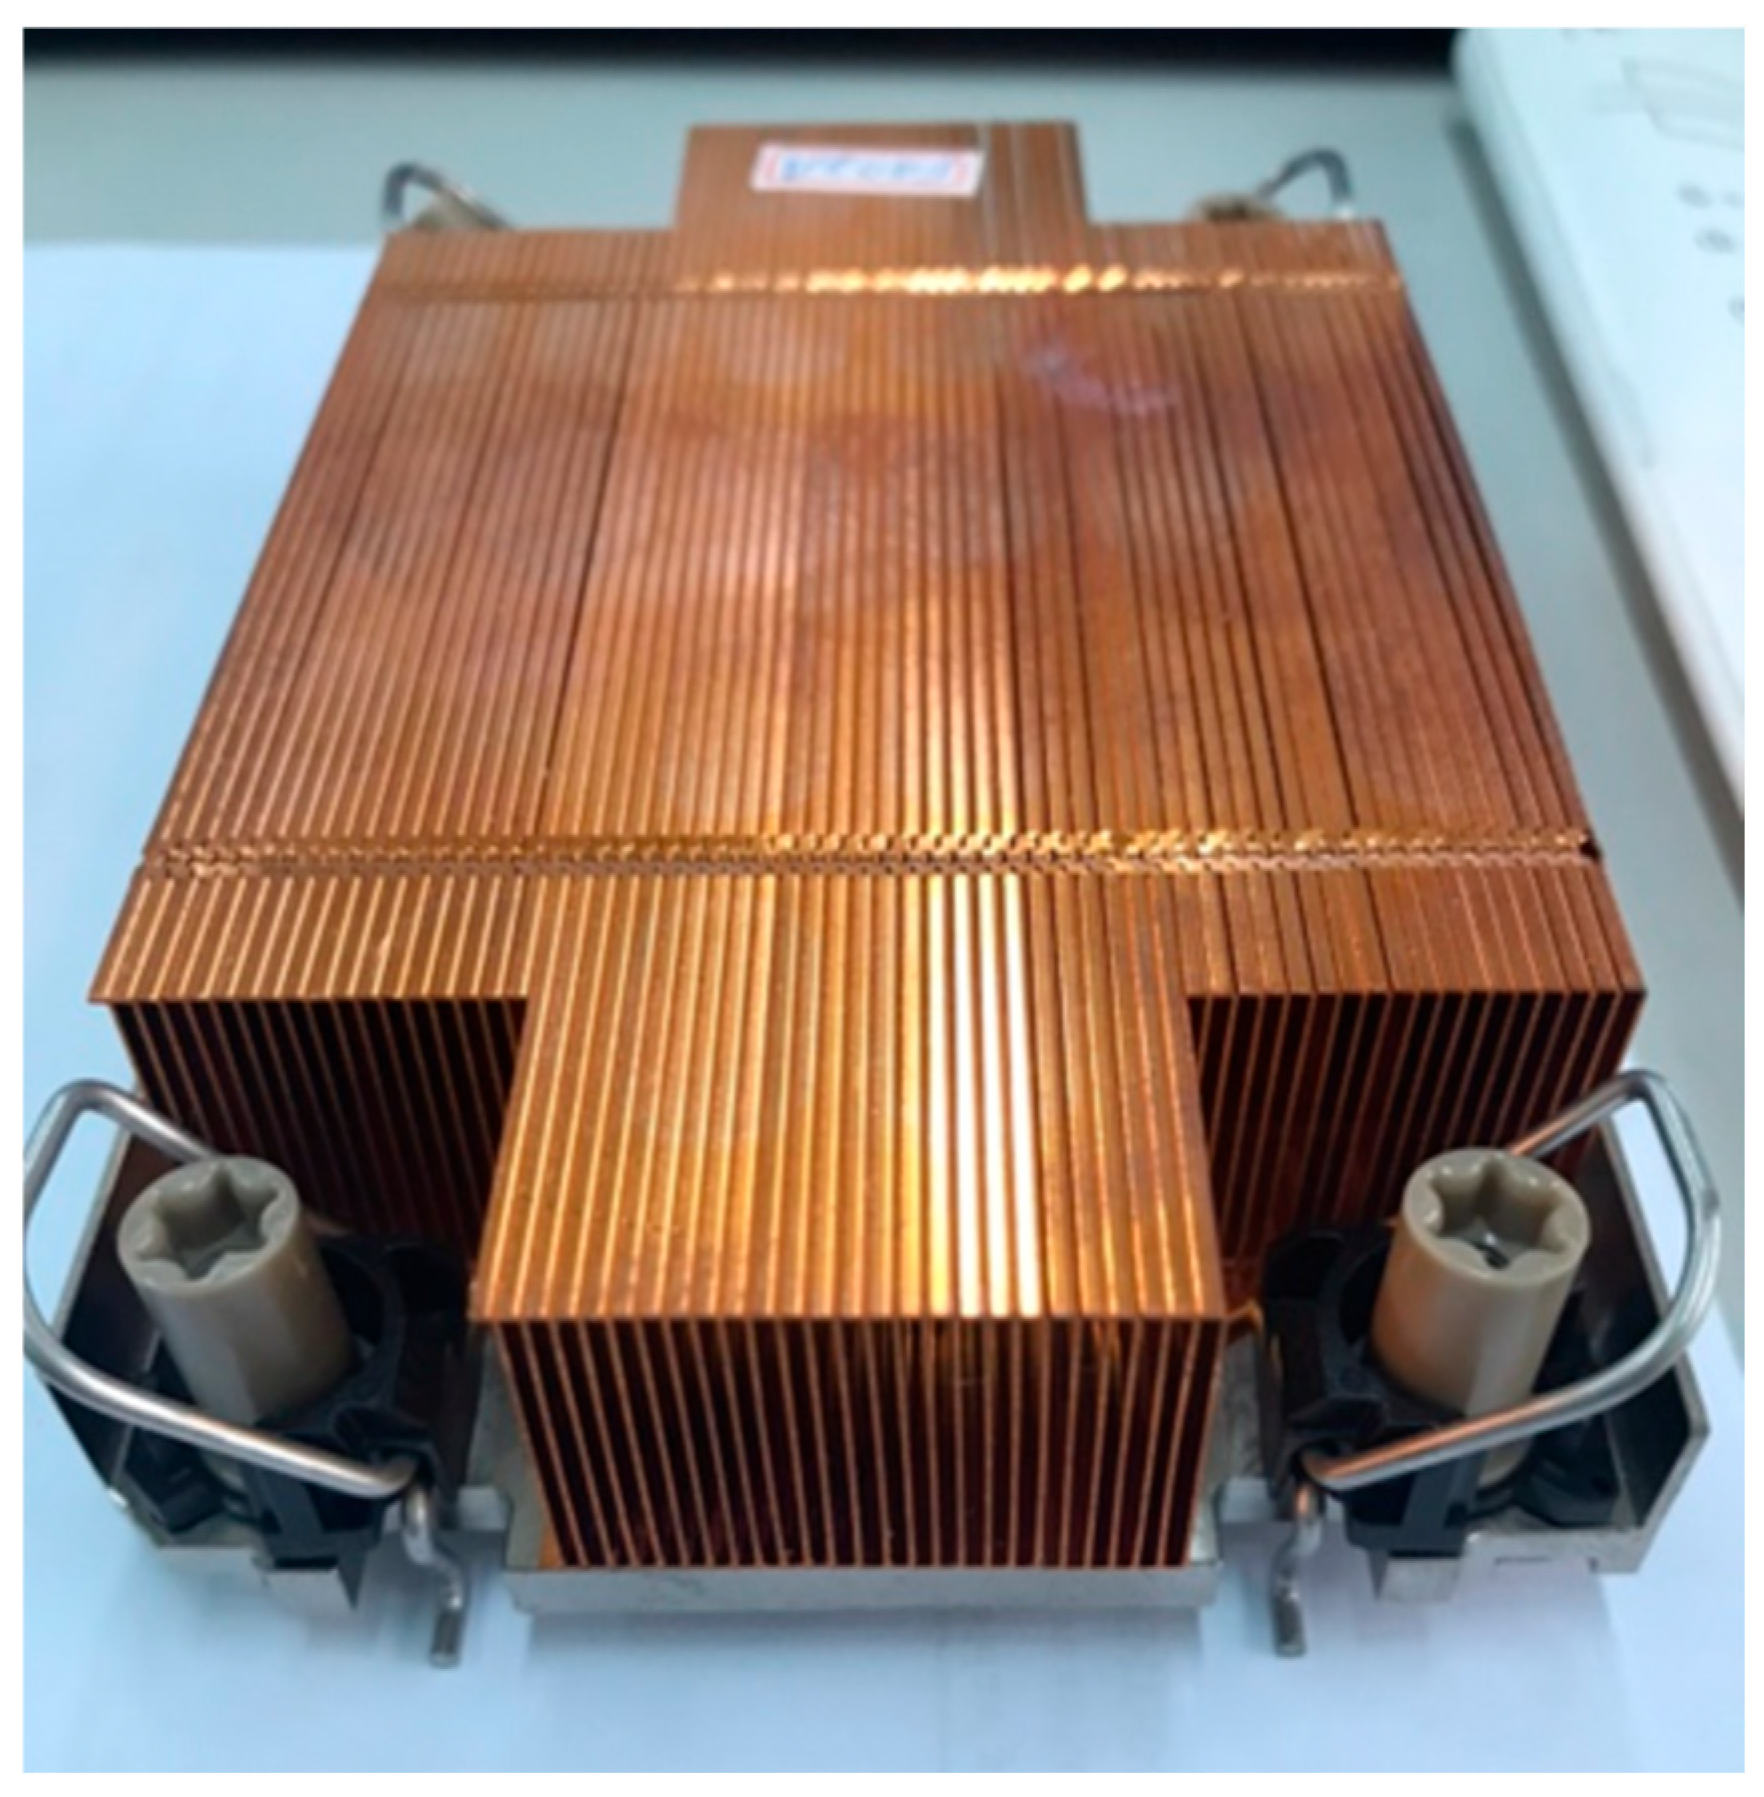
The CPU pin-fin heat sink has a base footprint of 78 mm × 112 mm. It consists of a copper base plate with three embedded heat pipes, whose effective thermal conductivity is 5000 W/m∙K, and aluminum pin fins welded to the heat pipes. The heat pipes spread the chip heat across the substrate before it is dissipated by the pin-fin array. The complete heat-sink assembly is shown in Figure 5, and the pin-fin geometric parameters are shown in Figure 6. The total heat-sink height is 25.7 mm, of which the pin-fin height is 17.2 mm. The pin diameter is 2.8 mm, the longitudinal pitch Sd is 8.45 mm, and the transverse pitch St is 6 mm. Two T-type thermocouples are placed at the heat-sink inlet and outlet to monitor the oil bulk temperatures, and a third T-type thermocouple is bonded at the geometric center of the CPU lid, under the heat-sink base, to record Tcase.

2.4.2. Working Fluid

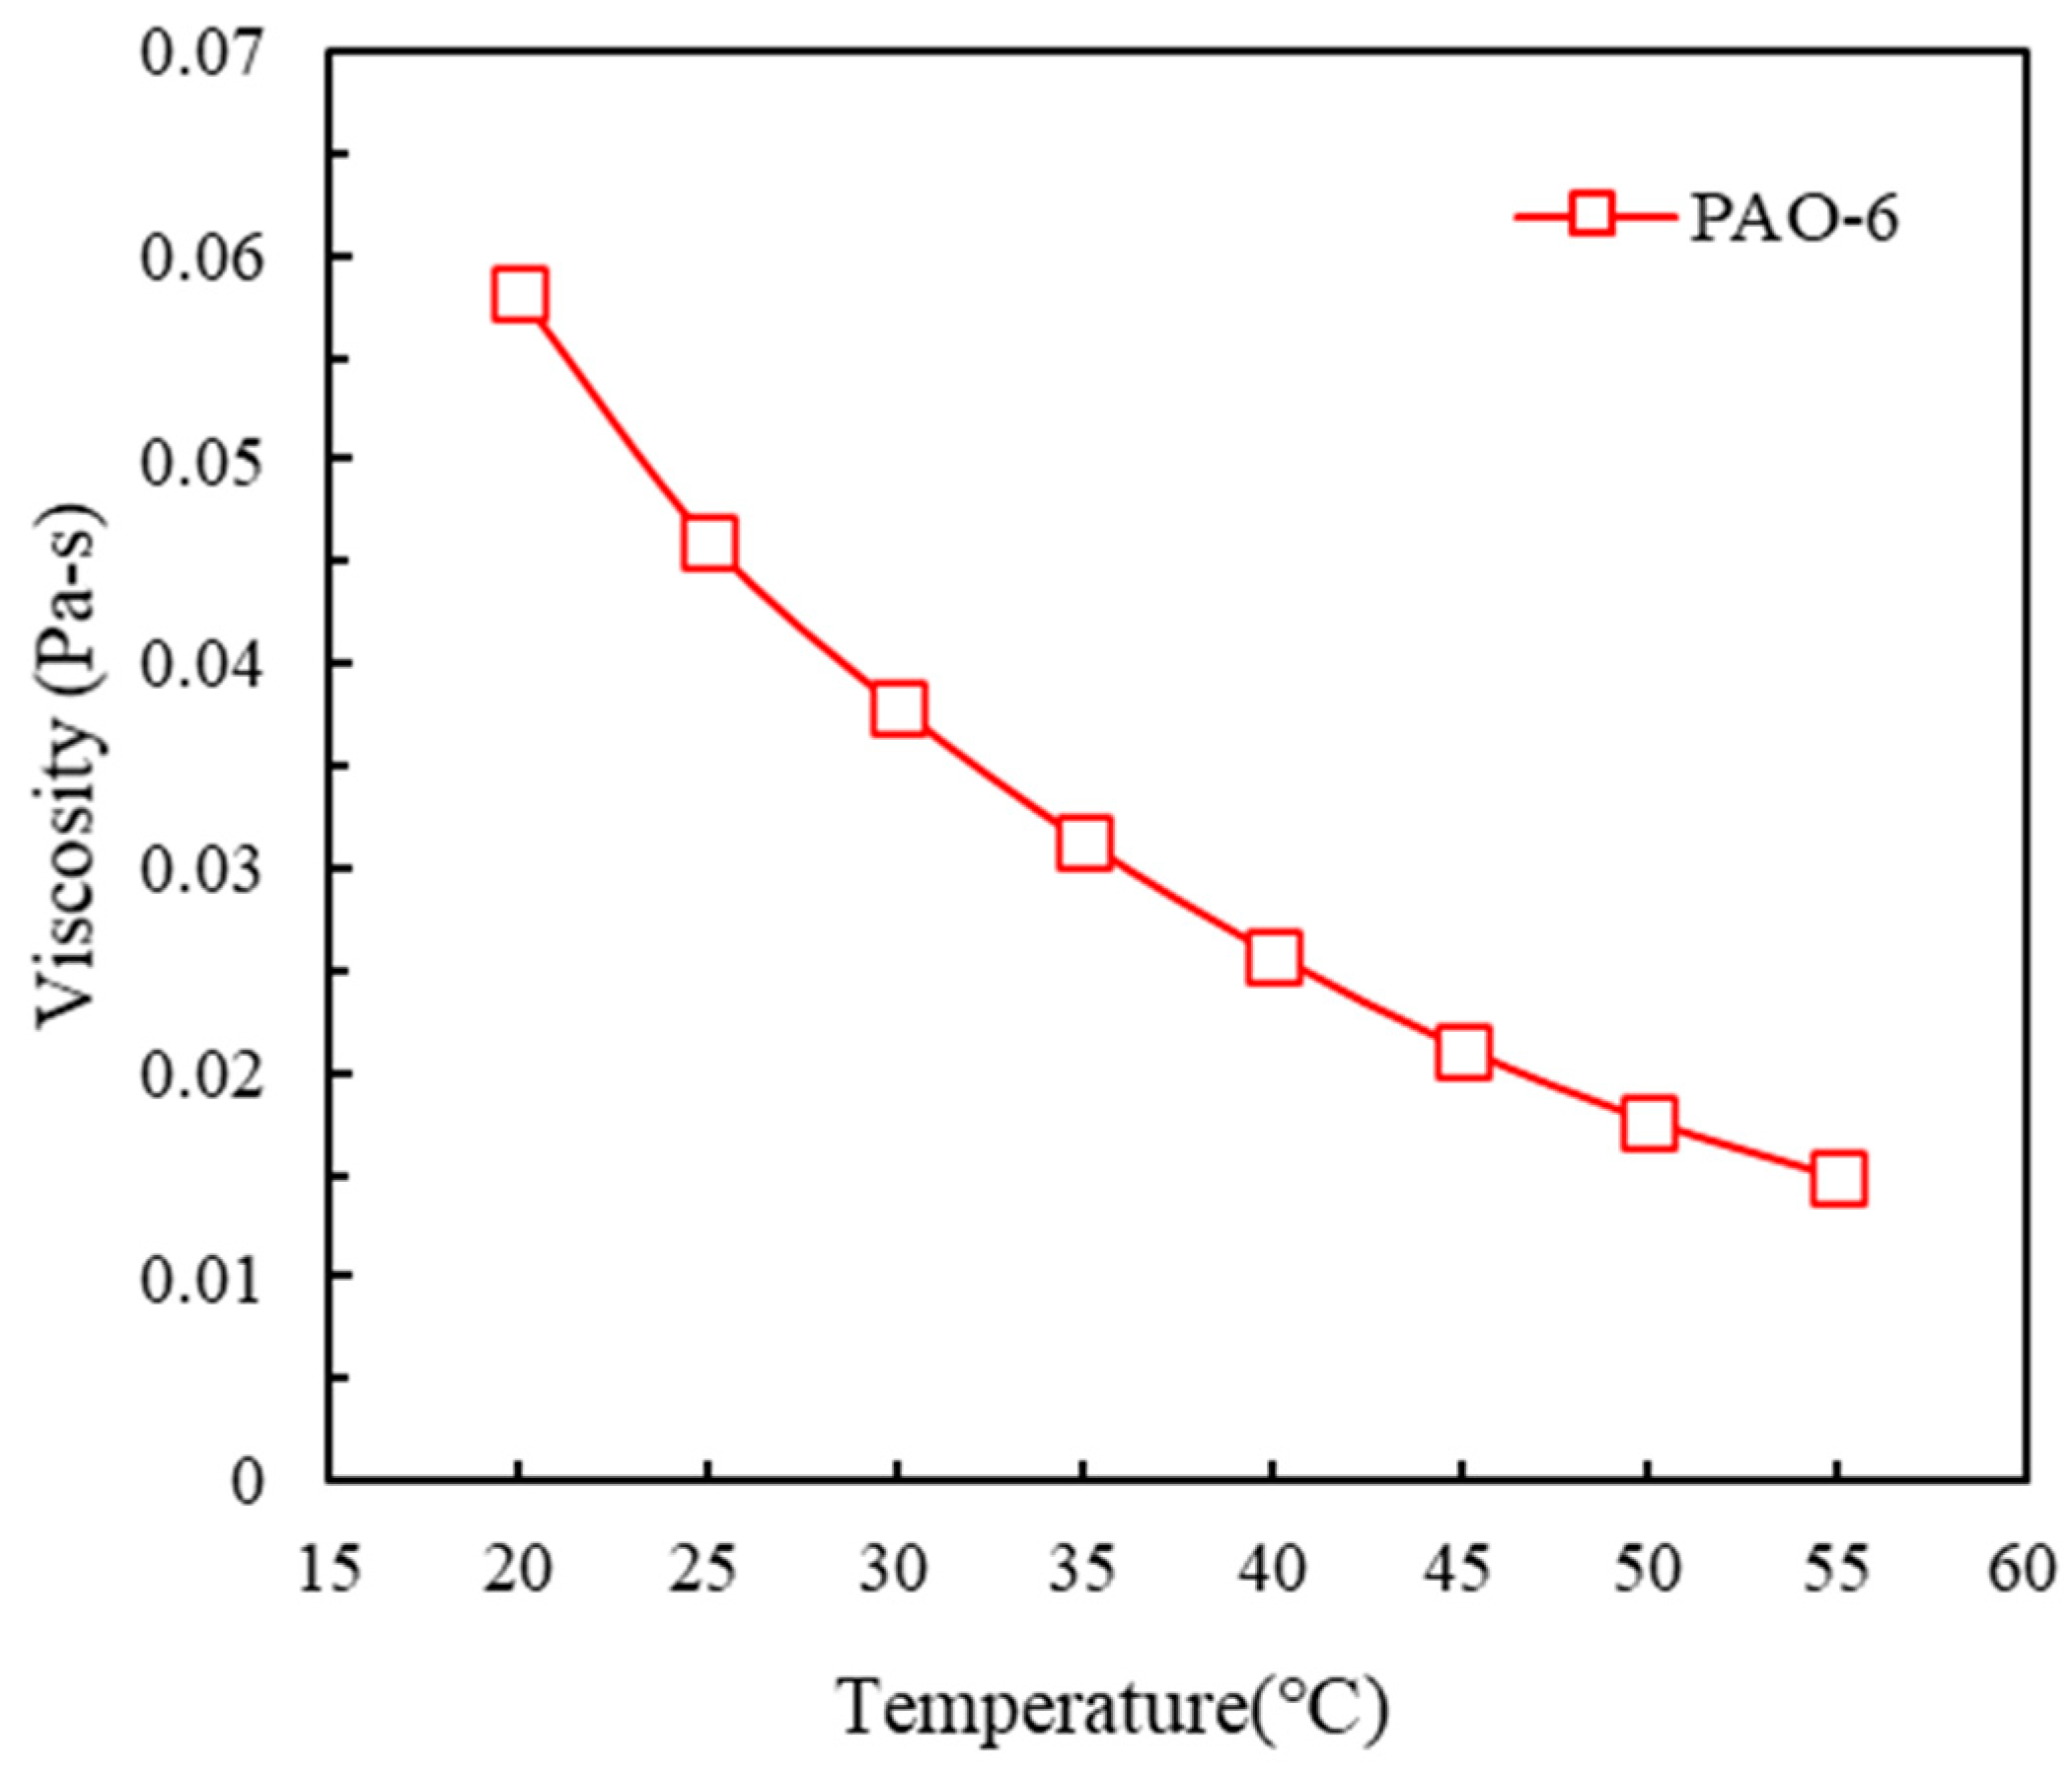
The working fluid is the synthetic poly-α-olefin oil PAO-6. Its viscosity decreases strongly with temperature, as shown in Figure 7. Variation of viscosity with temperature for PAO-6, and its principal thermophysical properties at 45 °C are listed in Table 2. The thermophysical properties listed in Table 2 and the viscosity-temperature relation shown in Figure 7 are taken from Zhang et al. [34]. The values in Table 2 are evaluated at the reference temperature of 45 °C. PAO-6 has low volatility, high thermal stability, a flash point of 246 °C, and a Global Warming Potential (GWP) of zero. It is widely used as a base oil for automotive engines, transmissions, and industrial lubricants, and it is substantially cheaper than fluorinated dielectric fluids. Compared with fluorinated dielectric liquids commonly used in immersion cooling, PAO-6 has a much lower density, while its thermal conductivity and specific heat are both more than twice as large. Over the operating temperature range considered here, density, thermal conductivity, and specific heat vary much less strongly than viscosity.

2.4.3. Loading and Monitoring Software

The CPU in the CPU pin-fin heat sink, as shown in Figure 8 is loaded to 100% using an in-house Linux load-generation script supplied by Lanner Electronics Inc. The same utility can also stress the GPU, PCH, OCP, and HDD subsystems. A separate health-monitoring script reports the instantaneous power consumption and on-die temperature of each component. For the CPU, the case temperature reported in this work is the thermocouple reading at the center of the CPU lid. For the remaining components, the die temperatures reported by the monitoring script are used. Tests are conducted at oil inlet temperatures of 30 °C, 35 °C, 40 °C, and 45 °C and at oil flow rates of 3, 4, 5, and 6 LPM. Steady state is identified from the agreement between the inlet/outlet energy balance and the electrical power input, after which Tcase is recorded by the data logger.

2.4.4. Instrumentation and Uncertainty Analysis

Throughout the tests, the oil inlet temperature was set by a thermostatic bath, the flow rate was set by the pump speed in combination with an inlet ball valve and verified by the flow meter, and steady state was confirmed from the agreement between the inlet-outlet energy balance and the measured electrical power.
All temperature signals were collected using Omega T-type thermocouples (Omega Engineering, Norwalk, CT, USA) connected to a Yokogawa MX-100 (Yokogawa, Tokyo, Japan) data-acquisition unit. The thermocouples were calibrated against a platinum resistance thermometer (RTD) before the experiments. The oil inlet and outlet temperatures were measured by probe-type thermocouples, while the CPU case temperature was measured by a fine T-type thermocouple bonded at the geometric center of the CPU lid beneath the heat-sink base. The oil flow rate was measured upstream of the test section using a Piusi K400 (Piusi, Suzzara, Italy) positive-displacement flow meter. In the thermal-test-vehicle (TTV) measurements, electrical power was supplied by a GPR-7550D DC (GW Instek, New Taipei City, Taiwan) power supply, and voltage/current were measured using a Hioki 3280-10F (Hioki, Ueda, Japan). For the real-server tests, CPU/GPU electrical power was recorded using the server monitoring script, while fan and pump electrical powers were determined from the corresponding voltage/current measurements. The measurement uncertainties of the T-type thermocouples, flow meter, voltmeter, and ammeter are ±0.1 °C, ±0.5%, ±0.05%, and ±0.1%, respectively. Propagating these uncertainties through the definition of Rth, while accounting for both precision and bias errors, gives a maximum overall uncertainty of 4.47% and a minimum uncertainty of 1.43% for the reported thermal resistance.

2.5. Numerical Simulation

The pin-fin geometry is optimized before fabrication using Simcenter Flotherm XT 2021. The simulations vary the pin diameter D, transverse pitch St, and longitudinal pitch Sd. The Reynolds number in the server ranges from approximately 5 to 1000. Because the internal flow paths are geometrically complex and may contain laminar, transitional, and locally turbulent regions, a low-Reynolds-number k–ε turbulence model is used. The governing Navier-Stokes equations are solved together with the energy equation [45]:
ρ t + x i ρ u i = 0
t ρ u i + x j ρ u i u j + p x i = x j τ i j + τ i j R + S i
t ρ H + x i ρ u i H = x i u j τ i j + τ i j R + q i + p t τ i j R u i x j + ρ ε + S i u i + Q
H t o t a l = h + u 2 2
In these equations, τij is the viscous stress tensor, τij,R is the Reynolds-stress tensor, ε is the turbulent dissipation rate, and Q is the volumetric heat source.
The numerical model adopts the following assumptions: the flow is steady and three-dimensional, the working fluid is incompressible and Newtonian, with temperature-dependent viscosity (Figure 7) and constant density, specific heat, and thermal conductivity over the operating range (Table 2), buoyancy is represented through the Boussinesq approximation, viscous dissipation and thermal radiation are neglected, only the internal flow field is solved, with the external chassis walls treated as adiabatic, zero-thickness surfaces, and the ambient pressure is 1 atm with a gravitational acceleration of 9.8 m/s2. The relative importance of buoyancy is characterized by the Richardson number Ri = Gr/Re2. For the present conditions, Ri is of order 0.01, well below unity, so the regime is forced-convection dominated, and buoyancy is negligible [46]. The Boussinesq term is retained as a small, physically consistent correction. All simulations are solved to a steady state, so the unsteady terms in the governing equations vanish.
The governing equations are solved with Simcenter Flotherm XT using a coupled pressure-velocity solver in double precision, with second-order discretization of the pressure, momentum, and energy equations. Convergence is monitored through the residuals of the governing equations together with the stabilization of the CPU temperature and the CPU thermal resistance.
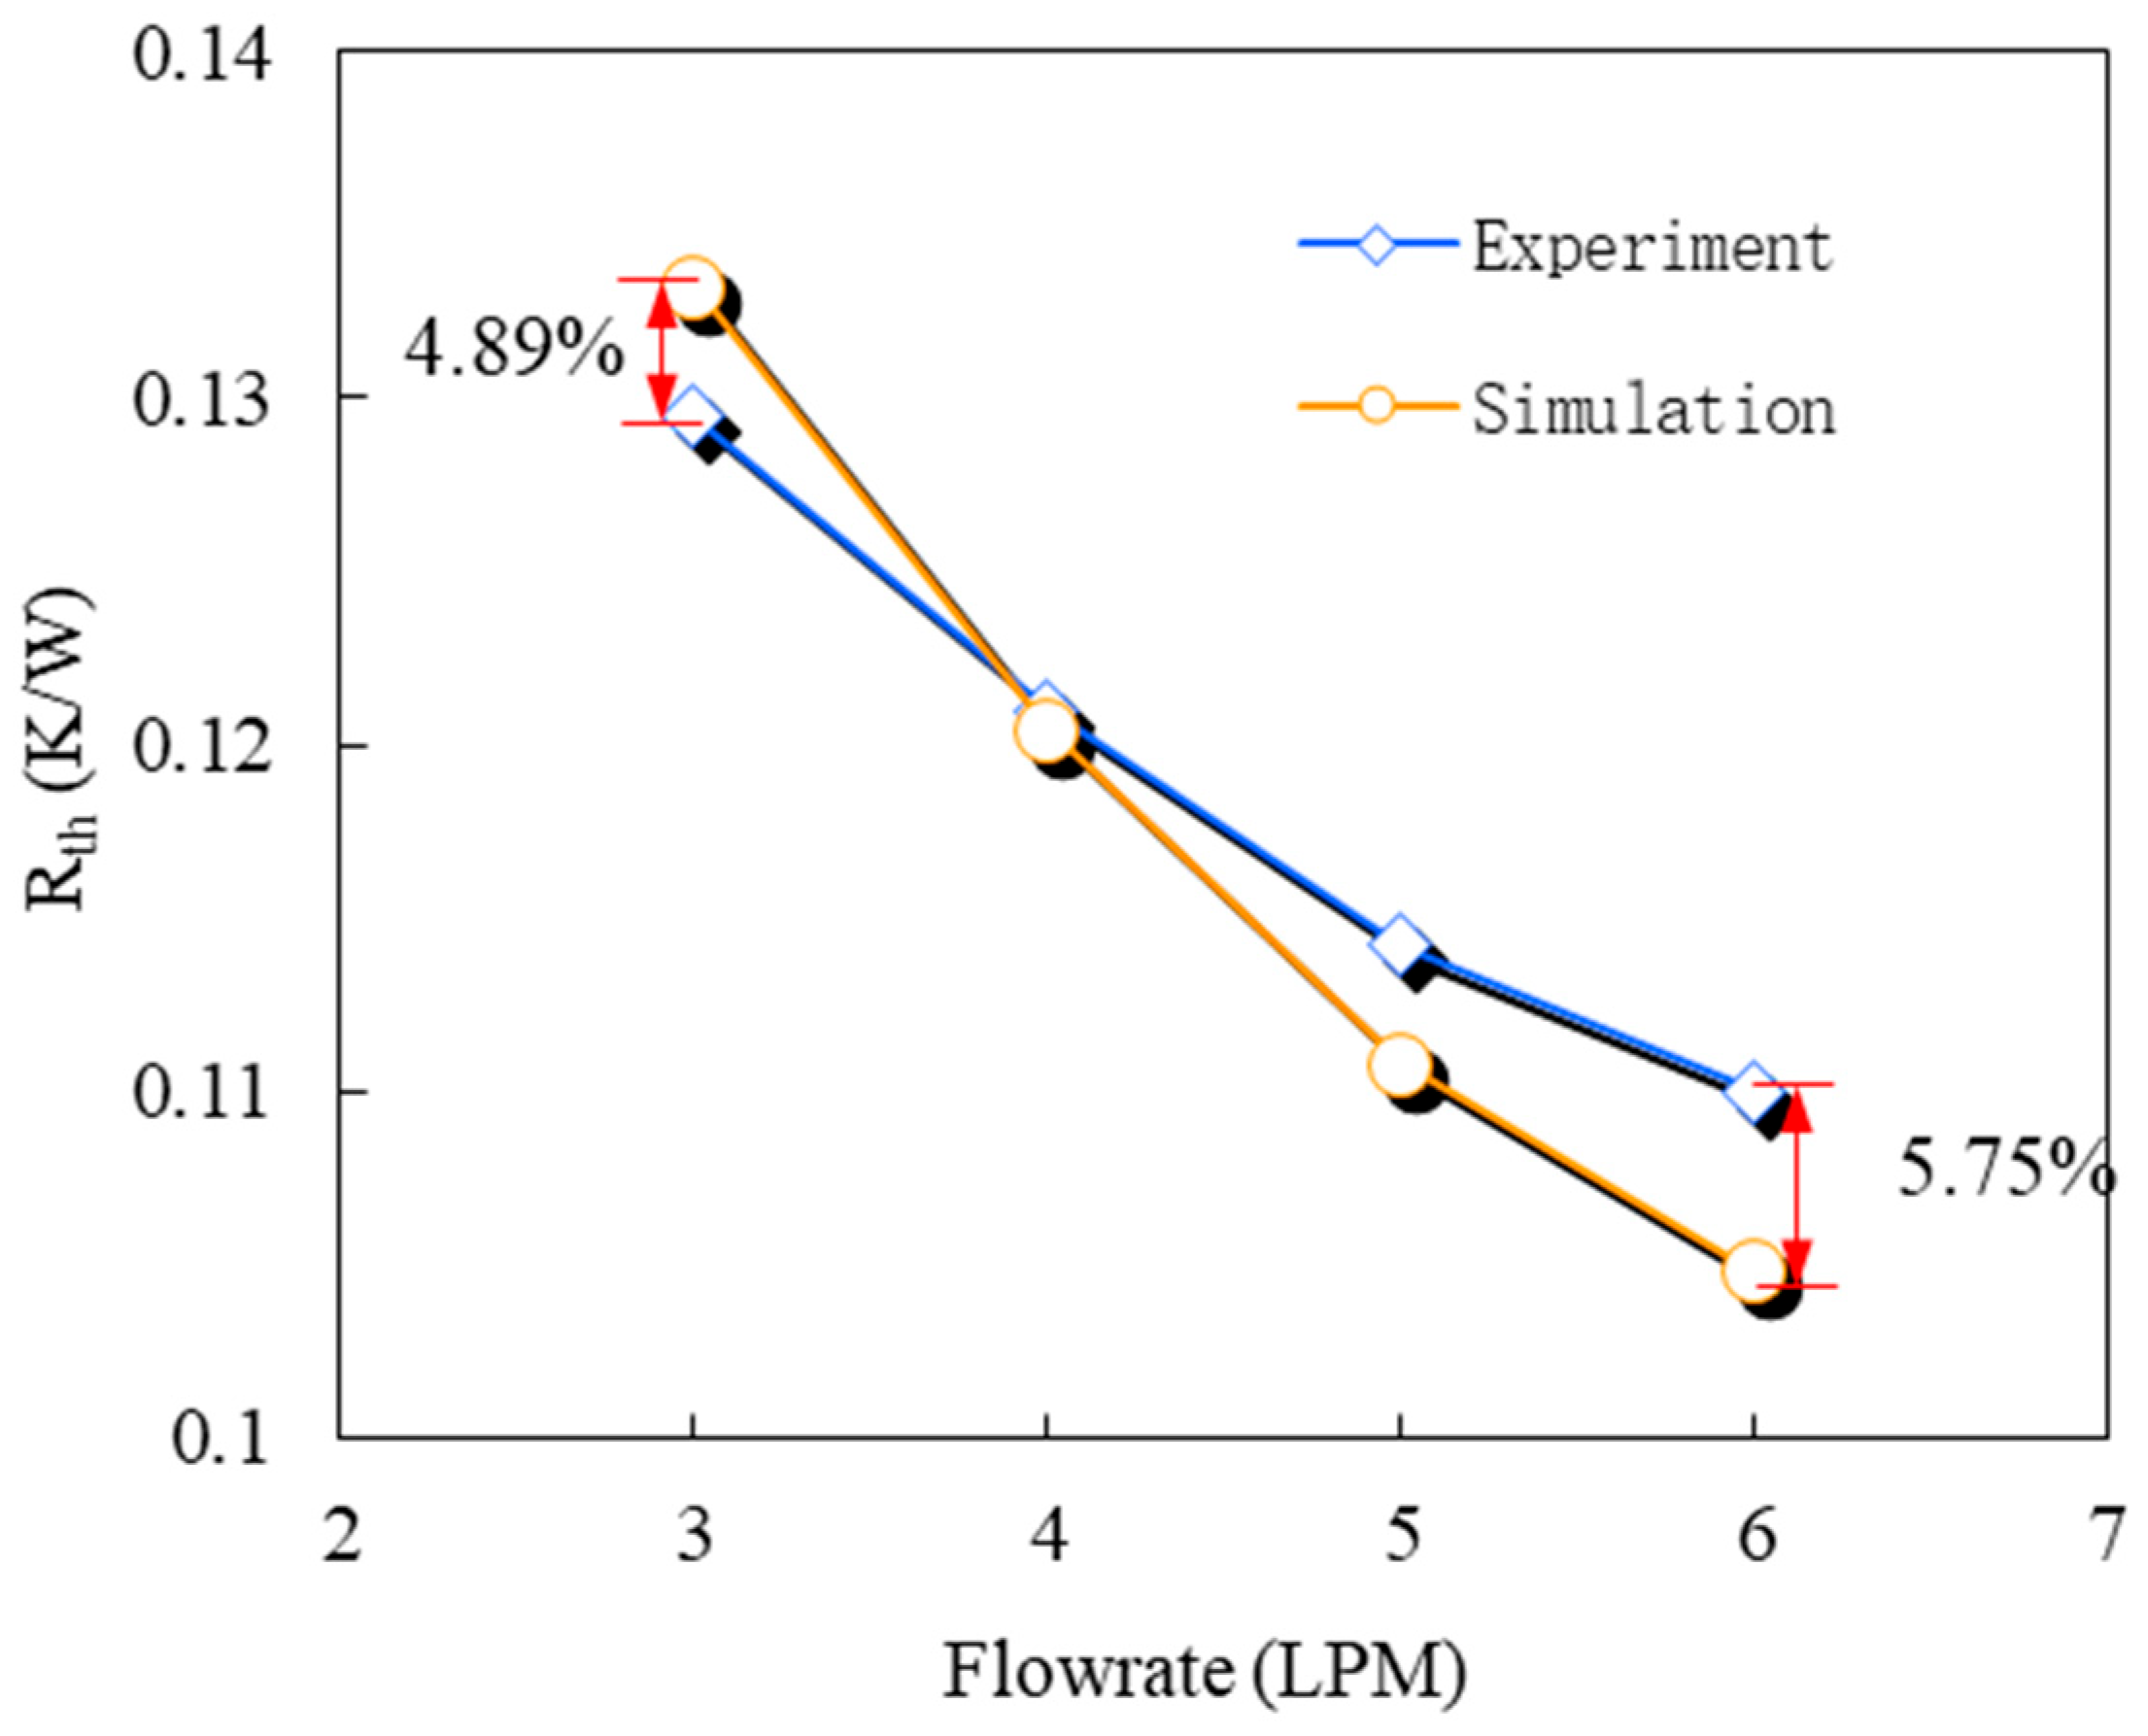
A turbulence model is retained rather than a purely laminar model because the local Reynolds number reaches values of order 1000, and the staggered pin-fin wakes can become locally transitional. The low-Reynolds-number k-epsilon formulation employs near-wall damping that reduces the turbulent viscosity to negligible values in the laminar regions. The adequacy of this setup is confirmed by the agreement with the experiment in Figure 9.
A mesh-independence study was performed at 3 LPM and a 45 °C inlet temperature by varying the characteristic mesh-scaling factor to generate three mesh densities of approximately 8, 10, and 13.6 million cells, with local refinement at all fluid-solid interfaces. As listed in Table 3, the CPU thermal resistance changed by less than 1.6% between the coarsest and finest meshes, so the 10-million-cell mesh was adopted for all subsequent simulations.
To reduce the computational cost, the server geometry is simplified by removing or redrawing features that have negligible influence on the main flow field. The simplification preserved the elements that govern the flow split (the CPU and GPU heat sinks, the RAM banks, the chassis walls, and the flow-directing valve and support seat) and removed or redrew only minor features such as cabling, small capacitors, and connectors. As shown in Figure 9, the predicted CPU thermal resistance from the simplified model agrees with the measured values to within 5.75% over the investigated flow-rate range. The deviation increases with flow rate because the simplified internal geometry slightly underestimates the internal pressure drop, which in turn affects the predicted flow split. The effect grows with flow rate, but the maximum deviation remains within 5.75% over the tested 3 to 6 LPM range, which spans the practical operating envelope of the system. The simplified server geometry used in the simulations is shown in Figure 10.

3. Results

To make the data origin specific, Section 3.1 reports numerical optimization results from CFD, whereas Section 3.2, Section 3.3, Section 3.4 and Section 3.5 report experimental measurements and benchmark comparisons. CFD-derived flow-distribution data are identified explicitly when used to interpret the measurements.

3.1. Numerical Optimization of the Pin-Fin Heat Sink

The numerical optimization is carried out at an inlet temperature of 45 °C using PAO-6, and the overall CPU thermal resistance Rth is taken as the objective function. The three geometric variables, namely D, Sd, and St, are varied sequentially.
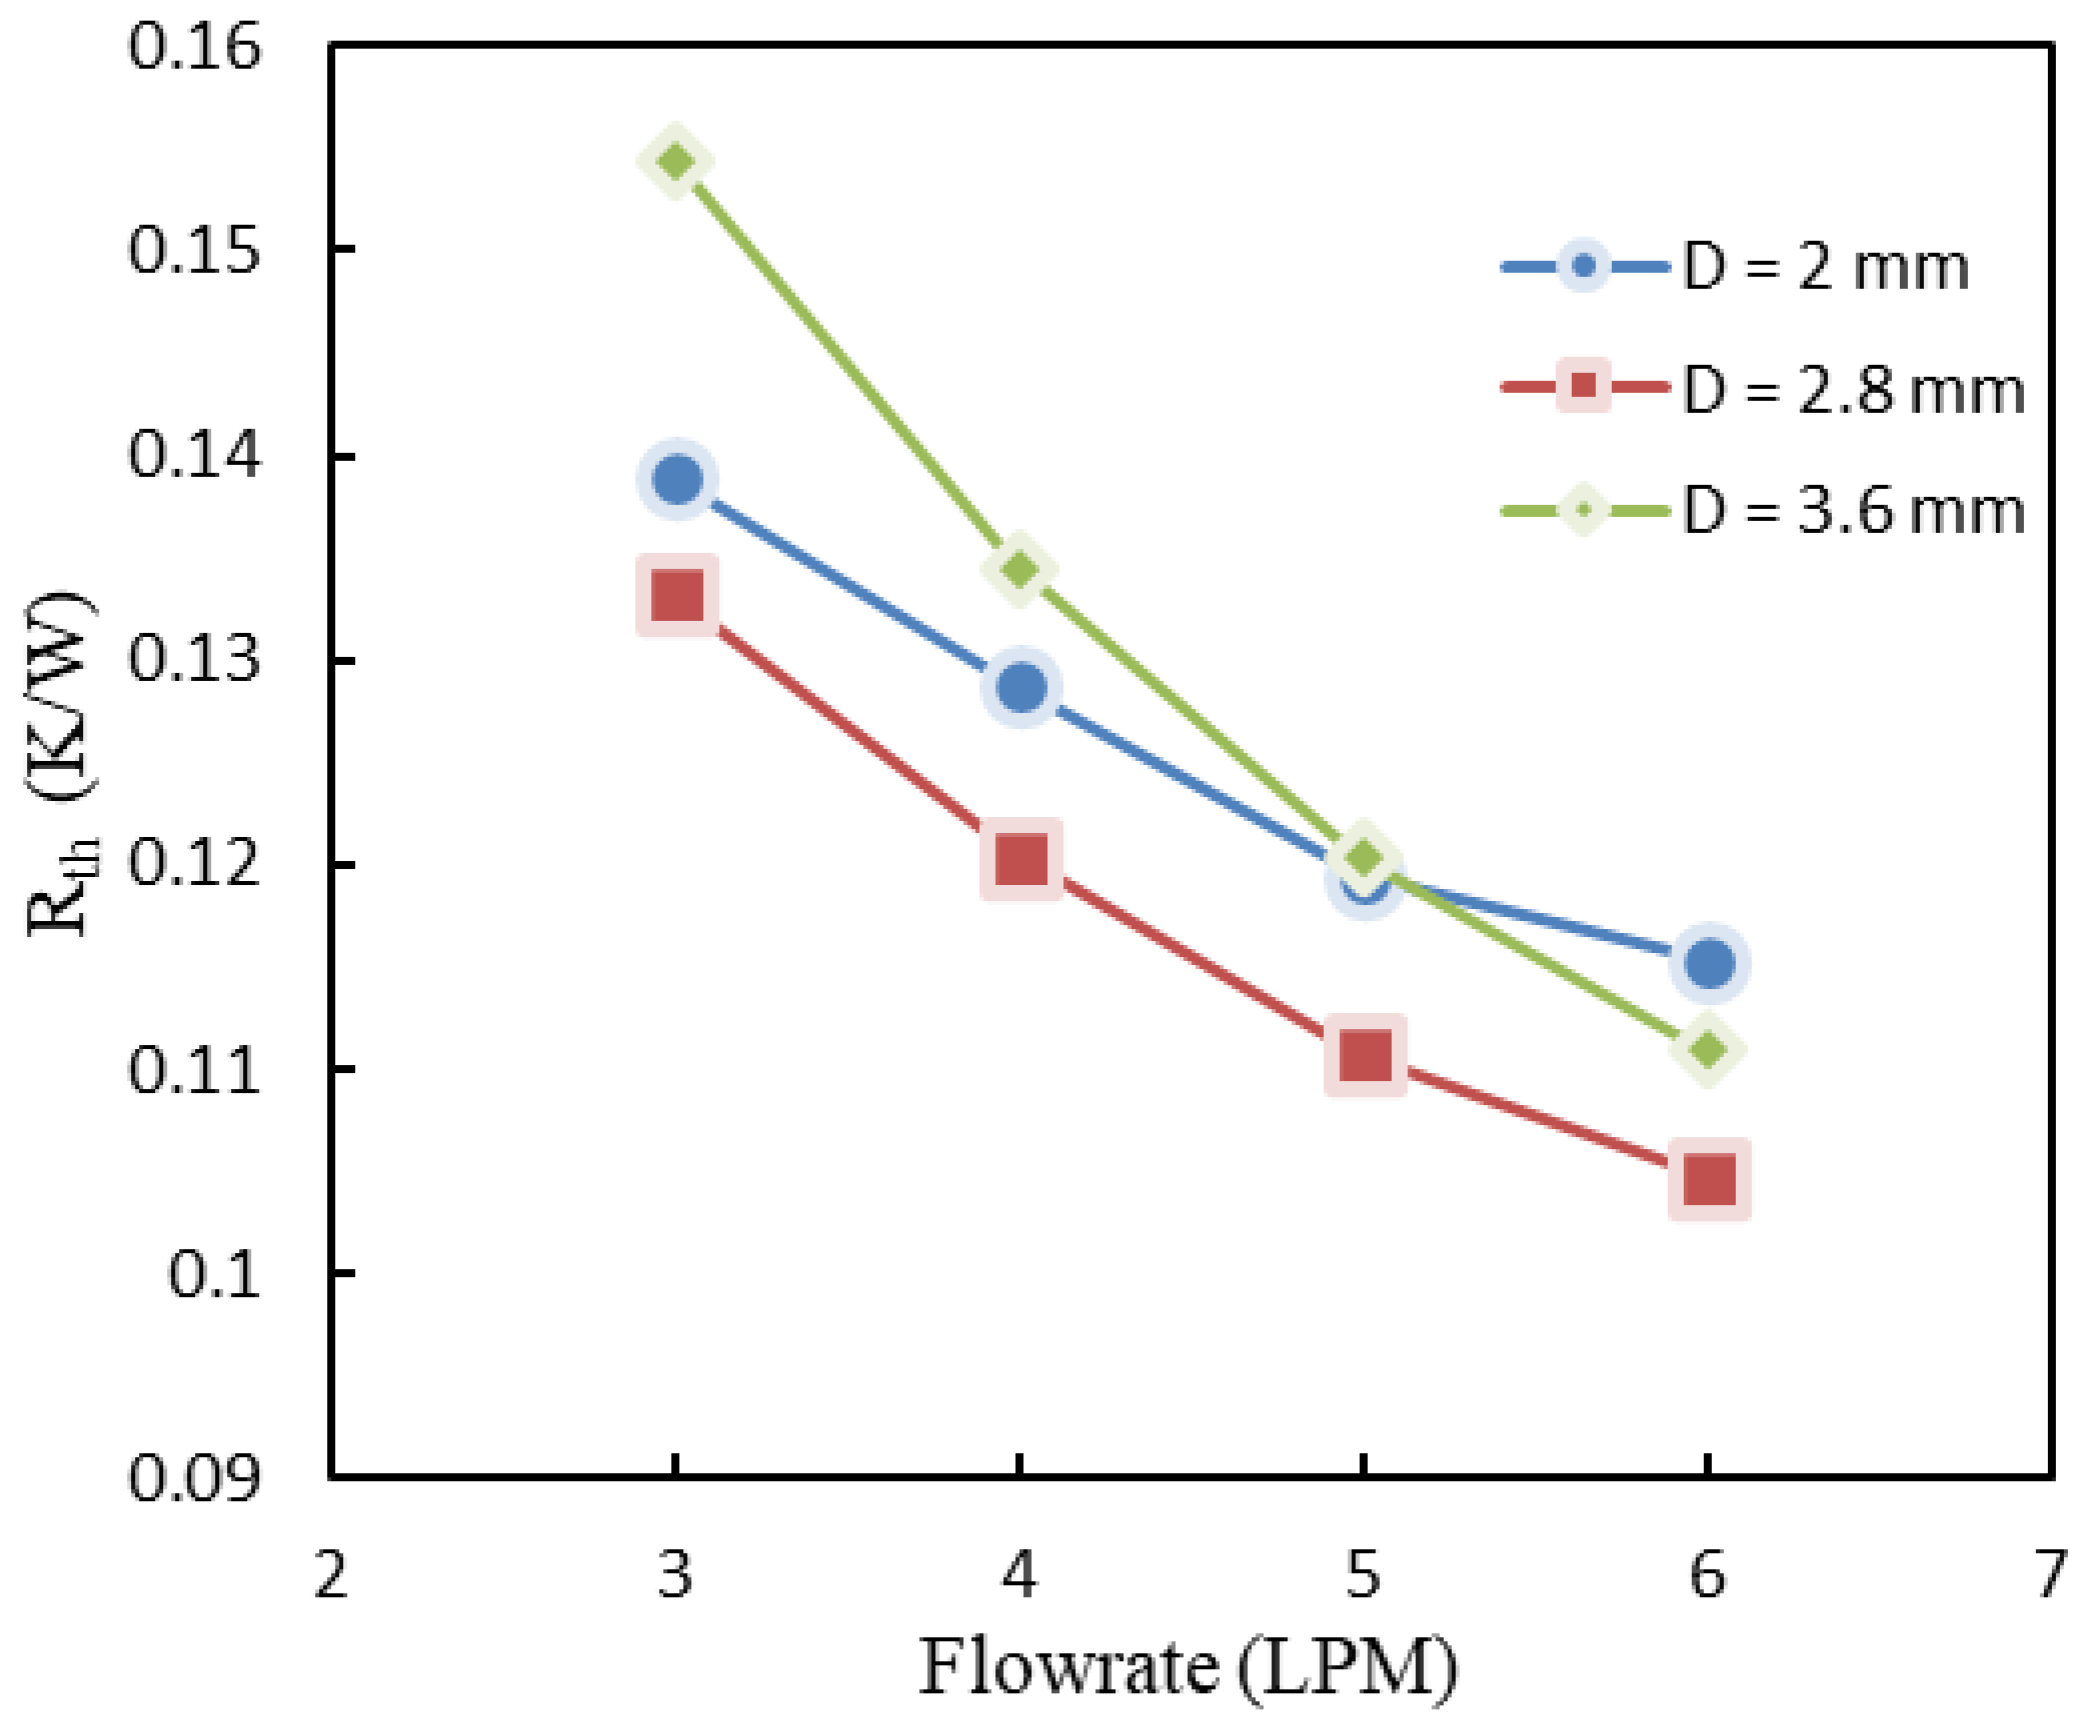
With Sd = 8.45 mm and St = 6 mm fixed, the pin diameter was varied across D = 2.0, 2.8, and 3.6 mm (which produces a ratio of total wetted area of 1:1.33:1.66) over a flow-rate range of 3–6 LPM. The results, summarized in Figure 11, show that D = 2.8 mm yields the lowest Rth across the entire flow-rate range. The behavior of the two extremes is instructive. At D = 3.6 mm, the largest surface area is offset by a substantially higher form drag and friction drag, which redirect flow toward the lower-resistance RAM bypass path and degrade the heat-transfer rate at the CPU. At D = 2.0 mm, the form drag is small (so that less fluid is bypassed), but the small diameter penalizes fin efficiency, and this penalty becomes increasingly apparent as the flow rate increases: at 6 LPM, D = 2.0 mm becomes the worst-performing configuration. These competing effects explain why the optimum diameter lies between the two extremes.
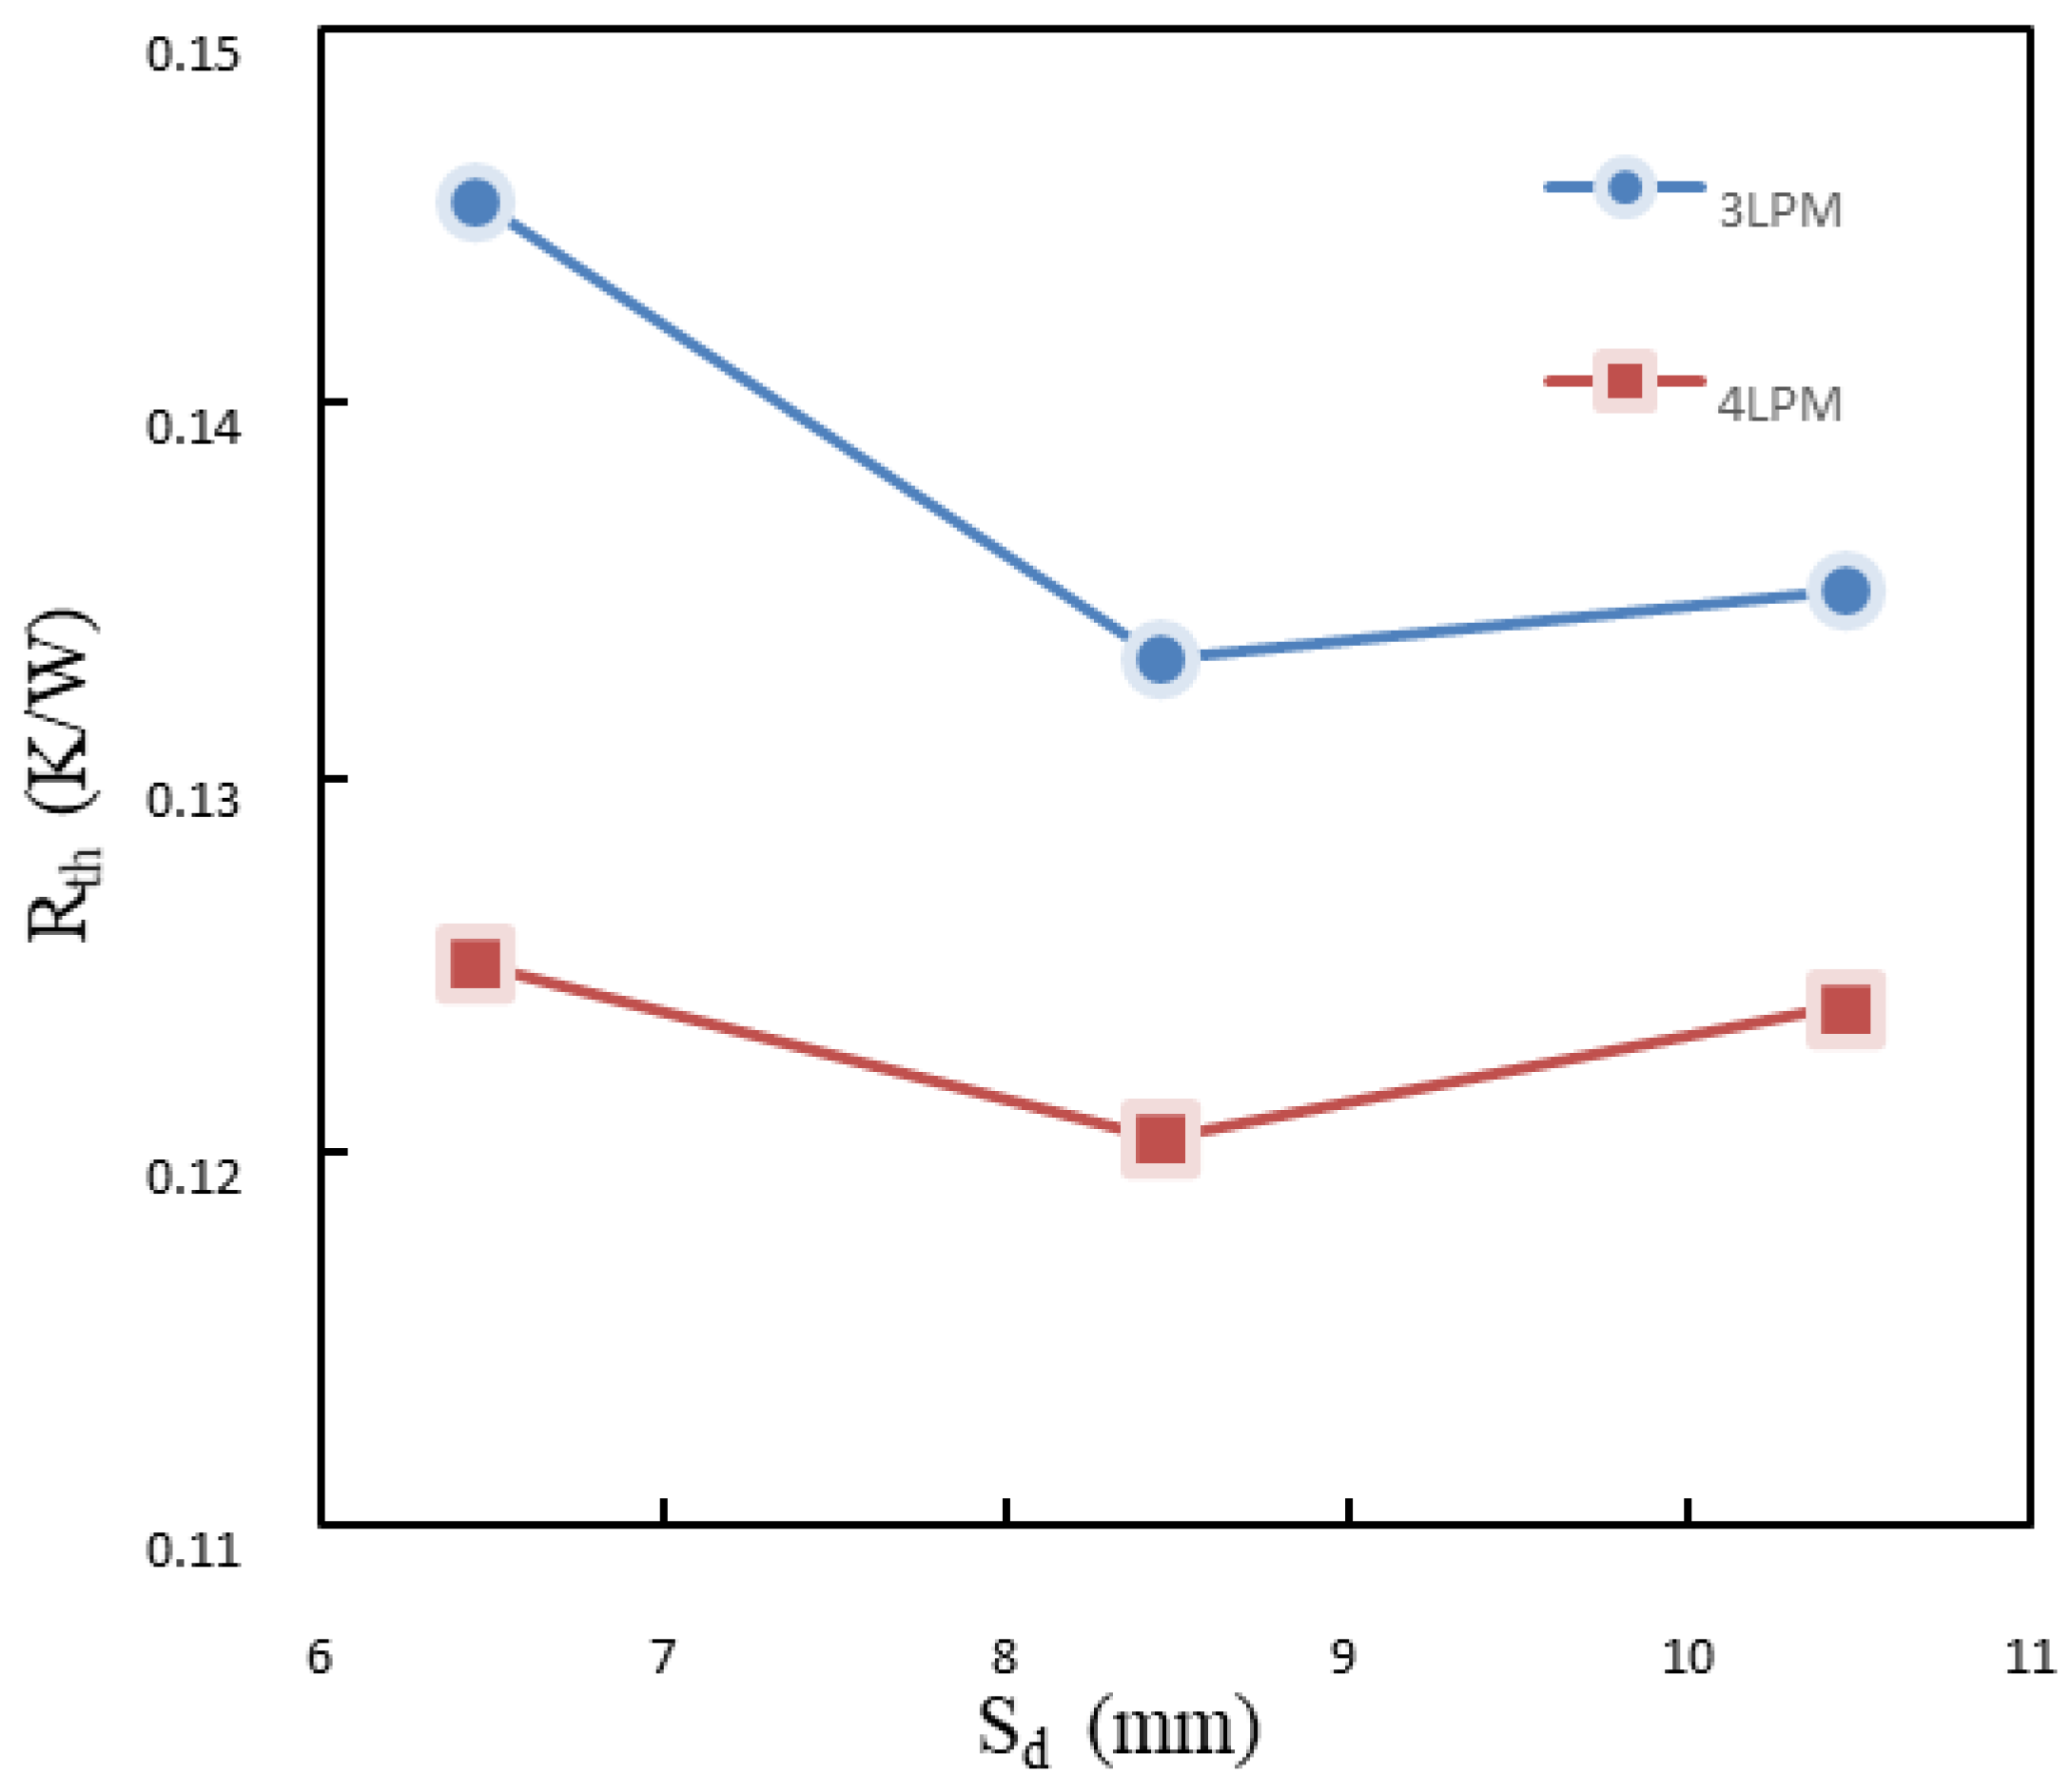
Fixing D = 2.8 mm and St = 6 mm, the longitudinal pitch Sd was varied across 6.45, 8.45, and 10.45 mm for inlet flow rates of 3 and 4 LPM. Figure 12 shows that the thermal resistance reaches a minimum at Sd = 8.45 mm at both flow rates. At Sd = 6.45 mm, the row-to-row gap (≈7.10 mm) is the smallest, the local velocity through the rear of each row is the highest, and form and friction drag are maximal, which leads to significant bypass and the largest Rth. At Sd = 10.45 mm, the gap (≈10.90 mm) is large enough to reduce both the bypass penalty and the effective velocity across each pin row, the latter weakening the local heat-transfer coefficient. The intermediate value Sd = 8.45 mm balances these competing effects.
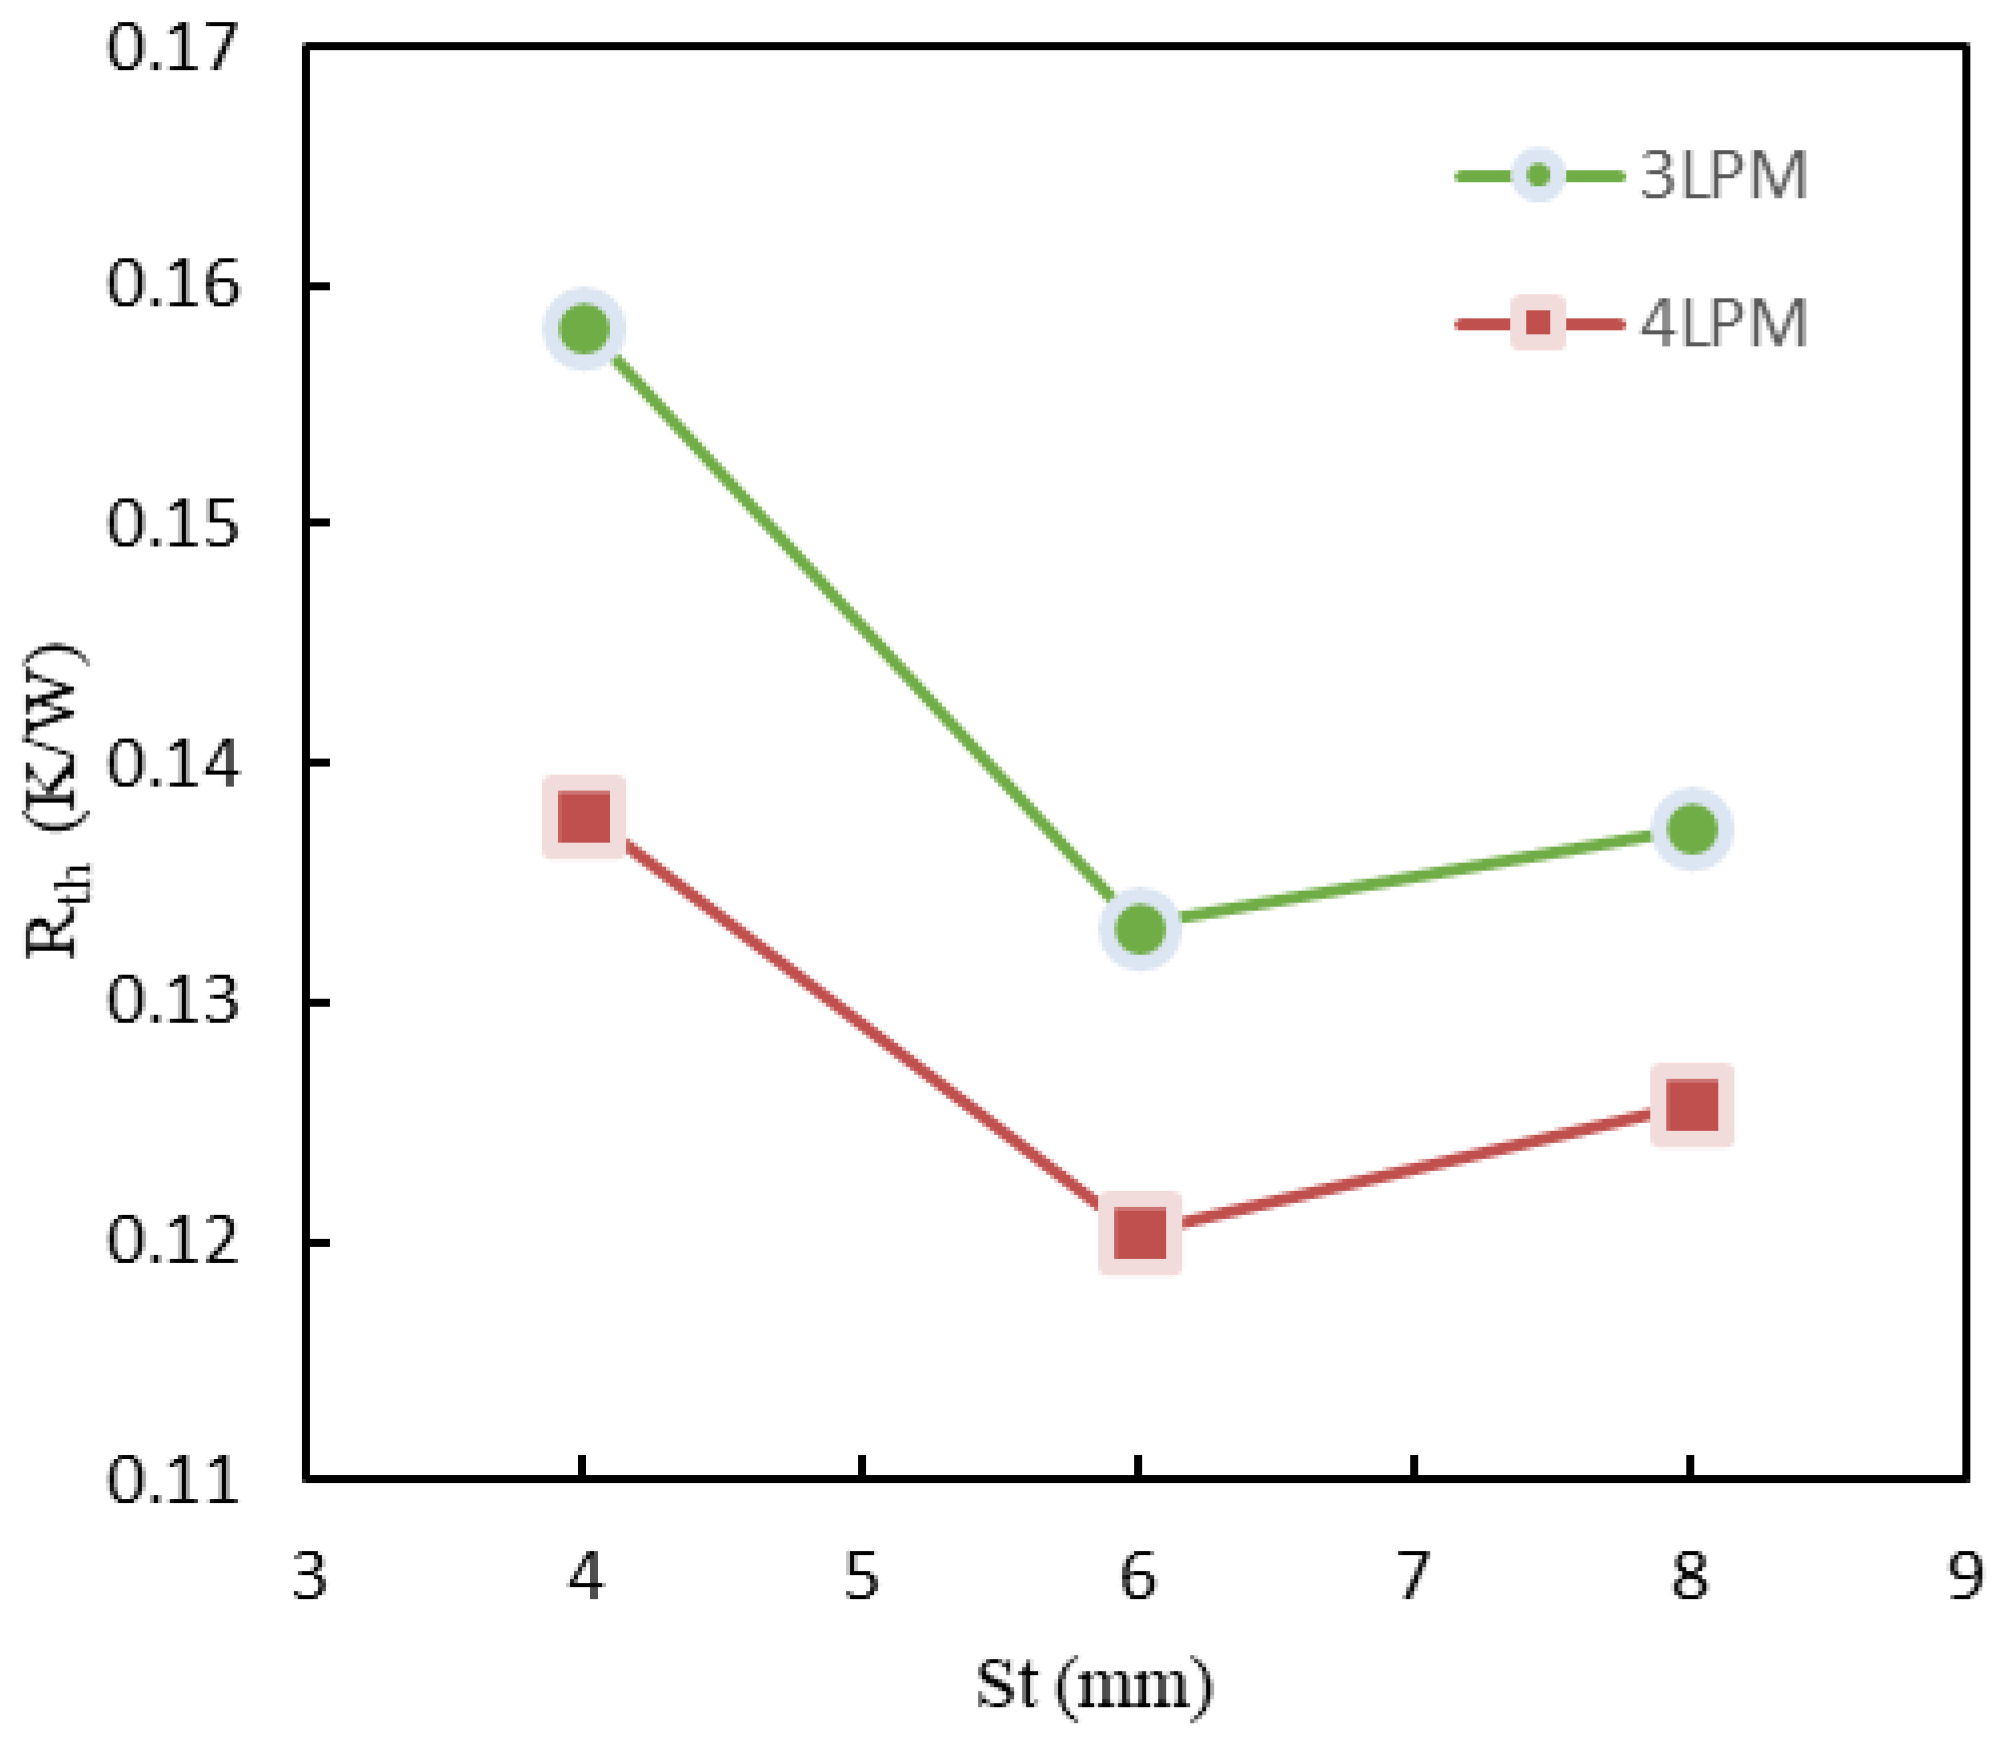
Following the same logic, with D = 2.8 mm and Sd = 8.45 mm fixed, the transverse pitch St was varied across 4, 6, and 10 mm, as shown in Figure 13. The thermal resistance is lowest at St = 6 mm due to the same balance between form-drag-induced bypass and local convective enhancement. The optimum geometry adopted for the experimental study is therefore D = 2.8 mm, St = 6 mm, and Sd = 8.45 mm. The pin-fin heat sink with these dimensions was fabricated and used in all the experimental results presented below.

3.2. Experimental Effect of Inlet Temperature and Oil Flow Rate

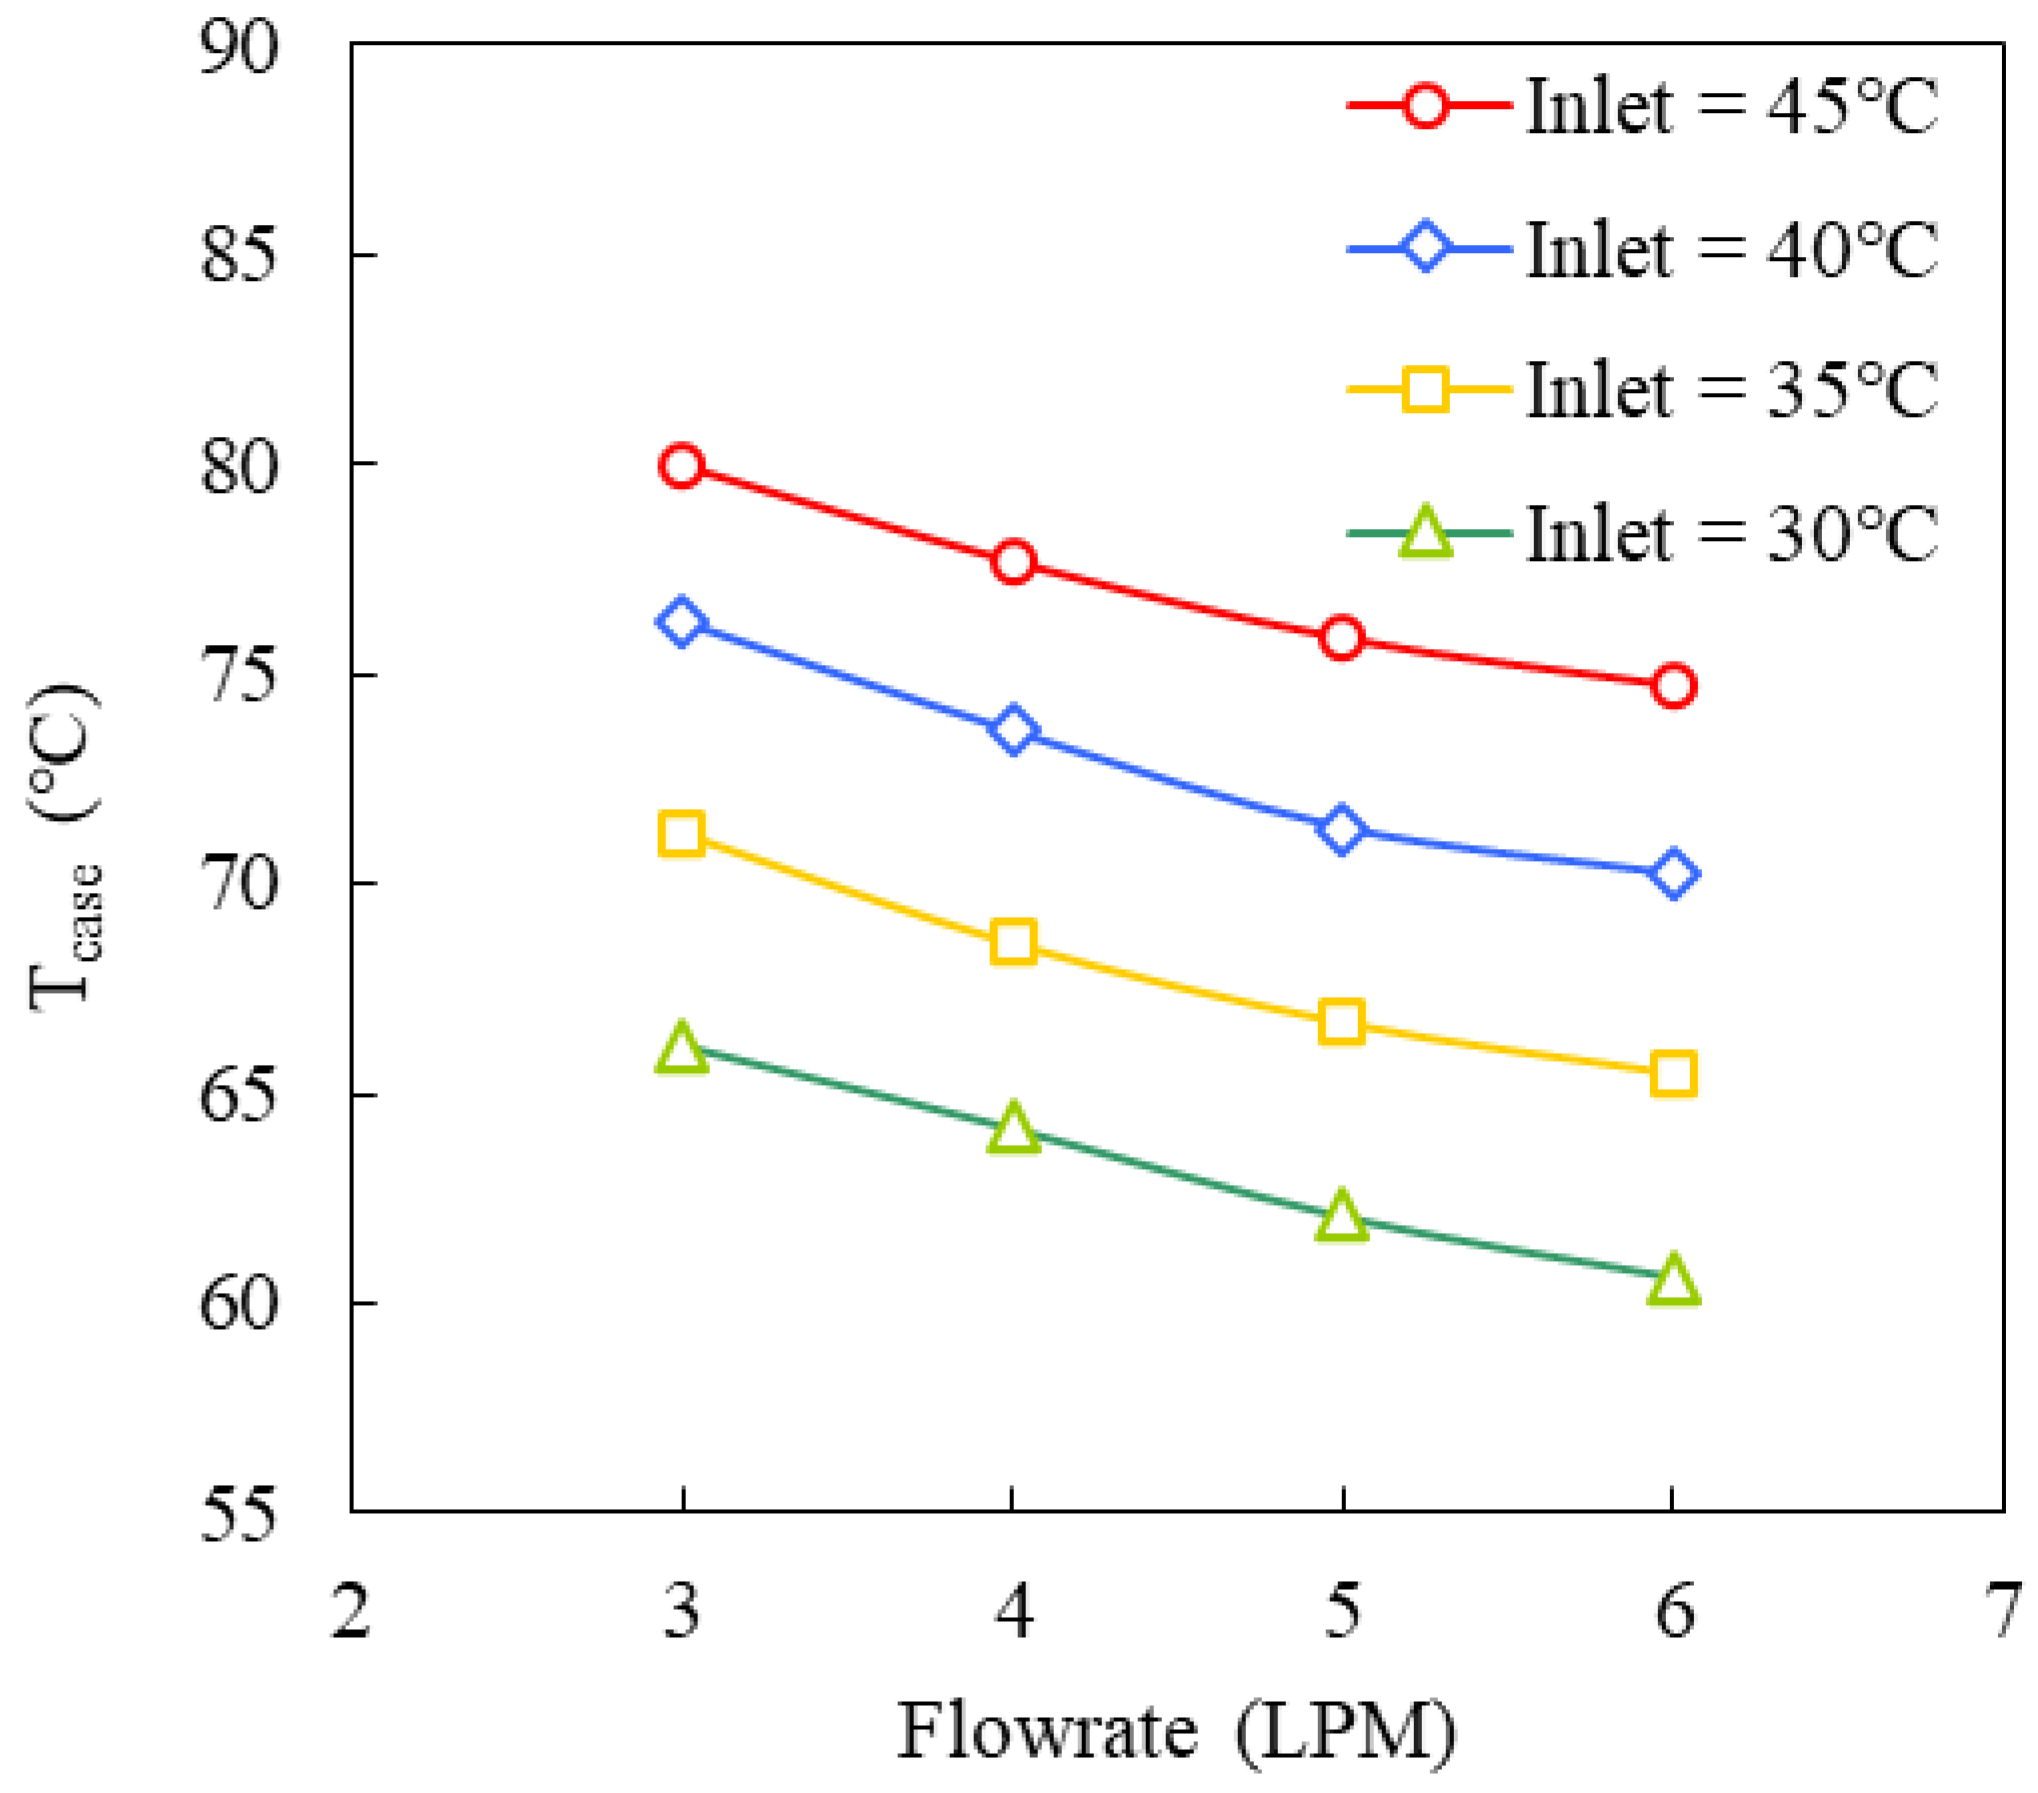
Figure 14 shows the measured CPU case temperature Tcase as a function of inlet flow rate for oil inlet temperatures of 30 °C, 35 °C, 40 °C, and 45 °C, with the CPU at 100% load throughout. Tcase decreases with increasing flow rate at every inlet temperature, and the thermal resistance is reduced by 15.05–21.92% as the flow rate is increased from 3 LPM to 6 LPM. The reduction is largest at the lowest inlet temperature because the larger CPU-to-oil temperature difference yields a higher specific heat-transfer rate.
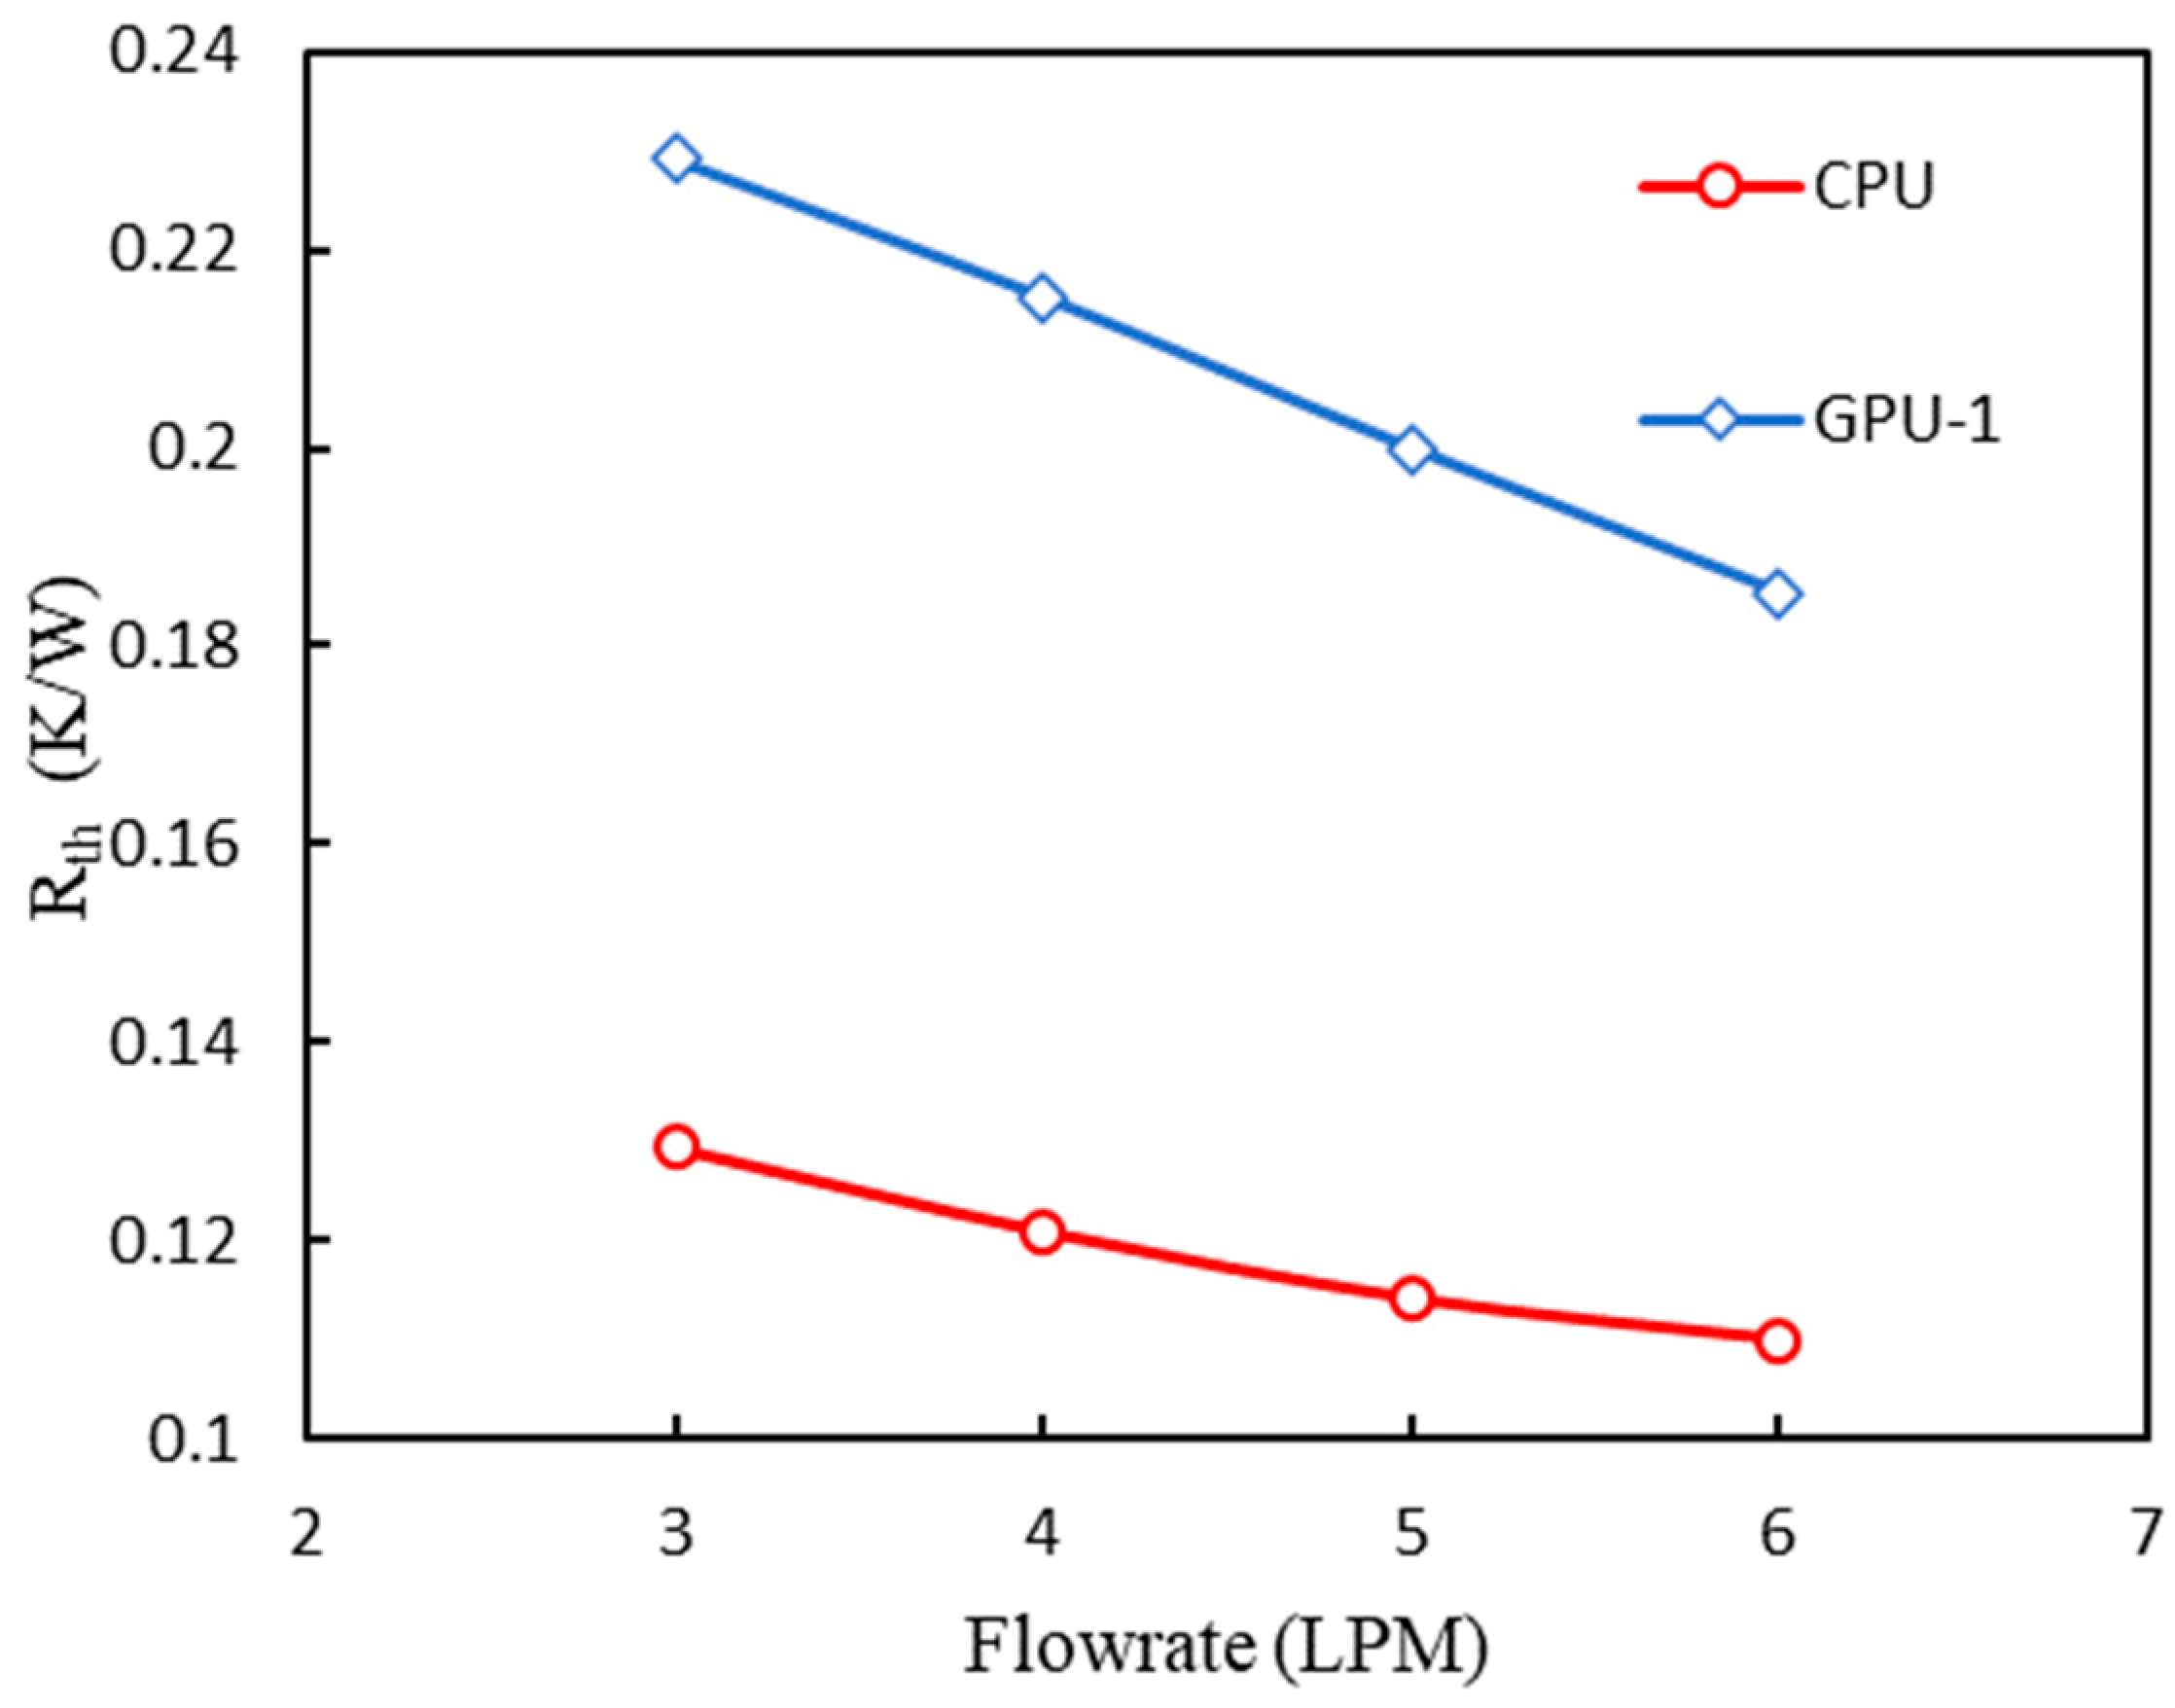
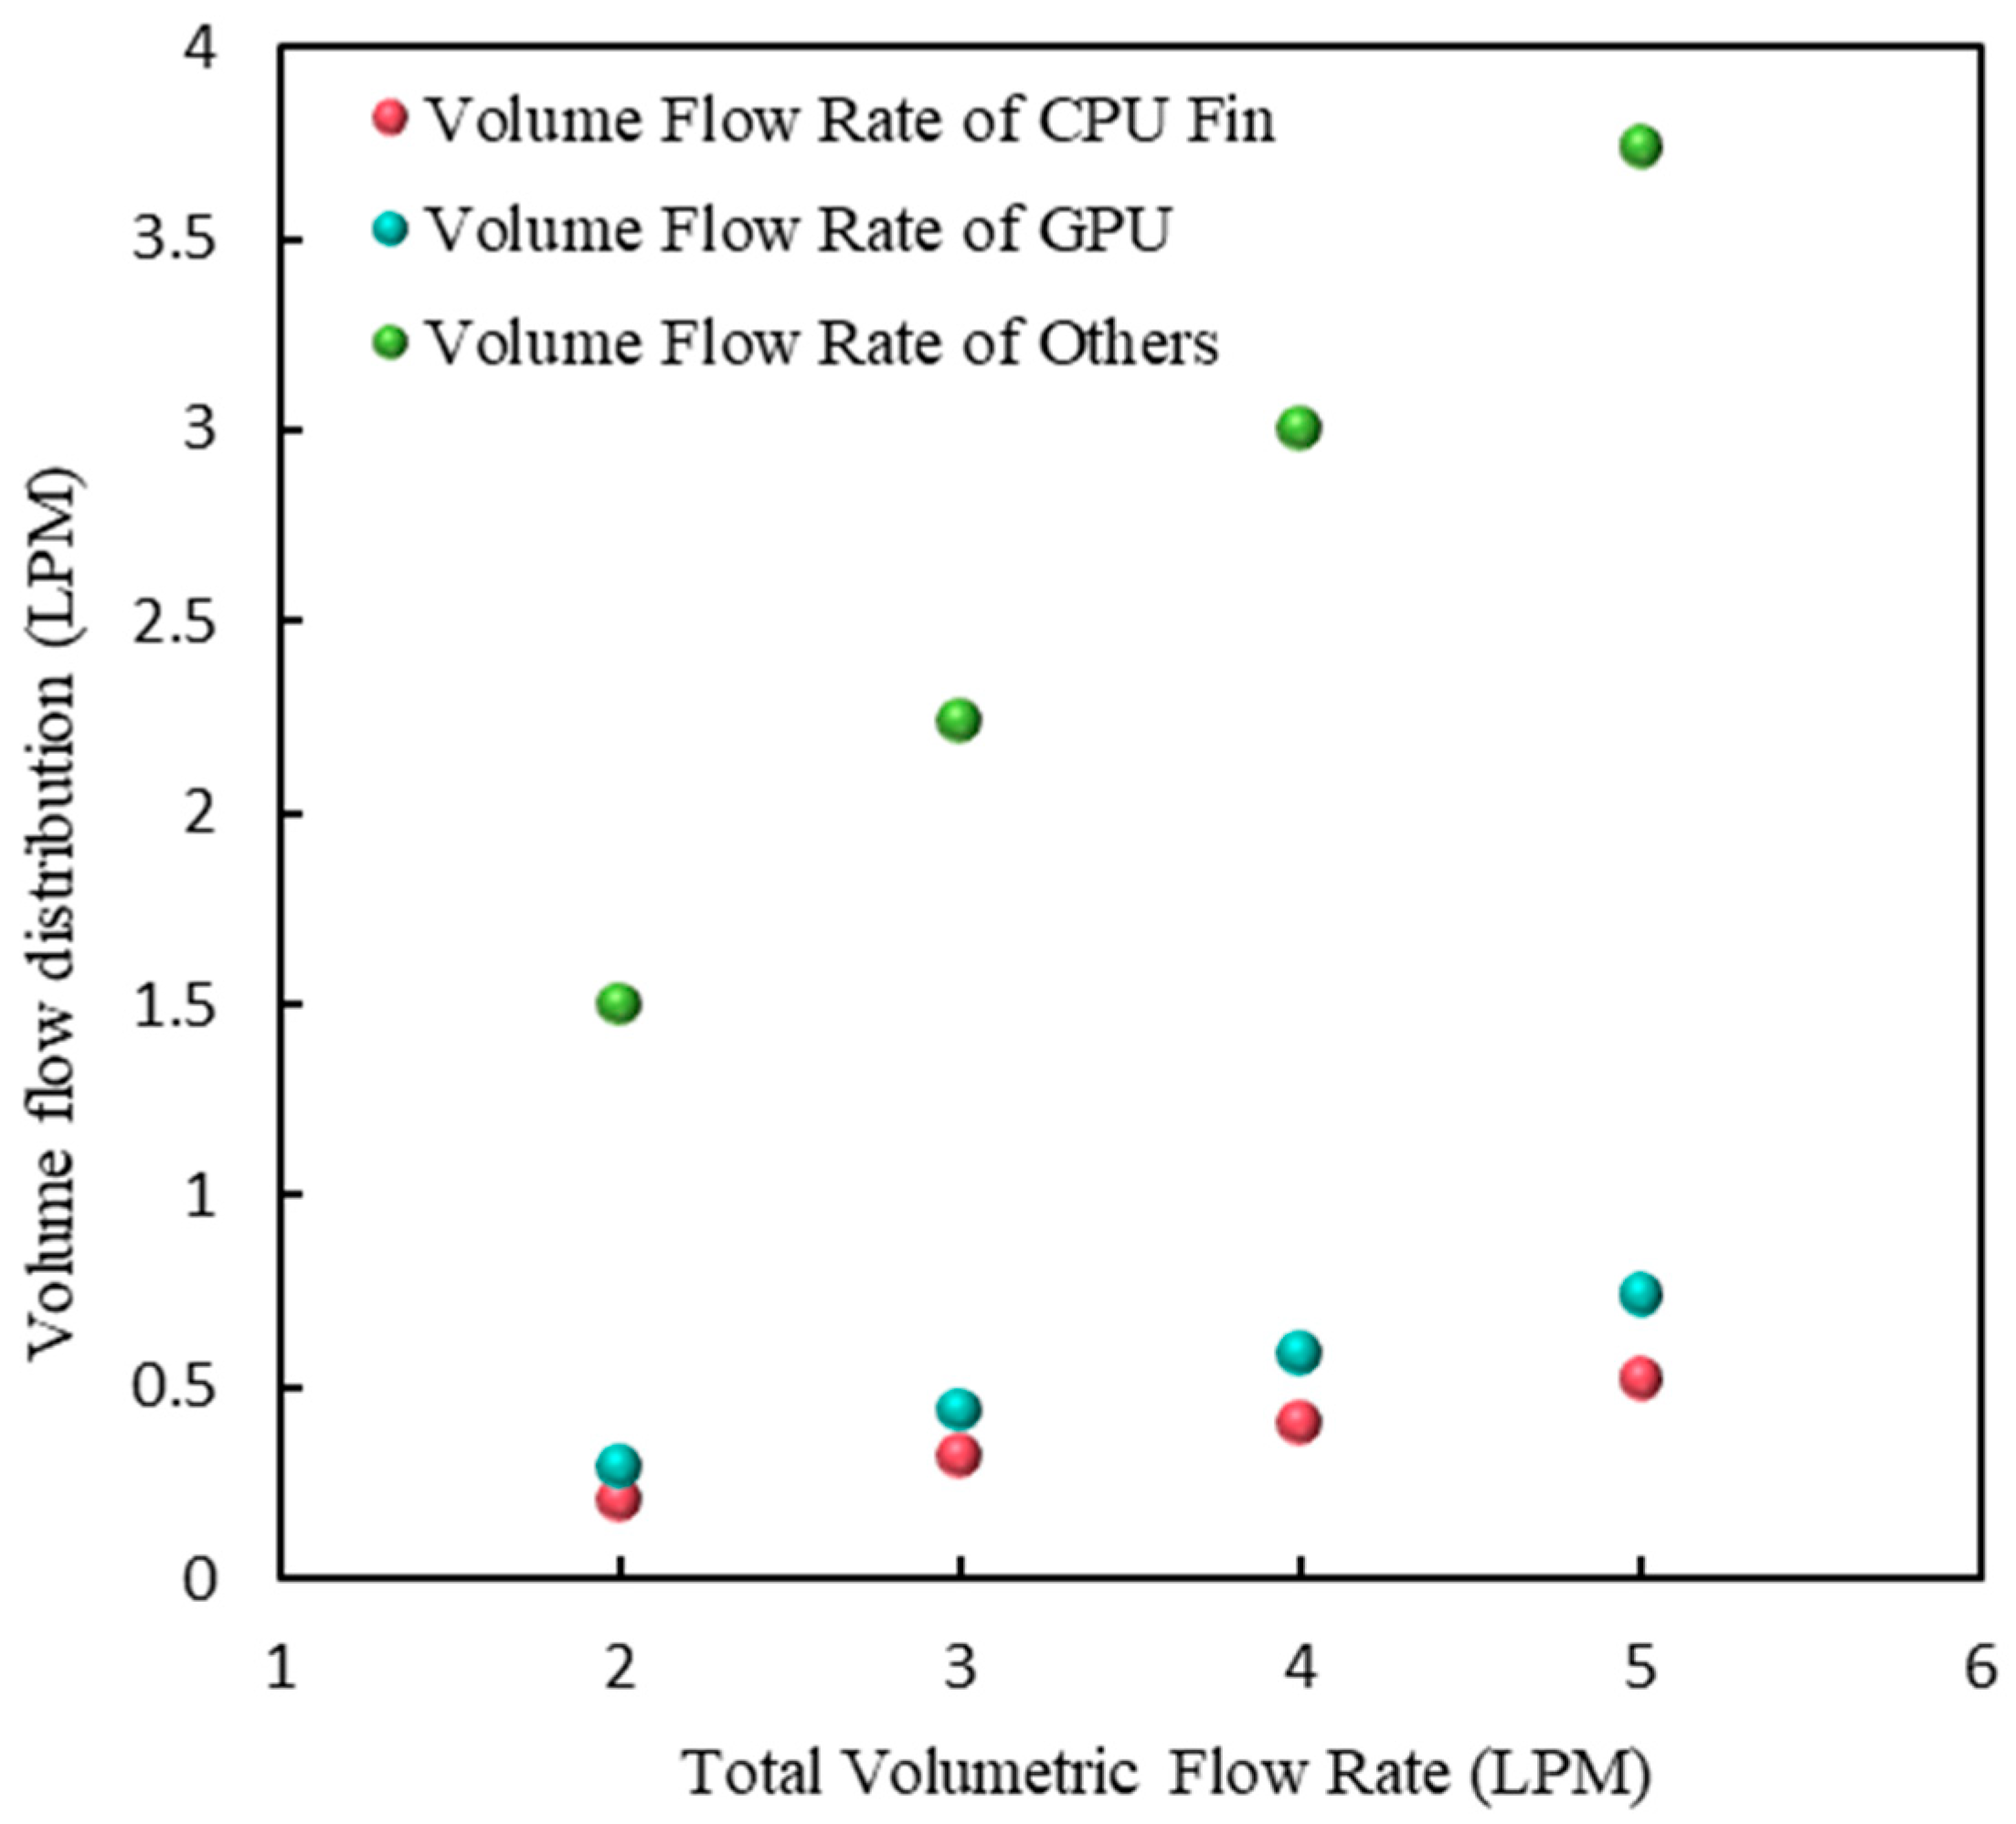
The dependence of Rth on flow rate is not linear: the rate of decline tapers off as the flow rate is increased, which is again a signature of the bypass phenomenon: beyond a certain point, additional total flow is preferentially diverted through the lower-resistance RAM channels rather than the pin-fin array. The asymmetry is highlighted in Figure 15, which compares Rth of the CPU and GPU-1 at Tin = 45 °C. The GPU thermal resistance decreases more rapidly with flow rate than the CPU thermal resistance: the GPU is fitted with a rectangular-fin heat sink (fin pitch 4.95 mm, fin height 30.5 mm) whose hydraulic resistance is substantially lower than that of the CPU pin-fin array, so as the total flow is increased, the marginal flow preferentially passes through the GPU heat sink. This is consistent with the bypass mechanism quantified in Equation (23). The corresponding flow distribution from the CFD model is reported in Figure 16.

3.3. Experimental Comparison with a Rectangular-Fin Immersion-Cooled Server

The optimized pin-fin immersion server is compared with the rectangular-fin immersion server reported by Shrigondekar et al. [30] using the same PAO-6 dielectric oil. The rectangular-fin heat sink, as shown in Figure 17. It has a fin pitch of 1.2 mm, a fin thickness of 0.25 mm, and a fin height of 22 mm, giving a total wetted area of 2414.4 cm2, much larger than the 383.7 cm2 of the present pin-fin heat sink. The measured thermal resistances are compared in Figure 18. Despite its much smaller wetted area, the pin-fin heat sink delivers a lower CPU thermal resistance across the flow-rate range investigated, by virtue of its higher fin efficiency, stronger inter-row mixing, and reduced bypass. At 3 LPM, the pin-fin heat sink reduces the CPU thermal resistance by 22.29% compared to the rectangular-fin heat sink. The optimized pin-fin immersion server is compared with the rectangular-fin immersion server reported by Shrigondekar et al. [30] using the same PAO-6 dielectric oil. The rectangular-fin baseline (1.2 mm fin pitch) is the same heat sink used by Shrigondekar et al. [30] and Muneeshwaran et al. [29], both from the present research group, so the baseline geometry is consistent across these studies.

3.4. Experimental Comparison with the Air-Cooled Baseline

The immersion tests are now compared with measurements performed by Lanner Electronics Inc. on the same server platform under conventional air cooling. The immersion test condition is 3 LPM at an oil inlet temperature of 45 °C. The chassis layout is identical but the dissipated powers of the principal components differ: as summarized in Table 4, the CPU and GPU thermal design power in the immersion configuration are 270 W and 300 W, respectively, exceeding the air-cooled baseline values of 205 W and 250 W by 31.7% and 20.0%, OCP and DIMM powers are unchanged. The air-cooled CPU uses a rectangular-fin heat sink, whereas the immersion-cooled CPU uses the pin-fin heat sink optimized above.
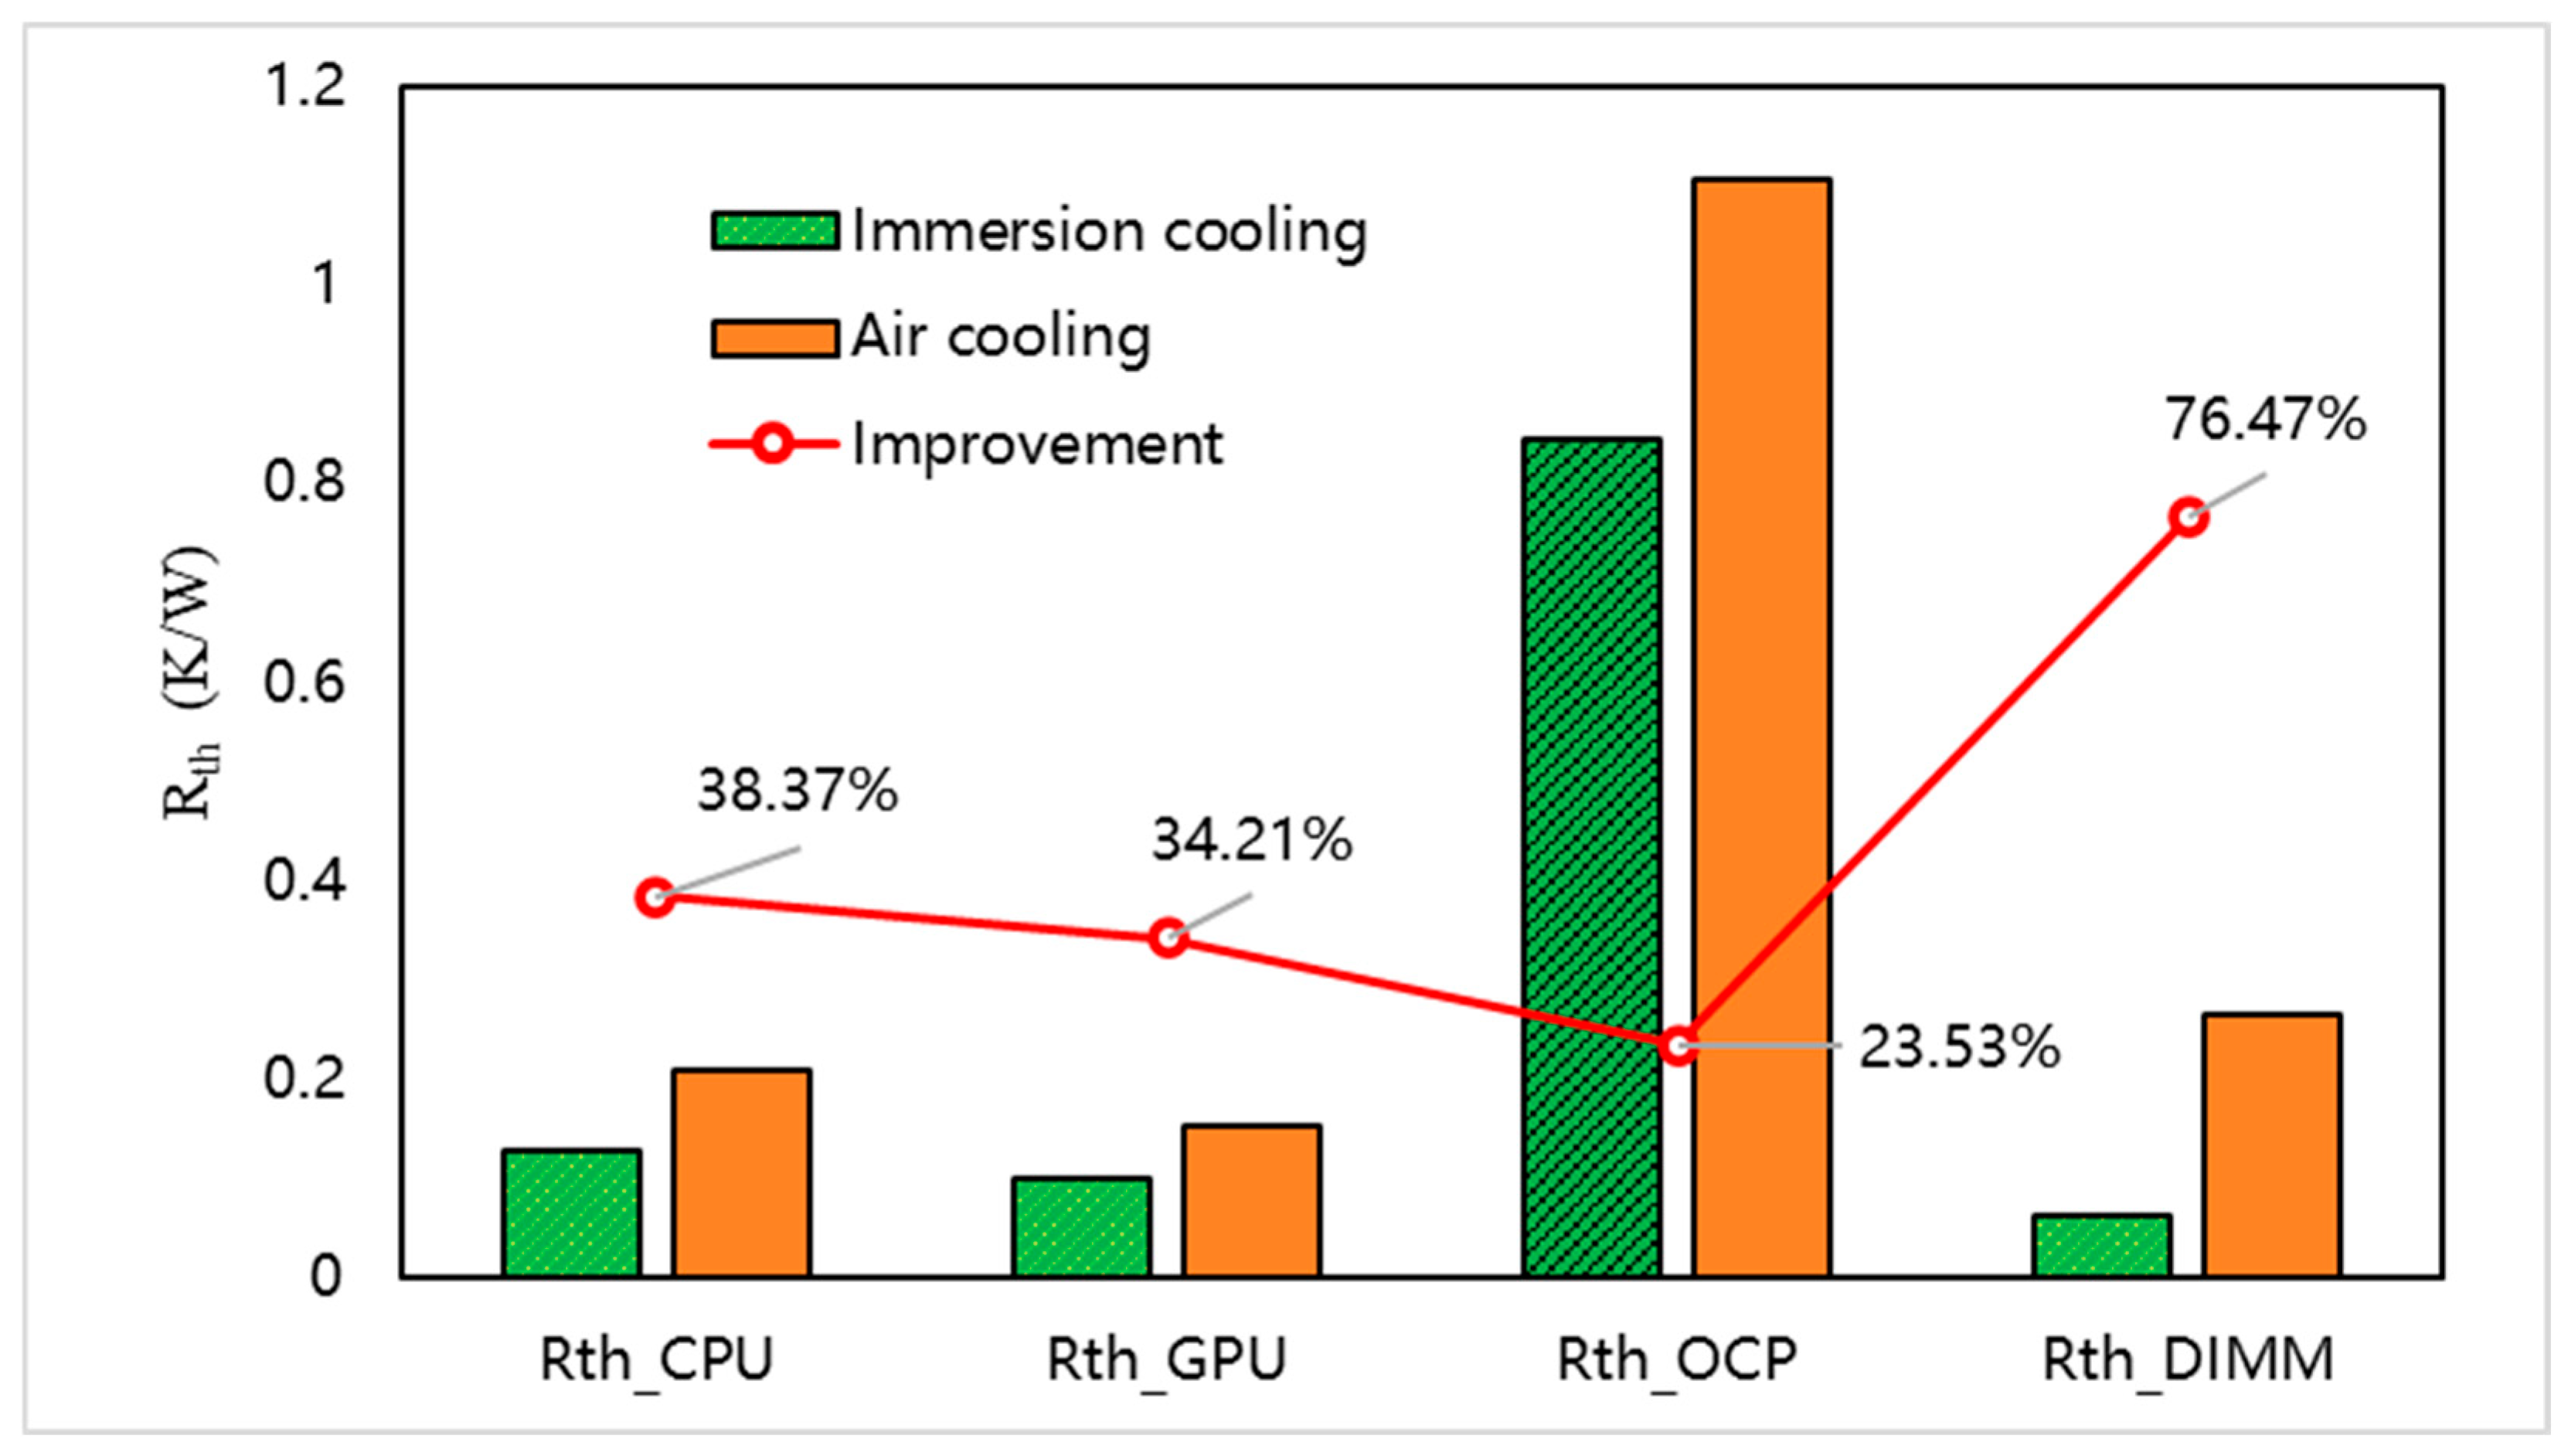
The component-level thermal resistances are compared in Figure 19. Relative to the air-cooled baseline, the immersion-cooled CPU, GPU, OCP, and DIMM thermal resistances are lower by 38.37%, 34.21%, 25.53%, and 76.47%, respectively. The fact that these reductions are achieved while operating the CPU and GPU at thermal powers 31.7% and 20% higher than the air-cooled reference highlights the superior heat-removal capacity of the pin-fin oil-immersion system.

3.5. Partial Power Usage Effectiveness (pPUE)

Power Usage Effectiveness (PUE), defined as the ratio of total facility power to IT power, is the conventional efficiency metric for data centers. In a full data center, the cooling-plant power includes chillers, dry coolers, and air-handling units. In the present laboratory study, these auxiliaries are not available, so a partial PUE (pPUE) restricted to the in-server fluid-mechanical power consumption is used to compare the two cooling architectures. The PUE metric follows the definition of The Green Grid [47]. Because the present facility rejects heat through a thermostatic bath rather than a production heat-rejection plant, the pPUE used here is a server-level metric restricted to the in-server fluid-moving power.
pPue = P total_server + P pump _fan P total_server
The fractional improvement of the immersion server relative to the air-cooled server is calculated as
improvement = pPUE air 1 pPUE immersion 1 pPUE air 1 × 100 %
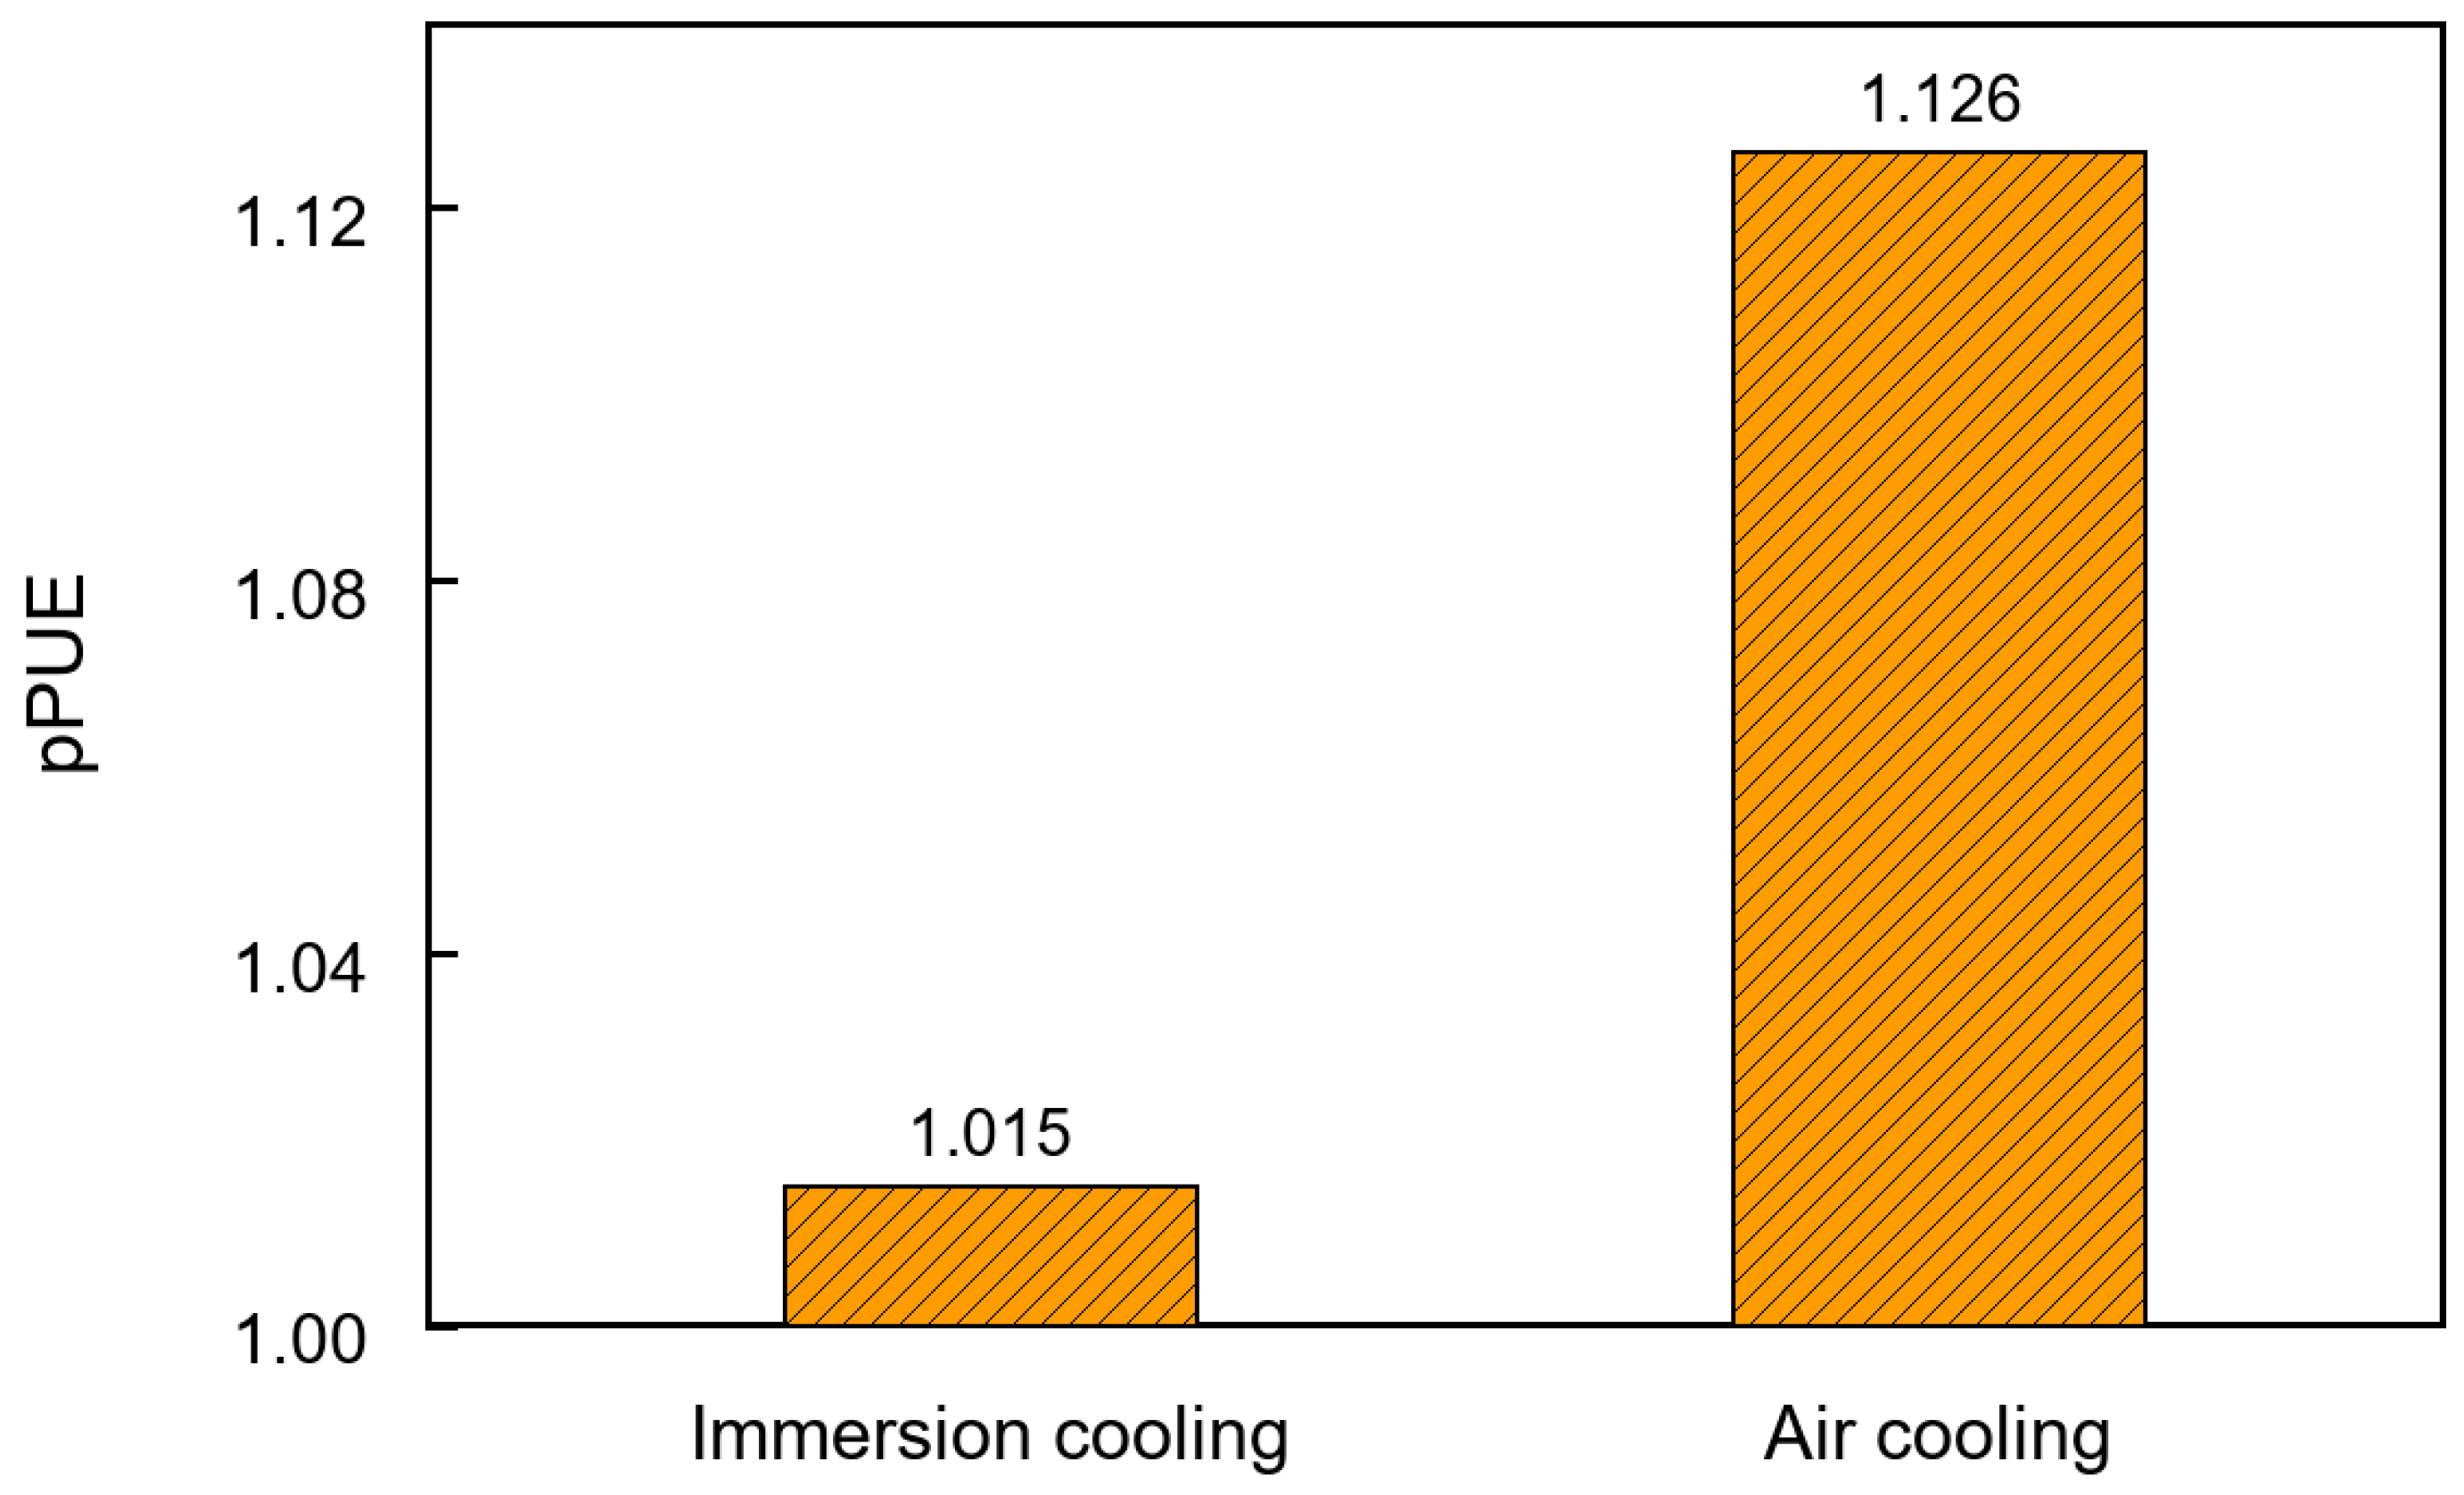
For the air-cooled server, the two cooling fans consume 76 W and the total server power is 605 W, giving pPUEair = 1.126. For the immersion server, the gear pump (including its power-supply losses) draws 11 W, and the server dissipates 720 W, giving pPUEimmersion = 1.015. Applying Equation (29) yields an improvement of 88.09%, summarised in Figure 20.
The 11 W is the power of the internal circulation pump only; it excludes the external heat-rejection plant (chiller, dry cooler, and any secondary-loop pumping), which is not part of the present laboratory facility. The same exclusion applies to the air-cooled value, so the comparison is made on a fair, server-level basis. The pPUE values and the CPU and GPU thermal-resistance reductions all correspond to the same operating condition (3 LPM, 45 °C oil inlet temperature, CPU at 100% load). The difference in total IT power between the two systems arises from the higher thermal design powers of the immersion configuration (Table 1), not from different test conditions.

4. Conclusions

A complete commercial server was instrumented for single-phase PAO-6 immersion cooling, and a pin-fin heat sink was developed to replace the conventional rectangular-fin heat sink on the CPU and mitigate the bypass flow caused by the adjacent RAM channels. A simplified hydraulic-thermal analysis was derived, the pin-fin geometry was optimized by three-dimensional CFD, and the optimum was fabricated and tested. The principal findings are:
  • The bypass analysis shows that, for a rectangular-fin heat sink, the bypass penalty cannot be removed by reducing the fin pitch alone, because any reduction in convective resistance is offset by an increase in the bypass term, so only an optimum fin pitch exists for a given motherboard. The closed-form expression for the overall thermal resistance, Equation (23), makes this trade-off explicit.
  • CFD identified clear optima for the three pin-fin parameters at D = 2.8 mm, Sd = 8.45 mm, and St = 6 mm, respectively. Over the range investigated, these parameters changed the CPU thermal resistance by approximately 4 to 15%.
  • Relative to a published rectangular-fin immersion server using the same oil [30], the optimized pin-fin heat sink reduced the CPU thermal resistance by 22.29% at 3 LPM despite having only 15.9% of the wetted area, owing to its higher fin efficiency, stronger inter-row mixing, and reduced bypass
  • Relative to the air-cooled baseline operating on the same server platform, the pin-fin immersion server reduced the CPU and GPU thermal resistances by 38.37% and 34.21%, respectively, while operating those two components at thermal design powers 31.7% and 20.0% higher than the air-cooled reference. The partial Power Usage Effectiveness of the immersion server was 1.015, corresponding to an 88.09% improvement relative to the air-cooled baseline value of 1.126.
Among the principal cooling technologies, the pin-fin single-phase immersion approach offers a practical balance of performance, cost, and complexity: it is simpler than direct-to-chip cold plates and two-phase immersion, while substantially outperforming air cooling and a rectangular-fin immersion baseline.
This study is limited to a single server platform and a single fluid (PAO-6), and the geometry was optimized by sequential univariate variation, which does not capture parameter interactions. Future work will pursue coupled response-surface or design-of-experiments optimization, a system-level energy assessment that includes the secondary loop, and extension to a wider range of fluids and to full-rack immersion.

Author Contributions

Conceptualization, S.-W.C., Y.-D.Z. and C.-C.W.; methodology, S.-W.C.; software, Y.-D.Z.; experimental validation, L.-H.C.; formal analysis, S.-W.C.; data curation, S.-W.C. and Y.-D.Z.; writing—original draft preparation, S.-W.C.; writing—review and editing, S.-W.C. and C.-C.W.; supervision, C.-C.W.; project administration, C.-C.W.; funding acquisition, C.-C.W. All authors have read and agreed to the published version of the manuscript.

Funding

This research was funded by the National Science and Technology Council, Taiwan, under grant NSTC 114-2221-E-A49-165-MY3.

Data Availability Statement

Data are available on request due to restrictions.

Conflicts of Interest

The authors declare no conflicts of interest.

Nomenclature

A f total wetted heat-transfer area (m2)
A 1 flow cross-sectional area of the CPU heat sink (m2)
A 2 flow cross-sectional area of the RAM channels (m2)
c p specific heat capacity (J/kg∙ K)
D pin diameter (m)
D h hydraulic diameter (m)
D h , f hydraulic diameter of the fin channel (m)
D h , R hydraulic diameter of the RAM channel (m)
f Fanning friction factor
GrGrashof number
h convective heat-transfer coefficient (W/m2 ∙ K)
h f convective heat-transfer coefficient of the fin channel (W/m2 ∙ K)
H fin height (m)
k thermal conductivity (W/m∙ K)
k f thermal conductivity of the working fluid (W/m∙ K)
L streamwise length of the CPU heat sink (m)
L h y hydrodynamic entry length (m)
L R streamwise length of the RAM channel (m)
N number of fin passages
N u f Nusselt number of the fin channel
p pressure (Pa)
Δ p pressure drop (Pa)
Pr Prandtl number
Q heat input (W)
Re Reynolds number
RiRichardson number
R t h thermal resistance (K/W)
S d longitudinal pin pitch (m)
S t transverse pin pitch (m)
t H/xc
T c a s e CPU case temperature (°C)
T i n fluid inlet temperature (°C)
T o u t fluid outlet temperature (°C)
T w average wall temperature (°C)
T f average fluid temperature (°C)
u f mean velocity in the fin channel (m/s)
u R mean velocity in the RAM channel (m/s)
V ˙ volumetric flow rate (m3/s)
V ˙ f volumetric flow through the CPU heat sink (m3/s)
V ˙ R volumetric flow through the RAM channels (m3/s)
V ˙ t o t a l total volumetric flow rate (m3/s)
x c fin spacing (m)
ε turbulent dissipation rate (m2/s3)
μ dynamic viscosity (Pa∙ s)
ρ density (kg/m3)
τ i j viscous stress tensor
CFDComputational fluid dynamics
CPUCentral processing unit
DCData center
DIMMDual in-line memory module
GPUGraphics processing unit
GWPGlobal warming potential
LPMLiters per minute
OCPOpen Compute Project module
PAOPoly-α-olefin
PCBPrinted circuit board
pPUEPartial power usage effectiveness
PUEPower usage effectiveness
RAMRandom-access memory
TIMThermal interface material
TTVThermal test vehicle

References

  1. Zezulka, F.; Marcon, P.; Vesely, I.; Sajdl, O. Industry 4.0–An Introduction in the phenomenon. IFAC-PapersOnLine 2016, 49, 8–12. [Google Scholar]
  2. Ebrahimi, K.; Jones, G.F.; Fleischer, A.S. A review of data center cooling technology, operating conditions and the corresponding low-grade waste heat recovery opportunities. Renew. Sustain. Energy Rev. 2014, 31, 622–638. [Google Scholar] [CrossRef]
  3. Liu, Y.; Wei, X.; Xiao, J.; Liu, Z.; Xu, Y.; Tian, Y. Energy consumption and emission mitigation prediction based on data center traffic and PUE for global data centers. Glob. Energy Interconnect. 2020, 3, 272–282. [Google Scholar] [CrossRef]
  4. Daraghmeh, H.M.; Wang, C.-C. A review of current status of free cooling in datacenters. Appl. Therm. Eng. 2017, 114, 1224–1239. [Google Scholar] [CrossRef]
  5. Nadjahi, C.; Louahlia, H.; Lemasson, S. A review of thermal management and innovative cooling strategies for data center. Sustain. Comput. Inform. Syst. 2018, 19, 14–28. [Google Scholar] [CrossRef]
  6. Moore, A.L.; Shi, L. Emerging challenges and materials for thermal management of electronics. Mater. Today 2014, 17, 163–174. [Google Scholar] [CrossRef]
  7. Ahmed, K.M.U.; Bollen, M.H.; Alvarez, M. A review of data centers energy consumption and reliability modeling. IEEE Access 2021, 9, 152536–152563. [Google Scholar] [CrossRef]
  8. Chu, W.-X.; Wang, C.-C. A review on airflow management in data centers. Appl. Energy 2019, 240, 84–119. [Google Scholar] [CrossRef]
  9. Fulpagare, Y.; Bhargav, A. Advances in data center thermal management. Renew. Sustain. Energy Rev. 2015, 43, 981–996. [Google Scholar] [CrossRef]
  10. Khalaj, A.H.; Halgamuge, S.K. A Review on efficient thermal management of air-and liquid-cooled data centers: From chip to the cooling system. Appl. Energy 2017, 205, 1165–1188. [Google Scholar]
  11. Ramakrishnan, B.; Alissa, H.; Manousakis, I.; Lankston, R.; Bianchini, R.; Kim, W.; Baca, R.; Misra, P.A.; Goiri, I.; Jalili, M. CPU overclocking: A performance assessment of air, cold plates, and two-phase immersion cooling. IEEE Trans. Compon. Packag. Manuf. Technol. 2021, 11, 1703–1715. [Google Scholar] [CrossRef]
  12. Rong, H.; Zhang, H.; Xiao, S.; Li, C.; Hu, C. Optimizing energy consumption for data centers. Renew. Sustain. Energy Rev. 2016, 58, 674–691. [Google Scholar] [CrossRef]
  13. Kheirabadi, A.C.; Groulx, D. Cooling of server electronics: A design review of existing technology. Appl. Therm. Eng. 2016, 105, 622–638. [Google Scholar] [CrossRef]
  14. Kuncoro, I.W.; Pambudi, N.; Biddinika, M.K.; Widiastuti, I.; Hijriawan, M.; Wibowo, K. Immersion cooling as the next technology for data center cooling: A review. Proc. J. Phys. Conf. Ser. 2019, 1402, 044057. [Google Scholar] [CrossRef]
  15. Pambudi, N.A.; Sarifudin, A.; Firdaus, R.A.; Ulfa, D.K.; Gandidi, I.M.; Romadhon, R. The immersion cooling technology: Current and future development in energy saving. Alex. Eng. J. 2022, 61, 9509–9527. [Google Scholar] [CrossRef]
  16. Cheng, C.-C.; Chang, P.-C.; Li, H.-C.; Hsu, F.-I. Design of a single-phase immersion cooling system through experimental and numerical analysis. Int. J. Heat Mass Transf. 2020, 160, 120203. [Google Scholar] [CrossRef]
  17. Kanbur, B.B.; Wu, C.; Fan, S.; Duan, F. System-level experimental investigations of the direct immersion cooling data center units with thermodynamic and thermoeconomic assessments. Energy 2021, 217, 119373. [Google Scholar] [CrossRef]
  18. Birbarah, P.; Gebrael, T.; Foulkes, T.; Stillwell, A.; Moore, A.; Pilawa-Podgurski, R.; Miljkovic, N. Water immersion cooling of high power density electronics. Int. J. Heat Mass Transf. 2020, 147, 118918. [Google Scholar] [CrossRef]
  19. Qu, W.; Mudawar, I. Measurement and prediction of pressure drop in two-phase micro-channel heat sinks. Int. J. Heat Mass Transf. 2003, 46, 2737–2753. [Google Scholar]
  20. Pires, I.A.; Silva, R.Á.; Pereira, I.T.O.; Faria, O.A.; Maia, T.A.C.; de Jesus Cardoso Filho, B. An assessment of immersion cooling for power electronics: An oil volume case study. IEEE Trans. Ind. Appl. 2020, 56, 3231–3237. [Google Scholar] [CrossRef]
  21. Sarangi, S.; McAfee, E.D.; Damm, D.G.; Gullbrand, J. Single-phase immersion cooling performance in intel servers with immersion influenced heatsink design. In Proceedings of the 2022 38th Semiconductor Thermal Measurement, Modeling & Management Symposium (SEMI-THERM), San Jose, CA, USA, 21–25 March 2022; pp. 1–5. [Google Scholar]
  22. Agung Pambudi, N.; Muhamad Yusuf, A.; Sarifudin, A. The Use of Single-Phase Immersion Cooling by Using Two Types of Dielectric Fluid for Data Center Energy Savings. Energy Eng. 2022, 119, 275–286. [Google Scholar] [CrossRef]
  23. Shah, J.M.; Eiland, R.; Rajmane, P.; Siddarth, A.; Agonafer, D.; Mulay, V. Reliability considerations for oil immersion-cooled data centers. J. Electron. Packag. 2019, 141, 021007. [Google Scholar] [CrossRef]
  24. Eiland, R.; Fernandes, J.; Vallejo, M.; Agonafer, D.; Mulay, V. Flow Rate and inlet temperature considerations for direct immersion of a single server in mineral oil. In Proceedings of the Fourteenth Intersociety Conference on Thermal and Thermomechanical Phenomena in Electronic Systems (ITherm), Orlando, FL, USA, 27–30 May 2014; pp. 706–714. [Google Scholar]
  25. Shinde, P.A.; Bansode, P.V.; Saini, S.; Kasukurthy, R.; Chauhan, T.; Shah, J.M.; Agonafer, D. Experimental analysis for optimization of thermal performance of a server in single phase immersion cooling. In Proceedings of the International Electronic Packaging Technical Conference and Exhibition, Anaheim, CA, USA, 7–9 October 2019. [Google Scholar]
  26. Huang, Y.; Ge, J.; Chen, Y.; Zhang, C. Natural and forced convection heat transfer characteristics of single-phase immersion cooling systems for data centers. Int. J. Heat Mass Transf. 2023, 207, 124023. [Google Scholar] [CrossRef]
  27. Wang, H.; Yuan, X.; Zhang, K.; Lang, X.; Chen, H.; Yu, H.; Li, S. Performance evaluation and optimization of data center servers using single-phase immersion cooling. Int. J. Heat Mass Transf. 2024, 221, 125057. [Google Scholar] [CrossRef]
  28. Li, X.; Xu, Z.; Liu, S.; Zhang, X.; Sun, H. Server performance optimization for single-phase immersion cooling data center. Appl. Therm. Eng. 2023, 224, 120080. [Google Scholar] [CrossRef]
  29. Muneeshwaran, M.; Lin, Y.-C.; Wang, C.-C. Performance analysis of single-phase immersion cooling system of data center using FC-40 dielectric fluid. Int. Commun. Heat Mass Transf. 2023, 145, 106843. [Google Scholar] [CrossRef]
  30. Shrigondekar, H.; Lin, Y.-C.; Wang, C.-C. Investigations on performance of single-phase immersion cooling system. Int. J. Heat Mass Transf. 2023, 206, 123961. [Google Scholar] [CrossRef]
  31. Huang, Y.; Liu, C.; Zhong, Y.; Zhang, C. Experimental study on jet-enhanced immersion liquid cooling for energy-efficient data centers. Energy 2025, 334, 137584. [Google Scholar] [CrossRef]
  32. Matsuoka, M.; Matsuda, K.; Kubo, H. Liquid immersion cooling technology with natural convection in data center. In Proceedings of the 2017 IEEE 6th International Conference on Cloud Networking (CloudNet), Prague, Czech Republic, 25–27 September 2017; pp. 1–7. [Google Scholar]
  33. Shah, J.M.; Eiland, R.; Siddarth, A.; Agonafer, D. Effects of mineral oil immersion cooling on IT equipment reliability and reliability enhancements to data center operations. In Proceedings of the 2016 15th IEEE Intersociety Conference on Thermal and Thermomechanical Phenomena in Electronic Systems (ITherm), Las Vegas, NV, USA, 31 May–3 June 2016; pp. 316–325. [Google Scholar]
  34. Zhang, Y.-D.; Lin, Y.-C.; Wang, C.-C. Investigation of the single-phase immersion cold plate amid PAO-4 and Noah@ 3000A—An experimental approach and its numerical verification. Int. Commun. Heat Mass Transf. 2024, 155, 107509. [Google Scholar]
  35. Gandhi, D.; Chowdhury, U.; Chauhan, T.; Bansode, P.; Saini, S.; Shah, J.M.; Agonafer, D. Computational analysis for thermal optimization of server for single phase immersion cooling. In Proceedings of the International Electronic Packaging Technical Conference and Exhibition, Anaheim, CA, USA, 7–9 October 2019. [Google Scholar]
  36. Kumar, V.M.; Rao, B.N.; Farooq, S. A detailed review on pin fin heat sink. Int. J. Mech. Aerosp. Ind. Mechatron. Manuf. Eng. 2016, 10, 971–980. [Google Scholar]
  37. Bhandari, P.; Rawat, K.S.; Prajapati, Y.K.; Padalia, D.; Ranakoti, L.; Singh, T. Design modifications in micro pin fin configuration of microchannel heat sink for single phase liquid flow: A review. J. Energy Storage 2023, 66, 107548. [Google Scholar] [CrossRef]
  38. Shaukatullah, H.; Storr, W.R.; Hansen, B.J.; Gaynes, M.A. Design and optimization of pin fin heat sinks for low velocity applications. IEEE Trans. Compon. Packag. Manuf. Technol. Part A 1996, 19, 486–494. [Google Scholar] [CrossRef]
  39. Mohammadi, A.; Koşar, A. Review on heat and fluid flow in micro pin fin heat sinks under single-phase and two-phase flow conditions. Nanoscale Microscale Thermophys. Eng. 2018, 22, 153–197. [Google Scholar]
  40. Ahmed, H.E.; Salman, B.H.; Kherbeet, A.S.; Ahmed, M. Optimization of thermal design of heat sinks: A review. Int. J. Heat Mass Transf. 2018, 118, 129–153. [Google Scholar] [CrossRef]
  41. Rizzi, M.; Canino, M.; Hu, K.; Jones, S.; Travkin, V.; Catton, I. Experimental investigation of pin fin heat sink effectiveness. In Proceedings of the National Heat Transfer Conference, Anaheim, CA, USA, 10–14 June 2001; pp. 1235–1243. [Google Scholar]
  42. Khan, W.A.; Culham, J.R.; Yovanovich, M.M. Optimization of pin-fin heat sinks using entropy generation minimization. IEEE Trans. Compon. Packag. Technol. 2005, 28, 247–254. [Google Scholar] [CrossRef]
  43. Sparrow, E.M.; Ramsey, J.; Altemani, C. Experiments on in-line pin fin arrays and performance comparisons with staggered arrays. J. Heat Transfer. 1980, 102, 44–50. [Google Scholar] [CrossRef]
  44. Shah, R. Laminar flow friction and forced convection heat transfer in ducts of arbitrary geometry. Int. J. Heat Mass Transf. 1975, 18, 849–862. [Google Scholar] [CrossRef]
  45. Chiriac, G.-G.; Dumitraș, C.G.; Chitariu, D.F.; Vizureanu, P.; Sandu, A.V. Influence of Gravity on Passively Cooled Heat Sink Using Experimental Data and Finite Element Analysis. Processes 2023, 11, 896. [Google Scholar] [CrossRef]
  46. Incropera, F.P.; DeWitt, D.P.; Bergman, T.L.; Lavine, A.S. Fundamentals of Heat and Mass Transfer; Wiley: Hoboken, NJ, USA, 1996; Volume 6. [Google Scholar]
  47. Avelar, V.; Azevedo, D.; French, A.; Power, E.N. PUE: A comprehensive examination of the metric. White Pap. 2012, 49, 52. [Google Scholar]
Figure 1. Flow-path diagram of the simplified immersion-cooled server.
Processes 14 02209 g001
Figure 2. Schematic diagram of the experimental rig.
Processes 14 02209 g002
Figure 3. Photograph of the immersion-cooling test rig.
Processes 14 02209 g003
Figure 4. Internal layout of the E400 server used in the immersion test.
Processes 14 02209 g004
Figure 5. Construction of the CPU pin-fin heat sink.
Processes 14 02209 g005
Figure 6. Geometric parameters of the pin-fin array.
Processes 14 02209 g006
Figure 7. Variation of viscosity with temperature for PAO-6.
Processes 14 02209 g007
Figure 8. Photograph of the manufactured pin-fin heat sink.
Processes 14 02209 g008
Figure 9. Comparison between simulated and measured thermal resistance (Tin = 45 °C; pin fin: D = 2.8 mm, St = 6 mm, Sd = 8.45 mm).
Processes 14 02209 g009
Figure 10. Simplified server geometry used in the CFD simulations.
Processes 14 02209 g010
Figure 11. Influence of pin diameter on the CPU thermal resistance (Sd = 8.45 mm, St = 6 mm).
Processes 14 02209 g011
Figure 12. Influence of longitudinal pitch Sd on the CPU thermal resistance (D = 2.8 mm, St = 6 mm).
Processes 14 02209 g012
Figure 13. Influence of transverse pitch St on the CPU thermal resistance (D = 2.8 mm, Sd = 8.45 mm).
Processes 14 02209 g013
Figure 14. Effect of oil flow rate on Tcase at four oil inlet temperatures.
Processes 14 02209 g014
Figure 15. Thermal resistance of CPU and GPU-1 versus flow rate (Tin = 45 °C).
Processes 14 02209 g015
Figure 16. Flow distribution between the CPU and GPU heat sinks, derived from CFD model.
Processes 14 02209 g016
Figure 17. Rectangular-fin reference heat sink from Shrigondekar et al. [30] (fin pitch = 1.2 mm, fin thickness = 0.25 mm, height = 22 mm).
Processes 14 02209 g017
Figure 18. Comparison of CPU thermal resistance between the rectangular-fin [30] and pin-fin heat sinks.
Processes 14 02209 g018
Figure 19. Component-level thermal resistance for the immersion and air-cooled configurations.
Processes 14 02209 g019
Figure 20. Partial PUE of the immersion-cooled and air-cooled servers.
Processes 14 02209 g020
Table 1. Nominal power dissipation of the principal server components.
Component Unit Power (W) Quantity Power (W)
CPU2701270
DIMM8864
GPU1502300
OCP50120
Others----66
Total 720
Table 2. Principal thermophysical properties of PAO-6 at 45 °C.
Working Fluid Density
(kg/m3)
Thermal Conductivity
(W/m·K)
Specific Heat
(J/kg·°C)
GWP
PAO-68070.14424130
Table 3. Mesh-independence study (3 LPM, inlet temperature 45 °C).
Mesh (Cells) CPU Thermal Resistance Rth (K/W) Deviation from Finest Mesh
Mesh I (8 million)0.13281.61%
Mesh II (10 million)0.13221.15%
Mesh III (13.6 million)0.1307baseline
Table 4. Thermal design power of the principal heat sources in the immersion and air-cooled configurations.
Component Immersion (W) Air Cooling (W)
CPU270205
OCP2020
GPU300250
DIMM6464
Disclaimer/Publisher’s Note: The statements, opinions and data contained in all publications are solely those of the individual author(s) and contributor(s) and not of MDPI and/or the editor(s). MDPI and/or the editor(s) disclaim responsibility for any injury to people or property resulting from any ideas, methods, instructions or products referred to in the content.