Article

Thermo-Hydraulic and Thermodynamic Analysis of Rotational–Perforated Static Mixer

1
School of Chemical Engineering, Hebei University of Technology, Tianjin 300401, China
2
School of Energy and Environmental Engineering, Hebei University of Technology, Tianjin 300401, China
3
School of Biological and Environmental Engineering, Tianjin Vocational Institute, Tianjin 300410, China
*
Authors to whom correspondence should be addressed.
Processes 2026, 14(13), 2060; https://doi.org/10.3390/pr14132060
Submission received: 8 June 2026 / Revised: 20 June 2026 / Accepted: 23 June 2026 / Published: 25 June 2026
(This article belongs to the Section Chemical Processes and Systems)

Abstract

To clarify the thermo-hydraulic performance and thermodynamic characteristics of rotational–perforated static mixer (RPSM) for laminar heat transfer enhancement in circular tubes, a three-dimensional steady laminar flow model was developed for inlet Reynolds numbers from 200 to 1000. The heat transfer enhancement, resistance increase, and irreversible losses of RPSM with two installation modes and Kenics were comparatively analyzed. The results show that RPSM (forward) exhibits the strongest practical heat transfer performance. Its convective heat transfer coefficient is on average 39.8% higher than that of Kenics, while its thermal effectiveness and number of transfer units are increased by 21.3% and 32.8%, respectively. However, the heat transfer enhancement of RPSM is accompanied by a significant increase in flow resistance. The Z-factors of RPSM (forward) and RPSM (backward) are approximately 3.4 and 6.2 times that of Kenics, respectively. Second law analysis shows that the Bejan numbers of all configurations are close to unity, indicating that total entropy generation is mainly dominated by heat transfer entropy generation. Although RPSM (forward) has a higher exergy destruction rate, its second law efficiency is on average 20.1% higher than that of Kenics. Flow–heat transfer coupling visualization shows that RPSM (forward) can maintain relatively continuous swirling and secondary flow structures, thereby promoting radial energy transport and temperature field uniformity. In contrast, RPSM (backward) induces stronger local recirculation and pressure loss, resulting in higher pumping power demand. Overall, for the specific RPSM geometry and Reynolds number range investigated in this study, RPSM (forward) shows advantages in heat transfer capacity and thermal exergy utilization, but these advantages are accompanied by a substantial flow resistance penalty. Therefore, further structural optimization should focus on retaining radial transport while reducing local pressure loss.

1. Introduction

Industrial heat transfer processes are widely encountered in the chemical, energy, food, pharmaceutical, and materials processing industries, where heat transfer efficiency directly affects process energy consumption, equipment size, and operating economics [1,2]. Under operating conditions involving highly viscous liquids, biologically active materials, crystallization-prone media, and low flow rates, internal tube flow is often laminar [3,4]. In laminar flow, the fluid mainly moves in axially stratified layers. Radial momentum and energy transport are weak, and the near-wall thermal boundary layer remains relatively stable, which markedly limits convective heat transfer in circular tubes [5,6]. Therefore, enhancing radial energy transport and near-wall heat transport in laminar tube flow while controlling pressure drop and pumping power demand remains an important issue in industrial heat transfer enhancement [7,8].
Passive heat transfer enhancement has received extensive attention because it requires no moving parts, has a simple structure, and is readily applicable in engineering systems [9,10]. It is also an effective approach for improving the insufficient heat transfer capacity of laminar flow. Various tube inserts can improve internal heat transfer by inducing secondary flow, disturbing the thermal boundary layer, and enhancing transverse transport [11,12]. Common inserts include twisted tapes, helically twisted tubes, corrugated tubes, baffles, and vortex generators. As representative passive in-tube elements, static mixers use fixed geometries to induce fluid splitting, rotation, stretching, and recombination, thereby strengthening cross-sectional fluid exchange and weakening the near-wall thermal boundary layer [9,10]. Compared with single disturbance structures, static mixers can generate more complex three-dimensional secondary flows and fluid redistribution, making them valuable for mixing and heat transfer enhancement under laminar conditions [11]. Recent studies on heat transfer effectiveness under complex internal-flow conditions have further shown that local geometric disturbances, internal roughness, and flow path complexity can substantially alter thermal flow interactions and heat transfer effectiveness [13]. Recent CFD studies have also demonstrated that coherent vortical structures, helical motion, and secondary flow organization strongly affect near-wall thermal flow interactions and cross-sectional energy redistribution [14]. These findings indicate that the performance of passive enhancement devices should be assessed not only by heat transfer augmentation, but also by the associated pressure drop penalty, flow complexity, and practical operating constraints. Conventional studies on enhanced heat transfer usually evaluate heat transfer enhancement and flow resistance penalties using the Nusselt number, friction factor, and overall performance evaluation criteria [15,16]. Research on heat transfer enhancement by static mixers has gradually shifted from heat transfer enhancement alone to the integrated evaluation of heat transfer, pressure drop, and mixing performance [11]. Bennour et al. [10] introduced baffles and vortex-generating structures into laminar flow static mixers and demonstrated that local geometric disturbances can improve fluid mixing and redistribution. Meng et al. [12] investigated heat transfer enhancement of nanofluids in a four-blade LPD static mixer, further confirming that static mixers improve tube-side heat transfer by enhancing fluid mixing. Jiang et al. [17] examined the effect of Kenics element thickness on pressure drop and showed that element thickness, aspect ratio, and Reynolds number significantly affect the friction factor. Lowry et al. [18] developed a single-phase pressure drop correlation for corrugated static mixers, highlighting the importance of resistance prediction for engineering applications. Chakleh et al. [19] compared commercial and novel static mixers and showed that different geometries produce markedly different mixing and resistance characteristics.
These indicators are suitable for dimensionless comparisons among different structures and operating conditions. However, under fixed tube diameter, fixed fluid properties, and constant wall temperature boundary conditions, the convective heat transfer coefficient h provides a more direct measure of practical heat transfer capacity, whereas the Z-factor quantifies the resistance increase caused by an insert relative to a smooth tube [17,18]. Accordingly, an equal pumping power evaluation based on h and the Z-factor can be used to analyze the matching between heat transfer and flow resistance for different configurations. In addition to local heat transfer intensity, heat exchanger effectiveness analysis can further determine whether heat transfer enhancement is converted into improved overall heat transfer sufficiency within the test section [20].
In addition to conventional thermo-hydraulic evaluation, recent developments in thermal transport enhancement and thermodynamic design have highlighted the importance of controlling heat flow paths and improving energy quality utilization [21]. From this perspective, an enhanced structure should be assessed not only by the amount of heat transferred, but also by the thermodynamic cost required to achieve such enhancement. Enhanced heat transfer structures may increase irreversibility associated with finite temperature difference heat transfer and flow friction. Thermo-hydraulic indicators alone therefore cannot fully reveal losses in energy quality [22,23]. Promvonge et al. [23] analyzed the thermo-hydraulic performance and entropy generation of a heat exchanger tube fitted with louvered winglet tapes and showed that entropy generation analysis provides a basis for thermodynamic evaluation of enhanced structures. Dhumal et al. [24] experimentally investigated entropy generation in a tube heat exchanger with turbulence-generating structures and used the Bejan number to identify the relative contributions of heat transfer and frictional irreversibilities. Mahammedi et al. [25] analyzed laminar thermal mixing with micro-helical inserts based on entropy generation and thermal synergy efficiency, emphasizing that both thermal and flow irreversibilities should be considered. Jayranaiwachira et al. [26],Yıldırım et al. [27], and Wang et al. [28] also demonstrated, from the perspectives of exergy analysis, entropy generation analysis, and vortex generator structural parameters, that the sources of irreversible loss in enhanced heat transfer processes are closely related to flow structures. These studies indicate that entropy generation decomposition, the Bejan number, exergy destruction rate, and second law efficiency are useful for systematically evaluating the thermodynamic performance of enhanced structures [29,30]. Recent heat transfer modeling studies have also emphasized that coupled thermal processes, such as latent heat transport and phase change assisted heat transfer, require an integrated thermal model to correctly describe useful energy transport and irreversible losses [31]. In addition, the ratio of heat transfer rate to pumping power provides an engineering measure of the heat output obtained per unit pumping power input and is therefore important for assessing the practical applicability of tube inserts [32].
The rotational–perforated static mixer (RPSM) is an in-tube enhancement element that combines blade-induced swirl with perforation-induced split flow [33]. Compared with conventional helical static mixers, the RPSM induces a primary swirling flow through twisted blades and generates local bypass flow and fluid redistribution through blade perforations, which can enhance cross-sectional radial energy transport and improve temperature field uniformity [34]. Previous studies have mainly investigated the RPSM from the perspectives of fluid mixing, chaotic advection behavior, energy consumption, pressure drop characteristics, perforation effects, and installation orientation [33,34,35,36]. These studies have shown that the periodic spatial arrangement of RPSM elements affects flow redistribution and chaotic advection behavior [34], and that installation orientation also changes the flow structure and resistance characteristics [35]. Meanwhile, the multi-blade, short-element, and perforated configuration of the RPSM introduces complex local resistance, flow direction adjustment, and momentum dissipation [33,35,36]. However, its heat transfer capacity, resistance penalty, heat transfer sufficiency, and thermodynamic irreversibility under constant wall temperature laminar tube flow conditions have not been fully clarified. Therefore, the contribution of the present work lies not in proposing a fundamentally new mixer geometry, but in extending the existing RPSM research toward a systematic thermo-hydraulic and second law evaluation for laminar heat transfer enhancement.
Overall, considerable progress has been made in passive heat transfer enhancement, static mixer structural design, pressure drop control, and second law evaluation. Nevertheless, the coupling among heat transfer capacity, resistance increase, heat transfer sufficiency, and thermodynamic irreversibility for the RPSM under constant wall temperature laminar tube flow remains insufficiently understood. This study focuses on the original RPSM geometry reported in previous studies. The blade twist angle, blade number, perforation diameter, aspect ratio, and element number were kept fixed, while only the installation orientation was varied. Therefore, this work provides a focused assessment of the orientation effect for a representative RPSM configuration and establishes a basis for subsequent multi-parameter design optimization.
In this study, a three-dimensional steady laminar flow numerical model of a circular tube fitted with a static mixer was established, and the RPSM was investigated over an inlet Reynolds number range of 200~1000. First, h, the Z-factor, and an equal pumping power h-Z performance factor were used to analyze the practical heat transfer capacity, relative resistance increase, and matching between heat transfer and flow resistance for different configurations. Second, heat exchanger effectiveness analysis was used to evaluate overall heat transfer sufficiency. Third, entropy generation decomposition, the Bejan number, exergy destruction rate, and second law efficiency were used to identify the sources of irreversible loss and the characteristics of thermal exergy utilization. Finally, the ratio of heat transfer rate to pumping power and visualizations of the coupled flow, heat transfer, and pressure fields were used to explain the mechanisms responsible for performance differences among the configurations.

2. Numerical Model and Validation

2.1. Computational Domain and Geometric Models

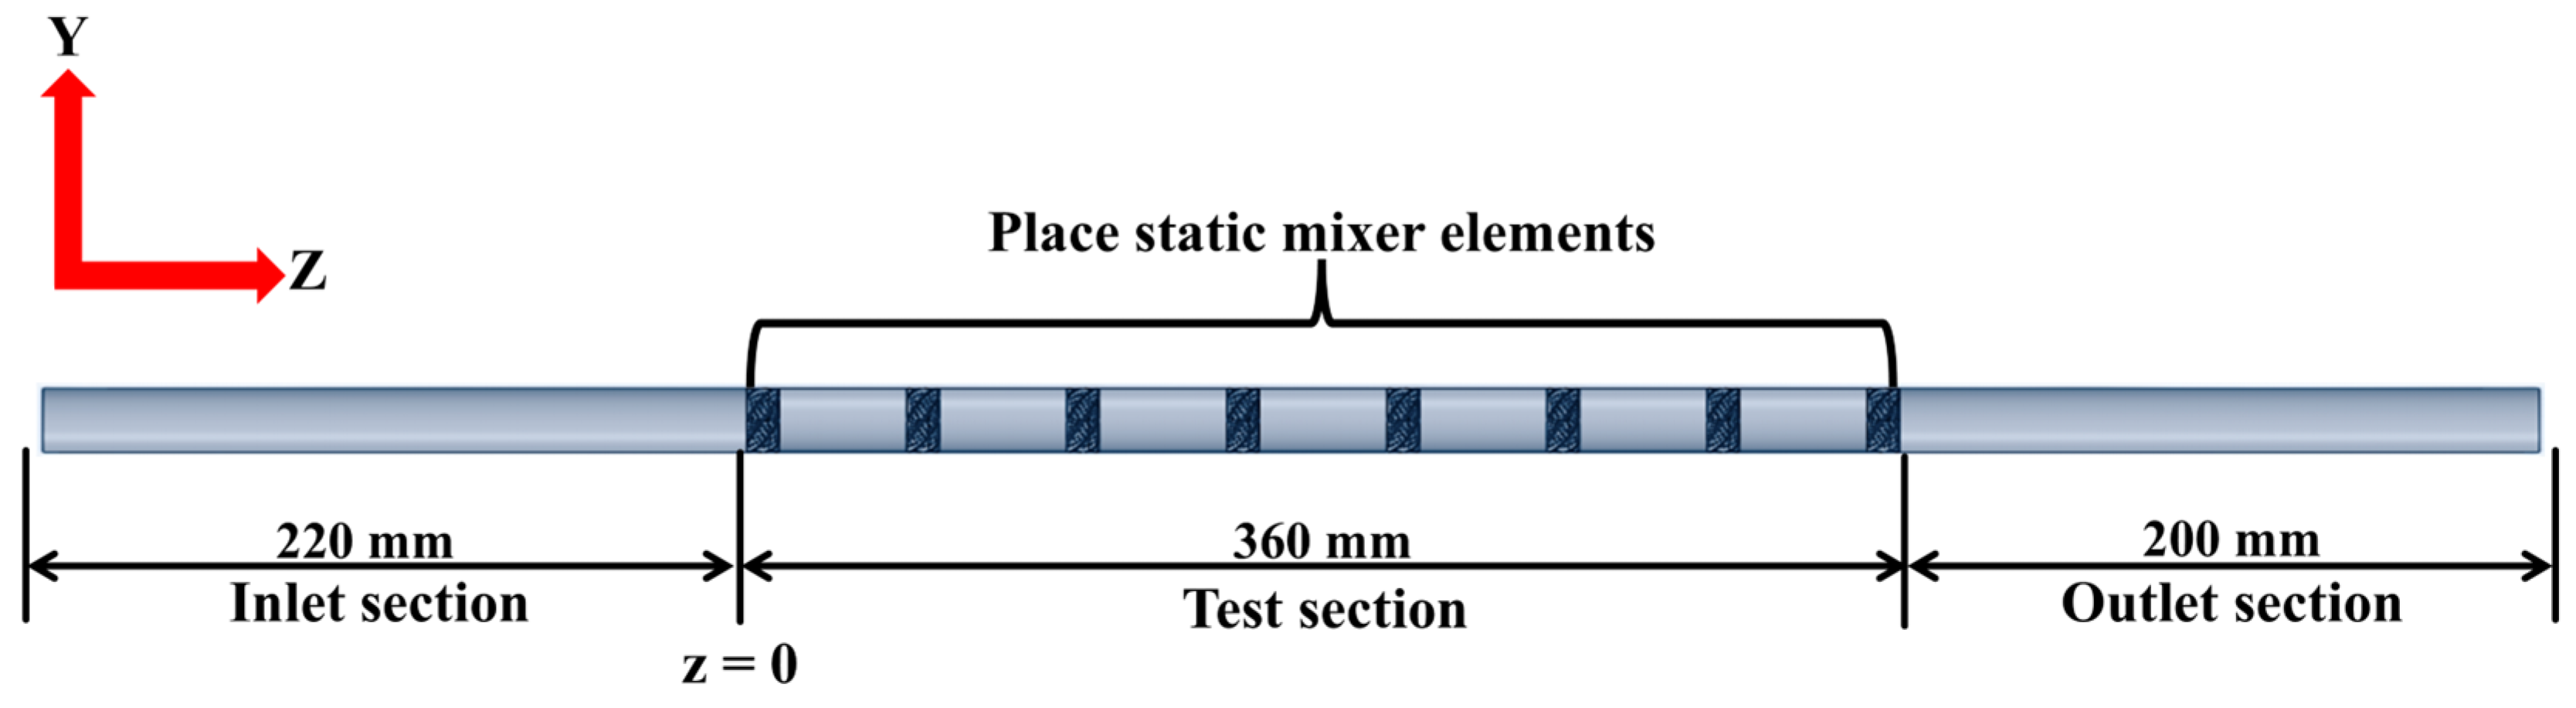
To analyze the thermo-hydraulic performance and thermodynamic characteristics of the rotational–perforated static mixer (RPSM) for laminar heat transfer enhancement in circular tubes, a three-dimensional numerical model of a tube fitted with a static mixer was established. The computational domain was a smooth circular tube with an inner diameter of D = 0.02 m and a total length of L = 0.78 m. As shown in Figure 1, the domain consisted of an inlet section, a test section, and an outlet section. The inlet section length was l1 = 11D = 0.22 m, which was used to reduce the influence of inlet boundary conditions on flow development in the test section. The test section length was l2 = 18D = 0.36 m; the static mixer elements were arranged in this region, which was also the main interval for heat transfer and pressure drop evaluation. The outlet section length was l3 = 10D = 0.20 m, which was used to reduce the influence of the outlet boundary on the flow and pressure distributions in the test section. The axial coordinate z is defined along the flow direction, with z = 0 located at the inlet of the test section. All cross-sectional positions used for flow and temperature visualization are measured from this origin.
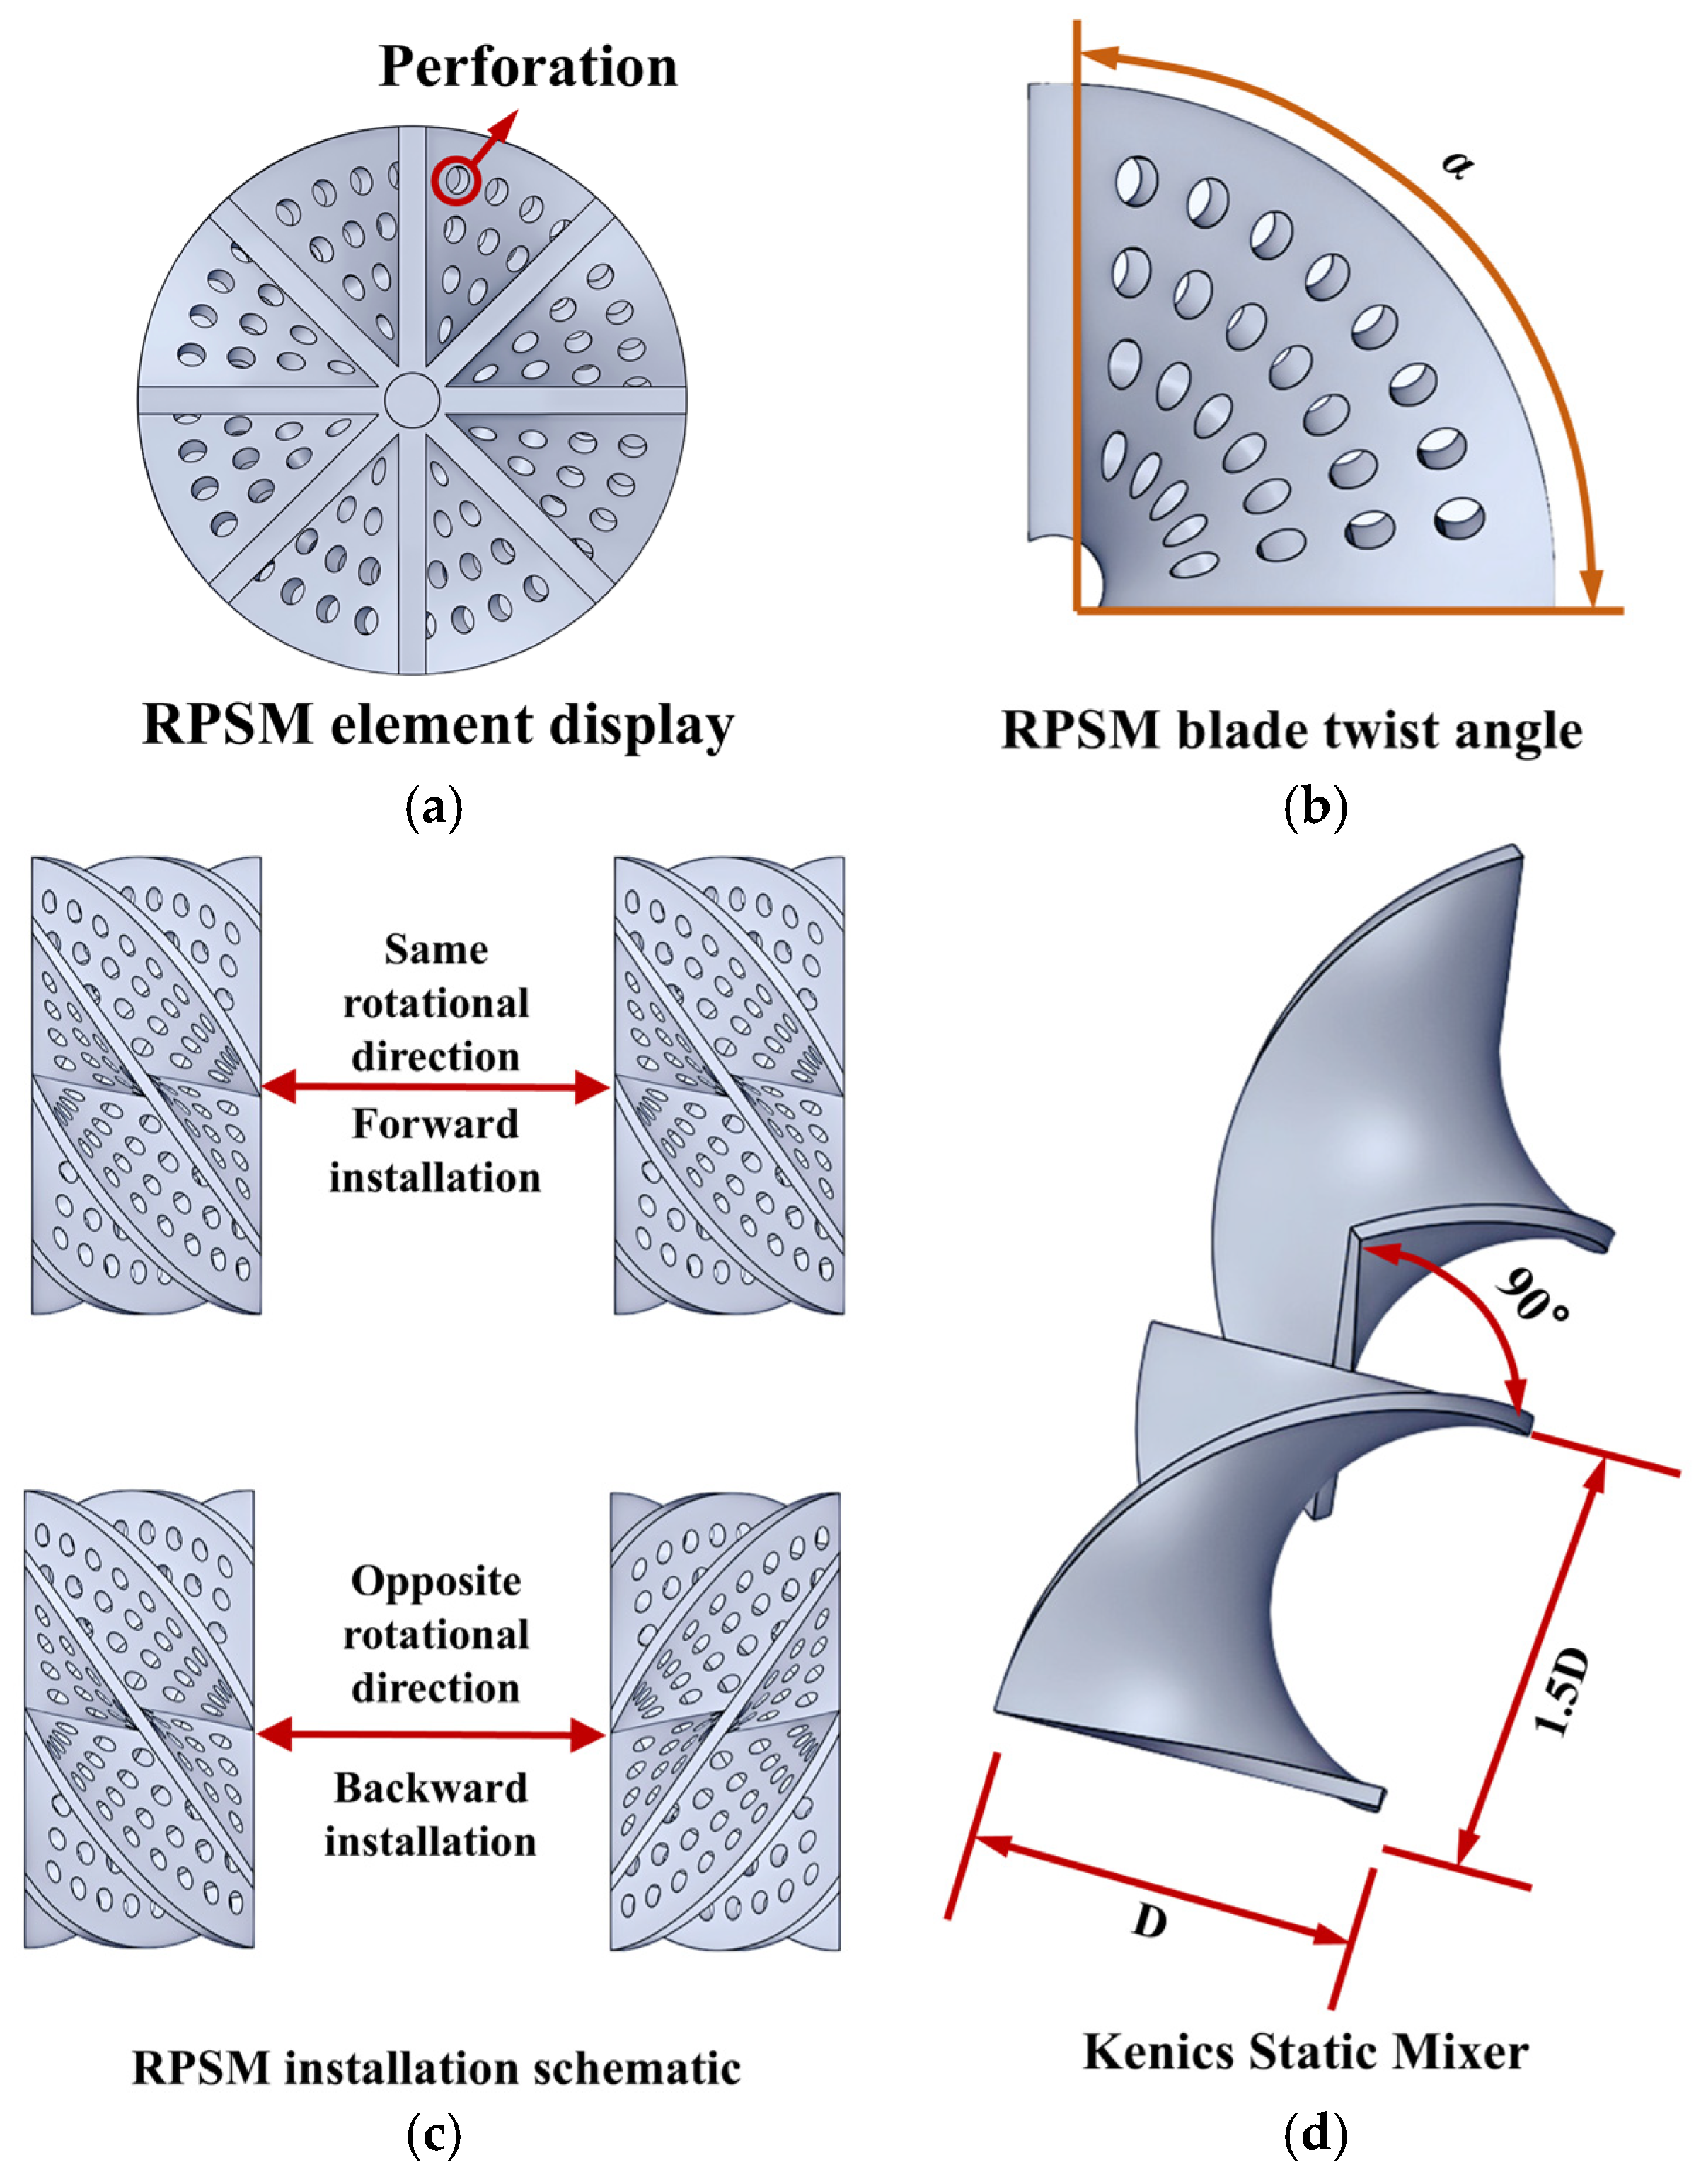
The main object of this study was the RPSM, while a classical Kenics static mixer and a smooth circular tube were selected as reference cases. The geometry and arrangement of the RPSM were characterized by six parameters: blade twist angle α, number of blades Nb, aspect ratio Ar, perforation diameter d, number of elements Ne, and install direction. Figure 2a shows the original RPSM configuration used in this study, which was determined based on the RPSM structure reported by Gao et al. [34]. Figure 2b illustrates the RPSM blade twist angle, which describes the axial twisting of a single blade. Figure 2c defines the arrangement in which adjacent RPSM elements rotate in the same direction as the forward installation and that in which adjacent elements rotate in opposite directions as the backward installation. As shown in Figure 2d, the Kenics static mixer consists of alternating helical blades; adjacent elements are staggered, the blade edges contact the tube wall, and no perforations are present. Because the Kenics static mixer is widely used in studies of laminar mixing and heat transfer enhancement, it was selected as the conventional static mixer reference for evaluating the relative performance of the RPSM. The smooth tube contained no inserts and provided the baseline for normalizing heat transfer and resistance results.
To ensure a consistent basis for comparison, the RPSM, Kenics static mixer, and smooth tube used the same tube diameter, test section length, fluid properties, and boundary conditions. The inlet velocity was adjusted to control the inlet Reynolds number Rein within the range of 200~1000. All geometric models were built in CATIA, and the same computational domain settings were retained for meshing and numerical simulation. The main geometric parameters of the RPSM and Kenics mixer are listed in Table 1.
The structural parameters listed in Table 1 define the representative RPSM geometry investigated in this work. Except for the install direction, all RPSM geometric parameters were kept unchanged to provide a controlled basis for comparing the forward and backward installations.

2.2. Governing Equations and Boundary Conditions

The numerical simulations were conducted using ANSYS Fluent 19.0. Water was used as the working fluid and was treated as an incompressible Newtonian fluid. To isolate the effects of the RPSM on laminar heat transfer and flow resistance, constant thermophysical properties were assumed: ρ = 998.2 kg/m3, μ = 1.003 × 10⁻³ kg/(m s), Cp = 4182 J/(kg K), and λ = 0.6 W/(m K). Thermal radiation and viscous dissipation were neglected, while gravity was considered (g = 9.81 m/s2). Gravity was retained in the momentum equation for completeness. However, because the fluid density was treated as constant and no Boussinesq approximation was introduced, buoyancy-driven natural convection was not activated in the present model. The investigated flow is a forced laminar internal flow governed mainly by the imposed inlet velocity. Therefore, the influence of gravity on the comparative thermo-hydraulic results is negligible under the present assumptions. The flow was assumed to be three-dimensional, laminar, and steady. The continuity, momentum, and energy equations are given by Equations (1)–(3), respectively.
∂ ( ρ u i ) ∂ x i = 0
∂ ( ρ u i u j ) ∂ x j = − ∂ p ∂ x i + ∂ ∂ x j μ ∂ u i ∂ x j + ∂ u j ∂ x i + F i
∂ ( ρ T ) ∂ t + ∂ ( ρ u i T ) ∂ x i = ∂ ∂ x i ( λ c p ∂ T ∂ x i )
where ui and uj are the velocity components in the i and j directions, respectively; p is the static pressure; μ is the dynamic viscosity; and Fi is the body force term. In the present study, Fi = ρgi when gravity is considered. Since a laminar model was used, no Reynolds stress term is included in the momentum equation.
A velocity inlet boundary condition was applied at the domain inlet. The inlet velocity was determined according to the target inlet Reynolds number, and the inlet temperature was fixed at 293 K. A pressure outlet boundary condition with a gauge pressure of 0 Pa was imposed at the outlet. No slip conditions were applied to all solid walls. To ensure that the heat transfer evaluation reflected only heat exchange between the test section wall and the internal fluid, the walls of the inlet and outlet sections and the surfaces of the static mixer elements were set as adiabatic, whereas the circular tube wall in the test section was maintained at a constant temperature of 343 K. The constant wall temperature condition was adopted to represent a tube heated by an external thermal reservoir with a relatively stable wall temperature. The inlet and outlet sections and the mixer surfaces were treated as adiabatic so that the heat transfer evaluation reflected only the heat input from the heated test section wall to the fluid. This treatment also provides a consistent basis for comparing the RPSM, Kenics, and smooth tube cases. The present boundary conditions are therefore most applicable to forced laminar internal heating processes with controlled wall temperature, while cases involving conjugate heat transfer through conductive inserts require further investigation. A pressure-based steady solver was used, and pressure–velocity coupling was implemented using the SIMPLEC algorithm. To improve the accuracy of the flow and heat transfer calculations, the pressure term was discretized using a second-order scheme, and the momentum and energy equations were discretized using second-order upwind schemes. The residual convergence criteria were set to 1 × 10⁻⁶ for the continuity and velocity equations and 1 × 10⁻⁸ for the energy equation. In addition, a monitoring plane was placed at the test section outlet to monitor the area-averaged outlet pressure and outlet temperature. A solution was considered converged when all residuals satisfied the specified thresholds and the outlet pressure and temperature remained stable during the final 500 iterations.

2.3. Data Reduction and Performance Metrics

To evaluate the overall performance of different configurations in terms of practical heat transfer capacity, relative flow resistance, and thermodynamic irreversibility, the numerical results were post-processed using the area-weighted average temperature and pressure at the inlet and outlet planes of the test section. The inlet Reynolds number was defined as:
R e in = D u in ρ μ
where D is the tube diameter (m), uin is the inlet velocity (m/s), ρ is the fluid density (kg/m3), and μ is the dynamic viscosity (kg/(m s)). The convective heat transfer coefficient h was calculated as:
h = m ˙ C p ( T ou t − T in ) A Δ T m
where ṁ is the mass flow rate through the test section (kg/s), Cp is the specific heat capacity at constant pressure (4182 J/(kg K)), Tin and Tout are the area-weighted average fluid temperatures at the inlet and outlet of the test section (K), respectively, A = πDl2 is the heated wall area, and ΔTm is the logarithmic mean temperature difference (LMTD), calculated as:
Δ T m = T out − T in ln T w − T in T w − T ou t
where Tw is the constant wall temperature (K). In this study, the Z-factor was used to characterize the increase in flow resistance caused by the static mixer relative to the smooth tube. It was calculated as:
Z = Δ P mixer Δ P empty
where ΔPmixer is the pressure drop across the test section of the tube containing mixer elements (Pa), and ΔPempty is the pressure drop across the same test section of the empty tube (Pa). On this basis, an equal pumping power h-Z performance factor was introduced to evaluate the matching between heat transfer enhancement and flow resistance increase:
Φ h − Z P = h i / h 0 Z i 1 / 3
where hi is the convective heat transfer coefficient of the ith configuration, h0 is the convective heat transfer coefficient of the smooth tube at the same Re, and the superscript P indicates an equal pumping power evaluation. Under the same tube diameter and constant fluid properties, hi/h0 is equivalent to Nui/Nu0, and Zi is equivalent to fi/f0. Therefore, ΦPh-Z is mathematically equivalent to the conventional performance evaluation criterion, PEC = (Nui/Nu0)/(fi/f0)1/3. The h-Z notation is retained only to emphasize the engineering interpretation based on the convective heat transfer coefficient and the relative resistance increase. Thus, ΦPh-Z should be regarded as an h-based form of the conventional equal pumping power PEC rather than a fundamentally new performance index.
In addition to thermo-hydraulic performance, heat exchanger effectiveness analysis was used to evaluate the overall heat transfer sufficiency of the test section. Thermal effectiveness ε is defined as the ratio of the actual fluid temperature rise to the maximum possible temperature rise, and it directly reflects the sufficiency of heat transfer from the wall to the fluid. The number of transfer units (NTU) characterizes the heat transfer capacity of the exchanger relative to the heat capacity rate of the fluid. For a constant wall temperature boundary condition, the wall temperature remains constant and the external heat source can be regarded as having a heat capacity rate much larger than that of the tube-side fluid. Therefore, NTU can be expressed as:
N T U = U A C min = h A m ˙ C p
Correspondingly, the thermal effectiveness can be written as:
ε = Q Q max = m ˙ C p ( T out − T in ) m ˙ C p ( T w − T in ) = T out − T in T w − T in
A larger ε indicates that the outlet fluid temperature is closer to the wall temperature and that heat transfer is more sufficient. To further identify the sources of irreversible loss during enhanced heat transfer, entropy generation was decomposed based on the second law of thermodynamics. Under constant wall temperature heating, heat transfer entropy generation can be expressed as:
S ˙ gen , ht = m ˙ C p ln T out T in − Q T w
where Q is the total heat transfer rate in the test section, given by:
Q = m ˙ C p ( T out − T in )
Frictional entropy generation was defined macroscopically based on the total pressure drop across the test section:
S ˙ gen , fr = m ˙ Δ P ρ T b
where Tb is the mean fluid temperature in the test section. In this study, Tb = (Tin + Tout)/2. The total entropy generation in the test section was therefore expressed as:
S ˙ gen = S ˙ gen , ht + S ˙ gen , fr
To quantify the contribution of heat transfer irreversibility to the total irreversible loss, the Bejan number Be was introduced:
B e = S ˙ gen , ht S ˙ gen = S ˙ gen , ht S ˙ gen , ht + S ˙ gen , fr
When Be approaches unity, the total irreversible loss is mainly caused by heat transfer irreversibility; when Be approaches zero, frictional irreversibility dominates. Entropy generation quantifies irreversibility and mainly reflects the absolute magnitude of loss. To further describe the degradation of useful energy caused by irreversibility, the exergy destruction rate was introduced and defined as:
Ė d = T 0 S ˙ gen
where T0 is the environmental reference temperature, taken as T0 = Tin in this study. On this basis, the second law efficiency ηII was used to quantify the fraction of the input exergy converted into useful fluid exergy. This metric is defined as the ratio of the exergy increase in the fluid to the exergy associated with wall heat input and reflects the effective utilization of thermal input. The exergy increase in the fluid is expressed as:
Δ E ˙ x , f = m ˙ C p ( T out − T in ) − T 0 ln T out T in
The exergy rate associated with wall heat input is:
E ˙ x , Q = 1 − T 0 T w Q
The pumping power in the test section is:
W ˙ p = m ˙ Δ P ρ
Accordingly, the second law efficiency is defined as:
η I I = Δ E ˙ x , f E ˙ x , Q + W ˙ p
Finally, to evaluate the coordination between heat transfer enhancement and flow resistance from an engineering thermodynamic perspective, the ratio of heat transfer rate to pumping power was defined as:
Q W ˙ p = m ˙ C p ( T out − T in ) m ˙ Δ P / ρ
A higher value of this metric indicates a greater heat output per unit pumping power input. By comprehensively analyzing h, the Z-factor, ΦPh-Z, ε, NTU, entropy generation, the Bejan number, exergy destruction, second law efficiency, and the ratio of heat transfer rate to pumping power, the laminar heat transfer enhancement performance of the RPSM can be systematically assessed in terms of practical heat transfer capacity, relative resistance increase, heat transfer sufficiency, and thermodynamic irreversibility.

2.4. Grid Independence and Model Validation

To ensure the reliability of the numerical results, the numerical model was examined in terms of grid independence, smooth tube reference validation, and static mixer model validation. It should be noted that h, the Z-factor, and the equal pumping power h-Z performance factor were mainly used to describe thermo-hydraulic performance in the results and discussion. By contrast, the Nusselt number Nu and Darcy friction factor f were used as validation metrics for the smooth tube reference, while Nu and the Z-factor were used for model validation. This is because classical correlations for heat transfer and resistance in circular tubes are generally expressed in terms of Nu and f. Moreover, under the same tube diameter and fluid properties used in this study, Nu = hD/λ; therefore, validation of Nu and f also supports the reliability of the subsequent h and Z-factor calculations.
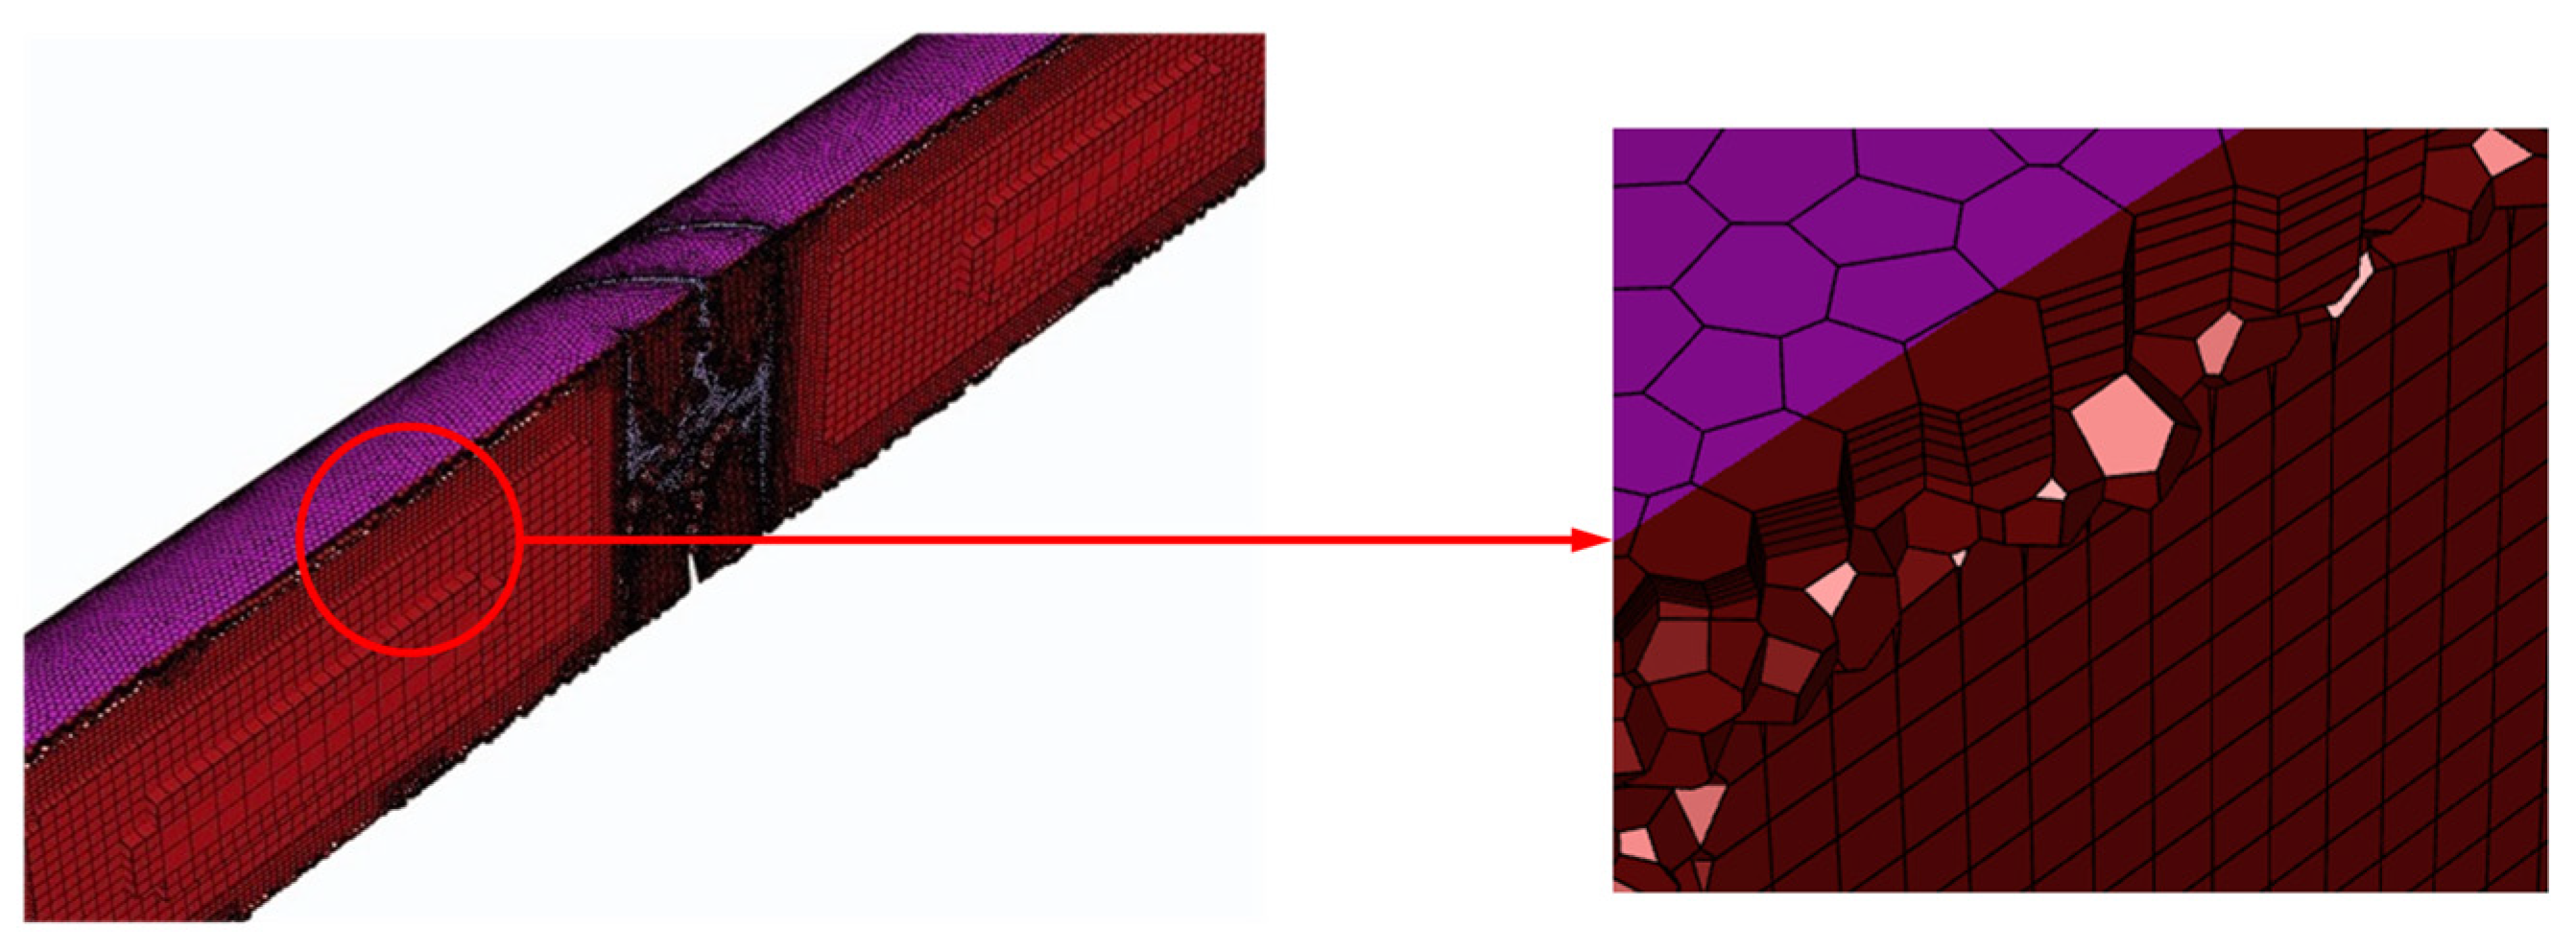
The mesh was generated using ANSYS Fluent Meshing. Considering both computational accuracy and cost, a Poly–Hexcore hybrid meshing strategy was adopted. The surface mesh was generated using curvature and proximity size functions. The global minimum and maximum surface sizes were 0.6 and 0.8 mm, respectively, the growth rate was 1.12, the curvature normal angle was 25°, and local refinement was applied based on edge proximity. To capture velocity and temperature gradients in key regions more accurately, a local surface size of 0.2 mm was applied to the static mixer surfaces, and a local surface size of 0.4 mm was applied to the heated wall, both with a local growth rate of 1.12. During volume meshing, a smooth transition boundary layer method was used near the walls. Five prism boundary layer layers were generated on all fluid walls, with a growth rate of 1.2 and a transition ratio of 0.272. Aspect ratio constraints and attachment angle parameters were also used to improve boundary layer mesh quality in the complex geometry. Local mesh details are shown in Figure 3. Special attention was paid to the perforation rims, blade edges, mixer surfaces, and near-wall regions, where large velocity and temperature gradients were expected. Local surface refinement was applied to the mixer elements and heated wall, and prism layers were generated on all fluid–solid boundaries to better resolve the near-wall gradients.
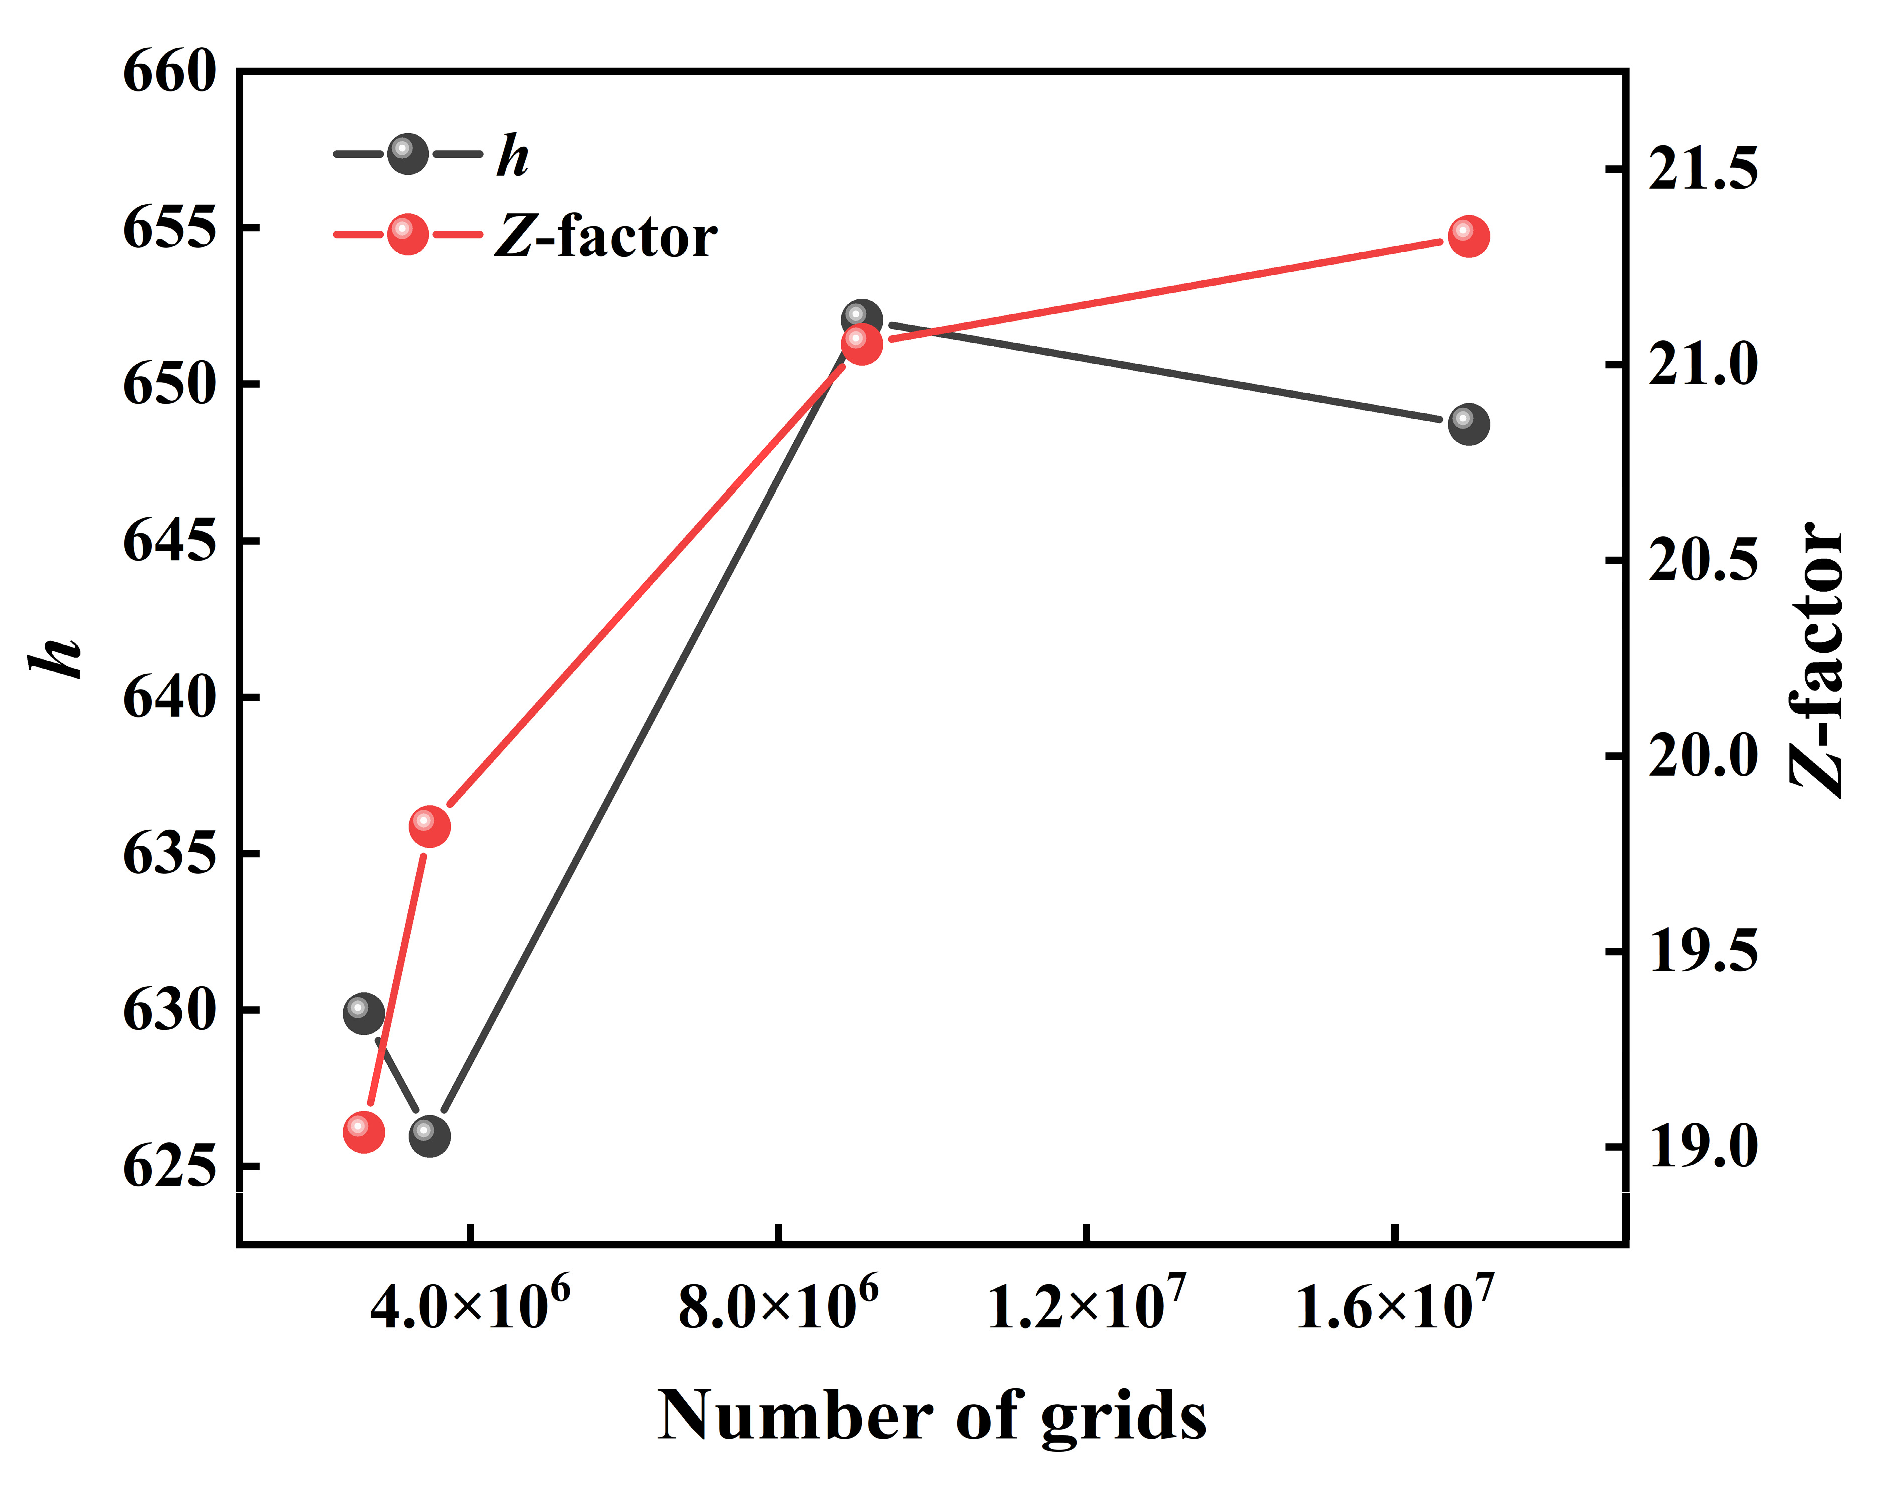
Grid independence verification was conducted for the RPSM forward configuration using four meshes with cell numbers ranging from 2.6 million to 17.0 million. The convective heat transfer coefficient, h, and the Z-factor in the test section at Rein = 200 were used as the verification parameters. As shown in Figure 4 and Table 2, the relative differences between Grid 3 and Grid 4 were 0.51% for h and 1.31% for the Z-factor, respectively, suggesting that further mesh refinement produced only marginal changes in the calculated results. The pronounced increase in cell number from Grid 2 to Grid 3 resulted from local refinement around the perforation rims, blade edges, mixer surfaces, and near-wall regions, which was necessary to resolve the steep velocity and temperature gradients induced by the complex RPSM geometry. Because the deviations between Grid 3 and Grid 4 were much smaller than the performance differences among the compared configurations, Grid 3 was adopted for the subsequent parametric simulations as a compromise between accuracy and computational cost.
The Nusselt number Nu used for smooth tube reference validation and model validation was calculated using Equation (22):
N u = h D h λ
where Dh is the hydraulic diameter (m), which is equal to the tube diameter D for a circular tube, and λ is the thermal conductivity of the fluid (W/(m K)). The Darcy friction factor f was calculated using Equation (23):
f = 2 Δ P · D h l 2 ρ u 2
where ΔP is the total pressure drop across the test section (Pa), l2 is the test section length (m), ρ is the fluid density (kg/m3), and u is the cross-sectional average velocity in the tube (m/s).
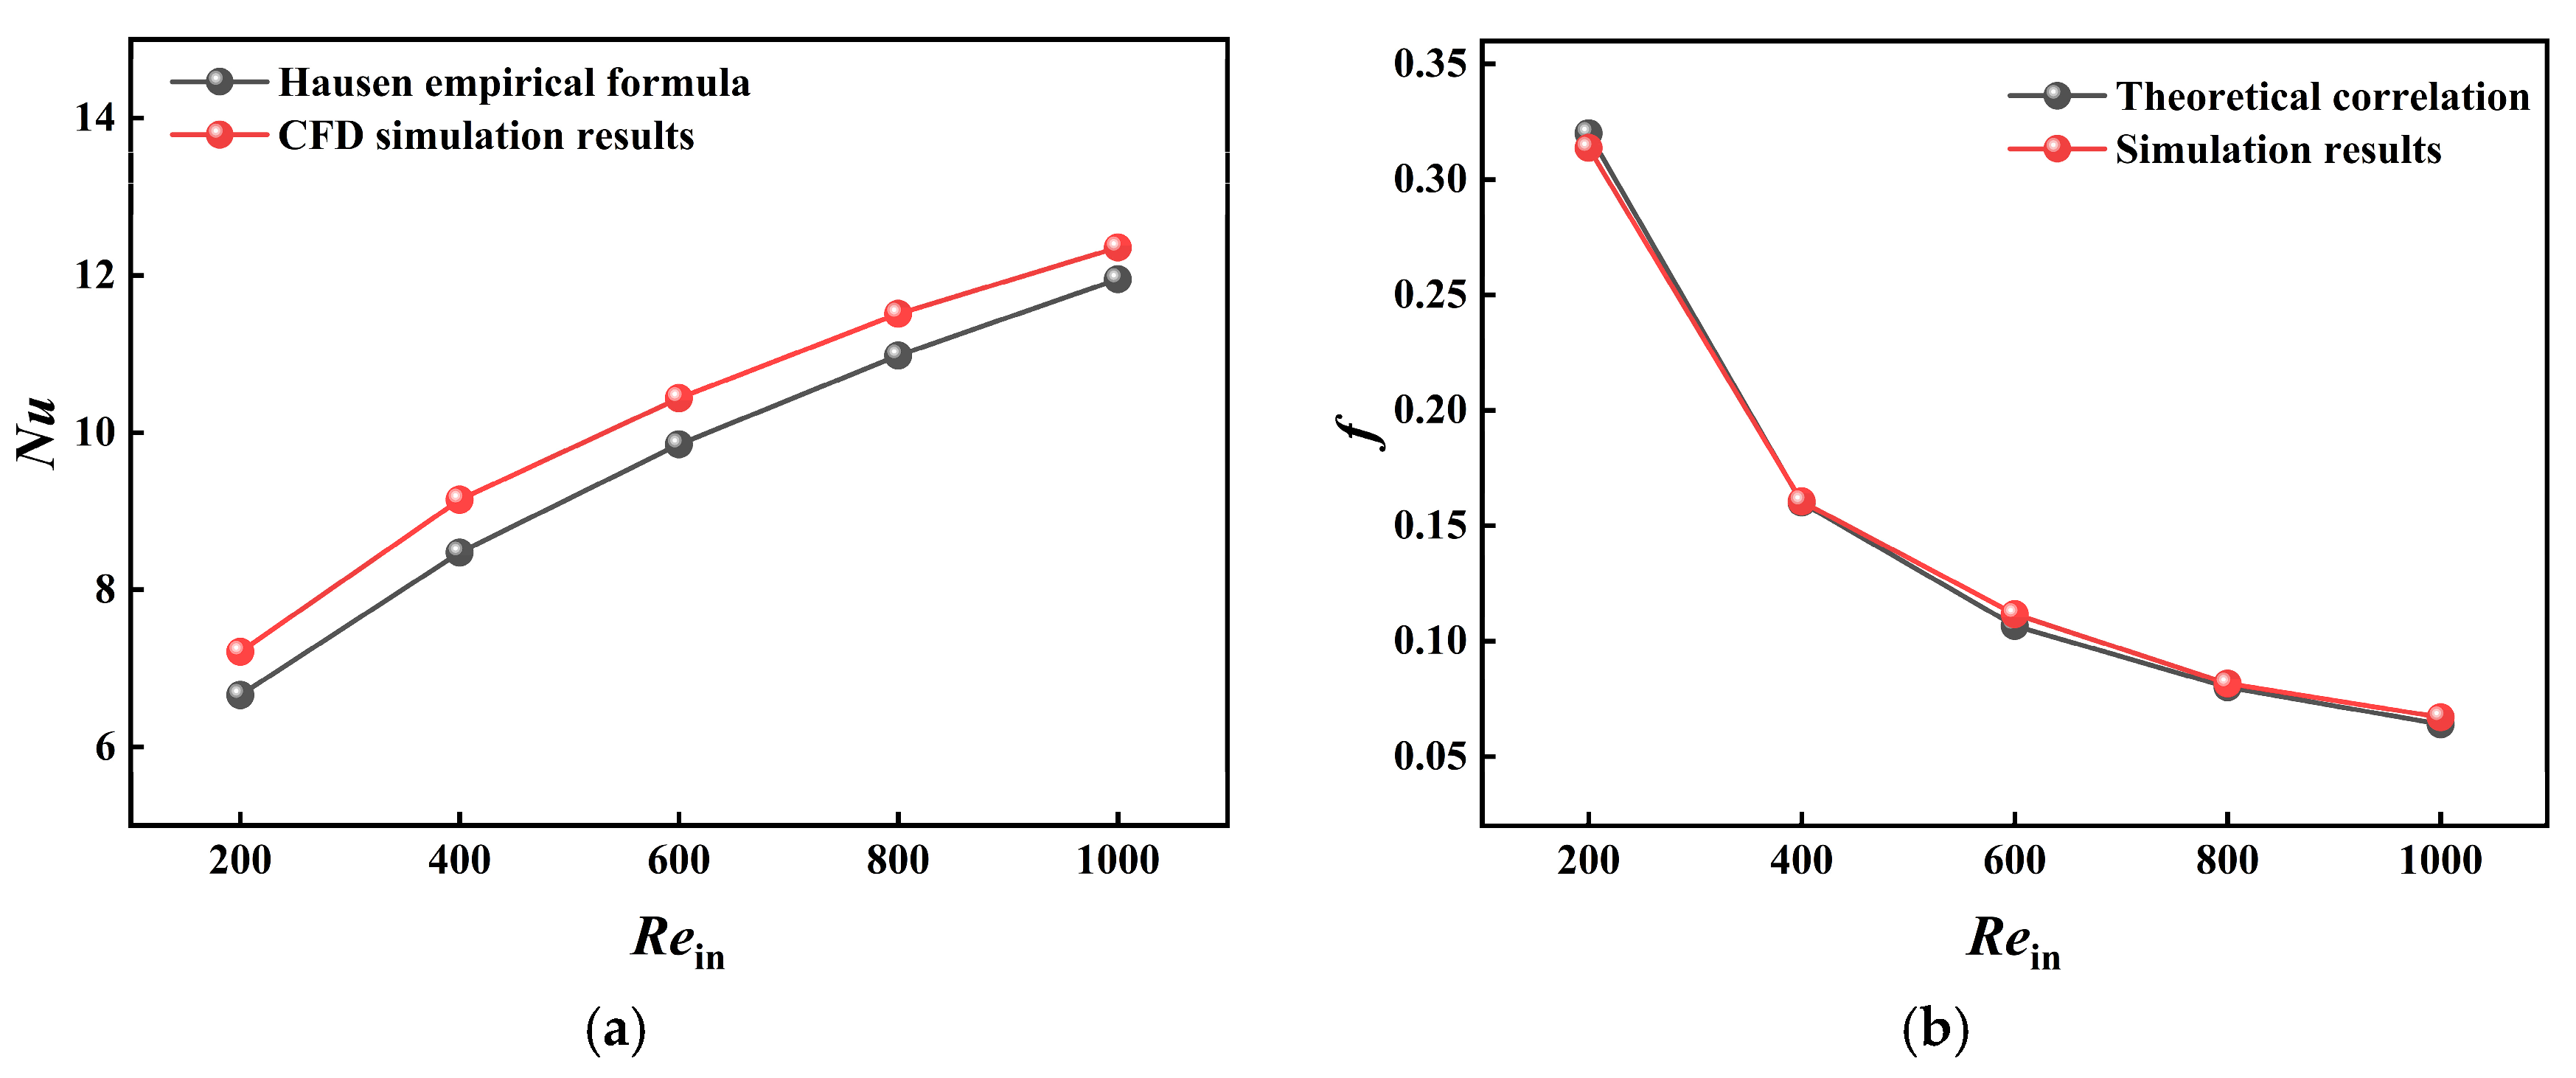
To validate the smooth tube heat transfer prediction under the constant property assumption, the simulated Nu was compared with the Hausen correlation for laminar developing flow in a circular tube under a constant wall temperature:
N u = 3.66 + 0.0668 ( R e P r D / l 2 ) 1 + 0.04 ( R e P r D / l 2 ) 2 / 3
where Pr is the Prandtl number and l2 is the heated test section length. This correlation is more consistent with the constant viscosity assumption adopted in the present numerical model. For the pressure drop, the CFD predicted f was compared with the laminar theoretical relation:
f = 64 / R e
The validation results are shown in Figure 5.
As shown in Figure 5, the simulated Nu values of the smooth tube show reasonable agreement with the Hausen correlation. The mean relative deviation is 6.07%. The simulated f is also consistent with the laminar theoretical value. These results indicate that the smooth tube reference values h0, Nu0, f0, and the baseline used for Z-factor calculation are reliable for the present comparative analysis.
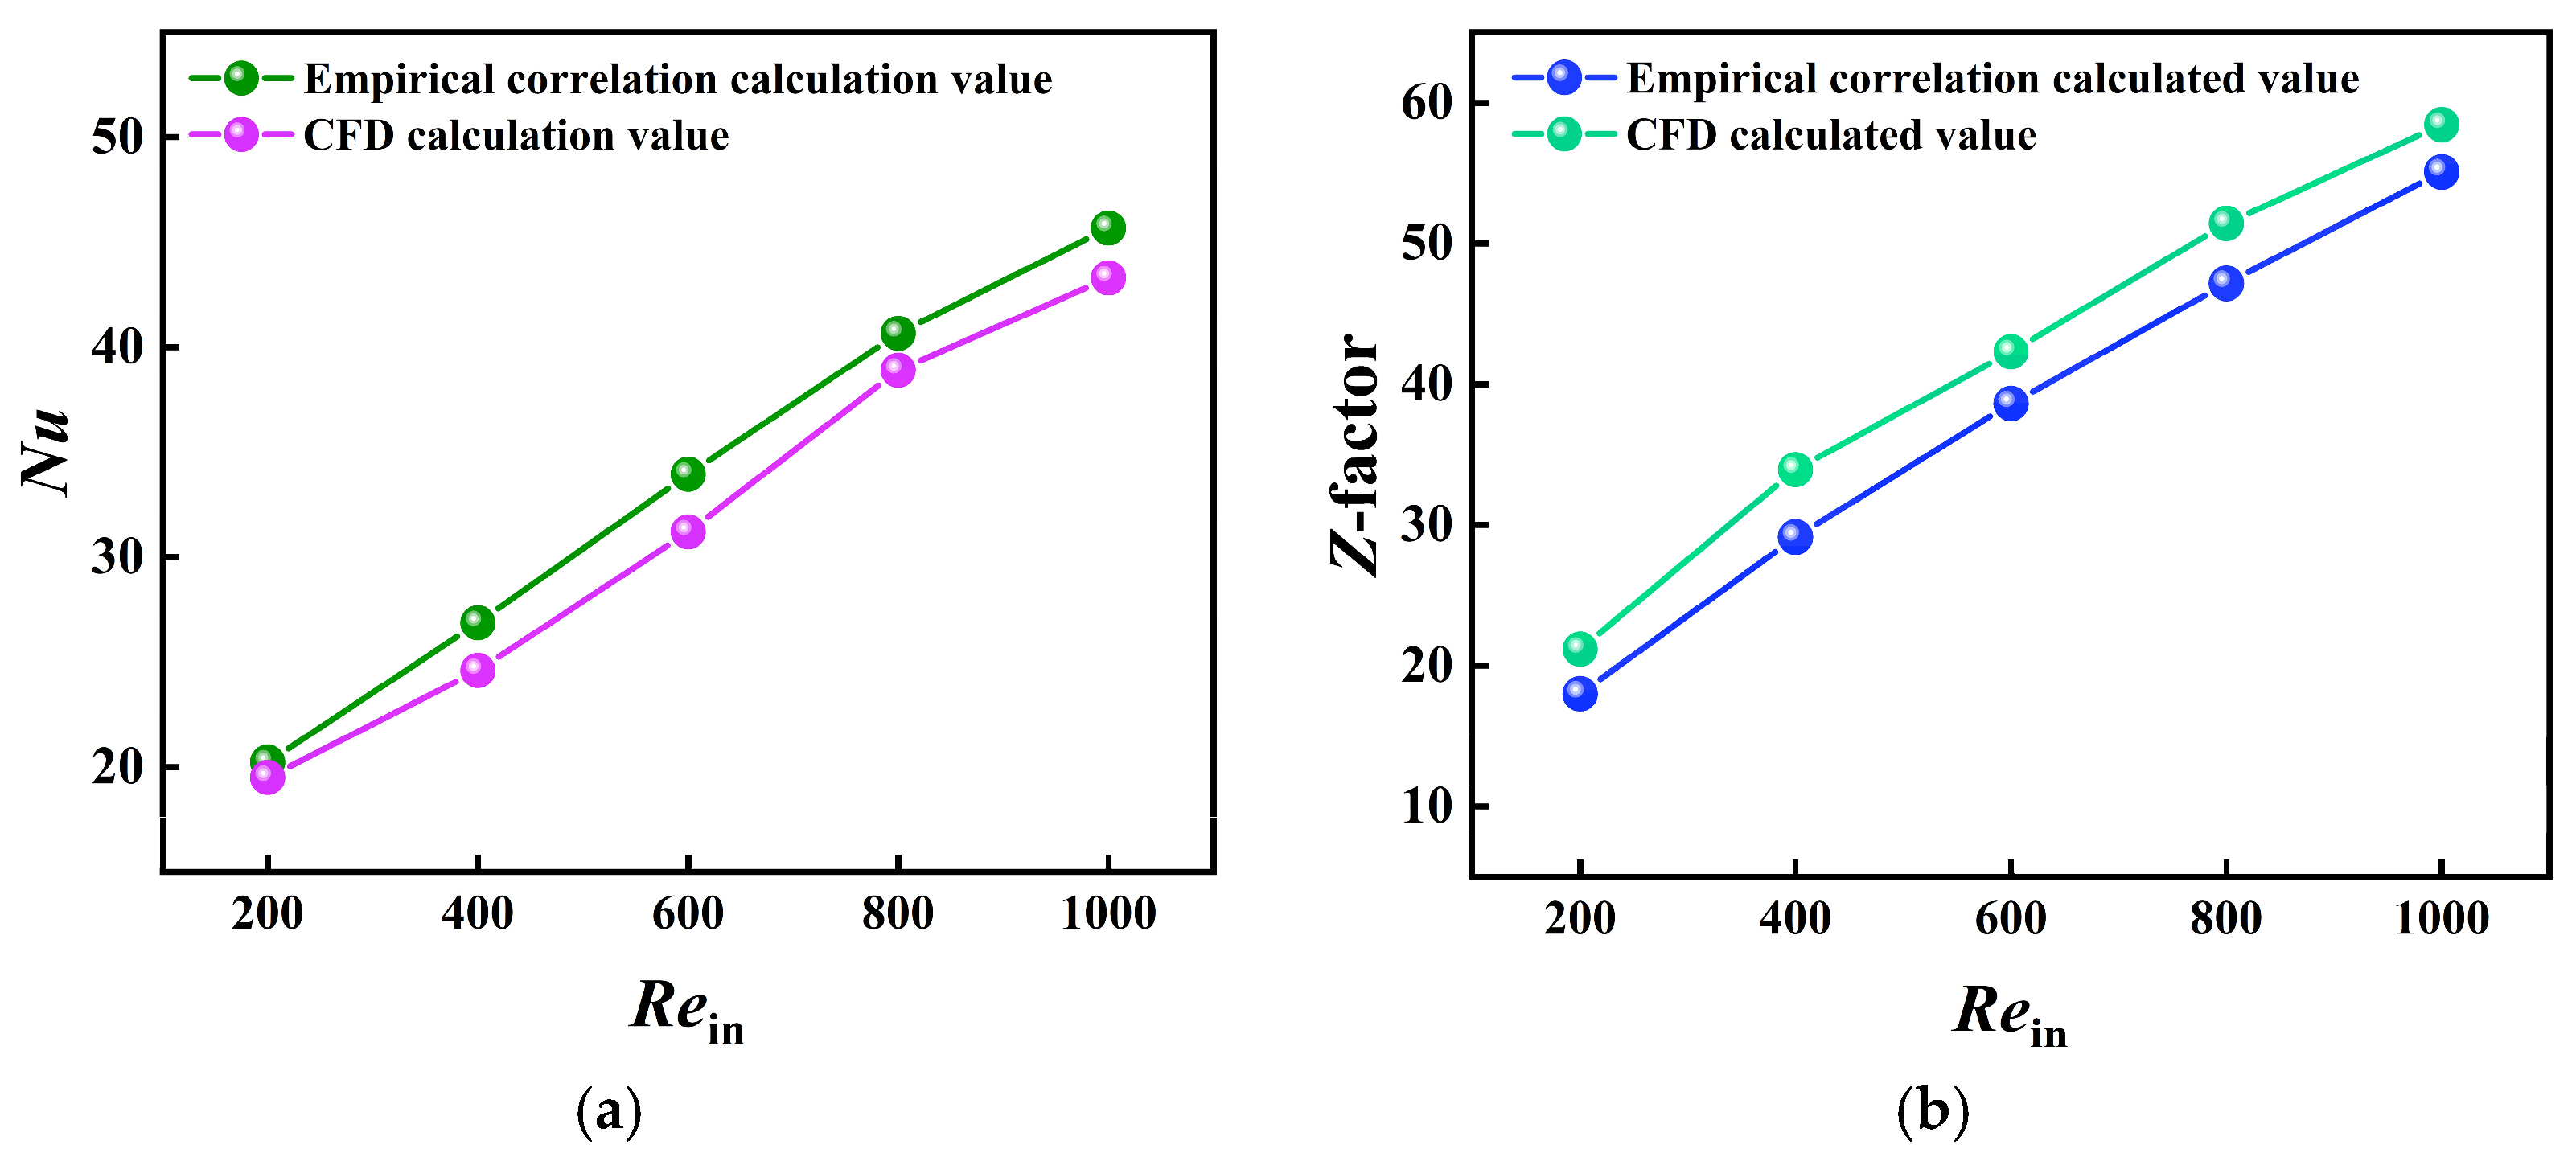
Because a dedicated heat transfer correlation for the RPSM in heated circular tubes is not yet sufficiently established, two indirect validation approaches were used to evaluate the reliability of the static mixer numerical model. For the RPSM, previous experimental studies on energy consumption have established an empirical Z-factor model; therefore, the simulated Z-factor of the RPSM was compared with the empirical model reported in the literature [33] to validate the prediction of flow resistance. The corresponding empirical correlation is given in Equation (26). In Equation (26), Ne denotes the number of RPSM elements, and θ denotes the relative angle between adjacent RPSM elements in the original empirical correlation. In the present validation case, Ne = 8 and θ = 0°. For the Kenics static mixer, a classical configuration with relatively mature laminar heat transfer correlations, the simulated Nu was compared with the empirical correlation reported in Ref. [37] to validate the heat transfer prediction. The corresponding empirical correlation is given in Equations (27) and (28). The validation results are shown in Figure 6. The mean relative error between the simulated Nu for Kenics and the empirical correlation was 5.74%, and the mean relative error between the simulated RPSM Z-factor and the empirical model was 9.8%. Both errors are within the acceptable range for engineering numerical simulations, indicating that the meshing strategy, boundary condition settings, and solution method used in this study can reasonably predict the trends of laminar heat transfer and flow resistance in static mixers.
Z = 2.703 R e 0.695 cos θ − 1.818 cos θ + 2.67 ⋅ e 0.419 j V 0.891 N e 0.188 , R e ≤ 4000
N u = 6.1 ( R e P r D L ) A r − 0.71 , R e < 700
N u = 0.46 R e 0.58 P r 0.4 A r − 0.71 , 700 < R e < 1000
Because a direct experimental heat transfer correlation for RPSM inserts under heated laminar flow in circular tubes is currently unavailable, an indirect validation strategy was employed. The smooth tube heat transfer and friction predictions were validated against classical correlations, the Kenics heat transfer results against an established empirical correlation, and the RPSM resistance against a reported Z-factor model. This validation framework supports the reliability of the numerical trends and comparative conclusions. Direct experimental heat transfer data for the RPSM would further improve the assessment of absolute prediction accuracy and should be pursued in future work.

3. Results and Discussion

3.1. Comparative Analysis of the Thermo-Hydraulic Performance of the RPSM

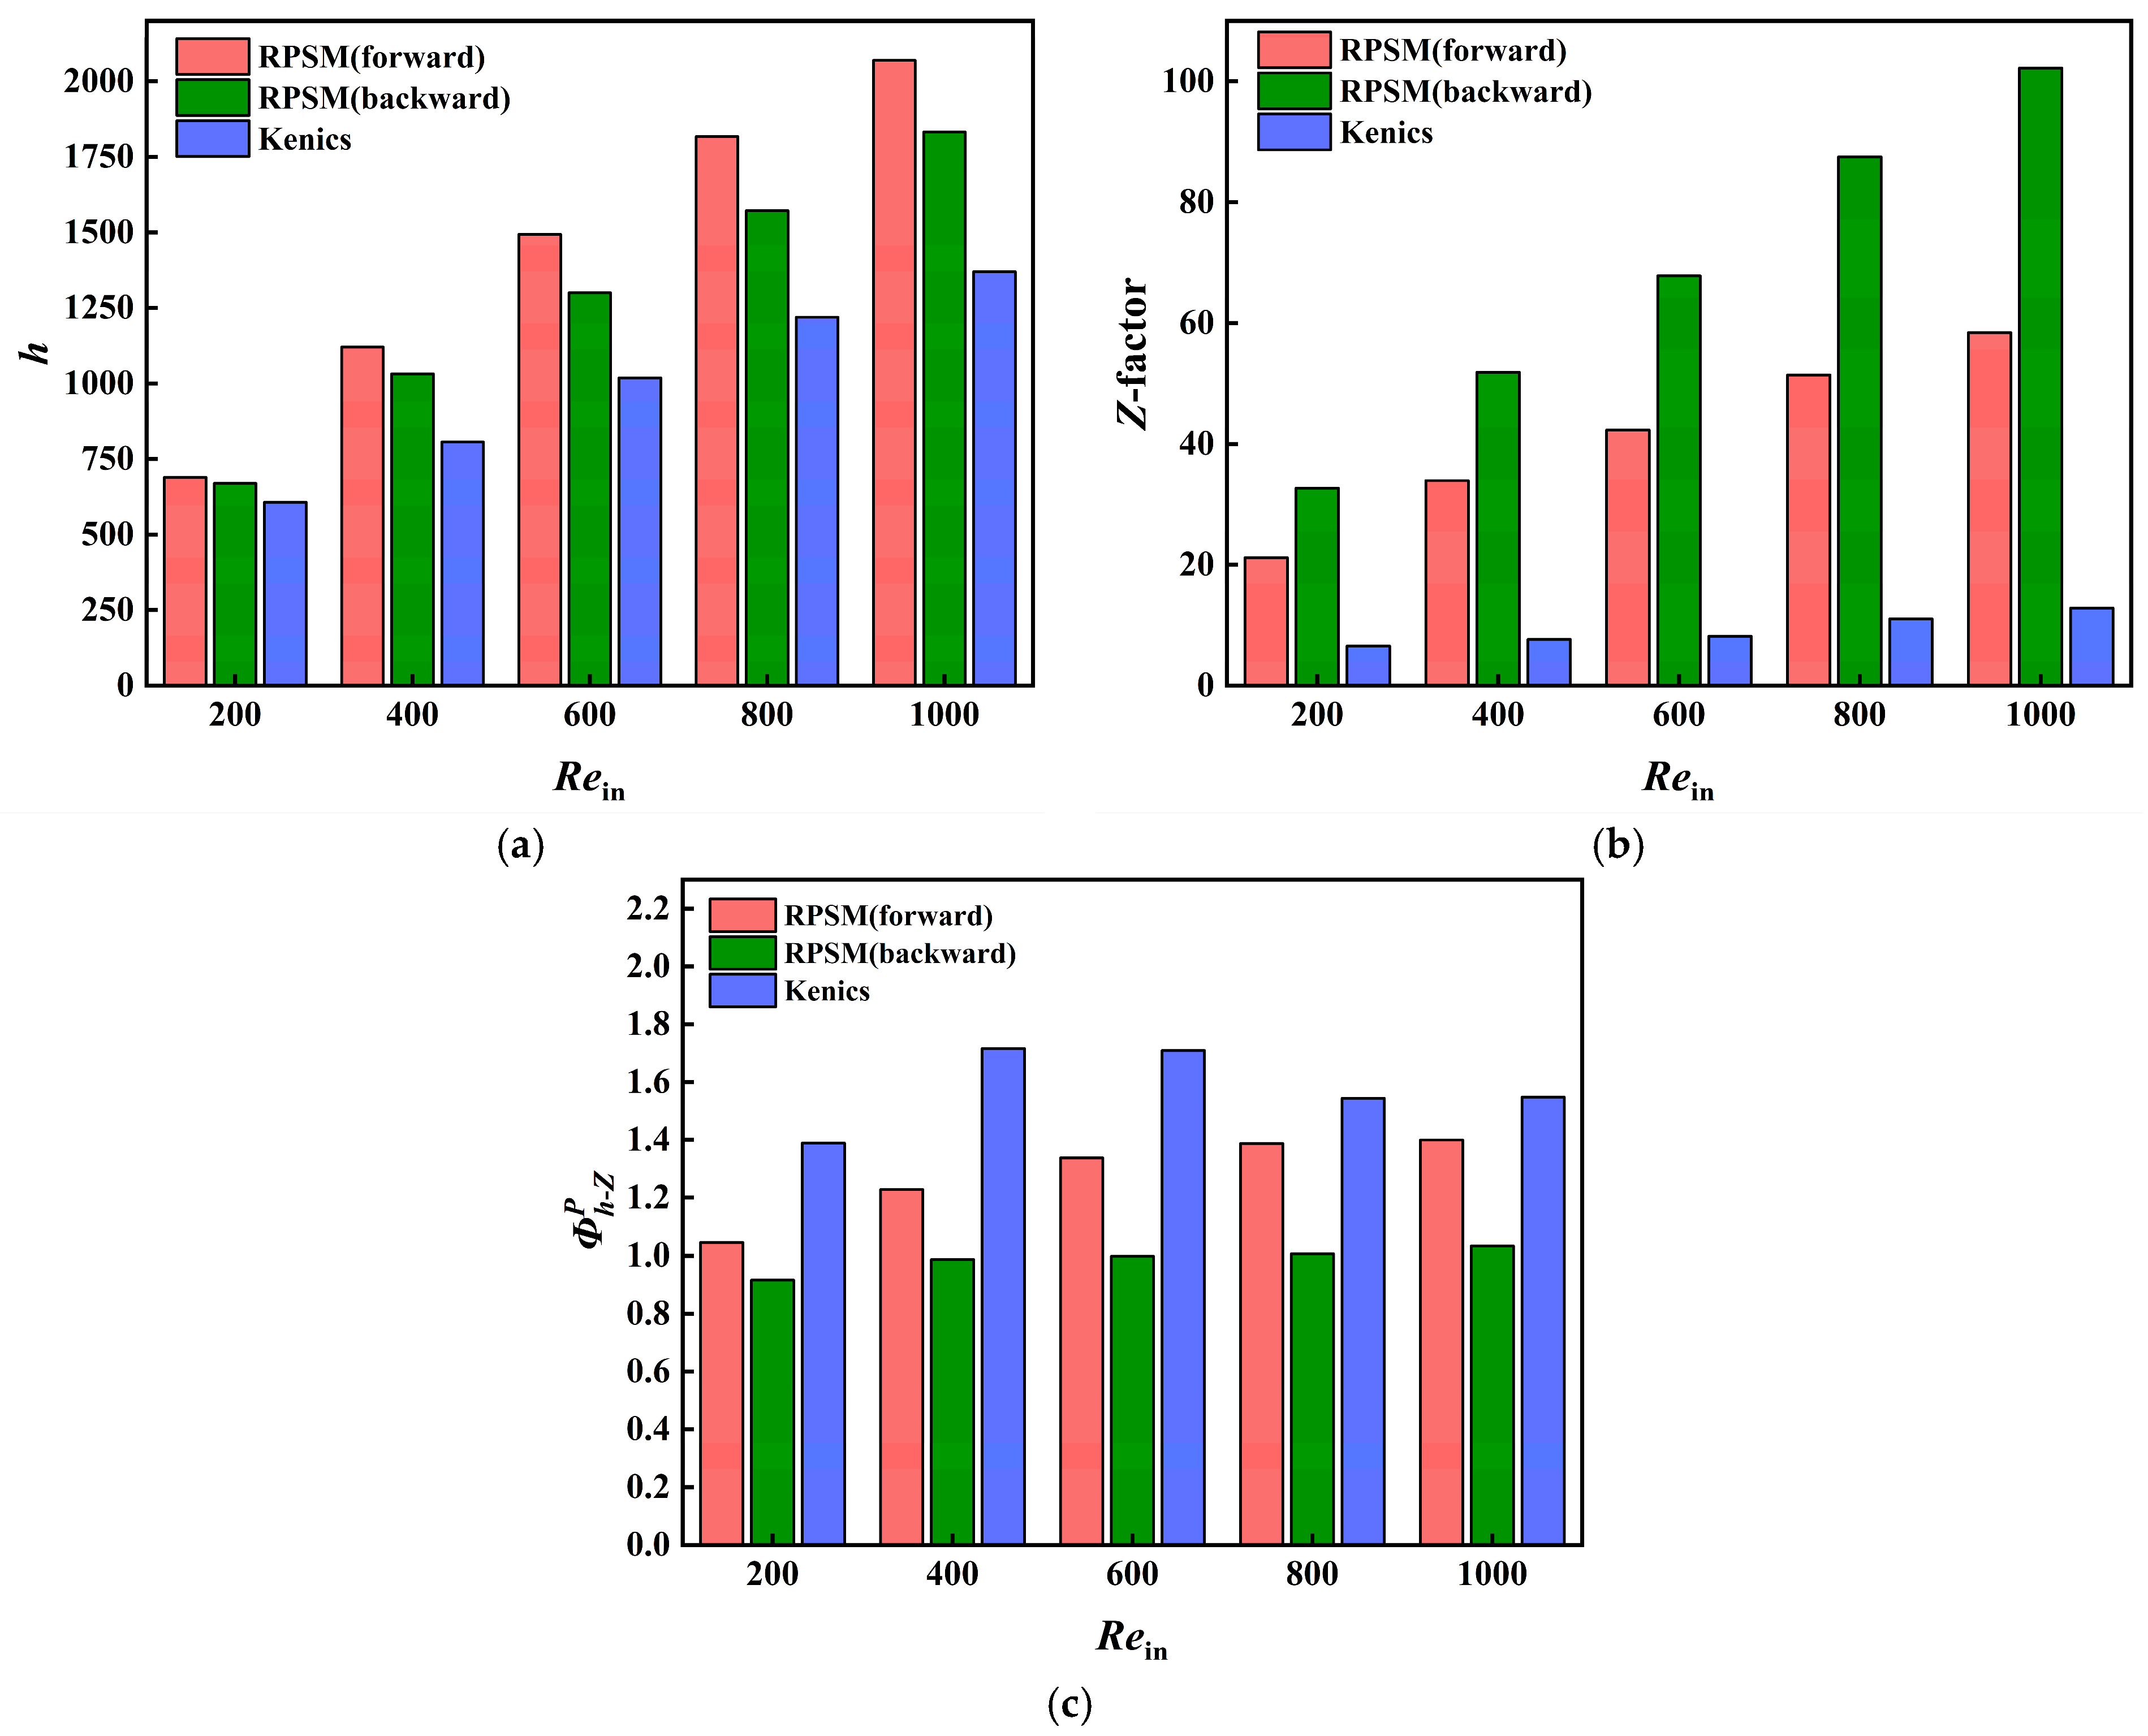
Figure 7 shows the variations in h, the Z-factor, and the equal pumping power h-Z performance factor ΦPh-Z for different configurations over Rein = 200~1000.
As shown in Figure 7a, h increases with Rein for all three configurations, indicating that increasing the flow velocity enhances convective heat transfer in the tube. At the same Rein, h follows the order RPSM (forward) > RPSM (backward) > Kenics. Over Rein = 200–1000, the h of RPSM (forward) is, on average, 39.8% higher than that of Kenics and 11.0% higher than that of RPSM (backward). The h of RPSM (backward) is, on average, 20.1% higher than that of Kenics. At Rein = 1000, the h of RPSM (forward) is approximately 51% higher than that of Kenics and 12.9% higher than that of RPSM (backward). These results indicate that, for the specific RPSM geometry investigated here, the forward installation more effectively enhances radial energy transport and near-wall heat transfer than the backward installation.
As shown in Figure 7b, the Z-factor increases markedly with Rein, indicating that the additional resistance caused by the inserts relative to the smooth tube increases with flow velocity. Among the configurations, Kenics has the lowest Z-factor, whereas RPSM (backward) has the highest. Over Rein = 200~1000, the average Z-factor of RPSM (forward) is approximately 3.4 times that of Kenics, while that of RPSM (backward) is approximately 6.2 times that of Kenics. The Z-factor of RPSM (backward) is, on average, approximately 62.5% higher than that of the forward installation. At Rein = 1000, the Z-factor of RPSM (backward) is approximately 74.9% higher than that of the forward installation, indicating that the backward installation can intensify local disturbances but causes a larger increase in flow resistance.
Figure 7c shows that Kenics has the highest overall ΦPh-Z. Although its h is lower than that of the RPSM configurations, its smaller resistance increase gives it a better balance between heat transfer enhancement and resistance control. The ΦPh-Z of Kenics is, on average, approximately 24.5% higher than that of RPSM (forward) and approximately 60% higher than that of RPSM (backward). The ΦPh-Z of RPSM (forward) is clearly higher than that of the backward installation, with an average increase of approximately 29.1%. This indicates that, for the specific RPSM geometry investigated here, the forward installation provides a more reasonable balance between heat transfer enhancement and resistance increase than the backward installation.
Overall, the RPSM (forward) configuration provides the strongest heat transfer enhancement among the tested inserts, but this advantage is accompanied by a much larger resistance penalty than Kenics. The RPSM (backward) configuration shows a lower heat transfer capacity and a higher Z-factor than the forward arrangement, giving a poorer thermo-hydraulic balance. In contrast, Kenics achieves the highest ΦPh-Z despite its lower heat transfer coefficient, mainly because of its smaller flow resistance increase. Thus, RPSM forward is preferable for maximizing heat transfer capacity, whereas Kenics performs better under equal pumping power conditions.

3.2. Heat Exchanger Effectiveness Analysis of the RPSM

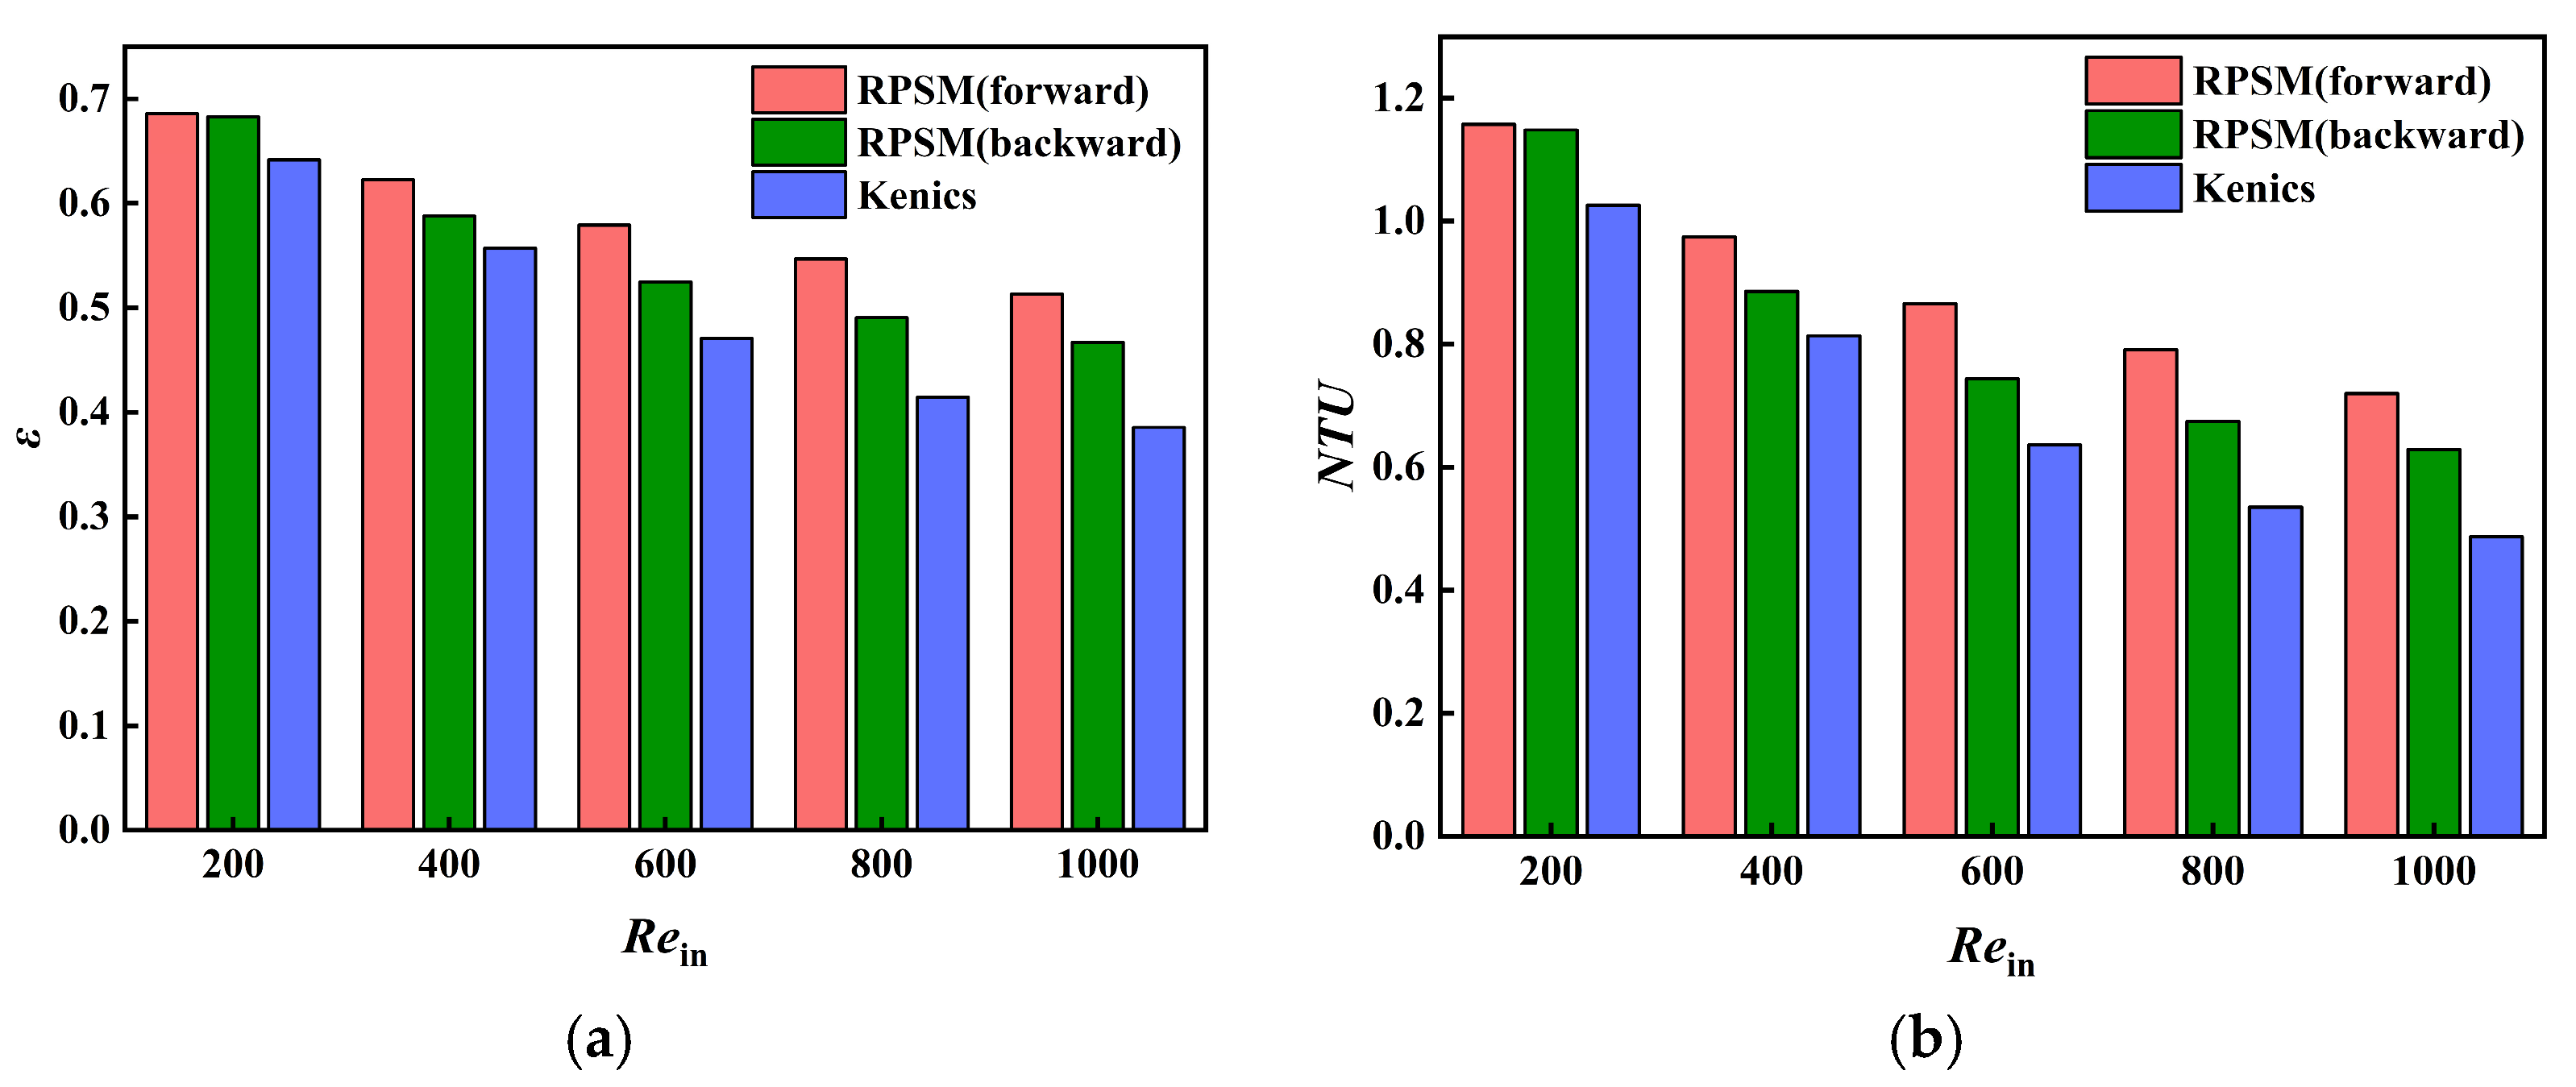
The preceding section shows that RPSM (forward) has a high practical heat transfer capacity but also a large relative resistance increase. To further determine whether this heat transfer enhancement is converted into improved overall heat transfer sufficiency in the test section, the thermal effectiveness ε and the number of transfer units NTU were analyzed for different configurations. The results are shown in Figure 8.
As shown in Figure 8a, ε decreases with increasing Rein for all three configurations. Under the same test section length and constant wall temperature condition, increasing the inlet velocity enhances the local convective heat transfer intensity but also significantly shortens the residence time of the fluid in the heated section. As a result, the temperature rise obtained per unit mass of fluid decreases, ultimately reducing the overall heat transfer sufficiency. Across the configurations, ε follows the order RPSM (forward) > RPSM (backward) > Kenics. Over Rein = 200–1000, the ε of RPSM (forward) is, on average, approximately 21.3% higher than that of Kenics and 7.62% higher than that of RPSM (backward), while the ε of RPSM (backward) is 12.58% higher than that of Kenics. At Rein = 1000, the ε of RPSM (forward) is approximately 33.1% higher than that of Kenics and 9.9% higher than that of RPSM (backward). These results indicate that the RPSM enables more sufficient heat transfer within the same test section length and brings the outlet fluid temperature closer to the wall temperature. The forward installation is more favorable for maintaining continuous swirl transport and radial energy transport and thus provides better heat transfer effectiveness than the backward installation.
The NTU results in Figure 8b show the same trend as ε, decreasing with increasing Rein. Although h increases with Rein, the increase in mass flow rate is more pronounced, which increases the heat capacity rate of the fluid and reduces the effective heat transfer capacity per unit heat capacity rate. Among the configurations, RPSM (forward) consistently has the highest NTU, followed by RPSM (backward), whereas Kenics has the lowest. The NTU of RPSM (forward) is, on average, approximately 32.8% higher than that of Kenics and 11.78% higher than that of the backward installation. The NTU of RPSM (backward) is, on average, approximately 18.57% higher than that of Kenics. At Rein = 1000, the NTU of RPSM (forward) is approximately 47.76% higher than that of Kenics and 14.41% higher than that of the backward installation. These results show that the enhancement effect of the RPSM is reflected not only in a higher local convective heat transfer coefficient but also in a stronger overall heat transfer capacity over the test section.
The ε-NTU results further confirm that, for the investigated RPSM geometry, RPSM (forward) provides higher heat transfer sufficiency than Kenics and RPSM (backward). This finding is consistent with the preceding h results, indicating that the swirl and secondary flow structures induced by RPSM (forward) promote radial energy exchange between the core and near-wall regions, thereby enhancing the overall heating of the test section.

3.3. Entropy Generation Decomposition and Bejan Number Analysis of the RPSM

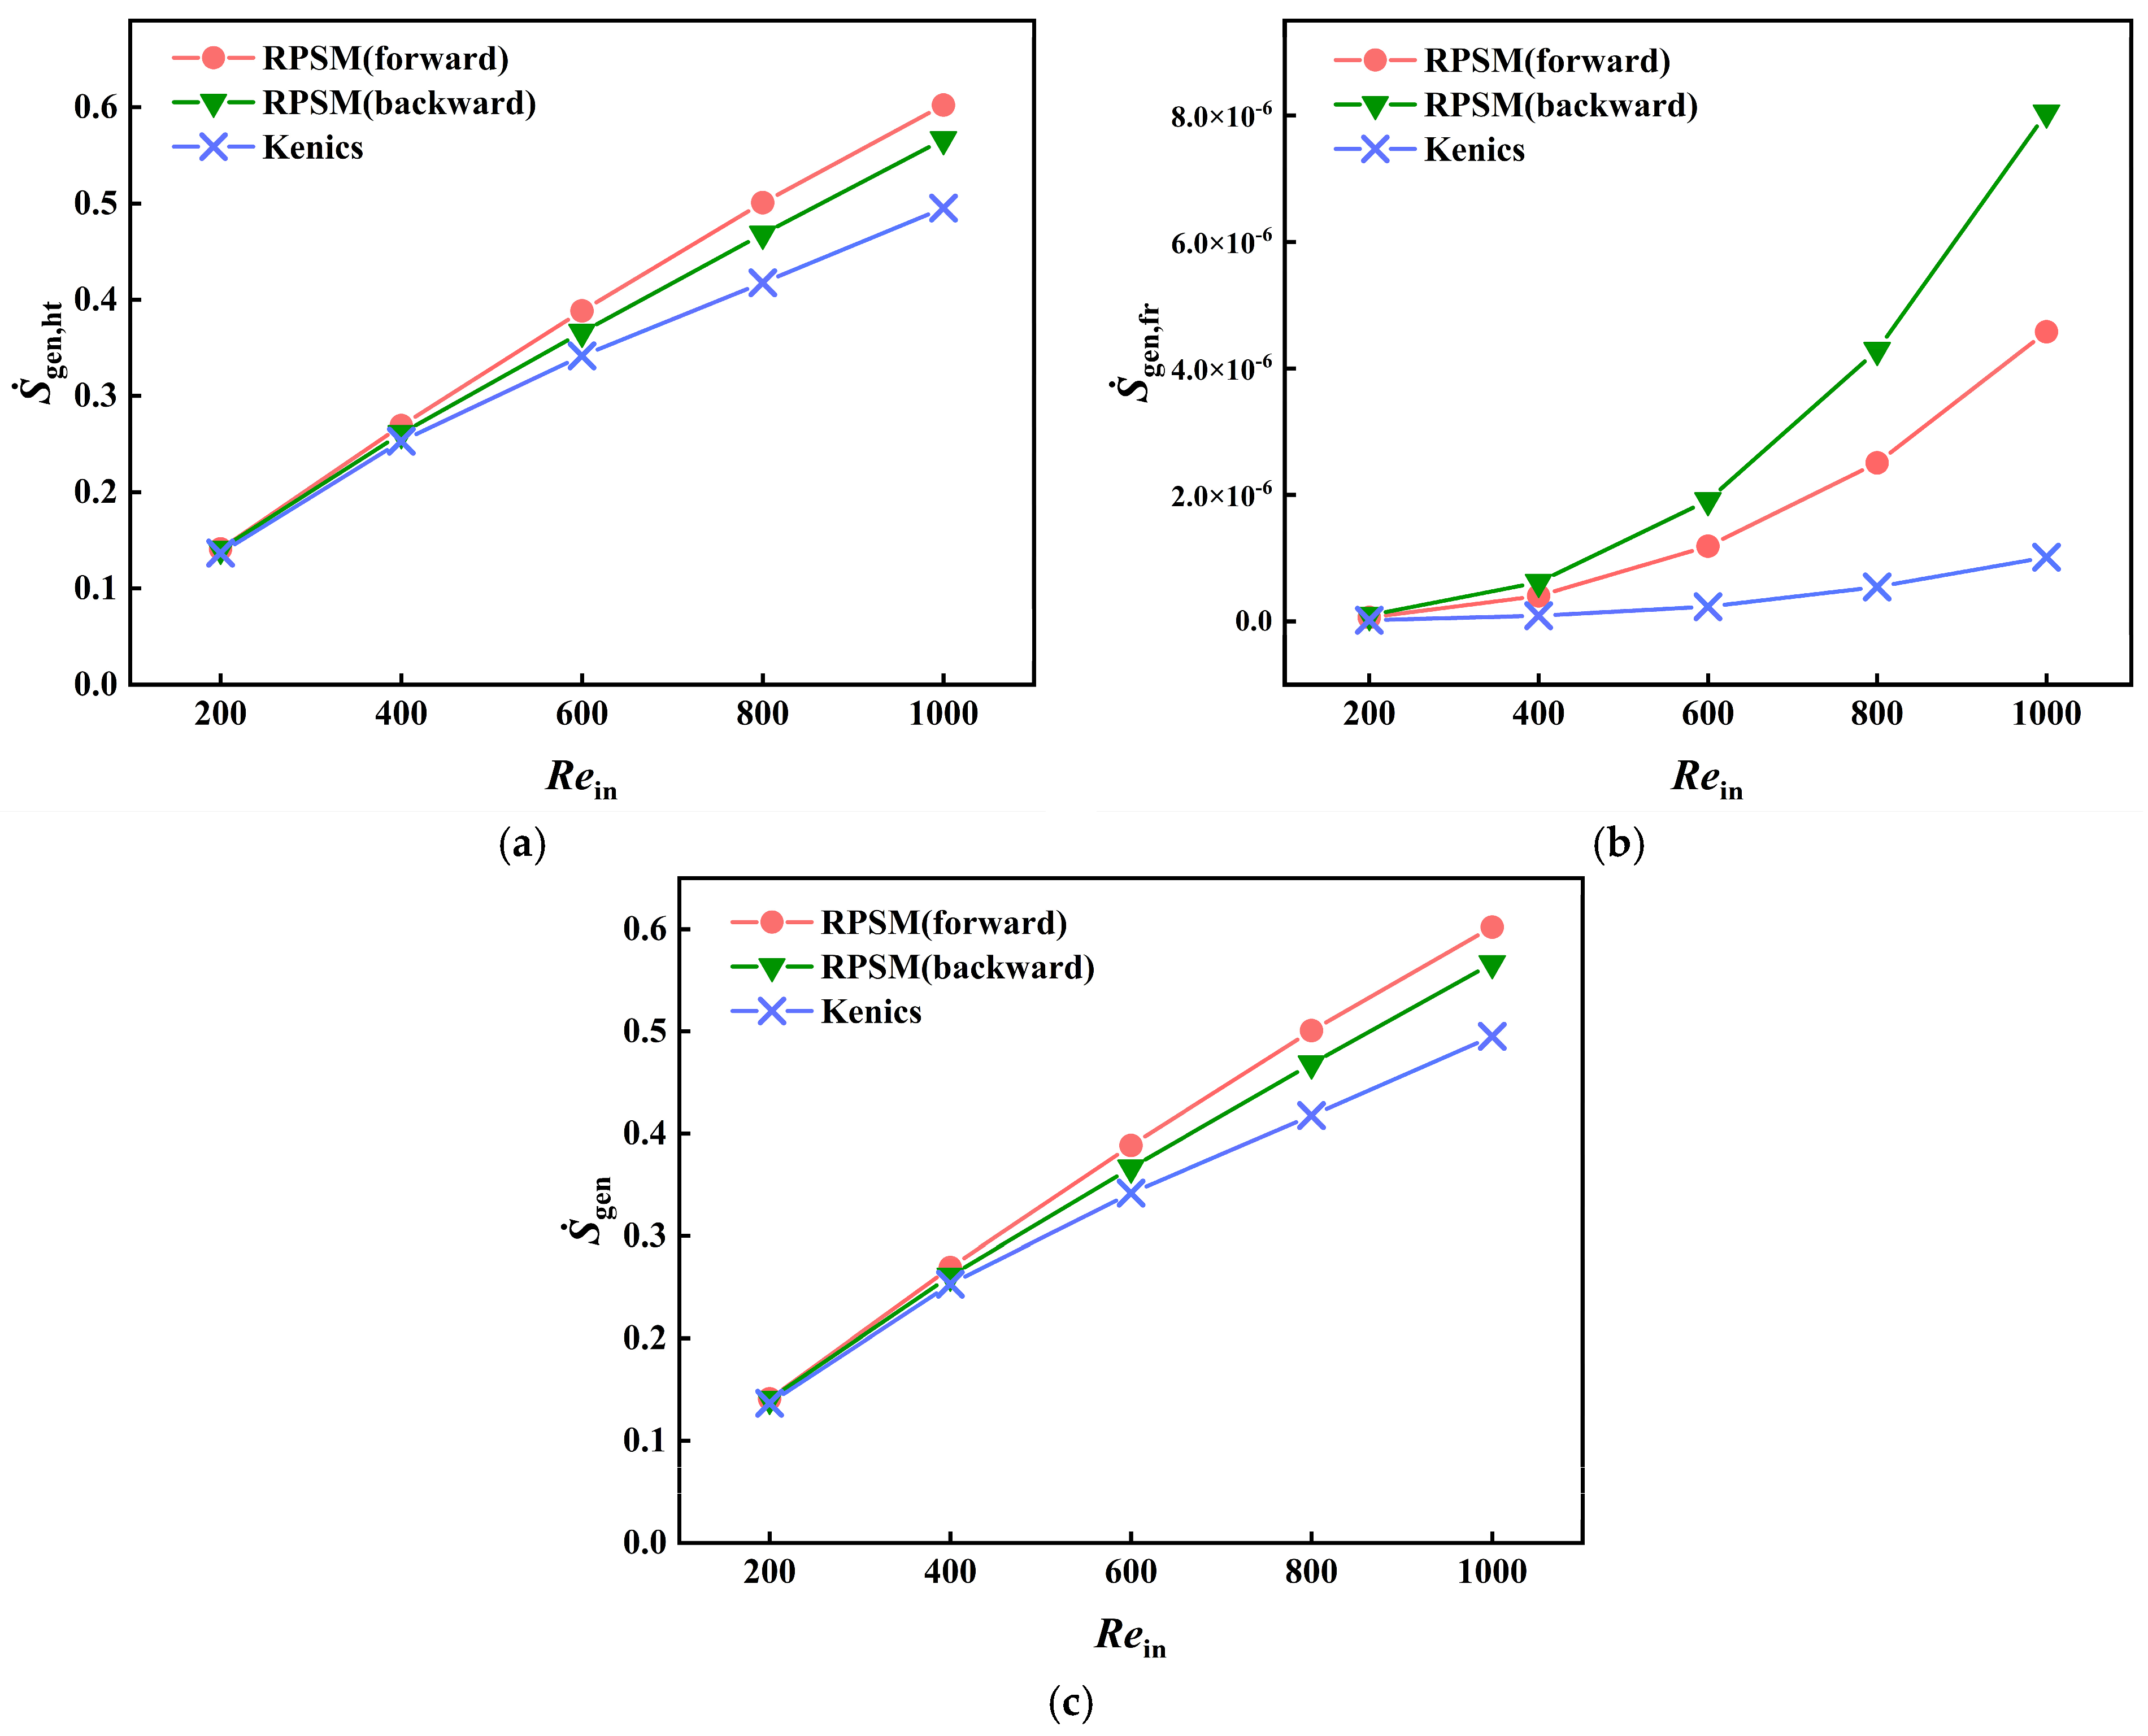
Enhanced heat transfer processes are usually accompanied by changes in irreversible losses. Therefore, entropy generation components and the sources of irreversible loss in different configurations were analyzed based on the second law of thermodynamics. The results are shown in Figure 9 and Figure 10.
As shown in Figure 9a, heat transfer entropy generation increases with Rein for all three configurations. This indicates that as the flow rate increases, the total heat transfer rate in the test section increases and the irreversible loss caused by finite temperature difference heat transfer increases accordingly. Among the configurations, heat transfer entropy generation follows the order RPSM (forward) > RPSM (backward) > Kenics. Over Rein = 200~1000, the heat transfer entropy generation of RPSM (forward) is, on average, approximately 12.94% higher than that of Kenics and 4.51% higher than that of the backward installation. The value for RPSM (backward) is, on average, approximately 7.97% higher than that of Kenics. This trend is consistent with those of h, ε, and NTU, indicating that the RPSM increases the heat transfer capacity by enhancing radial energy transport but also increases thermal irreversibility associated with finite temperature difference heat transfer.
Figure 9b shows the frictional entropy generation of different configurations. Frictional entropy generation increases markedly with Rein, and the differences among configurations are more pronounced than those for heat transfer entropy generation. The frictional entropy generation of RPSM (forward) is approximately 3.38 times that of Kenics, while that of RPSM (backward) is approximately 6.16 times that of Kenics. In addition, the frictional entropy generation of RPSM (backward) is, on average, approximately 63.1% higher than that of the forward installation. At Rein = 1000, it is approximately 75.6% higher than that of the forward installation. This result is consistent with the Z-factor analysis, confirming that the RPSM, especially in the backward installation, causes stronger additional resistance and momentum dissipation. However, the absolute value of frictional entropy generation is much lower than that of heat transfer entropy generation, and its contribution to total entropy generation is small. Therefore, frictional entropy generation mainly reflects relative differences in flow dissipation among configurations rather than indicating a dominant contribution to total irreversible loss.
As shown in Figure 9c, the trend of total entropy generation is essentially consistent with that of heat transfer entropy generation. It increases with Rein and follows the order RPSM (forward) > RPSM (backward) > Kenics. Because frictional entropy generation is numerically much lower than heat transfer entropy generation, total entropy generation is mainly determined by heat transfer entropy generation. Therefore, under the constant wall temperature laminar heating conditions considered in this study, finite temperature difference heat transfer is the dominant source of system irreversibility. The higher total entropy generation of the RPSM is mainly associated with its stronger heat transfer capacity and larger heat transfer rate.
The higher entropy generation of RPSM (forward) should not be interpreted as a thermodynamic advantage. It indicates a larger absolute irreversible loss caused mainly by stronger finite temperature difference heat transfer. Therefore, entropy generation should be interpreted together with heat transfer rate, useful fluid exergy increase, and pumping power demand.
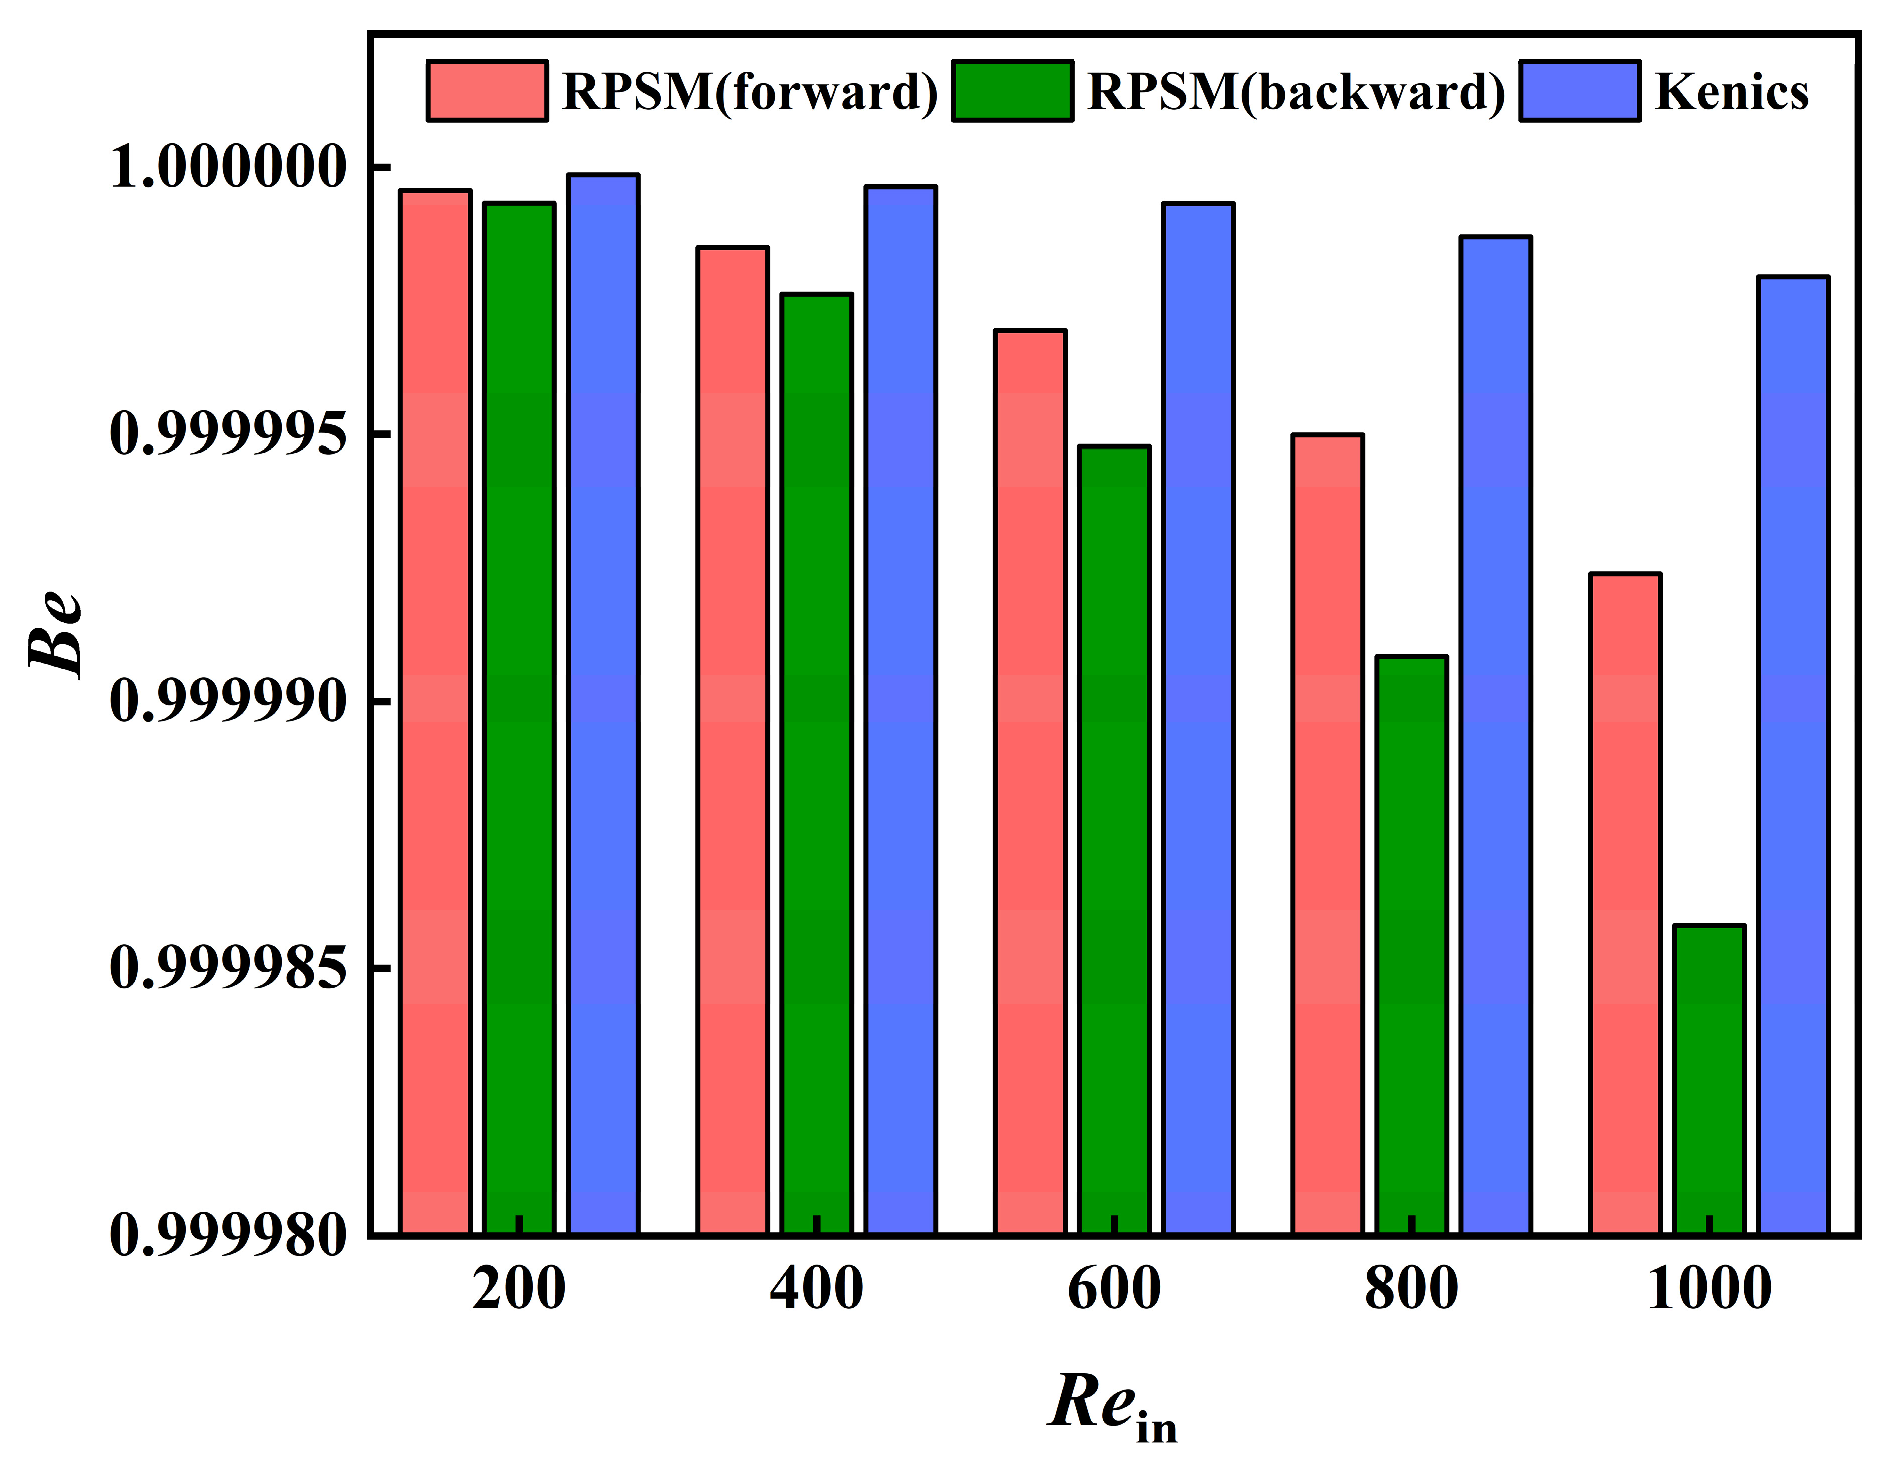
Figure 10 shows the variation in the Bejan number for different configurations. The Bejan number remains close to unity for all configurations, further indicating that heat transfer entropy generation is absolutely dominant in total entropy generation. As Rein increases, Be decreases slightly for the RPSM, especially in the backward installation, indicating an increased contribution of frictional entropy generation. This is consistent with the higher Z-factor and frictional entropy generation of this configuration. Nevertheless, even at Rein = 1000, Be remains close to unity for all configurations, indicating that although frictional irreversibility increases with flow velocity and structural disturbance, it does not alter the fundamental dominance of heat transfer irreversibility in total entropy generation.
The Bejan number close to unity indicates that heat transfer irreversibility dominates the total entropy generation under the present constant wall temperature laminar heating conditions. This does not mean that flow resistance is unimportant. Instead, it indicates that the absolute value of frictional entropy generation is much smaller than that of heat transfer entropy generation. The influence of flow resistance should therefore be assessed together with the Z-factor, frictional entropy generation, and Q/Ẇp.

3.4. Exergy Destruction and Second Law Efficiency of the RPSM

Recent studies emphasize the need to jointly assess useful energy degradation and heat transfer enhancement in complex thermal systems [31]. Here, exergy destruction represents the absolute useful energy loss caused by irreversibility, whereas second law efficiency measures the effective utilization of input thermal exergy. Thus, enhanced heat transfer may increase exergy destruction due to intensified finite temperature difference effects, but it can still improve second law efficiency when the useful exergy gain of the fluid increases proportionally more.
The total irreversible loss of different configurations is mainly governed by heat transfer entropy generation, whereas frictional entropy generation primarily reflects relative differences in flow dissipation. To further evaluate thermodynamic performance from the perspective of energy quality, the exergy destruction rate Ėd and second law efficiency ηII were analyzed in this section. The results are shown in Figure 11 and Figure 12.
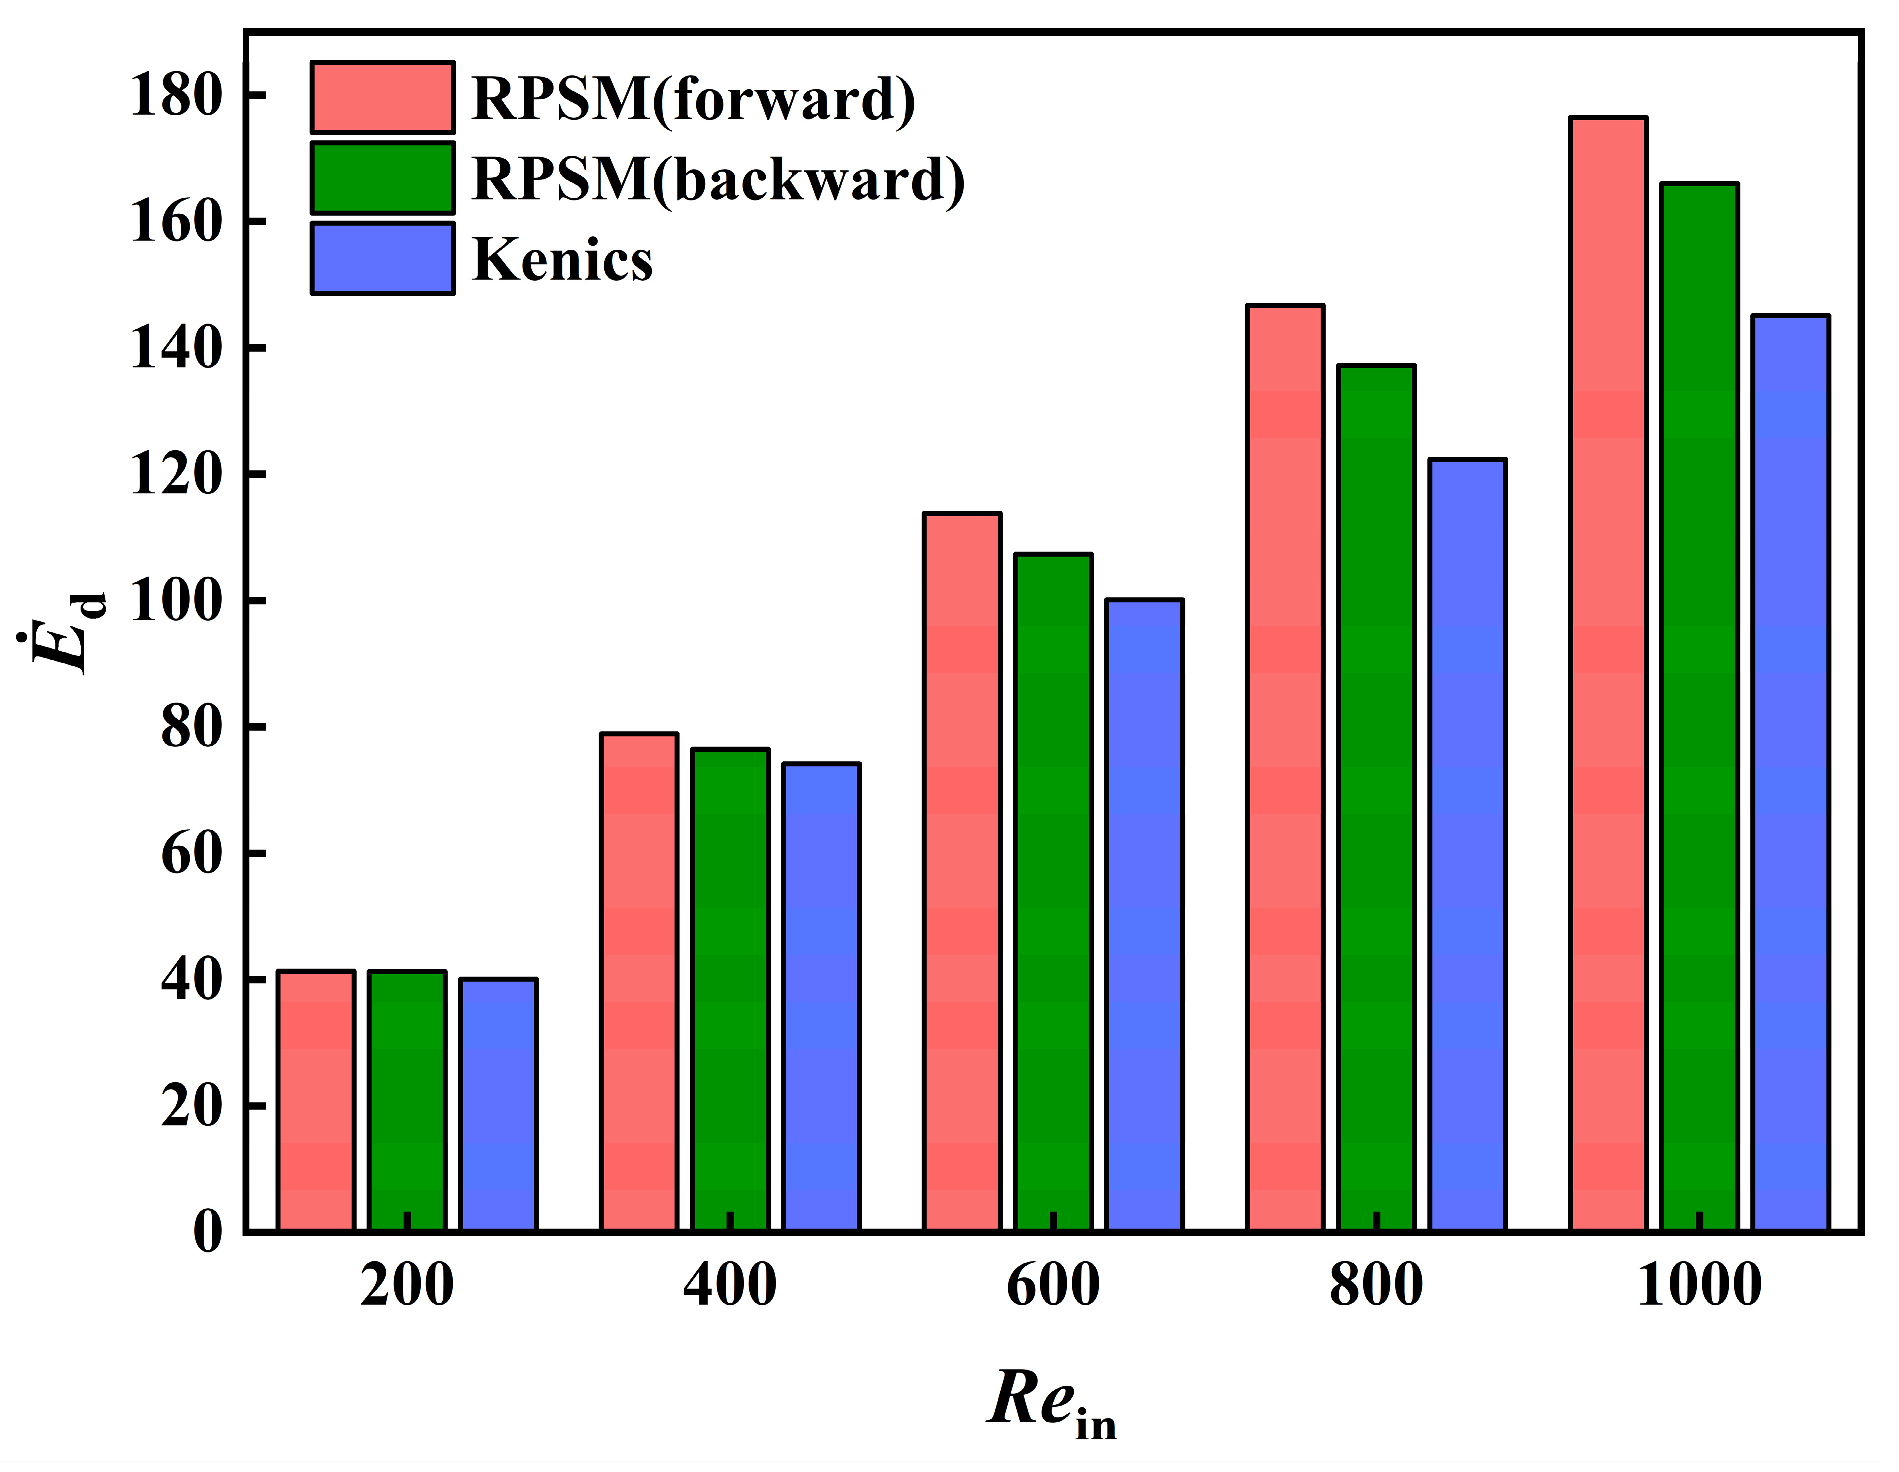
Figure 11 shows the variation in exergy destruction rate Ėd with Rein for different configurations. The Ėd values of all three configurations increase with Rein, and the trend is essentially consistent with that of total entropy generation. This is because increasing the flow rate strengthens the heat transfer rate and finite temperature difference heat transfer process in the test section, thereby increasing exergy destruction. Among the configurations, Ėd follows the order RPSM (forward) > RPSM (backward) > Kenics. Over Rein = 200~1000, the Ėd of RPSM (forward) is, on average, approximately 12.94% higher than that of Kenics and 4.51% higher than that of the backward installation. The Ėd of RPSM (backward) is, on average, approximately 7.97% higher than that of Kenics. At Rein = 1000, the Ėd of RPSM (forward) is approximately 21.6% higher than that of Kenics and 6.3% higher than that of the backward installation. This indicates that RPSM (forward) enhances heat exchange between the core and near-wall regions through swirl and secondary flows, making the heat transfer process in the test section more sufficient. However, the stronger finite temperature difference heat transfer also increases thermal irreversible loss.
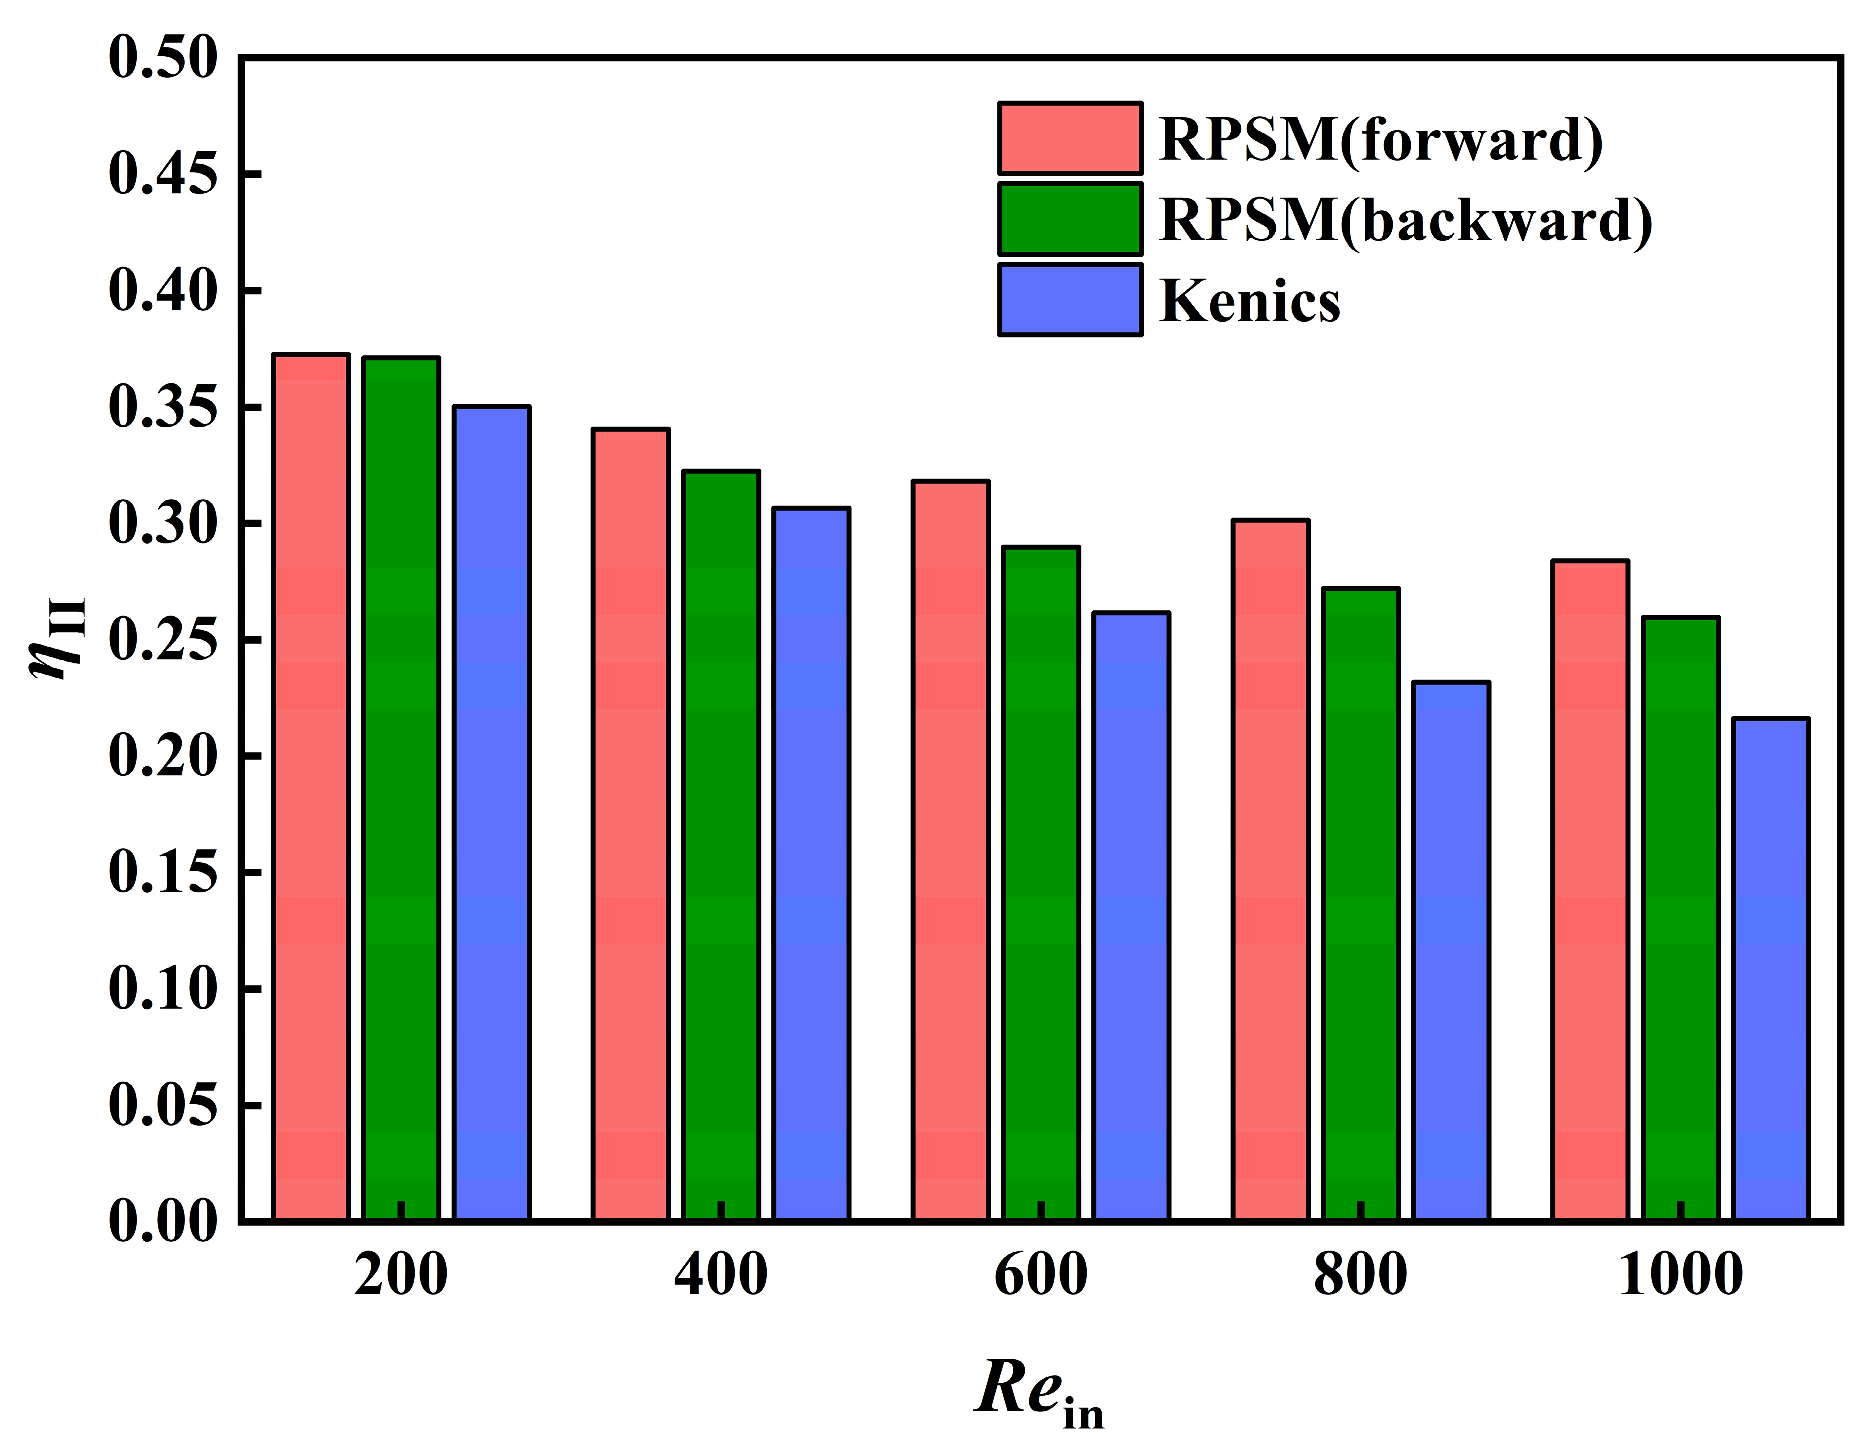
Figure 12 shows the second law efficiency ηII of different configurations. The ηII of all three configurations decreases with increasing Rein, indicating that as the flow rate increases, the sufficiency of fluid heating in the test section decreases and the fraction of input thermal exergy converted into useful fluid exergy decreases. The ηII of RPSM (forward) is, on average, approximately 20.1% higher than that of Kenics and 7.17% higher than that of the backward installation. The ηII of RPSM (backward) is, on average, approximately 11.89% higher than that of Kenics. At Rein = 1000, the ηII of RPSM (forward) is approximately 31.28% higher than that of Kenics and 9.36% higher than that of the backward installation. These results indicate that although RPSM (forward) has a higher exergy destruction rate, its continuous radial transport increases the effective heating of the fluid and thus increases the useful exergy gained by the fluid. Consequently, its second law efficiency remains higher than those of Kenics and the backward installation.
RPSM (forward) has both a higher Ėd and a higher ηII, indicating that its heat transfer enhancement process is accompanied by a larger absolute exergy loss, while the simultaneous increase in useful fluid exergy leads to a higher thermal exergy utilization ratio than those of RPSM (backward) and Kenics. Kenics has the lowest exergy destruction rate, but this is mainly because of its weaker heat transfer capacity and relatively insufficient heat transfer process; it does not imply the best energy utilization. The ηII of the backward RPSM installation is lower than that of the forward installation, while its Z-factor and frictional entropy generation are higher. This indicates that the flow direction adjustment and local momentum dissipation induced by the backward installation are stronger, giving it poorer coordination between energy utilization and flow dissipation than the forward installation. Therefore, within the specific RPSM geometry and operating range considered in this study, the forward installation is the more reasonable orientation from the perspective of heat transfer sufficiency and thermal exergy utilization. However, this conclusion should not be generalized to other RPSM geometries without further parametric verification, especially because the resistance increase and pumping power demand remain substantial.

3.5. Heat Transfer Output and Pumping Power Demand of the RPSM

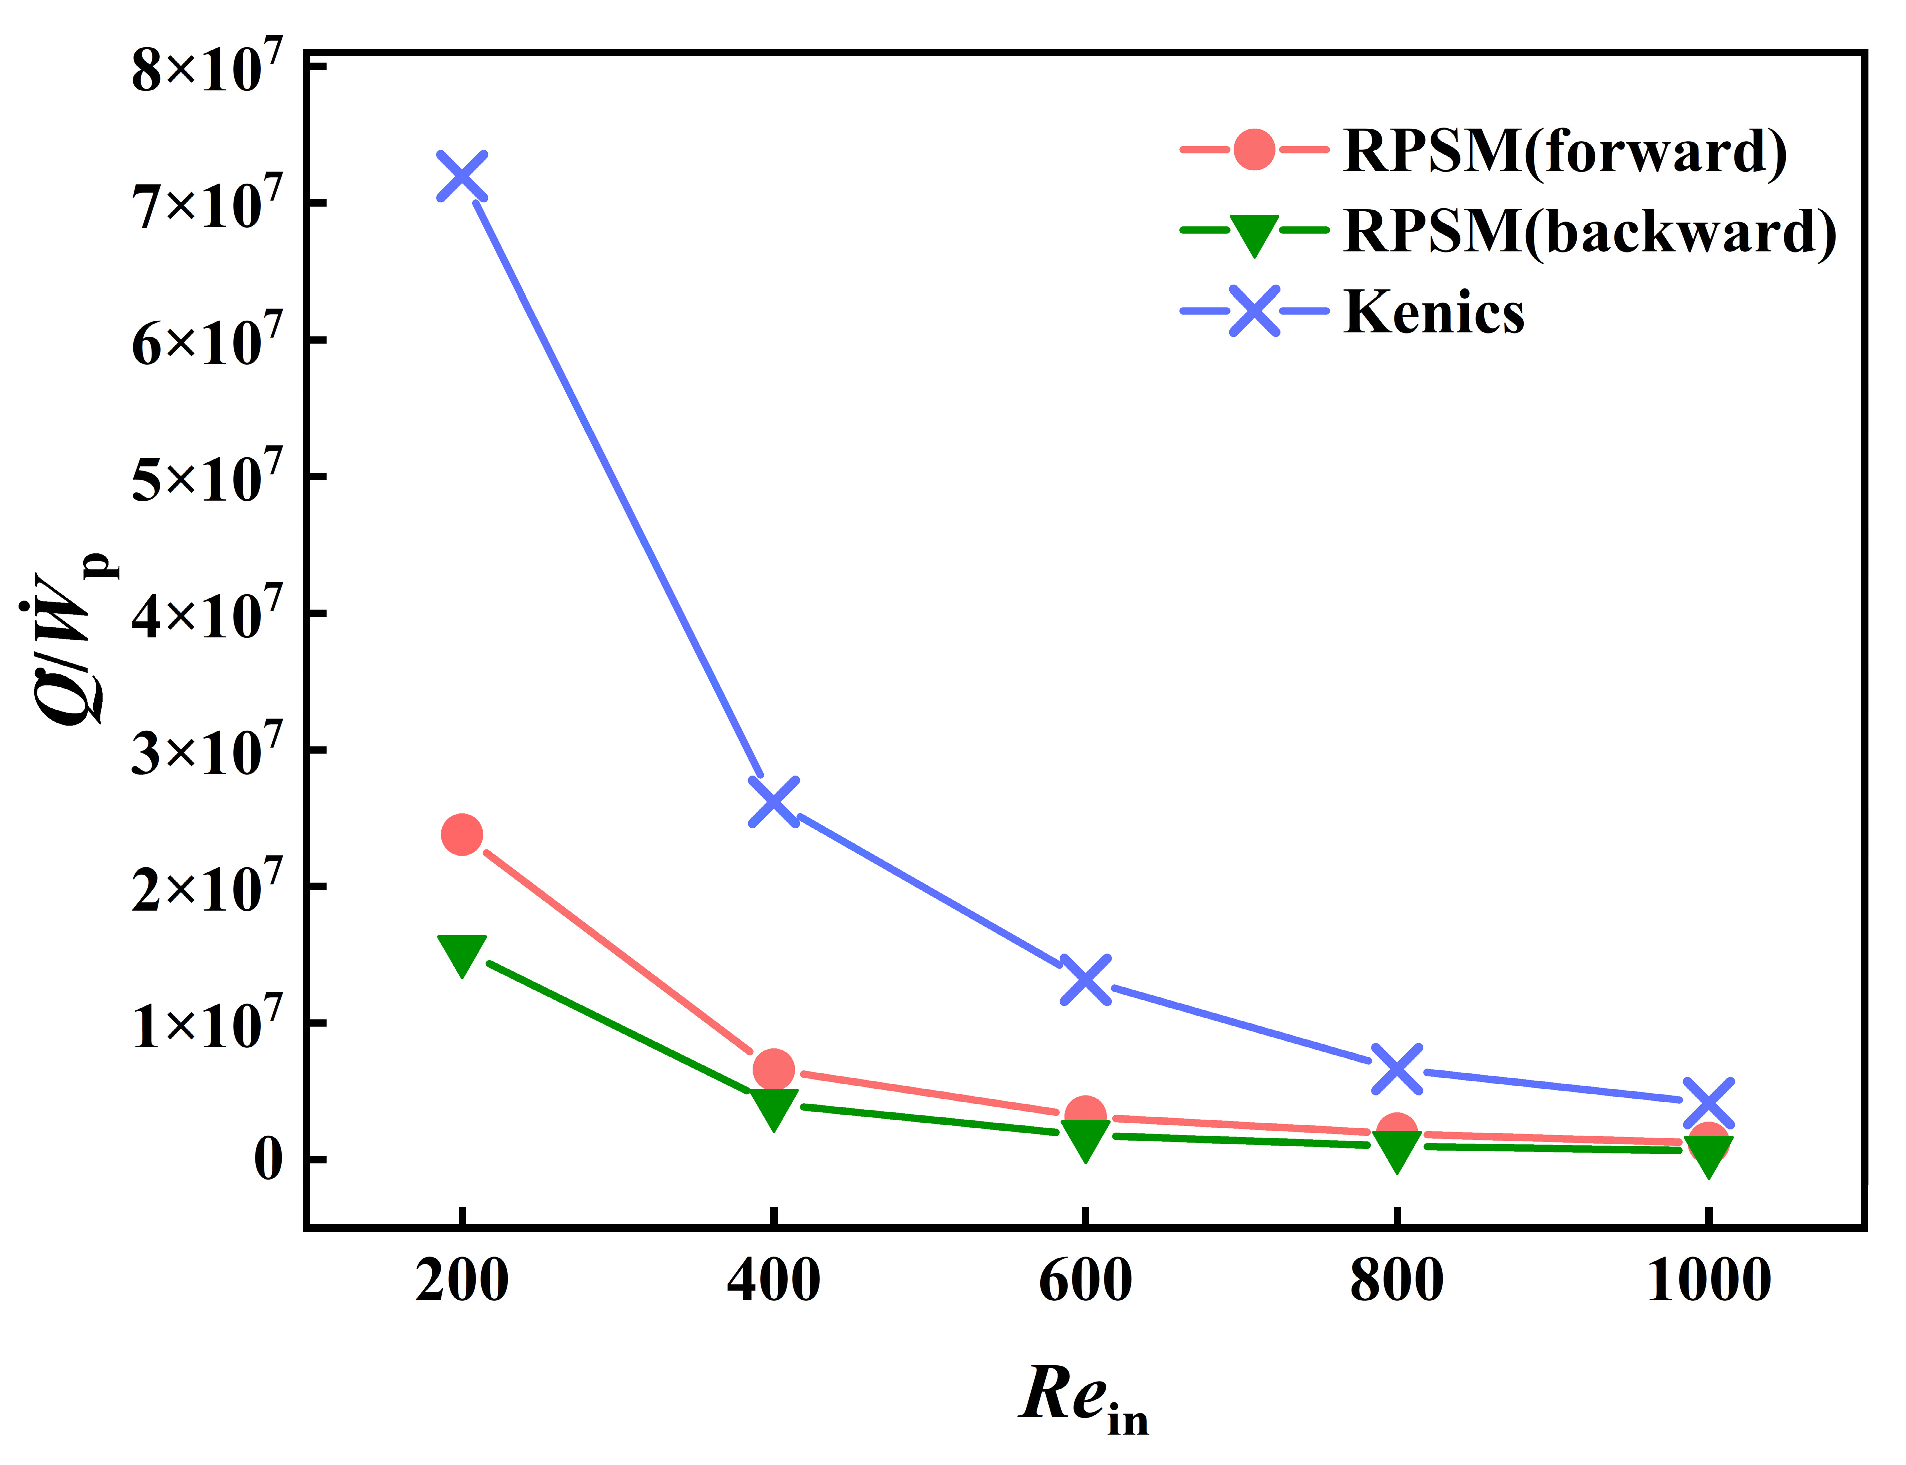
The preceding sections analyzed the heat transfer enhancement and irreversible loss characteristics of different configurations from the perspectives of thermo-hydraulic performance, heat transfer effectiveness, and the second law of thermodynamics. To further evaluate the energy input–output relationship in engineering applications, the ratio of heat transfer rate to pumping power, Q/Ẇp, was used to characterize the heat output obtained per unit pumping power input. The results are shown in Figure 13.
As shown in Figure 13, Q/Ẇp decreases markedly with increasing Rein for all three configurations. This indicates that as the flow velocity increases, the heat transfer rate increases, but the pumping power demand increases more strongly, reducing the heat output per unit pumping power. At the same Rein, Q/Ẇp follows the order Kenics > RPSM (forward) > RPSM (backward). Over Rein = 200~1000, the average Q/Ẇp of Kenics is approximately 2.64 times that of RPSM (forward) and 5.37 times that of RPSM (backward). The Q/Ẇp of RPSM (forward) is, on average, approximately 75.2% higher than that of the backward installation. At Rein = 1000, the Q/Ẇp of Kenics is approximately 2.42 times that of RPSM (forward) and 5.37 times that of RPSM (backward), indicating that the pumping power demand of the RPSM imposes a stronger constraint on engineering heat transfer benefits at higher Reynolds numbers.
From an engineering perspective, the RPSM should not be regarded as a direct replacement for Kenics in all applications. Its main advantage is improved heat transfer capacity, heat transfer sufficiency, and outlet temperature rise within a limited heating length, making the forward configuration suitable for compact devices where thermal enhancement is prioritized and higher pressure drop is acceptable. In contrast, Kenics is more favorable when pumping power, allowable pressure drop, or operating cost is constrained, due to its higher Q/Ẇp and better equal pumping power performance. Future RPSM optimization should therefore reduce local resistance while preserving adequate radial transport.

3.6. Coupled Flow–Heat Transfer Behavior and Pressure Distribution Characteristics of the RPSM

To connect the macroscopic performance indicators with the underlying flow physics, the streamline, temperature field, and pressure coefficient distributions were analyzed together. Previous CFD studies have shown that vortex organization and helical flow structures can strongly influence thermal flow interaction and lateral energy redistribution [14]. Therefore, particular attention was paid to the continuity of swirl motion, the development of secondary flow structures, and the redistribution of low-temperature core fluid and high-temperature near-wall fluid in the present RPSM configurations.
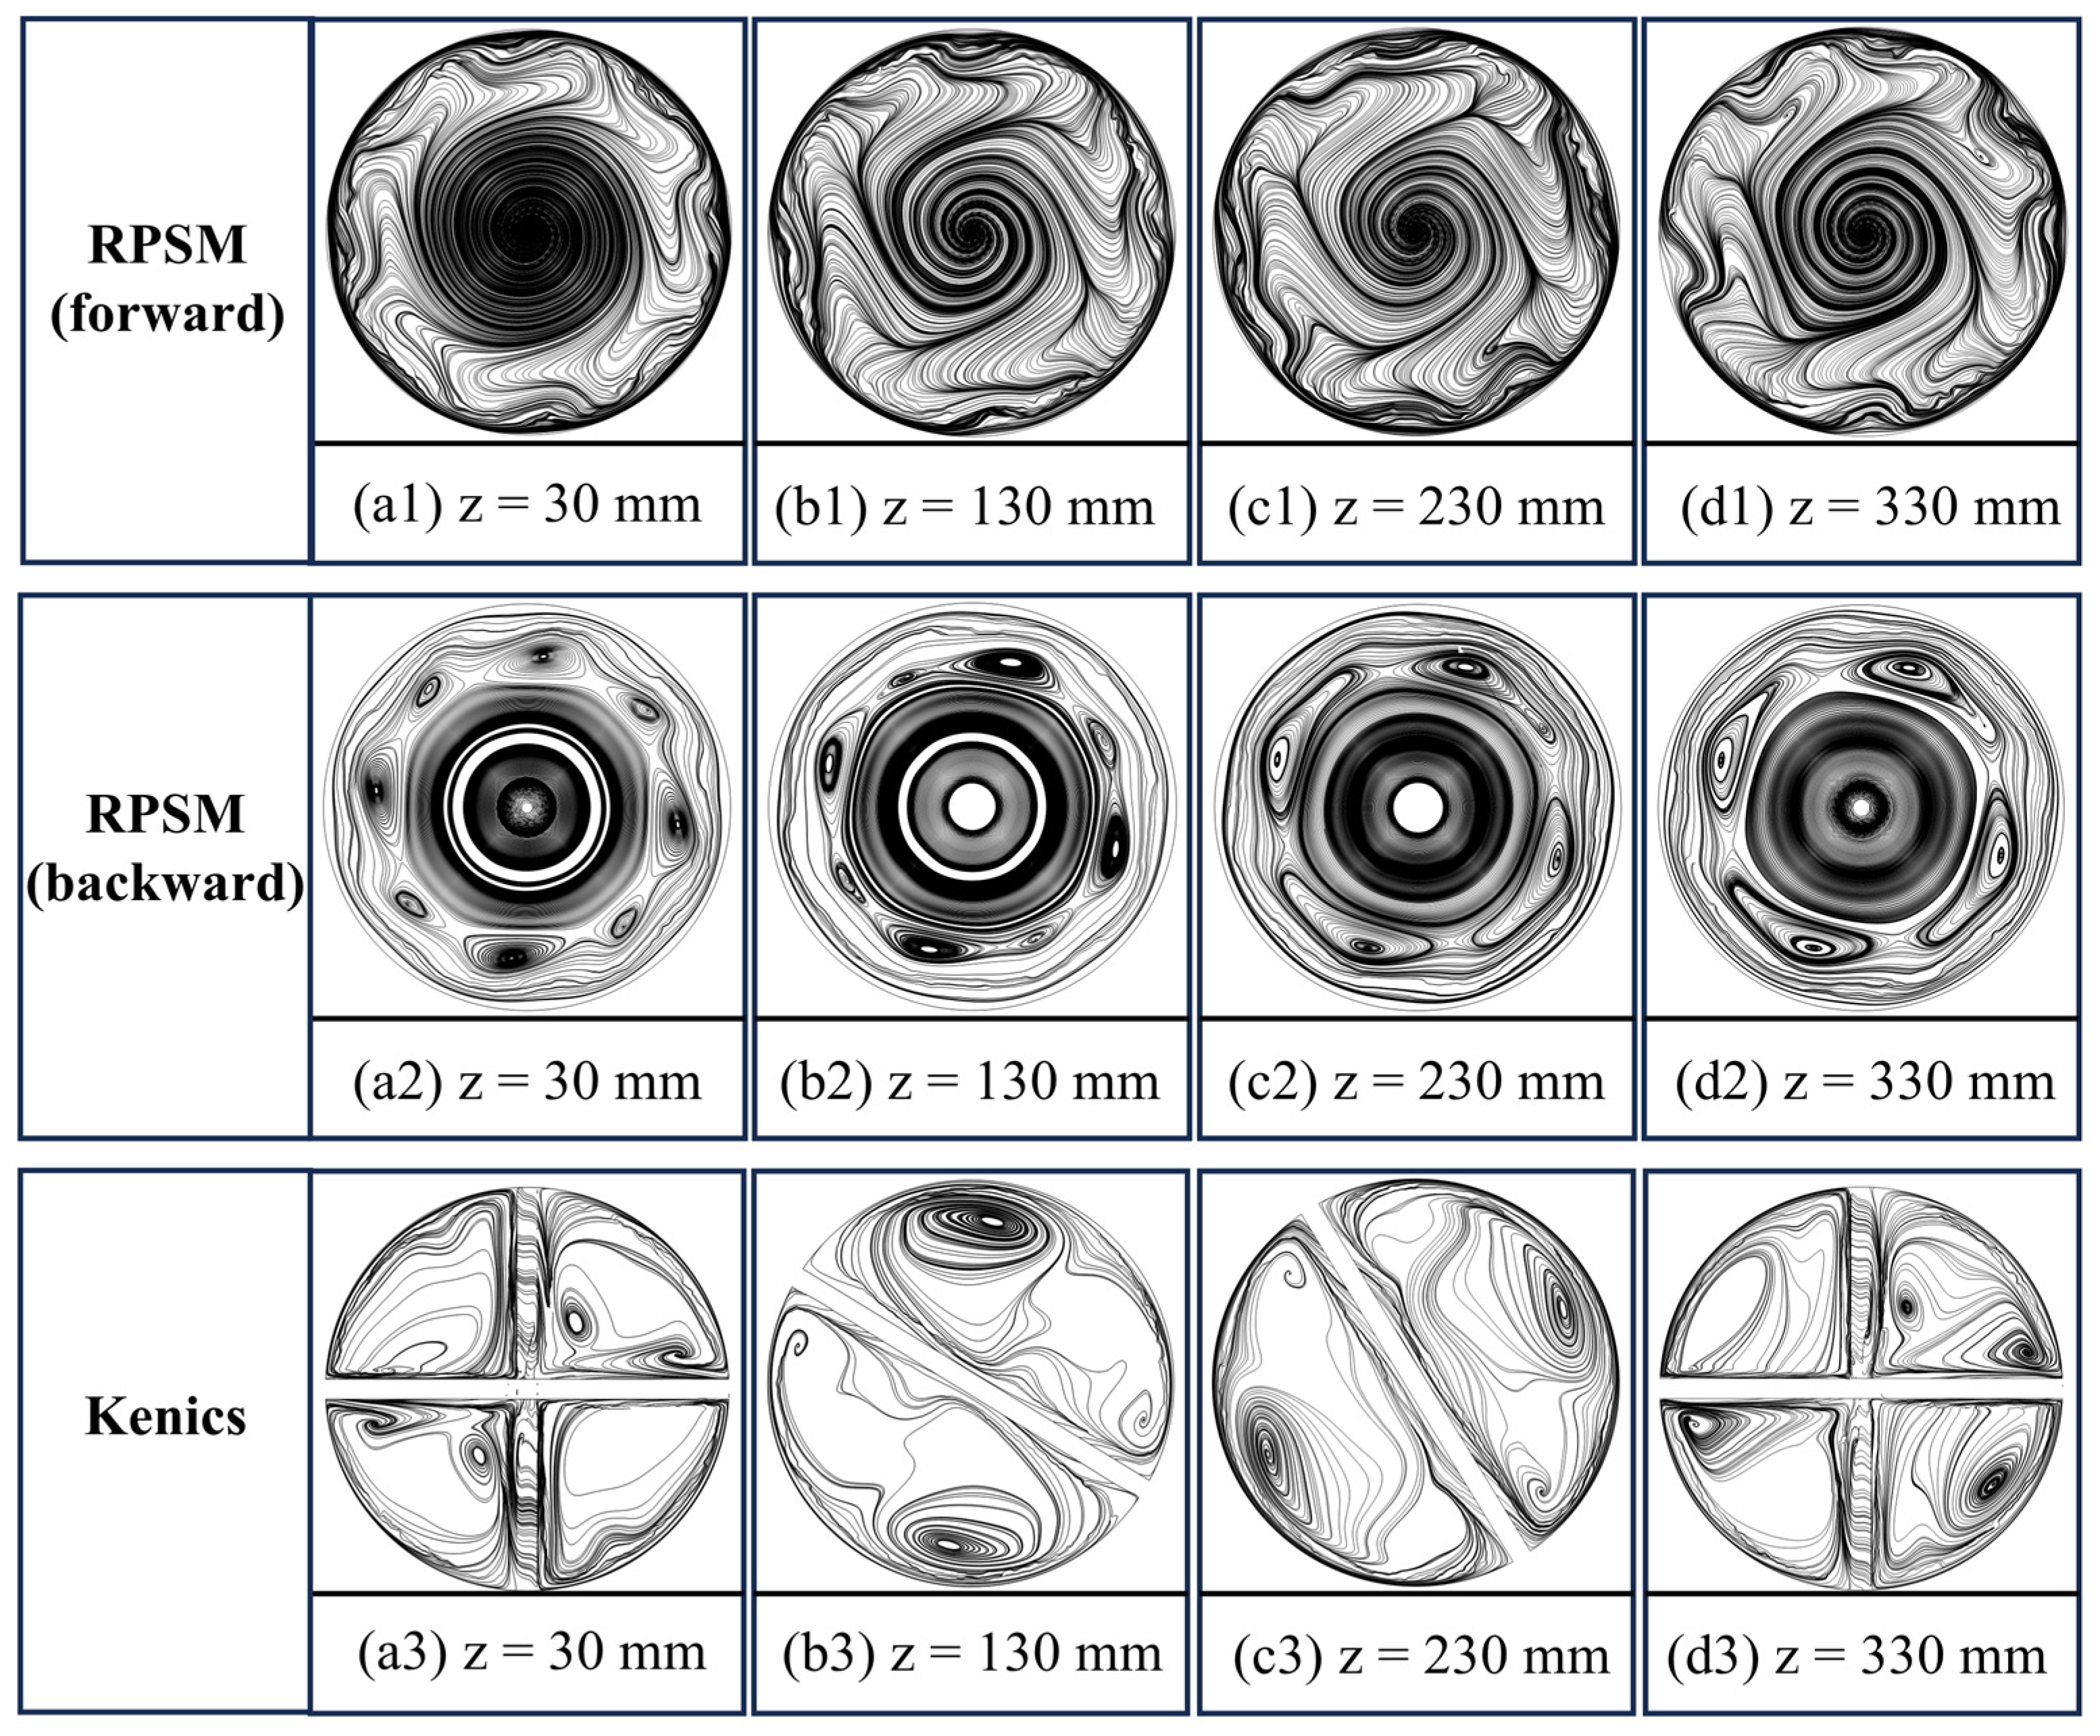
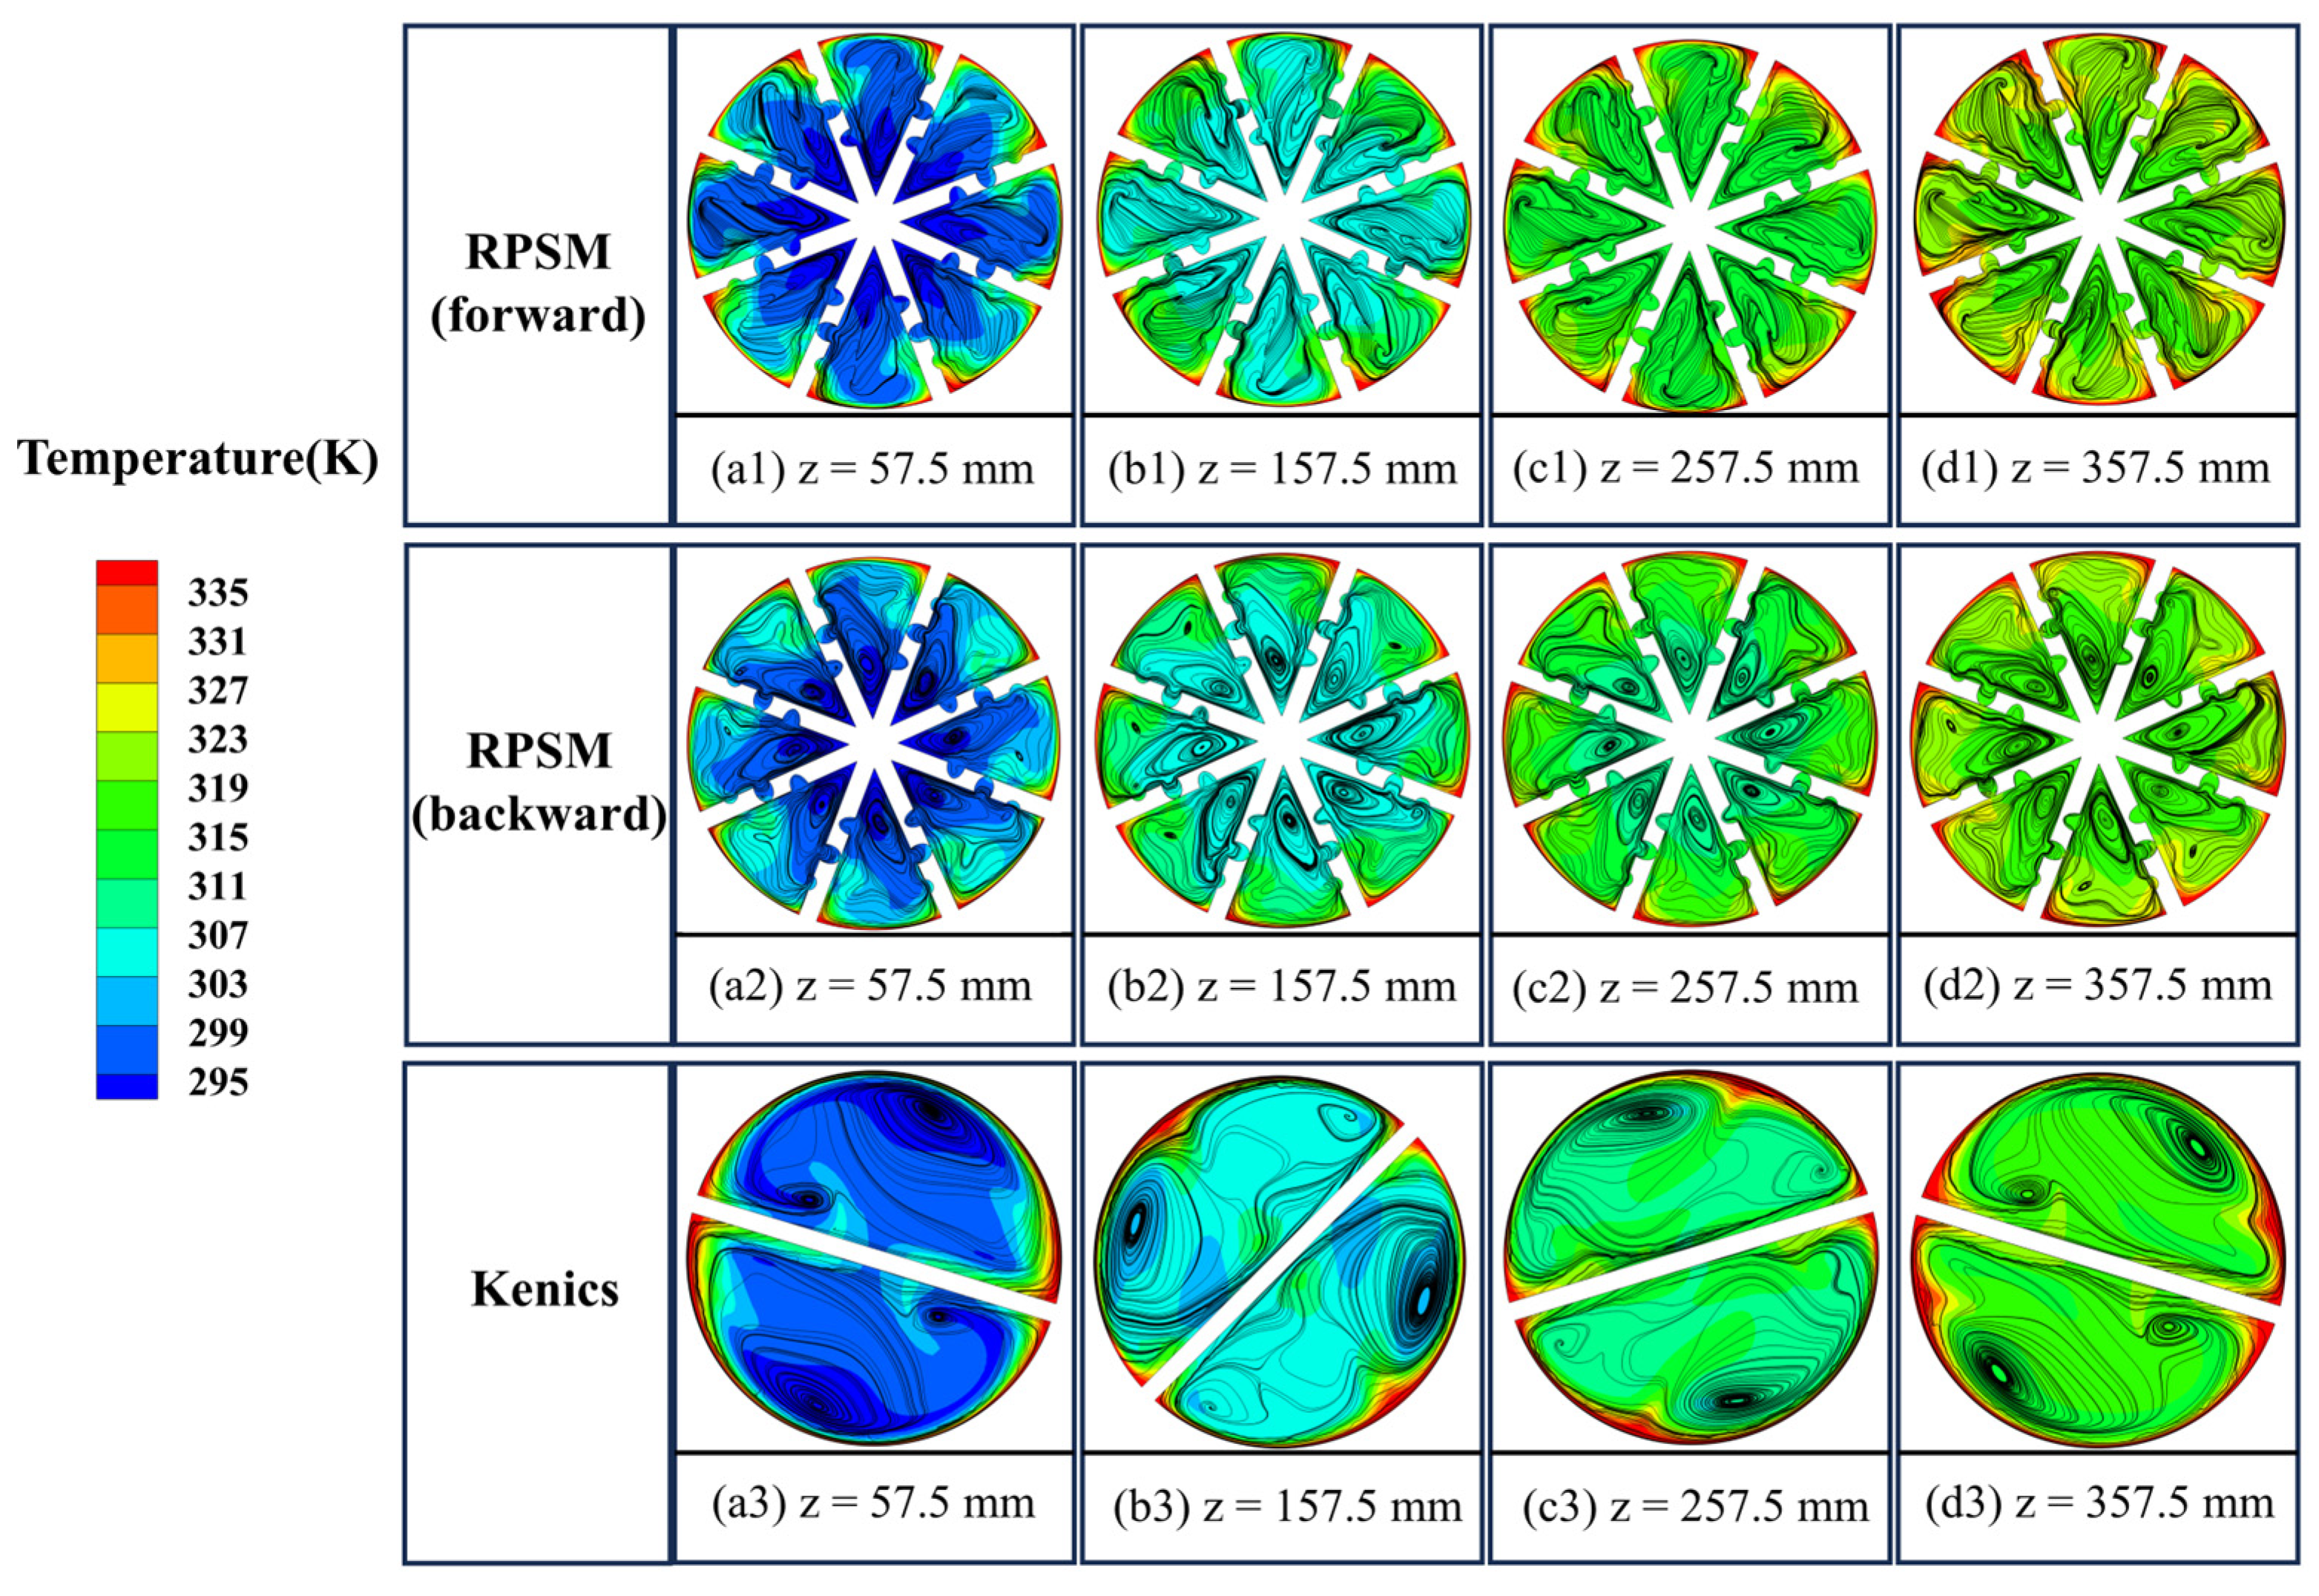
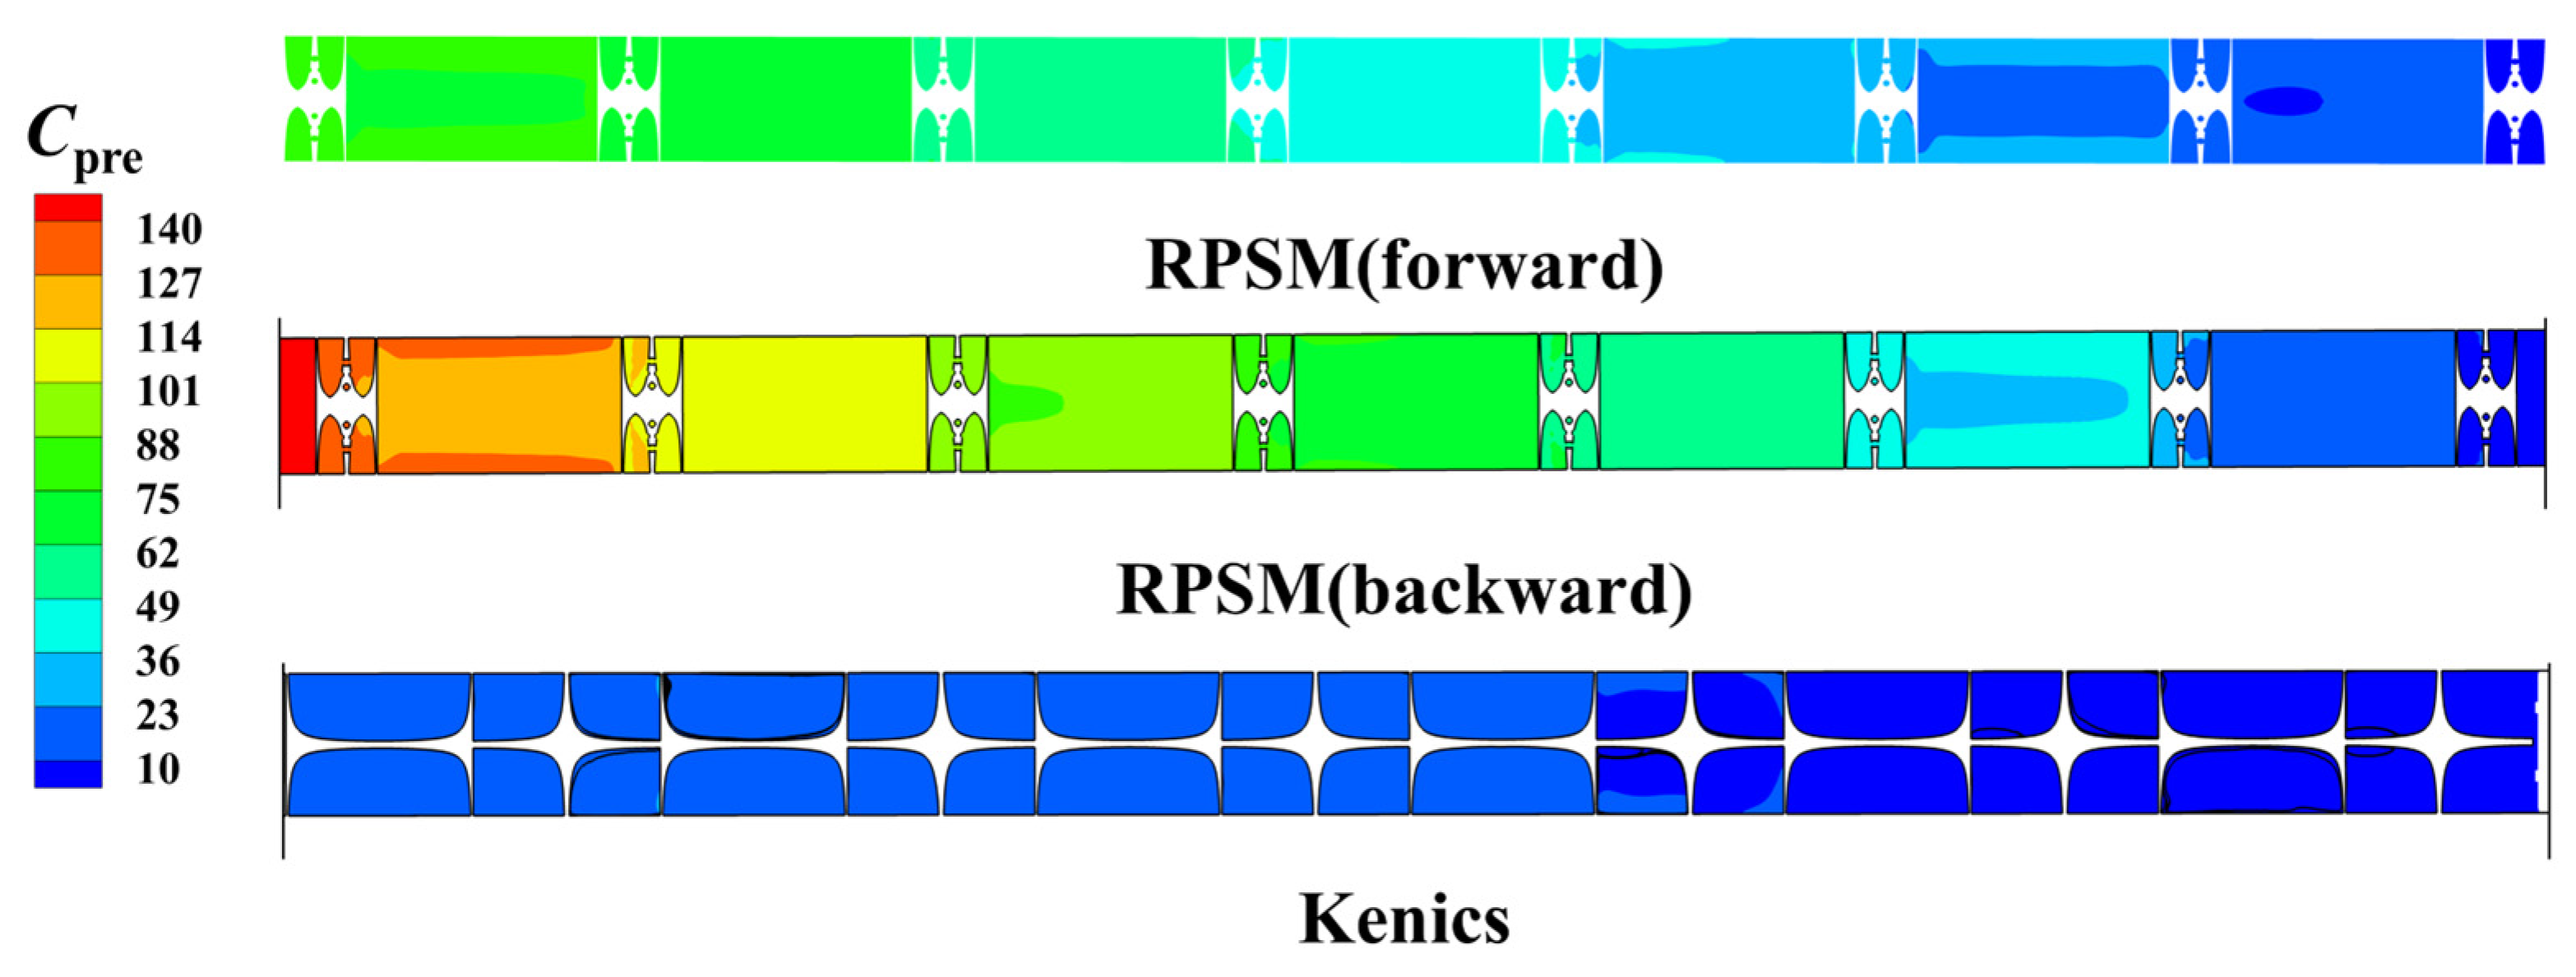
The above results show that RPSM (forward) performs well in terms of the convective heat transfer coefficient, heat transfer effectiveness, and second law efficiency, but it also has a high Z-factor and pumping power demand. To further explain the thermo-hydraulic performance differences among the configurations, representative cross-sections and axial planes were selected to analyze streamline distributions in the inter-element gap region, coupled temperature field and streamline characteristics in the element region, and pressure coefficient distributions. The results are shown in Figure 14, Figure 15 and Figure 16.
Figure 14 shows the cross-sectional streamline distributions in the inter-element gap region for different configurations. RPSM (forward) forms relatively continuous rotating flow structures at z = 30, 130, 230, and 330 mm. Obvious fluid entrainment and redistribution occur between the core and near-wall regions, indicating that the swirl induced by the elements retains strong transport capacity in the gap region after leaving the blade region. RPSM (backward) produces more local recirculation cells, and the streamlines near the wall are more strongly curved, indicating that the backward installation enhances local disturbance and flow direction adjustment but also causes stronger momentum dissipation. By contrast, the cross-sectional streamlines of Kenics mainly show partitioned rotational behavior; the range of flow redistribution is relatively limited, and the continuity of radial transport is weaker than that in the RPSM configurations.
Figure 15 further shows the coupled distributions of the temperature field and streamlines in the element region. Along the axial direction from z = 57.5 mm to z = 357.5 mm, the cross-sectional temperature increases gradually for all three configurations, but the temperature field distributions differ markedly. In RPSM (forward), the secondary flow induced by the multi-blade structure continuously drives low-temperature fluid from the core toward the near-wall region and entrains high-temperature near-wall fluid into the core region, thereby gradually homogenizing the cross-sectional temperature distribution. RPSM (backward) also produces obvious local thermal redistribution, but its streamline structure is more dispersed, and the enhanced local recirculation increases flow dissipation. Therefore, its heat transfer effectiveness is lower than that of RPSM (forward). In Kenics, the temperature distribution is strongly affected by blade-induced splitting; local high-temperature zones are mainly concentrated near the wall, and the degree of cross-sectional temperature homogenization is relatively weak. These results explain, from the perspective of coupled flow and heat transfer, why the RPSM configurations have higher h, ε, and NTU.
For pressure field visualization, the pressure coefficient was defined as:
C p r e = p − p o u t 0.5 ρ u i n 2
where p is the local static pressure and pout is the area-weighted average pressure at the outlet of the test section. Figure 16 shows the pressure coefficient Cpre distributions for different configurations. Overall, the pressure coefficient decreases gradually along the flow direction, indicating continuous pressure loss as the fluid passes through the static mixer. The upstream pressure coefficient of RPSM (backward) is higher and varies more strongly along the flow direction, indicating that the backward installation forces the fluid to adjust its motion direction more frequently between adjacent elements and therefore produces stronger local resistance and momentum loss. This is consistent with its higher Z-factor, higher frictional entropy generation, and lower Q/Ẇp. The pressure coefficient of RPSM (forward) also decreases appreciably along the flow direction, but its distribution is more continuous, indicating that the forward installation maintains better flow organization while sustaining swirl transport. Kenics has a lower pressure coefficient level and a smaller streamwise variation, indicating lower local resistance and thus a higher heat output per unit pumping power.
Figure 14, Figure 15 and Figure 16 show that the RPSM improves convective heat transfer capacity and effectiveness by enhancing radial energy transport through sustained swirl and secondary flow. For the present geometry, the forward configuration provides more continuous swirl-induced radial transport than the backward configuration, leading to higher h, ε, and NTU. Nevertheless, the intensified streamline curvature, local recirculation, and pressure loss increase flow dissipation, producing higher Z-factors and pumping power demand. These results indicate that RPSM-induced heat transfer enhancement is accompanied by a significant resistance penalty. Future optimization should reduce local pressure loss while retaining sufficient radial transport, and the orientation effect should be verified for broader geometric designs. The present flow and temperature field visualizations are intended to elucidate the coupled flow–heat transfer mechanism rather than to quantify concentration based mixing performance.

4. Conclusions

This study investigated the RPSM using three-dimensional steady laminar flow simulations. The thermo-hydraulic performance, heat exchanger effectiveness, and second law characteristics of RPSM forward, RPSM backward, and Kenics configurations were compared at Rein = 200 ~ 1000. The observed performance differences were interpreted through the coupled flow–heat transfer behavior and pressure distributions. Since the RPSM geometry was fixed, the forward–backward comparison should be regarded as an orientation assessment of a specific configuration rather than a full parametric design investigation. The main conclusions are as follows:
(1)
Among the configurations tested under the present geometry and Reynolds number range, RPSM (forward) exhibits the strongest heat transfer enhancement. Over Rein = 200~1000, the h of RPSM (forward) is, on average, approximately 39.8% higher than that of Kenics and 11.0% higher than that of RPSM (backward). Its ε and NTU are also, on average, approximately 21.3% and 32.8% higher than those of Kenics, respectively. These results indicate that RPSM (forward) improves not only the local convective heat transfer intensity but also the overall heat transfer sufficiency of the test section.
(2)
Heat transfer enhancement by the RPSM is accompanied by a pronounced increase in flow resistance, and the installation orientation has a significant effect on resistance characteristics. Within the investigated range, the Z-factors of RPSM (forward) and RPSM (backward) are approximately 3.4 and 6.2 times that of Kenics, respectively, and the value for RPSM (backward) is, on average, approximately 62.5% higher than that for RPSM (forward). Consequently, Kenics has the highest overall ΦPh-Z, while RPSM (forward) shows a more favorable h-Z balance than RPSM (backward) for the present geometry. This indicates that, for the specific RPSM geometry studied here, the forward installation provides a more favorable match between heat transfer enhancement and resistance control than the backward installation.
(3)
Second law analysis shows that total entropy generation under the present operating conditions is mainly governed by heat transfer entropy generation, whereas the absolute value of frictional entropy generation is low. The Bejan number remains close to unity for all configurations, indicating that finite temperature difference heat transfer is the primary source of system irreversibility. The higher entropy generation and exergy destruction of RPSM (forward) arise from intensified finite temperature difference heat transfer rather than reduced irreversibility. Although its higher second law efficiency indicates greater useful exergy gain in the heated fluid, this advantage must be weighed against the associated pressure drop and pumping power penalties.
(4)
Evaluation of heat transfer output and pumping power demand further shows that Kenics has the highest Q/Ẇp, followed by RPSM (forward), while RPSM (backward) has the lowest. Over Rein = 200~1000, the average Q/Ẇp of Kenics is approximately 2.64 times that of RPSM (forward) and 5.37 times that of RPSM (backward). The Q/Ẇp of RPSM (forward) is, on average, approximately 75.2% higher than that of RPSM (backward). The heat transfer advantage of RPSM (forward) is accompanied by a substantial pumping power penalty. Therefore, Kenics is more favorable for pressure drop limited or energy sensitive systems, whereas the present RPSM geometry is more suitable for heat transfer priority applications where compact heating or higher outlet temperature is desired and a higher pressure loss is acceptable.
(5)
For the investigated RPSM geometry, the forward configuration maintains more continuous swirl and secondary flow structures in the element and gap regions, enhancing radial energy exchange and improving temperature field homogenization and heat transfer performance. In contrast, the backward configuration intensifies local disturbance but also causes stronger swirl-direction adjustment, recirculation, and pressure loss, resulting in poorer thermo-hydraulic and pumping power performance. Future RPSM optimization should therefore reduce local pressure loss while preserving radial transport capacity.
The present study provides a comparative thermo-hydraulic and thermodynamic assessment of a representative RPSM configuration under constant wall temperature laminar flow conditions. The results clarify the coupled effects of installation orientation on heat transfer enhancement, pressure loss, heat transfer sufficiency, and thermodynamic irreversibility within the investigated Reynolds number range of 200~1000. Although the current validation framework includes smooth tube heat transfer and friction validation, Kenics heat transfer validation, and RPSM resistance validation, direct experimental heat transfer data for the RPSM are still desirable for further confirming the absolute prediction accuracy. Future work should extend the present analysis by conducting experimental heat transfer validation and multi-parameter optimization, with particular attention to the effects of perforation diameter, blade twist angle, blade number, aspect ratio, and element spacing on the balance between heat transfer enhancement and flow resistance penalty.

Author Contributions

Conceptualization, H.W., M.T. and S.Z.; methodology, H.W. and D.W.; software, H.W.; validation, H.W., X.G., Y.L. and Z.G.; formal analysis, S.Z. and D.W.; investigation, H.W.; resources, X.G. and L.W.; data curation, X.G.; writing—original draft preparation, H.W.; writing—review and editing, H.W.; visualization, R.W. and Y.L.; supervision, D.W.; project administration, Y.L.; funding acquisition, S.Z. All authors have read and agreed to the published version of the manuscript.

Funding

This study was supported by the Education Commission Research Program of Tianjin, China [Grant/Award Number: 2023KJ282].

Data Availability Statement

The original contributions presented in this study are included in the article. Further inquiries can be directed to the corresponding authors.

Conflicts of Interest

The authors declare no conflicts of interest.

Nomenclature

AHeated wall area of the test sectionm2
ArAspect ratio of the static mixer element-
BeBejan number-
CpSpecific heat capacity at constant pressureJ/(kg·K)
CprePressure coefficient-
DInner diameter of the circular tubem
dPerforation diameter of the RPSM bladem
ĖdExergy destruction rateW
ΔĖx,fExergy increase of the fluidW
Ėx,QExergy rate associated with wall heat inputW
fDarcy friction factor-
f0Darcy friction factor of the smooth tube-
gGravitational accelerationm/s2
hConvective heat transfer coefficientW/(m2·K)
hiConvective heat transfer coefficient of the ith configurationW/(m2·K)
h0Convective heat transfer coefficient of the smooth tube at the same Reynolds numberW/(m2·K)
LTotal length of the circular tubem
l1Length of the inlet sectionm
l2Length of the test sectionm
l3Length of the outlet sectionm
ṁMass flow ratekg/s
NbNumber of blades in one RPSM element-
NeNumber of static mixer elements in the test section-
NTUNumber of transfer units-
NuNusselt number-
ΔPmixerPressure difference between the inlet and outlet of the test section with mixer elementsPa
ΔPemptyPressure difference between the inlet and outlet of the smooth tube test sectionPa
PrPrandtl number-
QHeat transfer rate in the test sectionW
ReReynolds number-
ReinInlet Reynolds number-
ṠgenTotal entropy generation rate in the test sectionW/K
Ṡgen,htHeat transfer entropy generation rate in the test sectionW/K
Ṡgen,frFrictional entropy generation rate in the test sectionW/K
TTemperatureK
T0Ambient reference temperatureK
TbMean fluid temperature in the test sectionK
TinArea-weighted average fluid temperature at the inlet of the test sectionK
ToutArea-weighted average fluid temperature at the outlet of the test sectionK
TwWall temperature of the test sectionK
ΔTmLogarithmic mean temperature differenceK
uCross-sectional average velocity in the tubem/s
uinInlet average velocitym/s
ẆpPumping power in the test sectionW
ZZ-factor, resistance increase relative to the smooth tube-
ZiZ-factor of the ith configuration-
Greek   
αBlade twist angle of the RPSM°
εHeat effectiveness-
ηIISecond-law efficiency-
λThermal conductivity of the fluidW/(m·K)
μDynamic viscosity of the fluidkg/(m·s)
ρFluid densitykg/m3
ΔPTotal pressure drop in the test sectionPa
ΦPh-Zh-Z performance factor under equal pumping power condition-
θRelative angle between adjacent RPSM elements in the empirical Z-factor correlation°

References

  1. Ali, M.R.; Al-Khaled, K.; Hussain, M.; Labidi, T.; Khan, S.U.; Kolsi, L.; Sadat, R. Effect of Design Parameters on Passive Control of Heat Transfer Enhancement Phenomenon in Heat Exchangers—A Brief Review. Case Stud. Therm. Eng. 2023, 43, 102674. [Google Scholar] [CrossRef] [Scilit]
  2. Mousavi Ajarostaghi, S.S.; Zaboli, M.; Javadi, H.; Badenes, B.; Urchueguia, J.F. A Review of Recent Passive Heat Transfer Enhancement Methods. Energies 2022, 15, 986. [Google Scholar] [CrossRef] [Scilit]
  3. Bennour, E.; Kaid, N.; Kezrane, C. Numerical Investigation of Improved Mixing and Heat Transfer of a Shear-Thinning Fluid in Corrugated and Baffled Tube Systems. Appl. Therm. Eng. 2025, 268, 125863. [Google Scholar] [CrossRef] [Scilit]
  4. Set Ho, J.; Fu, M. Laminar Flow and Heat Transfer Enhancement in Helical Twisted Tube with Twisted Tape Inserted. Case Stud. Therm. Eng. 2025, 76, 107310. [Google Scholar] [CrossRef] [Scilit]
  5. Farhadi, S.; Shekari, Y.; Omidvar, P. Numerical and Experimental Investigation of Laminar and Turbulent Convective Heat Transfer in a Coiled Flow Reverser with Twisted Tape Insert. Int. J. Therm. Sci. 2024, 197, 108781. [Google Scholar] [CrossRef] [Scilit]
  6. Chithra, V.P.; Jayakumar, V.; Bakthavatchalam, B.; Kusekar, S.K.; Irshad, K.; Habib, K. Thermal Performance Enhancement of Laminar Flow Using Compound Twisted Square Duct and Variable Pitch Twisted Tape Inserts. Case Stud. Therm. Eng. 2024, 64, 105462. [Google Scholar] [CrossRef] [Scilit]
  7. Shahbazi, A.; Ashtiani, H.A.D.; Afshar, H.; Jafarkazemi, F. Optimization of the SMX Static Mixer Types Thermal and Hydraulic Performance by Coupling CFD-Genetic Algorithm. Int. Commun. Heat Mass Transf. 2021, 126, 105388. [Google Scholar] [CrossRef] [Scilit]
  8. Yu, Y.; Qiao, W.; Meng, H.; Wan, H.; Sun, W.; Zhang, P.; Guo, J.; Wang, F. Investigation of Enhancing Heat Transfer in Three Kenics Static Mixer Utilizing Muti-Objective Optimization. Int. J. Therm. Sci. 2025, 214, 109911. [Google Scholar] [CrossRef] [Scilit]
  9. Valdés, J.P.; Kahouadji, L.; Matar, O.K. Current Advances in Liquid–Liquid Mixing in Static Mixers: A Review. Chem. Eng. Res. Des. 2022, 177, 694–731. [Google Scholar] [CrossRef] [Scilit]
  10. Bennour, E.; Kezrane, C.; Kaid, N.; Alqahtani, S.; Alshehery, S.; Menni, Y. Improving Mixing Efficiency in Laminar-Flow Static Mixers with Baffle Inserts and Vortex Generators: A Three-Dimensional Numerical Investigation Using Corrugated Tubes. Chem. Eng. Process. Process Intensif. 2023, 193, 109530. [Google Scholar] [CrossRef] [Scilit]
  11. Kaid, N.; Bensafi, M.; Alqahtani, S.; Alshehery, S.; Menni, Y. Investigating Hydrothermal Mass Transfer in an Extremely Low-Pressure Drop Passive Mixer: A Three-Dimensional Simulation Study. Chem. Eng. Res. Des. 2023, 200, 1–11. [Google Scholar] [CrossRef] [Scilit]
  12. Meng, H.; Zhao, Y.; Yu, Y.; Qiao, W.; Tian, G. Heat Transfer Enhancement of Nanofluids in a Four-Blade LPD Static Mixer. Int. J. Heat Fluid Flow 2024, 106, 109289. [Google Scholar] [CrossRef] [Scilit]
  13. Wang, X.; Ye, L.; Li, W.; Zheng, T.; Liang, X.; Liu, C. Film Cooling Effectiveness in the Presence of Internal Hole Random Roughness: A Comprehensive Analysis. Int. Commun. Heat Mass Transf. 2025, 165, 108990. [Google Scholar] [CrossRef] [Scilit]
  14. Ye, L.; Guo, H.; Zhu, Y.; Jiang, P. Large Eddy Simulation of Film Cooling Flow from Diffusion Slot Hole with Crossflow Coolant Configuration. Phys. Fluids 2023, 35, 055101. [Google Scholar] [CrossRef] [Scilit]
  15. Wang, J.; Zeng, L.; Yu, S.; He, Y.; Tang, J. Experimental and Numerical Investigations of Tube Inserted with Novel Perforated Rectangular V-Shape Vortex Generators. Appl. Therm. Eng. 2024, 249, 123451. [Google Scholar] [CrossRef] [Scilit]
  16. Wang, J.; Zeng, L.; He, Y.; Zhao, B.; Chu, P. Effect of Structure Parameters on Thermal Performance of Novel Punched V-Shape VGs for Hear Exchangers: An Experimental Approach. Int. Commun. Heat Mass Transf. 2024, 155, 107472. [Google Scholar] [CrossRef] [Scilit]
  17. Jiang, X.; Xiao, Z.; Jiang, J.; Yang, X.; Wang, R. Effect of Element Thickness on the Pressure Drop in the Kenics Static Mixer. Chem. Eng. J. 2021, 424, 130399. [Google Scholar] [CrossRef] [Scilit]
  18. Lowry, E.; Yuan, Y.; Krishnamoorthy, G. A New Correlation for Single-Phase Pressure Loss through SMV Static Mixers at High Reynolds Numbers. Chem. Eng. Process. Process Intensif. 2022, 171, 108716. [Google Scholar] [CrossRef] [Scilit]
  19. Chakleh, R.; Azizi, F. Performance Comparison between Novel and Commercial Static Mixers under Turbulent Conditions. Chem. Eng. Process. Process Intensif. 2023, 193, 109559. [Google Scholar] [CrossRef] [Scilit]
  20. Mohadjer, A.; Nobakhti, M.H.; Nezamabadi, A.; Mousavi Ajarostaghi, S.S. Thermohydraulic Analysis of Nanofluid Flow in Tubular Heat Exchangers with Multi-Blade Turbulators: The Adverse Effects. Heliyon 2024, 10, e30333. [Google Scholar] [CrossRef] [Scilit] [PubMed]
  21. Xia, G.; He, X.; Jia, Y.; Zhu, Y.; Tian, Z. Design of a Cylindrical Thermal Rotary Concentrator Based on Transformation Thermodynamics. Materials 2025, 18, 4440. [Google Scholar] [CrossRef] [Scilit] [PubMed]
  22. Jayranaiwachira, N.; Promvonge, P.; Thianpong, C.; Skullong, S. Entropy Generation and Thermal Performance of Tubular Heat Exchanger Fitted with Louvered Corner-Curved V-Baffles. Int. J. Heat Mass Transf. 2023, 201, 123638. [Google Scholar] [CrossRef] [Scilit]
  23. Promvonge, P.; Skullong, S. Thermohydraulic Performance and Entropy Generation in Heat Exchanger Tube with Louvered Winglet Tapes. Int. J. Therm. Sci. 2022, 181, 107733. [Google Scholar] [CrossRef] [Scilit]
  24. Dhumal, G.S.; Havaldar, S.N. Experimental Investigation of Entropy Generation in a Pipe Heat Exchanger with Turbulence Generator inside and on the Outside. Case Stud. Therm. Eng. 2023, 51, 103464. [Google Scholar] [CrossRef] [Scilit]
  25. Mahammedi, A.; Tayeb, N.T.; Kim, J.-H.; Hossain, S. Entropy Generation Analysis and Thermal Synergy Efficiency in the T-Shaped Micro-Kenics. Heliyon 2024, 10, e32233. [Google Scholar] [CrossRef] [Scilit] [PubMed]
  26. Jayranaiwachira, N.; Promvonge, P.; Tongyote, P.; Skullong, S.; Nakhchi, M.E. Analysis of Exergy and Heat Transfer in a Tube Fitted with Flapped V-Baffles. Case Stud. Therm. Eng. 2024, 59, 104483. [Google Scholar] [CrossRef] [Scilit]
  27. Yıldırım, F.; Gürdal, M. Numerical Energy and Entropy Analyses of a Tube with Wavy Tape Insert Including CoFe2O4/Water Nanofluid under Laminar Regime. Int. J. Heat Fluid Flow 2024, 108, 109447. [Google Scholar] [CrossRef] [Scilit]
  28. Wang, J.; Zeng, L.; Ma, S.; Zhao, B.; Li, C. Entropy Generation and Thermal Behavior Analysis of Tube Fitted with Multi-Perforation Vortex Generators. Appl. Therm. Eng. 2025, 261, 125099. [Google Scholar] [CrossRef] [Scilit]
  29. Han, Y.; Li, J.; Zhang, C.; Zhu, Y.; Wu, X.; Lv, C.; Zhang, Z.; Zhang, C. Exergy Loss Analysis on Heat Transfer Characteristics of Twisted Petaloid Spirally Wound Tube with the Convection Boundary Condition. Appl. Therm. Eng. 2023, 218, 119291. [Google Scholar] [CrossRef] [Scilit]
  30. Celik, N.; Kapan, S.; Tasar, B. Effects of Various Parameters on Entropy Generation and Exergy Destruction in a Coil Wire Inserted Heat Exchanger by Using Deep Learning Neural Network Method. Int. Commun. Heat Mass Transf. 2025, 161, 108481. [Google Scholar] [CrossRef] [Scilit]
  31. Wang, Q.; Xiao, D.; Tang, G.; Lu, Z.; Ge, X.; Zou, C.; Huang, Q.; Jiang, D.; Li, G. A Latent-Heat-Coupled Wellbore Heat-Transfer Model with Phase-Change Materials. Phys. Fluids 2026, 38, 047122. [Google Scholar] [CrossRef] [Scilit]
  32. Promvonge, P.; Eiamsa-ard, S.; Skullong, S.; Maruyama, N.; Hirota, M. Thermal Performance and Exergy Analysis in a Round Tube with Louvered Trapezoidal Winglets. Int. J. Heat Mass Transf. 2023, 212, 124261. [Google Scholar] [CrossRef] [Scilit]
  33. Meng, L.; Gao, X.; Wang, D.; Liu, Y.; Wang, R.; Hu, B.; Tang, M.; Zhang, S. Experimental Study on Energy Consumption Characteristics of Rotational–Perforated Static Mixers. Can. J. Chem. Eng. 2023, 101, 6656–6671. [Google Scholar] [CrossRef] [Scilit]
  34. Gao, X.; Tang, M.; Wang, D.; Liu, Y.; Wang, R.; Yan, F.; Meng, L.; Zhang, S. The Effect of Periodic Spatial Arrangement of Rotational–Perforated Static Mixer on Chaotic Advection Behavior. Chem. Eng. Sci. 2024, 292, 119917. [Google Scholar] [CrossRef] [Scilit]
  35. Gao, X.; Wang, D.; Wang, R.; Liu, Y.; Wang, R.; Zhang, S.; Tang, M. Numerical Simulation Study on Mixing Performance and Flow Mechanism Analysis of Rotational–Perforated Static Mixers in Forward and Backward Installations. Chem. Eng. Sci. 2026, 333, 124251. [Google Scholar] [CrossRef] [Scilit]
  36. Gao, X.; Wang, D.; Liu, Y.; Wang, R.; Hu, B.; Wei, H.; Wang, L.; Zhang, S.; Tang, M. The Effects of Different Perforated Structures on Fluid Mixing Characteristics of Rotational–Perforated Static Mixers. Can. J. Chem. Eng. 2026, 1–22. [Google Scholar] [CrossRef] [Scilit]
  37. Joshi, P.; Nigam, K.D.P.; Nauman, E.B. The Kenics Static Mixer: New Data and Proposed Correlations. Chem. Eng. J. 1995, 59, 265–271. [Google Scholar] [CrossRef] [Scilit]
Figure 1. Schematic diagram of computational domain.
Processes 14 02060 g001
Figure 2. Schematic of the three-dimensional model: (a) RPSM element; (b) blade twist angle of RPSM; (c) installation orientation of RPSM; (d) Kenics static mixer.
Processes 14 02060 g002
Figure 3. Mesh on mixing elements and tube wall with partial enlarged views.
Processes 14 02060 g003
Figure 4. Grid independence verification.
Processes 14 02060 g004
Figure 5. Verification plot of smooth pipe: (a) verification of the empirical formula for Nu; (b) verification of the empirical formula for f.
Processes 14 02060 g005
Figure 6. Numerical validation: (a) Nu comparison between Kenics and empirical correlation; (b) Z-factor comparison between RPSM and empirical correlation.
Processes 14 02060 g006
Figure 7. Thermo-hydraulic performance evaluation of different configurations: (a) convective heat transfer coefficient; (b) Z-factor; (c) h-Z performance factor.
Processes 14 02060 g007
Figure 8. Heat exchanger effectiveness evaluation of different configurations: (a) thermal effectiveness ε; (b) number of transfer units NTU.
Processes 14 02060 g008
Figure 9. Entropy generation decomposition of different configurations: (a) heat transfer entropy generation; (b) frictional entropy generation; (c) total entropy generation.
Processes 14 02060 g009
Figure 10. Bejan number of different configurations.
Processes 14 02060 g010
Figure 11. Exergy destruction rate of different configurations.
Processes 14 02060 g011
Figure 12. Second law efficiency of different configurations.
Processes 14 02060 g012
Figure 13. Ratio of heat transfer rate to pumping power for different configurations.
Processes 14 02060 g013
Figure 14. Cross-sectional streamlines in the inter-element gap region of different configurations: (a1,b1,c1,d1) RPSM (forward); (a2,b2,c2,d2) RPSM (backward); (a3,b3,c3,d3) Kenics.
Processes 14 02060 g014
Figure 15. Coupled distributions of temperature field and streamlines in the element region of different configurations: (a1,b1,c1,d1) RPSM (forward); (a2,b2,c2,d2) RPSM (backward); (a3,b3,c3,d3) Kenics.
Processes 14 02060 g015
Figure 16. Pressure coefficient distributions of different configurations.
Processes 14 02060 g016
Table 1. Specifications of original RPSM and Kenics.
Design ParametersUnitRPSMKenics
Blade twist angle°90-
Blade number-8-
Hole diametermm1-
Aspect ratio-0.51.5
Element number-812
Install direction-Forward, backward-
Table 2. Results of grid independence verification.
NumberMesh NumberReinhZ-Factor
Grid 12,616,529200629.877319.03713
Grid 23,473,133200625.961119.8188
Grid 39,084,606200652.041621.05168
Grid 416,967,555200648.710721.32733
Disclaimer/Publisher’s Note: The statements, opinions and data contained in all publications are solely those of the individual author(s) and contributor(s) and not of MDPI and/or the editor(s). MDPI and/or the editor(s) disclaim responsibility for any injury to people or property resulting from any ideas, methods, instructions or products referred to in the content.