Article

Prediction and Control Technology of Trapped Annular Pressure in Gas Storage Wells

by
Wei Rong
1,
Xiaoping Yang
1,
Zhi Zhang
2,
Zhong Pan
1,
Xuefeng Dou
2,*,
Liangwen Liu
1,
Xiaobin Bai
3,
Nan Cai
2 and
Huayan Li
1
1
Engineering Technology Research Institute, Huabei Oilfield Company, PetroChina, Renqiu 062550, China
2
State Key Laboratory of Oil and Gas Reservoir Geology and Exploitation, Southwest Petroleum University, Chengdu 610500, China
3
CBM & Gas Storage Department, Huabei Oilfield Company, PetroChina, Renqiu 062550, China
*
Author to whom correspondence should be addressed.
Processes 2026, 14(12), 1949; https://doi.org/10.3390/pr14121949
Submission received: 14 May 2026 / Revised: 4 June 2026 / Accepted: 10 June 2026 / Published: 15 June 2026
(This article belongs to the Section Energy Systems)

Abstract

In view of the frequent occurrence of trapped annular pressure and the increasingly prominent risk of wellbore integrity under the periodic high-intensity injection and production conditions of gas storage wells, a trapped annular pressure prediction model suitable for deep gas storage wells is established based on the comprehensive heat transfer characteristics of the tubing string-cement sheath-formation. The calculation results of the model are in good agreement with field-measured pressure data, with a coincidence degree of about 95%. Based on the established model, the influence laws of four major factors, including tubing specification and dimension, thermophysical properties of annular fluid, casing material characteristics and daily gas production rate, on trapped annular pressure are systematically analyzed. Meanwhile, the pressure control effects of three measures, namely Annulus A pressure relief, application of insulated tubing and nitrogen injection into Annulus B, are quantitatively compared for the case well. The research results show that adopting tubing with larger outer diameter and thinner wall thickness, injecting fluid with lower thermal expansion coefficient or higher isothermal compressibility coefficient into the annulus and appropriately reducing daily gas production can effectively decrease trapped annular pressure. Among them, the influence of fluid properties on trapped annular pressure is far greater than that of pipe material parameters. Among the three pressure control measures, nitrogen injection into Annulus B presents the optimal pressure control effect; when the nitrogen volume accounts for approximately 3% of the total annular fluid volume, the trapped annular pressure is reduced by about 82%. The research findings provide a theoretical basis and technical guidance for the prediction and control of trapped annular pressure in gas storage wells. It is recommended to prioritize the nitrogen injection technology for Annulus B in the well construction stage, and realize pressure management for producing wells by combining Annulus A pressure relief and production regulation.

1. Introduction

With the continuous expansion of underground gas storage construction, annular pressure buildup has become a prominent problem affecting wellbore integrity and operational safety [1]. Gas storage wells operate under periodic high-rate injection and production, resulting in significant alternating variations in the wellbore temperature field. During the gas injection stage, low-temperature injected gas cools down the wellbore and helps suppress annular pressure. During the shut-in stage, heat transfer from the formation raises the wellbore temperature, leading to a slight increase in annular pressure. During the gas production stage, high-temperature formation fluid flows upward through the tubing, transferring heat through the tubing wall into multiple annuli and casings [2]. The confined fluid in sealed annuli expands thermally with restricted volume, thereby generating trapped annular pressure. Excessively high trapped annular pressure tends to cause wellbore integrity failures such as wellhead uplift, seal failure, casing deformation, and cement sheath debonding. In severe cases, it can induce safety accidents, including gas leakage, fire, and sour gas poisoning, endangering production and personnel safety [3]. Therefore, clarifying the mechanism of trapped annular pressure, establishing accurate prediction methods, quantifying influencing factors, and developing efficient control technologies are key research directions to ensure the safe operation of gas storage facilities.
Domestic and foreign scholars have conducted extensive research on the prediction and control of trapped annular pressure. In terms of pressure prediction models, P. Oudeman (2004) stated that fluid thermal expansion constitutes the dominant contributor to annular pressure variation and recommended incorporating the radial expansion and contraction of casing into calculations. Nevertheless, his model fails to account for changes in fluid physical properties across multiple annuli [4]. Wang et al. (2017) developed a sealed annulus analytical model incorporating tubing string mechanics and fluid PVT properties. This model is applicable to one-time thermal loading conditions but fails to characterize the dynamic variation in annular volume induced by long-term injection-production cycles in underground gas storage (UGS) wells [5]. Zhang et al. (2019) proposed a theoretical model for trapped annular pressure and evaluated the performance of various pressure control measures. However, the model is not coupled with the mechanical degradation of the cement sheath under cyclic loading, which may result in considerable prediction errors under high-temperature and high-pressure (HTHP) conditions in deep wells [6]. Sui et al. (2022) put forward a subsection calculation model for annuli and verified that the thermal expansion coefficient and isothermal compressibility of annular protection fluid exert remarkable impacts on annular pressure. Nevertheless, dynamic coupling between casing deformation and annular volume is neglected, and layered pressure transfer analysis for the multi-annulus configuration of gas storage wells is absent in their model [7]. Zhang et al. (2023) established a transient coupled prediction model suitable for deepwater HTHP wells. Since deepwater wells generally undergo only a single thermal cycle, the model cannot be directly extended to handle cyclic injection-production behaviors of gas storage wells [8]. Alves Eduardo B. D. M. (2023) constructed a heat transfer model via Laplace transform and validated a positive correlation between annular temperature rise rate and pressure buildup. Unfortunately, the model focuses merely on the temperature rising rate and ignores the comprehensive contributions of fluid compressibility and other parameters to pressure evolution [9]. Liu et al. (2024) proposed a prediction model with volume-pressure dynamic coupling, achieving favorable consistency with field-measured data, whereas the model lacks targeted consideration of unique operating features of gas storage wells, including intensive injection-production operations and alternating large temperature fluctuations [10]. Hong (2025) established a fluid-thermomechanical coupled model and recommended mitigating temperature disturbance on wellhead pressure via production optimization. The dominant effects of annular fluid physical properties (thermal expansion coefficient and isothermal compressibility) on pressure evolution are not thoroughly quantified in the proposed model [11].
Most existing prediction models are developed for conventional gas wells or deepwater oil and gas wells, with fundamental assumptions including a single thermal cycle, volume variation in a single annulus and seawater ambient conditions. These hypotheses deviate substantially from the practical characteristics of gas storage wells, such as intensive cyclic injection-production, drastic alternating temperature variation, special wellbore configuration, customized annular protection fluid and specific injection-production schemes. Accordingly, these existing models cannot accurately reproduce the in situ evolution of annular pressure. In view of the practical operational characteristics of underground gas storage, the newly developed model in this work dynamically couples fluid thermal expansion and compressibility effects, and additionally incorporates radius variation driven by differential pressure across casing and thermally induced casing deformation. An iterative solution of thermo-mechanical equilibrium equations is implemented to realize high-precision annular pressure prediction.
In the field of pressure control technologies, Jiang et al. (2017) investigated the pressure control rule of nitrogen injection and recommended the optimal nitrogen column length for different well types [12]. Zhang (2021) established a static–dynamic integrated calculation method for annular pressure and formed a comprehensive control technology for APB [13]. Liu et al. (2022) applied Bayesian analysis and identified wellbore temperature alternation and tubular wear as dominant factors for abnormal annular pressure [14]. Yang et al. (2024) developed an annular pressure accumulation model under leakage conditions and revealed the effects of multiple factors on pressure equilibrium time [15]. Zhang et al. (2024) established a two-dimensional finite element model and found that the production process imposes a much stronger effect on annular pressure than the injection process [16]. Liu et al. (2025) proposed a method to improve the pressure relief capacity of deepwater annuli by considering the influence of solid deposition [17]. Guan et al. (2026) experimentally studied the working mechanism of rupture discs and clarified the influences of temperature, flow rate and corrosion on burst pressure [18]. Current research on sustained annular pressure (SAP) control technologies is predominantly oriented toward conventional gas wells or deepwater oil and gas wells. Most investigations only focus on the control law of a single influencing factor on sustained annular pressure, making such technologies difficult to fully adapt to the actual working conditions of underground gas storage (UGS) wells.
Gas storage wells face much higher wellbore integrity risks than conventional oil and gas wells due to high-pressure injection-production, large production fluctuations, severe temperature cycling, tubular wear and corrosion, and other factors. Gas storage wells in the Huabei Oilfield exceed 5000 m in depth, with bottomhole pressure of approximately 50 MPa and temperature up to 160 °C. The surface temperature drops to −10 °C in winter, leading to a large wellbore temperature difference and widespread APB, with annular pressure over 30 MPa in some wells. Therefore, establishing a trapped annular pressure prediction model suitable for actual gas storage working conditions, quantifying influencing laws, and optimizing high-efficiency pressure control technologies are of great theoretical significance and engineering value.
Accordingly, based on the high-rate injection-production regime and the coupled heat transfer process of tubing–cement sheath formation, this paper establishes a trapped annular pressure prediction model and verifies its accuracy using field data. The influences of tubing size, annular fluid properties, casing parameters, daily gas production rate and temperature variation are systematically analyzed. Three control measures—nitrogen injection into the annulus, insulated tubing, and pressure relief in Annulus A—are quantitatively compared, and an optimal management scheme is proposed. The results provide a theoretical basis and technical support for wellbore integrity management in gas storage wells.

2. Calculation Model of Trapped Annular Pressure in Gas Storage Wells

2.1. Coupled Model of Trapped Annular Pressure and Temperature

The wellbore structure of gas storage injection-production wells is similar to that of conventional oil and gas wells, which mainly consists of tubing and casing strings, packers, wellheads, and supporting facilities. Generally, the tubing-casing annulus (i.e., Annulus A) of gas storage wells is filled with annulus protection fluid for pressure balancing and wellbore corrosion protection. Annulus B and Annulus C can be fully cemented with cement sheaths or filled with annulus protection fluid or inert gas to balance annular pressure, as shown in Figure 1.
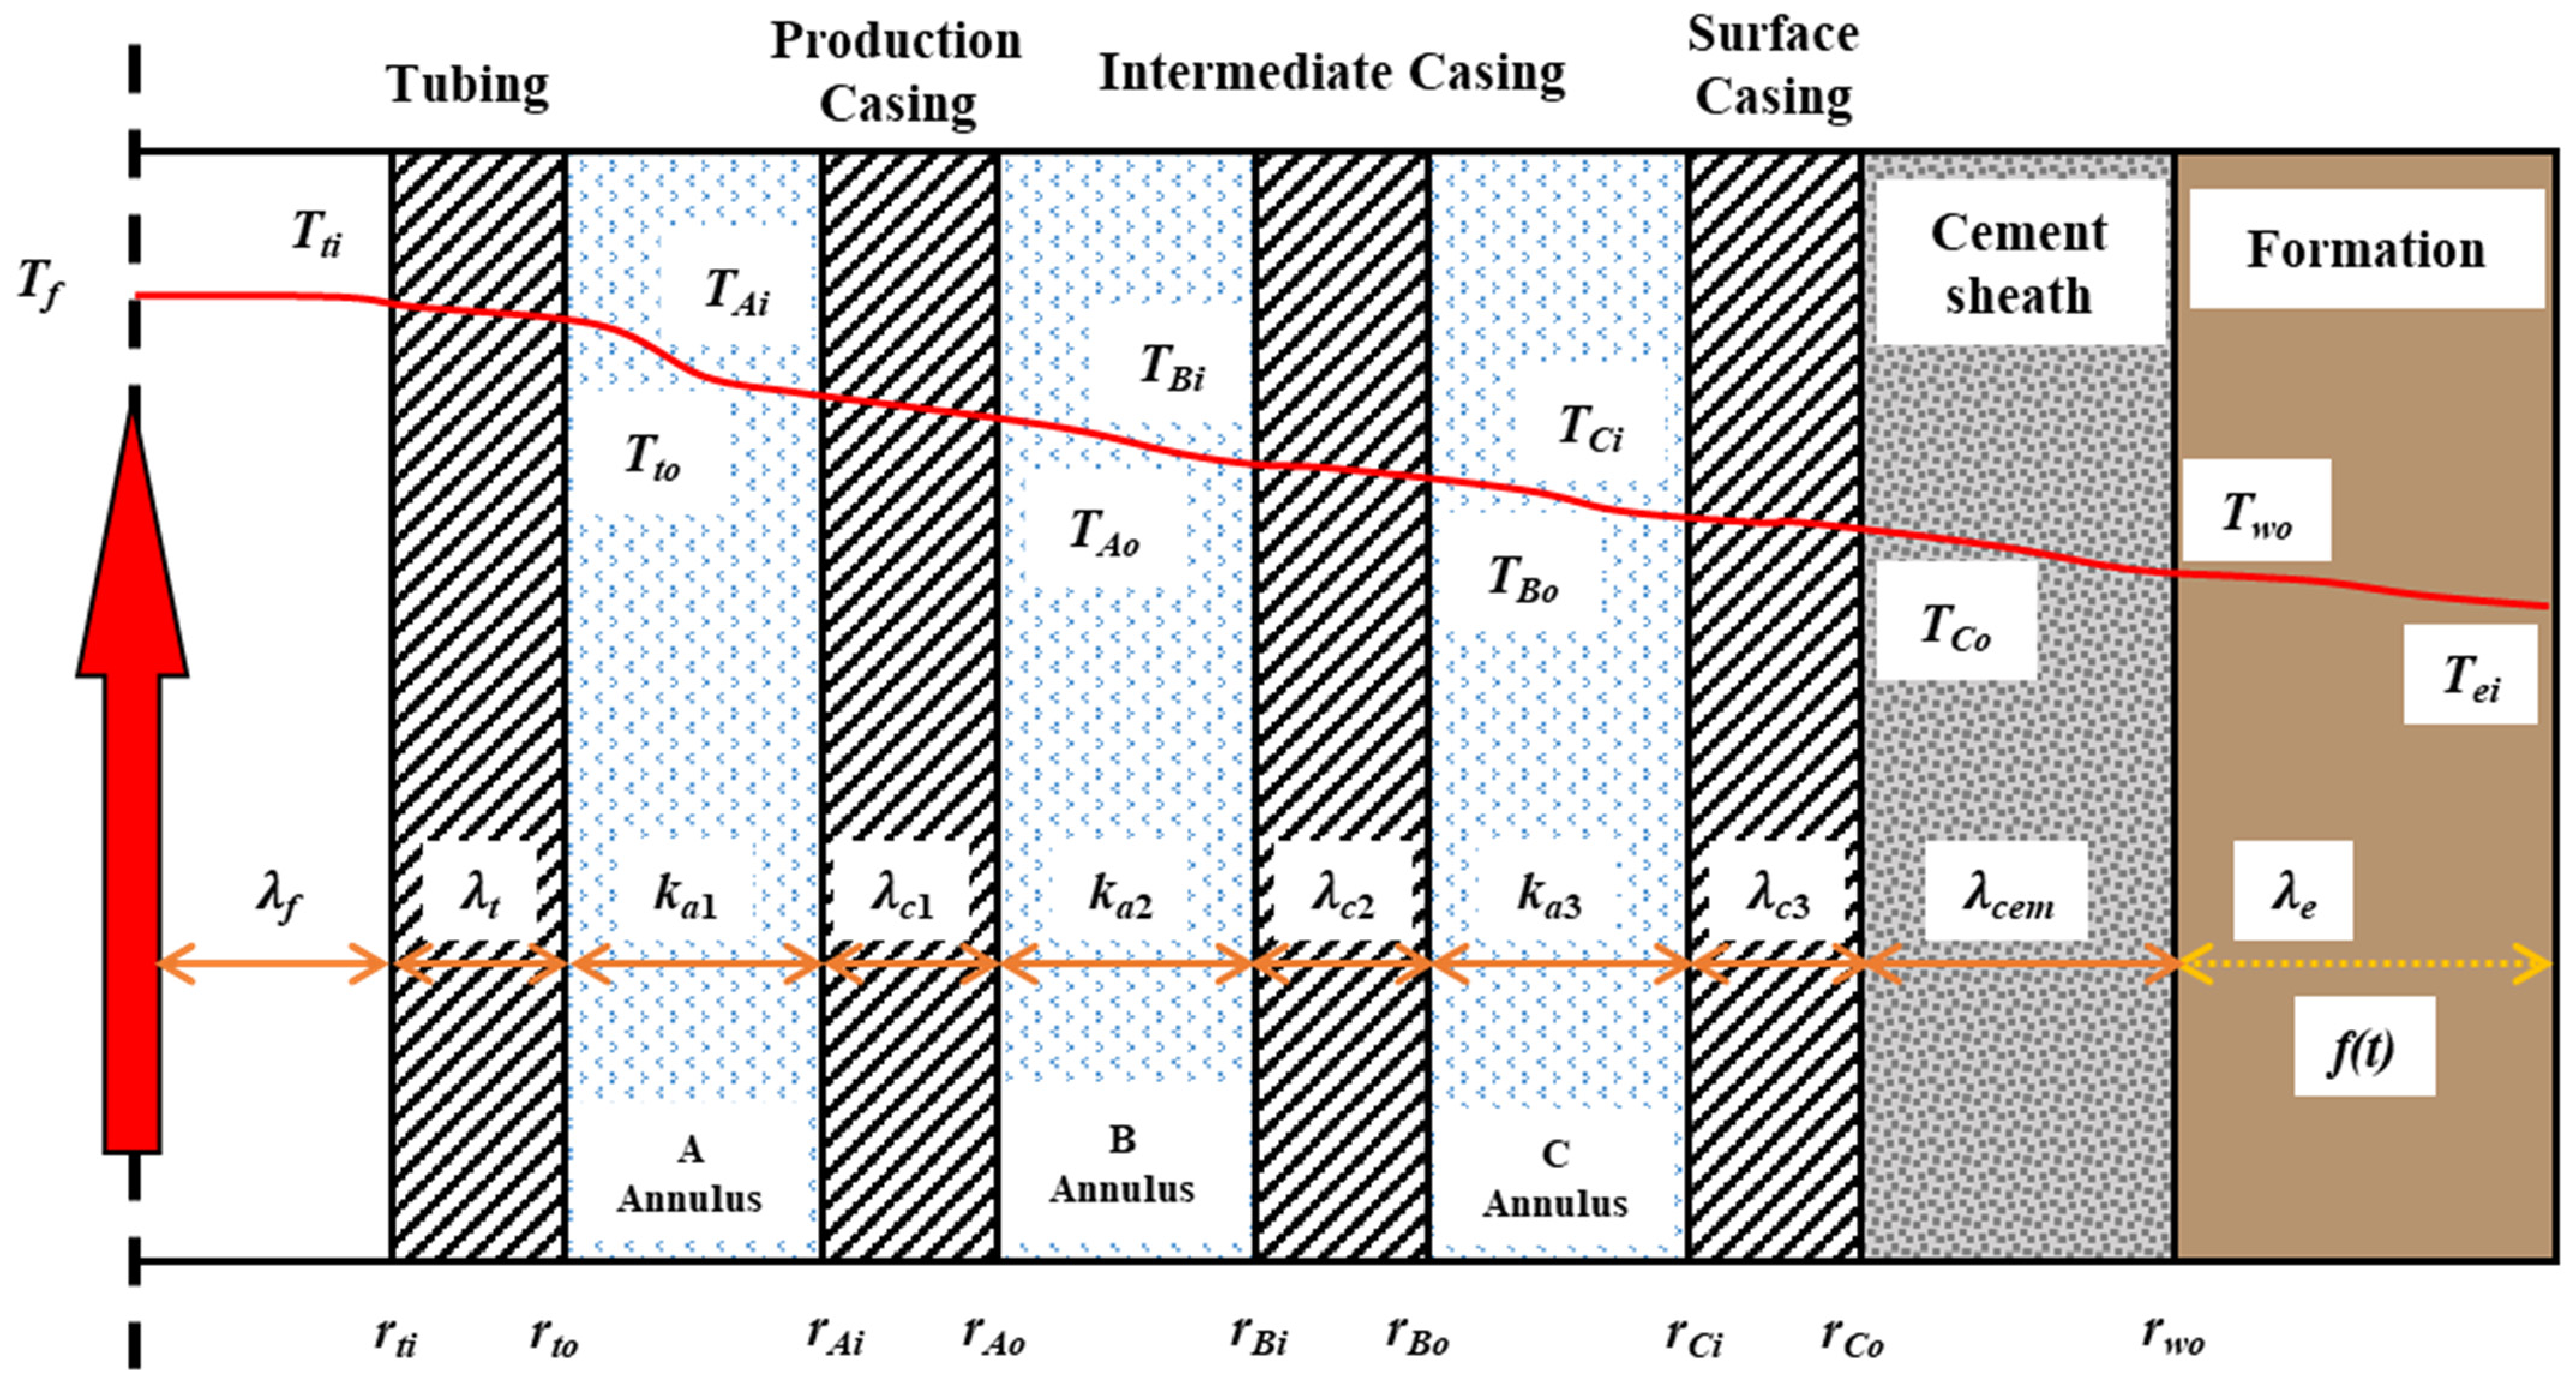
During production, high-temperature formation fluid enters the bottom of the wellbore and flows upward through the tubing to the wellhead. Vertically, heat is transferred from the bottom hole to the wellhead along with the formation fluid inside the tubing. Radially, heat is transferred from the high-temperature fluid in the tubing through the tubing wall to Annulus A, and then gradually transmitted outward to the production casing, Annulus B, intermediate casing, Annulus C, and the original formation. Before gas production, the temperature of the upper wellbore is lower than that of the reservoir. After production commences, the radial temperature distribution of the wellbore gradually decreases from the inner region to the outer region. Owing to differences in medium, heat transfer coefficient, component thickness, and heat transfer area at different positions, the temperature exhibits a nonlinear distribution along the wellbore radius, as shown in Figure 2.
To simplify the calculation, a heat transfer model is established taking Annulus A as an example; the models for other annuli can be established similarly. The assumptions are as follows [19,20]:
① The fluid flow in the wellbore is one-dimensional steady-state flow.
② All tubular strings in the wellbore are centered.
③ The heat transfer process from the tubing to the outer edge of the cement sheath is steady-state.
④ The heat transfer process from the outer edge of the cement sheath to the original formation is unsteady-state.
⑤ The axial heterogeneity of materials or media in each wellbore layer is neglected.
⑥ The heat transfer coefficient of each formation from the bottom hole to the surface is constant.
Under normal conditions, the thermal expansion coefficient and isothermal compressibility of annular fluid are strongly dependent on ambient temperature and pressure instead of being constant values. To facilitate numerical calculations in this work, these two parameters are simplified as constants. Such simplification may slightly increase prediction errors for deep formations, and extra caution is required when the model is applied to ultra-deep wells, which constitutes one of the key research directions for future investigations.
In practical underground gas storage (UGS) wells, heterogeneous characteristics may exist in axial materials and media across different wellbore layers. This homogenization assumption can alter heat conduction paths and the volumetric expansion of annular fluid, further leading to underestimated calculated annular pressure.
A steady-state assumption is adopted to approximate the production period for model simplification in this study; nevertheless, the cyclic injection-production of gas storage wells is inherently a transient process. Consequently, the pressure predicted by the proposed model corresponds to the stabilized value after reaching thermal–mechanical equilibrium under designated operation schedules rather than peak pressure.
According to thermodynamic laws and the principle of energy conservation [21,22], the heat transferred from the tubing string to the outer edge of the outer cement sheath at a certain depth is equal to the heat transferred from the outer edge of the outer cement sheath to the formation. The heat conservation formula is established as follows:
Q w = Q f Q w = 2 π r t o U t o   ( T f T w o ) Q f = 2 π λ e f ( t )   ( T w o T e i )
Uto in Equation (1) denotes the overall heat transfer coefficient defined by the total thermal resistance method. The heat flux is calculated by directly multiplying this coefficient by the temperature difference between fluid and outer surface of cement sheath (TfTwo), which is a standard simplification for steady-state heat transfer of multi-layer cylindrical walls. Its core assumptions lie in the fact that the radial thermal resistance of each layer is far larger than the axial heat conduction effect, and the average temperature difference of each layer can be adopted for approximate engineering calculation.
In which:
U t o = n = 1 3 r t o r a n k a n + j = 1 4 ( r t o ln r o j / r i j λ c j ) + m = 1 4 r t o ln r o m / r i m λ s m ) 1 T e i = T surf + g e h
where
Qw—Total heat flux transferred from the tubing string to the outer edge of the outer cement sheath, W/m;
Qf—Total heat flux transferred from the outer edge of the outer cement sheath to the formation, W/m;
rto—Outer radius of the tubing, m;
Uto—Total heat transfer coefficient from the tubing string to the outer edge of the outer cement sheath, W/(m2·°C);
Tf—Fluid temperature inside the tubing, °C;
Two—Temperature at the outer edge of the outer cement sheath, °C;
λe—Thermal conductivity of the formation, W/(m·°C);
rto—Outer radius of tubing string, m;
n—Annulus number from inside to outside;
ran—Distance from wellbore central axis to the outer edge of the n-th annulus, m;
kan—Heat transfer coefficient of the n-th annulus, W/(m·°C);
j—Casing string number from inside to outside;
roj & rij—Outer radius and inner radius of the j-th casing string, respectively, m;
λcj—Thermal conductivity of the j-th casing, W/(m·°C);
m—Cement sheath number from inside to outside;
rim & rom—Inner radius and outer radius of cement sheath, m;
f(t)—Dimensionless heat conduction time function of the formation;
Tei—Initial formation temperature, °C;
Tsurf—Surface temperature, °C;
ge—Geothermal gradient, °C/m;
h—Vertical depth, m.
Therefore, by combining Equations (1) and (2), the temperature at the outer edge of the wellbore cement sheath can be obtained as:
T wo = T e i λ e + T f r to U to f ( t ) λ e + r to U to f ( t )
The temperature of Annulus A can be derived as:
T A = T wo + r to U to λ A ln ( r w o / r o 1 ) ( T f T wo )
where:
TA—Temperature of Annulus A, °C;
λA—Thermal conductivity of fluid in Annulus A, W/(m·°C);
rwo—Radius from wellbore center to the outer edge of outer cement sheath, m;
ro1—Outer radius of the first casing (production casing), m.
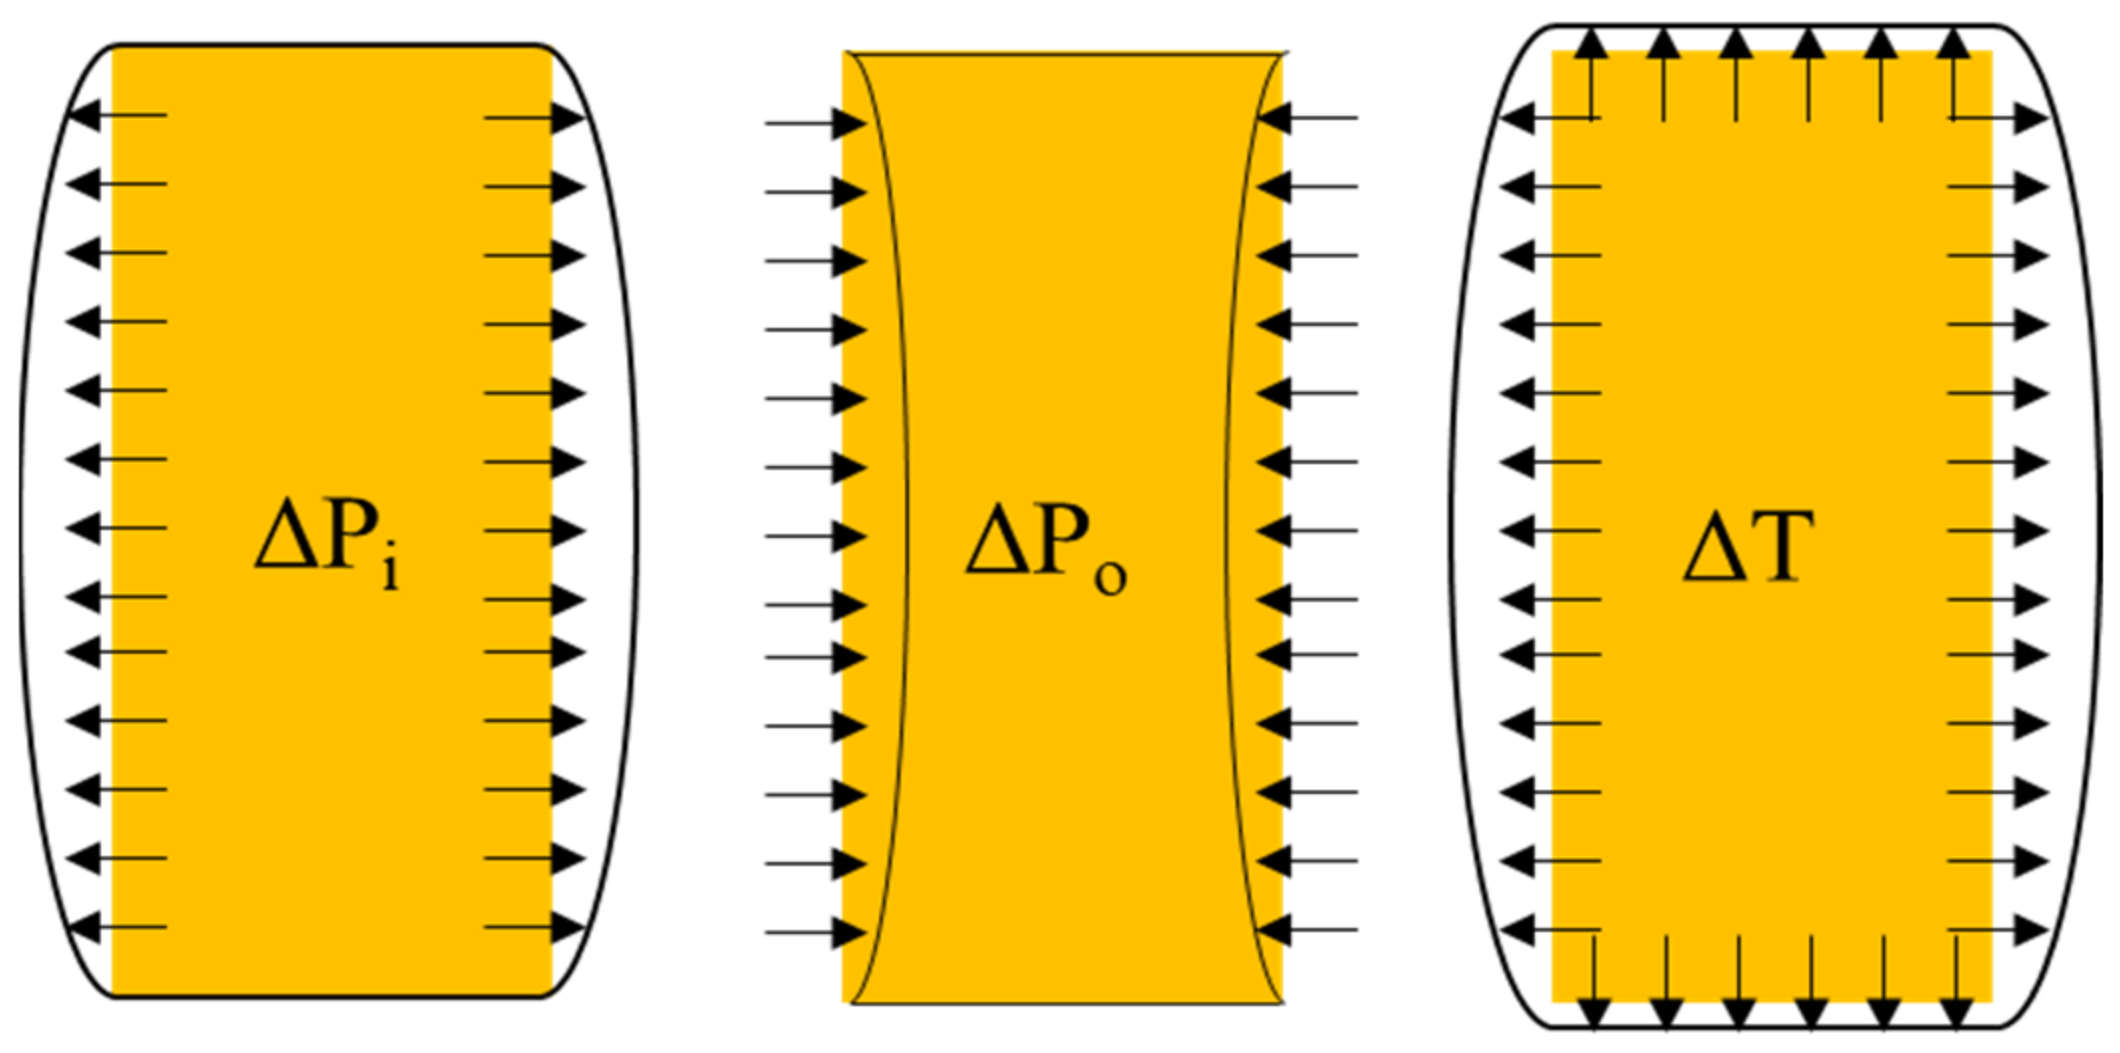
On the basis of the above wellbore temperature calculation method, the variation in trapped annular pressure caused by temperature change is further investigated [23]. Subjected to internal pressure, the tubing string expands outward with increased diameter and bulk volume. Conversely, the tubing is compressed inward with reduced diameter and volume under annular pressure loading. A rise in the temperature of the tubing’s internal fluid triggers both radial and axial thermal expansion of the tubing string, as illustrated in Figure 3.
According to the linear elastic theory of materials, the expression for the radius variation ΔDP of the tubing caused by expansion or contraction under the change in internal and external pressure difference is given as:
Δ D P = ( 1 + v ) D i 2 E ( D o 2 D i 2 ) ( 1 2 v ) D o + 1 Δ P i ( 1 + v ) D o 2 E ( D o 2 D i 2 ) ( 1 2 v ) D o + D i 2 D o 2 Δ P o
where:
ΔDP—Radius variation in tubing caused by internal and external pressure difference, m;
v—Poisson’s ratio of tubing, dimensionless;
Di—Inner radius of tubing, m;
E—Young’s modulus of tubing, GPa;
Do—Outer diameter of tubing, m;
ΔPi—Variation in internal tubing pressure, MPa;
ΔPo—Variation in annular pressure, MPa.
It is defined that the radius increase caused by outward expansion of the tubing due to the rise in internal and external pressure difference is taken as the positive direction, while the radius reduction caused by inward contraction due to the decrease in pressure difference is regarded as the negative direction. Accordingly, the first term in the above formula is positive, and the second term is negative.
Based on the fluid thermal expansion effect, compression effect and ideal gas state equation, the expression for the annular volume variation ΔVA caused by annular temperature change can be derived as:
Δ V A = Δ V A T Δ V A P + Δ V A Z
where:
Δ V A T = V H β t Δ T Δ V A P = V H β p Δ P o Δ V A Z = ( T + T ) p T O ( p + p ) 1 L N S A
ΔVA—Total volume variation in the annulus, m3;
ΔVAT—Volume variation in annular protection fluid caused by wellbore temperature change, m3;
ΔVAP—Volume variation in annular protection fluid caused by pressure change in Annulus A, m3;
ΔVAZ—Volume variation in annular gas induced by temperature and pressure changes based on the ideal gas state equation, m3; this item can be omitted if no gas exists in the annulus;
VH—Volume of annular protection fluid, m3;
βt—Thermal expansion coefficient of annular protection fluid, °C−1;
ΔT—Temperature variation, °C;
βp—Compressibility coefficient of annular protection fluid, MPa−1;
To—Initial annulus temperature, °C;
p—Initial annulus pressure, MPa.
Based on the total volume variation in the annulus, the tubing radius variation ΔDA affected by the volume change in annular fluid can be calculated as:
D A = D o 2 4 Δ V A π L m D o
where:
ΔDA—Tubing radius variation under the influence of fluid volume change in the annulus, m;
Lm—Setting depth of the packer, m.
According to the material thermal expansion theory, the expression for the tubing radius variation ΔDT caused by tubing temperature change is as follows:
Δ D T = α T ( 1 + v ) ( 1 v ) D o 2 D i 2 2 D o
where:
ΔDT—Tubing radius variation induced by tubing temperature change, m;
α—Thermal expansion coefficient of tubing, °C−1.
Assuming that during the variation in temperature and pressure, the tubing radius variation is only affected by three components of ΔDP, ΔDA and ΔDT. When the system reaches a steady state, the radius variations caused by annular fluid volume change and tubing self-volume change are equal in magnitude and opposite in direction. That is, after a certain time increment Δt the sum of ΔDP, ΔDA and ΔDT is exactly equal to zero.
Δ D P + Δ D A + Δ D T = 0
Substituting each term into the above formula and simplifying, the final pressure variation ΔPo of Annulus A can be obtained as:
Δ P o = ( 1 + v ) α T ( 1 v ) D o / 2 D o 2 D i 2 2 D o + D o 2 4 ( V H β t T V H β p P o + V A Z ) π L m ( 1 + v ) D o 2 E ( D o 2 D i 2 ) ( 1 2 v ) D o + D i 2 D o 2 + ( 1 + v )   D i 2 E ( D o 2 D i 2 ) ( 1 2 v )   D o + D i 2 D o 2 Δ P i ( 1 + v )   D i 2 E ( D o 2 D i 2 ) ( 1 2 v )   D o + D i 2 D o 2
where:
V A Z = T + T T p L N S A p + p o L N S A
where:
ΔPo—Final pressure variation in Annulus A, MPa;
LN—Length of gas column inside the annulus, m.
When solving the above calculation model, set ΔPo to 0 initially to calculate ΔVA, then substitute the result to obtain a new ΔPo. The iterative method is adopted for subsequent calculation until the result converges to a stable state. The fixed-point iterative formulation is expressed as P 0 ( K + 1 ) = f ( P 0 ( K ) ) . A relaxation factor of 0.5 is used to accelerate convergence, with the convergence tolerance set to 10−4 MPa and the initial iteration value assigned as P 0 ( 0 ) = 0 .

2.2. Model Verification

To verify the applicability of the established model, a well from a North China gas storage is selected as the case well. The case well is a vertical well with a total depth of 5250 m and a normal temperature-pressure system. The measured bottomhole temperature at a depth of 4990 m is 155.46 °C, and the bottomhole pressure is 37.58 MPa. All remaining relevant parameters of the present model are directly derived from the original design data and geological information of the case well. The established pressure calculation model is adopted for the calculation of the case well. The calculated results are compared with the field-measured pressure data, and the error and coincidence rate of the results are presented in Table 1.
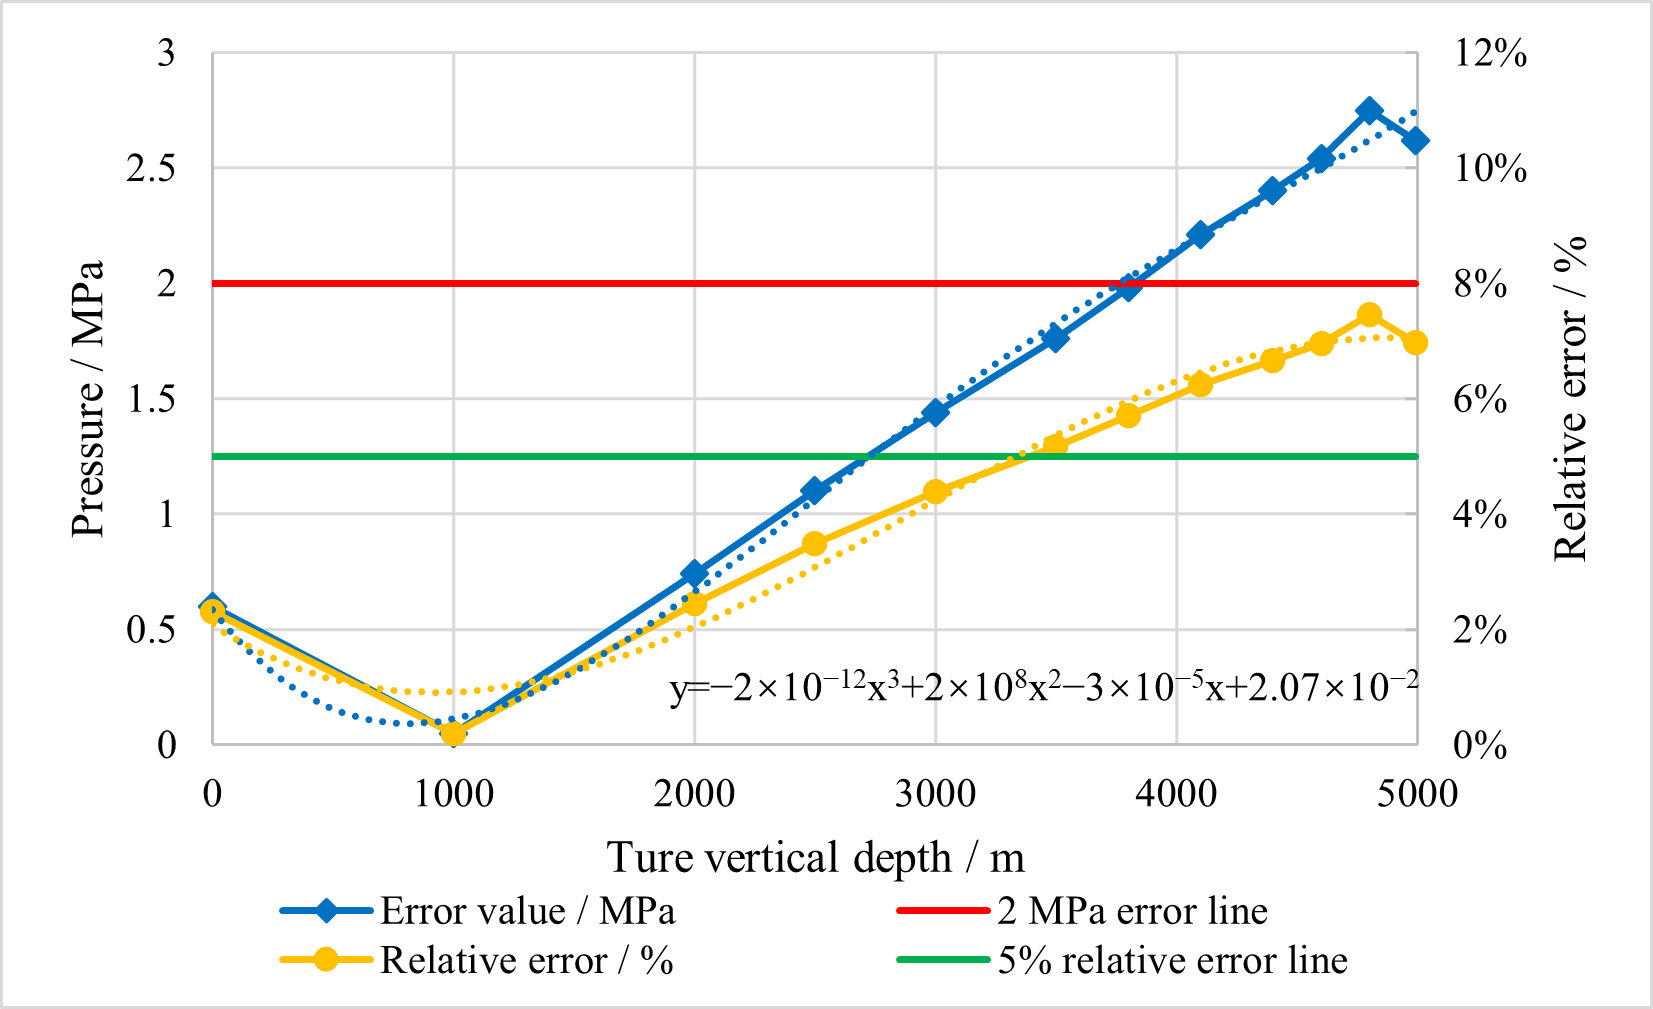
It can be seen from Table 1 that compared with the field-measured pressure data, the wellbore pressure calculated by the mathematical model established above presents the minimum error in the upper wellbore, and the error generally increases gradually along the well depth direction. The maximum prediction error occurs at a well depth of approximately 4800 m, with an absolute error of 2.75 MPa and a relative error of 7.46%. The minimum error appears at about 1000 m, with an absolute error of 0.05 MPa and a relative error of 0.19%. According to the statistical results, the average relative error is 4.83%, corresponding to a coincidence rate of 95.17%. Overall, the calculation results of the established model show high agreement with field measurements, which verifies that the model possesses favorable engineering applicability.
It is noteworthy that the relative error of predicted pressure rises with increasing well depth. This phenomenon can be attributed to the limitations introduced by two simplifications: the constant-fluid-property assumption, which fixes the fluid thermal expansion coefficient and isothermal compressibility as constants despite their inherent dependence on temperature and pressure, and the neglect of mechanical deformation of the cement sheath. In reality, cement sheath suffers from mechanical behaviors such as micro-damage and creep under high-temperature, high-pressure and alternating cyclic loads. In addition, complicated transient heat transfer between the wellbore and formation becomes more prominent at greater depths under the combined effects of the above factors, as shown in Figure 4.
In Figure 4, the horizontal red line corresponds to an absolute pressure of 2 MPa. Where the absolute error curve lies above this red line, the absolute deviation between calculated and measured wellbore pressure exceeds 2 MPa at the corresponding depth. The horizontal green line denotes a relative error of 5%; when the relative error curve rises above the green line, the relative discrepancy between predicted and field-measured wellbore pressure is greater than 5% at that depth interval.

3. Analysis on Influencing Factors of Trapped Annular Pressure in Gas Storage Wells

To further investigate the influence of the law of wellbore trapped annular pressure, based on the mathematical calculation model established above, parametric analyses are carried out to clarify the effects of tubing outer diameter, tubing wall thickness, thermal expansion coefficient and isothermal compression coefficient of annular fluid, thermal expansion coefficient of casing material, daily gas production and other factors on trapped annular pressure.

3.1. Influence Law of Tubing Dimension

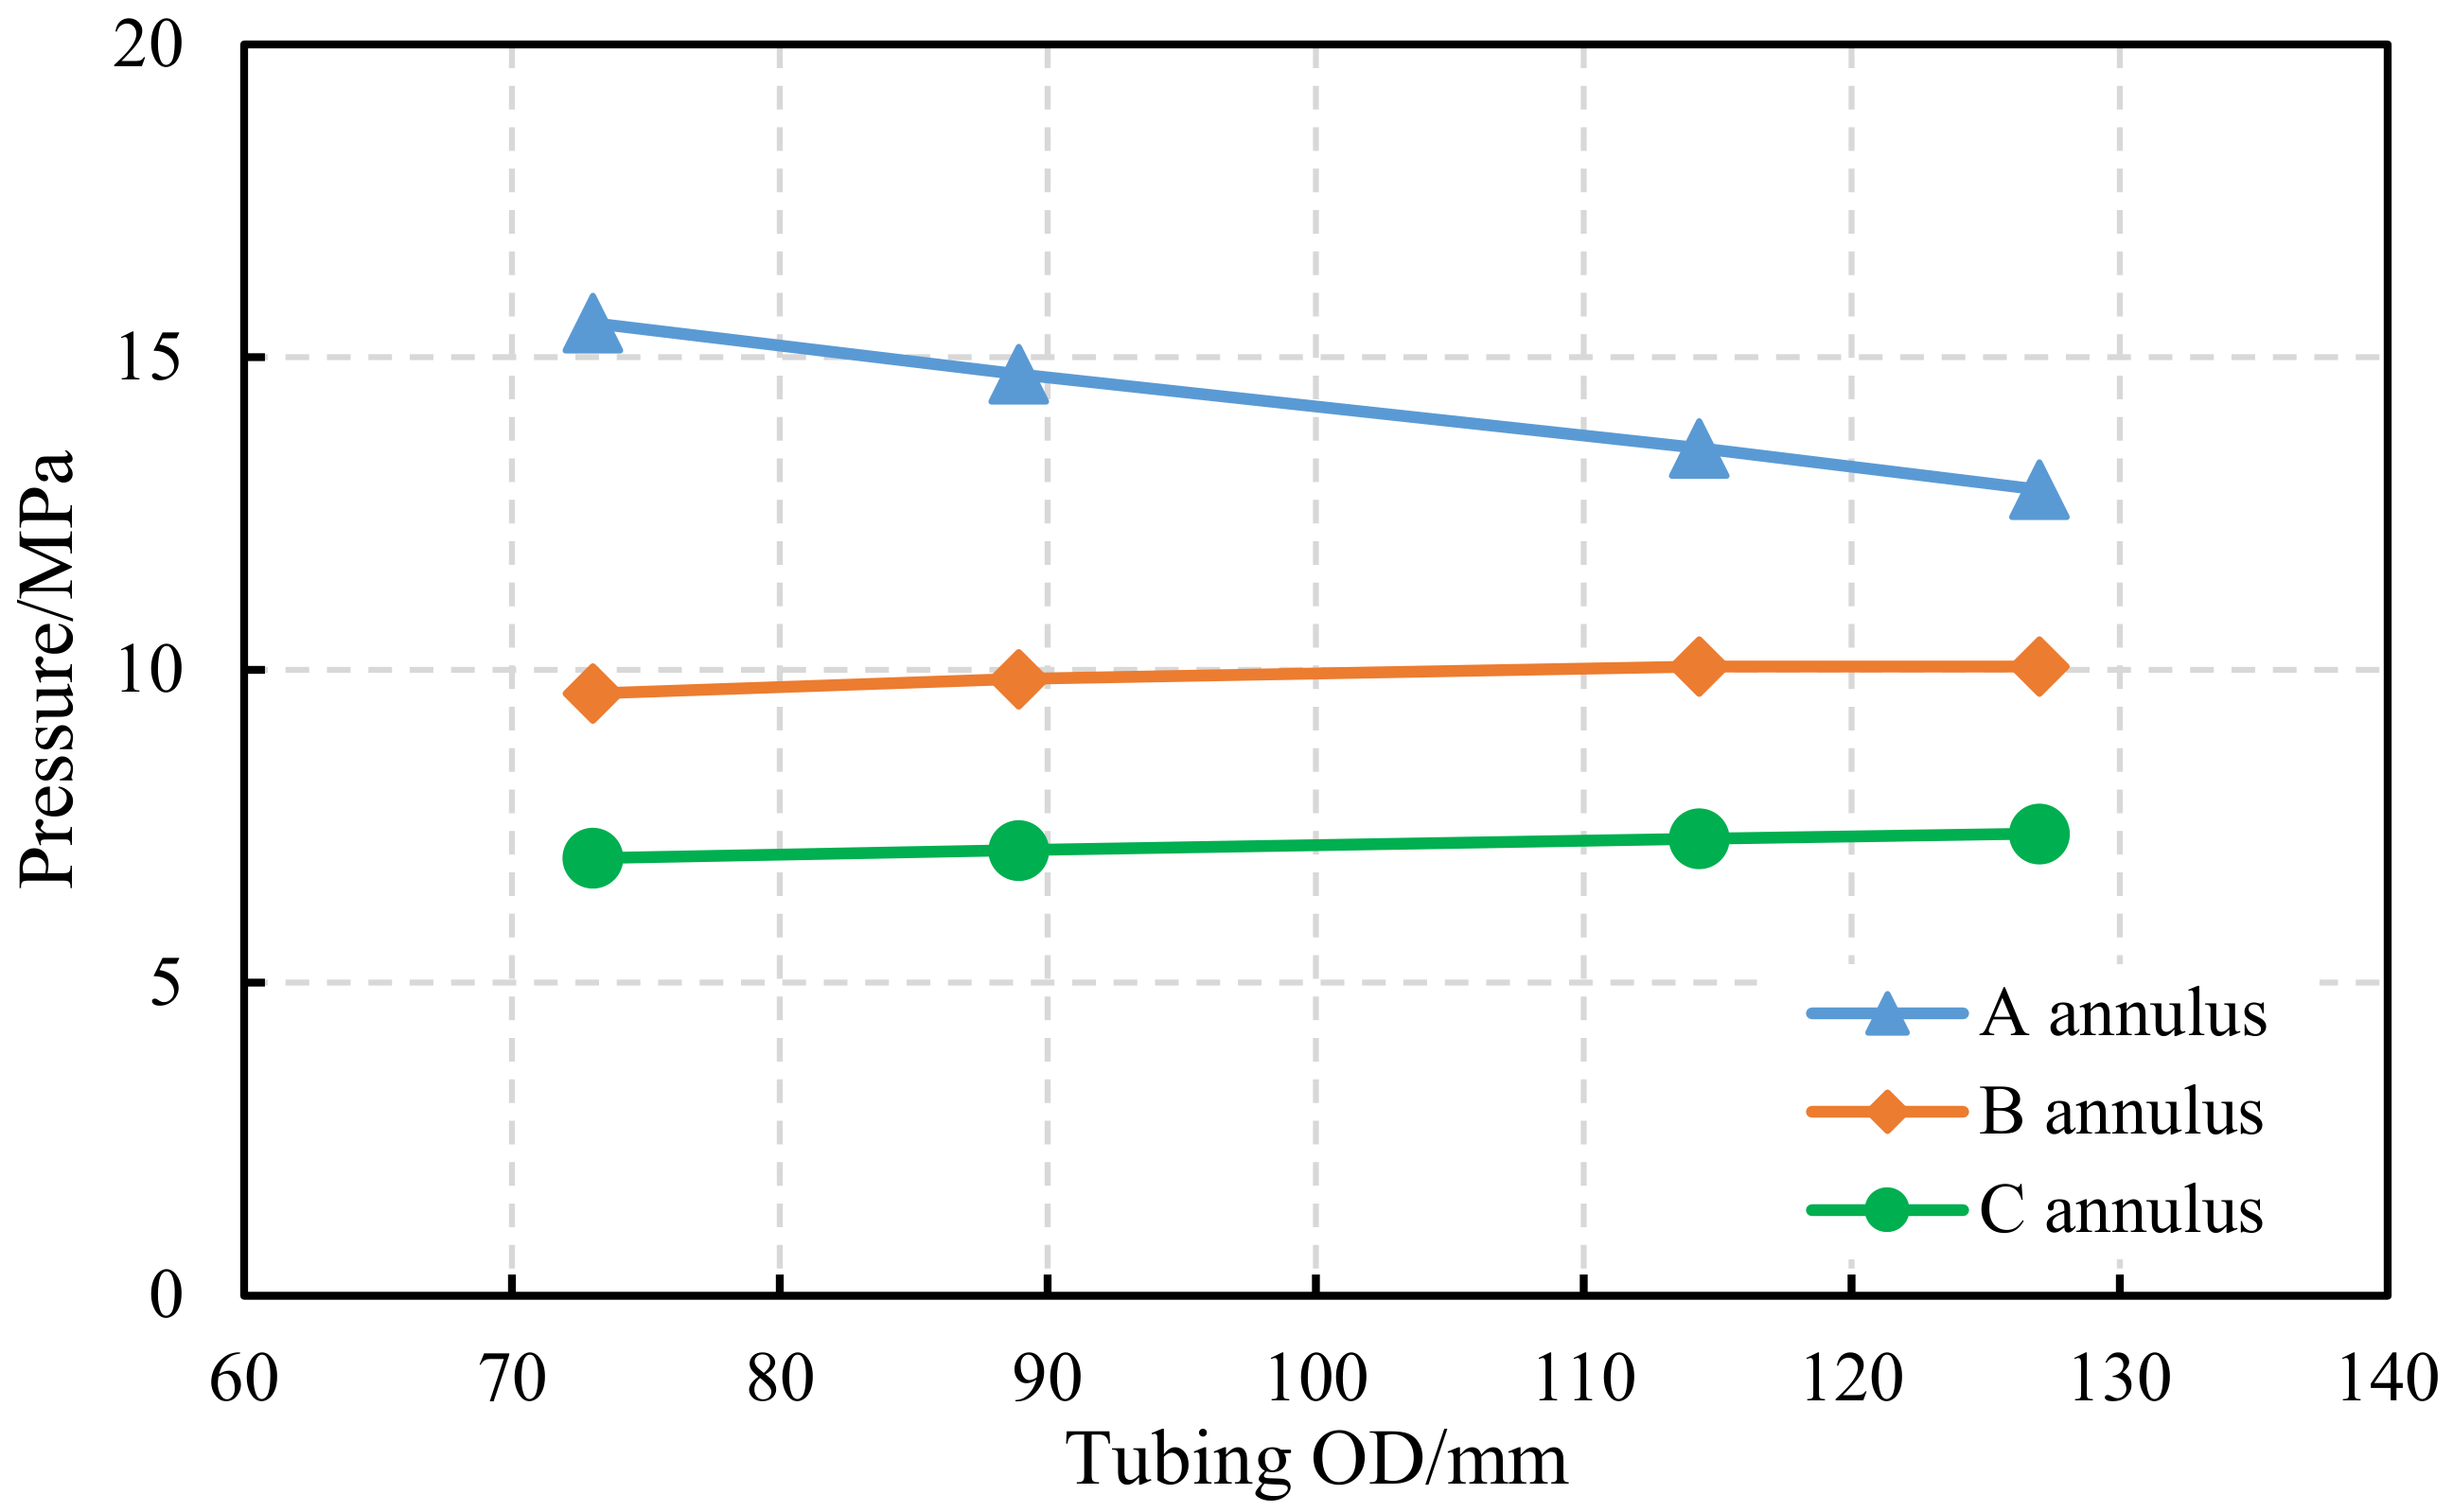
Taking four commonly used tubing sizes with outer diameters of 73.02 mm, 88.90 mm, 114.30 mm and 127 mm as research objects, under unchanged other conditions, a larger tubing outer diameter corresponds to a smaller induced trapped annular pressure. Further analysis indicates the main mechanism: with the increase in tubing outer diameter, the flow velocity of fluid in Annulus A decreases, leading to more heat dissipation during heat transfer. Consequently, the volume variation caused by thermal expansion is weakened, and the corresponding trapped pressure decreases significantly. When the tubing outer diameter increases by 74%, the trapped pressure of Annulus A decreases by 2.66 MPa, with a reduction ratio of 17%.
Adjacent to Annulus A, Annulus B is also affected to a certain extent by thermal transfer, and its trapped pressure declines as the tubing outer diameter increases. As the outermost annulus, Annulus C is farther away from Annulus A; thus, the influence of tubing outer diameter on its trapped pressure is rather limited, with a pressure variation of less than 1 MPa. The detailed results are shown in Figure 5.
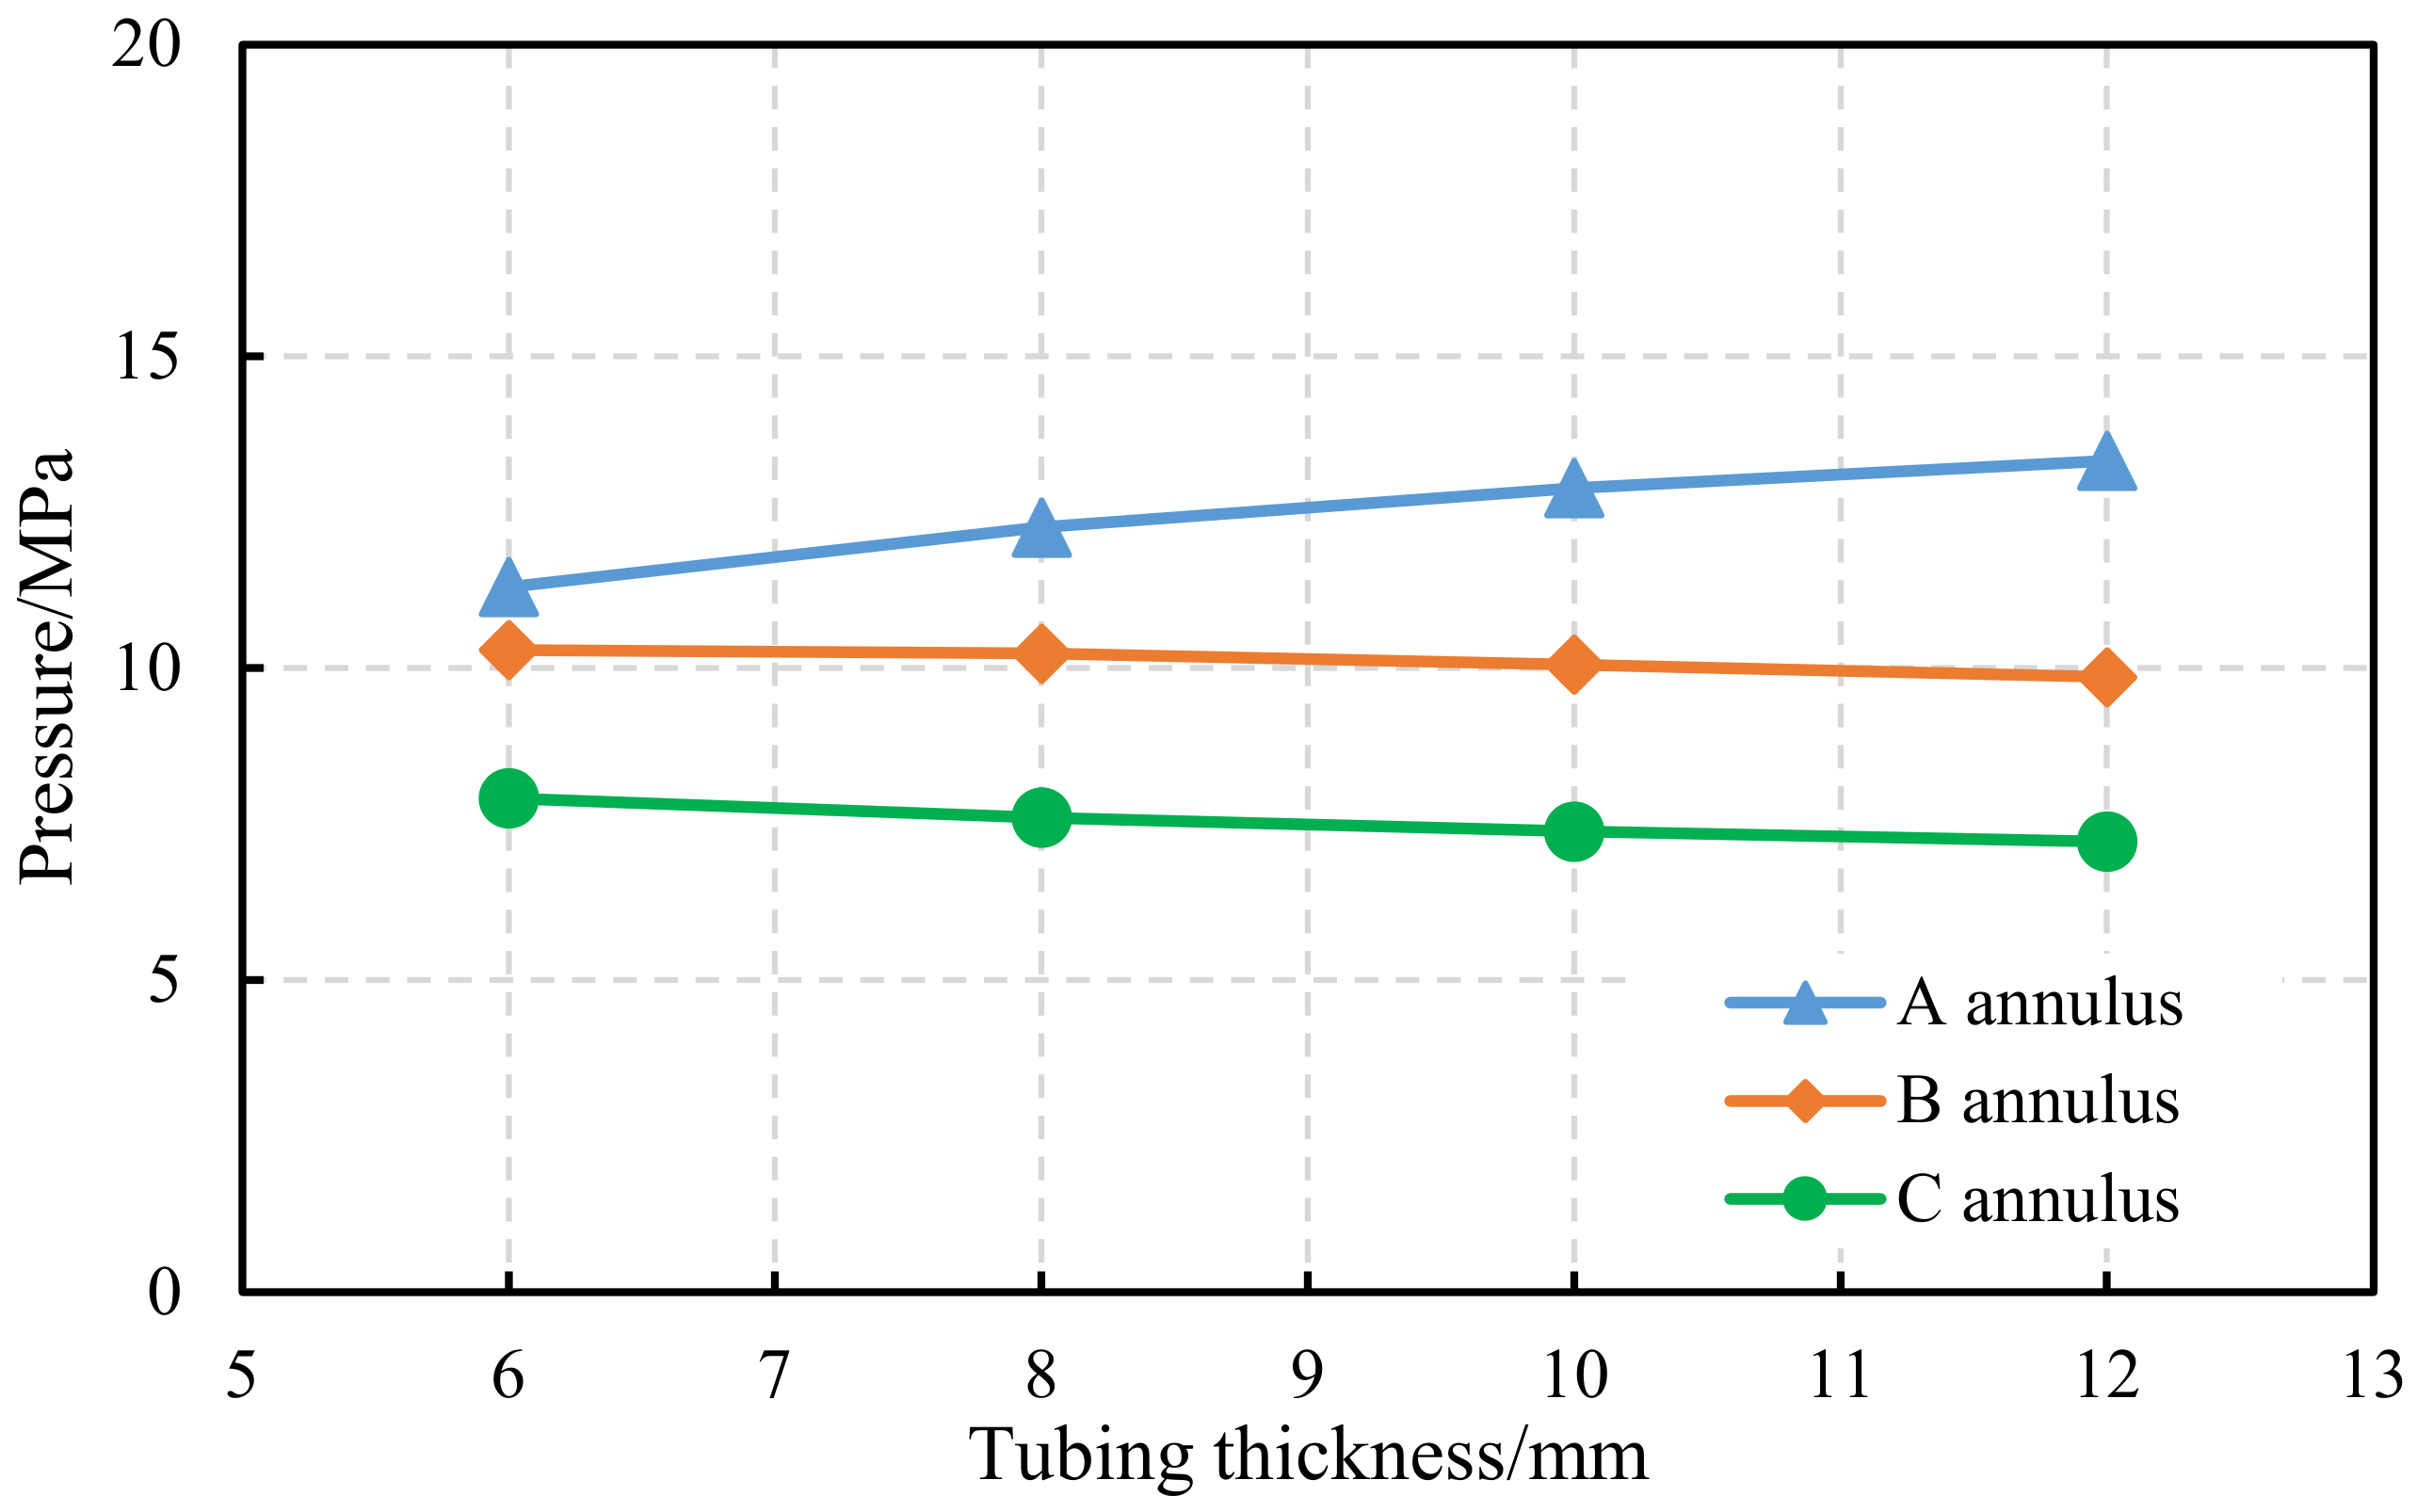
Taking N80 tubing with an outer diameter of Φ88.90 mm as the research object, calculations are performed under constant production and other conditions by selecting tubing with different wall thicknesses. The results show that the trapped pressure in Annulus A increases with the rise in tubing wall thickness, while the increasing amplitude gradually slows down. When the tubing wall thickness increases by 8 mm, the trapped pressure rises by 2.3 MPa.
Further analysis reveals the underlying mechanism: a larger tubing wall thickness accelerates the flow velocity of internal fluid and increases the total heat transferred to the annular fluid, which enhances the thermal expansion effect of Annulus A and consequently raises the trapped annular pressure. With the increase in tubing wall thickness, the trapped pressure in Annulus B decreases slightly, with a total reduction in only 0.6 MPa. Annulus C presents a similar variation trend to Annulus B. The relevant results are illustrated in Figure 6.

3.2. Influence Law of Annular Fluid Properties

In general, restricted by construction difficulty for gas storage wells, the residual fluid in the annulus is mainly liquid without adopting special technologies, and different liquids possess obviously distinct physical properties. Therefore, to quantitatively investigate its influence on trapped pressure, the trapped annular pressures under different thermal expansion coefficients and isothermal compression coefficients of annular fluid are calculated, respectively.
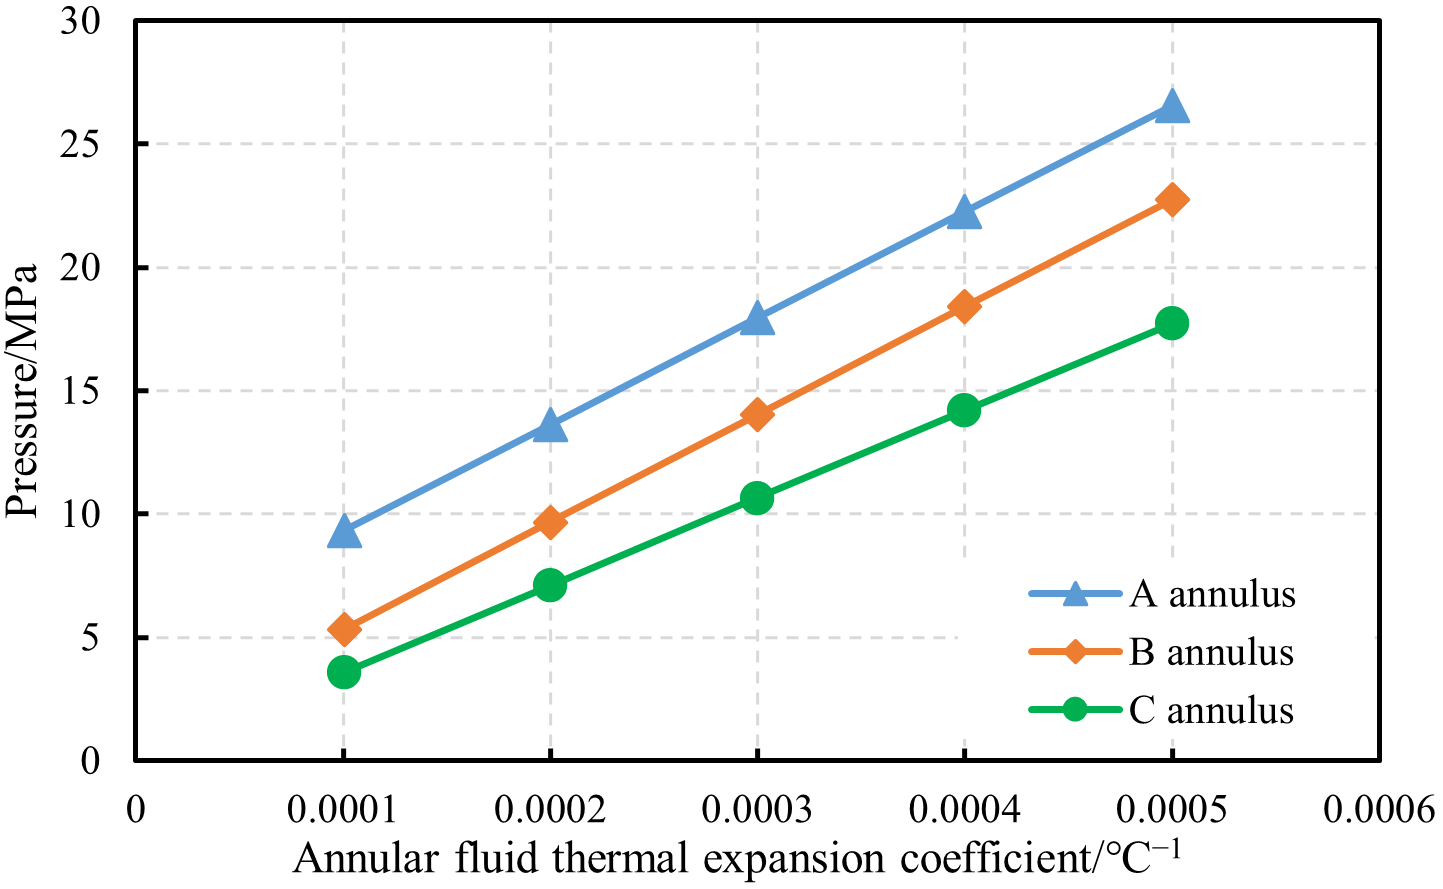
The thermal expansion coefficient of fluid characterizes its thermal expansion capacity; a larger thermal expansion coefficient means a stronger volume variation ability under temperature rise. For Annulus A, the trapped annular pressure increases with the rise in thermal expansion coefficient, presenting an approximately linear positive correlation. That is, a larger thermal expansion coefficient leads to a greater fluid volume variation under the same temperature increment. Other annuli show a similar variation law and also follow an approximate positive proportional relationship with the thermal expansion coefficient.
In addition, even a small variation in the fluid thermal expansion coefficient can cause a remarkable rise in trapped annular pressure. When the thermal expansion coefficient increases by 0.0004 °C−1, the trapped pressure of Annulus A rises by 17.24 MPa, that of Annulus B increases by 17.46 MPa, and that of Annulus C grows by 14.12 MPa. Under the same thermal expansion coefficient, the trapped pressure is the highest in Annulus A, followed by Annulus B, and the lowest in Annulus C. The detailed results are shown in Figure 7.
The isothermal compression coefficient of fluid reflects its deformation capacity under pressure. A smaller isothermal compression coefficient indicates that the fluid is less prone to being compressed under a certain pressure. For Annulus A, the isothermal compression coefficient of annular fluid is approximately linearly inversely proportional to the trapped annular pressure; that is, a larger isothermal compression coefficient results in a smaller fluid volume variation under the same temperature increment. Other annuli exhibit a similar variation trend and also follow an approximate inverse proportional relationship with the isothermal compression coefficient.
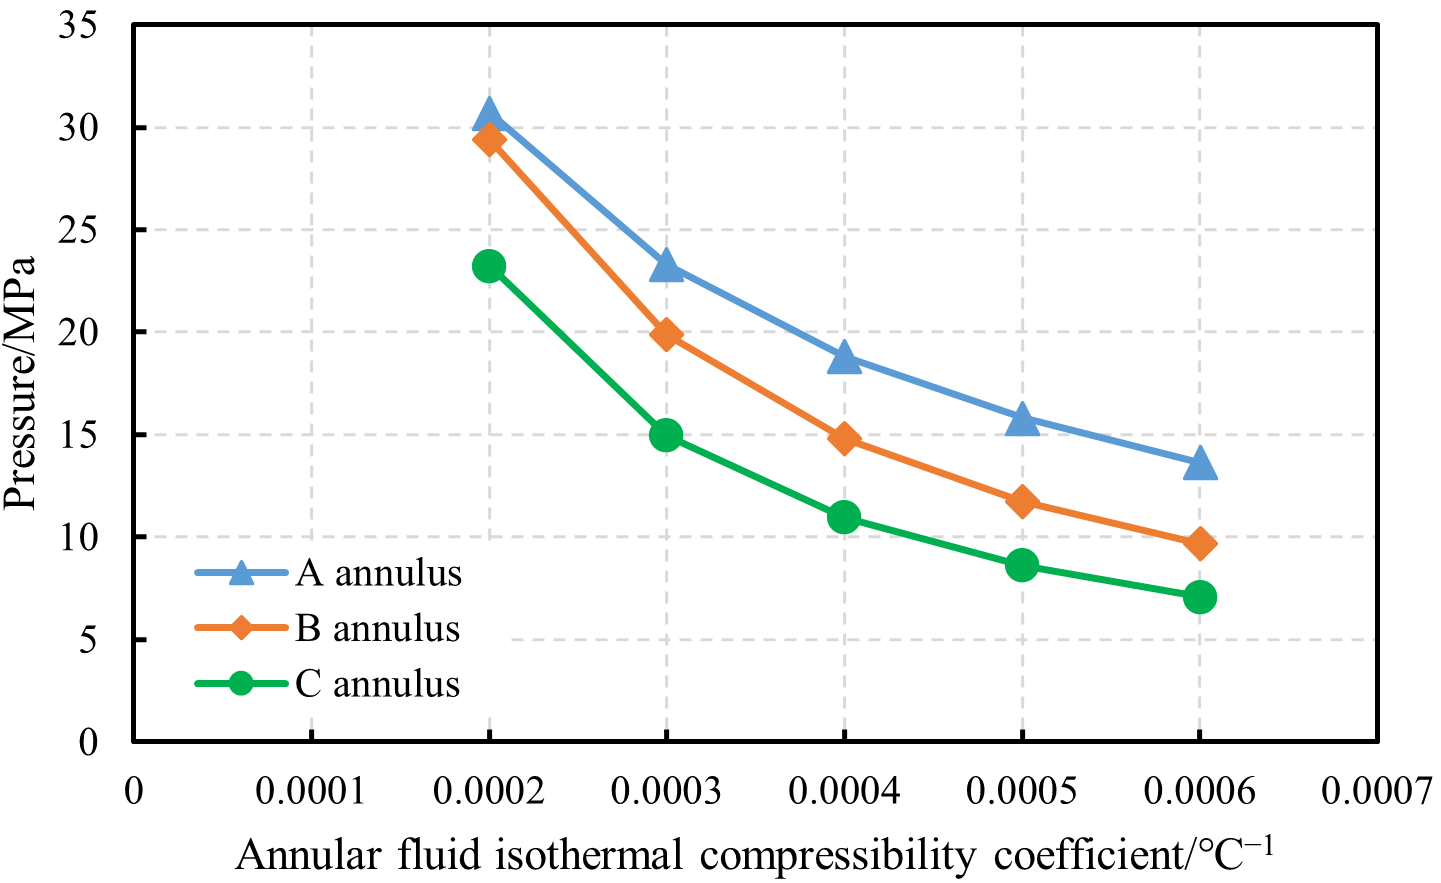
Moreover, even a slight change in the isothermal compression coefficient can lead to an obvious reduction in trapped annular pressure. When the isothermal compression coefficient increases by 0.0004 MPa−1, the trapped pressure of Annulus A decreases by 17.07 MPa, Annulus B by 19.70 MPa, and Annulus C by 16.12 MPa. Under the same isothermal compression coefficient, the trapped pressure is the highest in Annulus A, followed by Annulus B, and the lowest in Annulus C. The detailed results are presented in Figure 8.
Variation in annular pressure is governed by the net difference between two opposing physical effects: fluid thermal expansion and fluid compressibility. In the present parametric analysis, the pressure increment induced by rising thermal expansion coefficient and the pressure reduction resulting from elevated isothermal compressibility are comparable in magnitude (approximately 17 MPa for both), yet their underlying physical mechanisms differ fundamentally. The thermal expansion effect is predominantly proportional to temperature variation, whereas the compression effect is correlated with pressure fluctuation. Accordingly, these two effects are not mathematically symmetric and only exhibit similar magnitudes within the parameter range adopted for this calculation case.
In summary, the compressibility coefficient and thermal expansion coefficient of annular fluid exert a significant influence on trapped annular pressure. Therefore, the trapped pressure can be greatly reduced by optimizing the physicochemical properties of annular fluid.

3.3. Influence Law of Casing Performance Parameters

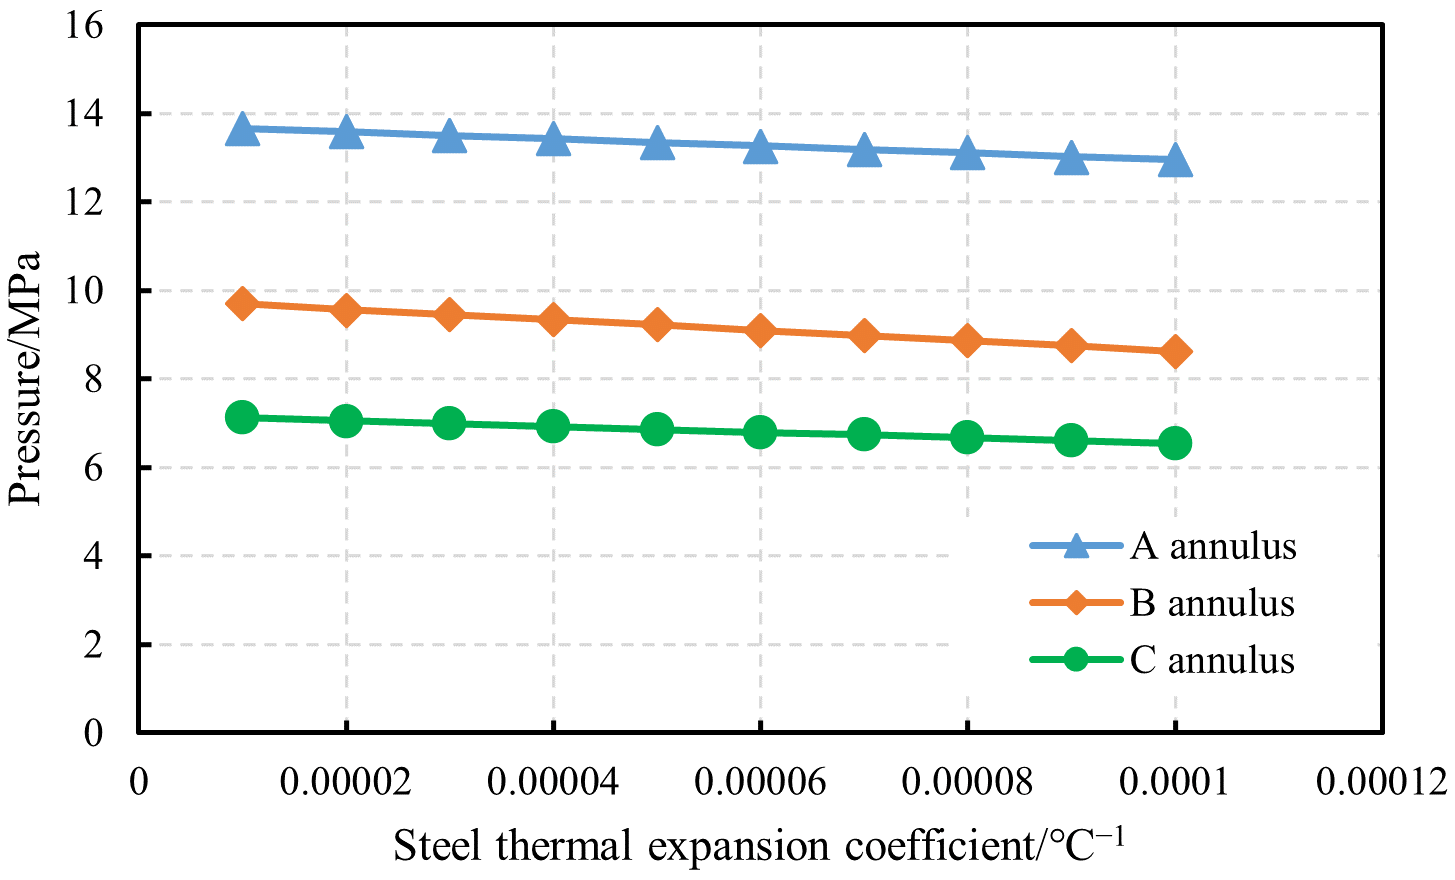
Casing materials downhole differ in thermal expansion coefficient, elastic modulus and Poisson’s ratio. The casing thermal expansion coefficient can affect the volumes of casing and annulus, thereby changing the trapped annular pressure. For Annulus A, under constant other conditions, the trapped annular pressure gradually decreases with the increase in casing thermal expansion coefficient. Annulus B and Annulus C show a similar variation trend and present an approximate inverse proportional relationship with the casing thermal expansion coefficient.
Furthermore, even a large variation in casing thermal expansion coefficient only leads to an insignificant change in trapped annular pressure. When the casing thermal expansion coefficient increases by 10 times, the trapped pressure of Annulus A decreases by merely 0.70 MPa, Annulus B by 1.07 MPa, and Annulus C by 0.58 MPa. Under the same casing thermal expansion coefficient, the trapped pressure ranks as Annulus A > Annulus B > Annulus C. The detailed results are shown in Figure 9.
In addition, numerical calculation by assigning different values to Young’s modulus and Poisson’s ratio of casing shows that both parameters have an extremely slight effect on trapped annular pressure. When the casing Young’s modulus increases by 30 GPa, the trapped pressure variations in Annulus A, B and C are all approximately 0.1 MPa. When the casing Poisson’s ratio increases by 4 times, the pressure variations in the three annuli are also around 0.1 MPa.

3.4. Influence Law of Daily Gas Production
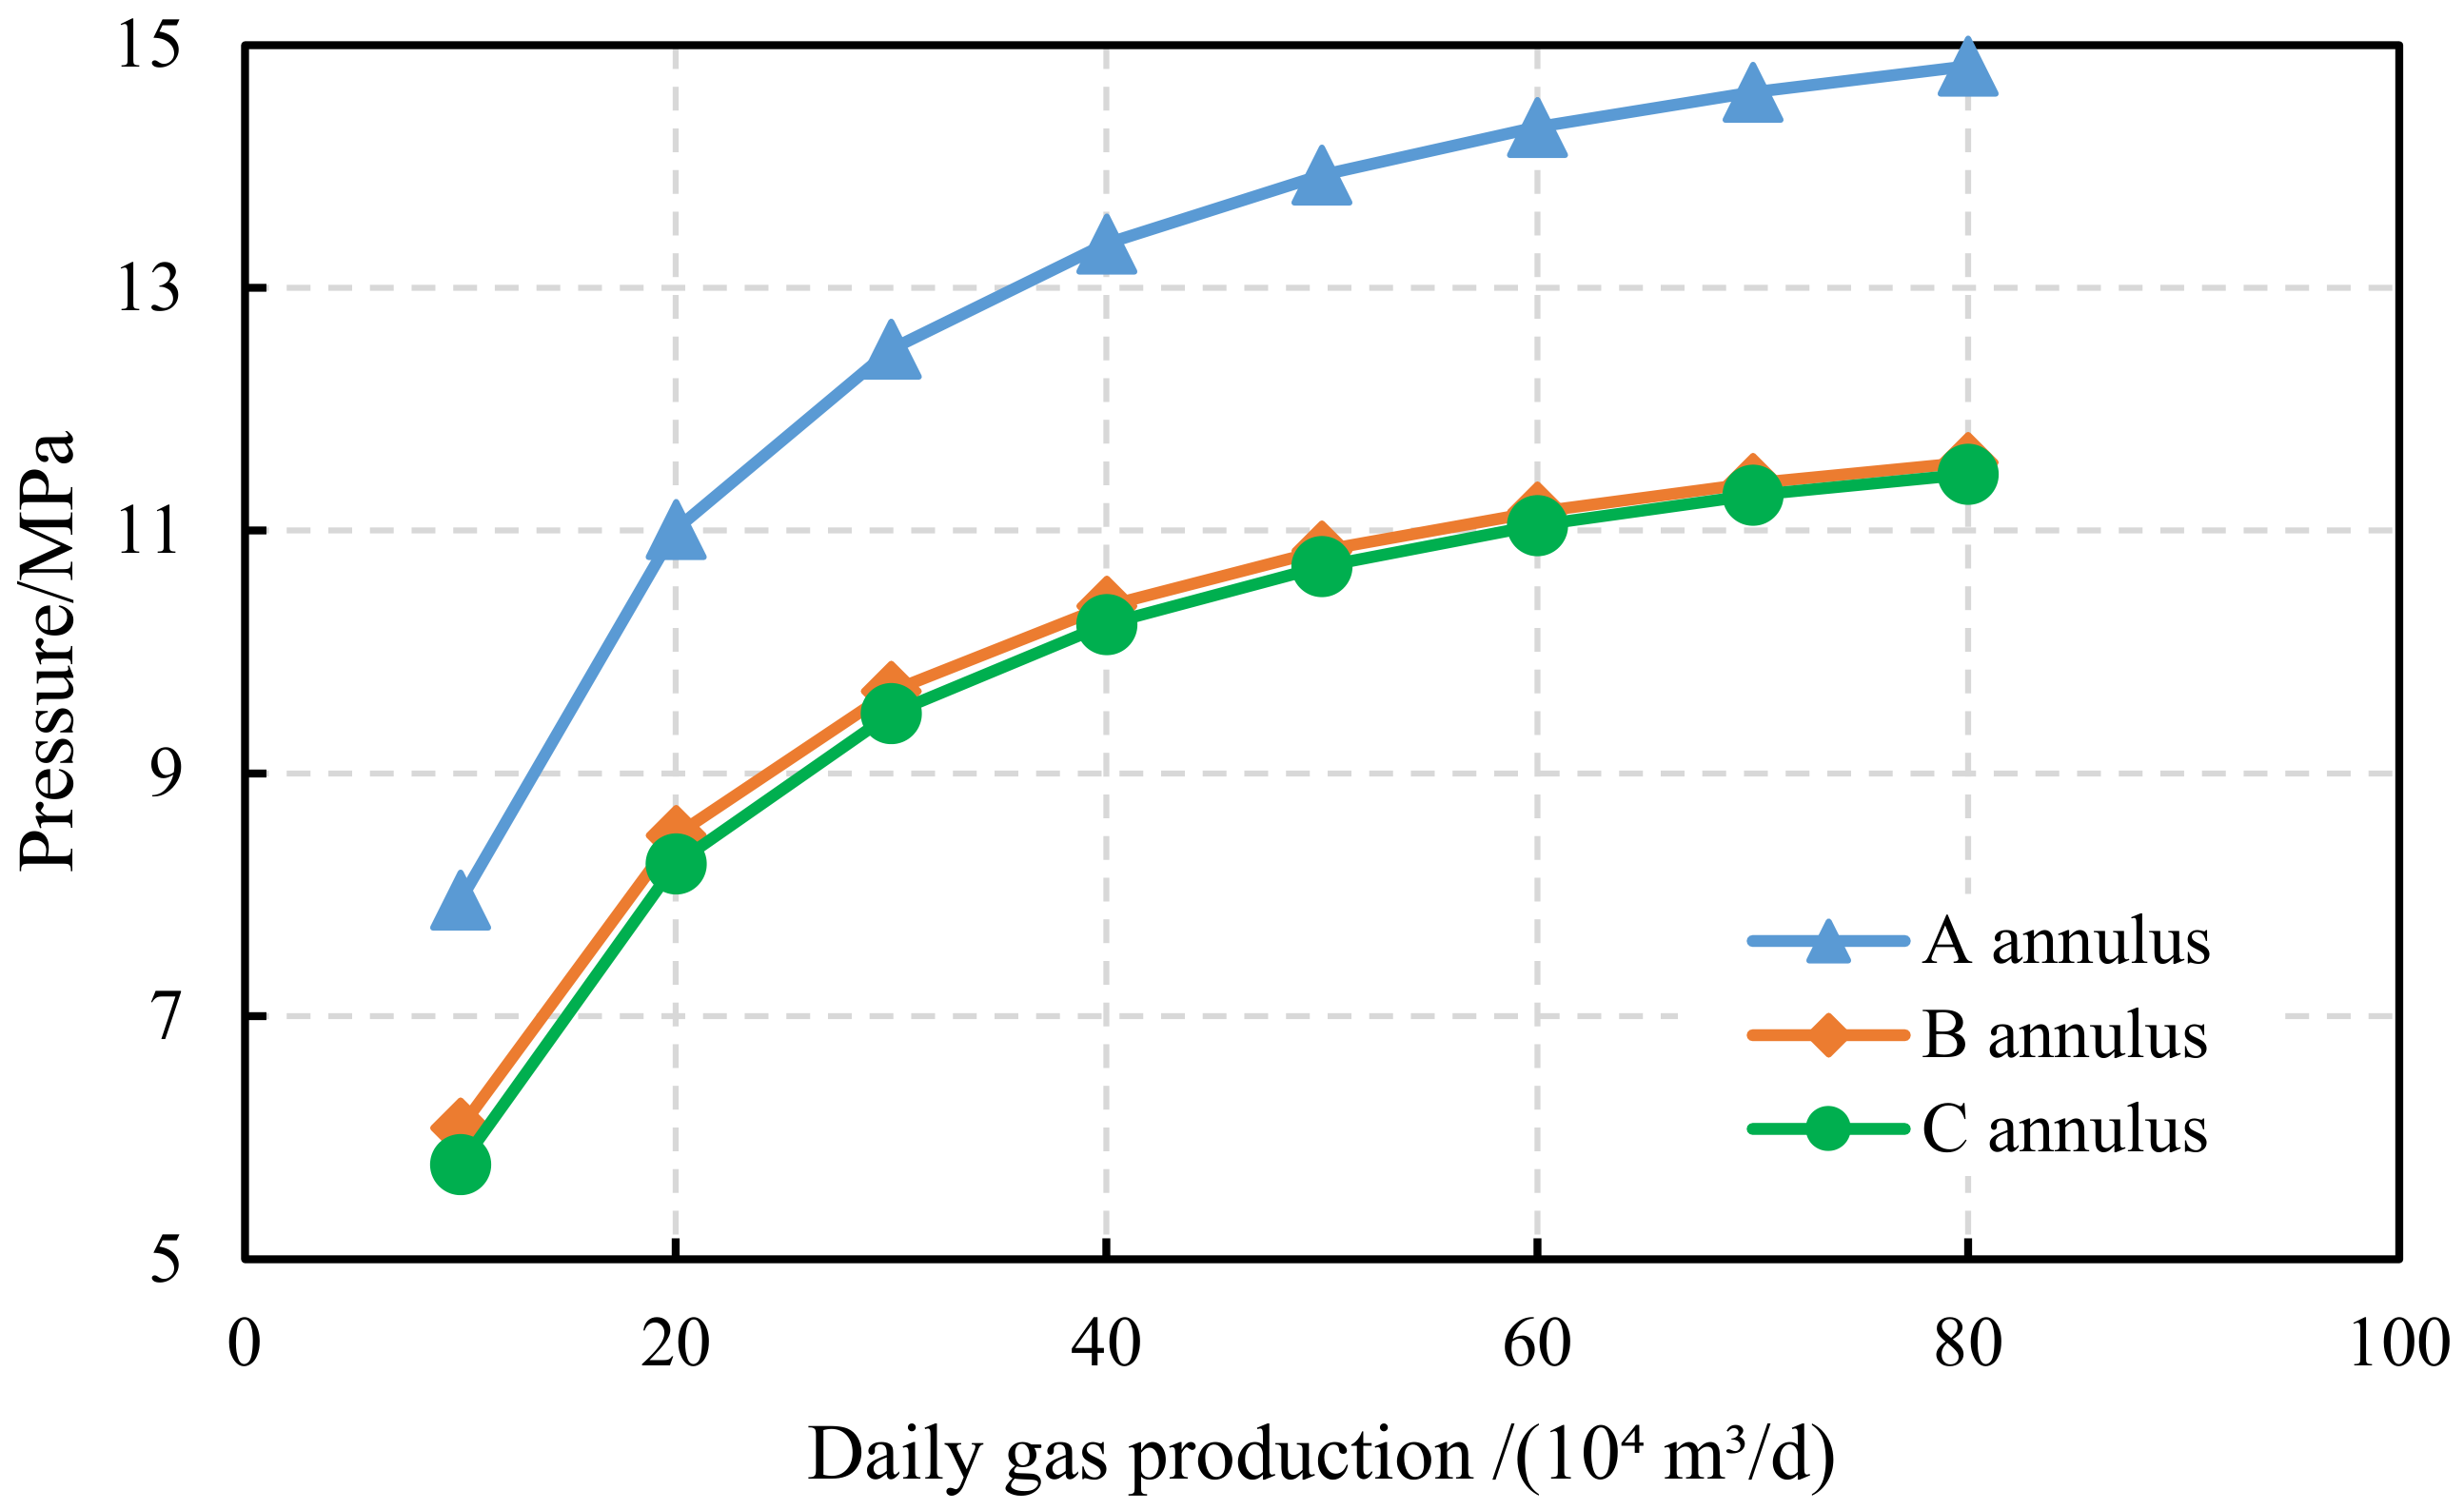
The production rate of gas storage wells varies greatly and is affected by working conditions such as well opening and closing, production time, and formation energy attenuation. Nevertheless, the production rate can be controlled within a reasonable range by artificially adjusting the throttle valve. For Annulus A, the trapped annular pressure gradually rises with the increase in daily gas production, while the growth rate tends to slow down gradually. Annulus B and Annulus C exhibit a similar variation trend with increasing gas production. Among them, Annulus A is most sensitive to daily production, followed by Annulus B, and Annulus C is the least. When the daily gas production increases from 10 × 104 m3/d to 80 × 104 m3/d, the trapped pressure rises by 6.87 MPa in Annulus A, 5.48 MPa in Annulus B, and 5.68 MPa in Annulus C. Based on the above law, for gas storage wells with severe and uncontrollable trapped annular pressure, reducing gas production can effectively mitigate the trapped pressure. For wells with mild trapped pressure and reasonable control measures adopted in design, the daily gas production can be appropriately increased to enhance production capacity. The detailed variation law is shown in Figure 10.
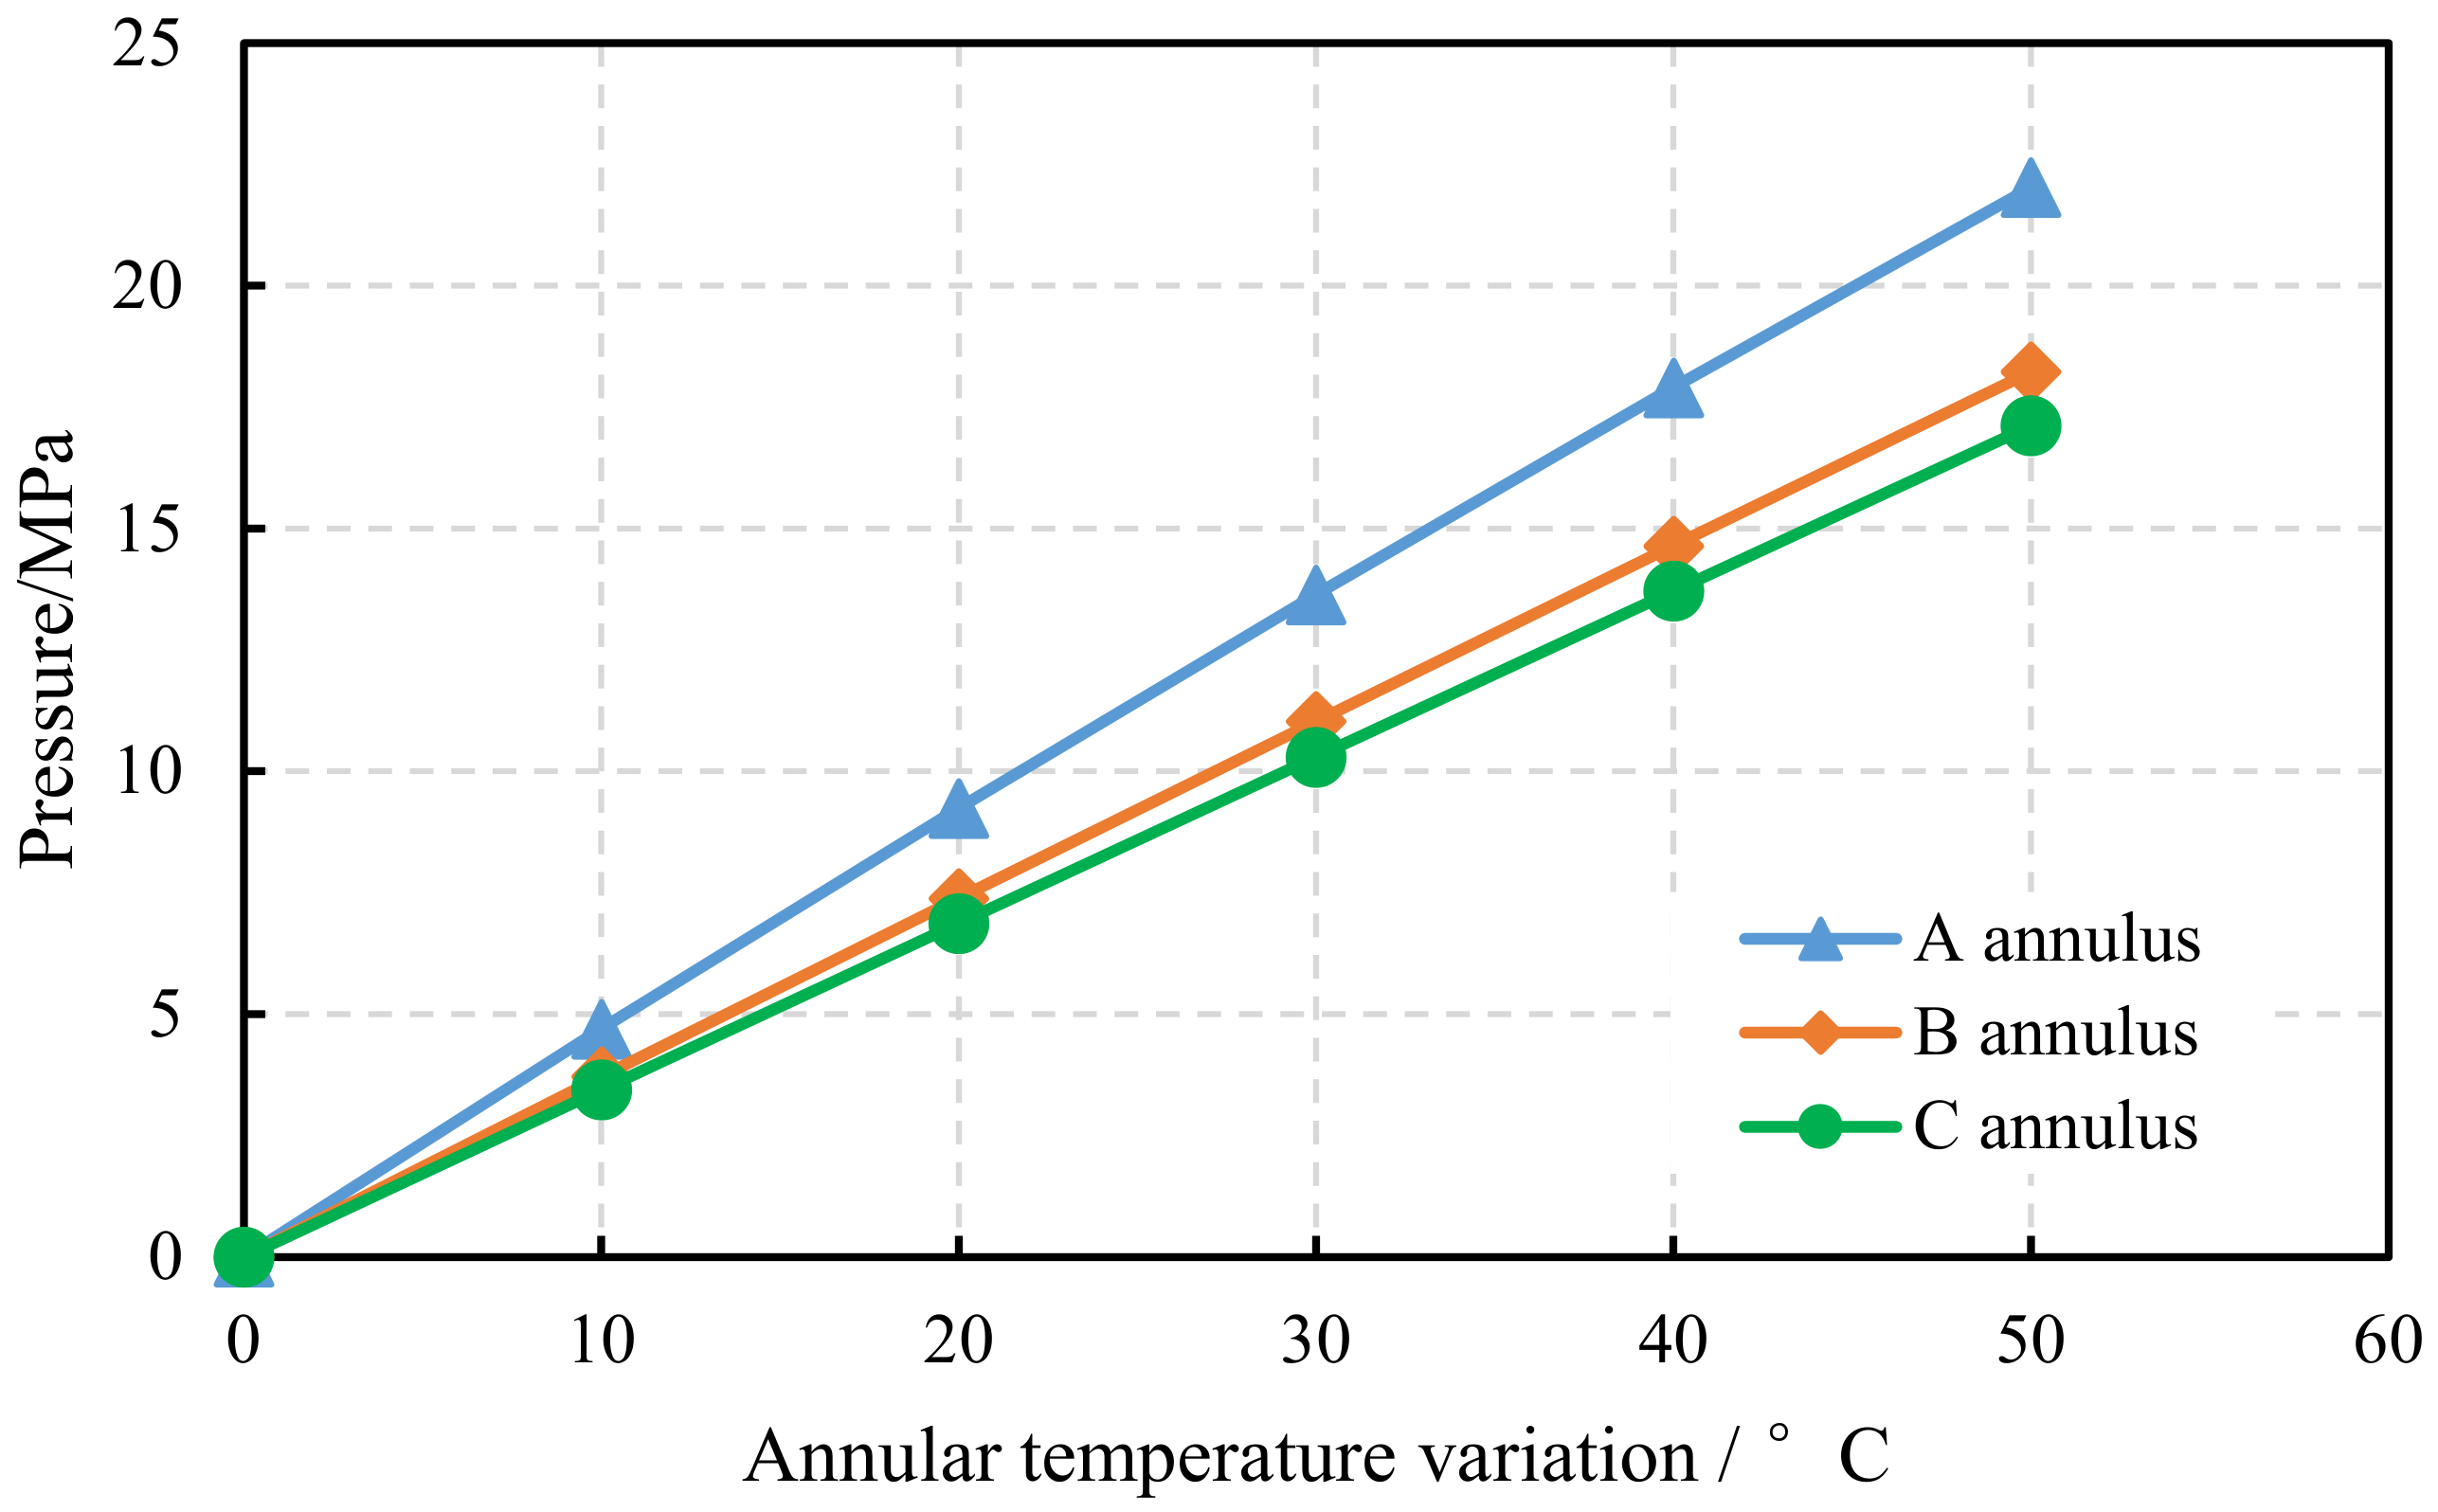
The essence of controlling daily gas production is to regulate the total heat transfer outward from the tubing. Since the direct cause of trapped pressure rise is the increase in wellbore temperature, it is necessary to investigate the influence of annular temperature difference on annular pressure. For Annulus A, the trapped annular pressure increases continuously with the rise in annular fluid temperature variation, and an approximately linear positive correlation exists between temperature variation and trapped pressure. Annulus B and Annulus C show the same linear increasing trend with the change in annular fluid temperature variation. Comparatively, the trapped pressure of Annulus A is more sensitive to temperature variation than that of Annulus B and Annulus C. When the annular fluid temperature variation rises from 0 °C to 50 °C, the trapped pressure increases by 22.03 MPa in Annulus A, 18.23 MPa in Annulus B, and 17.12 MPa in Annulus C.
The detailed variation law is shown in Figure 11.
Figure 11. Influence of annular temperature change on trapped annular pressure.
Processes 14 01949 g011
Comparative analysis shows that daily gas production, annular temperature variation, as well as the thermal expansion coefficient and isothermal compression coefficient of annular fluid, exert a dominant influence on trapped annular pressure. In contrast, parameters such as tubing outer diameter and wall thickness, along with the thermal expansion coefficient and elastic modulus of casing material, have a relatively minor impact.

4. Analysis on Control Technology of Trapped Annular Pressure

In view of the fact that some injection-production wells in gas storage reservoirs are not equipped with annular pressure relief pipelines and the reconstruction cost of such pipelines is relatively high, adopting non-venting annular pressure control methods possesses considerable economic value [24]. To compare and analyze the control effects of direct venting pressure reduction and non-venting pressure reduction technologies, taking a deep injection-production well in the North China Oilfield gas storage group as the case well, this study investigates the pressure reduction performances of three typical annular pressure control measures, namely releasing the pressure of Annulus A, adopting insulated tubing, and injecting nitrogen. Meanwhile, the control effect of each measure on the trapped pressure of Annulus B is compared and analyzed based on the wellbore temperature and pressure calculation model established above.

4.1. Basic Information of the Case Well

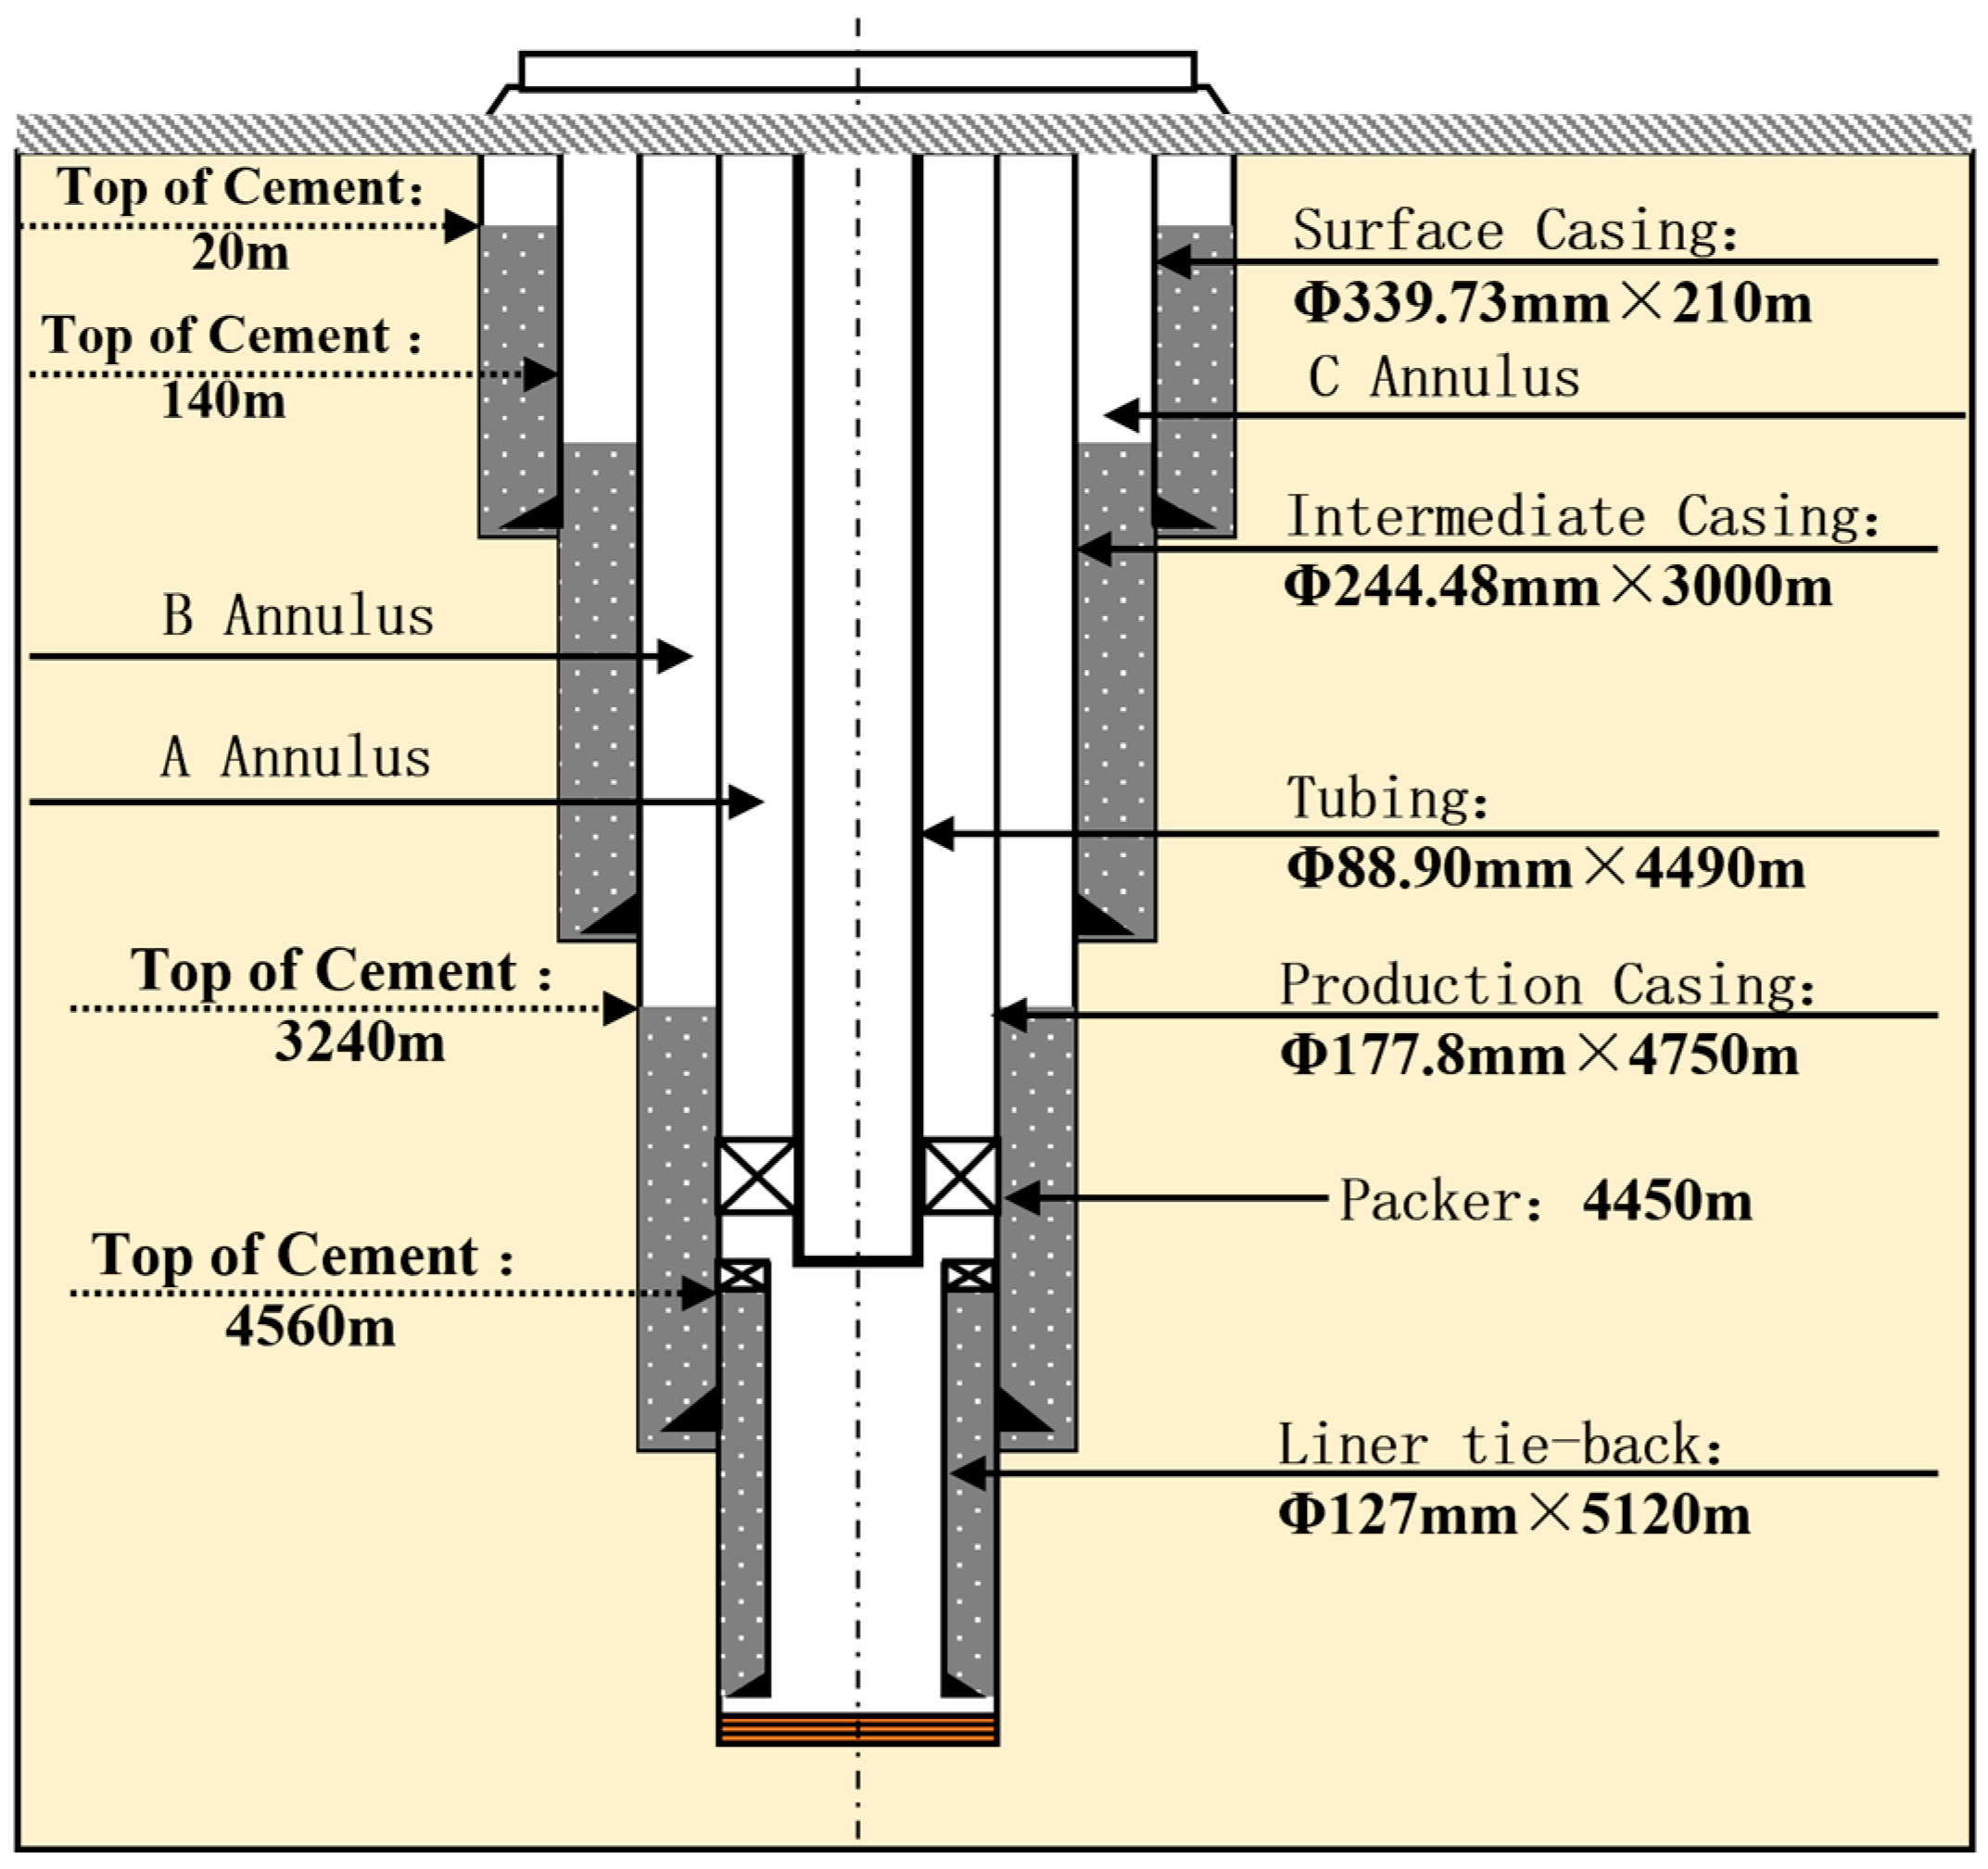
The wellbore structure of the case well consists of five tubular strings: surface casing, intermediate casing, production casing, tieback liner, and tubing. The surface casing has an outer diameter of 339.73 mm and a wall thickness of 9.65 mm, with a setting depth of 211 m and a cement return depth of 20 m. The technical casing features an outer diameter of 244.47 mm and a wall thickness of 11.05 mm, with a setting depth of 3019 m and a cement return depth of 144 m. The production casing has an outer diameter of 177.80 mm and a wall thickness of 11.51 mm, with a setting depth of 4752 m and cement return depth of 3241 m. The outer diameter of the tieback liner is 127.00 mm, deployed within the depth interval of 4566–5122 m. The tubing has an outer diameter of 88.90 mm and a wall thickness of 6.45 mm, with a running depth of 4522 m. The daily gas production of the well ranges from 20 × 104~80 × 104 m3/d. The reservoir temperature is 154 °C, and the surface ambient temperature is 5 °C. Other basic parameters are set as follows: casing Poisson’s ratio of 0.3, casing elastic modulus of 205 GPa, fluid thermal expansion coefficient of 0.0004 °C−1, fluid compression coefficient of 0.0003 MPa−1, fluid bulk modulus of 2200 MPa, casing thermal expansion coefficient of 0.000012 °C−1, string thermal conductivity of 43.75 W·(m·°C)−1, formation thermal conductivity of 2.25 W·(m·°C)−1, cement sheath thermal conductivity of 1.25 W·(m·°C)−1, annular protection fluid thermal conductivity of 1.73 W·(m·°C)−1, and nitrogen thermal conductivity of 0.05 W·(m·°C)−1. The detailed wellbore structural parameters of the case well are shown in Figure 12.
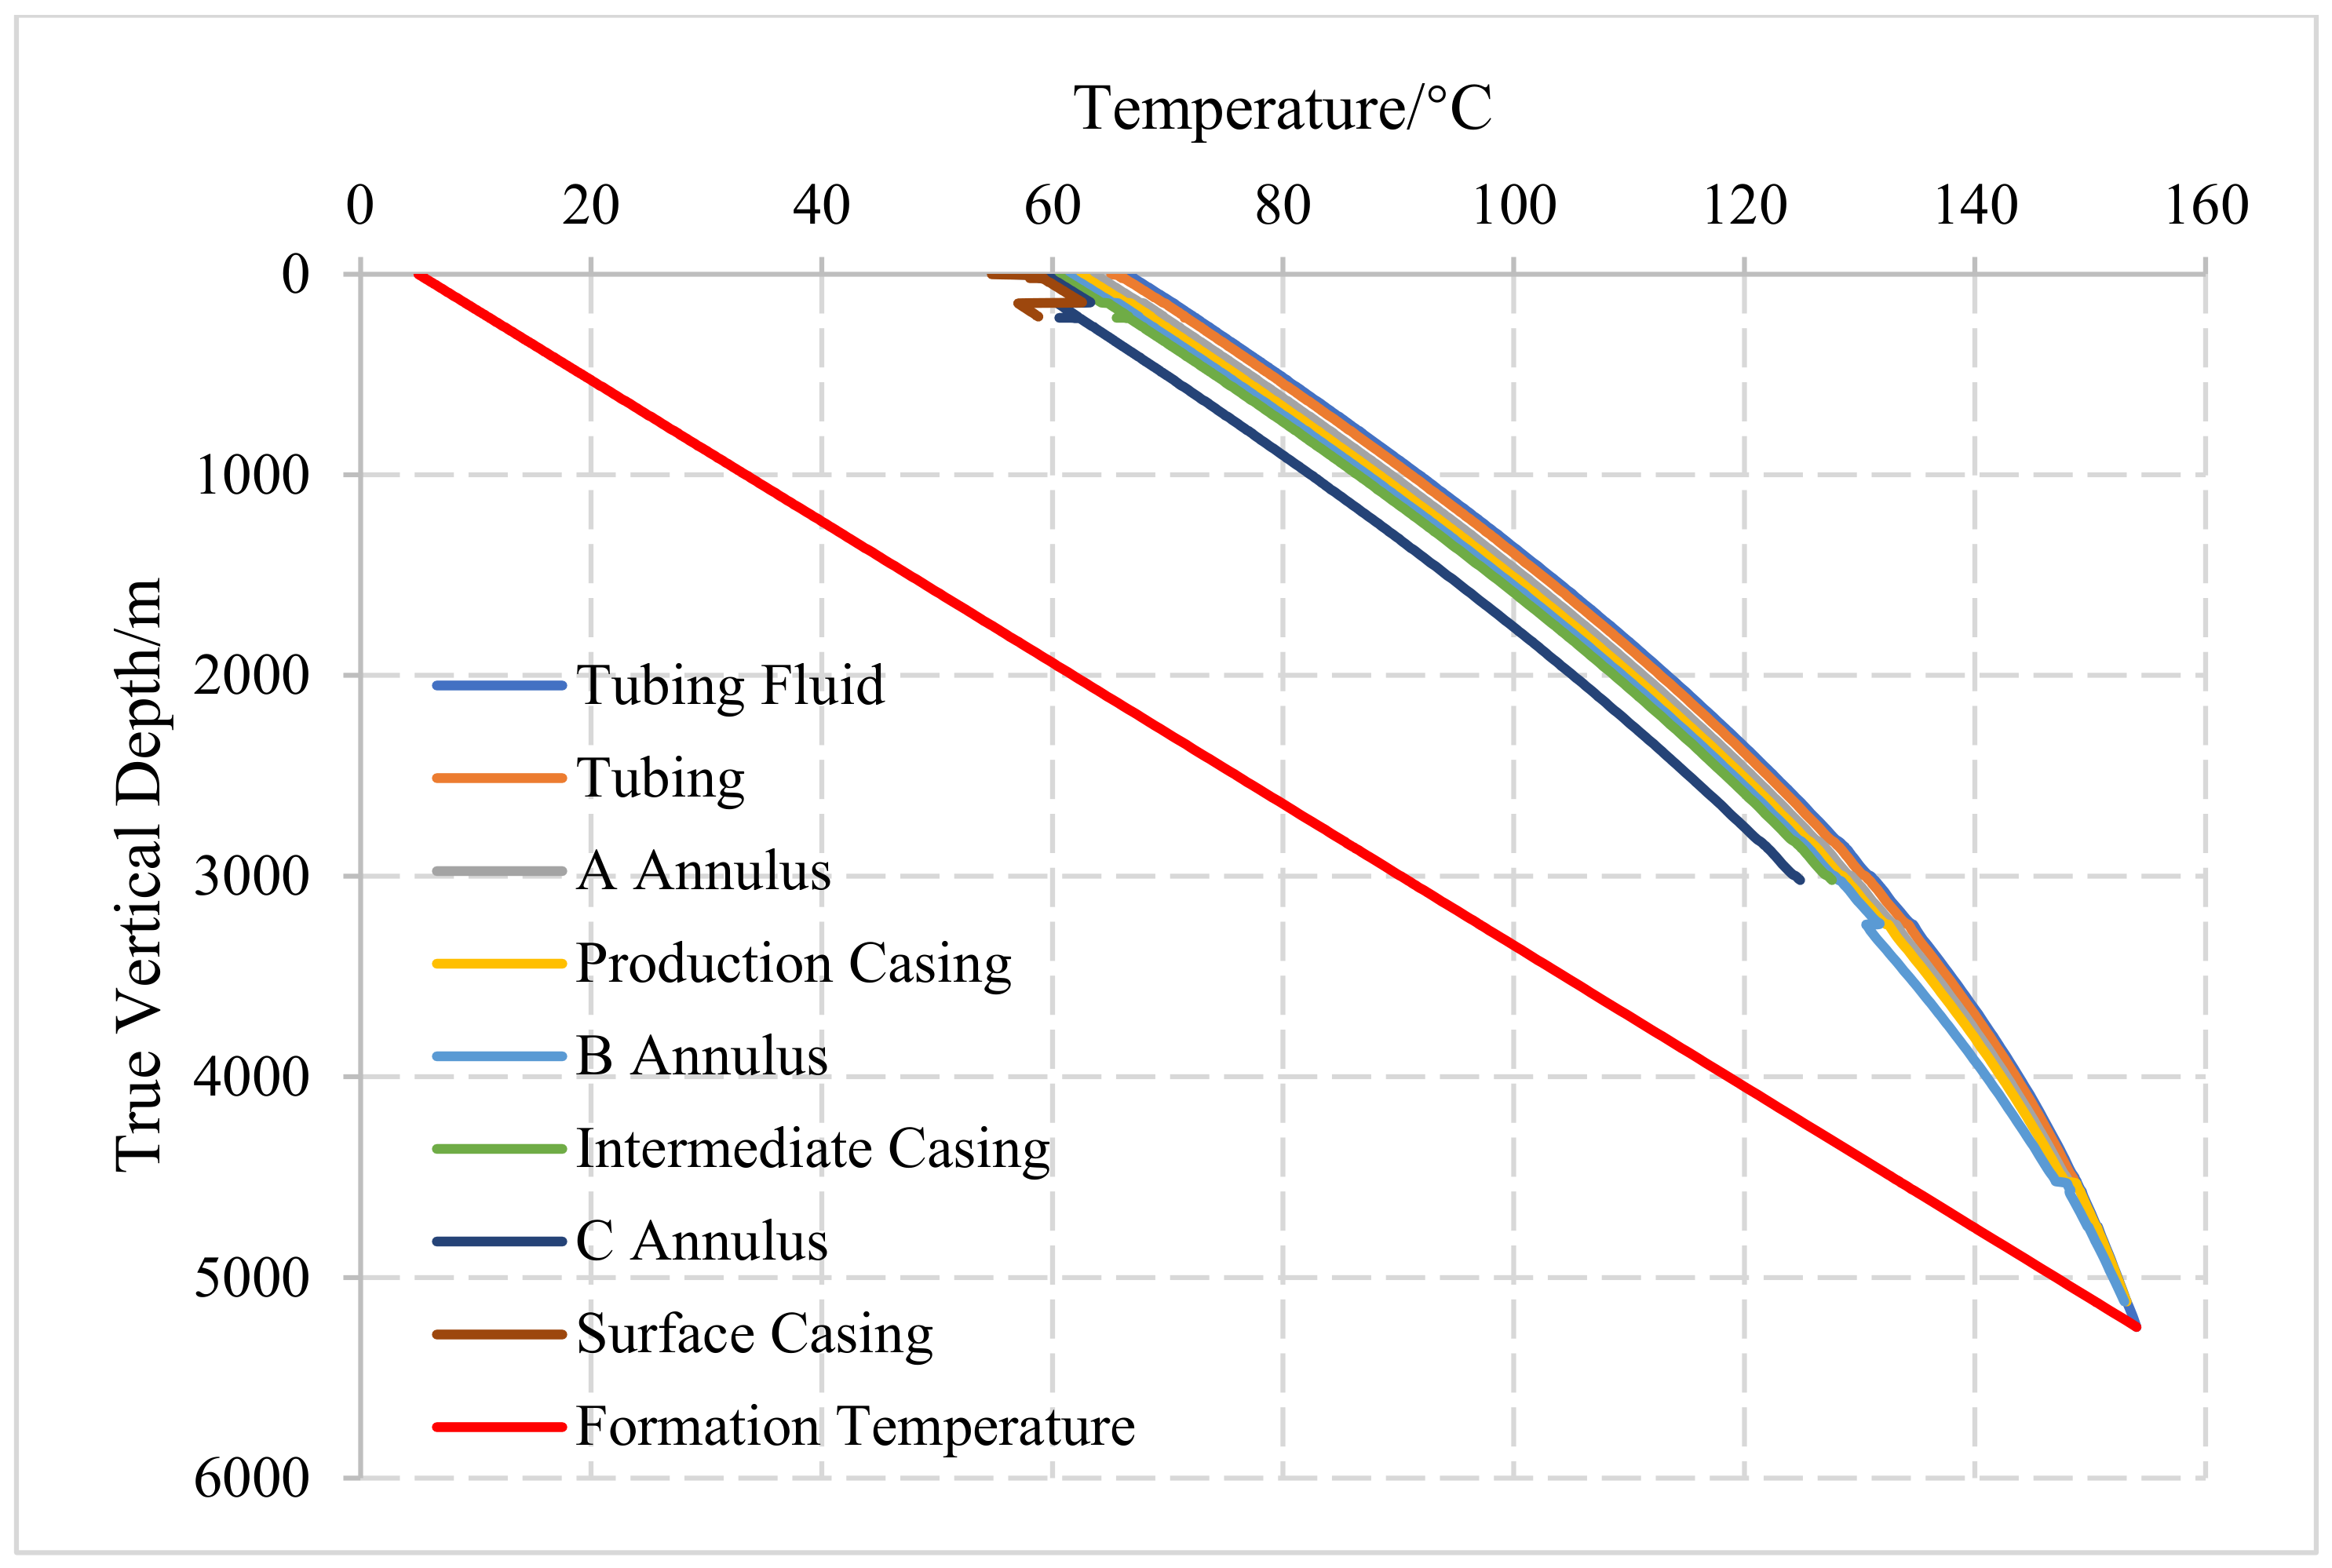
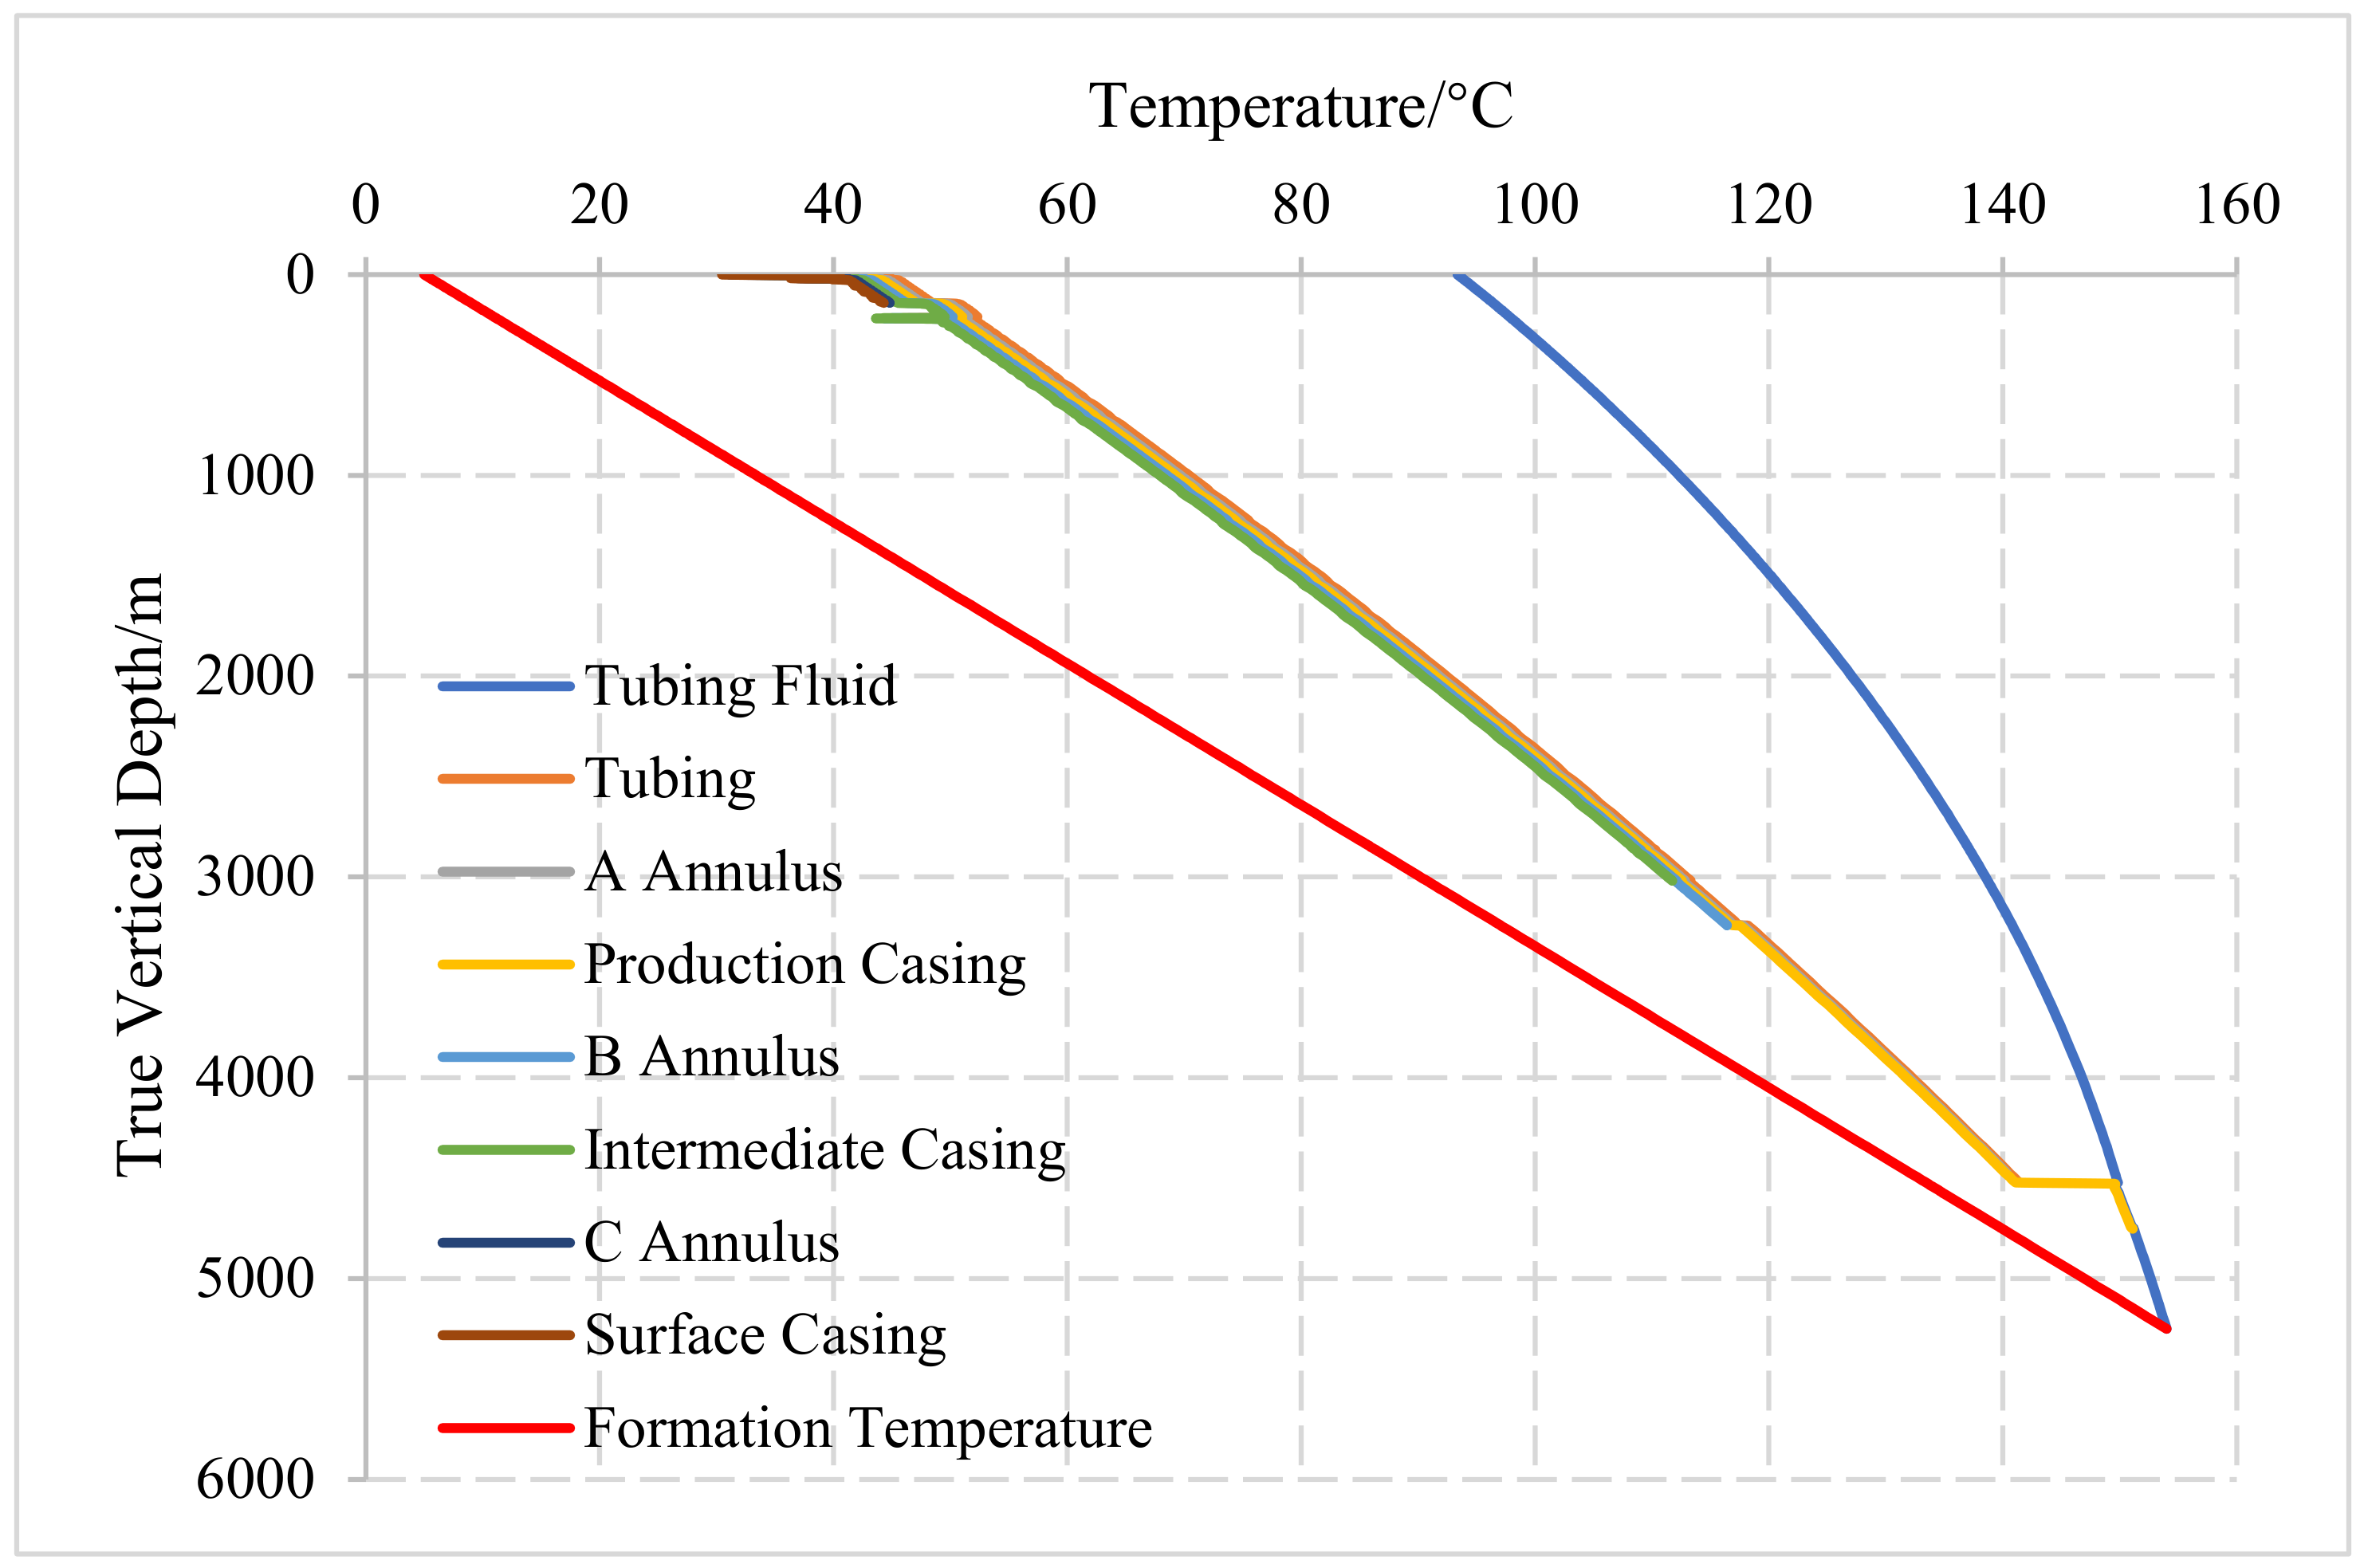
Based on the basic wellbore structure and relevant calculation parameters of the case well, calculation and analysis are carried out using the established annular temperature and pressure calculation model. When the daily gas production is set to 40 × 104 m3, the temperature field distribution of the well is obtained, as shown in Figure 13.
Under stable production conditions, the temperature of fluid inside the tubing gradually increases from the wellhead to the bottomhole with an accelerating growth rate. The temperature variation patterns of the tubing, Annulus A, production casing, Annulus B and technical casing are similar to that of the tubing fluid. At the same depth, the temperature decreases progressively from the inner to the outer wellbore structure. Compared with the initial formation temperature, the wellhead temperature rises by 57.06 °C in Annulus A, 53.53 °C in Annulus B, and 50.75 °C in Annulus C.

4.2. Effect Analysis of Annular Pressure Relief

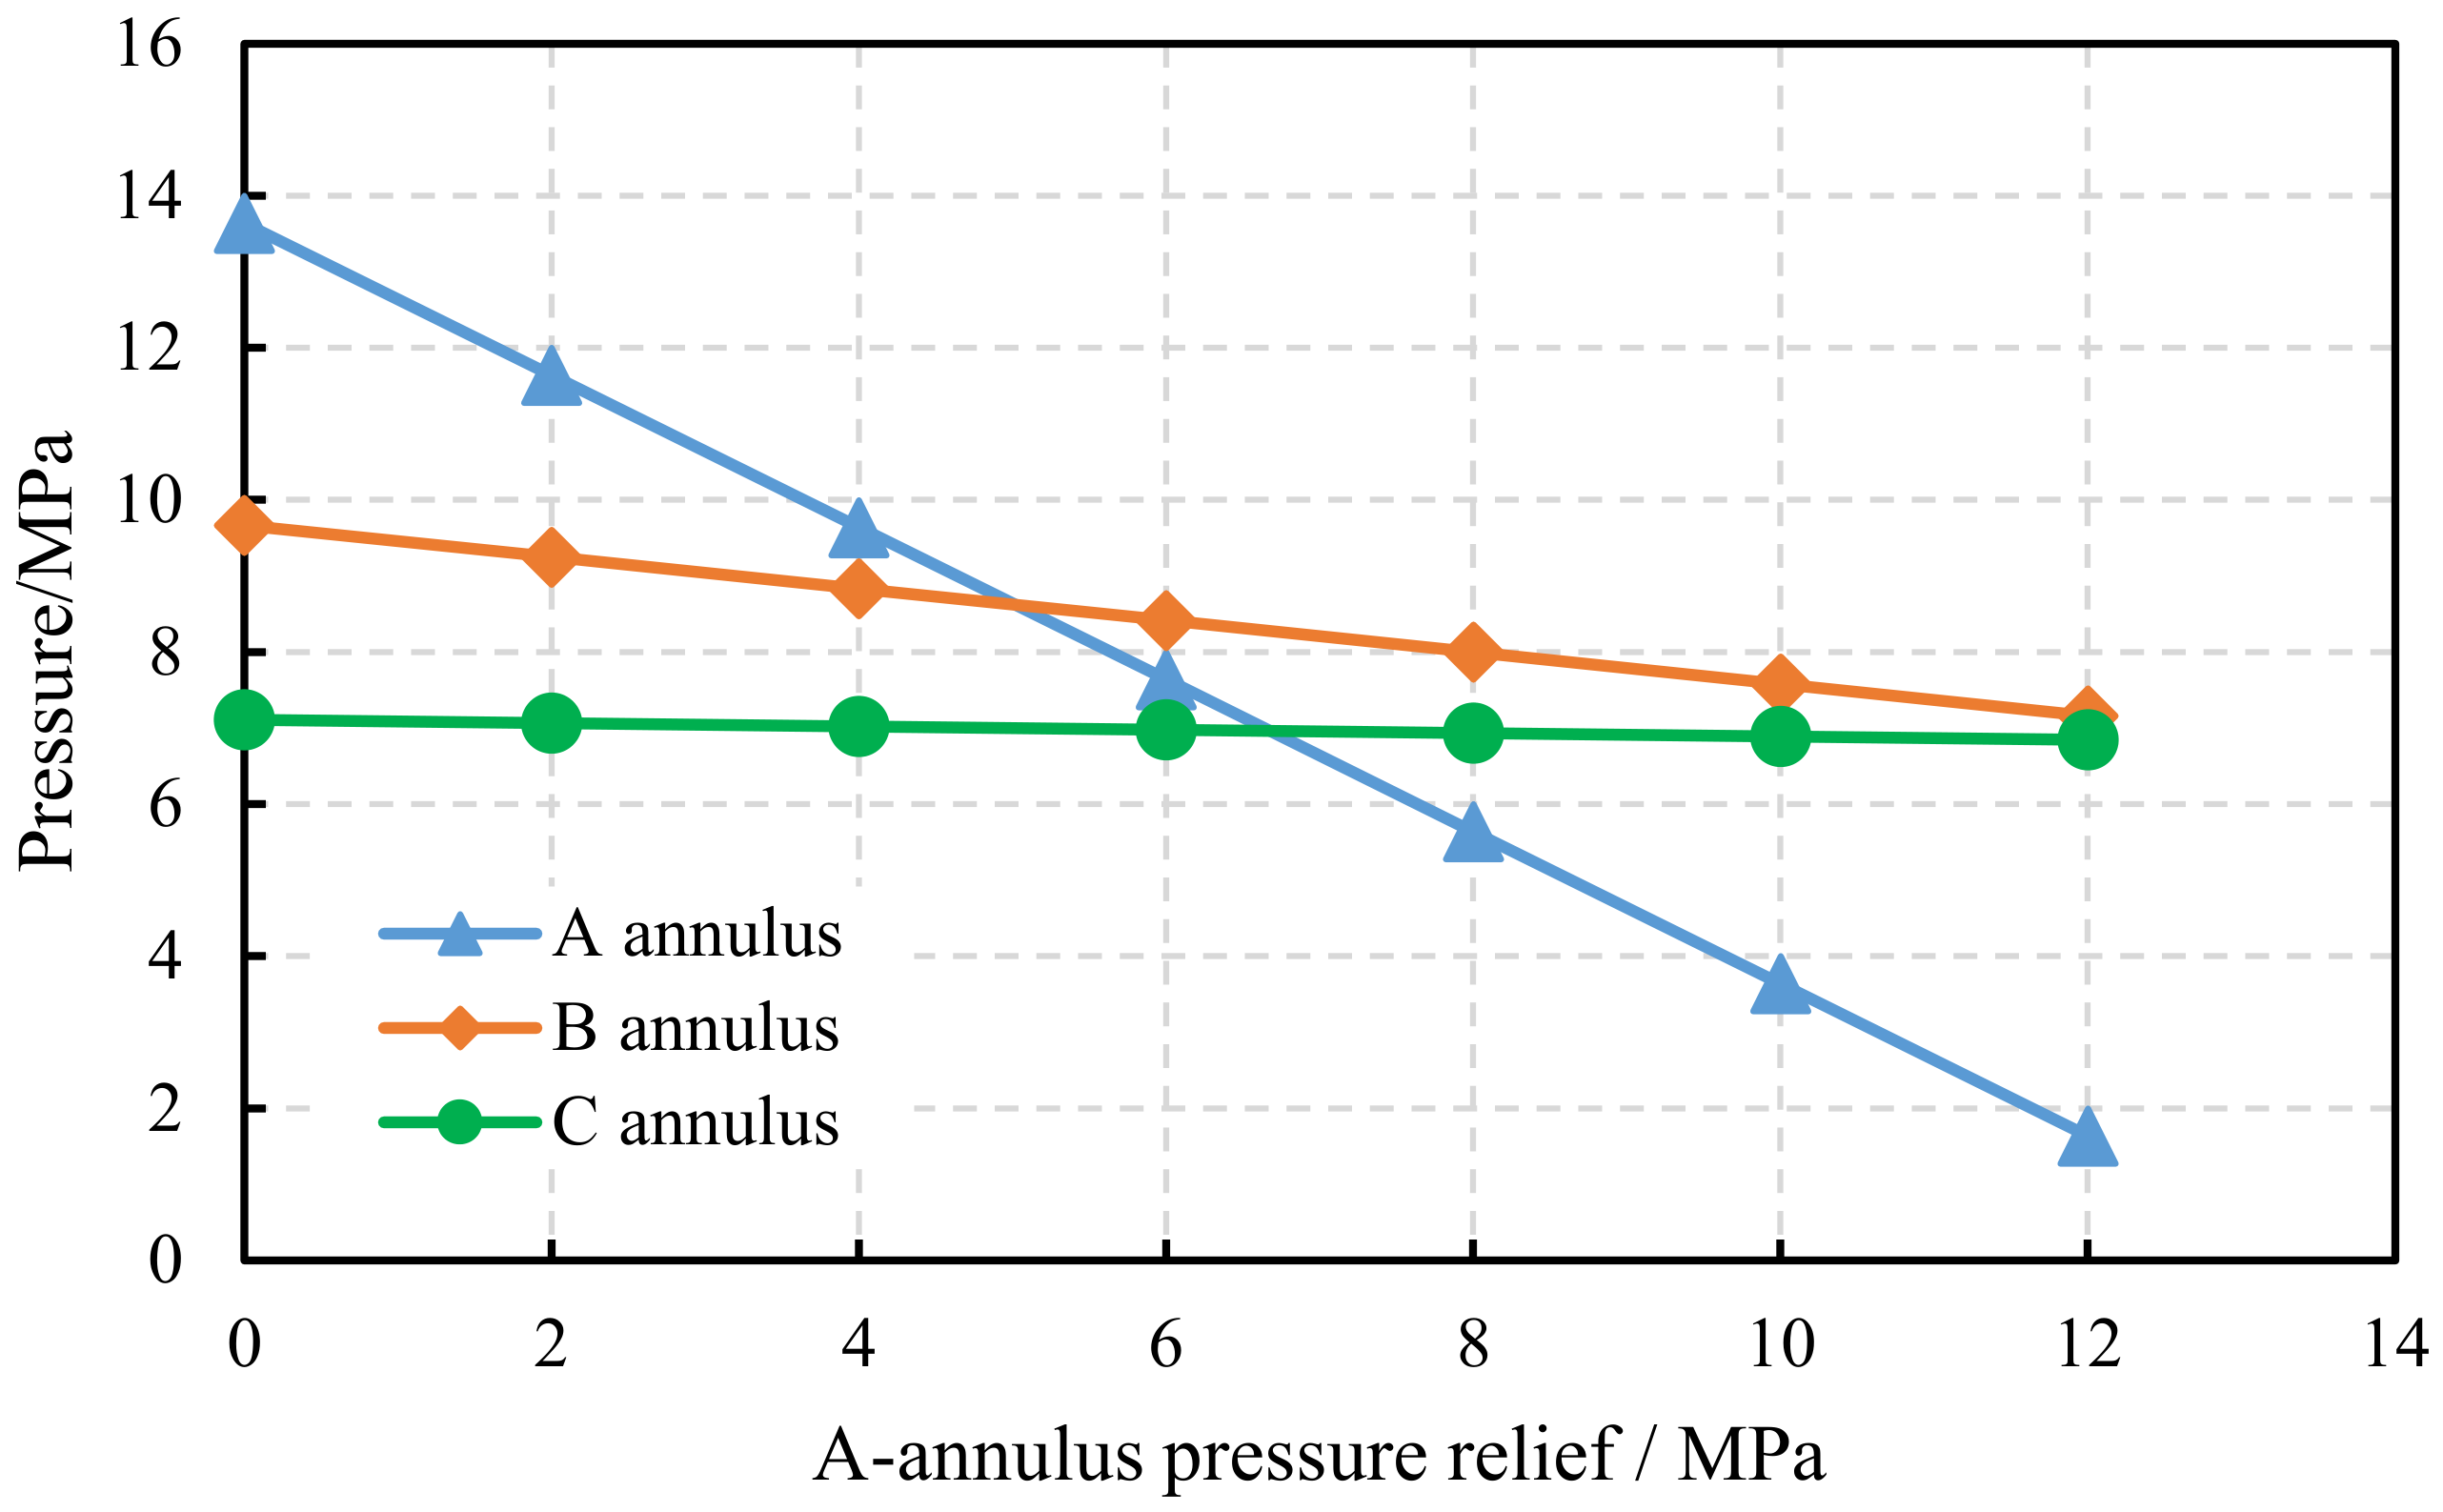
In the actual production process of gas storage wells, reasonable pressure relief operation on Annulus A cannot only rapidly and directly reduce its own trapped annular pressure, but also appropriately lower the trapped pressure of other annuli. The specific results are shown in Figure 14.
It can be seen from Figure 14 that for Annulus A, the wellhead trapped annular pressure decreases linearly with the increase in pressure relief magnitude. As the pressure relief of Annulus A rises, the trapped pressure of Annulus B also declines gradually in an approximately linear trend, albeit at a slower rate than Annulus A. Although the trapped pressure of Annulus C also shows a decreasing tendency, its variation amplitude is very limited. When the pressure of Annulus A is relieved by 12 MPa, the trapped pressure of Annulus B drops by 2.5 MPa, with a reduction rate of 26%. It is concluded that pressure relief of Annulus A has a certain regulating effect on Annulus B. Combined with other auxiliary measures, this method can efficiently reduce the trapped pressure of each annulus [25,26].

4.3. Effect Analysis of Insulated Tubing Application

Essentially, insulated tubing reduces the temperature increment of the annulus by improving the thermal insulation performance of the tubing, thereby weakening the trapped pressure induced by thermal expansion of annular fluid, and it performs well in lowering wellbore annular temperature. Chai Shichao et al. analyzed the application effect of insulated tubing in the high-wax Oilfield B of Bohai Sea. The results showed that after insulated tubing was run to depths of 500 m and 1000 m, the wellhead temperature rose from 20 °C to 33 °C and 40 °C, respectively, presenting a remarkable thermal insulation effect [27]. Fu Yarong et al. investigated the thermal insulation performance of insulated tubing in more than 50 old oil wells during secondary development and found that the average wellhead temperature increased by 18 °C, which effectively avoided wax precipitation of crude oil at the wellhead [28]. Zeng Wenguang et al. conducted research on the thermal insulation performance of lined insulated tubing in heavy oil wells. By analyzing influencing factors such as different lining materials and running depths of lined tubing, it was concluded that under a certain liquid production rate, the running depth of the string shall exceed 3500 m to meet the temperature requirement of field production [29]. It is proposed to adopt insulated tubing with a specification of 88.9 × 60.32 mm and a thermal insulation coefficient of 0.346147 W/(m·°C). The wellbore temperature field under a daily gas production of 40 × 104 m3 is calculated and presented in Figure 15.
It can be seen from Figure 15 that after adopting insulated tubing, the temperature variation trend of the fluid inside the tubing remains consistent with that under conventional tubing, both gradually increasing from the wellhead to the bottomhole with an accelerated growth rate. The fluid temperature in the tubing above the bottomhole is higher than that without insulated tubing, with a temperature rise of approximately 27 °C near the wellhead.
In addition, for the well section installed with insulated tubing, the temperatures of layered media, including Annulus A, production casing, Annulus B, technical casing, Annulus C and surface casing, are all greatly reduced compared with the condition without insulated tubing. Among them, the wellhead temperature of Annulus B decreases by about 26 °C. Calculation results indicate that the trapped annular pressure drops by approximately 20 MPa, with a reduction amplitude of about 58%, demonstrating an excellent pressure control effect.
In general, different thermal insulation technologies (e.g., vacuum-insulated tubing and medium-filled insulated tubing) vary considerably in thermal conductivity and economic cost. Vacuum-insulated tubing possesses the minimum equivalent thermal conductivity (typically below 0.05 W/(m·°C)) and delivers the best thermal preservation performance, yet it is characterized by complicated manufacturing procedures, high overall cost and stringent sealing requirements. Medium-filled insulated tubing covers multiple categories filled with rare gas, powder, aerogel and other materials. Diversified filler types and filling dosages lead to abundant product specifications of such tubing, which features relatively lower overall cost, accompanied by inferior thermal insulation performance and long-term stability. For practical engineering deployment, the optimal insulation scheme is recommended to be selected comprehensively according to target well depth, construction budget and designed service life, with preliminary parametric prediction implemented using the model proposed in this work.
Given the complex influencing factors such as thermal insulation coefficient and structural size of insulated tubing, this paper only focuses on the correlation between temperature variation and thermal expansion-induced pressure. The relationship between specific insulated tubing types and pressure control performance is not discussed in detail herein.

4.4. Effect Analysis of Nitrogen Injection

Li Cheng et al. established a calculation model of tubing-casing trapped annular pressure considering thermal expansion effects, investigated the influences of bottomhole temperature, bottomhole pressure, setting depth and production rate on trapped annular pressure, and recommended injecting gas at the initial stage of field operation to alleviate annular pressure [30].
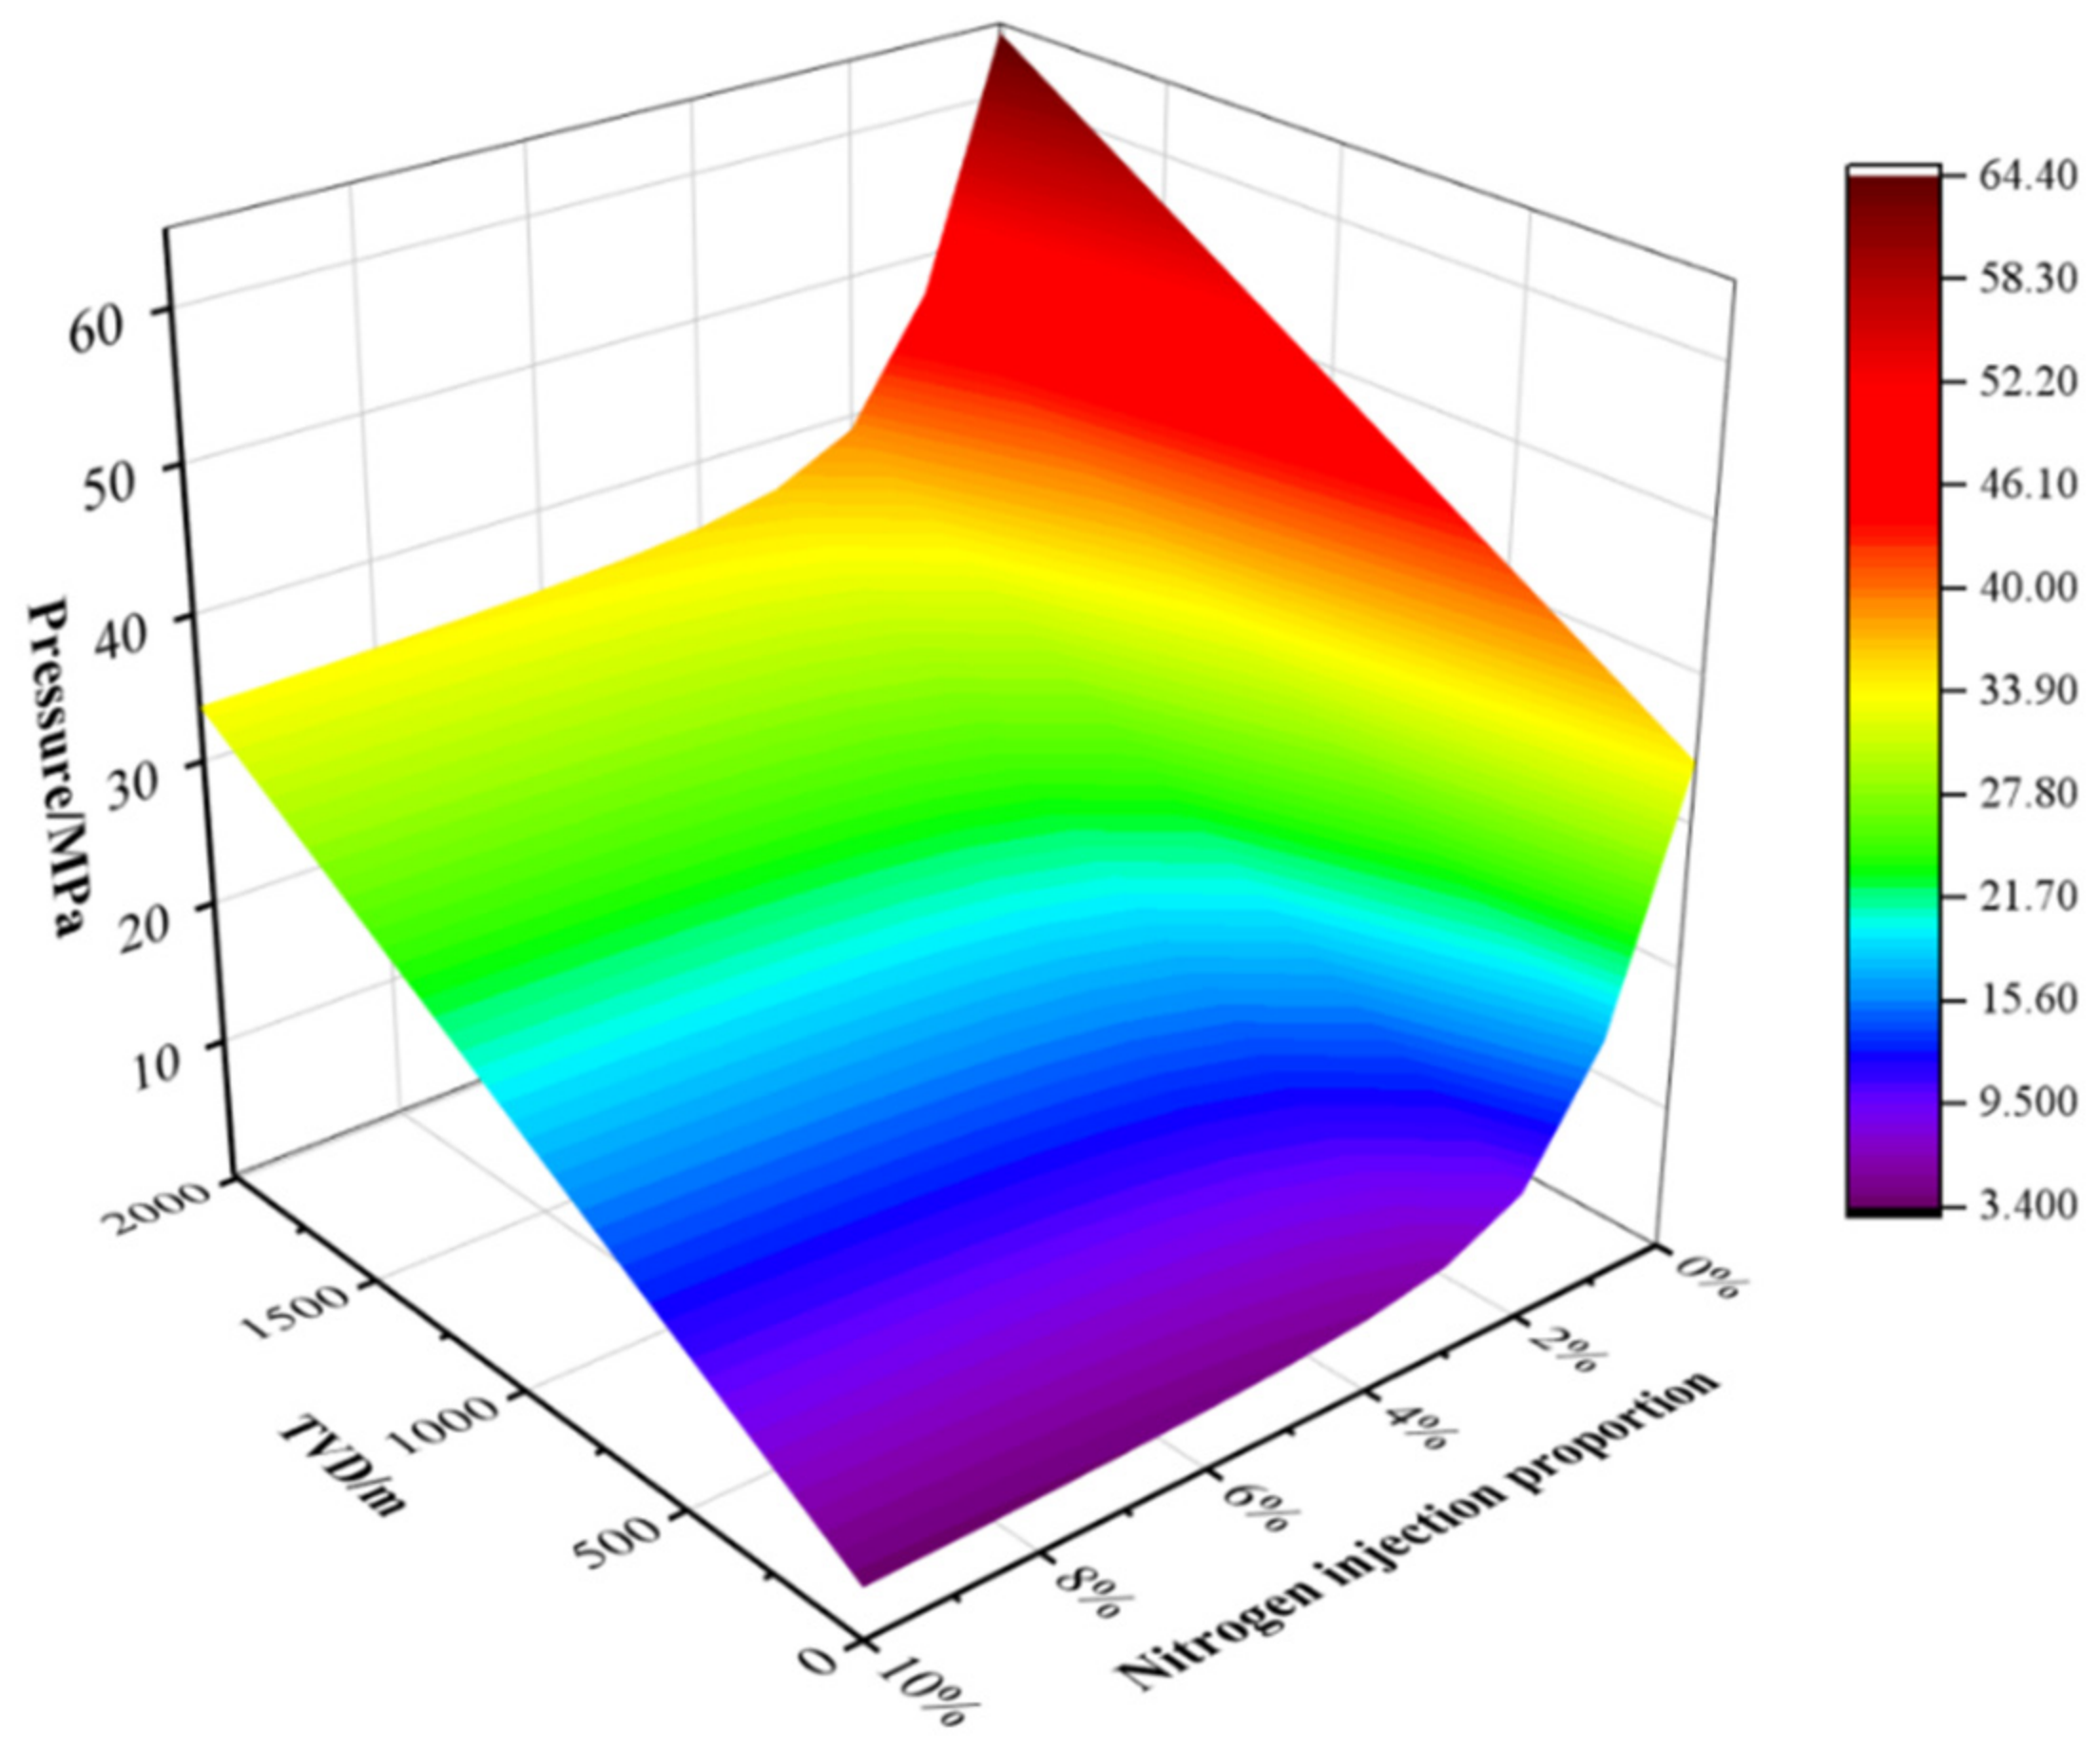
Pre-injecting a certain amount of nitrogen isolation fluid into Annulus B can reduce its trapped pressure. The nitrogen injection volume directly affects the expansion volume of residual drilling fluid in the annulus. With stable chemical properties and high compressibility, nitrogen can effectively relieve trapped annular pressure. The pressure control effect varies with nitrogen injection volume, and the comparison between injection volume and pressure reduction performance is calculated and analyzed, as shown in Figure 16.
It can be seen from Figure 16 that at the same depth, the trapped annular pressure decreases with the increase of the nitrogen injection ratio. The pressure drops sharply at a low nitrogen proportion, whereas the declining rate slows down rapidly as the proportion continues to rise, and the pressure eventually converges to a stable value. When the nitrogen injection ratio is 0, the trapped pressure of Annulus B at the wellhead reaches its maximum. When the ratio rises to approximately 10%, the trapped annular pressure decreases greatly and tends to be stable. The pressure control effect reaches an inflection point when the nitrogen injection volume accounts for about 3% of the total fluid volume in Annulus B. Under these conditions, the annular pressure is reduced by about 28 MPa with a pressure drop rate of roughly 82%, showing an outstanding pressure control effect.
Compared with published literature, the optimal injection ratio obtained in this work falls within the same order of magnitude and lies in the range reported in previous studies, and the pressure-mitigation performance for restraining annular pressure buildup also agrees well with existing findings. Further analysis indicates that discrepancies between the present results and partially published data mainly stem from differences in wellbore configuration, fluid properties, geothermal gradient, preset initial annular pressure and field operation schedules.

4.5. Analysis of Advantages and Disadvantages of Pressure Control Measures

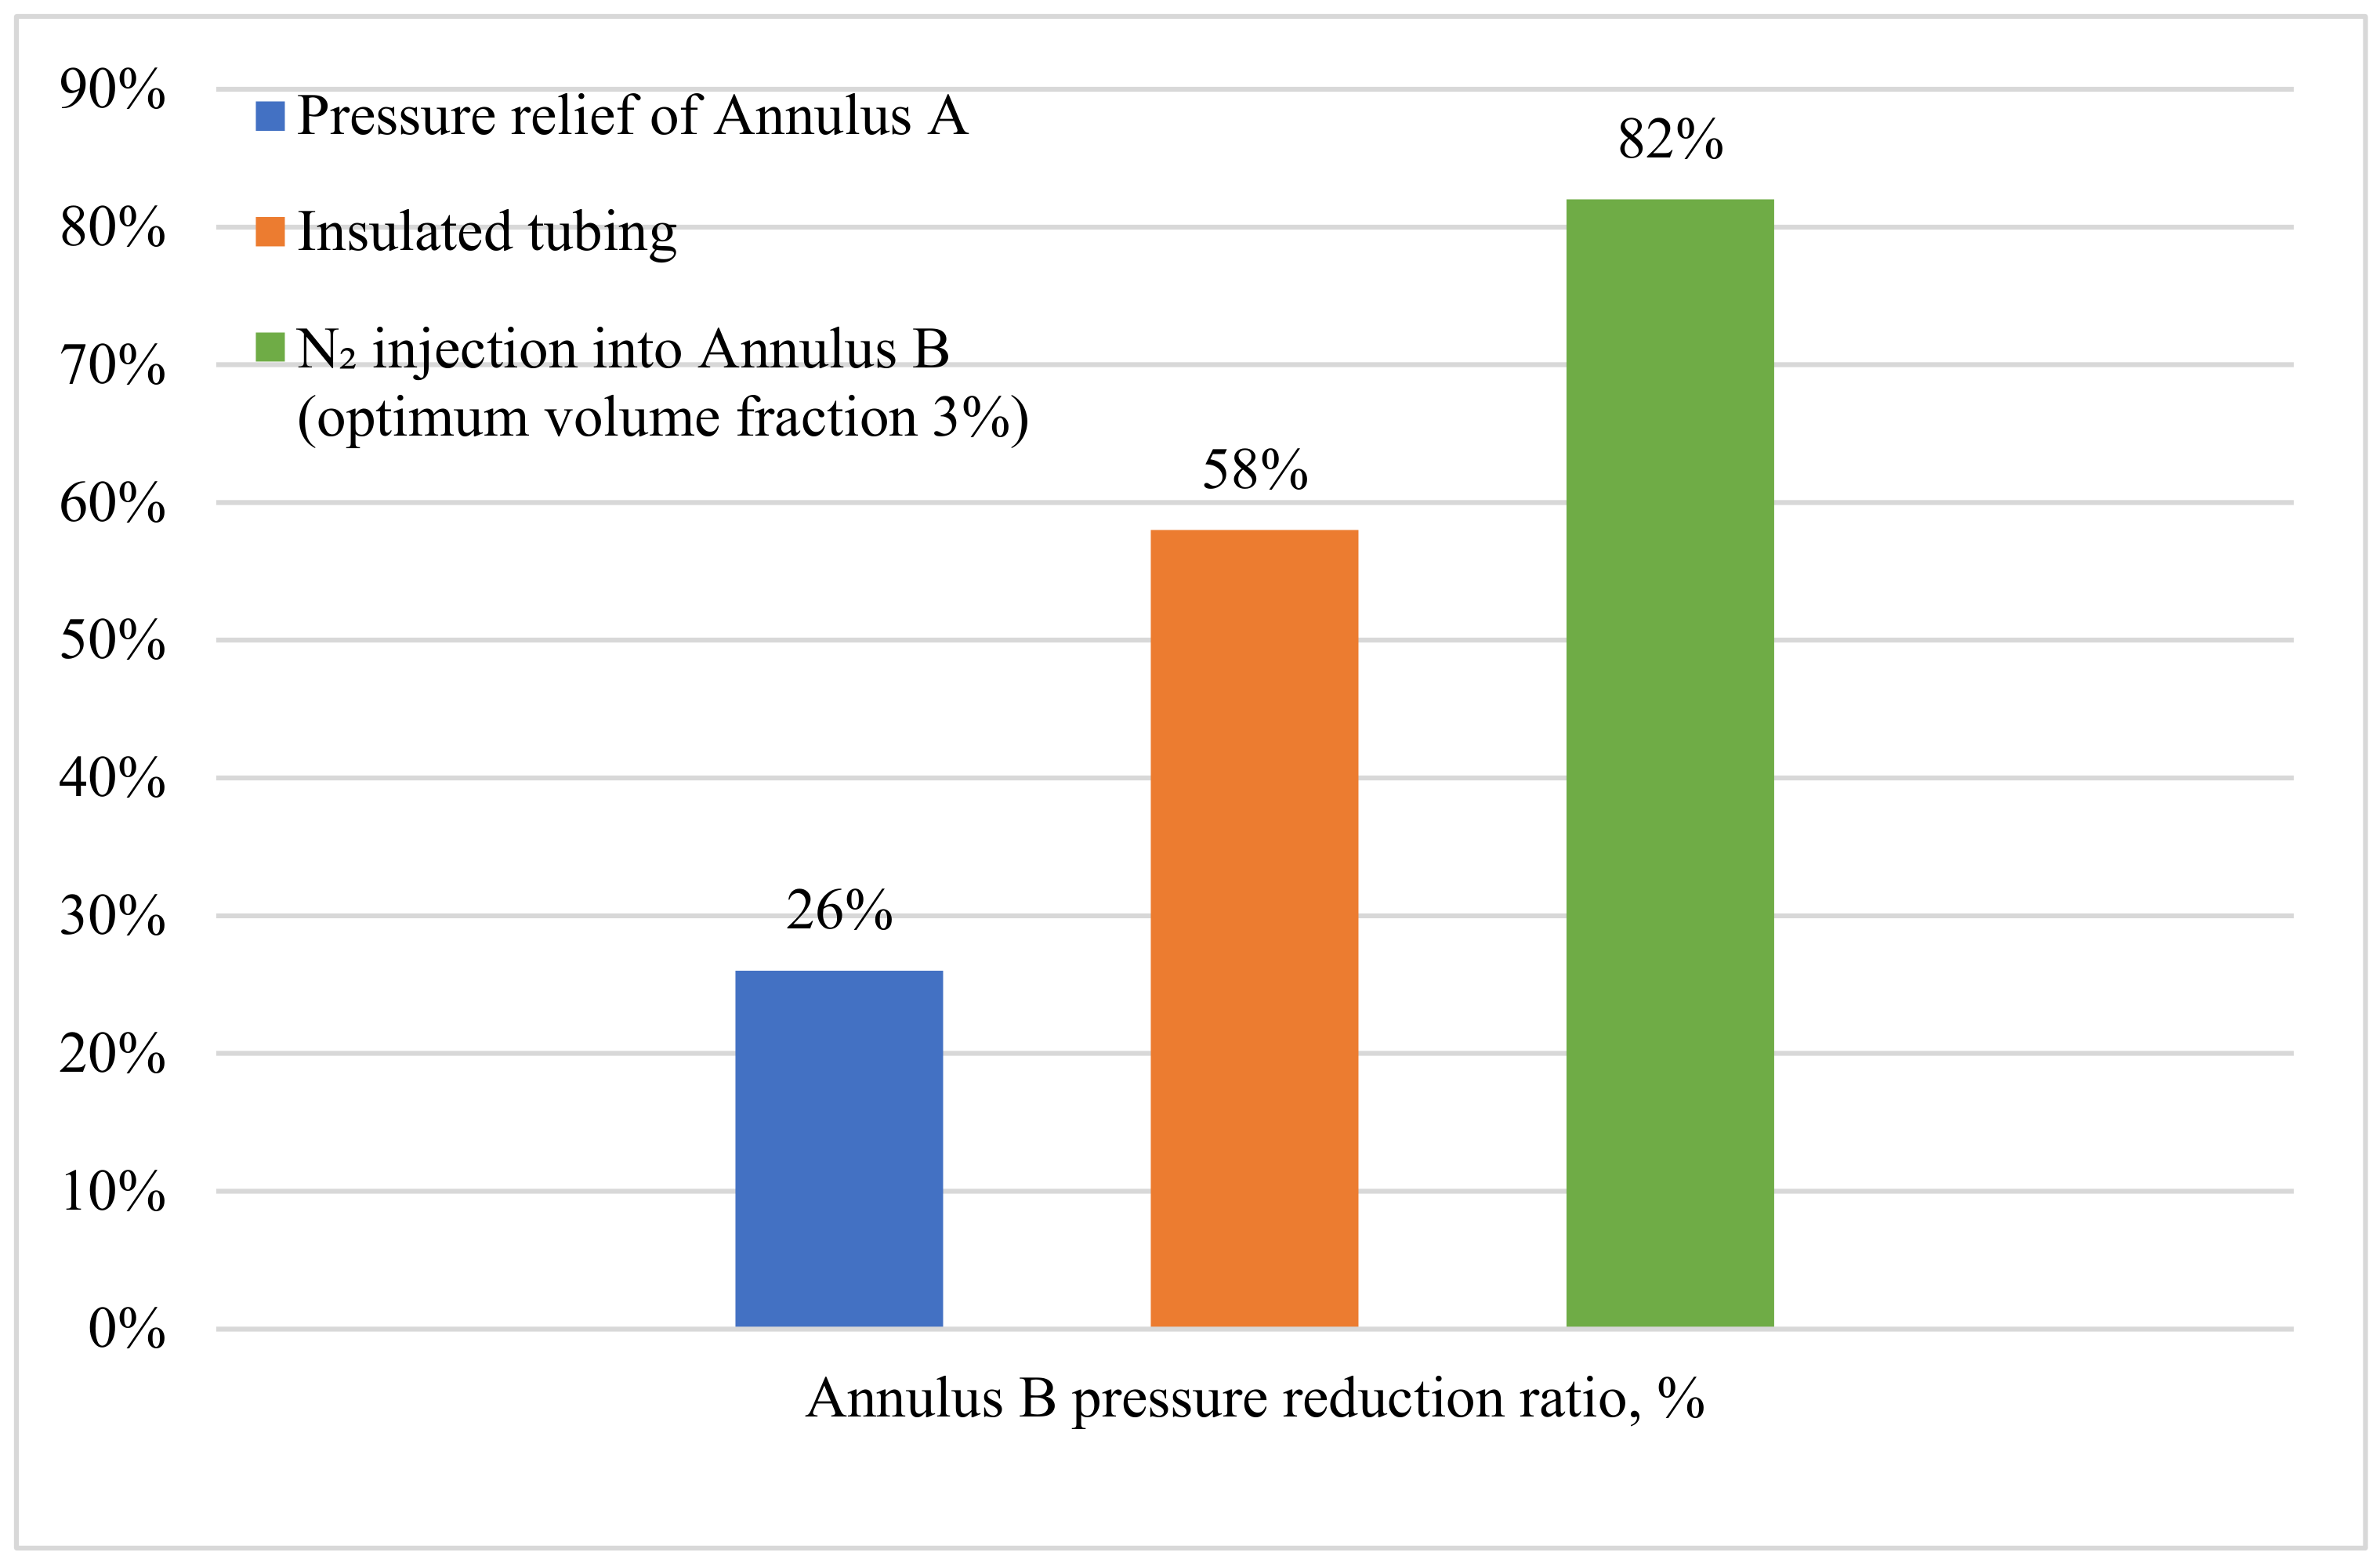
The pressure-reduction performances of the aforementioned three annular pressure control technologies are summarized and analyzed. Injecting nitrogen, accounting for 3% of annular volume, achieves the optimum pressure reduction rate of approximately 82%. Insulated tubing comes second with a pressure drop of about 58%, while direct pressure relief of Annulus A yields the weakest control effect at roughly 26%. Detailed results are presented in Figure 17.
In addition, substantial discrepancies exist among different sustained annular pressure control technologies in terms of technical performance, economic cost, operational complexity and long-term reliability.
Direct pressure relief of Annulus A: This method features the simplest operation with nearly zero investment cost and can be implemented on demand without pre-construction planning. It enables obvious pressure reduction in Annulus A and moderate pressure drop in Annulus B. Nevertheless, its overall depressurization efficiency is relatively limited. Relying on manual operation, its long-term reliability is subject to operating frequency and periodic sealing maintenance.
Insulated tubing: Installation is required during well completion, leading to high construction expenditure and complicated later retrofitting. Free of moving components, insulated tubing possesses favorable long-term reliability. Appropriate thermal insulation parameters should be determined according to well depth and service conditions, so this technology is preferred for gas wells with strict temperature management requirements.
Nitrogen injection into annulus: Preliminary design and construction are needed in the well construction phase, with initial capital mainly consumed by gas injection scheme design and equipment installation. No extra field intervention is required after implementation, resulting in low subsequent operation and maintenance costs. The optimal pressure control effect for Annulus B is achieved when the injected nitrogen volume accounts for approximately 3% of the total annular fluid volume. Benefiting from the superior chemical stability and high compressibility of nitrogen, this scheme delivers the best long-term reliability and is highly recommended for newly constructed wells.
Comprehensive comparison: Nitrogen injection demands a high upfront investment yet provides the most prominent depressurization and excellent long-term reliability, making it suitable for new wells. Direct venting of Annulus A is flexible and cost-effective, serving as a routine pressure adjustment measure for producing wells. Insulated tubing delivers medium pressure reduction at high capital cost and applies to critical temperature-sensitive wells. Furthermore, restricting the daily gas production rate is an effective auxiliary measure to suppress trapped annular pressure for high-yield gas wells.

5. Conclusions and Suggestions

(1) Aiming at the special production conditions of gas storage wells in North China, such as intensive injection and production, periodic temperature variation, high pressure and deep burial depth, a wellbore temperature field calculation model and a trapped annular pressure prediction model are established. The model fully considers the coupled heat transfer process among the wellbore string, cement sheath and formation, and is based on thermodynamic laws as well as the thermal expansion and compression effects of materials. Verified by a typical injection-production well in the North China gas storage, the average relative error of wellbore pressure prediction is 4.83%, with a coincidence degree of about 95%, which proves that the established model possesses good engineering applicability. It is noteworthy that to better reproduce the evolution of sustained annular pressure during working-condition switching of underground gas storage wells, developing a transient coupled model capable of simulating dynamic operating conditions is recommended as a key research priority in future work.
(2) Based on the established model, the influences of tubing dimension, annular fluid properties, string material and daily gas production on trapped annular pressure are systematically analyzed. The results show that daily gas production, annular temperature variation, fluid thermal expansion coefficient and isothermal compression coefficient have significant impacts on trapped pressure, among which annular temperature variation exerts the most dominant effect. Accordingly, reasonable regulation of gas production and selection of annular fluid with a low thermal expansion coefficient or high isothermal compression coefficient can effectively restrain the rise in annular pressure and reduce potential safety risks.
(3) For the case well, a comparative analysis is conducted on the control effects of three pressure mitigation measures, namely Annulus A pressure relief, nitrogen injection and insulated tubing application, on the trapped pressure of Annulus B. The results indicate that nitrogen injection into the annulus achieves the optimal pressure control performance. When the nitrogen injection volume accounts for approximately 3% of the total annular fluid volume, the reduction rate of trapped pressure reaches 82%, which is determined as the optimal injection proportion.
(4) The control of trapped annular pressure for gas storage wells shall adopt targeted and comprehensive countermeasures according to actual conditions. For new wells, it is recommended to prioritize the nitrogen injection technology for Annulus B during the well construction stage. For producing wells, pressure management can be implemented by combining Annulus A pressure relief, production regulation and insulated tubing retrofitting. In addition, installing rupture discs, one-way pressure relief valves and other devices can be adopted as auxiliary measures, which should be optimally selected according to wellbore structure, formation characteristics and economic benefits.

Author Contributions

Conceptualization, W.R. and X.Y.; Methodology, Z.Z. and Z.P.; Software, N.C.; Validation, L.L.; Investigation, X.B. and H.L.; Data curation, N.C.; Writing—original draft, N.C.; Writing—review and editing, X.D. All authors have read and agreed to the published version of the manuscript.

Funding

This research was supported by the National Natural Science Foundation of China (Grant Nos. U22A20164 and 52074234), the Sichuan Youth Science and Technology Innovation Research Team Special Program (Grant No. 2020JDTD0016), and the Open Fund of Sichuan Oil and Gas Development Research Center (No. 2025SY022).

Data Availability Statement

The original contributions presented in this study are included in the article. Further inquiries can be directed to the corresponding author.

Acknowledgments

This work was supported by the Engineering Technology Research Institute of PetroChina Huabei Oilfield Company and the State Key Laboratory of Oil and Gas Reservoir Geology and Exploitation, Southwest Petroleum University. The authors sincerely thank all contributors for their support in this study.

Conflicts of Interest

Authors Wei Rong, Xiaoping Yang, Zhong Pan, Liangwen Liu and Huayan Li are employed by the Engineering Technology Research Institute, Huabei Oilfield Company, PetroChina. Author Xiaobin Bai is employed by the CBM & Gas Storage Department, Huabei Oilfield Company, PetroChina. The remaining authors declare that the research was conducted in the absence of any commercial or financial relationships that could be construed as a potential conflict of interest.

References

  1. Davoodi, S.; Al-Shargabi, M.; Wood, D.A.; Thanh, H.V.; Makarov, N.; Podgaetsky, M. Advances in Underground Gas Storage: A Review of Current Practices and Future Prospects. Petroleum, 2026; in press. [CrossRef]
  2. Cao, L.; Sun, J.; Zhang, B.; Lu, N.; Xu, Y. Analysis of Multiple Annular Pressure in Gas Storage Well and High-Pressure Gas Well. Energy Eng. 2023, 120, 35–48. [Google Scholar] [CrossRef]
  3. Che, Z.; Zhang, Z.; Shi, T.; Tu, J.; Xiang, L.; Liu, N. Thermal expansion and pressure belt mechanism of annular fluid in high-temperature and high-pressure sulfur-containing gas wells. Nat. Gas Ind. 2010, 30, 88–90+145–146. [Google Scholar]
  4. Oudeman, P.; Kerem, E. Transient Behavior of Annular Pressure Build-up in HP/HT Wells. SPE Drill. Complet. 2006, 21, 234–241. [Google Scholar] [CrossRef]
  5. Wang, Z.; Chen, J.; He, X.; Yin, Y.; Liu, C. Analysis of Factors Influencing the Casing-tubing Annular Pressure of Gas Reservoir Wells. J. Southwest Pet. Univ. (Sci. Technol. Ed.) 2017, 39, 145–151. [Google Scholar]
  6. Zhang, B.; Guan, Z.; Lu, Z.; Hasan, A.R.; Wang, Q.; Xu, B. Trapped annular pressure caused by thermal expansion in oil and gas wells: A review of prediction approaches, risk assessment and mitigation strategies. J. Pet. Sci. Eng. 2019, 172, 70–82. [Google Scholar] [CrossRef]
  7. Sui, X.; Teng, Z.; Jia, S.; Wang, J.; Xu, C.; Zeng, X.; He, H. Gas Field Type Underground Gas Storage Well Borehole Pressure Calculation Model and Its Application. J. Northeast Pet. Univ. 2022, 46, 86–97+106+136–137. [Google Scholar] [CrossRef]
  8. Zhang, Z.; Xiang, S.; Yuan, Z.; Tang, H. A coupling prediction model of annular pressure build-up for deepwater oil and gas wells during transient-state testing. Geoenergy Sci. Eng. 2023, 230, 212162. [Google Scholar] [CrossRef]
  9. Alves, E.B.D.M.; Borges, R.J. Laplace transform-based modeling of heat transfer in producing wellbores. J. Braz. Soc. Mech. Sci. Eng. 2023, 45, 652. [Google Scholar] [CrossRef]
  10. Liu, S.; Luo, M.; Ma, C.; Wu, Y.; Tang, L.; Zhang, Z.; Ding, J. Safety Evaluation Method for Tubing Strings under Annular Trapping pressure in Deep Water High Temperature and High Pressure Gas Wells. Sci. Technol. Eng. 2024, 24, 4959–4968. [Google Scholar] [CrossRef]
  11. Hong, J.; Wang, Z.; Meng, L.; Shi, B.; Jing, K.; Cao, C.; Wang, Y. HTHP coupled fluid-thermal model for predicting wellbore temperature and pressure distribution of underground gas storage. Geoenergy Sci. Eng. 2025, 253, 213999. [Google Scholar] [CrossRef]
  12. Jiang, M.; Tan, C.; Li, J.; Cheng, X. Comparisons between protection fluid and nitrogen column in tube-casing annulus of gas storage wells. Acta Pet. Sin. 2017, 38, 1210–1216. [Google Scholar]
  13. Zhang, Y. Research on Reasonable Control Technology of Annular Control Pressure in Gas Storage Wells. Master’s Thesis, China University of Petroleum (East China), Qingdao, China, 2021. Available online: https://kns.cnki.net/kcms2/article/abstract?v=t_h3i5Pmq2wbECZk1aK7DZN1Ph1ICi7JikUckyJHz8g6IKhLnXMG7ozNrDwxEgrJuKLcMyNUMB2SpUb6R-o8HOQfQfGtB38XVK6M5MeBfLj5MmSiDLeyLzT0yr1vjB7P04gqS-ws12SssBo4C-nnkDeQXfHzuXlqXXneWqo9XAeKznwrL4n-zA==&uniplatform=NZKPT&language=CHS (accessed on 9 June 2026).
  14. Liu, Y.; Yan, Y.; Song, Y.; Yan, X. Risk Assessment of Annular Pressure Buildup in Natural Gas Storage. Pet. Tubul. Goods Instrum. 2022, 8, 51–56. [Google Scholar] [CrossRef]
  15. Yang, S.; Fu, J.; Zhao, N.; Xu, C.; Han, L.; Wang, J.; Liu, H.; Zhang, Y.; Liu, J. Comprehensive Analysis of the Annulus Pressure Buildup in Wells with Sustained Gas Leakage Below the Liquid Level. Processes 2024, 12, 2631. [Google Scholar] [CrossRef]
  16. Zhang, C.; Liu, Y.; He, J.; Hao, X.; Li, M. Study on Variation Law of Wellbore Temperature and Annular Pressure Under Injection-production Conditions of Gas Storage Wells. In Proceedings of the 34th National Natural Gas Academic Annual Conference, Suzhou, China, 19–21 September 2024; Chinese Petroleum Society: Beijing, China, 2024; p. 23. [Google Scholar] [CrossRef]
  17. Liu, J.; Song, X.; Zhang, Z.; Ding, J.; Ding, Y. Prediction Method for Annular Pressure Buildup in Deepwater Wells Based on Fluid Solid Phase Deposition. Processes 2025, 13, 890. [Google Scholar] [CrossRef]
  18. Guan, S.; Chen, X.; Liu, S.; Yang, J.; Qin, J.; Zhou, X. Experimental Investigation on the Functional Performance of Rupture Disks Under Annular Pressure Conditions in Deepwater Gas Wells. Processes 2026, 14, 1180. [Google Scholar] [CrossRef]
  19. Shi, Y.; Tang, Y.; Ma, T.; He, Y. Pressure Relief Control Model of Rupture Disk for Annular Pressure Build-up in Deep-water Wells. J. Southwest Pet. Univ. (Sci. Technol. Ed.) 2020, 42, 153–160. [Google Scholar]
  20. Yang, J.; Tang, H.; Liu, Z.; Yang, L.; Huang, X.; Yan, D.; Tian, R. Prediction model of casing annulus pressure for deepwater well drilling and completion operation. Pet. Explor. Dev. 2013, 40, 616–619. [Google Scholar] [CrossRef]
  21. Hasan, A.R.; Izgec, B.; Kabir, C.S. Ensuring sustained production by managing annular-pressure buildup. In Proceedings of the EUROPEC/EAGE Conference and Exhibition, Amsterdam, The Netherlands, 8–11 June 2009. SPE 121754. [Google Scholar]
  22. Ramey, H.J. Wellbore Heat Transmission. J. Pet. Technol. 1962, 14, 427–435. [Google Scholar] [CrossRef]
  23. Zhang, Z.; Cai, N.; Zhao, Y.; Zhang, H.; Li, Y.; Zhang, L. A calculation method of nitrogen column length for controlling annular overpressure in underground gas storage wells with intensive production and injection. Nat. Gas Ind. 2021, 41, 83–88. [Google Scholar] [CrossRef]
  24. Zhao, J.; Wang, G.; Liu, L.; Ma, B.; Wang, Y.; Xie, J. Annulus pressure relief device and method of gas storage injection-production well. Pet. Knowl. 2024, 4, 52–55. [Google Scholar]
  25. Dong, G.; Chen, P. A review of the evaluation methods and control technologies for trapped annular pressure in deepwater oil and gas wells. J. Nat. Gas Sci. Eng. 2017, 37, 85–105. [Google Scholar] [CrossRef]
  26. Liu, Z.; Samuel, R.; Gonzales, A.; Kang, Y. Modeling and simulation of annular pressure buildup mitigation using rupture disk. In Proceedings of the IADC/SPE Drilling Conference and Exhibition, Fort Worth, TX, USA, 1–3 March 2016. SPE 178807-MS. [Google Scholar] [CrossRef]
  27. Chai, S.; Wang, D.; Wang, X. Application of Wellbore Insulated Tubing Technique in Bohai High Waxy Oilfield B. Tianjin Sci. Technol. 2024, 51, 88–90+95. [Google Scholar] [CrossRef]
  28. Fu, Y.; Dou, Q.; Liu, W.; Sun, M.; Sun, B.; Hu, J. Coupling model for calculating wellbore temperature distribution of thermal insulation tubing. Pet. Geol. Eng. 2023, 37, 103–106. [Google Scholar]
  29. Zeng, W.; Wang, X.; Li, F.; Zhang, J.; Zeng, D. Analysis of Heat Loss of Lined Insulation Tubing in Heavy Oil Wells and Optimization of Recovery Parameters. Spec. Oil Gas Reserv. 2024, 31, 144–151. [Google Scholar] [CrossRef]
  30. Li, C.; Guan, Z.; Zhang, B.; Zhou, Y.; Wang, Q.; Yan, Y.; Han, C. Study on Trapped Pressure in Tubing-Casing Annulus at Early Production Stage in HTHP Wells. China Pet. Mach. 2020, 48, 43–50. [Google Scholar] [CrossRef]
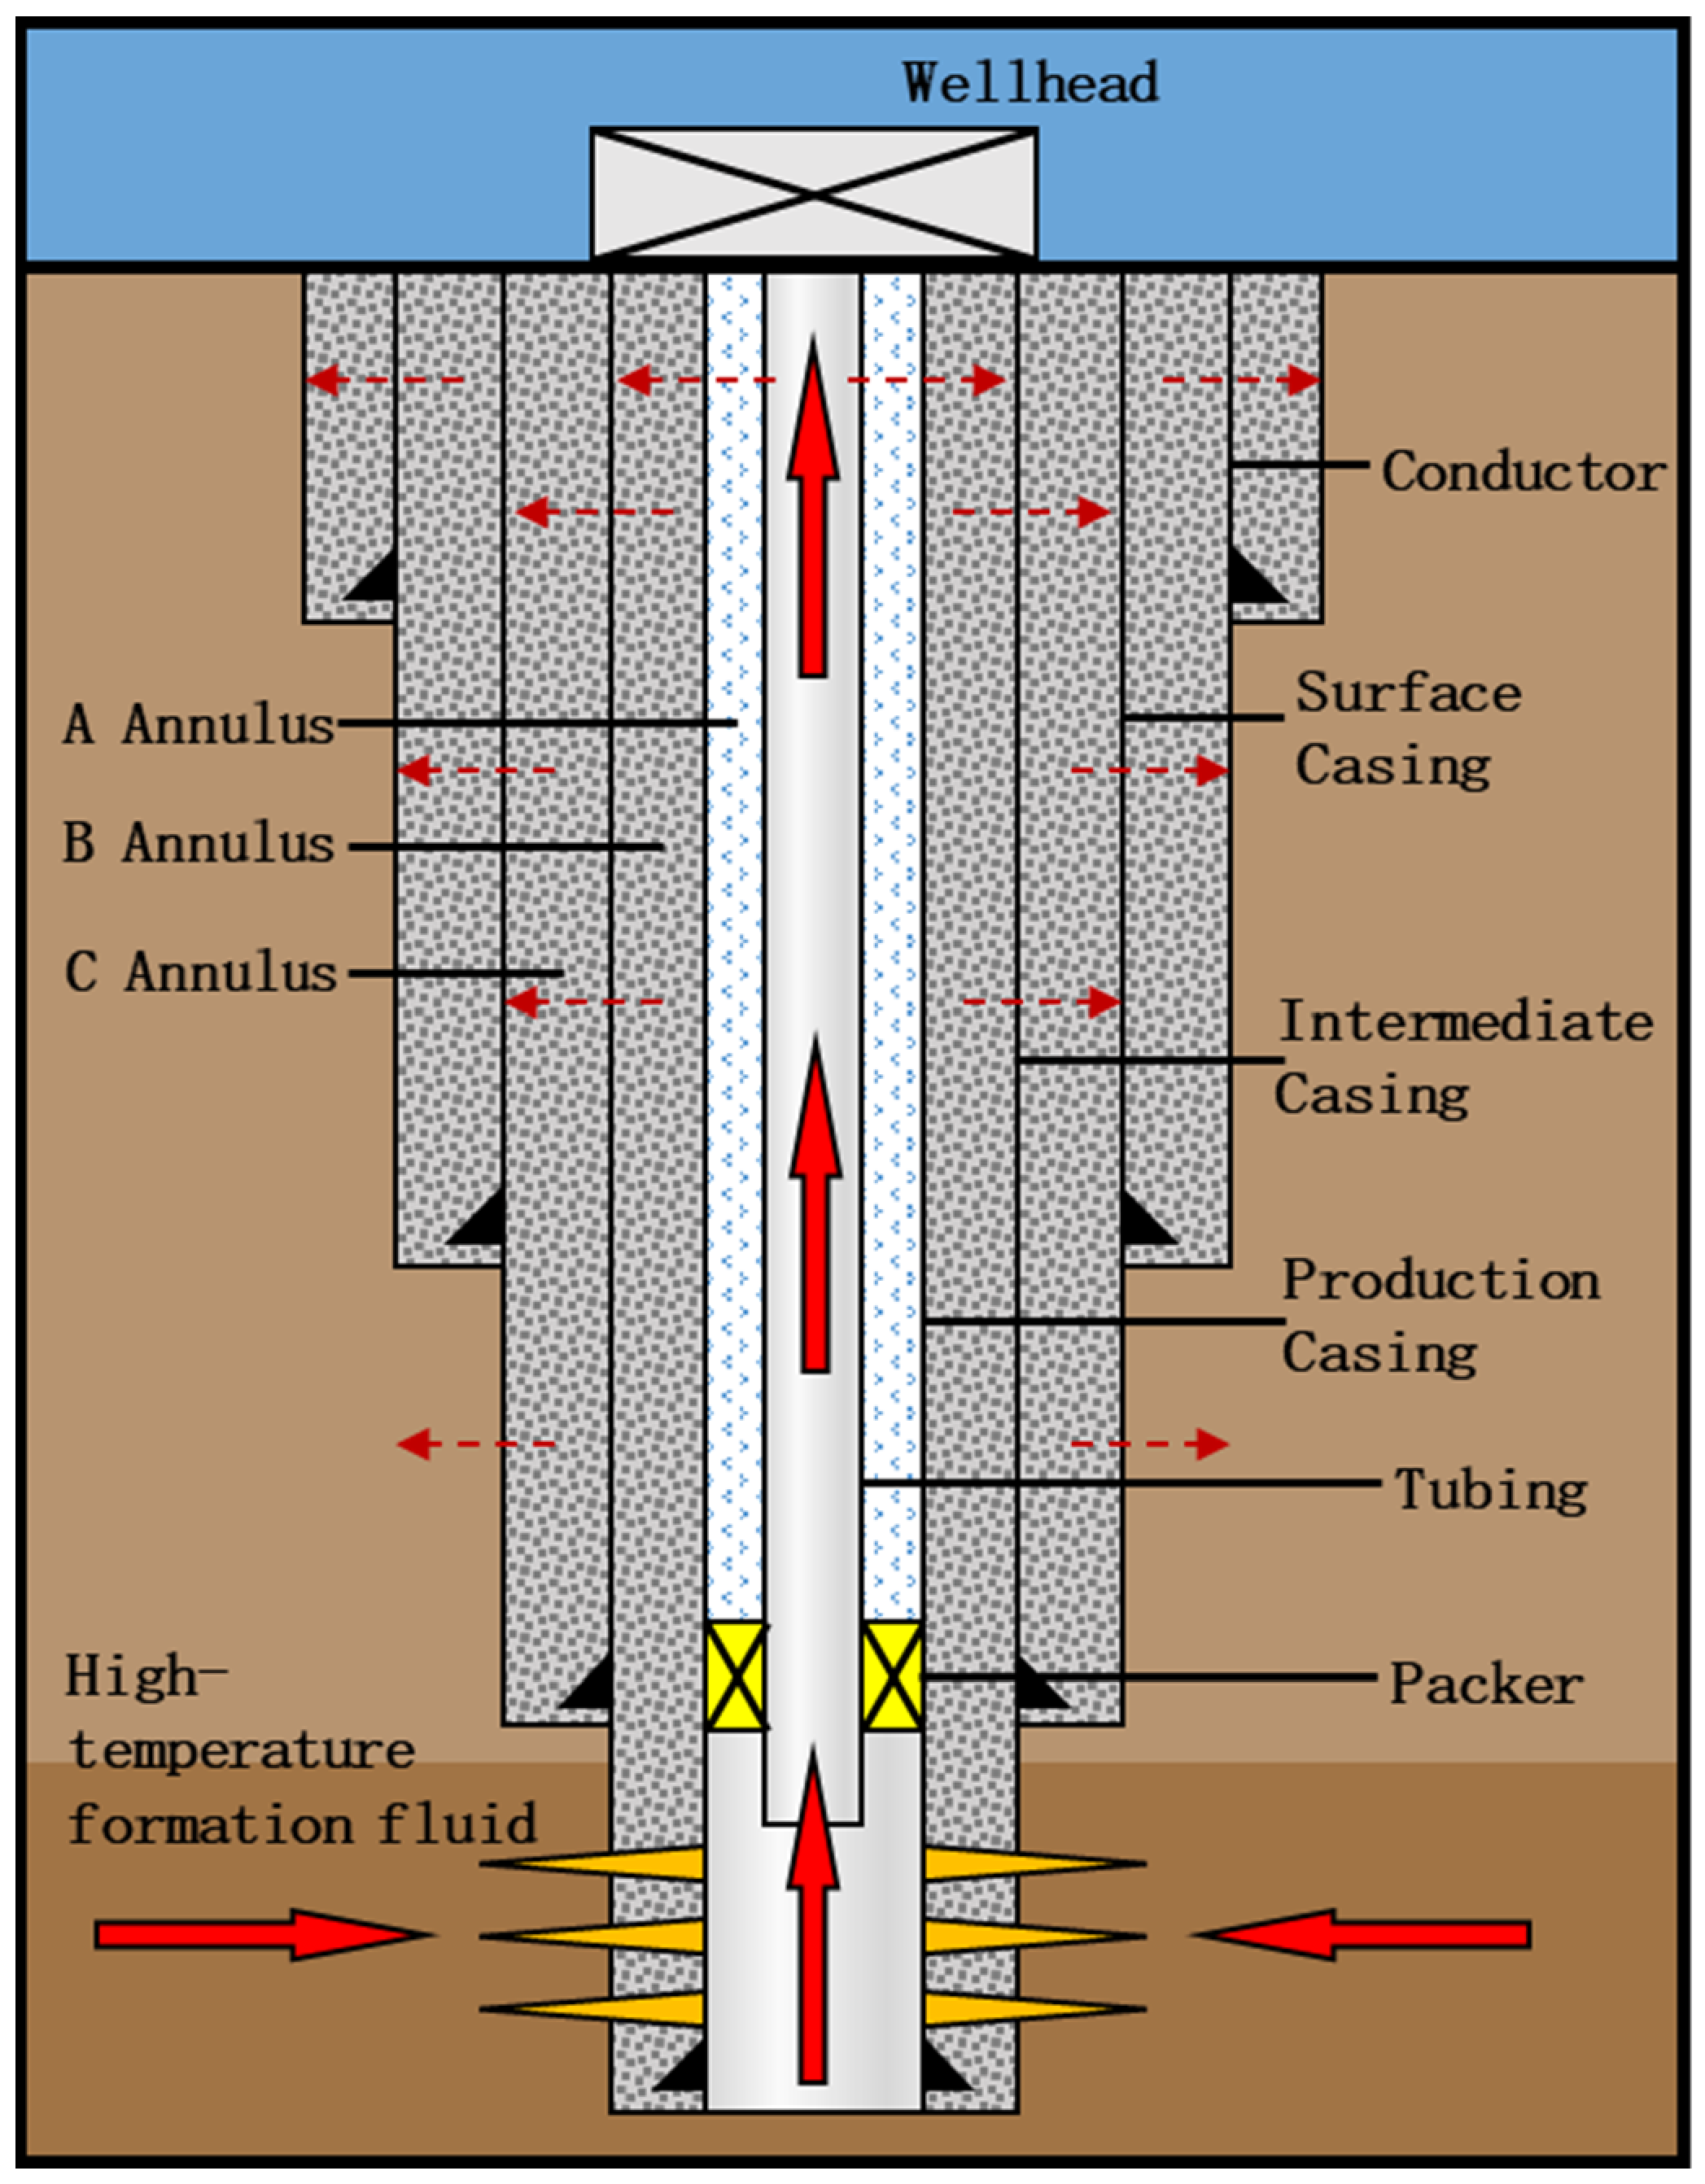
Figure 1. Wellbore structure and gas production heat transfer schematic of typical gas storage well.
Processes 14 01949 g001
Figure 2. Radial heat transfer distribution of typical gas storage wellbore.
Processes 14 01949 g002
Figure 3. Mechanical force and volume variation in tubing string subjected to internal pressure, external pressure and temperature change.
Processes 14 01949 g003
Figure 4. Variation trend of wellbore pressure prediction error with depth.
Processes 14 01949 g004
Figure 5. Influence of Different Tubing Outer Diameters on Annulus Trapped Pressure.
Processes 14 01949 g005
Figure 6. Influence of tubing wall thickness on trapped annular pressure.
Processes 14 01949 g006
Figure 7. Influence of fluid thermal expansion coefficient on trapped annular pressure.
Processes 14 01949 g007
Figure 8. Influence of fluid isothermal compressibility on trapped annular pressure.
Processes 14 01949 g008
Figure 9. Influence of casing material thermal expansion coefficient on trapped annular pressure.
Processes 14 01949 g009
Figure 10. Influence of daily gas production rate on trapped annular pressure.
Processes 14 01949 g010
Figure 12. Wellbore structure of a field gas storage well.
Processes 14 01949 g012
Figure 13. Wellbore temperature field distribution of field example well.
Processes 14 01949 g013
Figure 14. Influence of Annulus A bleeding volume on annulus trapped pressure.
Processes 14 01949 g014
Figure 15. Wellbore temperature field distribution with insulated tubing.
Processes 14 01949 g015
Figure 16. Distribution of Annulus B trapped pressure with different nitrogen foam ratios.
Processes 14 01949 g016
Figure 17. Comparison of pressure control performance for different annular pressure control measures.
Processes 14 01949 g017
Table 1. Verification of calculation results of wellbore pressure.
True Vertical Depth/mField Measured Pressure/MPaModel Calculated Pressure/MPaError Value/MPaRelative Error/%
025.9525.350.602.31%
100028.2628.310.050.19%
200030.5231.260.742.44%
250031.6332.731.103.48%
300032.7634.201.444.39%
350033.9335.691.765.17%
380034.6136.591.985.71%
410035.2837.492.216.25%
440035.9938.392.406.66%
460036.4639.002.546.96%
480036.8739.622.757.46%
499037.5840.202.626.97%
average value//1.68 4.83%
Disclaimer/Publisher’s Note: The statements, opinions and data contained in all publications are solely those of the individual author(s) and contributor(s) and not of MDPI and/or the editor(s). MDPI and/or the editor(s) disclaim responsibility for any injury to people or property resulting from any ideas, methods, instructions or products referred to in the content.