Article

Size-Dependent Pore Responses to Stress and Temperature of Anthracite Samples from the Qinshui Basin in North China Using NMR: Implications for Deep Coalbed Methane Exploitation
1
School of Resources and Geoscience, China University of Mining and Technology, Xuzhou 221008, China
2
Shanxi Coalbed Methane Exploration and Development Company, Huabei Oilfield, PetroChina, Changzhi 046000, China
3
Nuclear Industry Jingxiang Construction Group Co., Ltd., Huzhou 313000, China
*
Author to whom correspondence should be addressed.
Processes 2026, 14(12), 1884; https://doi.org/10.3390/pr14121884
Submission received: 20 April 2026 / Revised: 4 June 2026 / Accepted: 9 June 2026 / Published: 10 June 2026

Abstract

High-production wells of deep coalbed methane have been widely reported during the last decade. The Qinshui Basin in China is rich in deep coalbed methane resources, but the pore size distribution characteristics of coal under high-temperature and high-stress conditions remain unclear, affecting the formulation of coalbed methane development strategies. In this study, nuclear magnetic resonance simulations were conducted on anthracite samples from the Zhaozhuang and Sihe mines in the Qinshui Basin under varying temperatures and confining pressures, and the difference in stress and temperature sensitivity of pores with varying sizes was determined. The results show that the pores exhibit strong stress sensitivity but weak temperature dependence. Total porosity decreases with increasing confining pressure, with a maximum damage rate of 6.55%. Pore-size heterogeneity governs differential responses: micropores and macropore fractures show reduced porosity, whereas mesopores exhibit minor increases. Temperature-driven porosity changes occur in distinct phases: at lower temperatures (20–35 °C), damage rates escalate with heating, while at elevated temperatures (35–50 °C), sensitivity diverges due to the variations in native fracture structures. Furthermore, stress and temperature responses correlate with the developmental state of pre-existing pores/fractures and mineral infill. These findings provide critical insights for optimizing coalbed methane exploitation in deep anthracite reservoirs.

1. Introduction

A series of major technological and industrial breakthroughs have been achieved in the exploration and development of deep coalbed methane in China in recent years, such as the Ordos Basin, laying a solid foundation for the strategic transition to unconventional natural gas resources [1,2,3]. As a critical region for coalbed methane development in China, the Qinshui Basin has been considered as one of the most important industrial bases due to the relatively stable tectonic structure, excellent cap conditions, and resource endowment [4,5,6]. Following more than two decades of continuous development, shallow coalbed methane resources in the Qinshui Basin have now entered a phase of comprehensive exploration and intensive exploitation. Most shallow areas feature high well network densities and a high degree of resource utilization [7,8,9]. However, abundant coalbed methane resources in deep reservoirs remain relatively unexploited [10,11,12]. With the maturation of key technological systems, including innovations in geological theory, horizontal drilling, large-scale volumetric fracturing, and efficient production, the global challenges long associated with deep coalbed methane, such as low permeability, high stress, and the difficulty of achieving high production, are gradually being overcome [13,14,15]. Therefore, considering that the development of shallow resources in the Qinshui Basin is nearing saturation, the expansion of coalbed methane development into deeper strata has become an inevitable choice.
The pore and fracture characteristics are the critical geological parameters that control the occurrence, migration pathways, and production efficiency of coalbed methane, and the heterogeneity of pore structure determines the gas content and recoverability of reservoirs [16,17,18,19]. The contribution of pores with different sizes to coalbed methane production varies greatly; for example, micropores constitute the primary adsorption space, affecting the coalbed methane occurrence state [20,21,22,23]. Mesopores and macropores exert a significant effect on gas diffusion, and pore size distribution and connectivity jointly determine the permeability of coal [24,25,26,27]. The quantitative evaluation of pore structure mostly relies on experiments, such as high-pressure mercury injection, low-temperature liquid N2 and CO2 adsorption, and low-field nuclear magnetic resonance (NMR) [28,29,30,31]. These methods enable the relatively accurate determination of key parameters such as total pore size distribution, pore volume, and specific surface area, providing a crucial basis for evaluating coalbed methane production potential [32,33,34]. However, for the development of deep coalbed methane, constraints such as great depth and the difficulty of coring mean that conducting large-scale experiments on the pore structure of deep coal faces high costs. In contrast, shallow coal seams have been extensively explored with numerous data, and the patterns of pore structure evolution and the controlling factors have been determined [35,36]. Establishing a correlation model for the pore structure of coal with different depths, and thereby predicting the pore structure of deep coal, can effectively reduce exploration risks and experimental costs.
A critical difference between deep and shallow reservoirs lies in the significant changes in temperature and stress conditions. Experiments on deep coal samples from the Ordos Basin, Guizhou, and Xinjiang indicate that as effective stress increases, pores are prone to compression and closure, leading to a substantial reduction in pore connectivity and permeability [37,38,39]. A rising temperature reduces pore volume through the thermal expansion of the coal matrix and generates thermal stresses that alter the development of microfractures, accompanied by an effect on the adsorption-desorption equilibrium of coalbed methane [40,41,42]. Therefore, the pores of varying sizes respond to temperature and pressure conditions to a markedly different degree. Moreover, the pore structure is closely related to the organic matter maturity. The porosity of coal generally shows a U-shape change with increasing vitrinite reflectance, and the proportion of micropores significantly increases with increasing coal rank, enhancing the adsorption capacity [43,44,45]. The coal seams in the Qinshui Basin exhibit higher organic matter maturity and, as expected, more developed micropores [46,47,48], leading to the findings from the Ordos Basin not being directly applied, and the extent to which pores with varying sizes respond to temperature and stress variations remains unclear. Therefore, it is significant to clarify the size-dependent response mechanisms of pores to temperature and stress variations in anthracite.
To clarify differential changes in pores with varying sizes affected by temperatures and stresses, this study conducted physical simulations of anthracite reservoir porosity under in situ temperature-pressure conditions using low-field NMR. Through gradient-controlled thermobaric experiments, total porosity and pore-type variations in coal samples were determined, ultimately revealing stress and temperature sensitivity patterns of pores with varying sizes in deep anthracite reservoirs. These findings offer insights for predicting pore structure and formulating development strategies in deep anthracite reservoirs.

2. Materials and Methods

2.1. Samples

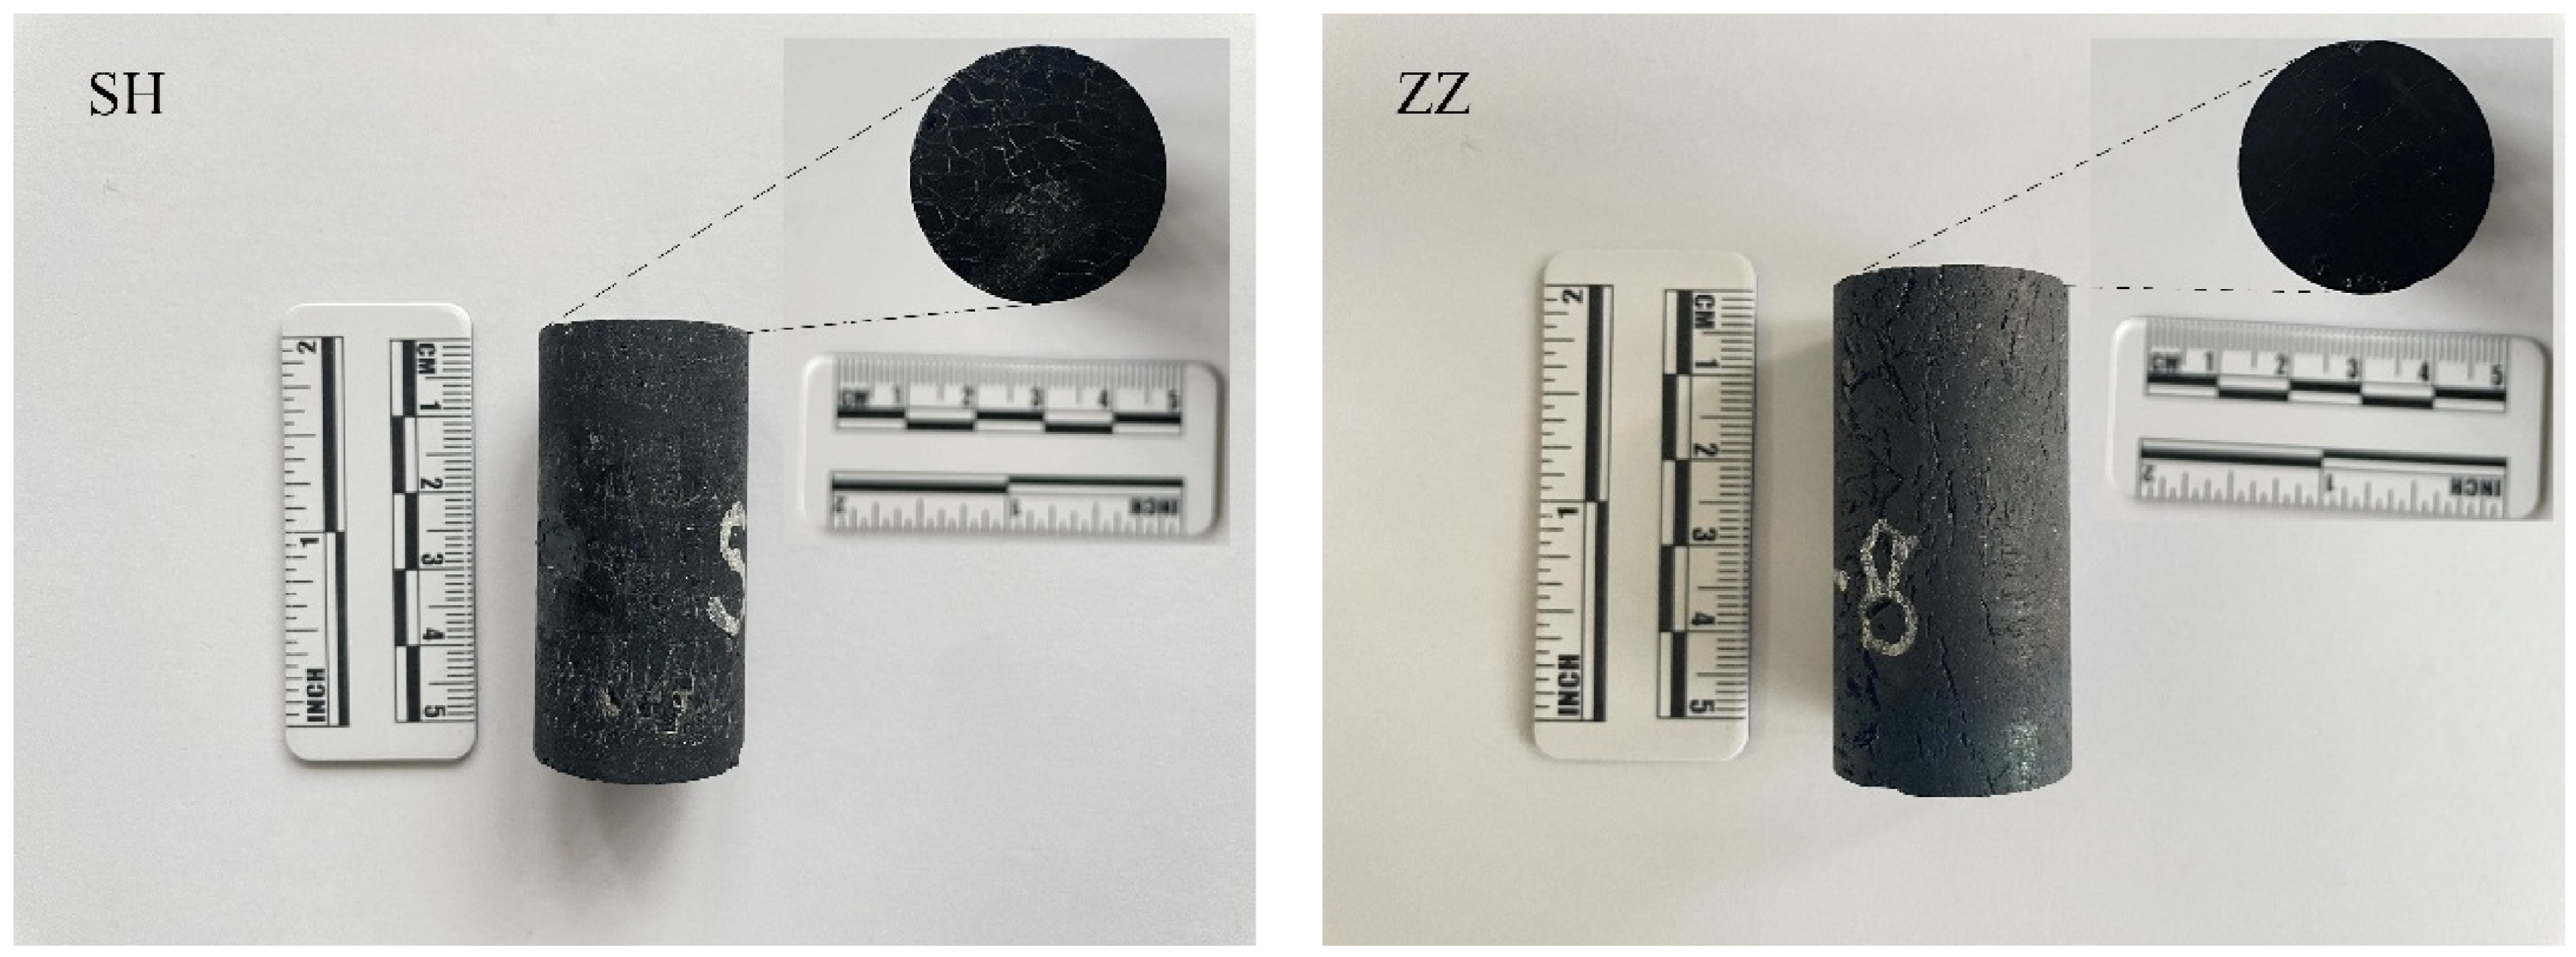
The two selected coal samples were collected from fresh coal seams (No. 15 coal in the Taiyuan Formation) at the Zhaozhuang and Sihe mines in Jincheng City in the southern Qinshui Basin, North China. To preserve sample integrity, large coal blocks (30 × 30 × 30 cm) were immediately wrapped in cling film, labelled to prevent contamination and oxidation, and transported to the laboratory for systematic preparation. Cylindrical plunger samples (25 mm diameter × 50 mm length) were drilled along bedding planes with strict tolerances: end parallelism ≤ 0.05 mm, diameter variation ≤ 0.3 mm, and axial deviation ≤ 0.25°. These specimens were used for confining pressure-dependent low-field nuclear magnetic resonance (NMR) experiments (Figure 1). Post-processing observations revealed distinct fracture characteristics: the Sihe sample exhibited irregular, interconnected fissures predominantly filled with minerals, whereas the Zhaozhuang sample showed isolated, sparsely filled fractures. For vitrinite reflectance analysis, 200 g of coal fragments (≥2 mm particle size) were prepared. Additionally, 250 g of pulverized samples (80–100 mesh, 0.15–0.18 mm) were processed for industrial composition testing.
The Zhaozhuang and Sihe samples exhibit distinct organic compositions. Maximum vitrinite reflectance values are 2.333% and 3.18% for Zhaozhuang and Sihe, respectively. Both samples are dominated by vitrinite (81.33% and 77.58%) and inertinite (18.67% and 22.42%), with, as expected, no detectable liptinite content (Table 1).
The Zhaozhuang and Sihe samples share comparable moisture content (1.0% vs. 1.6%). However, Zhaozhuang exhibits higher fixed carbon, lower ash content (11.1%), and reduced volatile matter compared to Sihe (37.65% ash). Notably, according to the Chinese standard classification for quality of coal—Part 1: Ash (GB/T 15224.1-2018 [49]), the Zhaozhuang sample belongs to the low-medium ash coal, while the Sihe sample falls into the medium-high ash category (Table 1).

2.2. Experiments

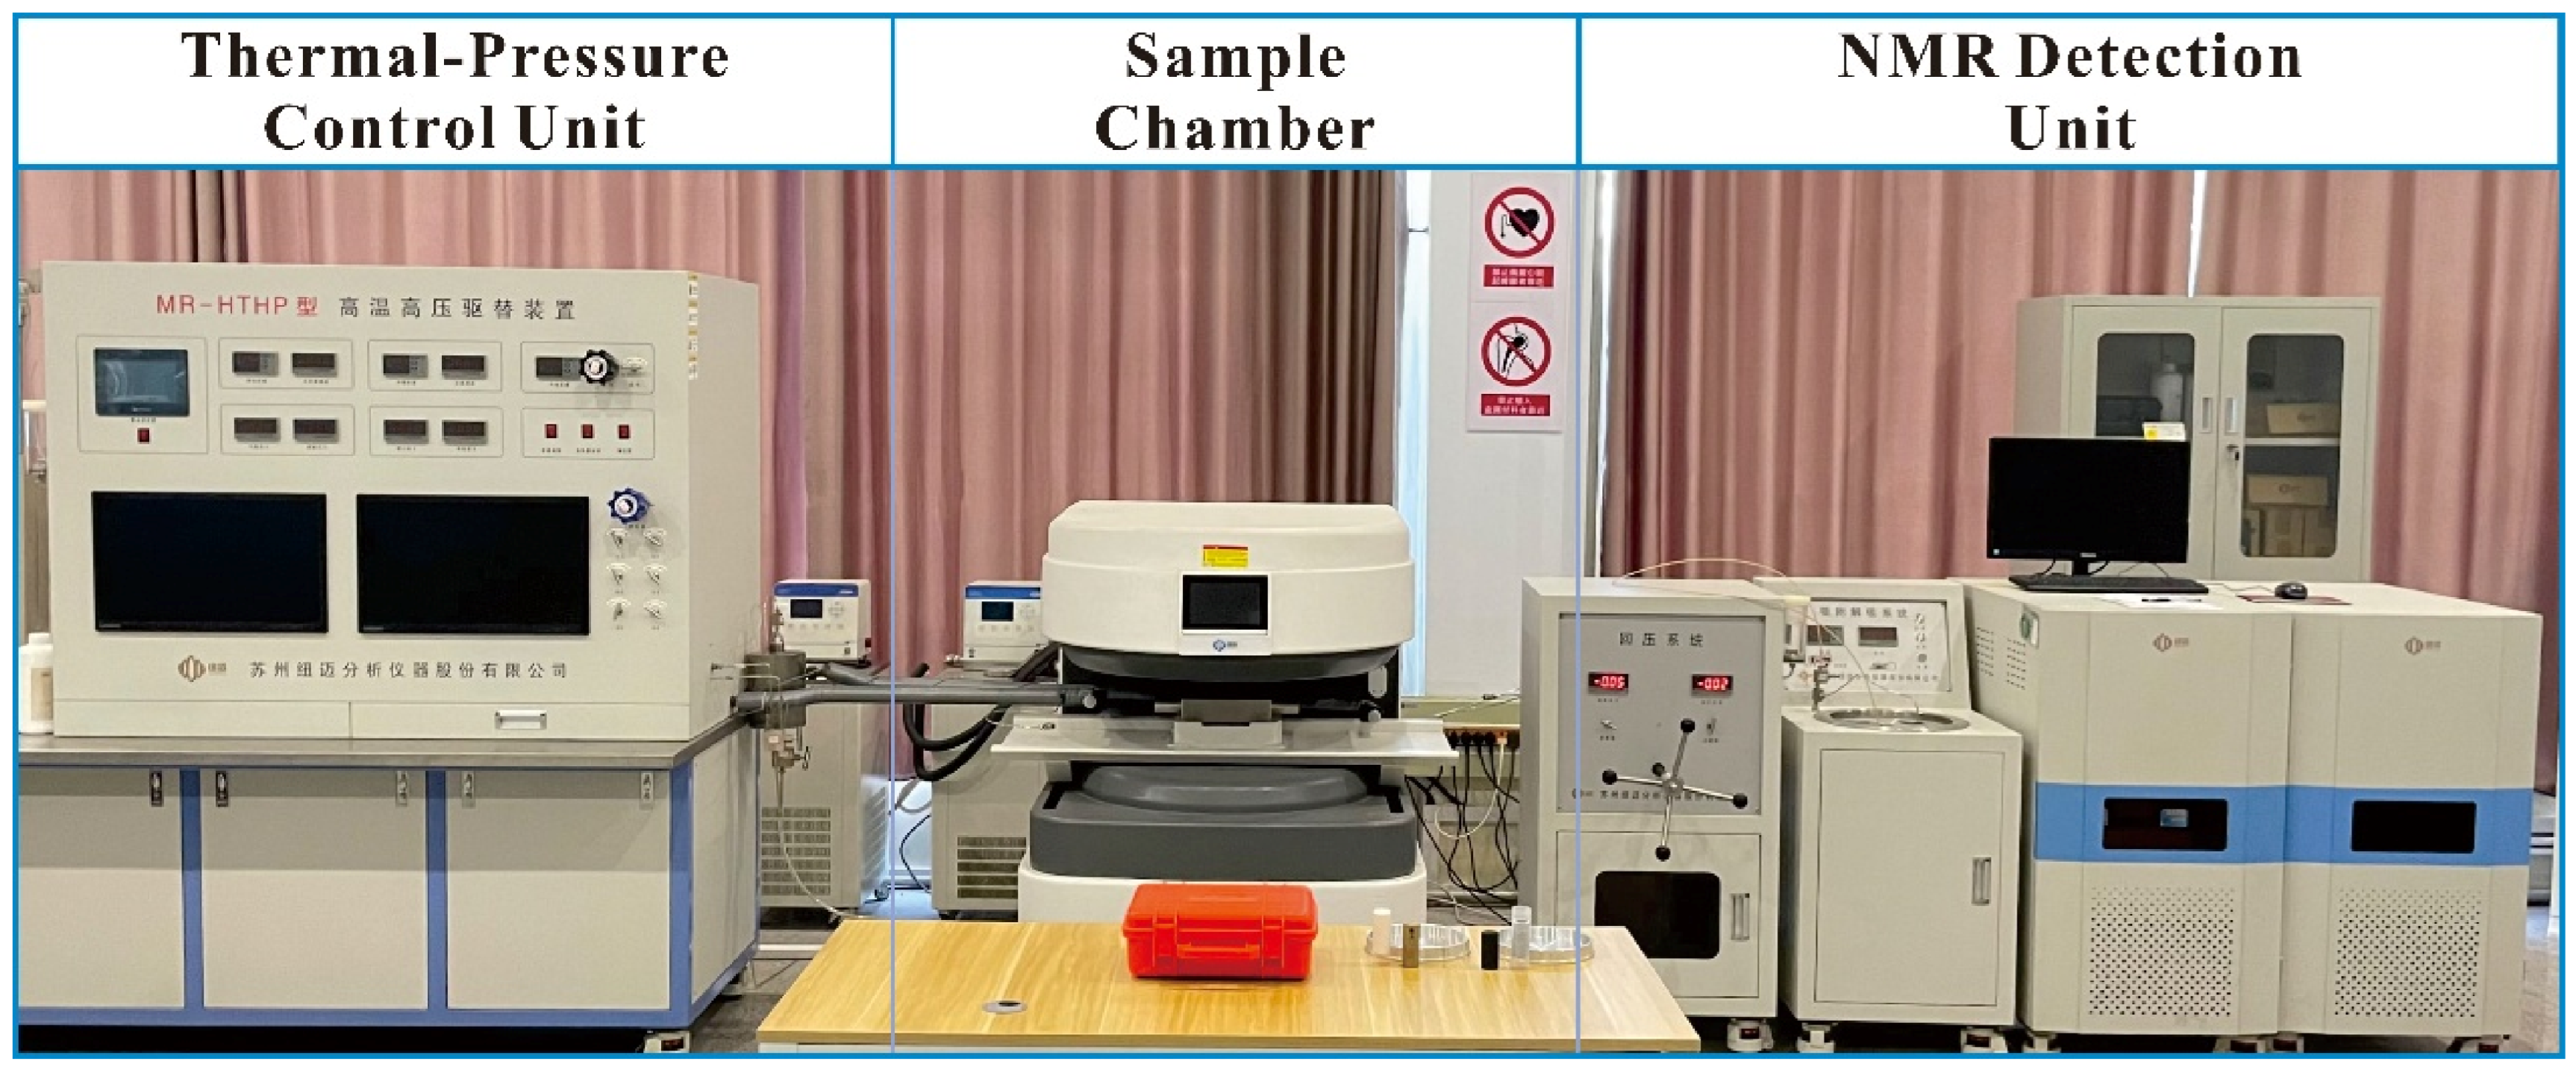
The LF-NMR system (MacroMR12-150H-I, Niumag Electronics, China; Figure 2) comprised three core modules: (1) Sample Chamber: A non-magnetic, oxygen-free cylindrical holder fabricated from high-temperature/high-pressure-resistant material. (2) Thermal-Pressure Control Unit: Fluorinated oil served as the pressure-transfer medium. A constant-flow pump and thermostatic device enabled simultaneous application of confining pressure and temperature, replicating in situ geological conditions. (3) NMR Detection Unit: Performed real-time T2 spectrum acquisition and spatial imaging during thermo-mechanical loading. System parameters included a 23.34 MHz resonance frequency, 0.5 T magnetic field, 25 mm probe coil, and 32 °C magnet temperature. Data acquisition utilized CPMG pulse sequences with SIRT algorithm inversion. Key settings: SW = 250 KHz, TE = 0.25 ms, TW = 2000 ms, NECH = 10,000, NS = 32.
Main procedures for experiments included: (1) Sample Preparation: Coal cylinders ( φ 25 mm × 50 mm) were vacuum-degassed using a saturation apparatus to remove pore contaminants. Subsequently, samples were pressure-saturated with distilled water for 24 h under vacuum to achieve full saturation. (2) Sample Mounting: Saturated coal cylinders were secured in holders using hydrogen-free heat-shrink tubing. The holders were then installed into the MacroMR12-150H-I-40 NMR probe for signal acquisition. (3) Testing procedure: The temperature and pressure of the coal sample inside the probe were adjusted by heating or pressurizing the fluorinated fluid through the MR-HTHP high-temperature/high-pressure displacement system to simulate the temperature and pressure conditions in deep formations in the study area. The confining pressure was first gradually increased to 10 MPa with the temperature set at 20 °C. After waiting for 15 min to ensure the sample reached the target temperature, scanning was initiated. Upon completion of the scan, the temperature was sequentially raised through the series of 25 °C, 30 °C, 35 °C, 40 °C, 45 °C, and 50 °C. At each temperature level, the system was maintained for 15 min before conducting tests under the same confining pressure. After completing the temperature sequence, the sample chamber was allowed to cool for 30 min. The confining pressure was then set sequentially to 15 MPa, 20 MPa, 25 MPa, and 30 MPa, with the aforementioned temperature sequence repeated at each pressure level. Following each scan, sufficient interval time was ensured to achieve the designed temperature, while the pressurization rate was controlled to maintain sample stability. The low-temperature unit data were monitored to keep the coil temperature within the probe constant at 25 °C. Each experimental condition was tested twice, with the error between the total peak areas of the two tests maintained below 1%.

3. Results

3.1. T2 Spectral Distribution

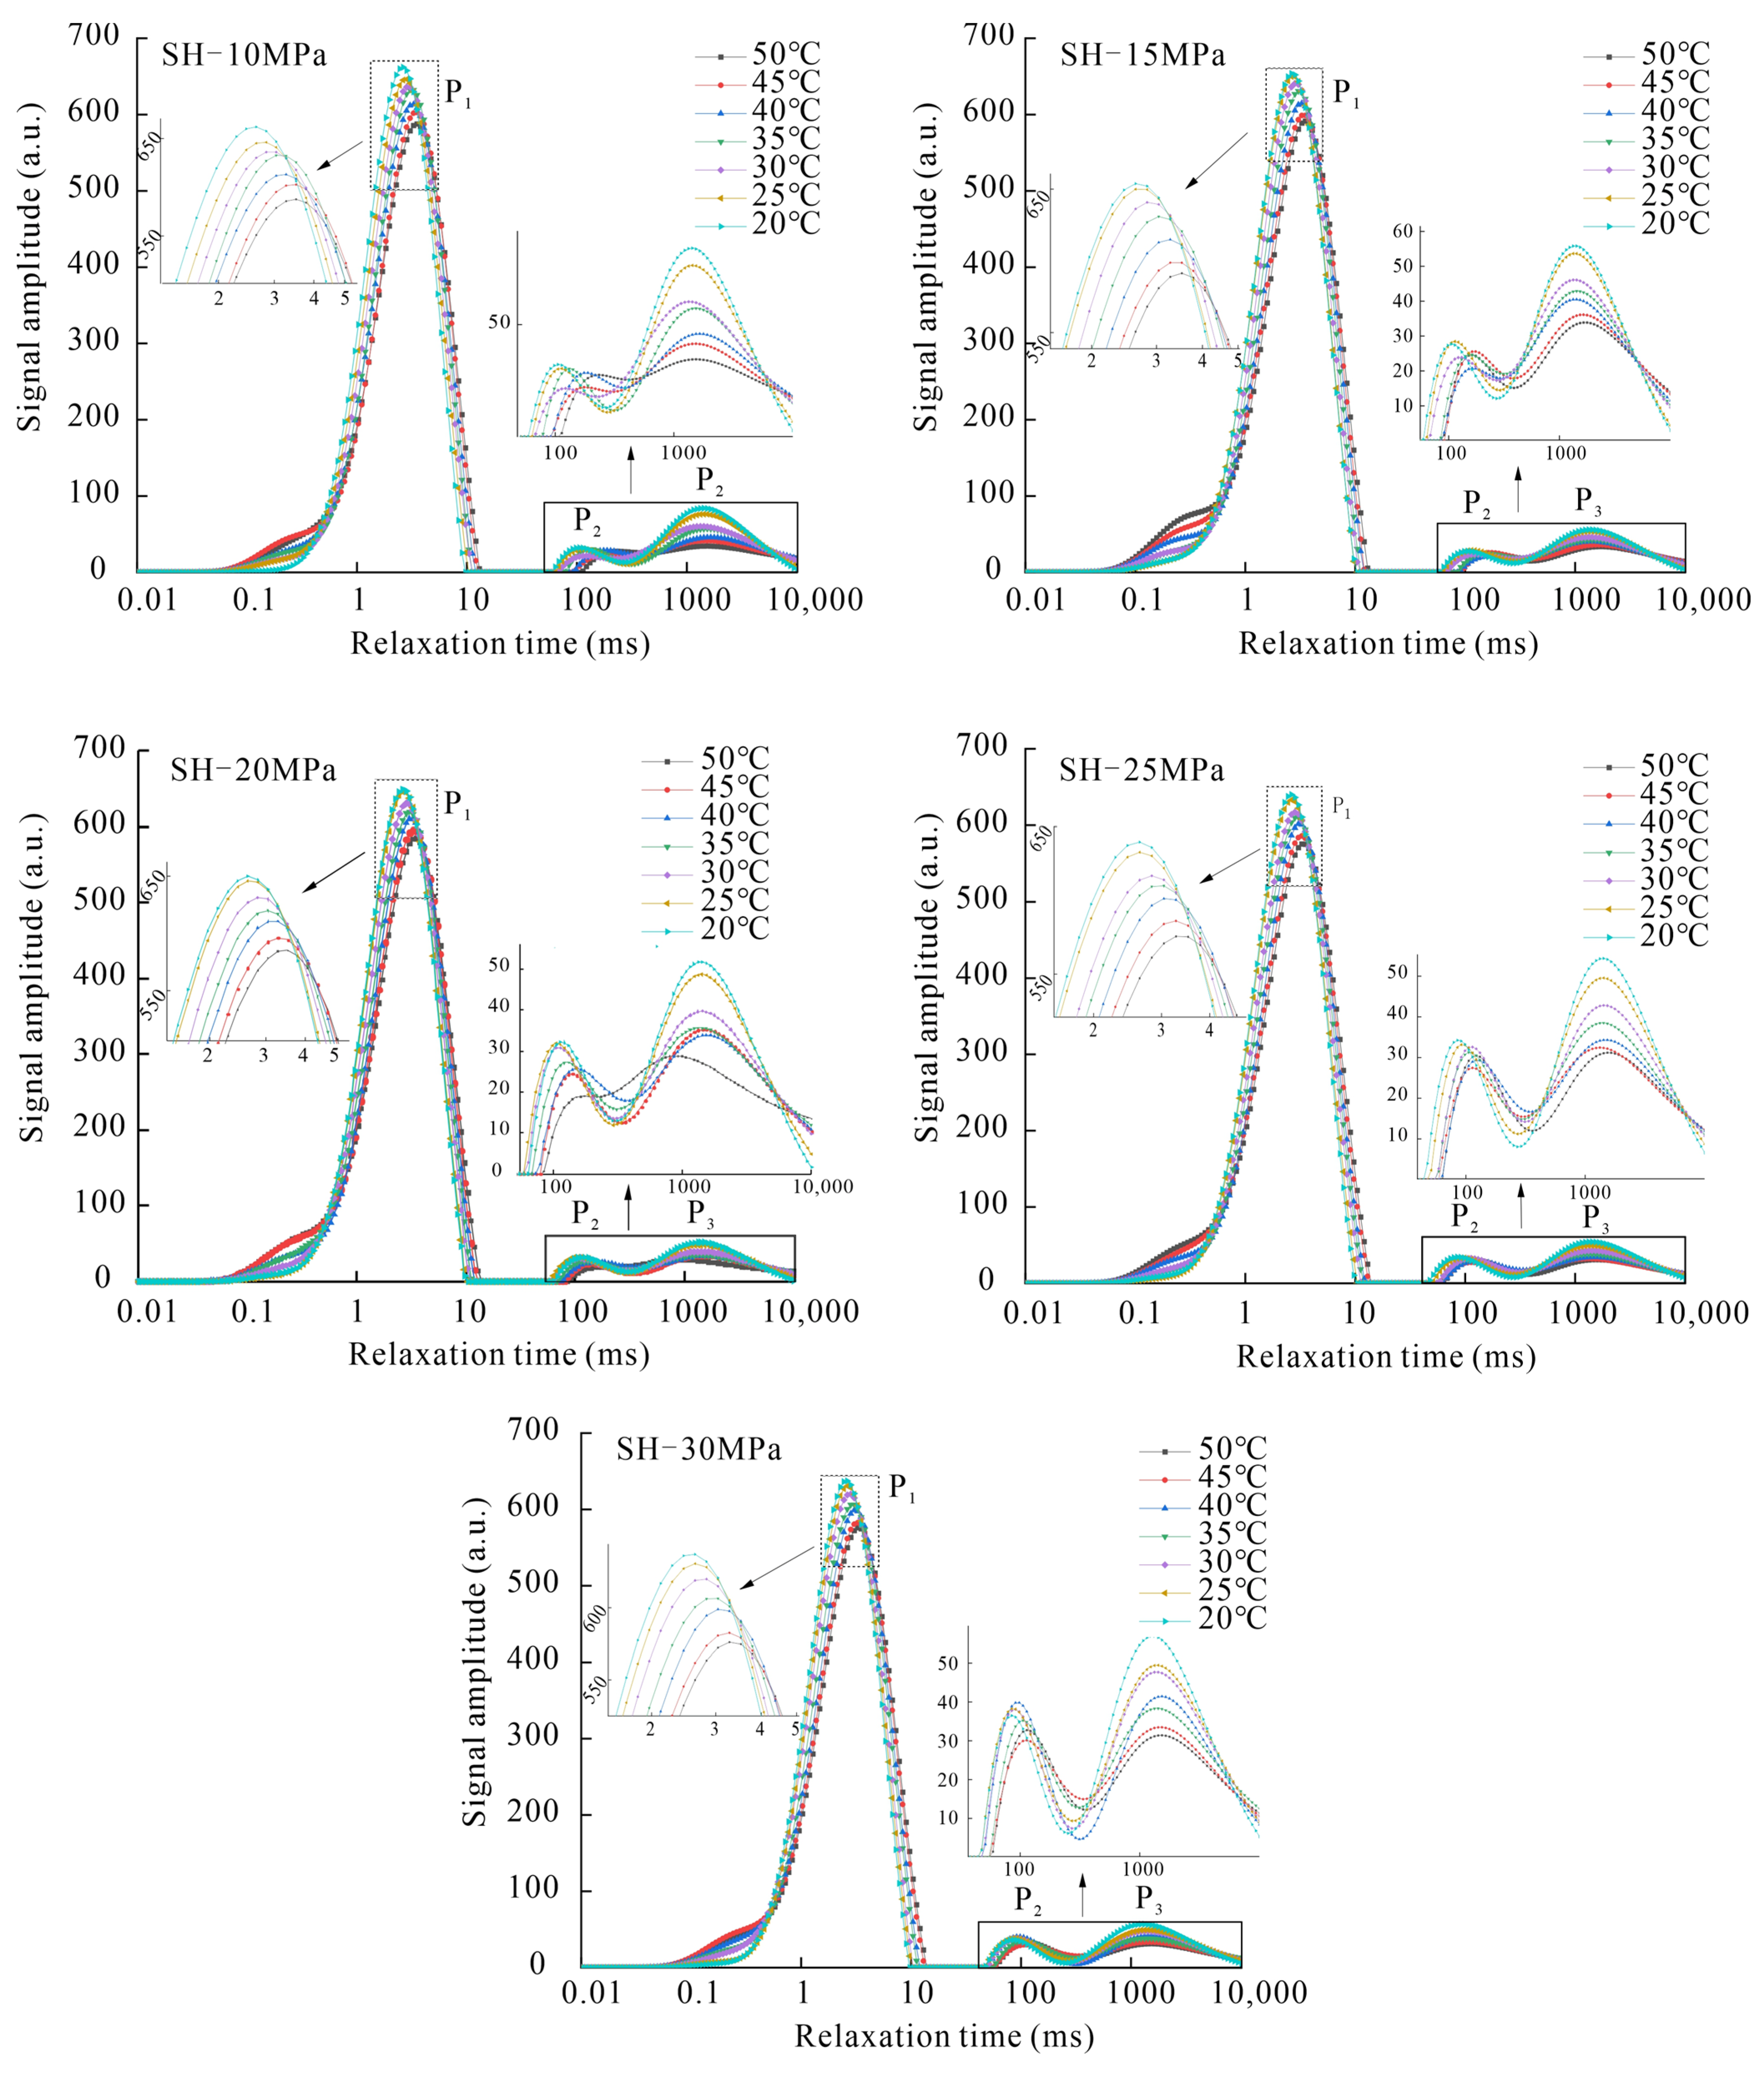
The overpressure NMR tests on Shihe and Zhaozhuang coal samples under varying temperature and confining pressure sequences revealed a consistent trimodal T2 spectrum pattern (Figure 3 and Figure 4). Based on the T2 spectral peak division method [50,51,52], the pore structures were classified as follows: the first peak (leftmost) corresponds to micropores, the second peak to mesopores, and the third peak to macropores and fractures.
The Shihe samples exhibited well-developed pore systems spanning from micropores to macropores, with observable connectivity between mesopores and macropores (Figure 3). Under constant confining pressure, the T2 spectrum amplitudes demonstrate progressive attenuation with temperature elevation from 20 °C to 50 °C across all three peaks. At 10 MPa confining pressure: P1 peak amplitude decreased from 661.94 to 587.64 (−11.2%); P2 declined from 32.26 to 27.64 (−14.3%); P3 showed significant reduction from 84.03 to 34.58 (−58.8%); Under the same temperature conditions, P1 and P3 peaks exhibited contrasting responses to increasing confining pressure: P1 decreased from 661.94 to 637.19 (−3.7%); P3 declined from 84.03 to 56.83 (−32.4%). Meanwhile, P2 displayed amplitude enhancement from 32.26 to 36.49 (+13.1%) at 20 °C (Figure 3).
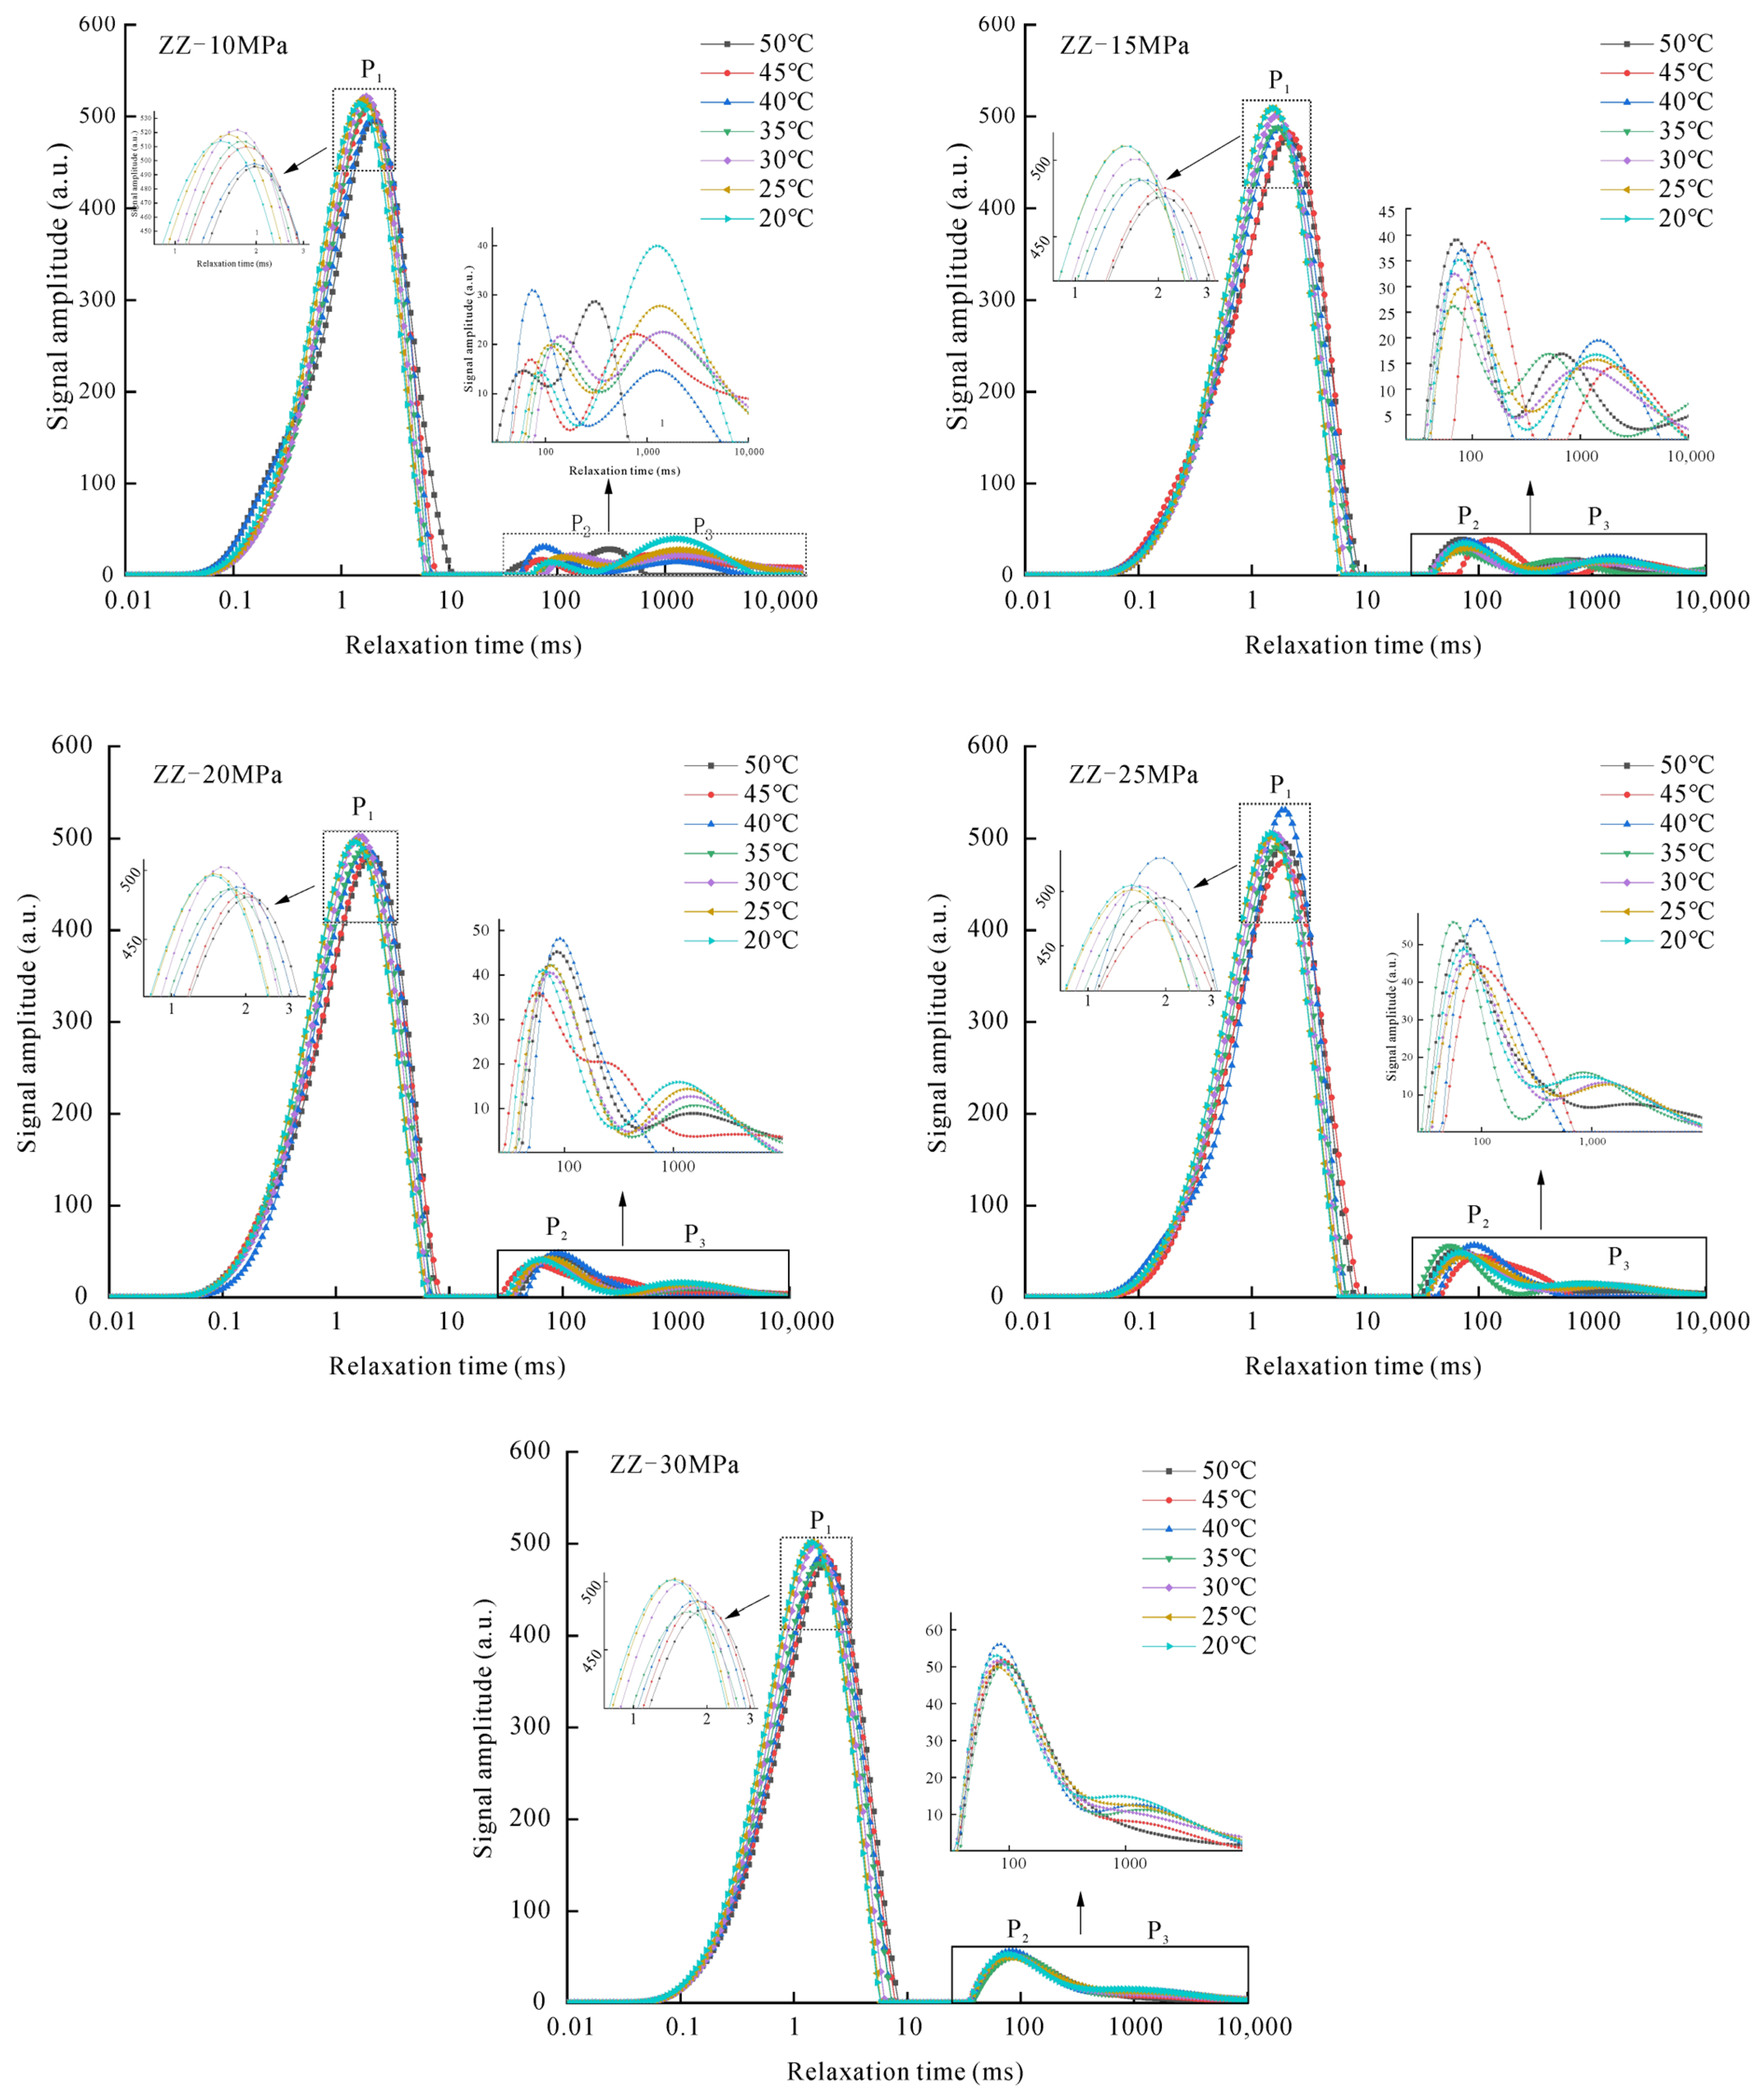
The T2 spectrum of the Zhaozhuang sample was similar to that of the Sihe sample, exhibiting a triplet pattern at low confining pressures. When the confining pressure reached 30 MPa, several T2 spectra showed biphasic. However, unlike the Sihe sample, the amplitude of the P2 and the area under its envelope in the Zhaozhuang sample were both greater than those of the P3 (Figure 4). At the same confining pressure, the trends in the amplitude of the three peaks varied greatly, and the T2 spectrum amplitude of the P1 generally decreased as the experimental temperature rose from 25 °C to 50 °C. However, the T2 spectrum amplitude of the P1 remained low at 20 °C, and that of the P2 showed poor correlation with temperature. When the confining pressure was 10 MPa, the T2 spectrum amplitude of the P1 decreased from 518.679 at 25 °C to 495.919 at 50 °C, but was only 513.999 at 20 °C. This pattern was determined at the other confining pressures, with the amplitude of the P3 decreasing from 39.955 at 20 °C to 28.665 at 50 °C. Under similar temperature conditions, the T2 spectrum amplitude of the P1 and P3 generally decreased with increasing confining pressure, while that of the P2 showed an opposite change.

3.2. Pore Structure Variations

The envelope area under the T2 spectrum corresponds to pore volume, and variations in peak areas under different temperature and pressure conditions reflect pore-size evolution [53,54,55]. As shown in Table 2, the total envelope area of the T2 spectrum for the Sihe sample exhibited distinct trends. At constant temperatures, the total area decreased significantly with increasing confining pressure. For example, at 20 °C, it declined from 18,843.04 (10 MPa) to 17,609.6 (30 MPa), with similar trends observed at other temperatures. Conversely, under fixed confining pressures, the total area decreased as the temperature rose. At 10 MPa, for instance, it dropped from 18,843.04 (20 °C) to 17,609.6 (50 °C), and analogous behavior occurred at other pressure levels.
The total T2 spectrum envelope area of the Zhaozhuang sample exhibited distinct behavior compared to the Sihe sample under varying temperature and pressure conditions (Figure 3 and Figure 4). At constant temperatures, the total area initially decreased and then increased with rising confining pressure, though the overall trend remained downward. For example, at 20 °C, it declined from 16,157.25 (10 MPa) to 15,721.82 (20 MPa) before rising to 15,990.48 at 30 MPa (Table 2). Similarly, under fixed confining pressures, the total area first decreased and then increased with temperature. At 10 MPa, it dropped from 16,157.25 (20 °C) to 15,642.28 (35 °C) before rebounding to 16,340.07 at 50 °C (Table 2).
In addition to the systematic variation in total T2 spectrum envelope area with temperature and pressure, individual T2 spectral peaks (P1, P2, P3) also exhibited distinct trends under these conditions. For the Sihe sample at constant temperatures, the P1 peak envelope area initially increased and then decreased with rising confining pressure, peaking between 15–20 MPa. The P2 peak area consistently increased, while the P3 peak area decreased (Figure 3). At 20 °C, for example, the P1 peak rose from 15,956.405 (10 MPa) to 16,042.155 (15 MPa) before declining to 15,401.096 (30 MPa). Similarly, the P2 peak increased from 467.849 to 515.954, and the P3 peak decreased from 2418.788 to 1692.552 over the same pressure range. These trends remained consistent across other temperatures. Zhao Zhuang coal samples displayed analogous behavior. Under fixed confining pressures, only the P3 peak exhibited a distinct reduction with increasing temperature, whereas the P1 and P2 peaks fluctuated irregularly.

4. Discussion

4.1. Size-Dependent Responses of Pores to Stresses

The variation in coal reservoir porosity under different pressures is quantified using the porosity pressure damage rate:
Δ φ σ = φ σ i φ σ 1 φ σ 1 × 100 %
where: Δ φ σ is porosity pressure damage rate, %; φ σ 1 is initial porosity, %; φ σ i is porosity at pressure p, %.
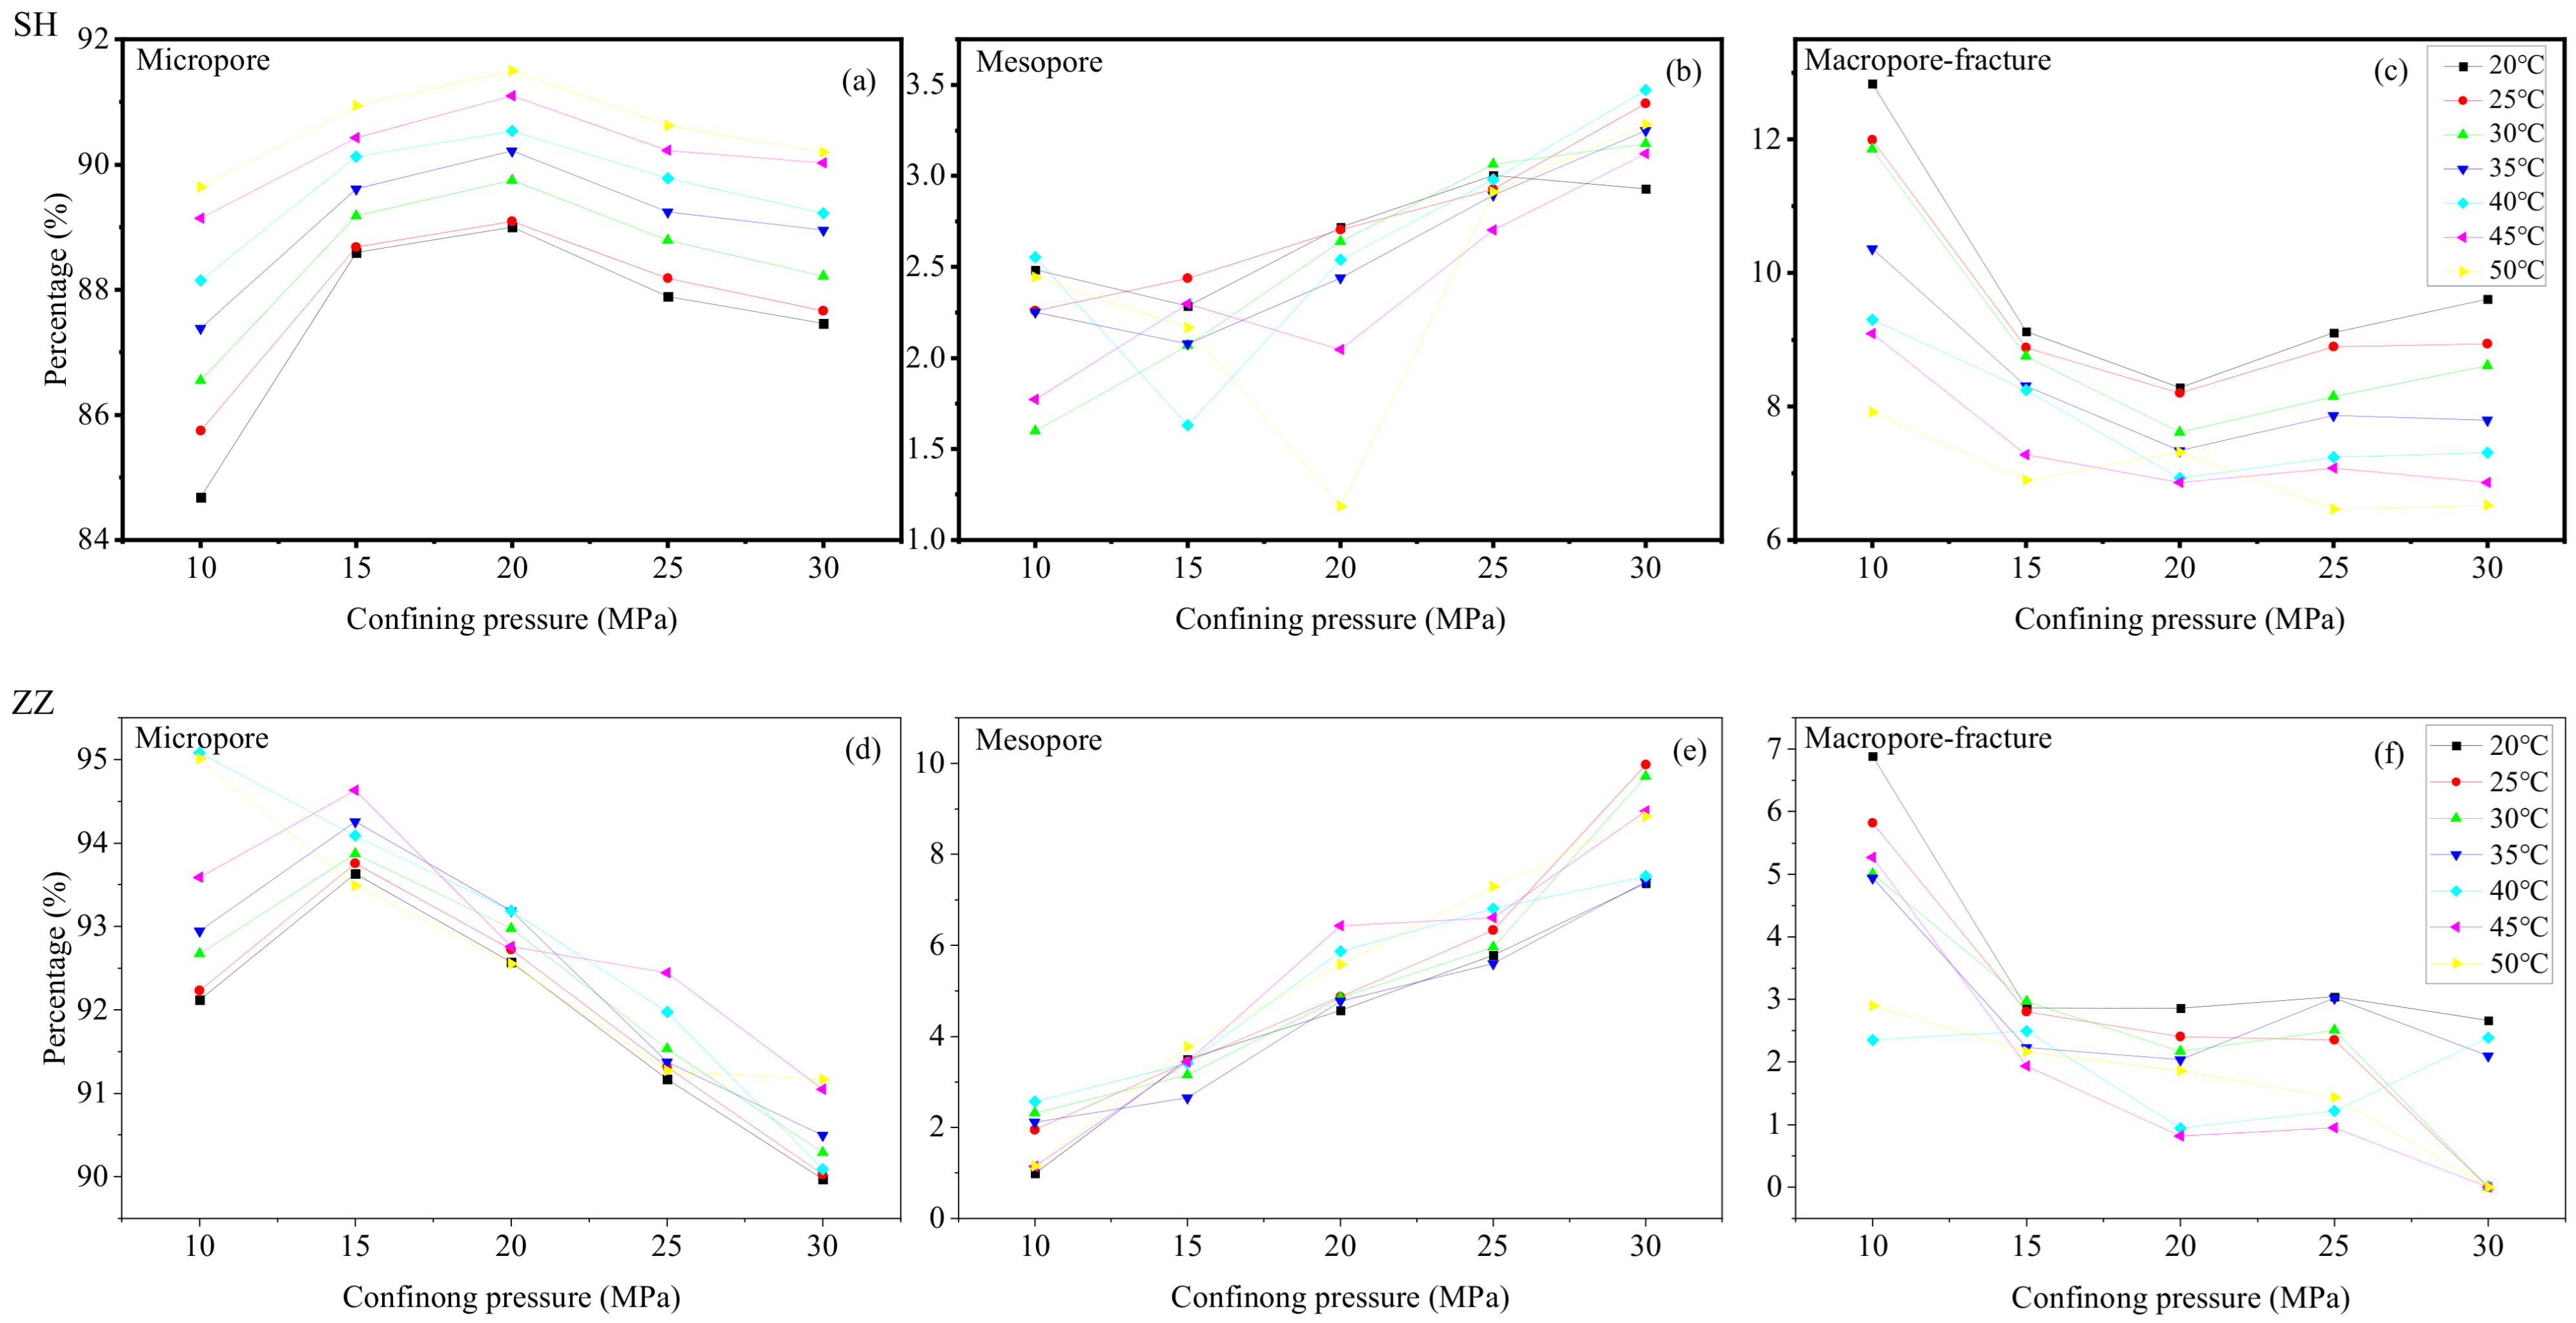
According to the defined metric, a negative value indicates that porosity at the target pressure is lower than the initial value, signifying pressure-induced damage. Conversely, a positive Δ φ σ implies increased porosity without damage. The absolute magnitude of a negative Δ φ σ quantifies the extent of damage. While individual coal samples may exhibit variability, the general trend shows decreasing porosity and increasing Δ φ σ with higher confining pressure. This relationship reflects the responsiveness of pore structures to external stress and their inherent stability under compression.
The total porosity of Sihe coal samples under varying temperatures generally decreases with increasing confining pressure, accompanied by progressively higher porosity damage rates. This trend is particularly pronounced below 45 °C (Table 3). Distinct variations exist in porosity evolution across different pore scales: Micropore porosity initially increases slowly, then decreases with rising confining pressure, while the damage rate shows an inverse trend with a critical transition at 15 MPa. This phenomenon occurs because meso-macropores compress into micropores at low confining pressures (<15 MPa), gradually increasing micropore volume. However, further pressure elevation (>15 MPa) induces micropore compression and closure, leading to volumetric reduction. Mesopore porosity demonstrates consistent growth with confining pressure across all temperatures. This results from macropores/fractures being compressed to the mesopore scale under pressure, where the newly formed mesopores significantly outnumber those being compressed, leading to a net mesopore porosity increase. Macropore/fracture porosity consistently decreases with confining pressure elevation at all temperatures, showing accelerated stress damage rates, particularly in low-pressure regimes (<20 MPa). This rapid reduction occurs because macropores and fractures undergo preferential compression closure at lower pressures [56]. Beyond 20 MPa, partial recovery occurs through reversible microcrack propagation and macropore expansion, leading to moderated porosity decline rates.
The porosity and stress-induced porosity damage rate of different pore types in the Sihe sample exhibit distinct responses to confining pressure: Micropores and macropores/fractures show decreasing porosity with increasing confining pressure, accompanied by progressively higher damage rates. In contrast, mesopore porosity increases with confining pressure without observable stress damage (Figure 5a–c). This paradoxical phenomenon (overall porosity reduction coupled with rising damage rate) arises from the sample’s pore structure heterogeneity: Micropores dominate the pore system (84.7–89.0%), followed by macropores/fractures (8.2–12.8%), with mesopores being least developed (2.3–3.0%). Although mesopores demonstrate positive compressibility, their limited proportion results in an absolute porosity increase that is substantially outweighed by the cumulative reduction in micropore and macropore/fracture porosity.
The total porosity of Zhaozhuang coal samples generally decreases with increasing confining pressure across tested temperatures, though minor increases (lower than the decreasing rates observed at other temperatures) are noted at 35 °C and 40 °C. The stress-induced porosity damage rate shows consistent growth with pressure elevation. Both micropores and macropores/fractures exhibit porosity reduction and progressive damage rate increase under confining pressure. Notably, unlike the Sihe sample that shows initial micropore growth at low pressures, Zhaozhuang micropores demonstrate immediate porosity decline from initial pressure application, accompanied by continuously intensifying damage rates. Comparative analysis suggests this divergence stems from mineral-filled fractures in Sihe coal [21,57], which enhance stress transmission through the matrix. This improved stress coupling enables more effective mesopore-to-micropore conversion at low pressures. Conversely, the Zhaozhuang sample exhibits stronger mesopore porosity growth with pressure elevation, likely due to its sparsely filled fractures that enhance stress sensitivity in macropores/fractures [21,57].
Compared with the Sihe sample, the Zhaozhuang sample exhibits less stable and more fluctuating trends in total porosity and porosity damage rate under confining pressure variations (Figure 5d–f). This instability likely stems from differences in pore size distribution between the two coal types. The Zhaozhuang sample demonstrates the poorest development of macropores and fractures, while its mesopores and macropores/fractures exhibit enhanced stress sensitivity compared to the Sihe sample. These contrasting pore structure characteristics may collectively contribute to the observed oscillatory behavior in pressure-dependent porosity evolution (Figure 5d–f).
Further analysis of stress-induced porosity damage rates in Sihe and Zhaozhuang coal samples across 20–50 °C reveals distinct patterns: The Sihe sample exhibits damage rate fluctuations between 2.08–6.55% (mean 3.90%), while the Zhaozhuang sample shows lower variations of 0.87–3.67% (mean 1.30%) (Table 3). The heightened stress sensitivity in Sihe coal stems from differential pore responses: stress elevation exerts negative effects on micropores and macropores/fractures but enhances mesopore development. Notably, Zhaozhuang coal demonstrates a stronger positive mesopore response to stress compared to the Sihe sample, while both coals show comparable negative effects on micropores. This contrasting pore behavior likely explains the Zhaozhuang sample’s reduced overall porosity damage rate.

4.2. Size-Dependent Responses of Pores to Temperatures

The temperature-induced porosity damage rate (Δ φ T) quantifies porosity evolution in coal reservoirs under varying thermal conditions. It is defined as follows:
Δ φ T = φ T i φ T 1 φ T 1 × 100 %
where: Δ φ T is temperature-induced porosity damage rate, %; φ T1 is the porosity at the initial temperature, %; φ Ti is the porosity at the target temperature, %.
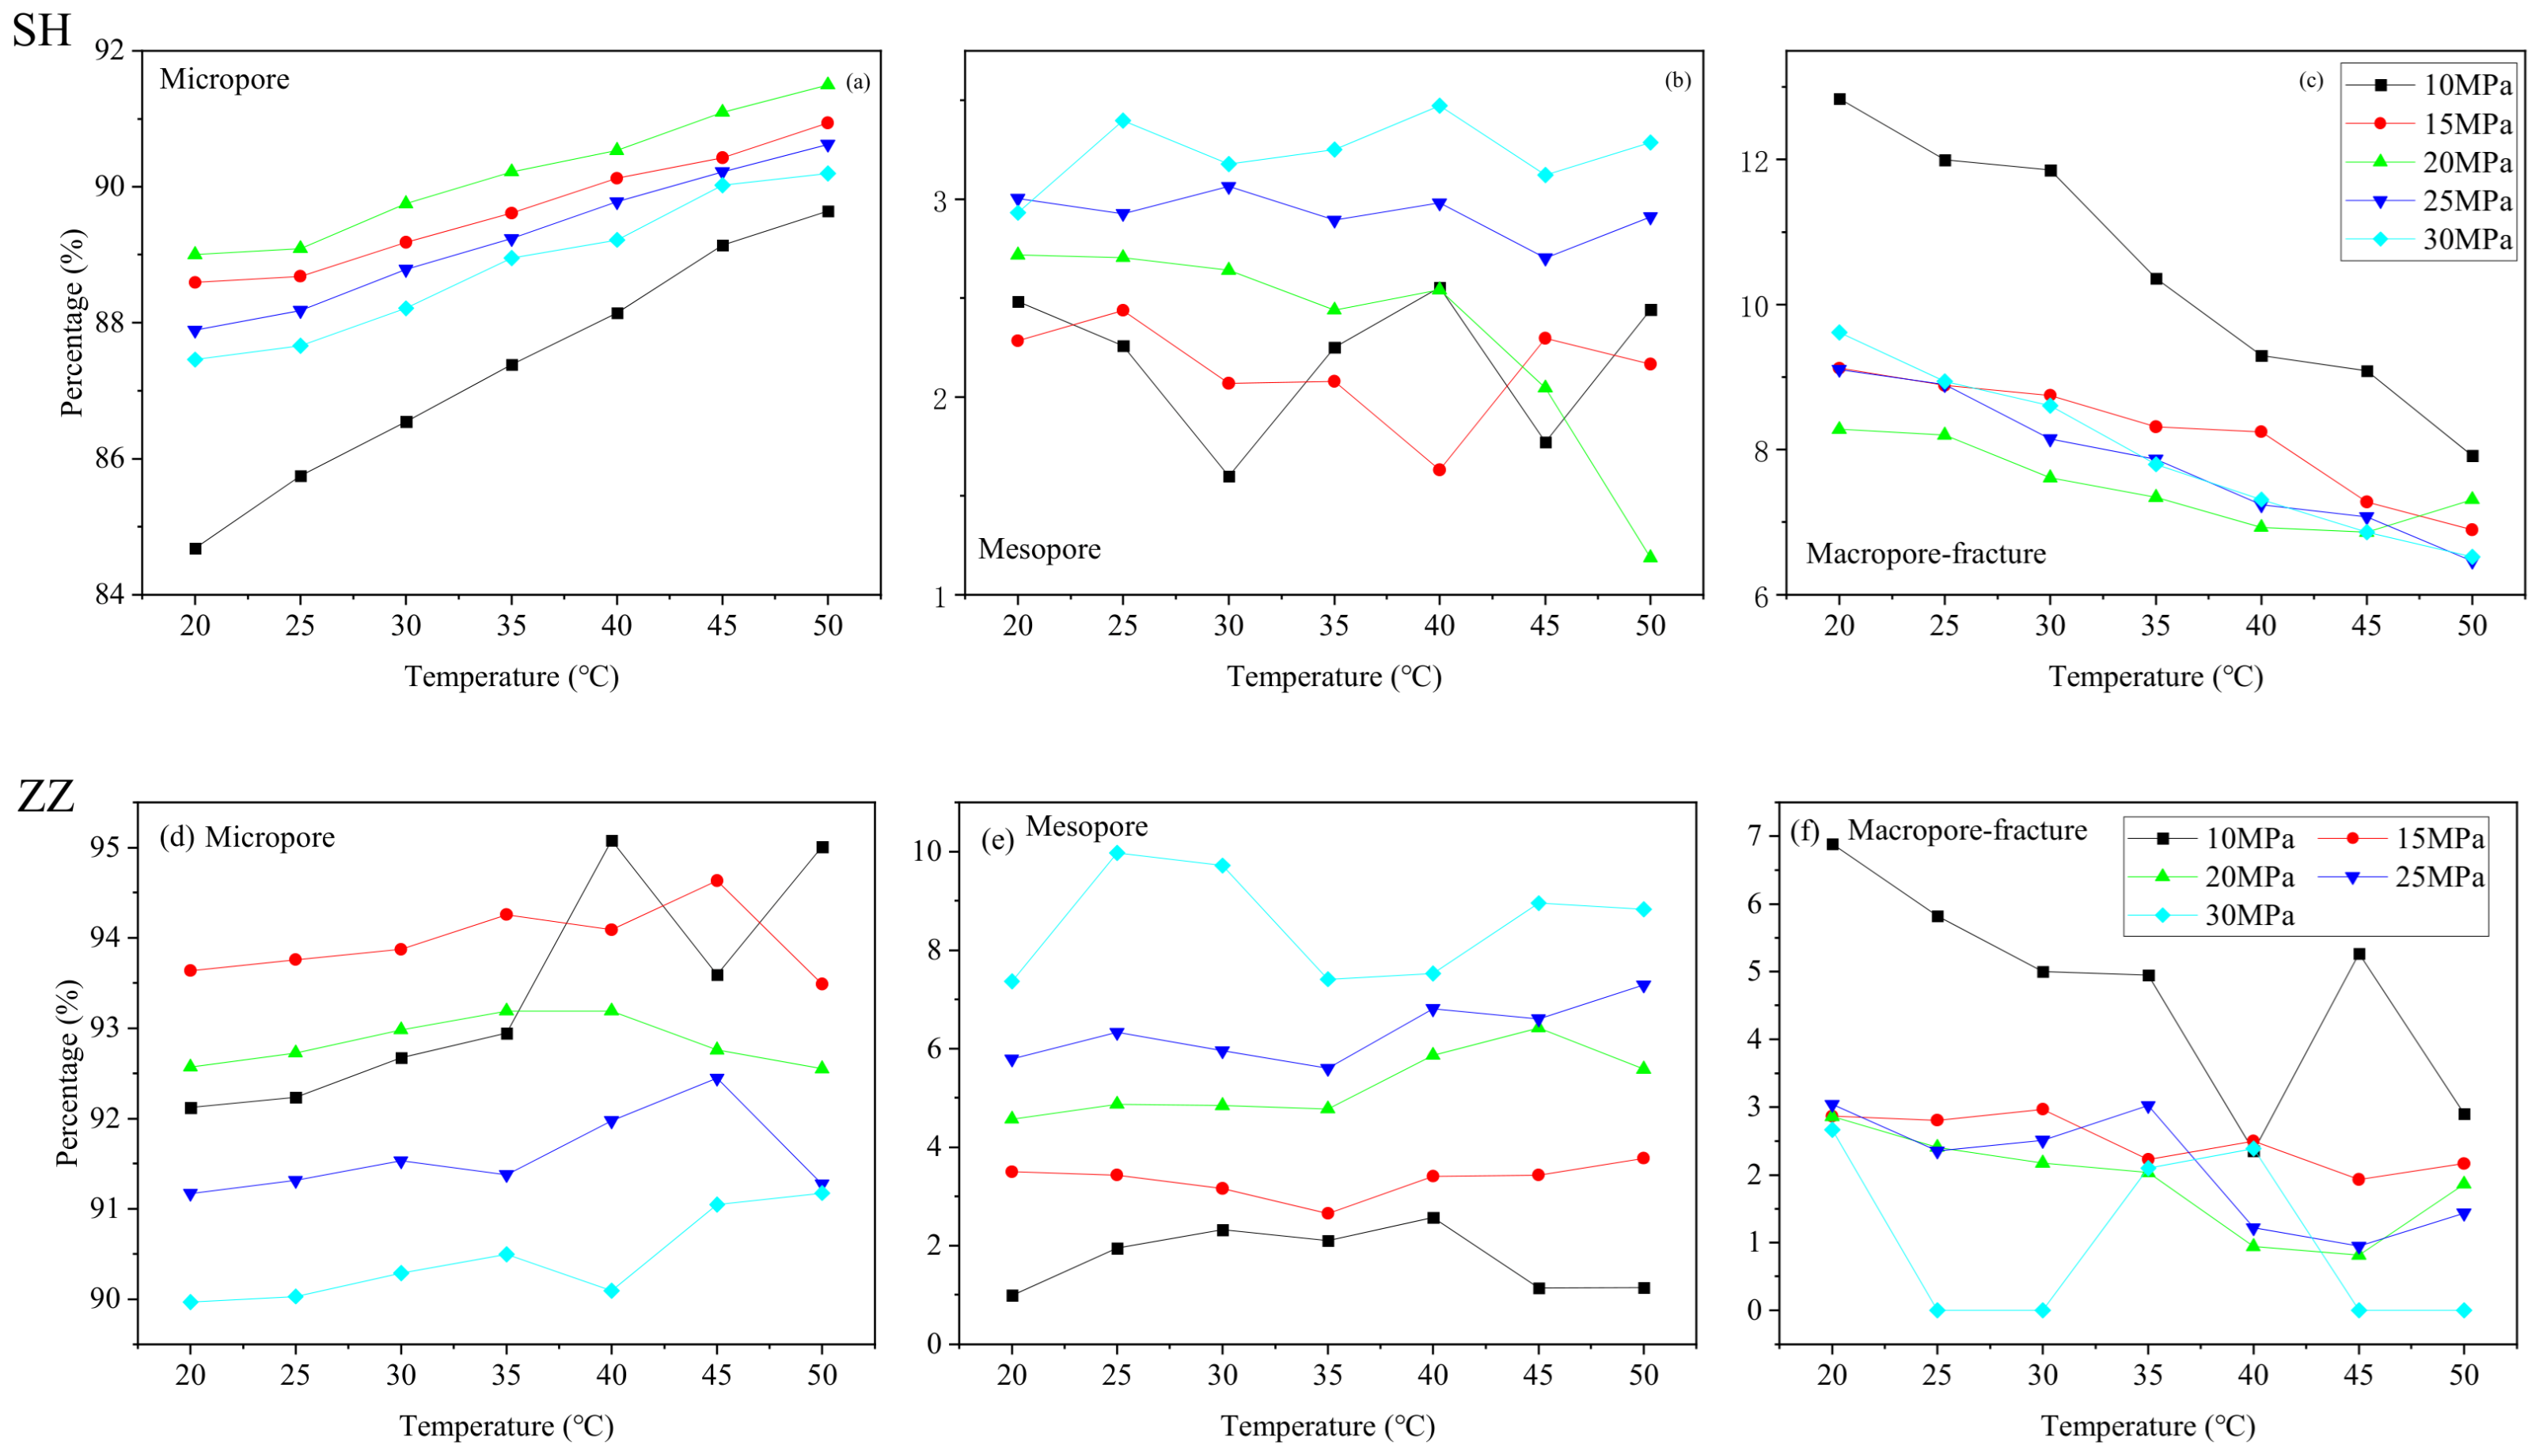
Per this definition, negative temperature-induced porosity damage rates signify thermal degradation (porosity reduction relative to initial conditions), while positive values indicate porosity enhancement. The absolute value of a negative value quantifies degradation severity. Under constant confining pressure, Sihe coal samples exhibited an overall porosity decrease (20–50 °C) with a three-stage thermal response: initial rapid decline, subsequent deceleration, and eventual stabilization with minor recovery (Table 4). This triphasic pattern intensified above 15 MPa confining pressure, since thermally-induced matrix swelling governs this behavior [40,41,42,58,59]: Below 15 MPa, limited compaction permits significant swelling-induced pore closure, accelerating damage rates with temperature. Above this threshold, pre-compressed fractures transition from deformation mechanisms to stress-controlled closure, causing initial damage rate escalation followed by asymptotic stabilization.
For the Sihe sample, increasing temperature drove progressive growth in micropore proportion and decline in macropore/fracture fraction, while mesopores exhibited irregular fluctuations (Figure 6a–c). Notably, the early heating stage showed disproportionate reductions in macropores relative to micropore gains, suggesting large-scale matrix deformation initially dominates thermal responses. As temperatures rise further, deformation transitions to smaller-scale adjustments within the matrix structure.
The thermal response of the Zhaozhuang sample diverged markedly from that of the Sihe sample. Initially, both exhibited similar behaviors, in which the temperature-induced porosity damage rate increased with rising temperatures. However, above 40 °C, the Zhaozhuang sample showed progressive recovery, reducing the damage rate to approximately 1% at 50 °C (Table 4). This indicates a three-phase porosity evolution: (1) initial decline, (2) subsequent recovery, and (3) slight net increase. Prior studies suggest that coal matrices undergo both thermal expansion and cracking under heating [60,61]. The late-stage porosity increase in the Zhaozhuang sample likely stems from thermally induced microcracks formed near the material’s critical failure threshold. Micropores exhibited a transient increase in damage rate followed by recovery and eventual expansion. Mesopores mirrored this pattern but with reduced intensity. Macropores/fractures showed a stabilizing damage rate after initial growth. During early heating stages, thermal expansion dominated, causing net porosity reduction. In later stages, crack-induced porosity generation surpassed expansion effects, yielding an overall inverted U-shaped damage rate trajectory.
The proportion of micropores in Zhaozhuang coal samples initially increased but later decreased with rising temperature, while mesopores and macropores/fractures exhibited early-stage decline followed by stabilization (Figure 6d–f). This pattern partially corroborates the occurrence of thermal cracking during late heating stages, where newly generated microfractures counterbalanced the reduction in larger pores, thereby moderating their proportional decline.
A comparative analysis of porosity temperature damage rates for the Sihe and Zhaozhuang samples under confining pressures of 10–30 MPa revealed significant differences. Over the temperature range of 20 °C to 50 °C, the Sihe sample exhibited a porosity damage rate of 2.45–7.37% (mean: 4.00%), whereas the Zhaozhuang sample demonstrated markedly lower temperature-induced damage (Table 4). Pre-experimental observations indicated that the Zhaozhuang sample contained extensive fractures with minimal mineral infilling. This structural heterogeneity likely provided sufficient space to accommodate thermal deformation of the coal matrix, thereby mitigating porosity damage under temperature variations.

5. Conclusions

(1)
The studied anthracite samples exhibit significant stress sensitivity in their porosity. As confining pressure increases, total porosity declines, while the stress-induced porosity damage rate rises. Notably, distinct pore types respond differently to pressure: micro and macropores/fractures show reduced porosity under elevated confining pressures, whereas mesopores display a marginal increase.
(2)
The studied anthracite samples show limited temperature sensitivity in porosity. At lower temperatures (20–35 °C), the porosity damage rate increases with rising temperature. At elevated temperatures (35–50 °C), however, the temperature response diverges due to structural heterogeneity in pre-existing fissures across samples.
(3)
The porosity of the studied anthracite samples presents intrinsic sensitivity to both stresses and temperatures, which are further modulated by the developmental state of pre-existing fracture networks and mineral infilling.

Author Contributions

Conceptualization, X.F., A.W. and B.Z.; investigation, K.L.; resources, A.W.; writing—original draft preparation, C.Z.; writing—review and editing, C.Z., A.W., K.L. and B.Z.; supervision, X.F.; funding acquisition, X.F. and B.Z. All authors have read and agreed to the published version of the manuscript.

Funding

This study was supported by the National Natural Science Foundation of China (42072190), the Fundamental Research Funds for the Central Universities (2025QN1082), and the Jiangsu Funding Program for Excellent Postdoctoral Talent (2025ZB713).

Data Availability Statement

The data presented in this study are available on request from the corresponding author. The data are not publicly available due to institutional confidentiality regulations.

Conflicts of Interest

Authors Cong Zhang and Kexin Li were employed by the Shanxi Coalbed Methane Exploration and Development Company of Huabei Oilfield, China, and author Aisong Wang was employed by the Nuclear Industry Jingxiang Construction Group Co., Ltd. The remaining authors declare that the research was conducted in the absence of any commercial or financial relationships that could be construed as a potential conflict of interest.

References

  1. Yang, Z.; He, R.; Li, X.; Li, Z.; Li, Z.; Liu, Z.; Lu, Y. Application of Multi-Vertical Well Synchronous Hydraulic Fracturing Technology for Deep Coalbed Methane (DCBM) Production. Chem. Technol. Fuels Oils 2019, 55, 299–309. [Google Scholar] [CrossRef]
  2. Li, S.; Qin, Y.; Tang, D.; Shen, J.; Wang, J.; Chen, S. A comprehensive review of deep coalbed methane and recent developments in China. Int. J. Coal Geol. 2023, 279, 104369. [Google Scholar] [CrossRef]
  3. Xu, F.; Hou, W.; Xiong, X.; Xu, B.; Wu, P.; Wang, H.; Feng, K.; Yun, J.; Li, S.; Zhang, L.; et al. The status and development strategy of coalbed methane industry in China. Pet. Explor. Dev. 2023, 50, 765–783. [Google Scholar] [CrossRef]
  4. Sun, X.; Lin, X.; Liu, S.; Zhao, M.; Song, Y. Geology of coalbed methane reservoirs in the Southeast Qinshui basin of China. Int. J. Coal Geol. 2005, 62, 197–210. [Google Scholar] [CrossRef]
  5. Wang, B.; Zhang, Q.; Qu, Z.; Zhang, Y. South Anze Structure and Its Control on Coalbed Methane Aggregation in the Qinshui Basin and the Mechanism of Syncline Gas Enrichment in the Qinshui Basin. Energies 2023, 16, 4521. [Google Scholar] [CrossRef]
  6. Sun, X.; Wang, H.; Du, F.; Yao, Y.; Liu, D.; Liu, Z. CBM enrichment mechanisms in the Southern Qinshui Basin: A synergistic role of tectonic-lithological-hydrodynamic coupling. Int. J. Coal Geol. 2025, 309, 104861. [Google Scholar] [CrossRef]
  7. Liu, H.; Sang, S.; Formolo, M.; Li, M.; Liu, S.; Xu, H.; An, S.; Li, J.; Wang, X. Production characteristics and drainage optimization of coalbed methane wells: A case study from low-permeability anthracite hosted reservoirs in southern Qinshui Basin, China. Energy Sustain. Dev. 2013, 17, 412–423. [Google Scholar] [CrossRef]
  8. Chen, S.; Tao, S.; Tian, W.; Tang, D.; Zhang, B.; Liu, P. Hydrogeological control on the accumulation and production of coalbed methane in the Anze Block, southern Qinshui Basin, China. J. Pet. Sci. Eng. 2021, 198, 108138. [Google Scholar] [CrossRef]
  9. Jiang, L.; Song, Y.; Zhao, W.; Bo, D.; Liu, S.; Hao, J. Main controlling factor of coalbed methane enrichment area in southern Qinshui Basin, China. J. Pet. Explor. Prod. Technol. 2024, 14, 165–173. [Google Scholar] [CrossRef]
  10. Zheng, G.; Sun, B.; Lv, D.; Pan, Z.; Lian, H. Study on Reservoir Properties and Critical Depth in Deep Coal Seams in Qinshui Basin, China. Adv. Civ. Eng. 2019, 2019, 1683413. [Google Scholar] [CrossRef]
  11. Zhu, Q.; Du, X.; Zhang, T.; Yu, H.; Liu, X. Investigation into the variation characteristics and influencing factors of coalbed methane gas content in deep coal seams. Sci. Rep. 2024, 14, 18813. [Google Scholar] [CrossRef] [PubMed]
  12. Yang, X.; Tang, S.; Xi, Z.; Zhang, S.; Zhang, Q.; Zhang, K.; Liu, D.; Wang, J. Dynamic evolution and differential enrichment of deep coalbed methane: A case study in Qinshui Basin. Int. J. Coal Geol. 2025, 299, 104696. [Google Scholar] [CrossRef]
  13. Zhang, J.; Niu, Y.; Chen, J.; Guo, Y.; Guo, L. Research on Deep Coalbed Methane Localized Spotting and Efficient Permeability Enhancement Technology. Appl. Sci. 2022, 12, 11843. [Google Scholar] [CrossRef]
  14. Feng, R.; Li, C.; Sun, L.; Wang, J.; Liu, J.; Li, N. Study on the Influence of Deep Coalbed Methane Horizontal Well Deployment Orientation on Production. Energies 2024, 17, 5784. [Google Scholar] [CrossRef]
  15. Liu, X.; Wang, X.; Chen, F.; Zhu, X.; Mao, Z.; Liu, X.; Ma, H. Three-Dimensional Geomechanical Modeling and Hydraulic Fracturing Parameter Optimization for Deep Coalbed Methane Reservoirs: A Case Study of the Daniudi Gas Field, Ordos Basin. Processes 2025, 13, 1699. [Google Scholar] [CrossRef]
  16. Gao, D.; Li, M.; Wang, B.; Hu, B.; Liu, J. Characteristics of Pore Structure and Fractal Dimension of Isometamorphic Anthracite. Energies 2017, 10, 1881. [Google Scholar] [CrossRef]
  17. Ouyang, Z.; Wang, H.; Sun, B.; Liu, Y.; Fu, X.; Dou, W.; Du, L.; Zhang, B.; Luo, B.; Yang, M.; et al. Quantitative Prediction of Deep Coalbed Methane Content in Daning-Jixian Block, Ordos Basin, China. Processes 2023, 11, 3093. [Google Scholar] [CrossRef]
  18. Wang, X.; Shen, W.; Yang, X.; Li, N.; Chen, H.; Zhang, Z. Review and Outlook of Pore Structure Characteristics and Flow Mechanisms in Deep Coalbed Methane Reservoirs: Advances and Perspectives. Energy Fuels 2026, 40, 7197–7213. [Google Scholar] [CrossRef]
  19. Moore, T.A. Coalbed methane: A review. Int. J. Coal Geol. 2012, 101, 36–81. [Google Scholar] [CrossRef]
  20. Fu, H.; Tang, D.; Xu, T.; Xu, H.; Tao, S.; Li, S.; Yin, Z.; Chen, B.; Zhang, C.; Wang, L. Characteristics of pore structure and fractal dimension of low-rank coal: A case study of Lower Jurassic Xishanyao coal in the southern Junggar Basin, NW China. Fuel 2017, 193, 254–264. [Google Scholar] [CrossRef]
  21. Pan, J.; Mou, P.; Ju, Y.; Wang, K.; Zhu, Q.; Ge, T.; Yu, K. Micro-nano-scale pore stimulation of coalbed methane reservoirs caused by hydraulic fracturing experiments. J. Pet. Sci. Eng. 2022, 214, 110512. [Google Scholar] [CrossRef]
  22. Li, H.; Chen, S.; Tang, D. Coal pore size distribution and adsorption capacity controlled by the coalification in China. Int. J. Hydrogen Energy 2024, 88, 594–603. [Google Scholar] [CrossRef]
  23. Kumar, J.; Mendhe, V.A.; Kamble, A.D.; Bannerjee, M.; Mishra, S.; Singh, B.D.; Mishra, V.K.; Singh, P.K.; Singh, H. Coalbed methane reservoir characteristics of coal seams of south Karanpura coalfield, Jharkhand, India. Int. J. Coal Geol. 2018, 196, 185–200. [Google Scholar] [CrossRef]
  24. Zhou, Y.; Li, Z.; Yang, Y.; Wang, M.; Gu, F.; Ji, H. Effect of adsorption-induced matrix deformation on coalbed methane transport analyzed using fractal theory. J. Nat. Gas Sci. Eng. 2015, 26, 840–846. [Google Scholar] [CrossRef]
  25. Miao, H.; Veerle, V.; Zhang, J.; Chen, S.; Chang, X.; Du, Y.; Wang, Y.; Wei, C.; Luo, J.; Quan, F.; et al. Control mechanism of pressure drop rate on coalbed methane productivity by using production data and physical simulation technology. Fuel 2026, 406, 137060. [Google Scholar] [CrossRef]
  26. Pan, H.; Shao, Y.; Liu, Z.; Zuo, Q.; Su, J.; Bai, J.; Miao, H.; Guo, Y.; Zhang, J. A Physical Parameter Characterizing Heterogeneity of Pore and Fracture Structures in Coal Reservoirs. Processes 2024, 12, 1553. [Google Scholar] [CrossRef]
  27. Singh, R.K.; Nayak, N.P.; Kumar, S. Effect of micro-fractures on gas flow behavior in coal for enhanced coal bed methane recovery and CO2 storage. Heliyon 2024, 10, e25914. [Google Scholar] [CrossRef]
  28. Naveen, P.; Asif, M.; Ojha, K. Integrated fractal description of nanopore structure and its effect on CH4 adsorption on Jharia coals, India. Fuel 2018, 232, 190–204. [Google Scholar] [CrossRef]
  29. Karacan, C.Ö.; Mitchell, G.D. Behavior and effect of different coal microlithotypes during gas transport for carbon dioxide sequestration into coal seams. Int. J. Coal Geol. 2003, 53, 201–217. [Google Scholar] [CrossRef]
  30. Gamson, P.; Beamish, B.; Johnson, D. Coal microstructure and micropermeability and their effects on natural gas recovery. Fuel 1993, 72, 87–99. [Google Scholar] [CrossRef]
  31. Mastalerz, M.; Hampton, L.; Drobniak, A.; Loope, H. Significance of analytical particle size in low-pressure N2 and CO2 adsorption of coal and shale. Int. J. Coal Geol. 2017, 178, 122–131. [Google Scholar] [CrossRef]
  32. Peng, C.; Zou, C.; Yang, Y.; Zhang, G.; Wang, W. Fractal analysis of high rank coal from southeast Qinshui basin by using gas adsorption and mercury porosimetry. J. Pet. Sci. Eng. 2017, 156, 235–249. [Google Scholar] [CrossRef]
  33. Wang, L.; Li, Z.; Mao, G.; Zhang, Y.; Lai, F. Effect of Nanoparticle Adsorption on the Pore Structure of a Coalbed Methane Reservoir: A Laboratory Experimental Study. ACS Omega 2022, 7, 06770. [Google Scholar] [CrossRef] [PubMed]
  34. Zou, M.; Yao, L.; Ding, Z.; Huang, Z.; Ran, T. Characterization of coal pore structures and flow simulation based on CT and experiments of MIP and SEM. Part. Sci. Technol. 2025, 43, 120–132. [Google Scholar] [CrossRef]
  35. Pashin, J.C. 2-Geology of North American coalbed methane reservoirs. In Coal Bed Methane, 2nd ed.; Elsevier: Amsterdam, The Netherlands, 2020; pp. 35–64. [Google Scholar]
  36. Chen, Z.; Dong, K.; Yao, W.; Hu, X.; Jin, X.; Ou, X. Multiscale pore structure and coalbed methane in the Jurassic deep coal seams of Southern Junggar Basin, China. J. Asian Earth Sci. 2026, 299, 106955. [Google Scholar] [CrossRef]
  37. Zhang, S.; Wu, C.; Fang, X.; Liu, N.; Jiang, X.; Han, J. Mapping of Stress Sensitivity Affected by Water Variation to Microscopic Pore Distributions in Medium- and High-Rank Coals. Nat. Resour. Res. 2022, 31, 1601–1619. [Google Scholar] [CrossRef]
  38. Tian, J.; Liu, J.; Elsworth, D.; Leong, Y.; Li, W. An effective stress-dependent dual-fractal permeability model for coal considering multiple flow mechanisms. Fuel 2023, 334, 126800. [Google Scholar] [CrossRef]
  39. Wang, Z.; Liu, D.; Yao, Y.; Li, P.; Sun, X.; Feng, D.; Duan, J. Occurrence state of deep coalbed methane: A study considering the co-evolution of stress and pore structure. Fuel 2026, 407, 134718. [Google Scholar] [CrossRef]
  40. Yu, Y.; Meng, Z.; Gao, C.; Lu, Y.; Li, J. Experimental Investigation of Pore Pressure Effect on Coal Sample Permeability Under Different Temperatures. Nat. Resour. Res. 2022, 31, 1585–1599. [Google Scholar] [CrossRef]
  41. Zhang, Y.; Liu, J. In-situ geological conditions and their controls on permeability of coalbed methane reservoirs in the eastern Ordos Basin. Front. Earth Sci. 2024, 12, 1416308. [Google Scholar] [CrossRef]
  42. He, Y.; Li, X.; Xie, H.; Li, X.; Xia, T.; Chen, S. Dynamics change of coal methane adsorption/desorption and permeability under temperature and stress conditions. Phys. Fluids 2025, 37, 016605. [Google Scholar] [CrossRef]
  43. Yu, Y.; Meng, Z.; Li, J.; Lu, Y.; Xu, C.; Wang, Y. Experimental study on pore structure and permeability of different rank coals related to temperature. Fuel 2026, 405, 136737. [Google Scholar]
  44. Mendhe, V.A.; Bannerjee, M.; Varma, A.K.; Kamble, A.D.; Mishra, S.; Singh, B.D. Fractal and pore dispositions of coal seams with significance to coalbed methane plays of East Bokaro, Jharkhand, India. J. Nat. Gas Sci. Eng. 2017, 38, 412–433. [Google Scholar]
  45. Mohanty, D.; Chattaraj, S.; Singh, A.K. Influence of coal composition and maturity on methane storage capacity of coals of Raniganj Coalfield, India. Int. J. Coal Geol. 2018, 196, 1–18. [Google Scholar] [CrossRef]
  46. Shen, J.; Qin, Y.; Zhao, J. Maceral Contribution to Pore Size Distribution in Anthracite in the South Qinshui Basin. Energy Fuels 2019, 33, 7234–7243. [Google Scholar] [CrossRef]
  47. Duan, C.; Fu, X.; Deng, Z.; Kang, J.; Zhang, B.; Lu, J.; Hong, X.; Dai, R.; Li, X. Pore Structure Multifractal Characteristics of Coal Reservoirs in the Central and Eastern Qinshui Basin and Influencing Factors. Processes 2023, 11, 286. [Google Scholar] [CrossRef]
  48. Han, L.; Huang, D.; Qiu, Z.; Shen, J.; Zhang, X.; Ni, X.; Yu, Z.; Bai, J.; Yang, Y. Pore-Fracture Connectivity of High-Rank Coal in Qinshui Basin, China. Nat. Resour. Res. 2025, 34, 2757–2773. [Google Scholar]
  49. GB/T 15224.1-2018; Classification for Quality of Coal—Part 1: Ash. Standardization Administration of the People’s Republic of China: Beijing, China, 2018.
  50. Zhou, S.; Liu, D.; Cai, Y.; Yao, Y. Fractal characterization of pore-fracture in low-rank coals using a low-field NMR relaxation method. Fuel 2016, 181, 218–226. [Google Scholar]
  51. Liu, Z.; Liu, D.; Cai, Y.; Yao, Y.; Pan, Z.; Zhou, Y. Application of nuclear magnetic resonance (NMR) in coalbed methane and shale reservoirs: A review. Int. J. Coal Geol. 2020, 218, 103261. [Google Scholar] [CrossRef]
  52. Yao, P.; Zhang, J.; Lv, D.; Vandeginste, V.; Chang, X.; Zhang, X.; Wang, D.; Han, S.; Liu, Y. Effect of water occurrence in coal reservoirs on the production capacity of coalbed methane by using NMR simulation technology and production capacity simulation. Geoenergy Sci. Eng. 2024, 243, 213353. [Google Scholar] [CrossRef]
  53. Zheng, S.; Yao, Y.; Liu, D.; Cai, Y.; Liu, Y. Characterizations of full-scale pore size distribution, porosity and permeability of coals: A novel methodology by nuclear magnetic resonance and fractal analysis theory. Int. J. Coal Geol. 2018, 196, 148–158. [Google Scholar] [CrossRef]
  54. Tao, S.; Chen, S.; Tang, D.; Zhao, X.; Xu, H.; Li, S. Material composition, pore structure and adsorption capacity of low-rank coals around the first coalification jump: A case of eastern Junggar Basin, China. Fuel 2018, 211, 804–815. [Google Scholar] [CrossRef]
  55. Fang, S.; Yin, S.; Li, Z.; Yang, D.; Wang, D.; Ding, Z.; Li, G. Study on the adsorption characteristics and pore-fissure response mechanism of meagre coal and anthracite under different methane pressures. Energy 2025, 332, 137283. [Google Scholar] [CrossRef]
  56. Li, X. Pore-Fracture Structure and Mechanical Damage Mechanism of High Volatile Bituminous Coal Reservoir During CBM Production in the Southern Junggar Basin. Ph.D. Thesis, China University of Mining and Technology, Beijing, China, 2018. [Google Scholar]
  57. Pan, J.; Wang, K.; Hou, Q.; Niu, Q.; Wang, H.; Ji, Z. Micro-pores and fractures of coals analysed by field emission scanning electron microscopy and fractal theory. Fuel 2016, 164, 277–285. [Google Scholar] [CrossRef]
  58. Shi, Q.; Kou, B.; Wang, S.; Sun, Q.; Xue, W.; Ji, R.; Cai, Y. Porosity Changes in Thermally-Treated Bituminous Coal During Step-by-Step Crushing: Implications for Closed Pore Variations with Temperature. Nat. Resour. Res. 2022, 32, 1339–1358. [Google Scholar] [CrossRef]
  59. Kang, J.; Elsworth, D.; Fu, X.; Liang, S.; Chen, H. Contribution of thermal expansion on gas adsorption to coal sorption-induced swelling. Chem. Eng. J. 2022, 432, 134427. [Google Scholar] [CrossRef]
  60. Teng, T.; Wang, J.; Gao, F.; Ju, Y.; Jiang, C. A thermally sensitive permeability model for coal-gas interactions including thermal fracturing and volatilization. J. Nat. Gas Sci. Eng. 2016, 32, 319–333. [Google Scholar] [CrossRef]
  61. Peng, R.; Ju, Y.; Wang, J.; Xie, H.; Gao, F.; Mao, L. Energy Dissipation and Release During Coal Failure Under Conventional Triaxial Compression. Rock Mech. Rock Eng. 2014, 48, 509–526. [Google Scholar] [CrossRef]
Figure 1. Experimental coal sample.
Processes 14 01884 g001
Figure 2. Nuclear magnetic resonance analyzer.
Processes 14 01884 g002
Figure 3. Low-field NMR T2 spectra of Sihe coal samples under different temperature and pressure conditions.
Processes 14 01884 g003
Figure 4. Low-field NMR T2 spectra of Zhaozhuang coal samples under different temperature and pressure conditions.
Processes 14 01884 g004
Figure 5. Relationship between pore size distribution and confining pressure of the samples under different temperatures (ac) -SH; (df) -ZZ.
Processes 14 01884 g005
Figure 6. The relationship between pore size distribution and temperature of the samples under different confining pressures (ac) -SH; (df) -ZZ.
Processes 14 01884 g006
Table 1. Coal petrography and quality results.
Sample IDV/%I/%E/%Ro,max/%Mad/%Ad/%Vdaf/%FCad/%
ZZ81.3318.67/2.331.011.18.779.2
SH77.5822.42/3.181.637.613.154.2
Table 2. Peak area of samples under different temperature and pressure conditions.
Temperature/°CPeak Area
SHZZ
10 MPa15 MPa20 MPa25 MPa30 MPa10 MPa15 MPa20 MPa25 MPa30 MPa
2018,843.0418,107.5917,893.0317,885.4817,609.6016,340.0716,029.6815,872.3416,150.4215,740.08
2518,621.2318,117.7517,807.6817,769.3617,489.8716,272.9716,137.516,018.9815,900.7415,799.34
3018,253.1617,888.3617,709.2117,547.7317,592.0116,036.9515,930.2215,516.6515,852.3715,796.09
3517,894.0017,613.2017,595.1917,315.3917,309.1915,642.5815,497.3415,857.7315,773.0415,779.13
4017,732.3317,523.0717,238.3917,156.4717,216.8515,718.9515,626.1215,659.0215,807.0715,781.10
4517,569.6317,571.6917,472.9417,254.7617,203.5516,026.5815,720.4315,781.5515,896.1915,830.16
5017,453.8217,664.2217,362.5117,255.4216,959.6316,157.2515,813.8615,721.8215,976.9715,990.48
Table 3. Pore stress damage rate for coal samples under different temperature conditions with confining pressure ranging from 10 MPa to 30 MPa.
Temperature
/°C
Total/%Micropore/% Mesopore/%Macropore-Fracture/%
SHZZSHZZSHZZSHZZ
20−6.55−3.67−3.48−8.4310.28632.09−30.02−100.00 *
25−6.08−2.91−3.98−5.5541.31661.81−30.00−100.00
30−3.62−1.50−1.77−6.6791.42188.54−30.00−0.01
35−3.270.87−1.53−1.7839.67253.75−27.23−57.16
40−2.910.40−1.73−2.1932.01319.82−23.68−100.00
45−2.08−1.23−1.11−3.5972.55405.76−26.14−100.00
50−2.83−1.03−2.23−3.3430.69633.59−20.00−61.69
* A value of −100% indicates the absence of the P3 peak in the NMR T2 spectrum under 30 MPa confining pressure, signifying complete closure of macropores/fractures.
Table 4. Pore stress damage rate for coal samples under different confining pressures with temperatures ranging from 20 °C to 50 °C.
Confining Pressure
/MPa
Total/%Micropore/%Mesopore/%Macropore-Fracture/%
SHZZSHZZSHZZSHZZ
10−7.371.13−1.955.29−8.8818.23−42.87−56.98
15−2.451.360.131.79−7.499.97−26.27−22.91
20−2.960.96−0.240.94−57.6823.39−14.29−34.19
25−3.521.09−0.521.20−6.4927.29−31.53−52.22
30−3.69−1.57−0.68−0.257.9817.98−34.69−100.00
Disclaimer/Publisher’s Note: The statements, opinions and data contained in all publications are solely those of the individual author(s) and contributor(s) and not of MDPI and/or the editor(s). MDPI and/or the editor(s) disclaim responsibility for any injury to people or property resulting from any ideas, methods, instructions or products referred to in the content.