Article

Design and Application of Fuzzy PID Temperature Control Algorithm Based on Thermal Convection Nucleic Acid Amplification Instrument


1
School of Life Science and Technology, Changchun University of Science and Technology, Changchun 130022, China
2
Changchun Chengshi Health Industry Co., Ltd., Changchun 130000, China
3
Jilin Provincial Institute of Metrology Science, Changchun 130103, China
*
Author to whom correspondence should be addressed.
Processes 2026, 14(12), 1889; https://doi.org/10.3390/pr14121889
Submission received: 2 May 2026 / Revised: 30 May 2026 / Accepted: 8 June 2026 / Published: 10 June 2026
(This article belongs to the Section Process Control, Modeling and Optimization)

Abstract

The nucleic acid amplification reaction has extremely high requirements for the precision of temperature control. The conventional PID control algorithms exhibit limitations in nonlinear and time-varying PCR temperature control systems, including poor adaptive parameter adjustment, excessive overshoot, and insufficient steady-state precision, which directly restricts the efficiency and specificity of nucleic acid amplification. This paper focuses on the design and optimization of the fuzzy PID temperature control algorithm. By combining the nonlinear adaptive advantages of fuzzy control and the steady-state precision of PID control, a temperature control algorithm model suitable for the thermal convection nucleic acid amplification instrument was constructed. This device can adapt to the thermal convection temperature control mode, providing a stable reaction platform for the subsequent algorithm performance testing and nucleic acid amplification experiments. For this fuzzy PID temperature control algorithm, this study established a simulation model using MATLAB/Simulink R2020a by defining the fuzzy input and output variables and designing the membership functions and fuzzy rule base. A performance comparison of temperature control was then conducted between this algorithm and the conventional PID algorithm. The nucleic acid amplification experiment verified the effectiveness of this algorithm in practical applications. The simulation results demonstrate that the fuzzy PID algorithm significantly suppresses the system overshoot, effectively shortens the adjustment time, and achieves a steady-state control precision of ±0.05 °C. The temperature control system equipped with this algorithm achieves a heating rate of 7.5 ± 0.1 °C/s, a cooling rate of 13.5 ± 0.1 °C/s, a steady-state temperature deviation of only ±0.1 °C, and an amplification efficiency of 98.7%. All performance indicators are superior to those of the conventional PID temperature control system and existing commercial instruments. This fuzzy PID temperature control algorithm provides crucial technical support for enhancing the efficiency, specificity, and repeatability of nucleic acid amplification, and holds broad application value in the biotechnology field with high requirement on precision temperature control.

1. Introduction

The application of gene technology in clinical diagnosis, life science research, food safety testing, and public health prevention and control has been continuously deepening. Given that polymerase chain reaction (PCR) is the core technology of nucleic acid amplification, the precision and stability of the instrument’s temperature control system directly determine the nucleic acid amplification efficiency, detection sensitivity, and result reliability, which are the key indicators of the core performance of PCR equipment [1]. With the dual advantages of fuzzy logic qualitative reasoning and PID quantitative regulation, fuzzy PID control technology can achieve adaptive adjustment of PCR temperature control parameters and nonlinear error compensation [2]. It demonstrates strong adaptability, high temperature control precision, and excellent robustness in scenarios such as instrument temperature regulation, constant temperature stabilization, anti-interference, and precise temperature curve tracking, which is the mainstream control strategy in the current PCR temperature control field [3]. However, traditional fuzzy PID technology has obvious engineering shortcomings. It has poor adaptability of the rule base in complex temperature control conditions, lagging response to temperature changes, long algorithm computation time, some supporting hardware relying on imports, complex debugging process, and high cost, making it difficult to meet the practical engineering requirements for efficient and precise PCR temperature control [4,5].
To break through the limitations of traditional control schemes, intelligent optimization algorithms such as particle swarm optimization (PSO), genetic algorithm (GA), and Kalman filtering have been gradually introduced into PCR temperature control system. Relevant practical application explorations have been carried out both domestically and internationally. However, various algorithms have inherent technical defects [6]. In domestic applications, Nanjing Mingrui Testing applied the PSO algorithm to a multi-channel PCR temperature detector, which effectively improved parameter optimization efficiency and enabled it to adapt to high-throughput detection scenarios. However, it is prone to getting stuck in local optima in extreme conditions and has insufficient global optimization capabilities [7]. Shanghai Yanhua Intelligent integrated the GA algorithm into medical temperature control modules, which can achieve global optimization of multiple target parameters and meet the requirements of scientific research-grade instruments. Nevertheless, it has problems such as high computational complexity, poor real-time performance, and easy premature convergence [8]. ZhiCe Electronic used Kalman filtering for PCR instrument temperature calibration, effectively suppressing detection noise. But it is difficult to balance computational complexity and real-time performance, unable to adapt to precise detection scenarios with rapid temperature changes, and has weak resistance to sudden disturbances [9]. Although the layout of PCR temperature control intelligent algorithms abroad is more mature and the application scale is higher, the core technical bottlenecks have still not been overcome [10]. Seegene Company in Korea integrated the PSO algorithm into its fully automatic PCR system, which can dynamically adjust temperature control parameters, improve experimental repeatability, and accelerate optimization speed. However, it has insufficient adaptability in strongly nonlinear temperature control systems and cannot balance convergence speed and temperature control precision [11]. Flinders University in Australia combined the GA algorithm with Smart PCR technology to achieve multi-objective optimization. Due to excessive computational complexity, it is difficult to adapt to rapid temperature-changing amplification scenarios [12]. The international mainstream instrument companies use sequential dual Kalman filtering to optimize the temperature control system and rely on multi-sensor data fusion to achieve noise reduction. However, their dynamic adaptability and resistance to sudden disturbances are weak, and the problem of multi-algorithm parameter coupling has not been solved, limiting the application of this technology in high-end PCR instruments [13].
Based on the existing technical solutions, the current PCR temperature control field has not yet formed an ideal solution that balances efficient response, precise temperature control, and multi-scenario adaptability [14]. Conventional fuzzy PID cannot adapt to the coupling characteristics of thermal convection and temperature fields and has insufficient parameter adaptive capability [15]. Model predictive control (MPC) has large computational load and poor real-time performance, which is unsuitable for portable rapid amplification equipment. Intelligent optimization PID algorithms, such as PSO and GA, are prone to local optima and premature convergence problems, with limited robustness and environmental adaptability. Overall, the various technical defects jointly restrict the further improvement of PCR instrument performance [16]. In response to the above industry pain points, an intelligent temperature control system for PCR instruments based on fuzzy PID is built. On the hardware side, a cross-shaped heating array, turbulence cooling fans, and airflow rectification devices are adopted to optimize temperature control uniformity, and the screening of compatible hardware modules, device parameter calibration, and installation position optimization are completed. The final structure of the system is determined through mathematical modeling, simulation analysis, and experimental debugging. Tests show that the system has strong anti-interference capability, excellent robustness, precise temperature control, compact size, and controllable cost, and can meet the requirements of rapid and stable heating and cooling of PCR instruments and multi-scenario applications [17,18]. The core innovations and contributions of this study are as follows. A segmented nonlinear first-order inertia coupling model suitable for thermal convection nucleic acid amplification instruments is constructed, which incorporates three nonlinear effects of temperature zone thermal inertia, airflow coupling, and environmental disturbance to break through the limitations of traditional linear simplified models. A thermal convection-specific two-input three-output fuzzy PID algorithm is developed, with hybrid membership functions and fuzzy rules customized for the three temperature zones of PCR, achieving precise matching between algorithm parameters and equipment heat transfer characteristics. The algorithm structure is optimized to reduce computational complexity, without the need for complex online optimization, which can adapt to the embedded hardware platform of portable nucleic acid detectors. The temperature control and nucleic acid amplification performance are superior to existing commercial equipment and traditional intelligent temperature control methods.

2. Materials and Methods

2.1. Experimental and Simulation Tools and Materials

This study selects MATLAB R2020a (The MathWorks, Inc., Natick, MA, USA) for model development, algorithm design, and performance analysis. A simulation model of the temperature control system is built based on the MATLAB/Simulink R2020a visual environment. The Fuzzy toolbox is used to define fuzzy variables, design membership functions, build fuzzy rule bases, and verify fuzzy reasoning. The first-order inertia series transfer function is adopted to simulate the thermal inertia, hysteresis, and nonlinear dynamic characteristics of the temperature control system of the thermal convection nucleic acid amplification instrument. The hardware experimental platform is a self-built test fixture for the thermal convection nucleic acid amplification instrument, which is mainly composed of a host computer, a multi-function measuring instrument (Fluke 8846A Digital Multimeter, Fluke Corporation, Everett, WA, USA), the amplification instrument main unit, and a main control board equipped with a main control chip (STM32F407, STMicroelectronics, Geneva, Switzerland). The main control board contains a fuzzy PID control algorithm, which can realize real-time collection, processing, and closed-loop regulation of temperature data.

2.2. Basic Principle of PID Control Algorithm and Analysis of Its Temperature Control Adaptability

PID, as a classic control strategy in the field of industrial control, has been widely applied due to its simple structure, flexible adjustment, strong robustness, and high control precision for linear systems [19]. Without the need to understand the internal mechanism of the controlled object, this algorithm achieves precise closed-loop regulation by merely processing the deviation between the set value and the actual output value [20]. The core of its control lies in the collaborative effect of the three components: proportion (P), integration (I), and differentiation (D). These three components are responsible for instantaneous response, cumulative compensation, and trend prediction, respectively. By continuously correcting the control output through the construction of closed-loop control logic, the system can reach a stable state [21].
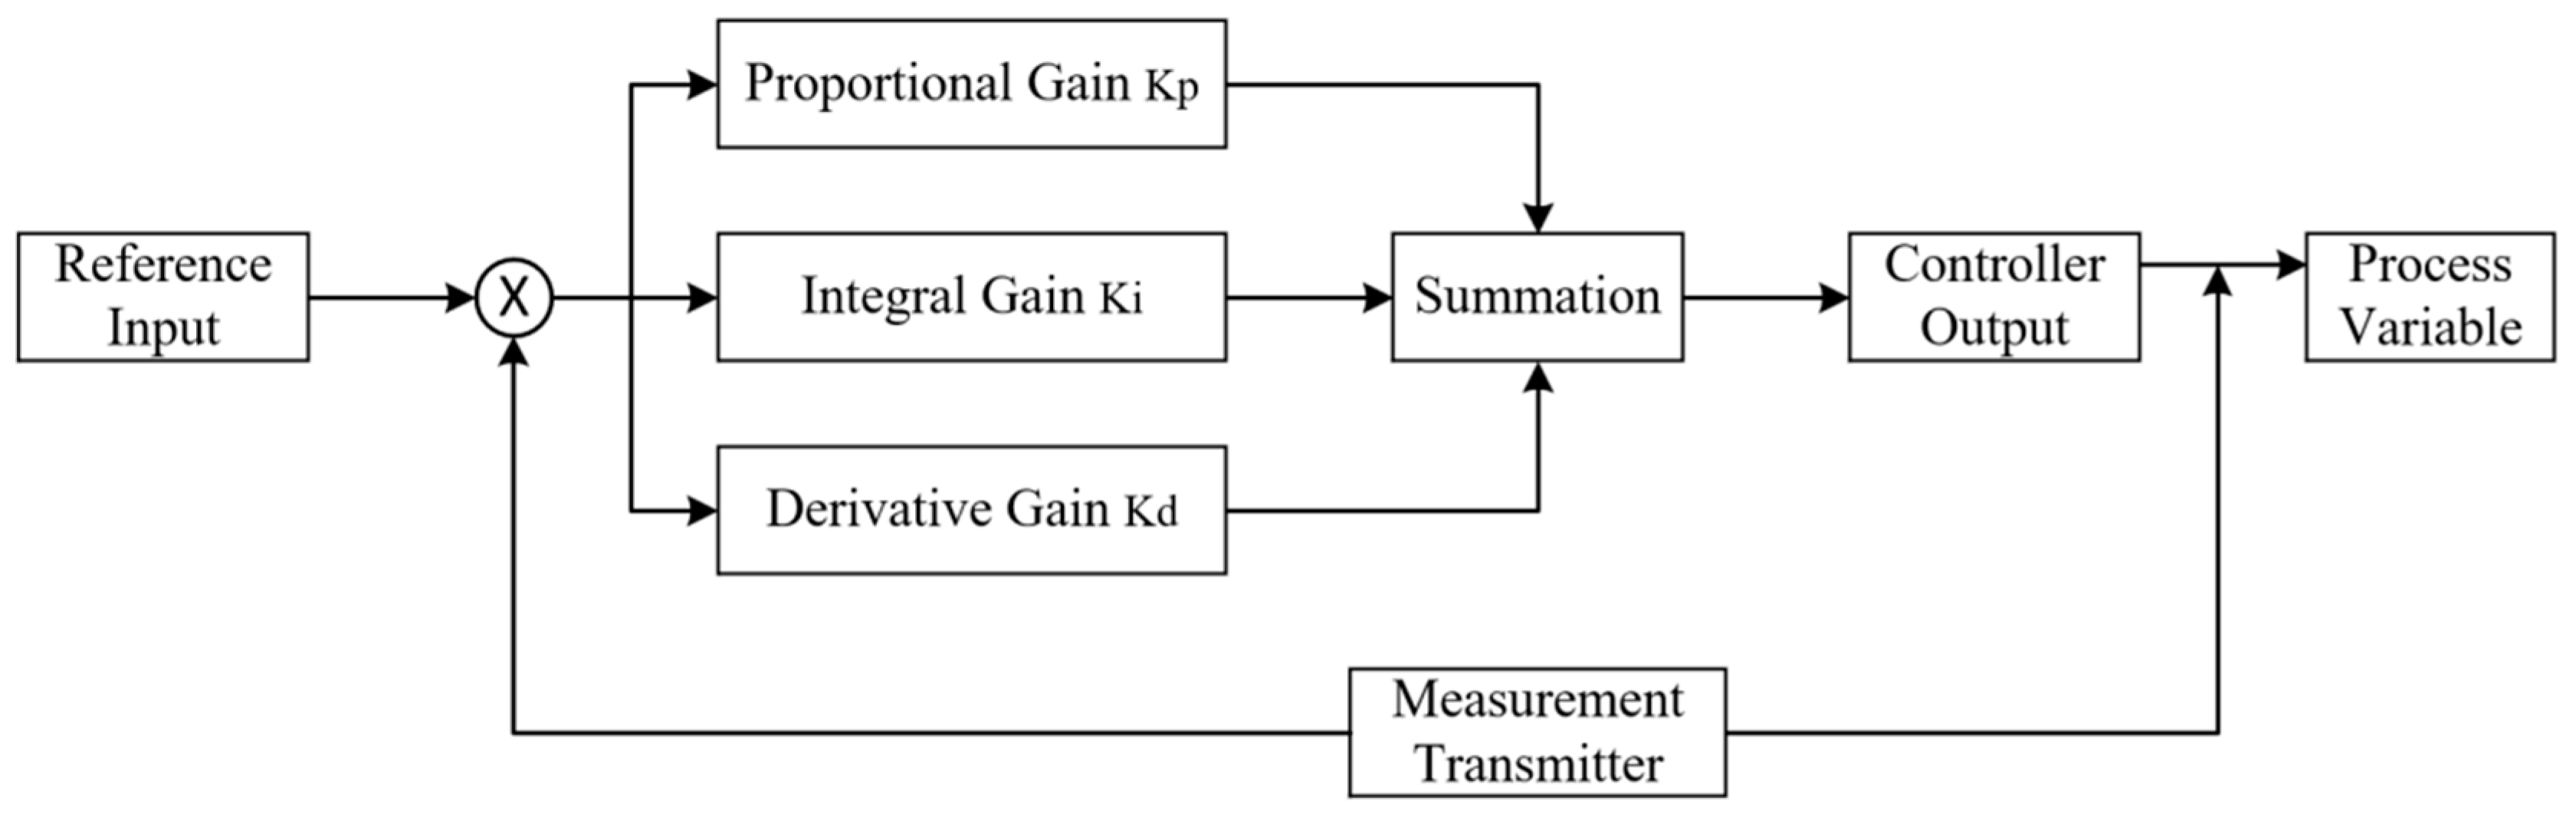
As shown in Figure 1, the PID closed-loop control process is clear and well-defined. First, the deviation between the set temperature value and the actual value collected by the feedback is calculated by the comparison section. Then, the deviation signal is simultaneously input into the P, I, and D control modules, which perform instantaneous amplification, time accumulation, and rate-of-change prediction, respectively. The processing results of each module are summed and superimposed to generate the final control quantity and act on the controlled object. Finally, the measurement transmitter continuously acquires the actual output value of the controlled object and feeds it back to the front-end comparison element. Thus, a closed-loop control circuit with real-time monitoring and dynamic correction capabilities is formed, ensuring that the controlled variable stably approaches the set value [22].
In the PID control system, the core variables are first defined. Suppose the system temperature setpoint is r(t), and the actual detected temperature of the reaction chamber (i.e., the output value) is h(t). The deviation signal e(t) between the two can then be expressed as e(t) = r(t) − h(t). The three control components each exert regulatory effects based on different characteristics of the deviation signal. The final control output of the controller is the linear superposition of the three components [23].
The proportion component (P) is the core execution unit determining the control response speed. Its output is in a direct proportion to the deviation signal e(t), and it can immediately adjust the control intensity according to the magnitude of the deviation. The continuous-time domain expression for this component is given by Equation (1):
h P ( t )   =   k p e ( t )
Kp represents the proportion gain. The value of Kp is of crucial importance for the control performance. An excessively large value can cause severe oscillations and even damage the nucleic acid. An excessively small value leads to slow response and reduced efficiency. Furthermore, due to the thermal inertia of the reaction chamber, simple proportion control generates steady-state error and cannot meet the temperature control precision requirement of ±0.1 °C.
The core design of the integration component (I) lies in eliminating the steady-state error caused by proportion control. Its output is proportional to the integration value of the deviation signal e(t) over time. The continuous-time domain expression for this component is given by Equation (2):
h I ( t ) = K p · 1 T i 0 t e τ d τ
Ti is the integration time constant. As long as the deviation exists, the integration component continuously accumulates it, thereby increasing the control output until the system’s static error is completely eliminated. The value of Ti directly determines the strength of the integration effect. A smaller Ti results in faster static error elimination but tends to cause system overshoot. A larger Ti improves system stability but reduces the efficiency of static error elimination.
The core function of the differentiation component (D) is to predict the trend of the deviation signal. Its output is proportional to the rate of change of the deviation signal e(t), which can effectively suppress the overshoot and oscillation of the system in advance. The continuous-time domain expression for this component is shown in Equation (3):
h D ( t ) = K p · T d d e t d t
Td is the differentiation time constant. The differentiation component focuses on the rate of change. The value of Td is equally critical for the control performance. An excessively large value tends to amplify noise collected by the sensor, causing fluctuations in the control output. An excessively small value struggles to effectively suppress system overshoot and fails to meet the requirement for smooth temperature switching during nucleic acid amplification [24].
By linearly superposing the outputs of the three components, the complete continuous-time domain mathematical model of the PID controller can be obtained, as shown in Equation (4):
h t = K p e t + 1 T i 0 t e τ d τ   + T d d e t d t
To simplify parameter adjustment, the integration coefficient is defined K i = K p 1 T t and the differentiation coefficient is defined K d   =   K p · T d . The above formulas can be rewritten in a more concise form, as shown in Equation (5):
h t = K p e t + K i 0 t e τ d τ + K d d e t d t
Kp, Ki, and Kd constitute the core adjustment parameters of the PID controller. Their appropriate matching is the key to ensuring the temperature control performance of the system [25].
In practical applications, nucleic acid amplification instruments employ digital microprocessor. Therefore, the continuous PID algorithm needs to be discretized. The core logic of discretization is to sample the deviation signal at a fixed sampling period T, converting the continuous integration operation into a discrete summation, and converting the continuous differentiation operation into a difference operation. Let the sampling index be n n = 0 , 1 , 2 , 3 , and the discrete time instant can be approximated as t nT . The deviation signal obtained at the n-th sampling is e n = e nT , and the deviation signal obtained at the \(n − 1\)-th sampling is e n     1   =   e n     1 T .
By using the rectangular integration method to approximate and substitute the continuous integration, Equation (6) can be obtained:
0 t e τ d τ T i = 0 n e i
By using the backward difference method to approximate and substitute the continuous differentiation, Equation (7) can be obtained:
d e t d t e n     n     1 T
By substituting these discretized approximations into the continuous PID mathematical model, the discretized positional PID algorithm expression can be obtained, as shown in Equation (8):
h n = K p e n + T T t i = 0 n e i + T d e n     n     1 T
After further simplification, the simplified Equation (9) is obtained:
h n = K p e n + K i i = 0 n e i + K d e n e n     1
K i = K p · T T i is the discretized integration coefficient. K d = K p · T d T is the discretized differentiation coefficient. h(n) is the controller output value at the n-th sampling instant [26]. This discretized expression can be directly executed by the digital controller. By periodically updating the deviation signal and calculating the control output, it realizes the real-time regulation of the temperature in the nucleic acid amplification reaction chamber.
In conclusion, through the collaborative action of the proportion, integration, and differentiation components, the PID algorithm simultaneously addresses the system’s rapid response capability, steady-state control precision, and overshoot suppression. Its discretized form can adapt to digital control systems, laying the core algorithm foundation for the design of the temperature control system for nucleic acid amplification. However, factors such as changes in the reaction liquid volume and ambient temperature fluctuations during nucleic acid amplification can cause nonlinear changes in the system’s thermal characteristics. The fixed parameters of the conventional PID algorithm struggle to adapt to such dynamic changes. Therefore, it is necessary to introduce the fuzzy control theory to construct a fuzzy PID algorithm to further improve the control precision and robustness of the temperature control system.

2.3. Technical Solution and Structural Layout of the Temperature Control System

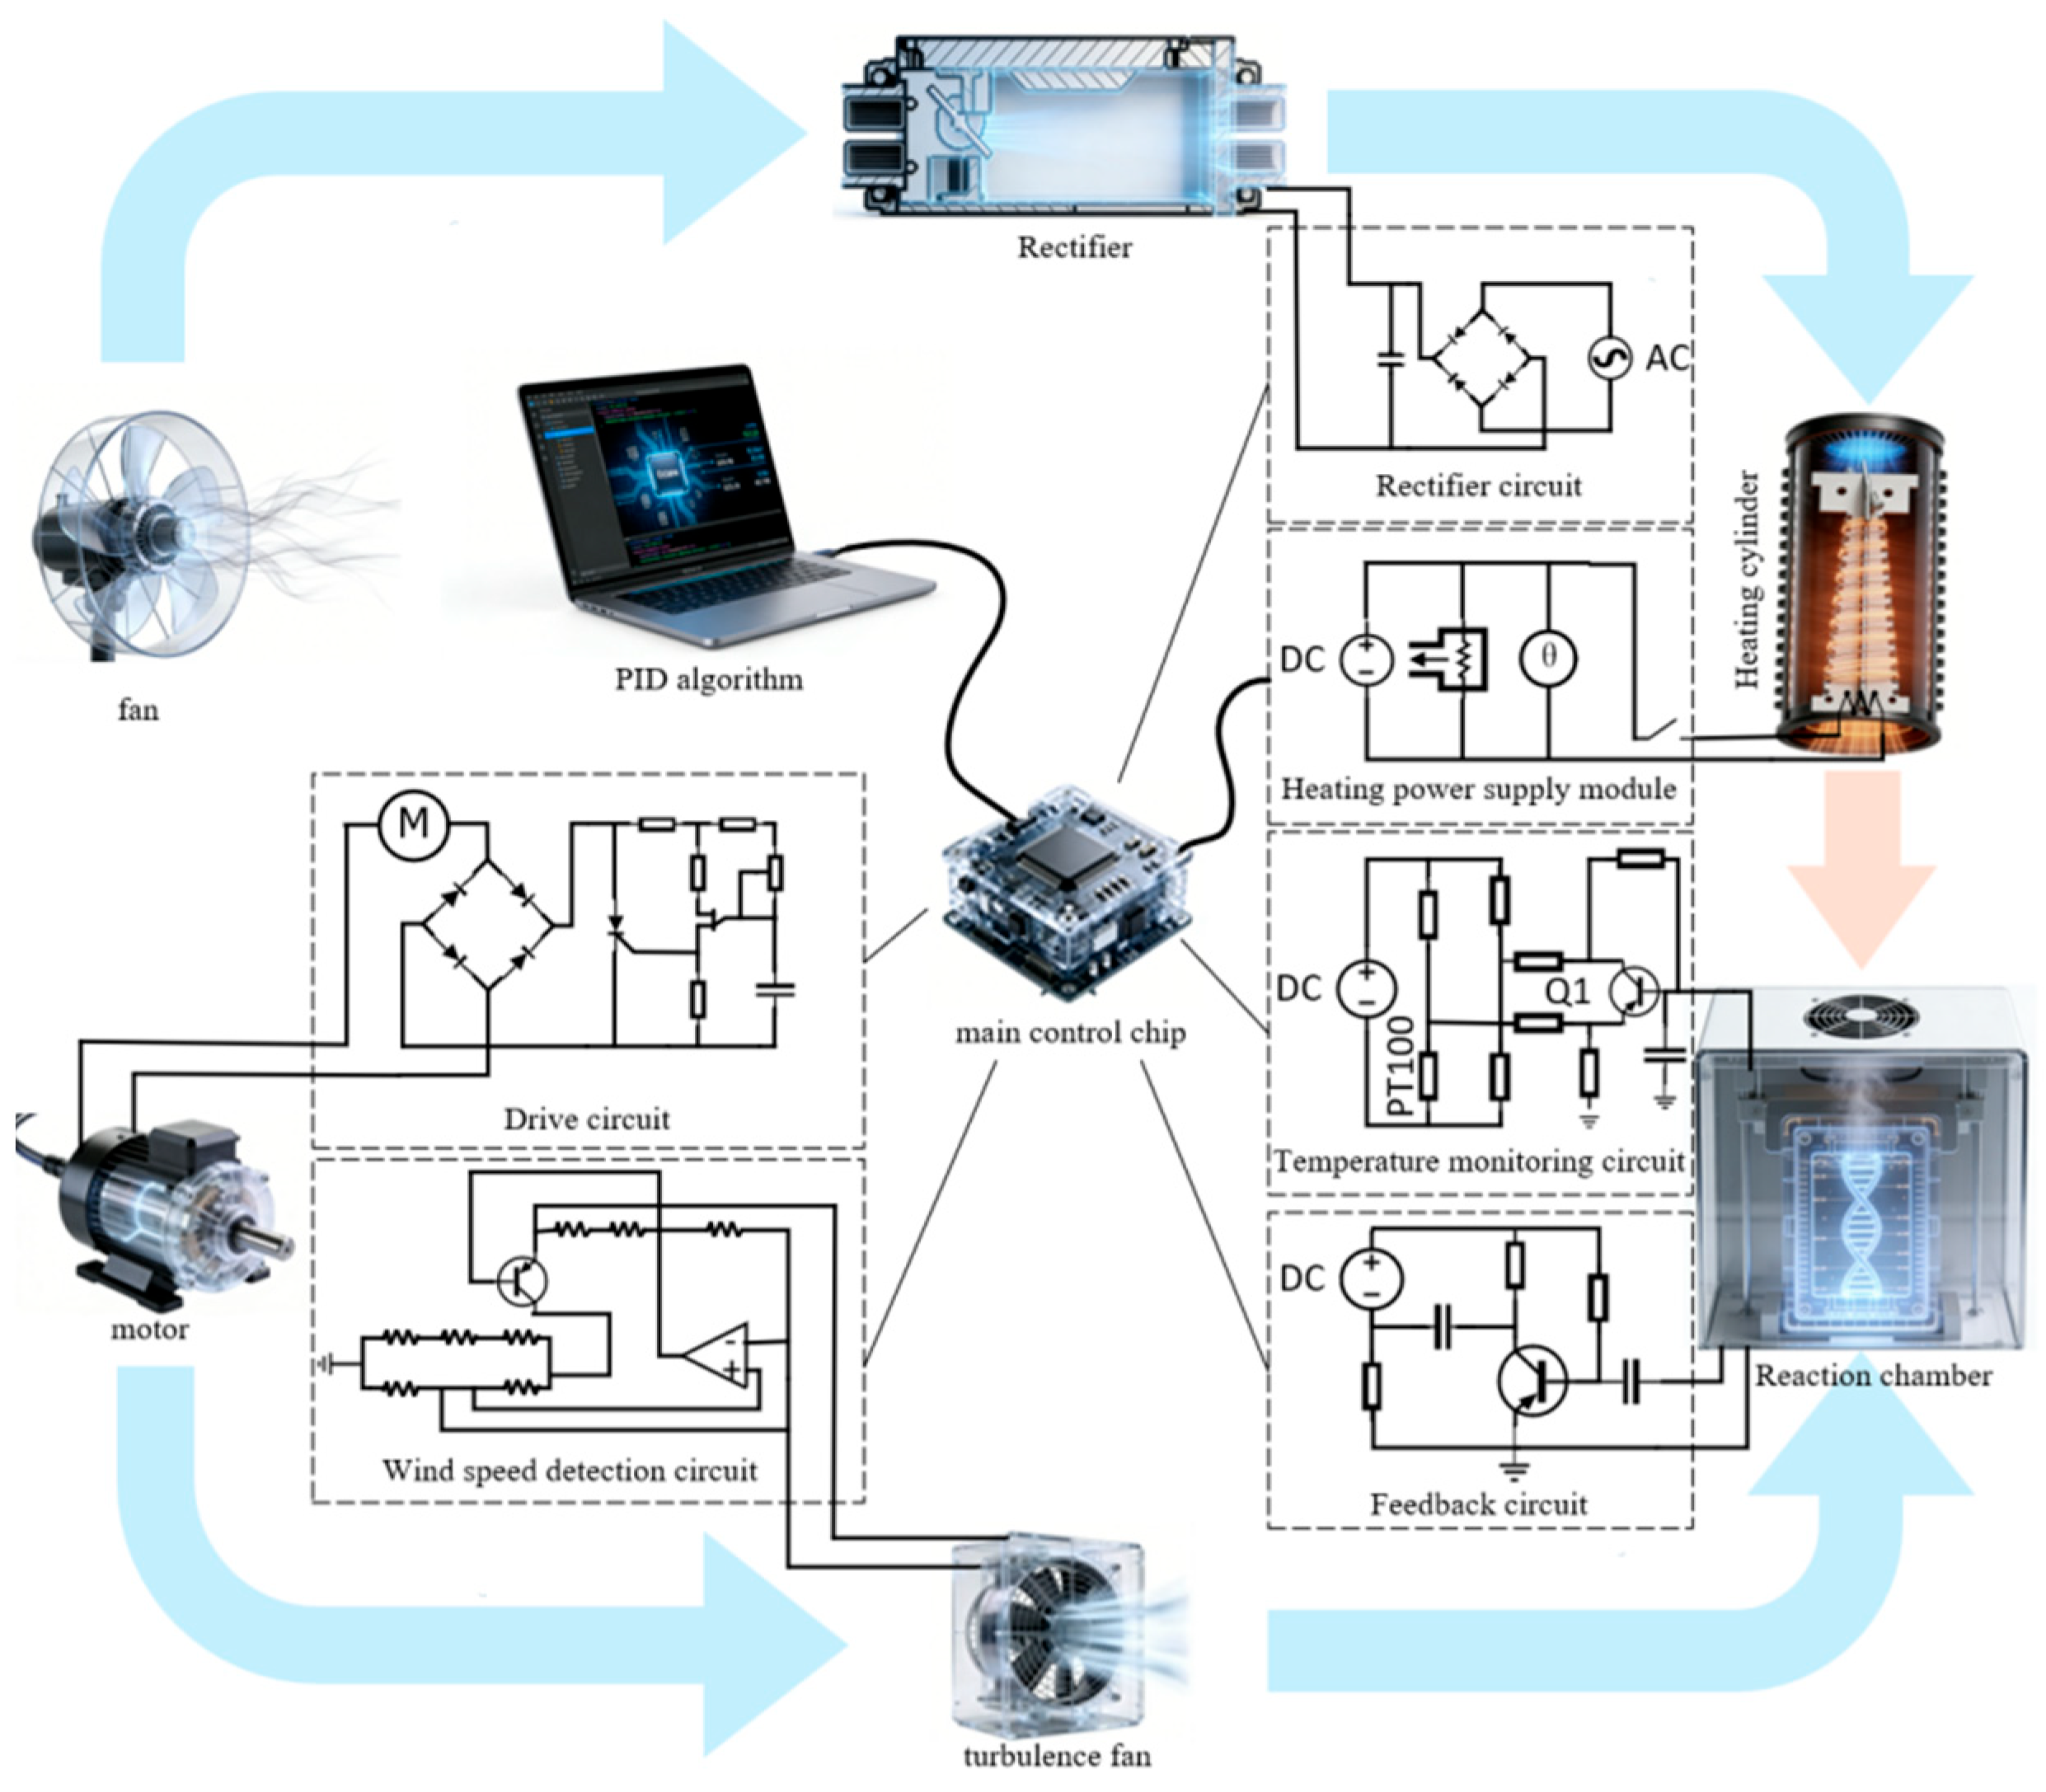
With the advancements in microelectronics, sensors, and manufacturing technologies, the temperature control system of thermal convection nucleic acid amplification instruments is continuously upgrading towards higher precision, faster response, and greater stability. To meet the stringent temperature control requirements of the three core stages, namely denaturation, annealing, and extension, a temperature control scheme based on forced convection is designed. More specifically, an efficient temperature control module is constructed by integrating rectifier, heating cylinder, and turbulence fan. The reaction chamber is placed within a controllable air thermal field to achieve dynamic temperature regulation. The system relies on hardware components such as high-precision temperature sensors and wind speed sensors for data acquisition. With a main control chip running a fuzzy PID algorithm as the core control unit, the system deeply integrates fuzzy PID control technology with the instrument hardware. Through real-time temperature sampling and closed-loop regulation, it optimizes the uniformity of the temperature field and the heating and cooling rates under the airflow circulation condition, ultimately ensuring the specificity of nucleic acid amplification and the reliability of test results. The working principle is illustrated in Figure 2.
The temperature control system in this study adopts a fully closed-loop control architecture. With the main control chip equipped with the fuzzy PID algorithm as the hardware core, the fuzzy PID control technology is deeply integrated with the instrument hardware. Through the algorithm, adaptive adjustment of control parameters and dynamic regulation are achieved. Driven by a preset amplification program, the system collaboratively controls the rectifier, heating cylinder, and turbulence fan to construct a dynamically adjustable air thermal field, and complete the heating and cooling processes required for nucleic acid amplification. The high-precision temperature sensor, as the hardware perception unit, collects real-time temperature data around the reaction chamber. Through the hardware paths such as feedback circuit, temperature monitoring circuit, and wind speed detection circuit, the data are transmitted with low latency to the main control chip running the fuzzy PID algorithm, providing real-time inputs for algorithm execution. After parameter setting and calculation, the algorithm outputs two control signals: one for precise regulation of heating power, and the other for optimizing airflow circulation and temperature field uniformity. Consequently, the system’s temperature response rate is improved. The entire system achieves precise temperature control throughout the nucleic acid amplification process through the fuzzy PID hardware control loop, ensuring product specificity and detection reliability.

3. Design of Fuzzy PID Temperature Control Algorithm for Nucleic Acid Amplification

Nucleic acid amplification has strict requirements for temperature control precision, stability and response speed. Conventional PID struggles to effectively handle the system’s nonlinearity and time-varying disturbances. The fuzzy PID algorithm, which integrates the advantages of fuzzy adaptive control and PID steady-state control, can establish a dynamic parameter adjustment mechanism. This chapter presents a comprehensive system design for this algorithm, covering key aspects such as architecture, variable quantification, membership functions, rule base, fuzzy reasoning, and defuzzification, ensuring the effective integration of core diagrams and formulas.

3.1. Overall Algorithm Control Architecture Design

The core of the fuzzy PID algorithm lies in real-time adaptive adjustment of PID parameters through fuzzy logic. Its overall architecture includes the basic fuzzy link and the complete adaptive integration [27]. Its basic workflow is shown in Figure 3. First, the real-time temperature y is compared with the preset temperature r to obtain the temperature deviation e. Then, the deviation is differentiated to obtain the deviation change rate ec. After fuzzifying e and ec into fuzzy variables E and EC, respectively, they are input into the inference unit to produce the fuzzy output U. Finally, defuzzification converts U into a crisp control quantity u that acts on the controlled object, forming a closed loop for preliminary temperature regulation.
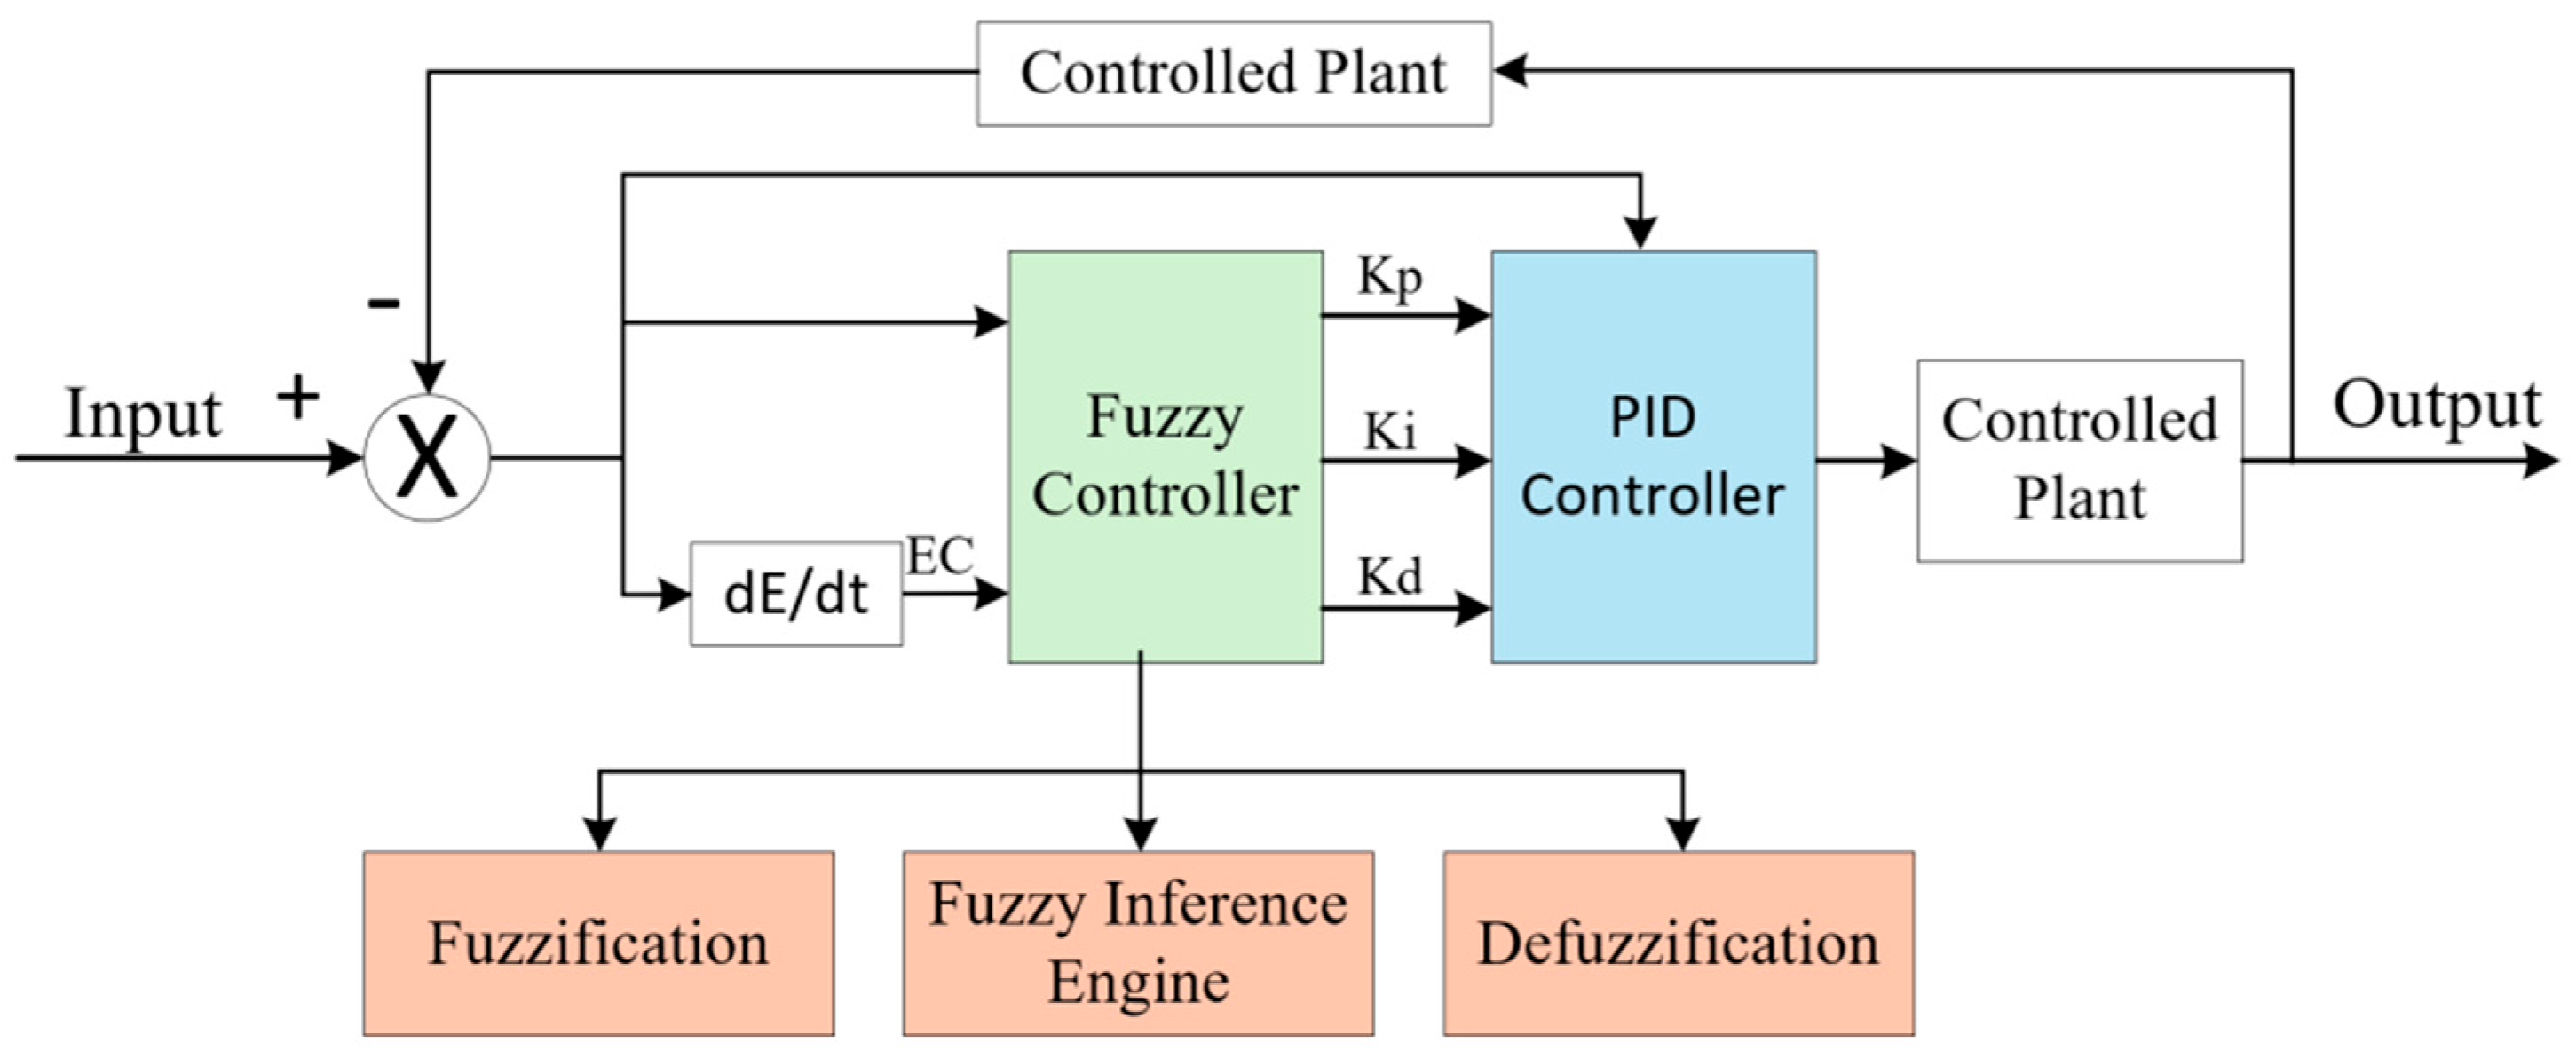
The output results of the basic fuzzy link can be used as the basis for correcting the PID parameters. As shown in Figure 4, the complete control architecture integrates a PID module on the basis of the basic fuzzy link. First, the temperature deviation e and the rate of deviation change ec are fuzzified into fuzzy variables E and EC. Then, the parameter correction amounts Kp, Ki, and Kd are obtained through fuzzy rule base reasoning. Finally, they are superimposed with the initial PID parameters to generate real-time adjustable Kp, Ki, and Kd parameters, driving the PID controller to achieve precise control. This architecture combines the steady-state advantage of PID control and the dynamic adaptive ability of fuzzy control, making it well suited to the complex characteristics of nucleic acid amplification temperature control.

3.2. Quantization Design of Fuzzy Input and Output Variables

To achieve precise temperature control during nucleic acid amplification, the fuzzy PID adopts a “two input and three output” configuration. The input quantities are selected as the temperature deviation e and the deviation rate ec, which characterize the extent and trend of temperature deviation from the setpoint. The output quantities are the three PID parameter correction amounts, ΔKp, ΔKi, and ΔKd, which optimize control performance through dynamic parameter adjustment [28].
Given the temperature range for nucleic acid amplification (55–95 °C) and the hardware system limits, the basic domains of e and deviation rate ec are both set as [−95, 95]. To enhance real-time performance, the fuzzy domain is quantified as [−3, 3] and divided into 7 fuzzy subsets: {NB, NM, NS, ZO, PS, PM, PB}. This division comprehensively cover all states ranging from extreme deviation to zero deviation.
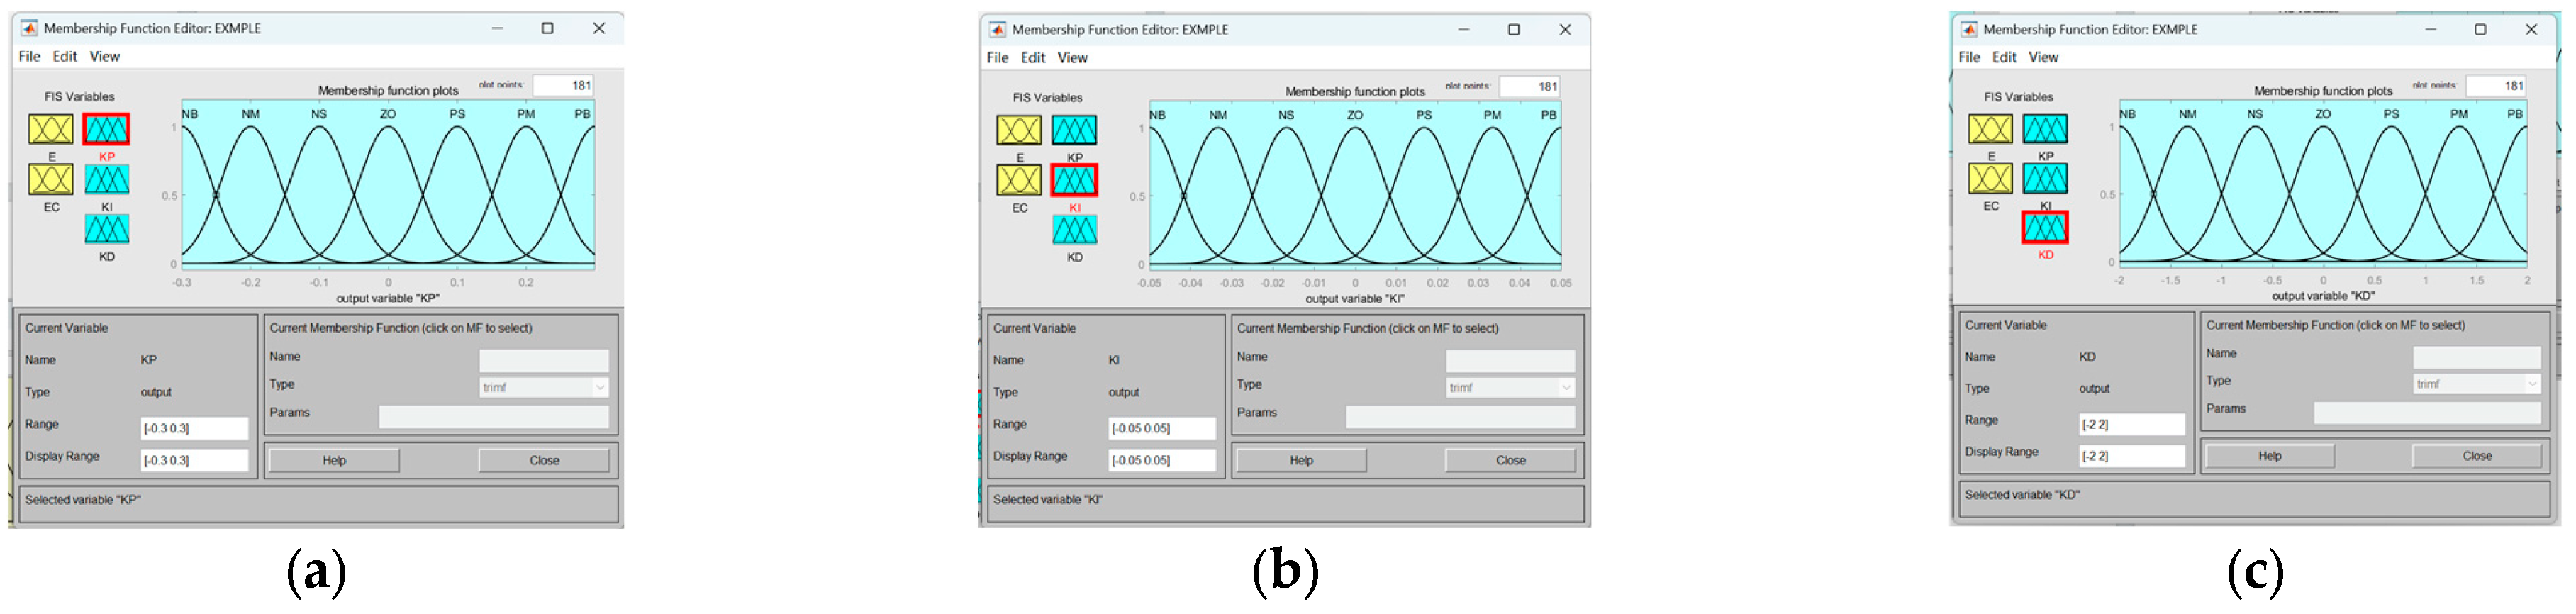
Based on system operating characteristics and experimental calibration results, the basic domains of the output variables are defined as follows. The range of ΔKp is [−0.3, 0.3], which is set to avoid overly aggressive adjustments. The range of ΔKi is [−0.05, 0.05], which is set to prevent saturation. The range of ΔKd is [−2, 2], which is set to quickly suppress deviations. The fuzzy domains of all three are quantified as [−3, 3] and divided into 7 fuzzy subsets, ensuring consistent parameter correction logic and precise control.
To achieve precise mapping between the basic domain and the fuzzy domain, quantization factors convert the measured temperature deviation and deviation change rate into the input values required for fuzzy inference. The calculation formula is shown in Equation (10).
G = u i
G is the quantization factor. u and i represent the value ranges of the basic domain and the fuzzy domain, respectively. This formula can uniformly map e and ec to the interval [−3, 3], providing standardized inputs and ensuring consistency and precision [29].

3.3. Optimization Design of Membership Functions

The membership function is the key link connecting precise quantities with fuzzy variables, which determines the overall performance of the control system. Considering the fast dynamic response, strong time-varying nature, and complex disturbances in the temperature control process for nucleic acid amplification, a mixed design scheme of Gaussian function and triangular function is adopted to balance smoothness and real-time performance.
For the two ends of the fuzzy subsets (NB and PB), a Gaussian membership function is used. Its expression is as shown in Equation (11):
y = gaussmf x , σ , c = e x c 2 2 σ 2
where y is the output membership value, x is the input temperature deviation variable; gaussmf is the standard abbreviation for Gaussian membership function; σ represents the standard deviation of the Gaussian function, which adjusts the steepness of the curve. The smaller the σ, the steeper the curve, and the more concentrated the membership degree. c is the mean value, which determines the center position and coverage range. The Gaussian function with smooth and continuous characteristics is used for the NB and PB subsets to avoid parameter changes under extreme deviations and ensure the stability of temperature control within the extreme value range [30].
For the intermediate fuzzy subsets (NM, NS, ZO, PS, PM), a triangular membership function is used. Its expression is as shown in Equation (12):
y = trimf x , a , b , c = 0 x a x a b a a x c c x c b b x d 0 x a
where y is the output membership value, x is the input temperature deviation, a and c are the left and right base points of the triangular function, which define the domain interval. b is the function vertex, corresponding to the maximum membership degree. This function has simple calculate calculation and quick response, which can effectively improve the efficiency of fuzzy reasoning and meet the real-time requirements of temperature control. Its linear variation characteristics accurately reflect the parameter adjustment law under the condition of intermediate deviation.
The core parameters of the membership functions are determined by a combined tuning method. First, based on the temperature control range (55~95 °C) of the thermal convection nucleic acid amplification instrument, heating and cooling rates (7.5 °C/s for heating and 13.5 °C/s for cooling), and hardware dynamic response characteristics, the deviation distribution range of the temperature control system is obtained through the MATLAB System Identification Toolbox, and the domain boundaries and center parameters of the fuzzy subsets are initially determined. Secondly, physical temperature control experiments in multiple temperature zones are conducted to collect temperature deviation and change rate data during the denaturation, annealing, and extension stages. The Gaussian function σ value is calibrated to ensure smooth control under extreme deviations, and the vertex and base point parameters of the triangular function are optimized to improve reasoning efficiency under intermediate deviations. Finally, iterative debugging is performed on the Simulink platform with overshoot, steady-state precision, and adjustment time as optimization objectives to determine the final membership function parameters, so that they match the nonlinear and time-varying characteristics of the thermal convection temperature control system.

3.4. Construction and Optimization of the Fuzzy Rule Base

The fuzzy rule base is the core of the fuzzy PID controller. It establishes the mapping between inputs and outputs based on experience and expansion requirements. Its design takes into account the effects of temperature deviation E and deviation change rate EC on the parameters Kp, Ki, and Kd, and formulates adjustment strategies for the denaturation, annealing, and extension stages.
When E is large, the control objective is to quickly correct the deviation. Kp should be increased to accelerate the response speed. Ki and Kd should be reduced to suppress integration accumulation and disturbances, prevent overshoot oscillation, and ensure a smooth heating and cooling process.
When E is moderate, the control focus is on balancing response speed and control stability. Kp takes a medium value to balance control sensitivity and prevent over-control. Ki and Kd are also set at the median value, gradually enhancing the integration effect to eliminate static errors. A moderate differentiation effect is used to suppress deviation changes. Thus, it ensures a smooth transition that meets the high stability requirements of the annealing stage.
When E is small, the control objective is to improve control precision and anti-interference capability. Kp should be increased to enhance fine-tuning precision, and Ki should be increased to completely eliminate steady-state error, satisfying the precision requirements of the extension stage. Kd should be kept moderate to suppress oscillations caused by fluctuations in the power supply or environment, thereby ensuring the stability of temperature.
Through the above control strategy, fuzzy control rule tables for E, EC and ΔKp, ΔKi, ΔKd are established based on extensive experimental data and simulation analyses of nucleic acid amplification temperature control. These tables cover 7 × 7 = 49 combinations of input variables, achieving comprehensive coverage of all temperature states. The specific rule tables are shown below (Table 1, Table 2 and Table 3):
The fuzzy control rule base and parameter tuning follow the experimental verification closed-loop process. First, based on the three-stage temperature control process requirements of nucleic acid amplification (95 °C denaturation, 55 °C annealing, and 72 °C extension), the PID parameter adjustment strategies under different temperature deviations E and deviation change rates EC are clarified. Second, by integrating the expert experience of intelligent temperature control and the practical engineering experience of PCR temperature control, a basic rule table covering all operating conditions is generated. Subsequently, the rules are imported into the MATLAB Fuzzy toolbox for iterative simulation. Based on the indicators of temperature control response speed and overshoot suppression effect, the rule conflicts are corrected and the mapping relationships are optimized. Finally, through repeated calibration using actual experiments of the thermal convection-based nucleic acid amplification instrument, it is ensured that the rules adapt to actual working conditions such as forced convection heat transfer, environmental disturbance, and time-varying thermal inertia. As a result, 49 optimal fuzzy control rules are ultimately formed.

3.5. Fuzzy Inference and Dynamic Adjustment of PID Parameters

Fuzzy inference is the core step in converting input fuzzy quantities into output fuzzy quantities based on the rule base. The Mamdani inference method is adopted. The mapping relationships of rules are expressed through “IF-THEN” logical statements. 49 input combinations corresponding to the output strategies are comprehensively covered. For example:
  • R1: If E is NB and EC is NB, then ΔKp is PB, ΔKi is NB, and ΔKd is PS
  • R2: If E is NB and EC is NM, then ΔKp is PB, ΔKi is NB, and ΔKd is NS
  • R49: If E is PB and EC is PB, thenΔKp is NB, ΔKi is PB, and ΔKd is PB
The mathematical expression of the above rules is given in Equation (13), which establishes a mapping relationship through the Cartesian product of the input variable fuzzy subsets and the output variable fuzzy subsets:
R 1 = N B E × N B E C T × P B K p × N B K i × P S K d R 49 = P B E × P B E C T × N B K p × P B K i × P B K d
The inference process is as follows. First, based on the membership values of the input variables E and EC, all matching fuzzy rules are activated. Then, through fuzzy operations, the outputs of all activated rules are integrated to obtain fuzzy sets for ΔKp, ΔKi, and ΔKd, providing a basis for subsequent parameter adjustments.
The ΔKp, ΔKi, and ΔKd obtained from fuzzy inference are fuzzy sets. They need to be combined with the initial PID parameters to obtain the precise parameters required for actual control. The real-time adjustment formula for PID parameters is shown in Equation (14):
K p = K p 0 + Δ K p K i = K i 0 + Δ K i K d = K d 0 + Δ K d
Kp0, Ki0, and Kd0 are the initial parameters determined based on the static characteristics and experimental calibration, ensuring the stable system startup. Kp, Ki, and Kd are the real-time parameters dynamically updated in accordance with the temperature state, enabling adaptive system control [31].

3.6. Defuzzification Processing

The fuzzy outputs ΔKp, ΔKi, and ΔKd need to be converted into precise values through defuzzification. In this study, the area centroid method is adopted to obtain representative values by calculating the centroid of the membership function curve. This method provides smooth output, strong anti-interference capability, and full utilization of all information, and balances precision and efficiency. It is suitable for the temperature control system of nucleic acid amplification.
The continuous domain calculation formula for the area centroid method is shown in Equation (15):
u = a b μ N x · x d x a b μ N x d x
where u is the precise output value obtained after defuzzification; a and b are the minimum and maximum values representing the domain of the fuzzy output variable; μ N x represents the membership function of the output fuzzy variable, where x is the variable value in the fuzzy domain. The integration covers the entire fuzzy domain, ensuring that information from all fuzzy subsets is incorporated.
In practical engineering applications, to improve computational efficiency and adapt to the discrete nature of digital control systems, a discrete-domain approximation formula is adopted, as shown in Equation (16):
u = i = 1 n x i · μ N x i i = 1 n μ N x i
where u is the precise output value after defuzzification; x i represents the discretized node values in the fuzzy domain, μ N x i is the membership degree corresponding to x i , and n is the total number of discrete nodes. This formula quickly and accurately calculates ΔKp, ΔKi, and ΔKd, providing the basis for real-time PID adjustment and ensuring temperature control precision and stability [32].

3.7. Theoretical Analysis of Stability and Robustness of Fuzzy PID Temperature Control Algorithm

To verify the stability of the proposed fuzzy adaptive PID temperature control algorithm, rigorous modeling and derivation of the closed-loop error system are first performed. Let the temperature setpoint be r t and the system output temperature be h t . The error is defined as:
e t = r t h t
Consider the fuzzy adaptive PID control law:
u t = K p t e t + K i t 0 t e τ d τ + K d t e t
where K p t = K p 0 + Δ K p t , K i t = K i 0 + Δ K i t and K d t = K d 0 + Δ K d t . Combined with the nonlinear model of the thermal convection-based nucleic acid amplifier, the controlled plant can be simplified as:
h t = f ( h , t ) + b ( t ) u t + d t
where f ( h , t ) denotes the nonlinear thermal inertia term of the system, b ( t ) is the input gain, and d t is the external disturbance term. Accordingly, the closed-loop error dynamics can be expressed as:
e t = f ( h , t ) b ( t ) u t d t + r t
Under the condition of constant set temperature (the segmented constant temperature condition of PCR), r t = 0 , and the closed-loop error system is obtained as:
e t = f ( h , t ) b ( t ) u t d t
The Lyapunov function is selected as:
V t = 1 2 e 2 t
Taking the derivative of yields:
V t = e t e t
Substituting the closed-loop error system into the above equation gives:
V t = e t f ( h , t ) b ( t ) u t d t
Further substituting the fuzzy adaptive PID control law into the equation yields:
V t = b ( t ) e t K p t e t + K i t 0 t e τ d τ + K d t e t e t f ( h , t ) e t d t
Among them, the first term b ( t ) K p t e 2 t is the dominant term that ensures error attenuation. When the control input gain satisfies b ( t ) > 0 and K p t > 0 , this term is negative for any non-zero error. The integral term is used to eliminate steady-state errors, and the derivative term is used to suppress overshoot caused by rapid error changes. Their parameters are all constrained by the fuzzy universe of discourse, membership functions, and defuzzification output range, so they will not undermine the negative feedback characteristics of the system.
Considering the effects of system nonlinear terms and external disturbances, they are combined into a comprehensive residual term Φ ( t ) :
Φ ( t ) = e t f ( h , t ) e t d t
Since the reaction chamber temperature, air velocity, ambient temperature, and heating power are all within limited physical ranges, both f ( h , t ) and d t are bounded functions. Therefore, there exists a positive constant c 2 such that Φ ( t ) c 2 e 2 t . By reasonably selecting initial control parameters and combining online correction via fuzzy rules, the proportional control dominant term can be made larger than the comprehensive residual term, that is, there exists a positive constant c 1 > 0 satisfying:
V t c 1 e 2 t
Thus, when e t 0 , we have V t < 0 ; when e t = 0 , we have V t = 0 . This indicates that the Lyapunov function decreases monotonically along the trajectory of the closed-loop system, the equivalent energy of the closed-loop error system continuously reduces, and the system state will gradually converge to the equilibrium point with zero error.
According to the Lyapunov asymptotic stability theorem, if there exists a continuously differentiable, positive definite, and radially unbounded Lyapunov function whose first derivative is negative definite, the equilibrium point of the system is asymptotically stable. The constructed V t = 1 2 e 2 t in this paper satisfies positive definiteness and radial unboundedness, and its derivative satisfies V t c 1 e 2 t < 0 . Therefore, the closed-loop temperature control error system meets the Lyapunov asymptotic stability condition, that is:
l i m t e t = 0
This indicates that the actual temperature h t can asymptotically track the set temperature r t , and the system can theoretically achieve zero-static-error temperature control. The global asymptotic stability referred to in this paper means that within the operating ranges of temperature, air velocity, and heating power allowed by the instrument, the closed-loop system can maintain bounded errors and eventually converge to zero for any initial temperature error. Since the correction amounts of fuzzy PID parameters are jointly constrained by the finite universe of discourse, membership functions, and centroid defuzzification, K p t ,   K i t , and K d t always remain bounded, thus avoiding the divergence problem in the parameter adaptation process. This theoretical analysis provides a stability basis for the low overshoot, short settling time, and high steady-state accuracy exhibited in subsequent simulations and experiments [33].
Combined with the Lyapunov stability analysis, it can be seen that under the conditions of bounded disturbances and bounded control parameters, the closed-loop error system will not diverge. The temperature error always remains bounded and can re-converge to the vicinity of the set temperature after the action of disturbances. Therefore, the proposed fuzzy adaptive PID temperature control algorithm has certain robustness against thermal inertia changes, ambient temperature drift, and airflow disturbances, and can meet the requirements of rapid temperature rise and fall and high-precision constant temperature control in the nucleic acid amplification process.

4. Simulation Verification and Test Analysis of Fuzzy Adaptive PID Temperature Control Algorithm

To verify the performance of the fuzzy adaptive PID algorithm in nucleic acid amplification temperature control, a simulation system based on MATLAB R2020a (Fuzzy/Simulink) is built in this chapter. Through system modeling, parameter configuration, and comparative experiments, the analysis covers dynamic response, steady-state precision, and disturbance rejection capability. Meanwhile, a physical test platform is constructed for validation, providing data support for engineering applications.

4.1. Simulation Environment and Core Parameter Configuration

MATLAB R2020a is selected as the core platform. The membership function, rule base and reasoning mechanism are efficiently defined using the Fuzzy toolbox. The Simulink visualization environment is utilized. By dragging and dropping modules, the conventional PID and fuzzy adaptive PID comparison model can be quickly constructed, thereby improving the simulation efficiency and reliability.
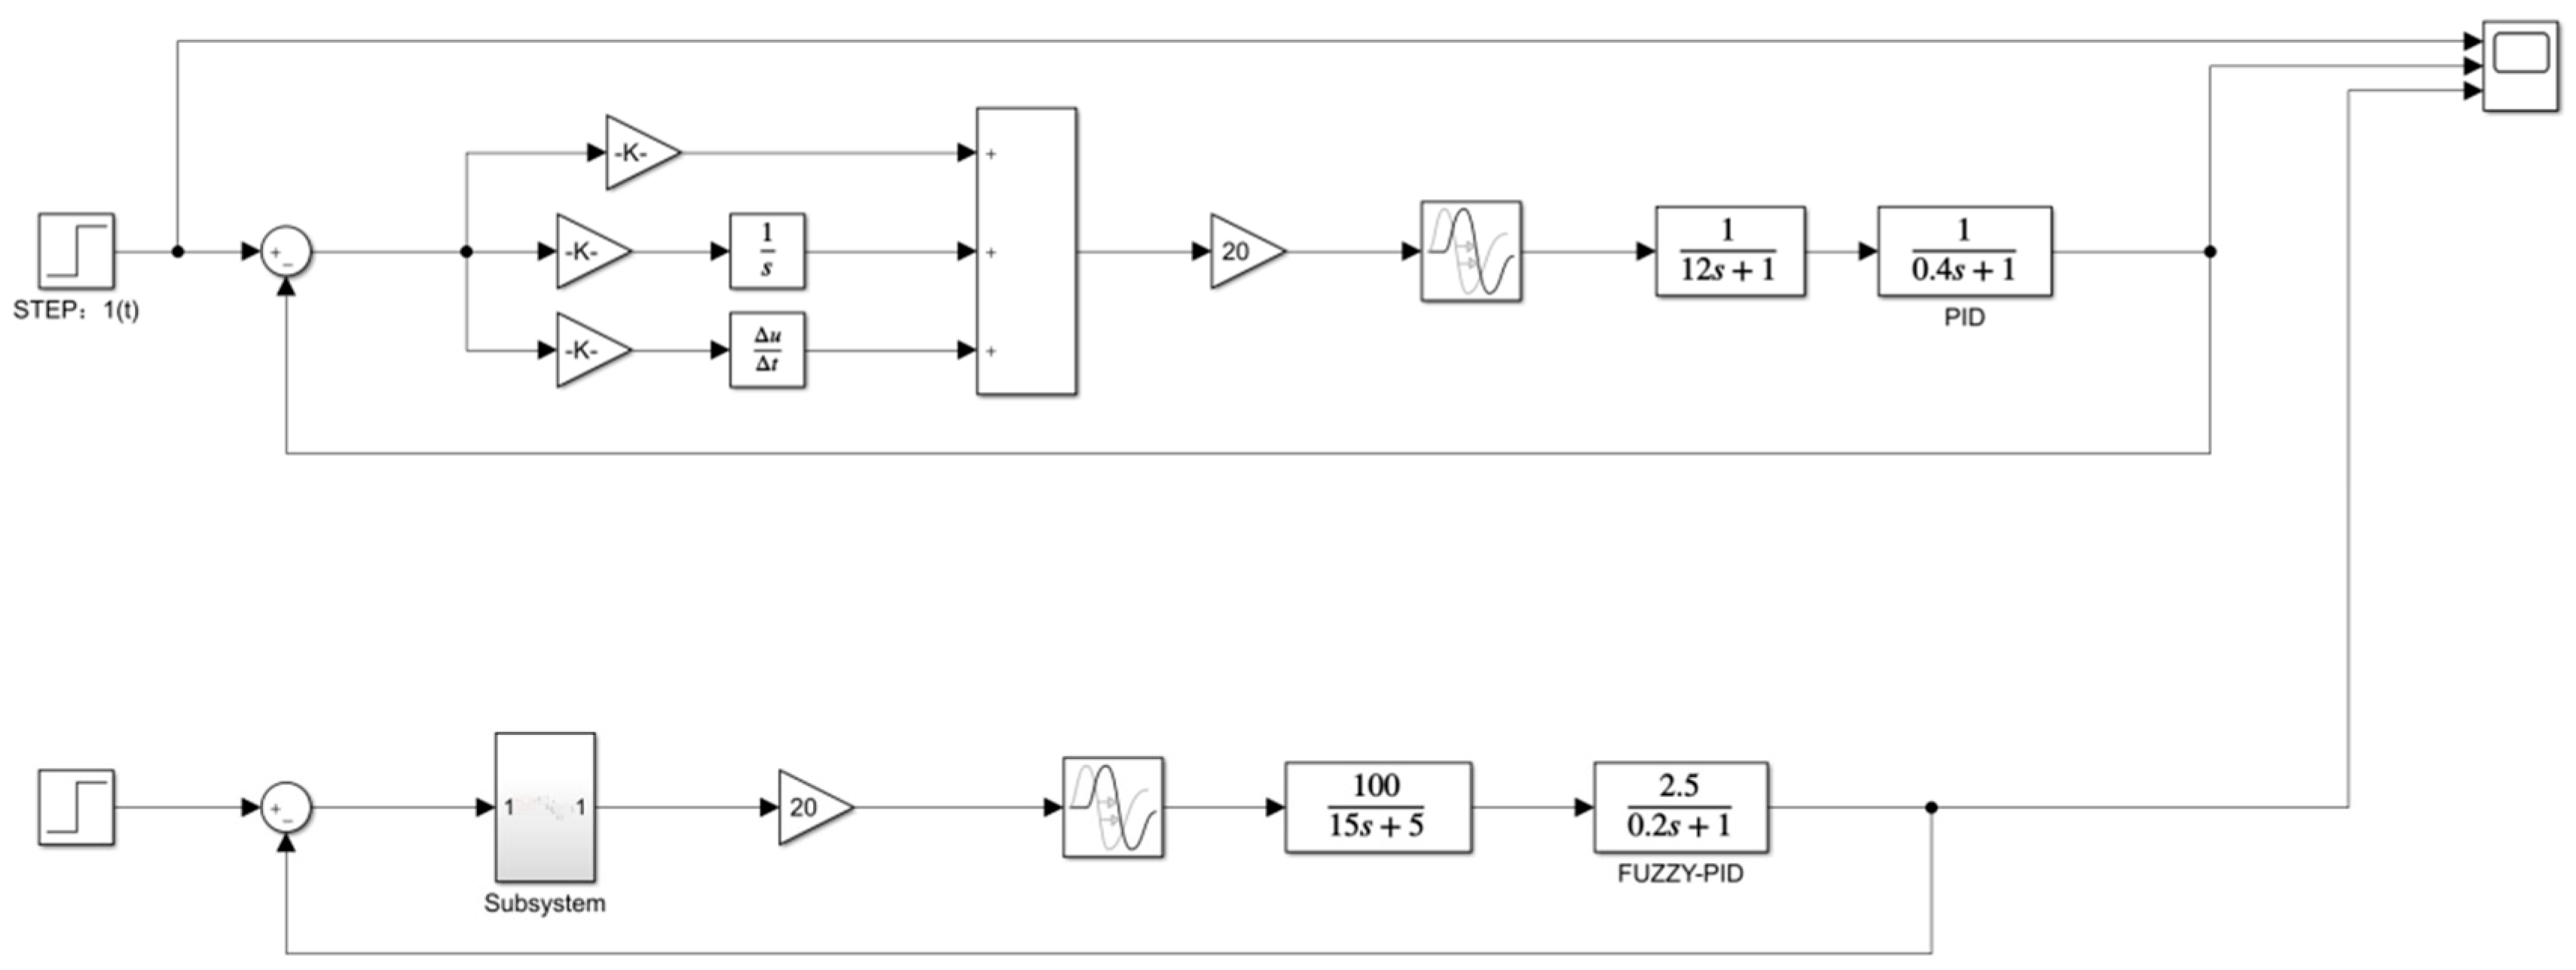
In response to the nonlinear thermal effects, airflow-temperature field coupling, environmental heat exchange coupling, and time-varying hysteresis characteristics of the temperature control system of thermal convection nucleic acid amplification instruments, the traditional linear time-invariant model is abandoned, and a segmented nonlinear first-order inertia series model is used to characterize the system dynamic response. This model retains the simulation adaptability of the first-order inertia structure and embeds the nonlinearity of thermal convection heat transfer, airflow coupling, and environmental disturbance coupling characteristics. Combined with the heat transfer characteristics of thermal convection hardware, multi-temperature zone system identification, and experimental calibration, the temperature zone-dependent thermal inertia coefficient α(T), airflow coupling coefficient β(v), environmental disturbance compensation coefficient γ(T0), and heating nonlinear gain k(T) are introduced to construct the segmented nonlinear transfer function of the controlled object as follows.
The nonlinear first-order inertia transfer function of the main heating module:
G S 1 S = k ( T ) · α ( T ) · 100 15 s + 1
The nonlinear first-order inertia transfer function of the sensing and heat dissipation module:
G S 2 S = β ( v ) · γ ( T 0 ) · 2.5 0.2 s + 1
The total transfer function of the system is the series coupling of the two modules:
G S = G S 1 S × G S 2 S
where G S 1 S is the nonlinear transfer function of the main heating module, G S 2 S is the nonlinear transfer function of the sensing and heat dissipation module, and G(s) is the total transfer function of the temperature control system. α(T) is the temperature zone nonlinear thermal inertia correction coefficient, which dynamically adapts to the three temperature zones of denaturation at 95 °C, annealing at 55 °C, and extension at 72 °C, and characterizes the nonlinear thermal inertia differences between the reaction chamber and airflow at different temperatures. β(v) is the forced convection airflow coupling coefficient, which correlates the coupling heat transfer characteristics between the turbulence fan wind speed and the temperature field. γ(T0) is the environmental temperature coupling compensation coefficient, which offsets the heat exchange disturbance between the environment and the instrument. k(T) is the heating power nonlinear gain, which corrects the nonlinear characteristics of the heating module output.
The experimental calibration procedure for the nonlinear parameters is as follows. First, step heating inputs are applied to the system at three standard temperature zones: 55 °C (annealing), 72 °C (extension), and 95 °C (denaturation). The step response curves of the reaction chamber temperature are recorded, and the first-order time constant at each zone is identified using the MATLAB System Identification Toolbox. The ratio of each identified time constant to a reference time constant yields the value of α(T) at the corresponding temperature. A continuous function α(T) over the entire range of 55–95 °C is then obtained by cubic spline interpolation. Second, while the heating power is kept constant, the speed of the circulation fan is varied in steps of 0.5 m/s. The steady-state temperature and the heating rate of the reaction chamber are measured at each fan speed, and the relationship between fan speed and heat exchange efficiency is fitted to determine the nonlinear function β(v). Third, within the typical operating ambient temperature range of 15–35 °C, the ambient temperature T0 is set in steps of 5 °C. With no heating input, the heat exchange rate between the reaction chamber and the environment is recorded, and the correlation between the ambient temperature and the system heat loss is fitted to obtain the calibration function γ(T0). Fourth, over the full temperature range of 55–95 °C, target temperatures are set in steps of 5 °C. Once the steady state is reached, the heating power output is recorded, and the nonlinear relationship between temperature and heating power gain is fitted, yielding the calibration curve k(T). After all parameters are calibrated, the simulation model can accurately reproduce the nonlinear dynamic behavior of the actual convective thermal control system, ensuring that the response error between the simulation model and the physical system is less than 5% and thereby satisfying the reliability requirements for simulation validation.
This model comprehensively covers the nonlinear thermal effects, airflow-heat field coupling, environmental coupling, and time-varying characteristics of the thermal convection temperature control system, and accurately reproduces the actual temperature control dynamic process.
To ensure the fairness and effectiveness of the comparison, both controllers use identical initial parameters. Based on the static characteristics and engineering experience, the values are set as Kp0 = 0.25, Ki0 = 0.0035, and Kd0 = 0.008. The simulation parameters are as follows: duration 150 s, sampling interval 1 s, and input signals including a unit step and a time-sequence signal that mimics nucleic acid amplification.
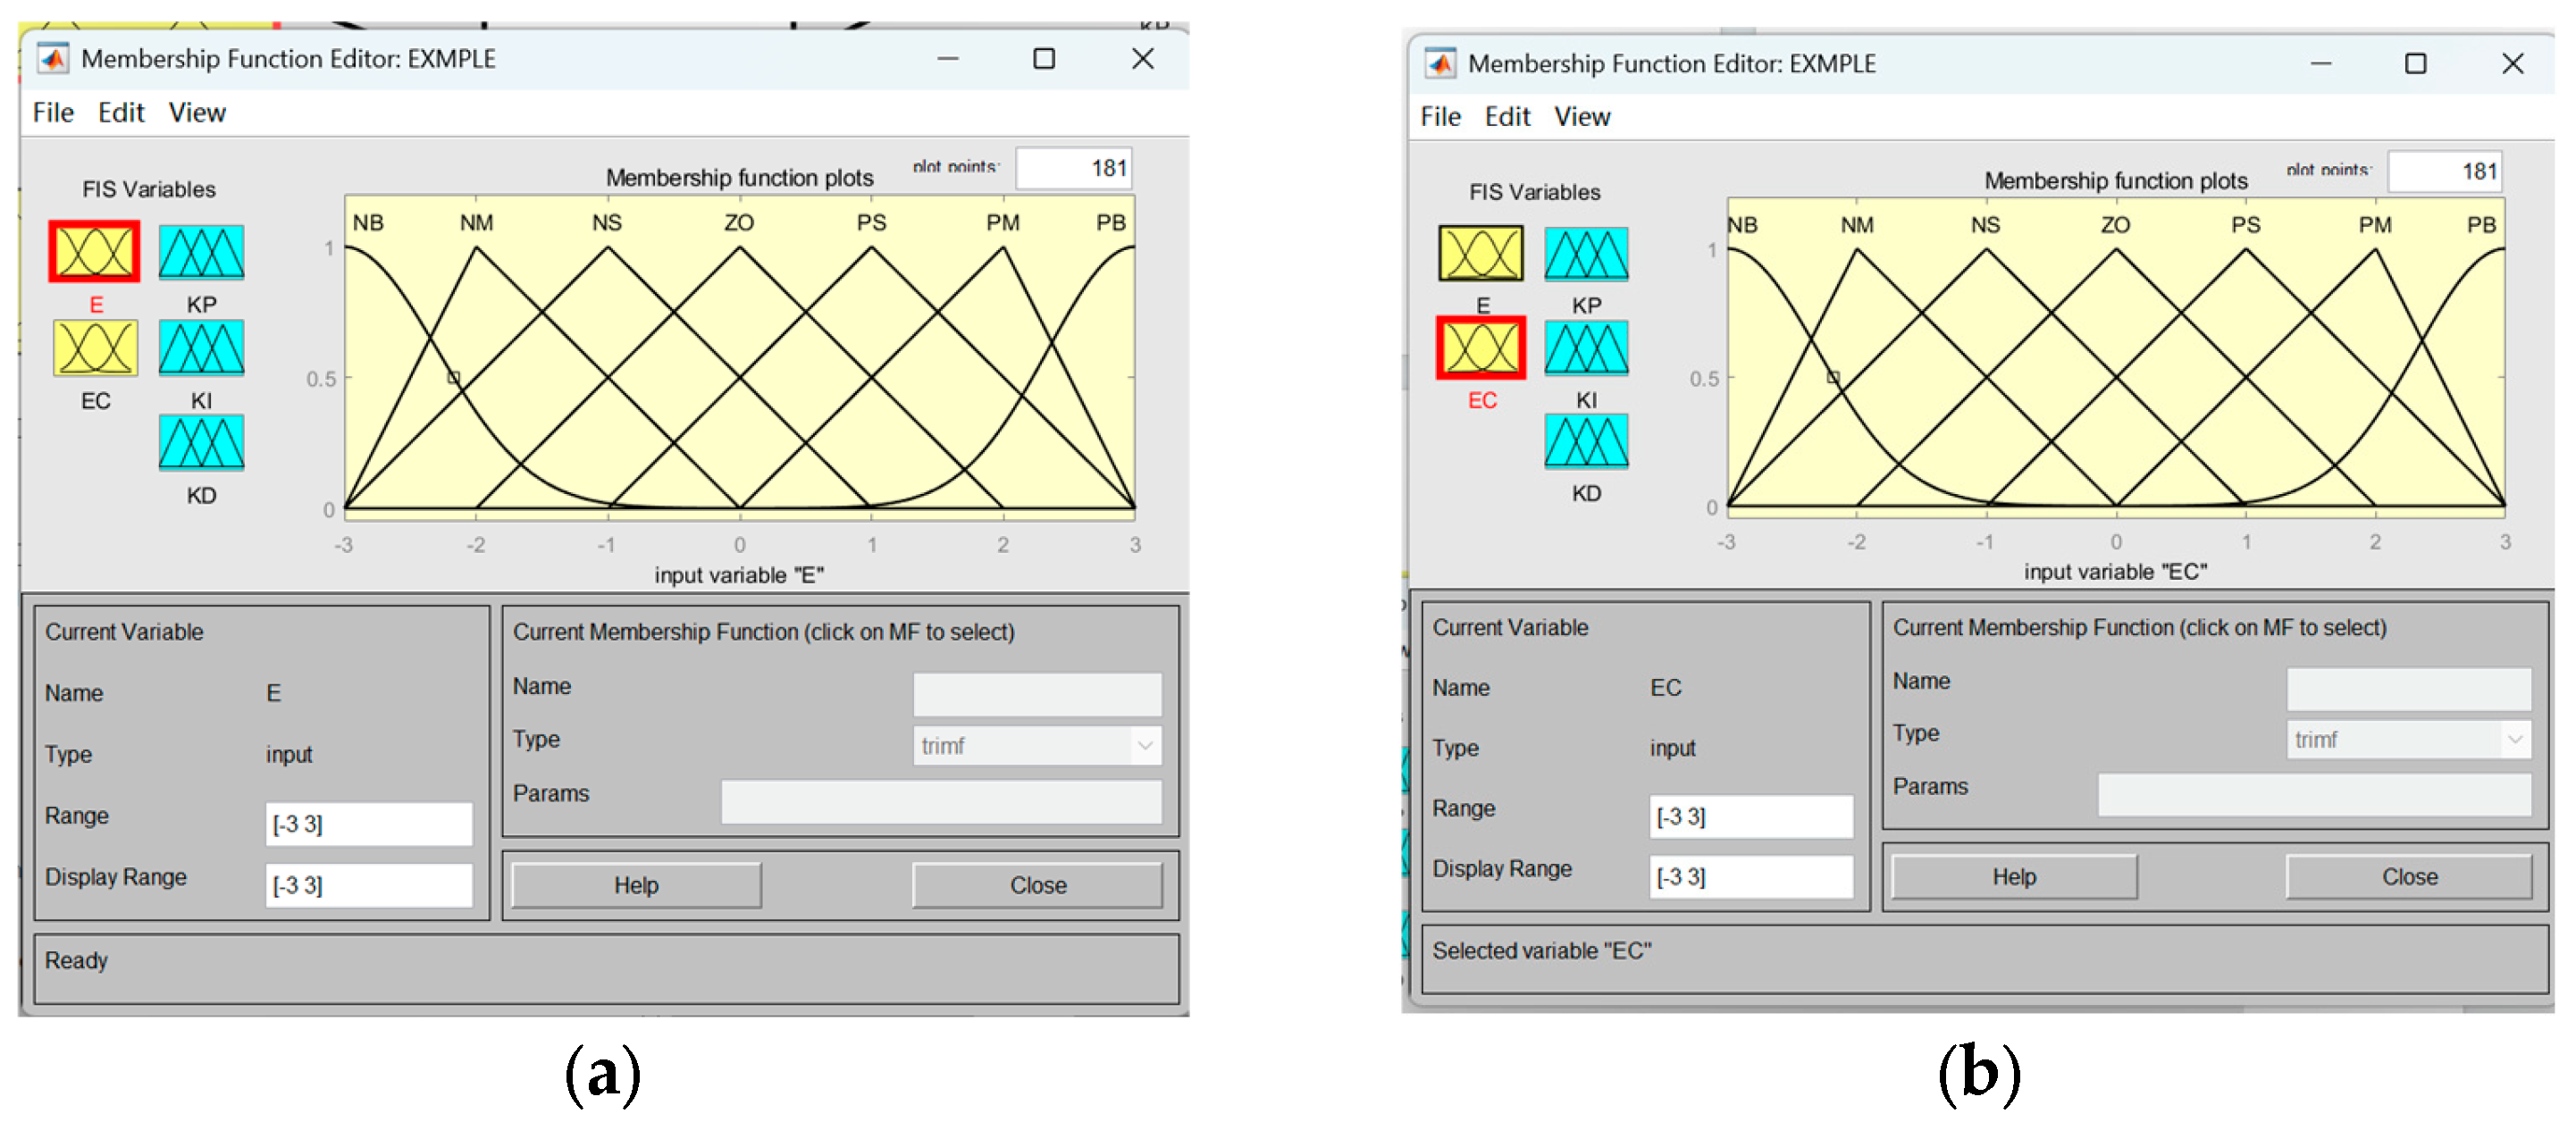
Based on the algorithm design, the membership functions and the domains of input and output variables are defined in the MATLAB Fuzzy toolbox. The input variables are temperature deviation E and deviation change rate EC. Their membership functions are shown in Figure 5. Both have a fuzzy domain of [−3, 3] divided into seven subsets (NB, NM, NS, ZO, PS, PM, PB). The boundary subsets (NB, PB) use Gaussian functions to ensure smooth adjustments under extreme deviations. The intermediate subsets (NM through PM) use triangular functions to improve inference efficiency.
The output variables are the PID parameter corrections ΔKp, ΔKi, and ΔKd. Their membership functions are shown in Figure 6. Figure 6a presents the membership functions of ΔKp over the domain [−0.3, 0.3]. Figure 6b shows those of ΔKi over [−0.05, 0.05]. Figure 6c displays those of ΔKd over [−2, 2]. All three adopt the same hybrid design of Gaussian and triangular functions as the input variables, ensuring coherence in fuzzy inference logic and precision in parameter adjustment.
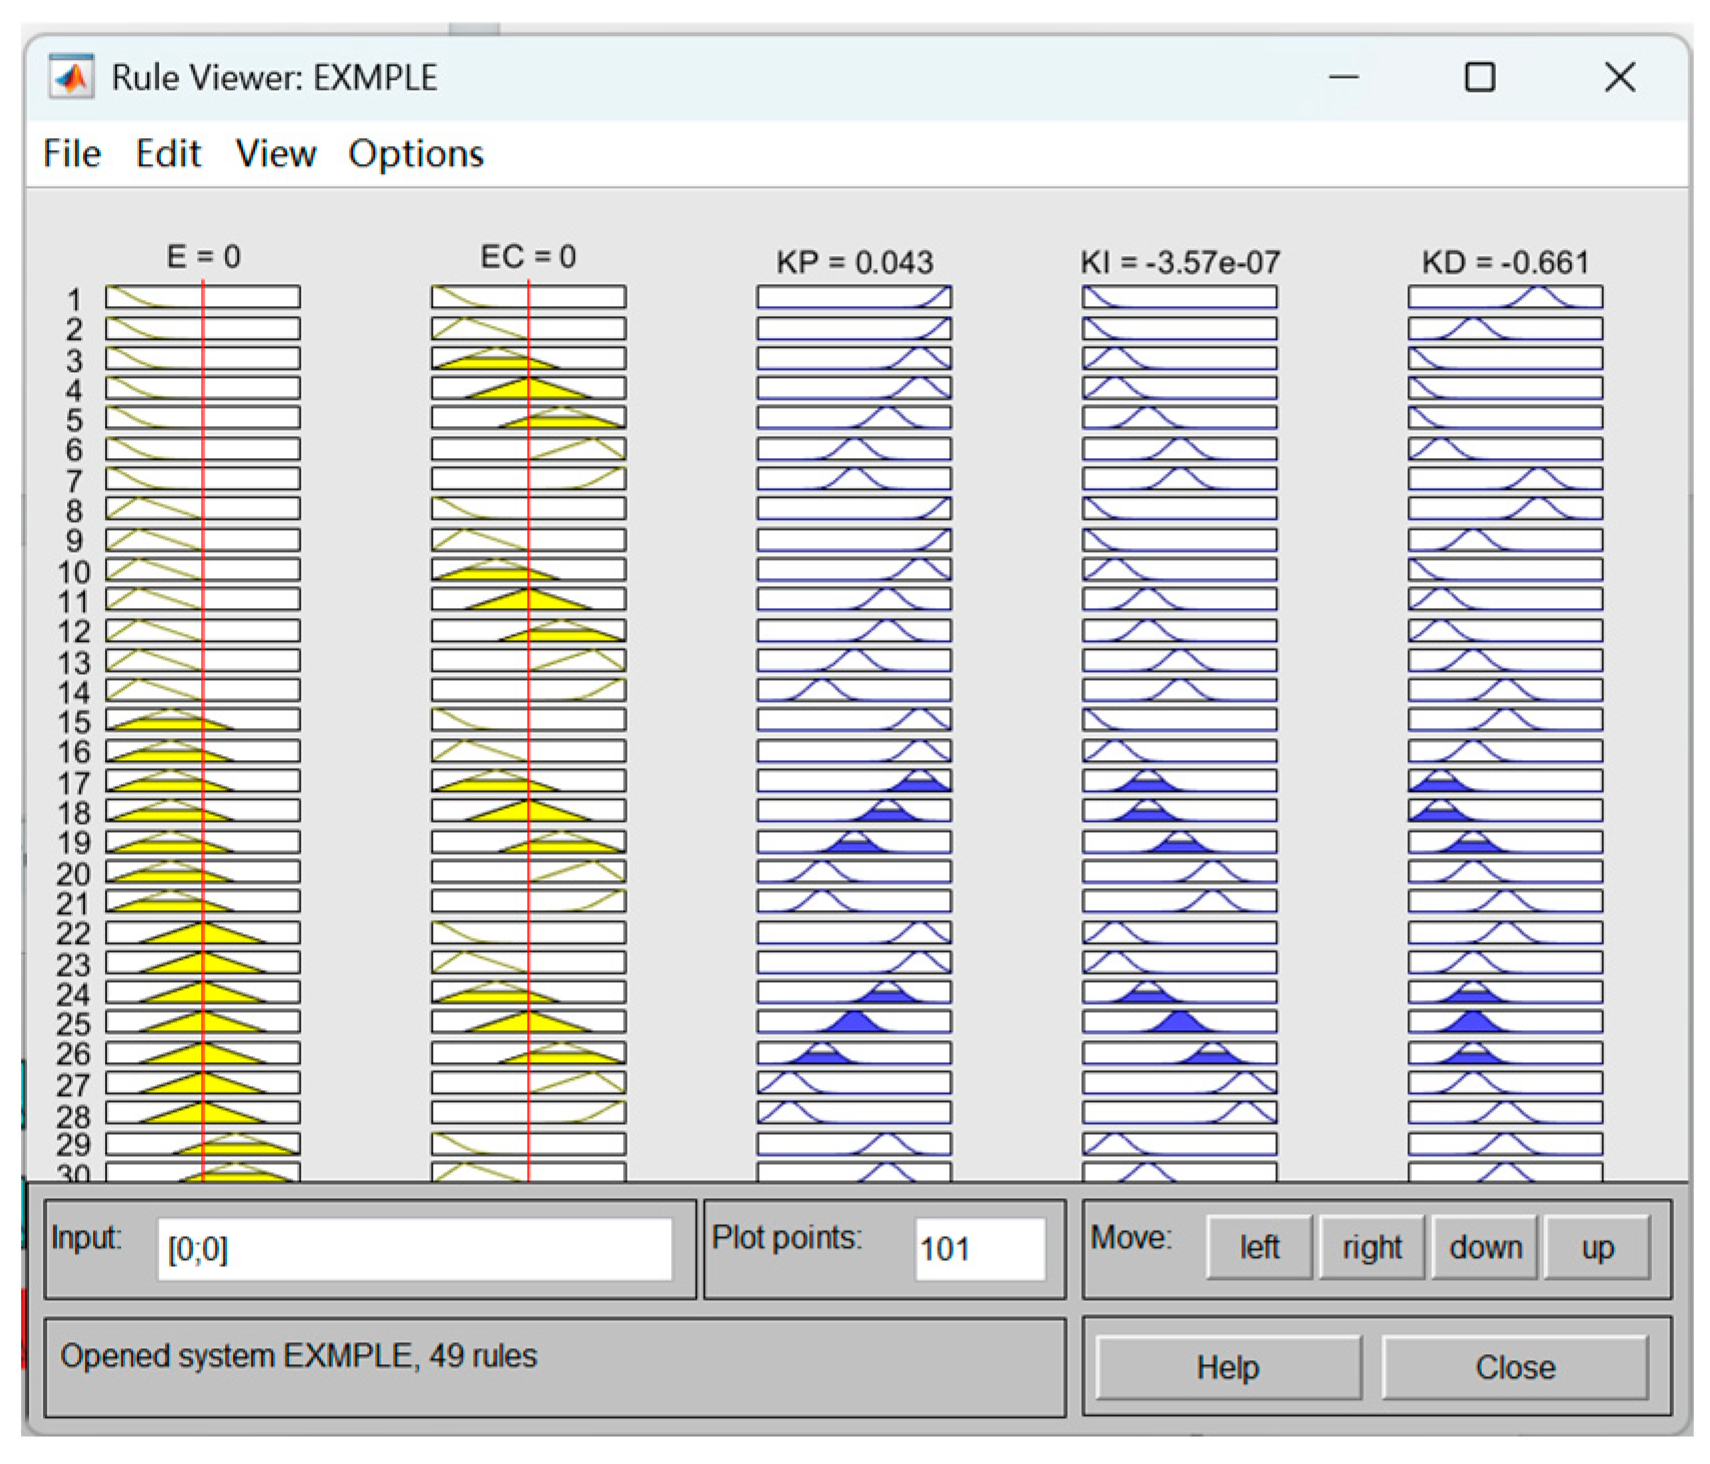
According to the ΔKp, ΔKi, and ΔKd fuzzy control rule tables established in the second part, the mapping of all 7 × 7 = 49 fuzzy rules is configured in the Fuzzy toolbox through “IF-THEN” statements. It is worth noting that all the rules cover all the combination states of the input variables E and EC. After rule configuration, the Rule Viewer function of the toolbox verifies the settings visually, as shown in Figure 7. When E = 0 and EC = 0, the system outputs ΔKp = 0.043, ΔKi = −0.000000357, and ΔKd = −0.661, verifying the correctness of the rule mapping.
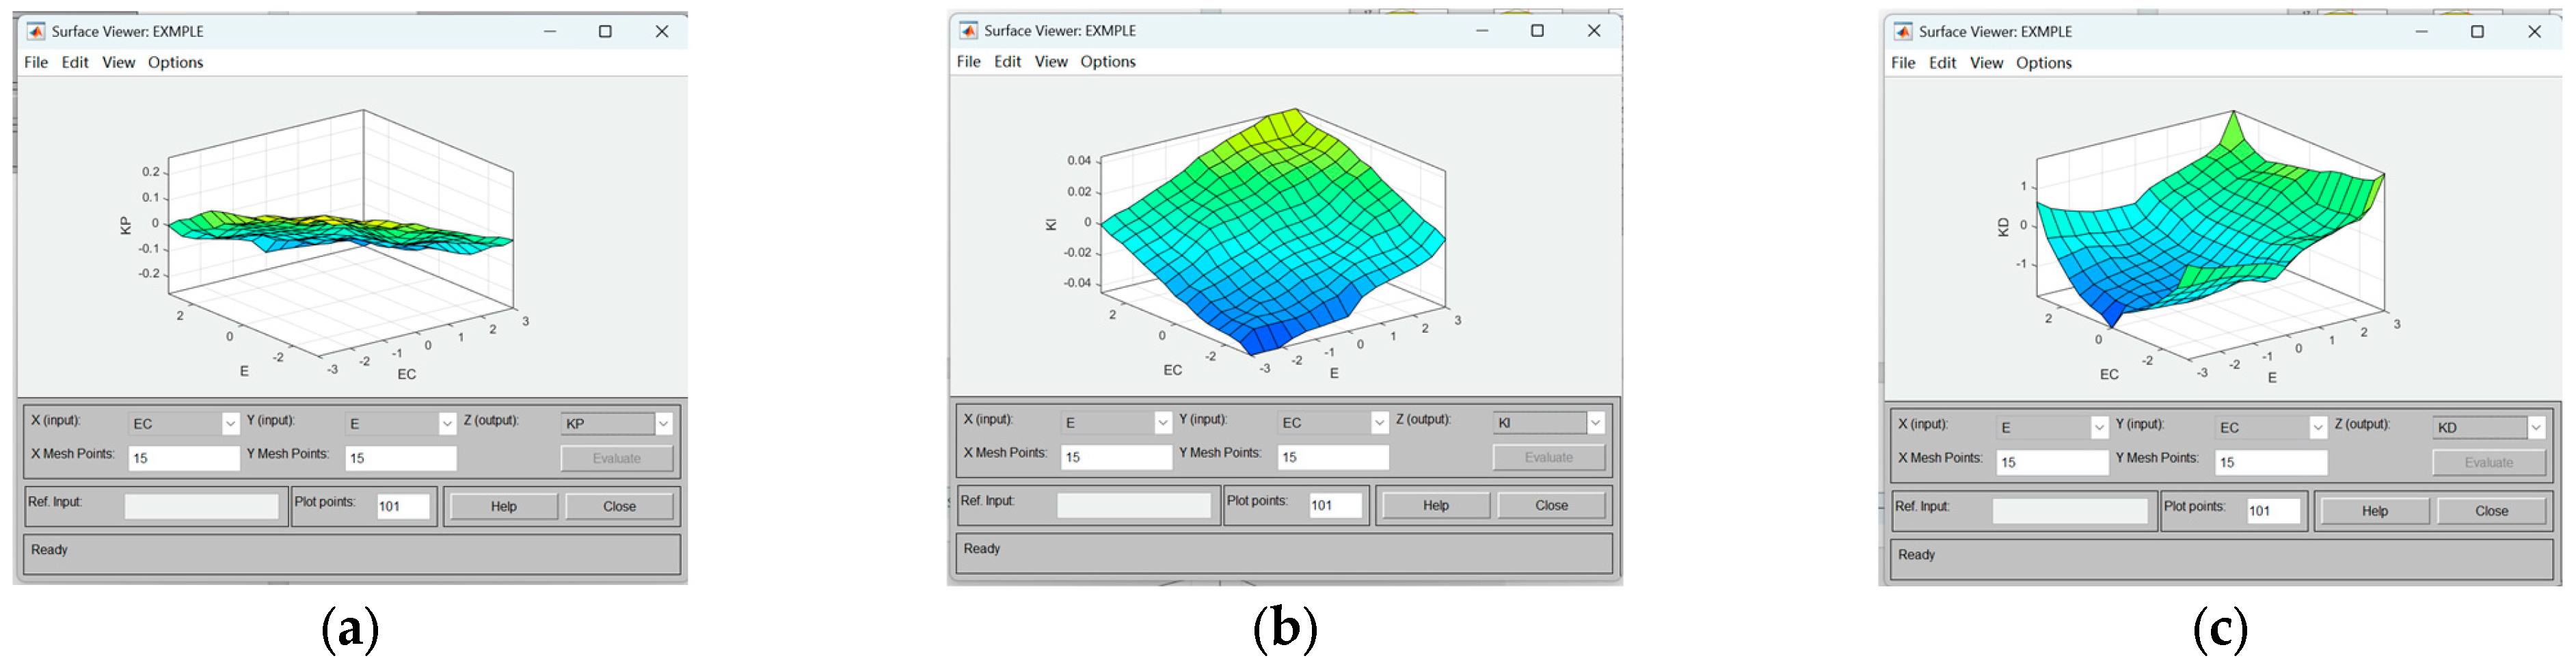
The Surface Viewer generates output surface plots that intuitively show the nonlinear relationships, as shown in Figure 8. Figure 8a indicates that when the deviation is large (NB/PB), the output ΔKp is large, which is in line with the logic of the enhanced proportional effect. Figure 8b shows that ΔKi becomes larger at small deviations, reflecting the design idea of strengthening integration action for steady-state precision. Figure 8c reveals that ΔKd adapts appropriately when the deviation change rate is large, effectively suppressing oscillations. The surface characteristics of all three are highly consistent with the preset rules.

4.2. Simulink Simulation Model Construction

In MATLAB Simulink, a comparison model of conventional PID and fuzzy adaptive PID is established, as shown in Figure 9. The model includes a signal source, a controller, a controlled object, and an observation module. The signal source provides a unit step and a time-sequence signal to simulate temperature setpoint changes. Both controllers share the same controlled object, which is a first-order inertia series structure based on Equations (29)–(31). The observation modules capture and compare the temperature response curves in real time.
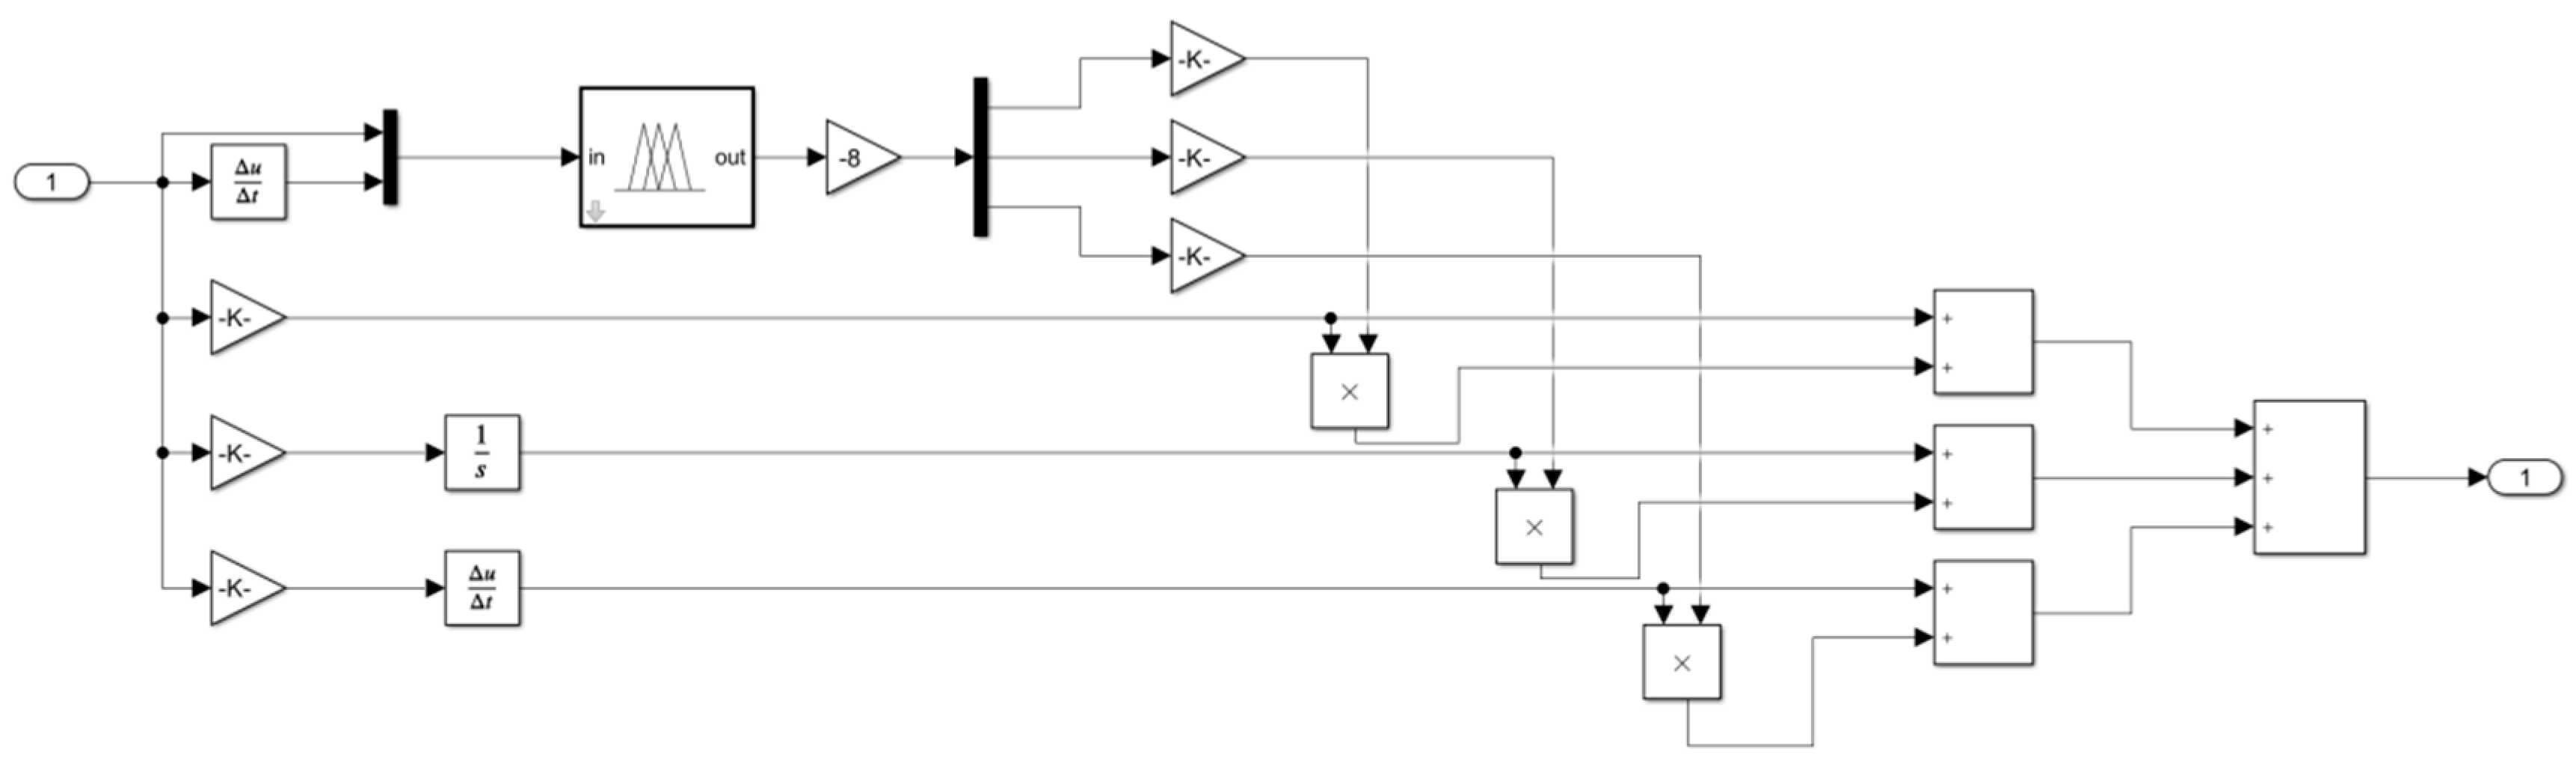
The internal structure of the fuzzy adaptive PID subsystem is shown in Figure 10. It is a single-input single-output structure that contains fuzzy logic, parameter adjustment, and PID control modules. The procedure is as follows. The deviation e and the deviation change rate ec are quantized and fed into the fuzzy logic module, which infers the corrections ΔKp, ΔKi, and ΔKd. These corrections are added to the initial parameters to obtain the real-time PID parameters. Finally, a control signal is generated and applied to the controlled object, achieving adaptive temperature regulation.

4.3. Simulation Experiment Design and Test Analysis

To comprehensively evaluate the control performance of the fuzzy adaptive PID algorithm, a simulation experiment is designed. The input signal is a unit step signal r 1 t = 1 t , simulating the scenario where the temperature in the nucleic acid amplification process rapidly switches from the initial value to the target value. The focus is on analyzing the dynamic response speed, overshoot, and steady-state precision of the controllers.
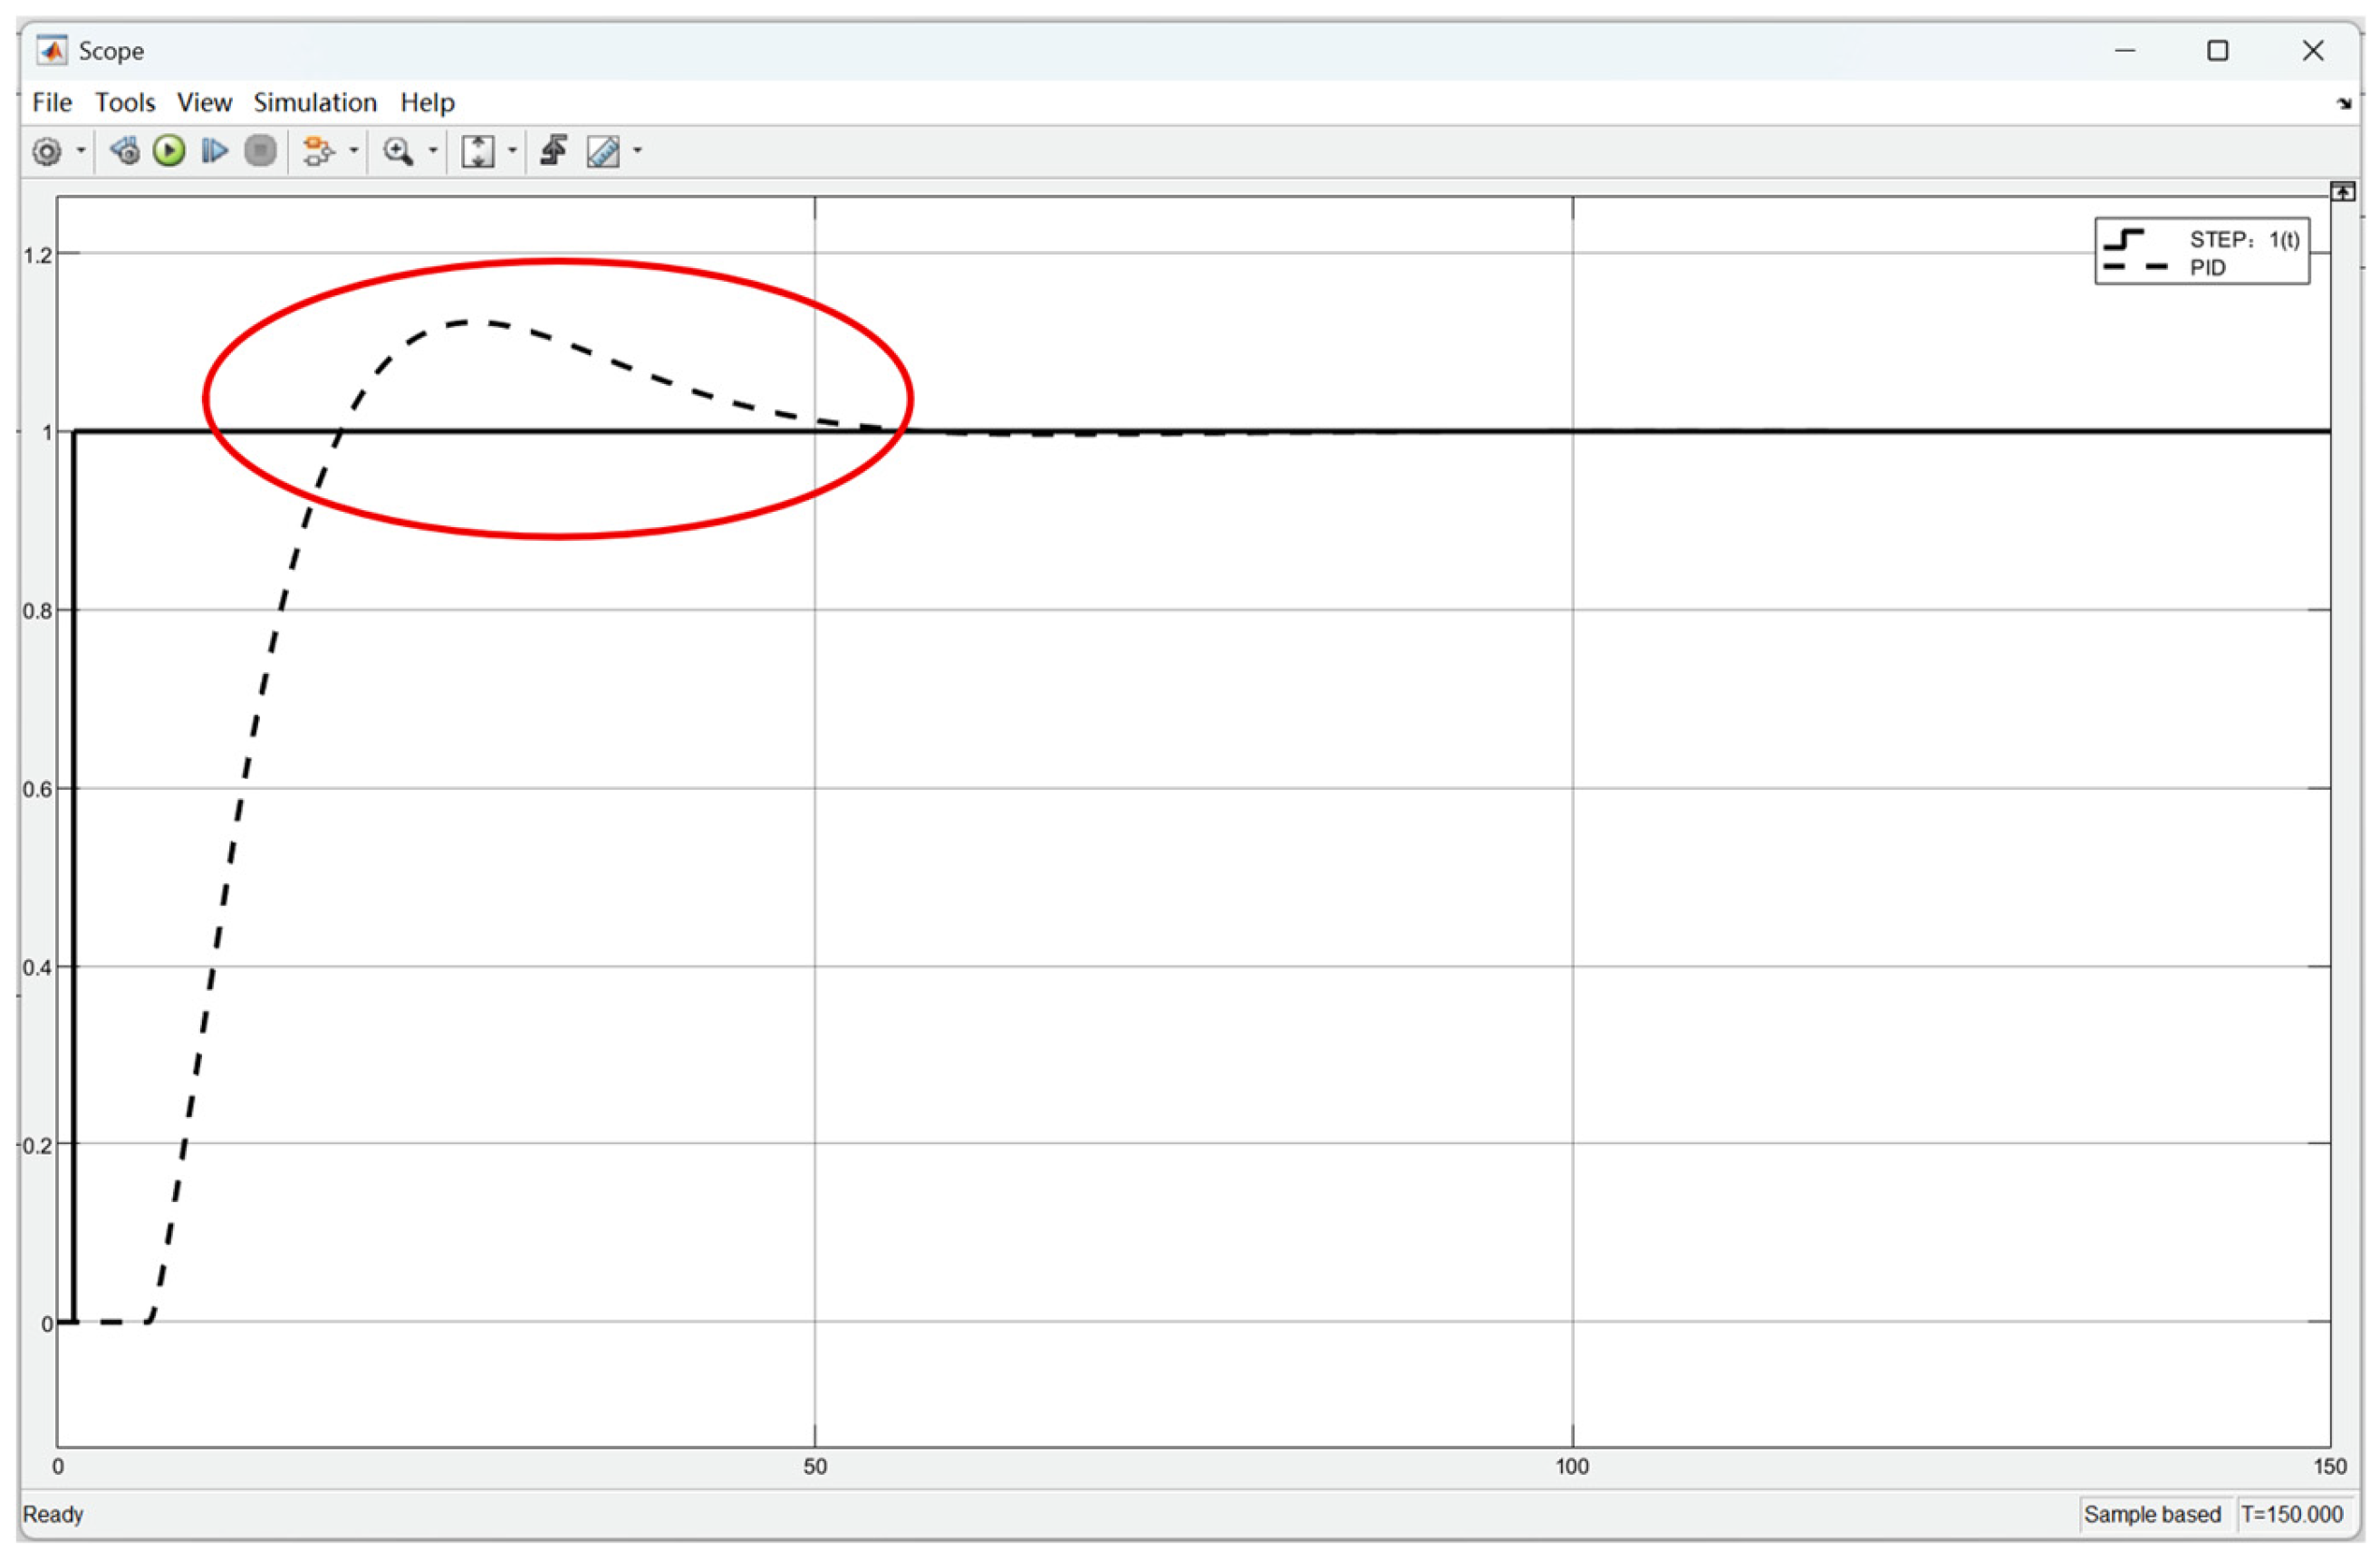
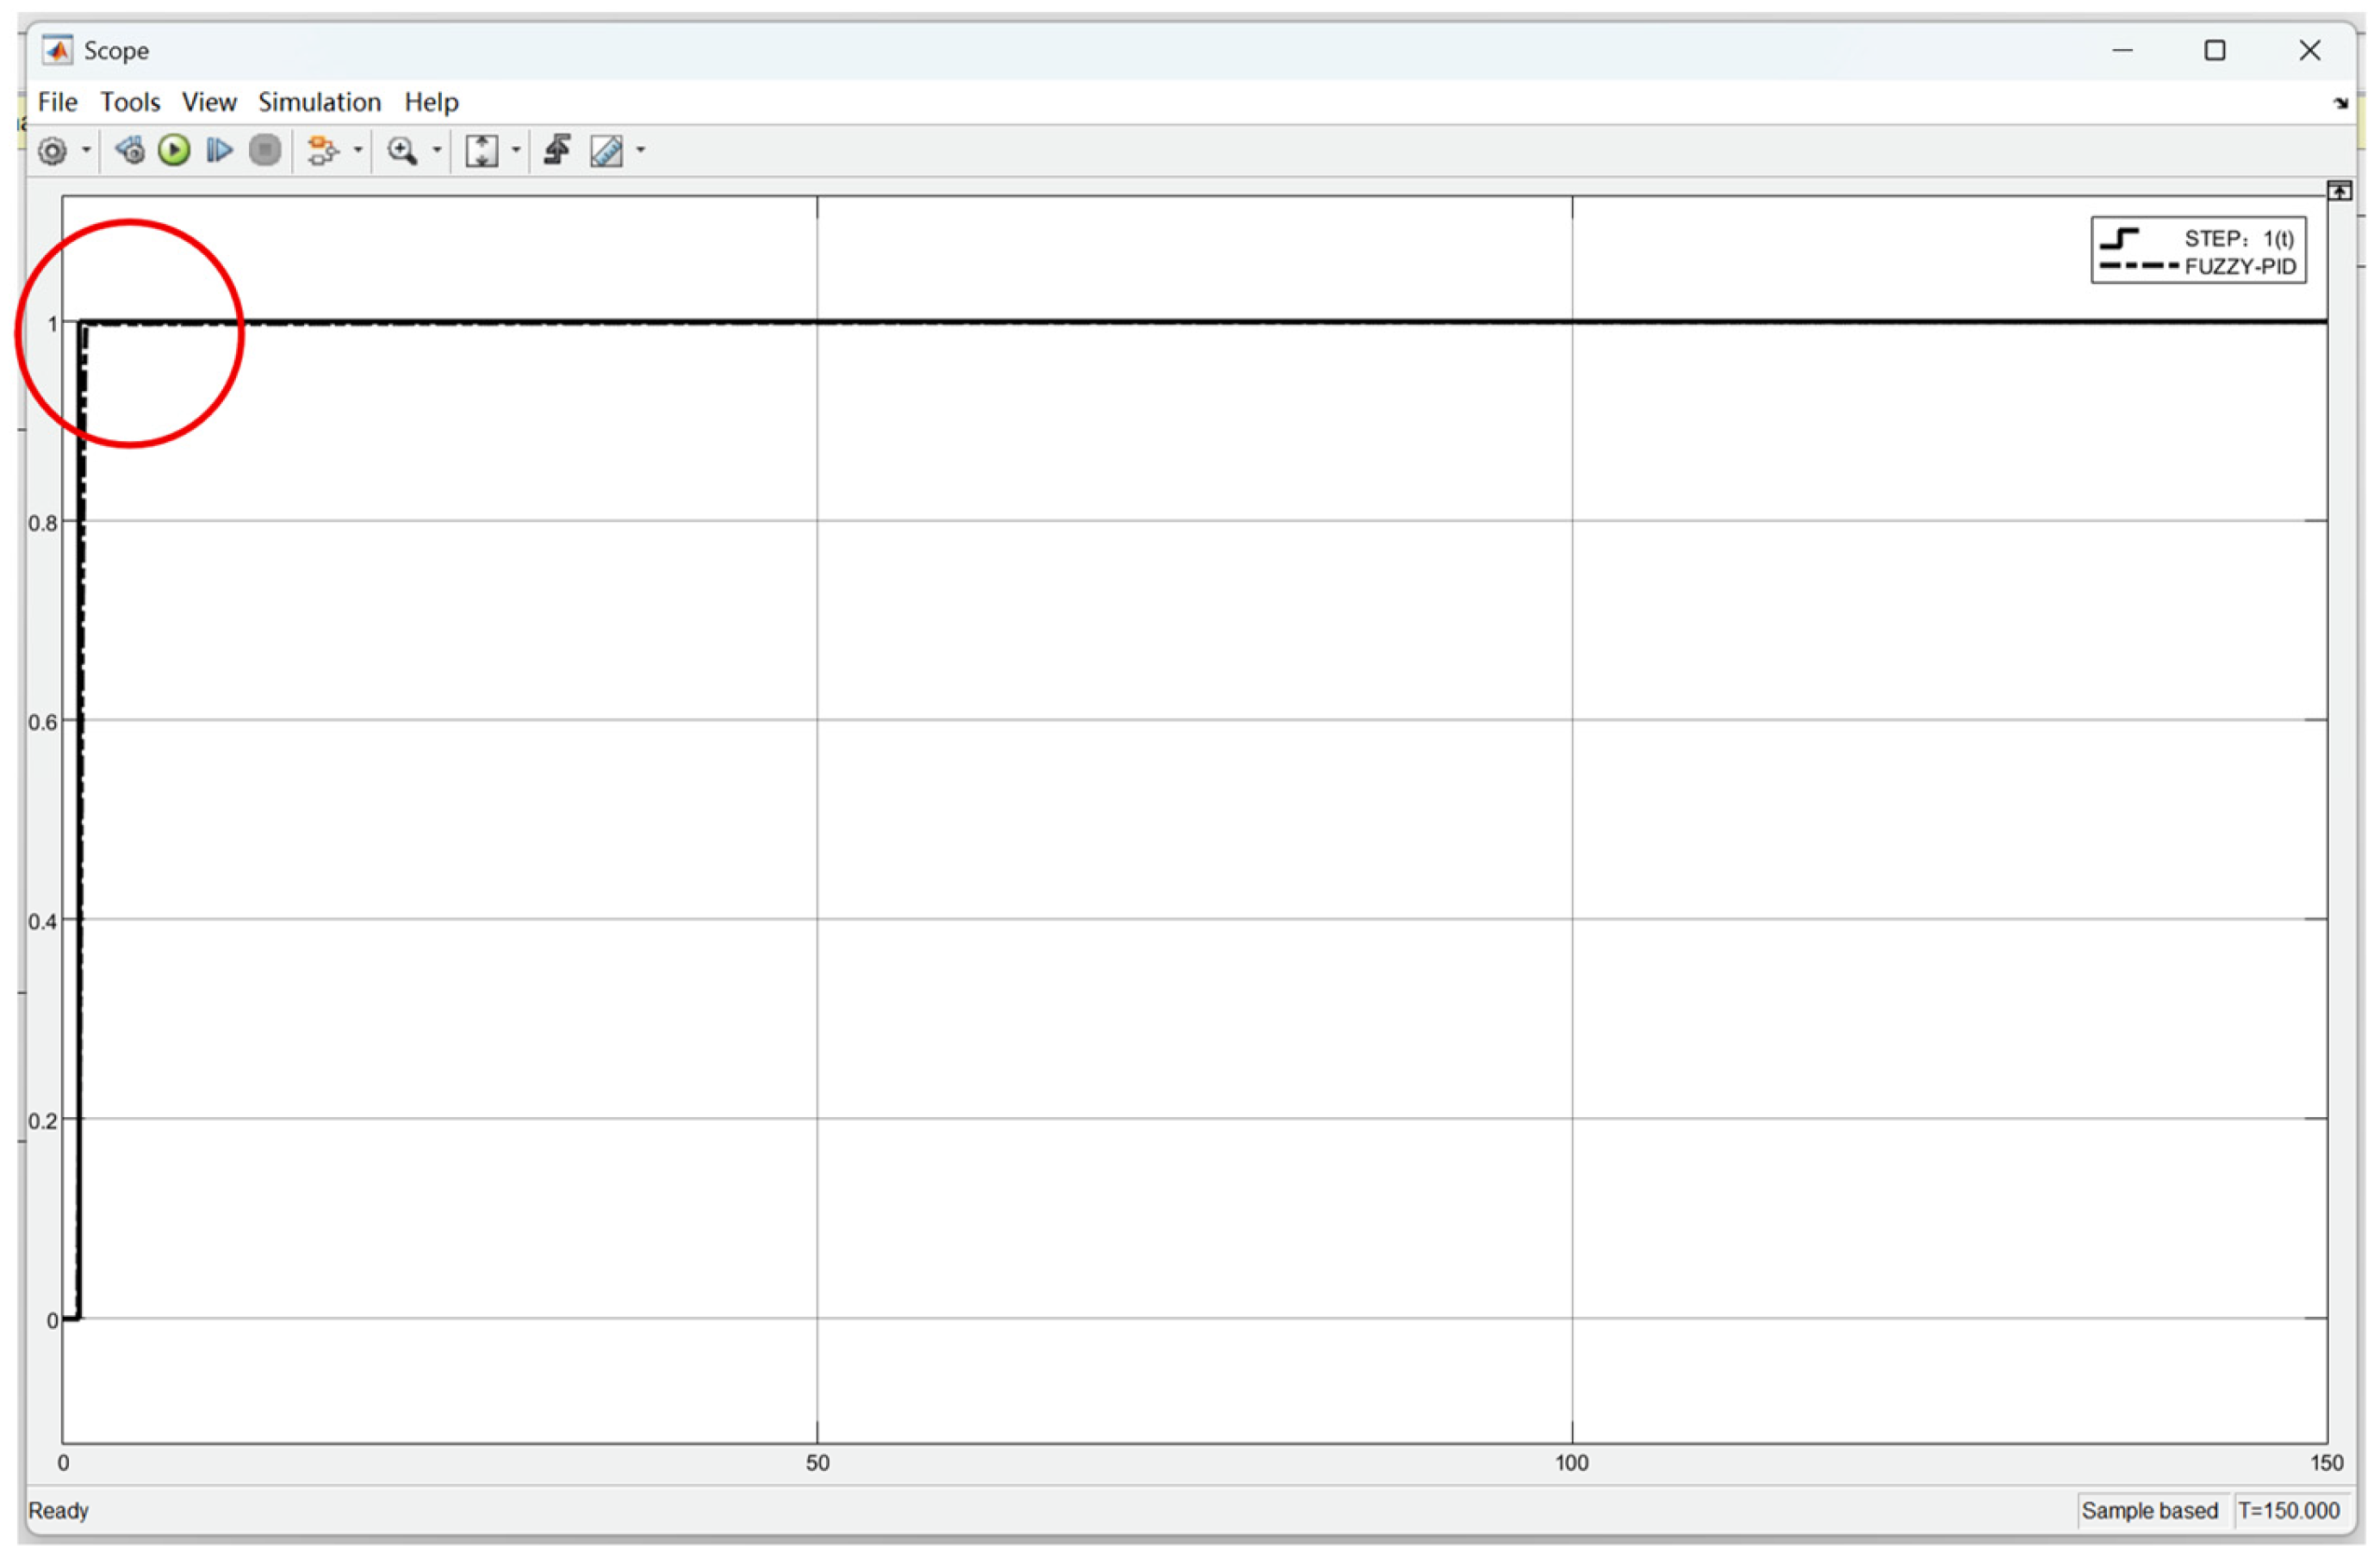
Under the unit step signal, the output responses of the conventional PID controller and the fuzzy adaptive PID controller are shown in Figure 11 and Figure 12, respectively.
The comparison shows that the conventional PID exhibits significant overshoot (with fluctuations ranging from 18.8–53 s) and requires 55 s to reach steady state, which is unable to meet the strict requirements of nucleic acid amplification. The fuzzy adaptive PID has no overshoot, fast response, and excellent steady-state precision. Through dynamic parameter adjustment, it fulfills the core requirements. The simulation results are highly consistent with the theoretical analysis. The fuzzy adaptive PID controller has no overshoot and fast convergence under unit step input, and the adjustment time is shortened by more than 60% compared with the traditional PID. In the simulation working condition with random disturbances added, the system temperature fluctuation remains stable without instability and oscillation. It directly verifies the convergence and anti-interference robustness of the algorithm, and the theoretical stability conclusion is supported by simulation.
The simulation verification based on the MATLAB platform confirms the superiority of the proposed algorithm in terms of dynamic response, overshoot suppression, and steady-state precision. The physical tests show no overshoot and the settling time of less than 1.5 s, satisfying the requirements. The results demonstrate that the algorithm effectively overcomes the limitations of conventional PID and provides an optimized solution for temperature control in nucleic acid amplification.

5. Results and Discussion

To verify the application value of the fuzzy PID algorithm, dual verification through simulation and experiment is carried out. By comparing with the conventional PID algorithm on the Simulink platform, the advantages of this algorithm in terms of dynamic response and steady-state precision are clearly identified. Based on the actual application scenarios of nucleic acid amplification, controlled experiments are designed to comprehensively demonstrate the applicability and superiority of the algorithm.

5.1. Construction of Experimental Setup

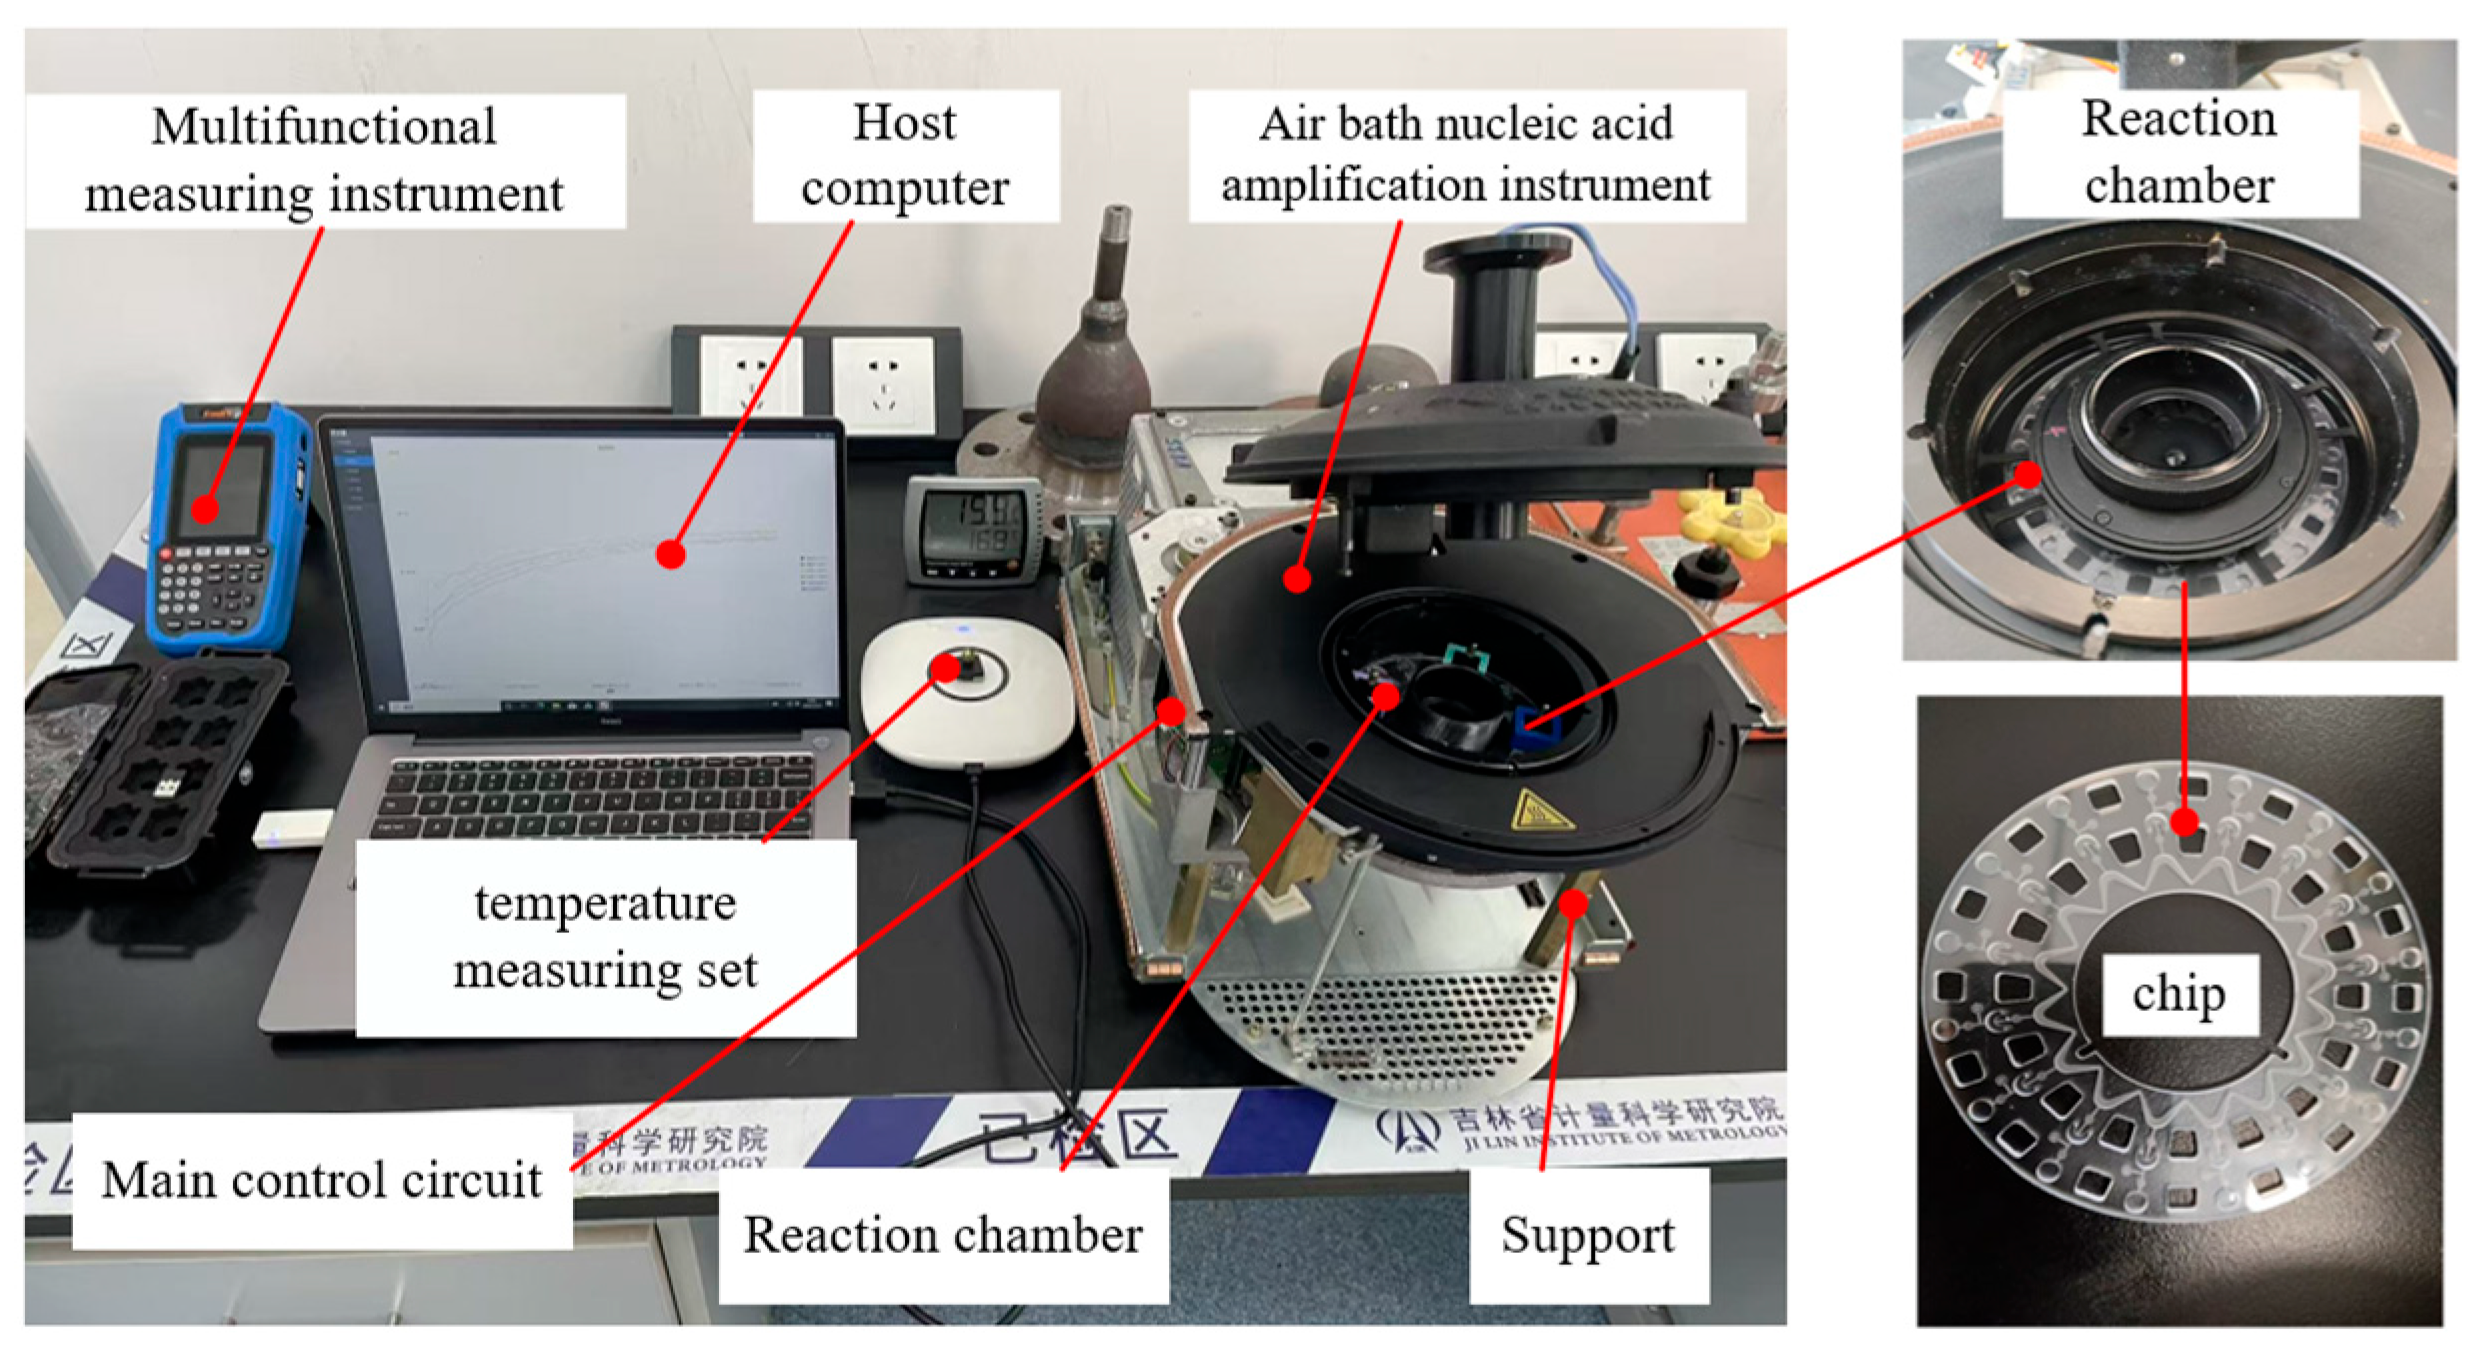
First, a test fixture for the thermal convection nucleic acid amplification instrument is built. The fixture consists of a host computer, a multi-function measuring instrument, the amplification instrument main unit, and a main control board. The main control board is responsible for data processing and operation monitoring, driving the heating module and collecting sensor data. It has a built-in fuzzy PID algorithm that performs real-time adaptive adjustment of parameters, coordinates stable system operation, and ensures temperature control precision. The host computer, through dedicated software, sets programs and parameters, and displays the operation interface, data charts, and analysis results in real time. The system test fixture is shown in Figure 13.

5.2. Comparative Analysis of Simulation Results and Temperature Control Performance

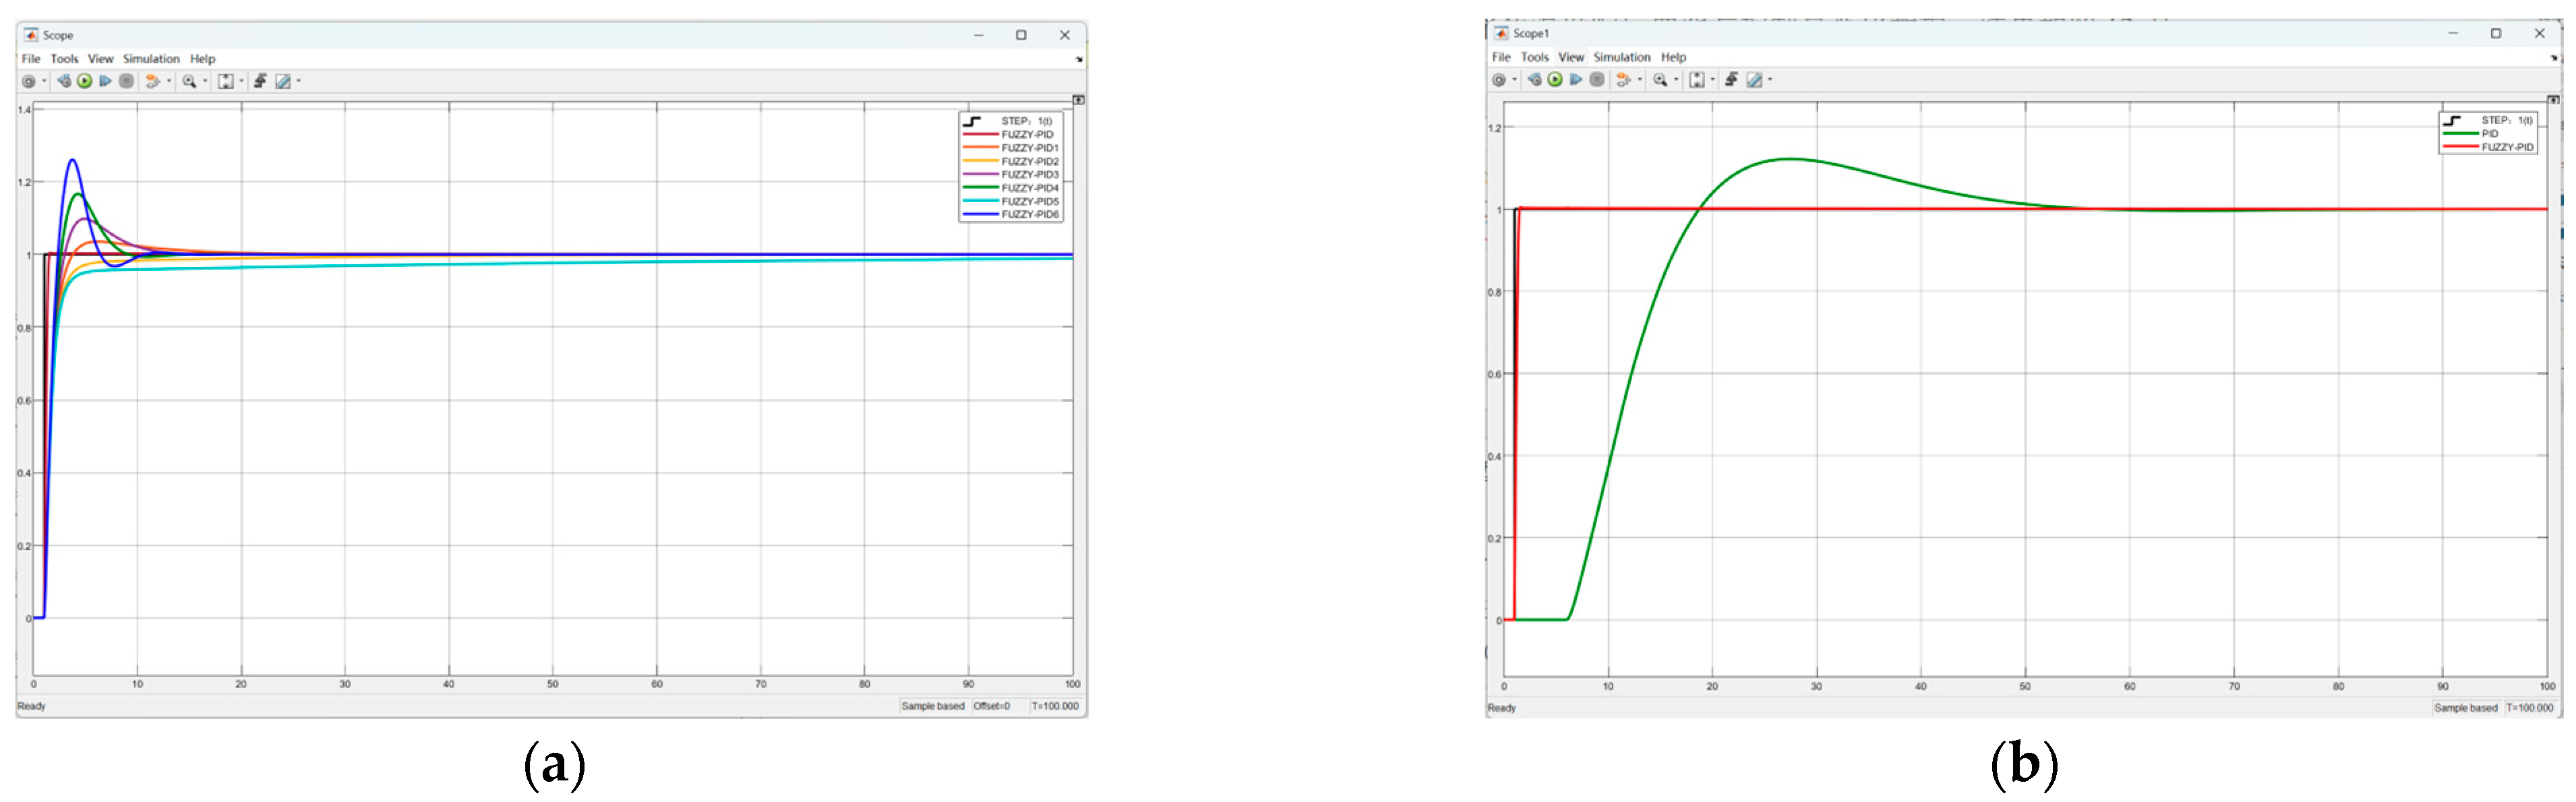
Based on the Simulink model established in Section 3, two sets of core experiments are designed, namely the response comparison experiment of fuzzy PID under different parameter configurations, and the performance benchmarking experiment of fuzzy PID and conventional PID. A unit step signal is used to simulate the rapid temperature switching scenario. The simulation duration is 100 s, with a sampling period of 1 s. Temperature response and control output data are collected. The results are shown in Figure 14.
Figure 14 contains two sets of temperature response curves. Figure 14a shows the output curves of fuzzy PID controllers with six different parameter configurations. The black curve is the reference step input signal. The red curve is the optimal fuzzy PID response. The orange, yellow, purple, green, cyan, and blue curves correspond to fuzzy PID responses with parameter combinations (0.005, 0.00045), (0.005, 0.00015), (0.005, 0.0009), (0.005, 0.0015), (0.005, 0.00005), and (0.005, 0.0025), respectively. Figure 14b shows the comparison curves between fuzzy PID and conventional PID. The red curve is the fuzzy PID response. The green curve is the conventional PID response. The black curve is the reference input signal. By extracting and analyzing the characteristic parameters of the curves, the algorithm’s performance is quantitatively evaluated from four dimensions: response speed, overshoot, steady-state precision, and control output smoothness.
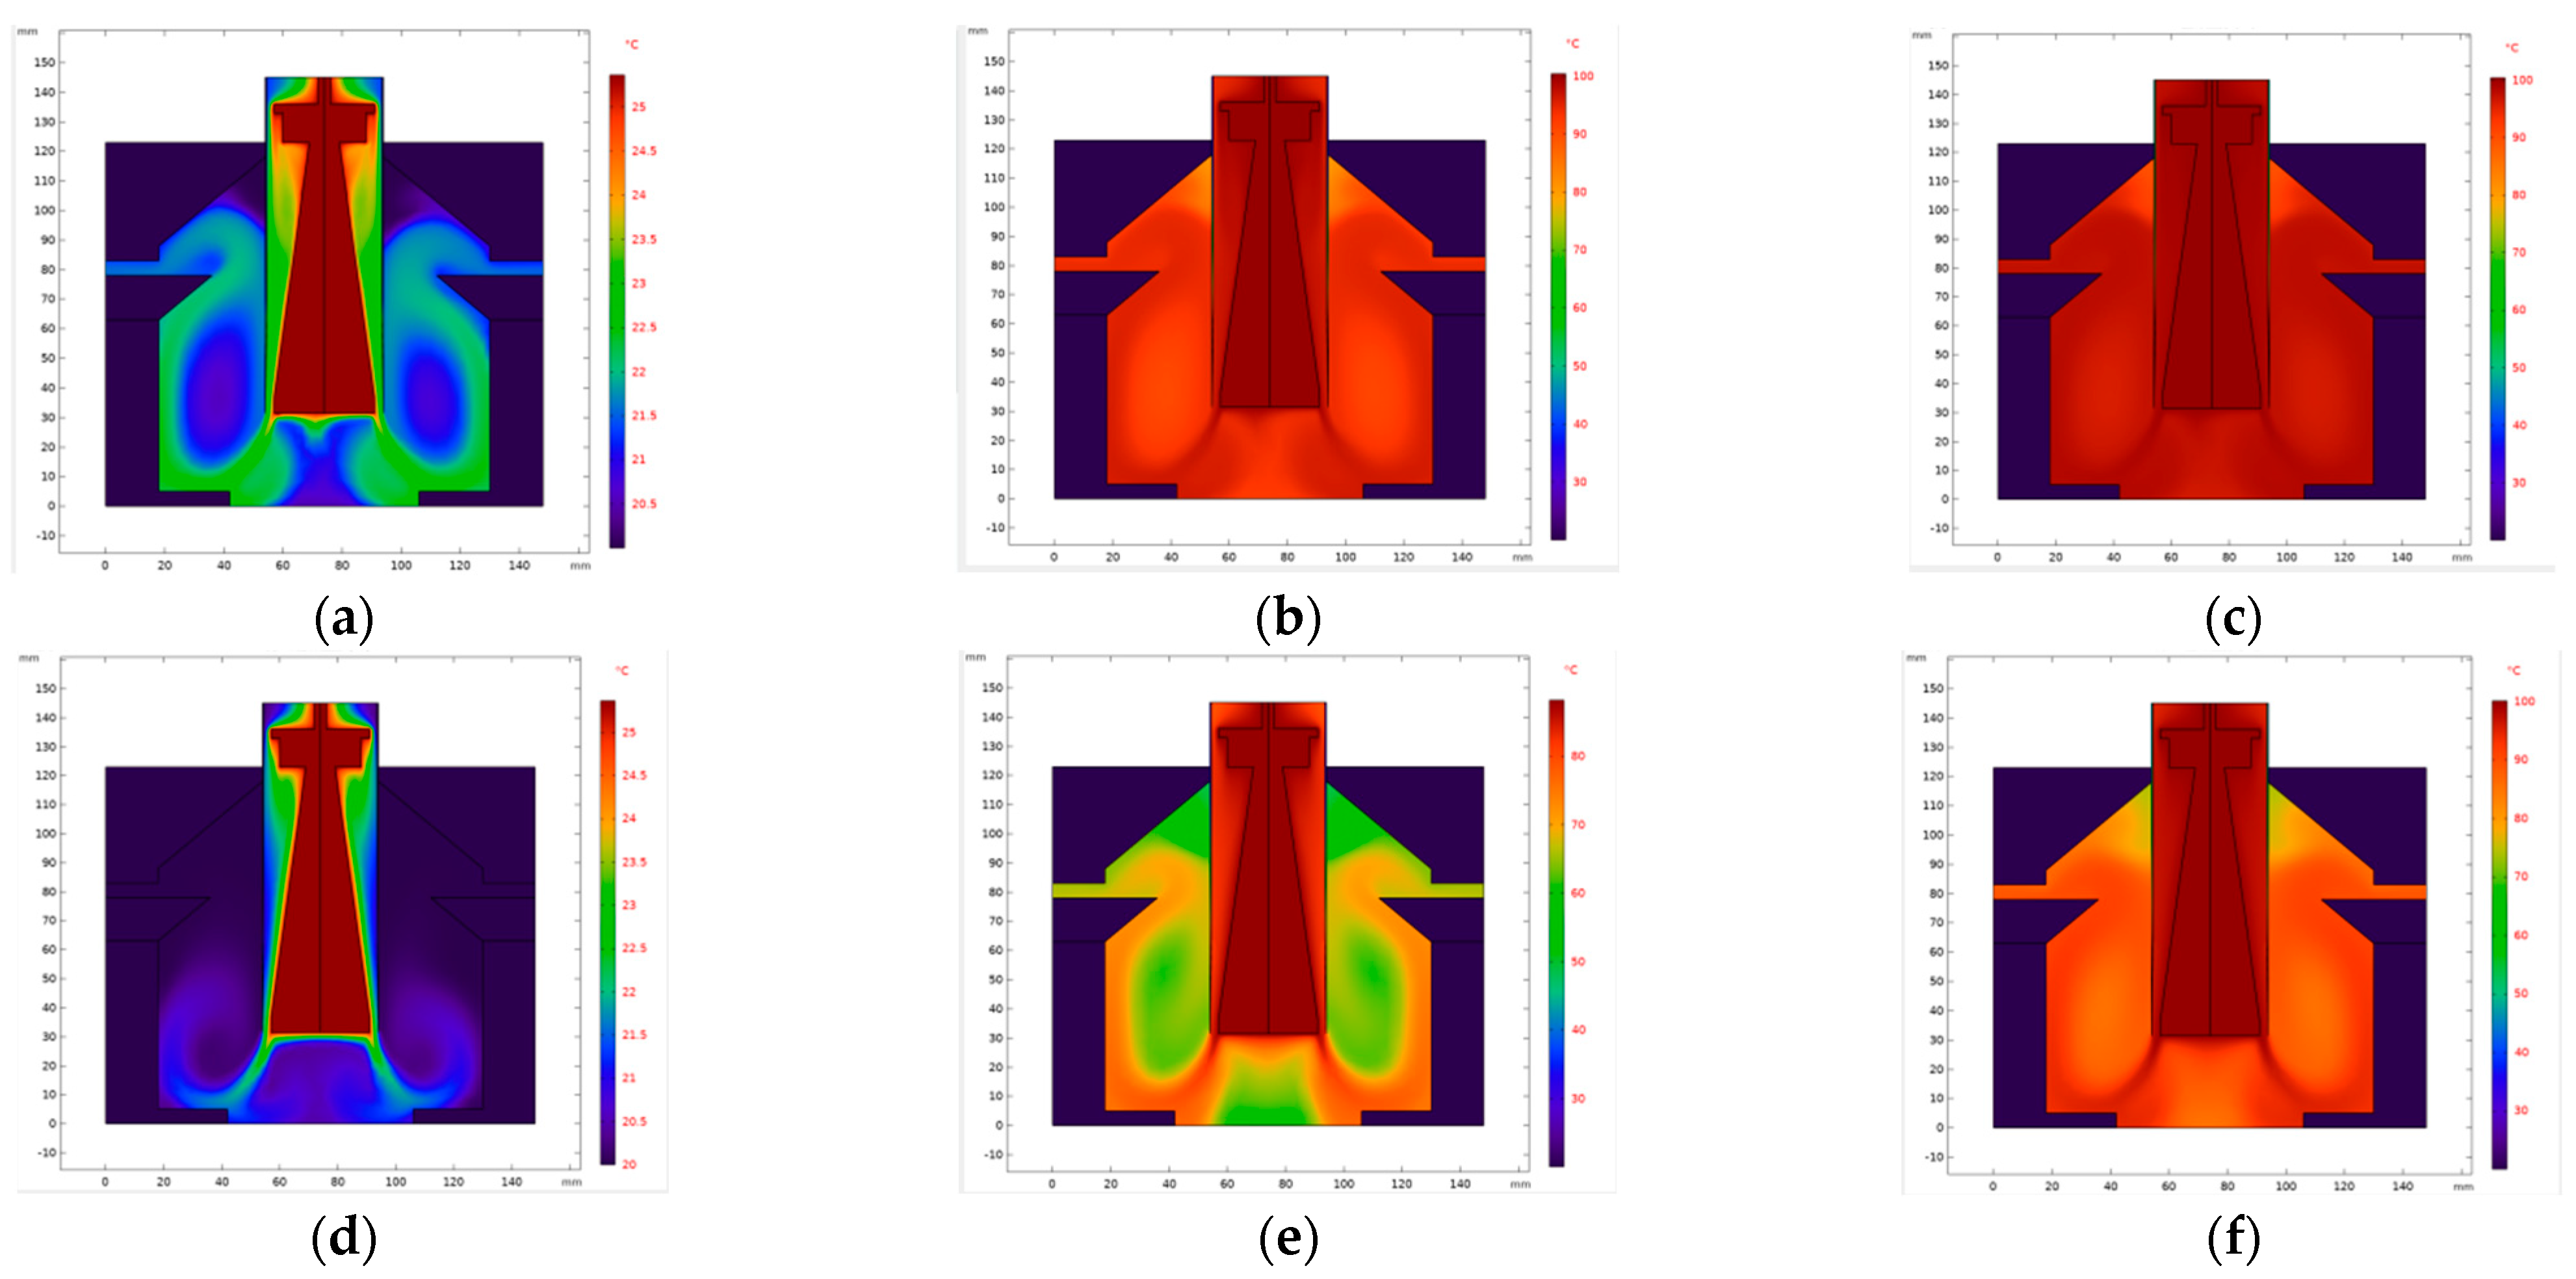
To verify the actual control effect of fuzzy PID control in the thermal convection nucleic acid amplification instrument, a simulation comparison platform with and without the control strategy is established. The operation data at 1 s, 15 s, and 30 s are collected. The results are shown in Figure 15. According to Figure 15a–c, with PID control, the system quickly reaches the setpoint within 1 s without overshoot, runs smoothly over a long period, and accurately follows the target temperature. Figure 15d–f show that without PID control, the system exhibits irregular fluctuations within 1 s, and the fluctuations continue to intensify over time, causing the temperature to deviate significantly from the target value, failing to meet the basic requirements of precise temperature control.
Compared with the system without PID control, the advantages of PID control are extremely significant. It has excellent rapid response characteristics, quickly reaching the setpoint after startup without overshoot. It has strong stability, maintaining steady temperature throughout the process and ensuring control precision. It has excellent anti-interference ability, effectively counteracting thermal disturbances inside and outside the system. This experiment verifies the applicability and superiority of PID control in this system. Precise steady-state temperature control is a core prerequisite for nucleic acid amplification reactions. PID control technology can provide a temperature environment that meets the requirements for the reaction. It can ensure the precision and repeatability of experimental results and build a solid foundation for the practical engineering application of the equipment.
In conclusion, the fuzzy PID controller, in terms of core temperature control indicators, precisely matches the temperature control requirements of nucleic acid amplification, including fast response, no overshoot, and high precision. This lays a theoretical foundation for the subsequent practical experimental verification.

5.3. Comparative Analysis of Control Outputs: Fuzzy PID vs. Conventional PID

To visually verify the control advantages of the fuzzy PID throughout the entire nucleic acid amplification process, a typical “heating-holding-cooling” cycle is used as the test scenario to compare the dynamic response characteristics of fuzzy PID and conventional PID at each stage. The analysis focuses on the differences in response speed, overshoot suppression, and steady-state precision, clarifying the suitability of fuzzy PID for PCR temperature control requirements.
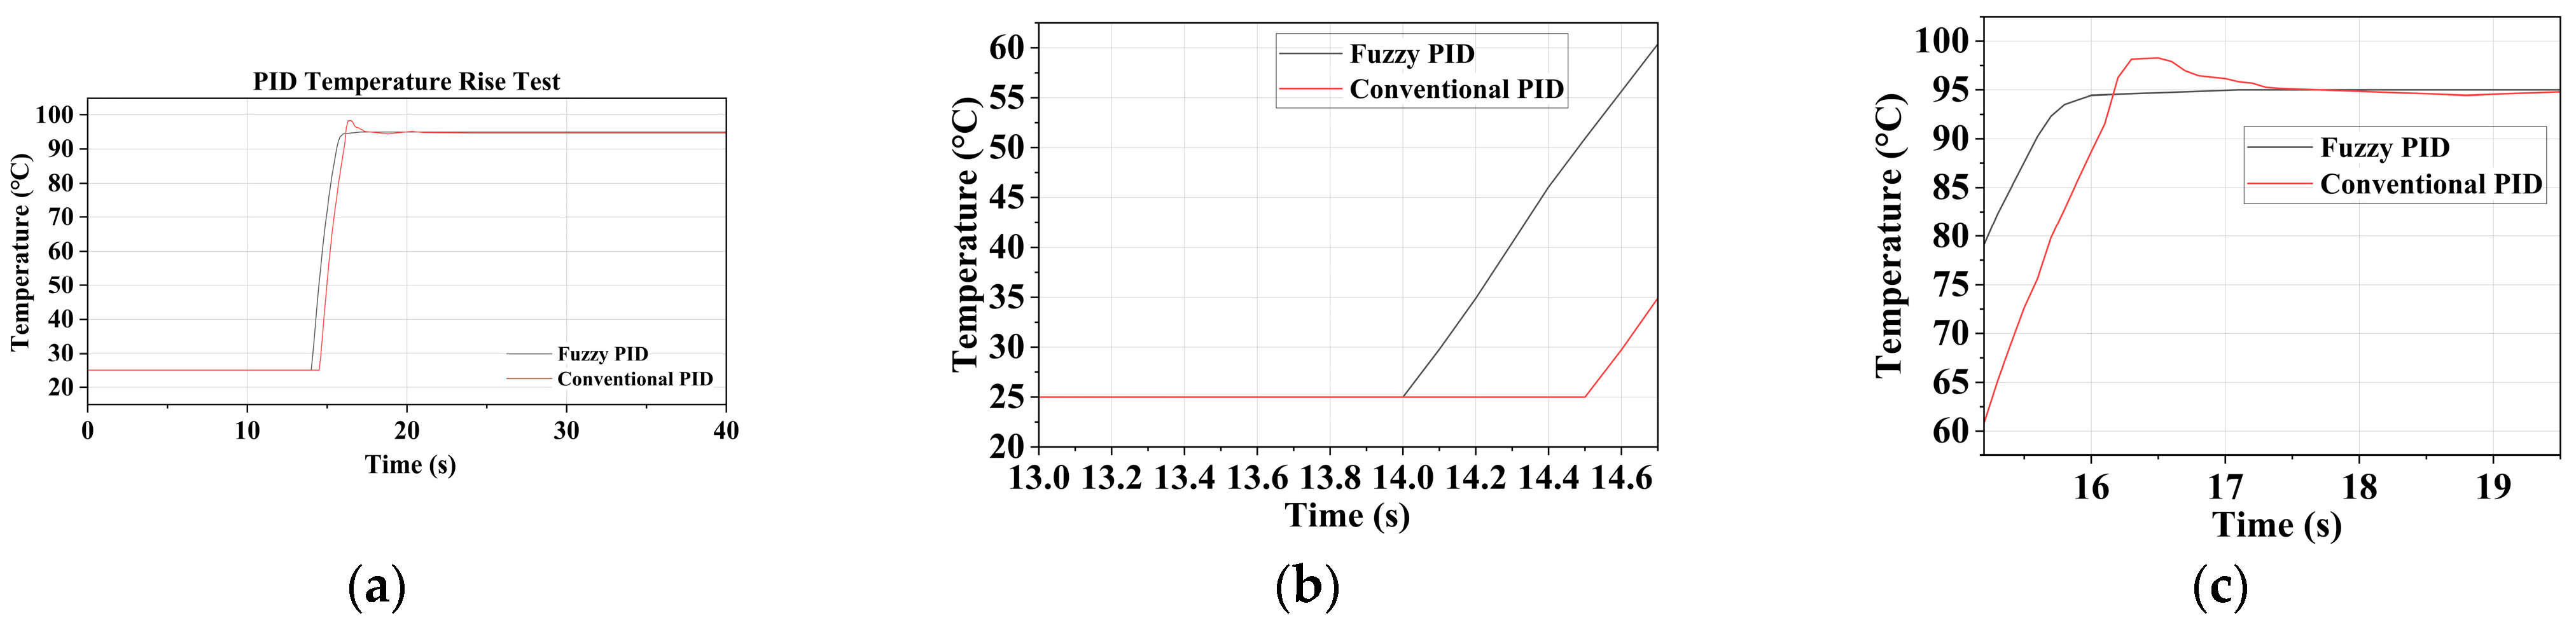
Figure 16 and the corresponding enlarged views present the differences in control response between fuzzy PID and conventional PID during the heating phase of PCR. The input signal is a piecewise function expressed as follows:
r ( t ) = 25 t 14 95 t > 14
From the enlarged views in Figure 16, it can be observed that during the initial holding phase, although conventional PID maintains the temperature at 25 °C, slight fluctuations occur. Fuzzy PID achieves almost zero deviation, with better steady-state precision. During the heating phase, the difference between the two is significant. Conventional PID shows an obvious lag, overshoots when the temperature approaches 95 °C, and exhibits oscillations of about 2 °C, taking a long time to stabilize. Fuzzy PID responds quickly without lag, the temperature trajectory smoothly follows the target value without overshoot or oscillation, and stabilizes precisely near the target value in about 17 s.
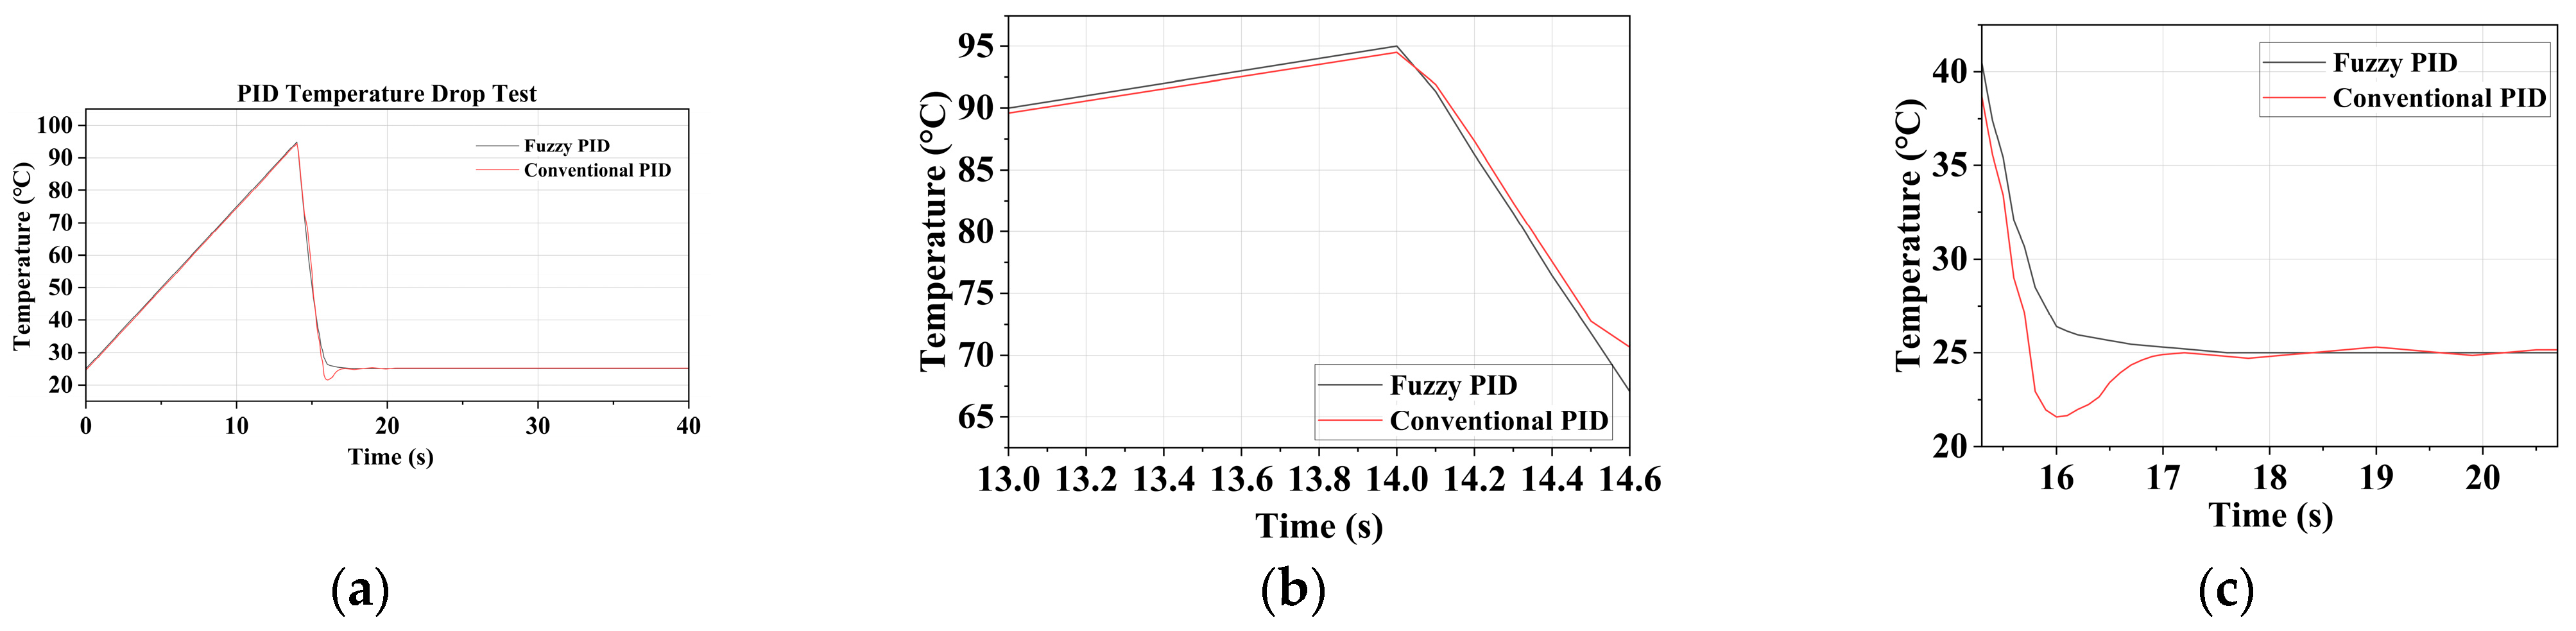
Figure 17 illustrates the difference in dynamic response between fuzzy PID and conventional PID during the cooling phase of the PCR temperature control system. The input signal is a piecewise function, and the expression is as follows:
r ( t ) = 5 t + 25 t 14 25 t > 14
During the cooling phase, the control deficiencies of conventional PID are particularly prominent. The temperature plunges below 20 °C, accompanied by oscillations of about 3 °C, and takes 3 s to stabilize, which can easily disrupt the reaction stability during the annealing stage and increase the risk of non-specific binding. Fuzzy PID provides a smooth and controllable cooling process, accurately dropping to 25 °C in about 16 s without temperature fluctuations, matching the core requirement of precise and stable temperature for the annealing stage.
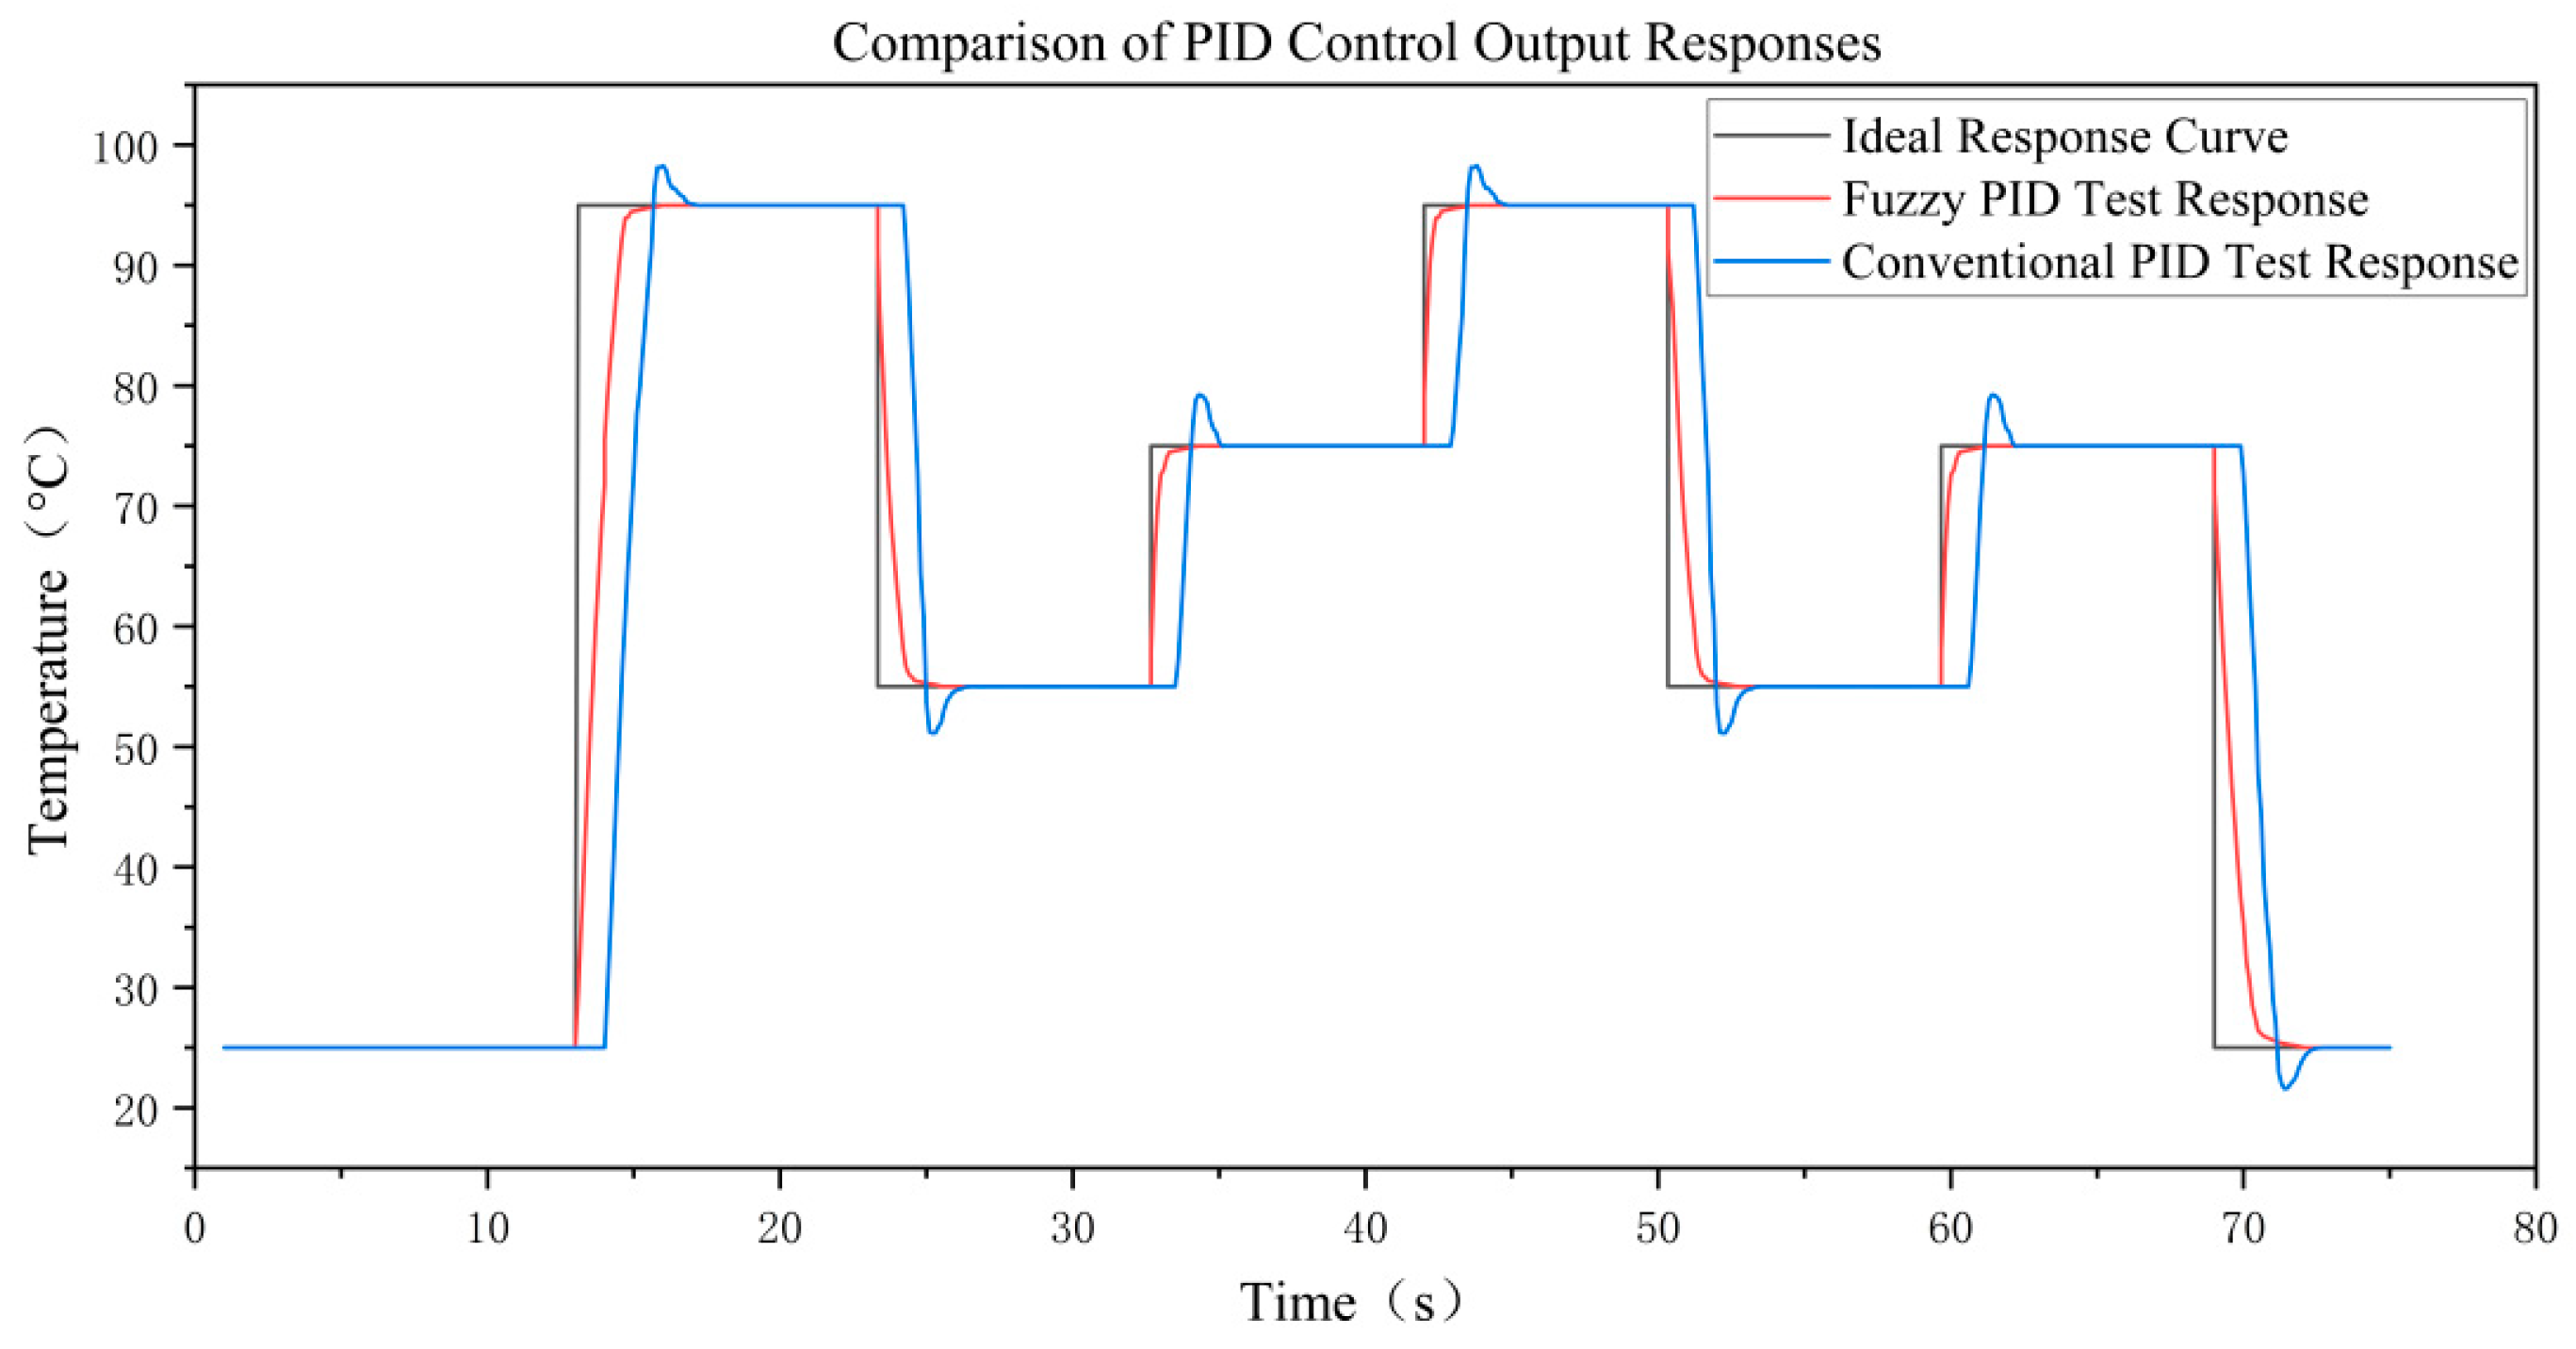
The dynamic response test results are shown in Figure 18. Conventional PID exhibits significant overshoot when the step signal switches, with steady-state fluctuations in the range of ±2–3 °C. The response curve of fuzzy PID closely follows the ideal trajectory, with overshoot compressed to within ±0.1 °C and steady-state fluctuations below 0.05 °C. It accurately reproduces the required temperature change rhythm and range for nucleic acid amplification, effectively avoiding temperature fluctuations that could interfere with enzyme activity and primer binding, thereby ensuring amplification efficiency and reaction specificity.
In summary, through dynamic parameter adjustment, fuzzy PID effectively suppresses overshoot during the heating phase and avoids oscillations during the cooling phase. Its dynamic response characteristics are better suited to the stringent temperature control requirements of PCR, and its control effect is significantly superior to that of conventional PID.
To quantitatively verify the performance advantages of the algorithm, this study comprehensively compares the system performance with and without the fuzzy PID algorithm across dimensions such as temperature control precision, dynamic response, anti-interference capability, long-term stability, and actual amplification effect. The specific results are shown in Table 4.
The quantitative comparison results show that the fuzzy PID algorithm achieves comprehensive optimization of system performance, with significant technical advantages. The algorithm matches the core control requirements of the thermal convection amplification instrument, such as high precision, fast response, strong stability, and high adaptability. Moreover, its control effect is far superior to that of an uncontrolled system, providing reliable technical support for engineering applications and laying a foundation for subsequent performance optimization.

5.4. Performance Comparison with Other Advanced Intelligent Control Strategies

The relative advantages of the proposed fuzzy PID algorithm in this paper are further verified. Under the same simulation and experimental conditions, two typical intelligent temperature control strategies, namely particle swarm optimization PID (PSO-PID) and genetic algorithm optimization PID (GA-PID), are introduced for horizontal comparison. The parameter tuning ranges and optimization processes of PSO-PID and GA-PID are set according to references [9,10,11] and temperature control engineering experience. As for the PSO algorithm, inertia weight ω ∈ [0.4, 0.9], learning factors c1 = c2 = 2, population size is 30, and iteration number is 50. For the GA algorithm, crossover probability is 0.8, mutation probability is 0.1, population size is 30, and iteration number is 50. The PID parameter optimization ranges of the two algorithms are uniformly set as Kp ∈ [0.1, 0.5], Ki ∈ [0.001, 0.01], Kd ∈ [0.001, 0.02]. The initial parameters of the fuzzy PID are consistent with the previous ones (Kp0 = 0.25, Ki0 = 0.0035, Kd0 = 0.008). The optimal parameters obtained by PSO-PID and GA-PID after optimization are (0.31, 0.0041, 0.0095) and (0.29, 0.0039, 0.0092) respectively.
Under the unit step signal and three-stage PCR temperature control cycle, the performance indicators of the four control methods (traditional PID, PSO-PID, GA-PID, and the fuzzy PID in this paper) are collected. The results are shown in Table 5. According to the simulation and measurement results, both PSO-PID and GA-PID can improve the overshoot and adjustment time of traditional PID. However, there are premature convergence or local optimal problems during the convergence process, resulting in slightly higher overshoot and steady-state fluctuations than the fuzzy PID proposed in this paper. The algorithm in this paper performs optimally in all core indicators, especially in overshoot suppression (≤0.1 °C), steady-state precision (±0.05 °C), and resistance to environmental interference (deviation ≤ ±0.1 °C under ±5 °C disturbance).
The traditional PID generally has an overshoot of 3.0 °C, an adjustment time of 55 s, and a steady-state precision of only 0.5 °C. This is insufficient to meet the high requirements of nucleic acid amplification. PSO-PID and GA-PID significantly improve the dynamic response, with overshoot reduced to 2.2 °C and 2.8 °C, respectively, and adjustment time shortened to 8.5 s and 10.2 s, respectively. However, there is still a fluctuation range in its steady-state precision and heating/cooling rates. Under environmental disturbances, the deviation can reach ±0.20~±0.35 °C. In contrast, the fuzzy PID in this paper has an overshoot ≤0.1 °C, adjustment time <1.5 s, steady-state precision ±0.05 °C, stable heating and cooling rates of 7.5 °C/s and 13.5 °C/s respectively, and deviation ≤±0.1 °C under environmental disturbance. All the indicators are superior to the lower limit values of the comparison algorithms, and there is no range fluctuation, reflecting the robustness and consistency brought by parameter adaptation.
In summary, the fuzzy PID in this paper is superior to PSO-PID and GA-PID in dynamic response, steady-state precision, anti-interference capability, and engineering robustness. Thus, it is more suitable for the high-performance temperature control requirements of thermal convection nucleic acid amplification instruments.

5.5. Comparative Performance Analysis Between Simulation and Physical System

To verify the engineering application effectiveness of the fuzzy PID algorithm in the thermal convection nucleic acid amplification instrument and to clarify the differences between simulation results and actual operation, a parallel controlled experiment is conducted. Both experimental groups use identical control parameters, temperature control curves, and sampling frequencies, and real-time operating data are collected synchronously. A comparative analysis is carried out around three core dimensions: dynamic response characteristics, steady-state control precision, and full-cycle tracking error. A three-dimensional error model quantifies the distribution of deviations, verifying the algorithm’s practical applicability, robustness, and operational reliability.
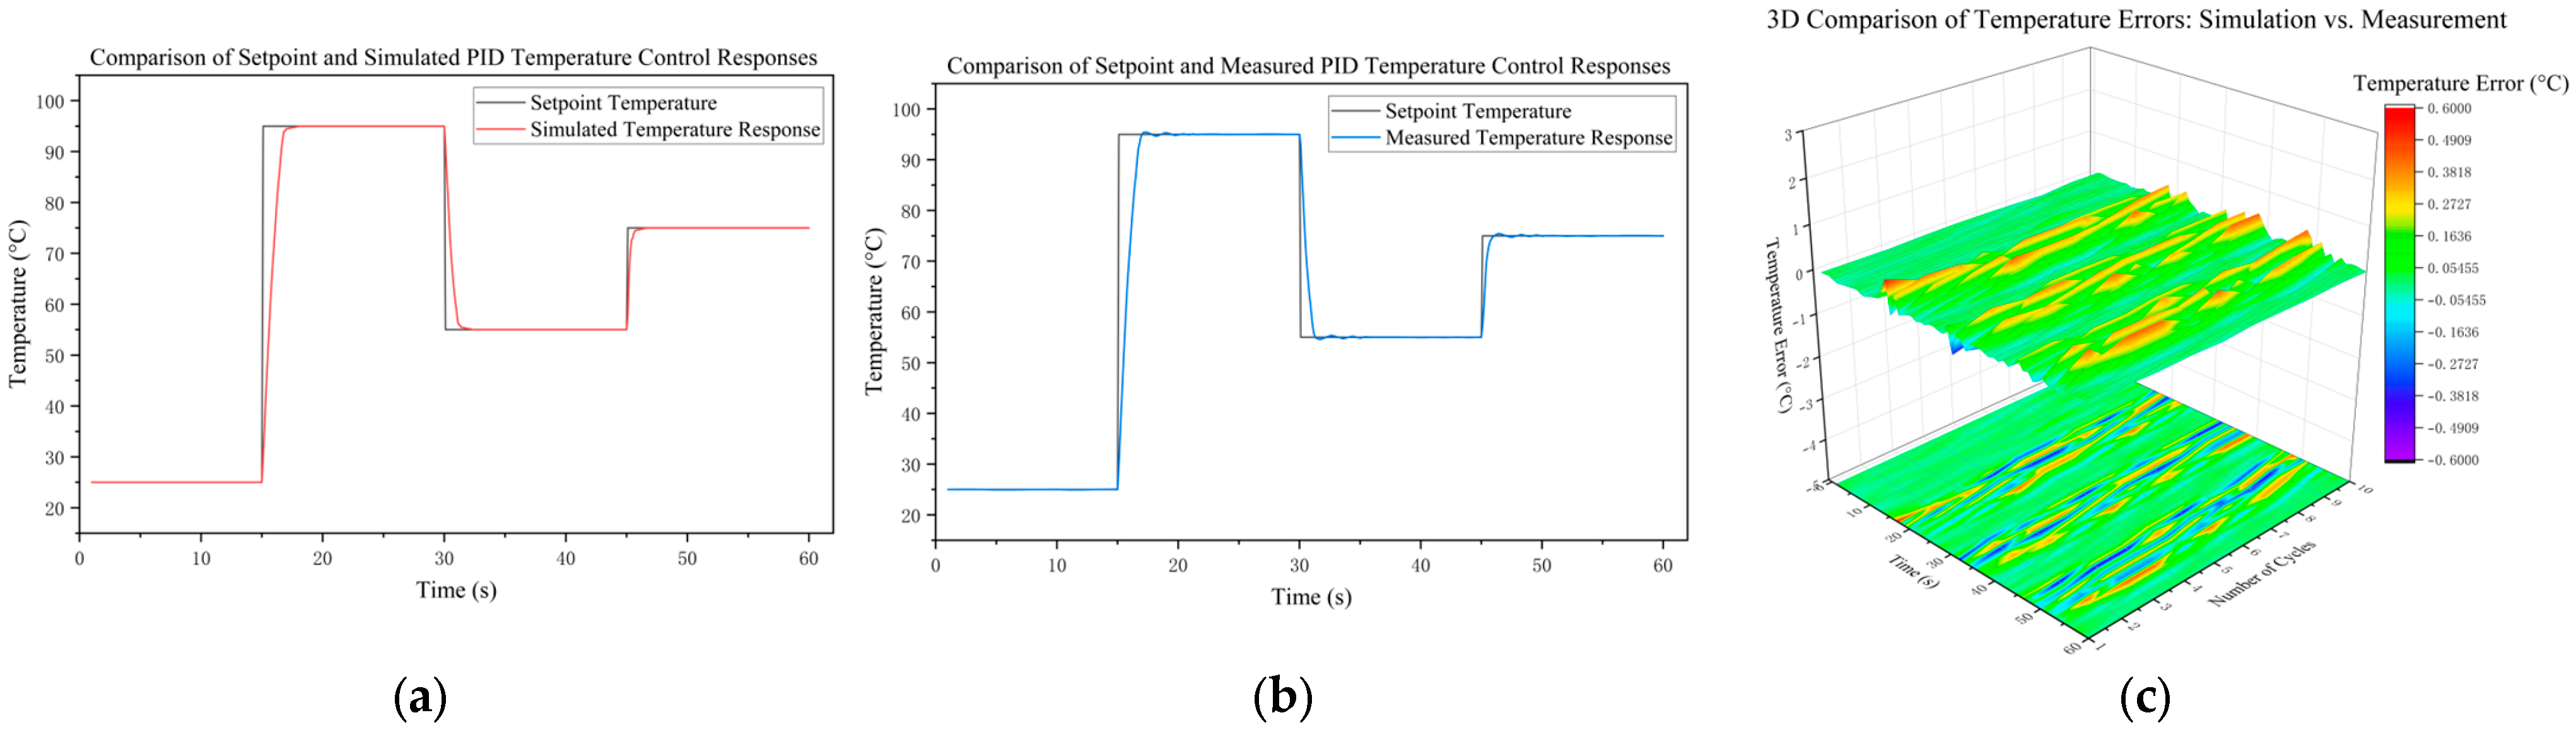
Figure 19 shows the simulated (a) and measured (b) temperature response curves and the three-dimensional error surface (c). The simulation results show that the algorithm quickly and accurately tracks the three-step temperature profile without overshoot and with minimal steady-state fluctuation, demonstrating excellent adaptive adjustment capability and trajectory tracking performance. The measured temperature variation trend closely matches the simulation results, faithfully reproducing the cyclic temperature control process of nucleic acid amplification and meeting basic temperature control requirements. Due to non-ideal factors such as nonlinear heat exchange, system heat loss, hardware response delays, and environmental disturbances, the measured curve exhibits a slight lag at temperature switching edges, and steady-state fluctuations are slightly larger than those in the simulation.
The three-dimensional error surface intuitively shows the spatiotemporal distribution of errors. Throughout the entire temperature control cycle, the error is controlled within ±0.6 °C, with error peaks concentrated during dynamic temperature switching phases. During the constant-temperature phases of the core reaction, the error remains stable within ±0.3 °C, meeting the precision requirements of nucleic acid amplification. The error does not accumulate with increasing cycle numbers, indicating that the algorithm has good anti-interference capability and robustness during multi-cycle continuous operation, effectively suppressing system parameter variations and environmental disturbances. This verifies the feasibility of the algorithm in practical engineering applications.
The experimental results verify the theoretical and simulation conclusions. Under actual non-ideal working conditions such as environmental temperature fluctuations and airflow disturbances, the full-cycle temperature error and core constant temperature period error of the system remain stable without parameter divergence and control instability. It confirms that the fuzzy PID algorithm has reliable stability and robustness in practical applications. The theoretical analysis and engineering practice are highly consistent.

5.6. Amplification Results and Performance Evaluation of the Bordetella Pertussis IS481 Gene

To verify the clinical application feasibility of the thermal convection nucleic acid amplification instrument based on fuzzy PID temperature control, this experiment adopts a fluorescence quantitative detection system for Bordetella pertussis. Absolute quantitative PCR tests are performed to evaluate the instrument’s detection linearity, amplification efficiency, sensitivity, and dynamic range. At the same time, batch detection tests using simulated clinical samples are conducted to comprehensively assess the instrument’s practical application performance. The system performance evaluation indicators are summarized in Table 6.
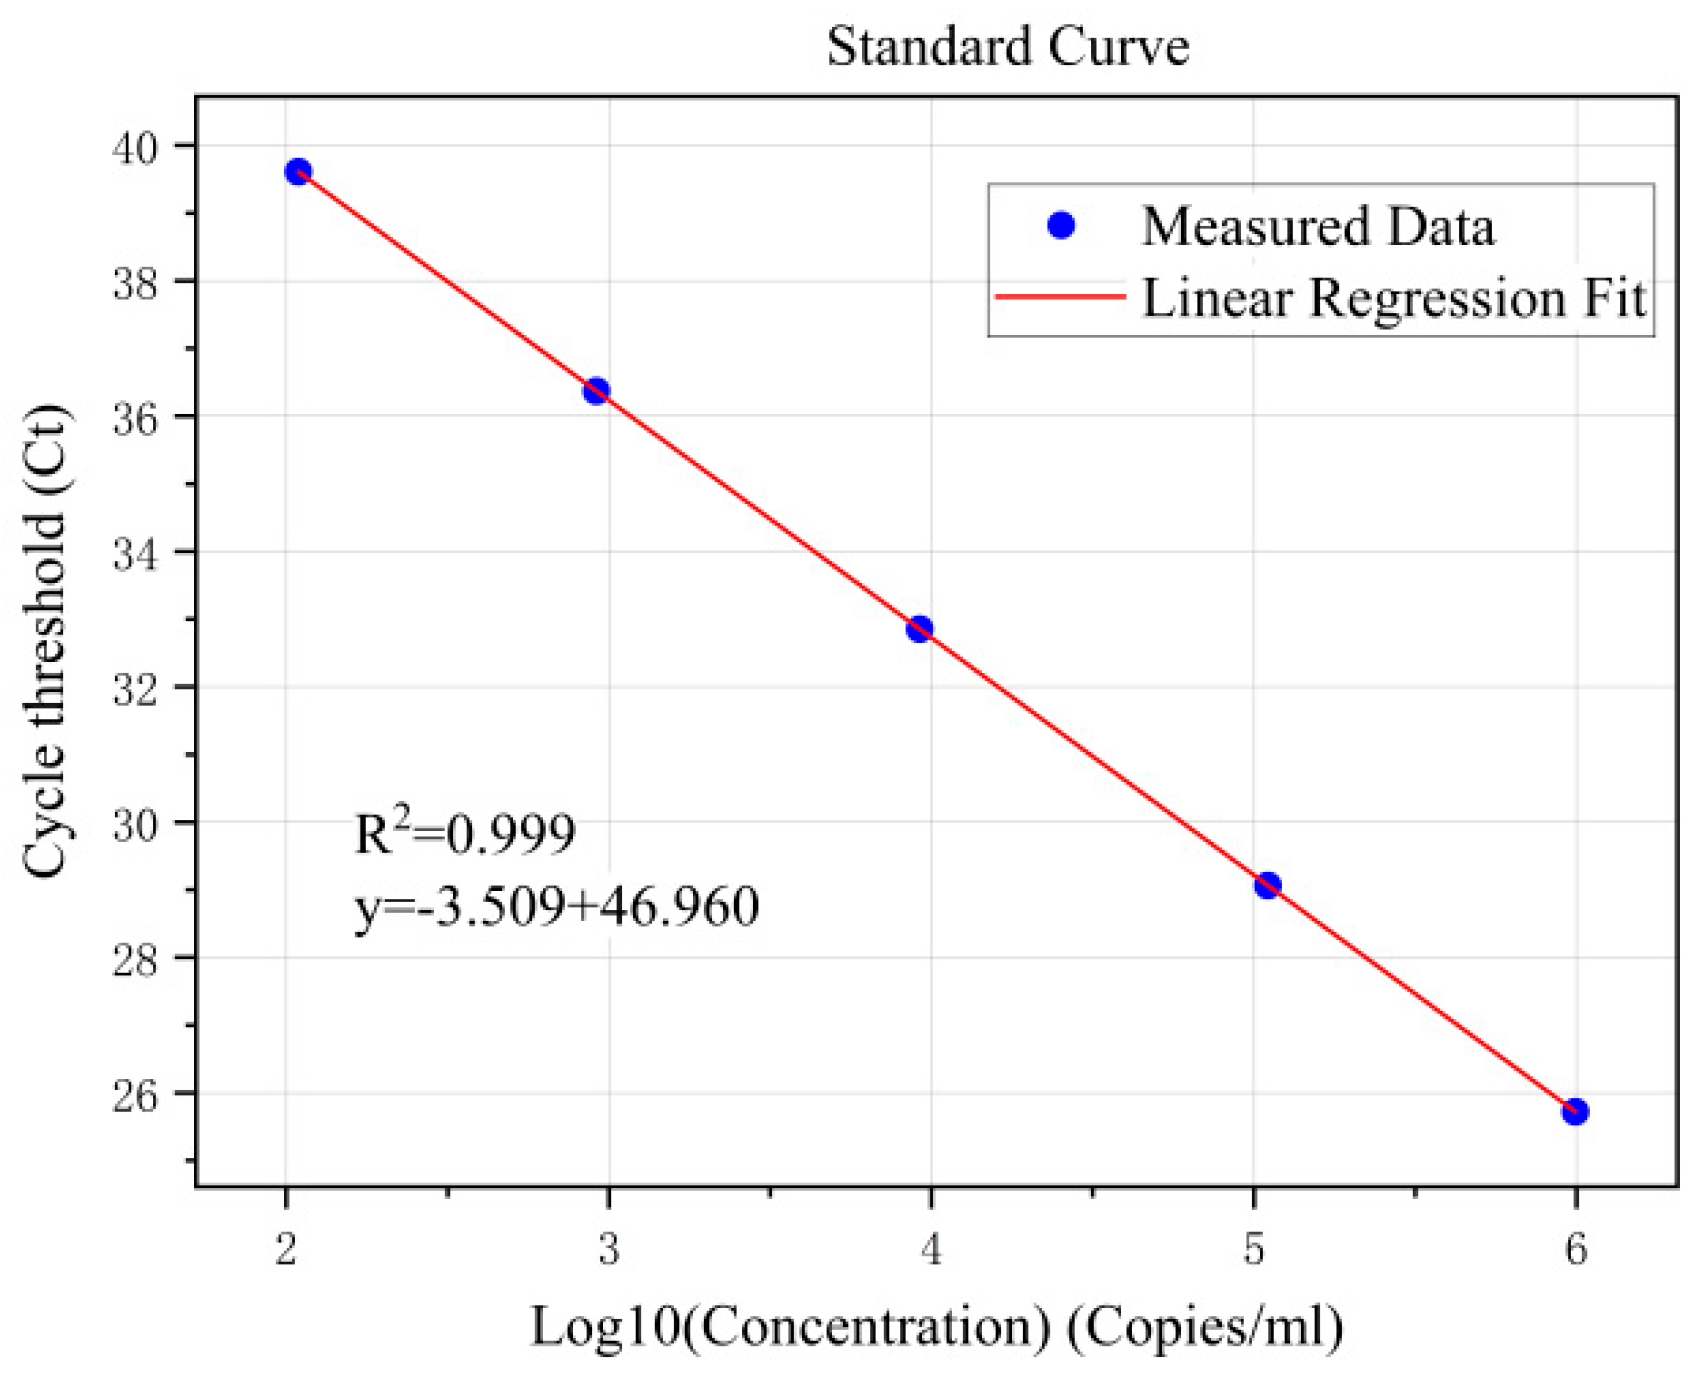
Table 6 show that the instrument achieves an amplification efficiency of 98.7%, which falls within the ideal range for PCR (90–110%). This benefits from the precise temperature control of the fuzzy PID algorithm, which provides a stable environment for enzyme activity. The lower limit of detection is 109 copies/mL, far superior to the industry standard requirement (<1000 copies/mL). The detection dynamic range covers 109–990,800 copies/mL (spanning four orders of magnitude), exceeding the industry standard requirement (≥three orders of magnitude). All performance indicators meet clinical application requirements. A standard curve is constructed using five gradient concentrations of standards (1.0 × 10² to 1.0 × 10⁶ copies/mL), and the results are shown in Figure 20. The fitted equation is y = −3.509x + 46.960, with a coefficient of determination R2 = 0.999, indicating a very strong linear correlation.
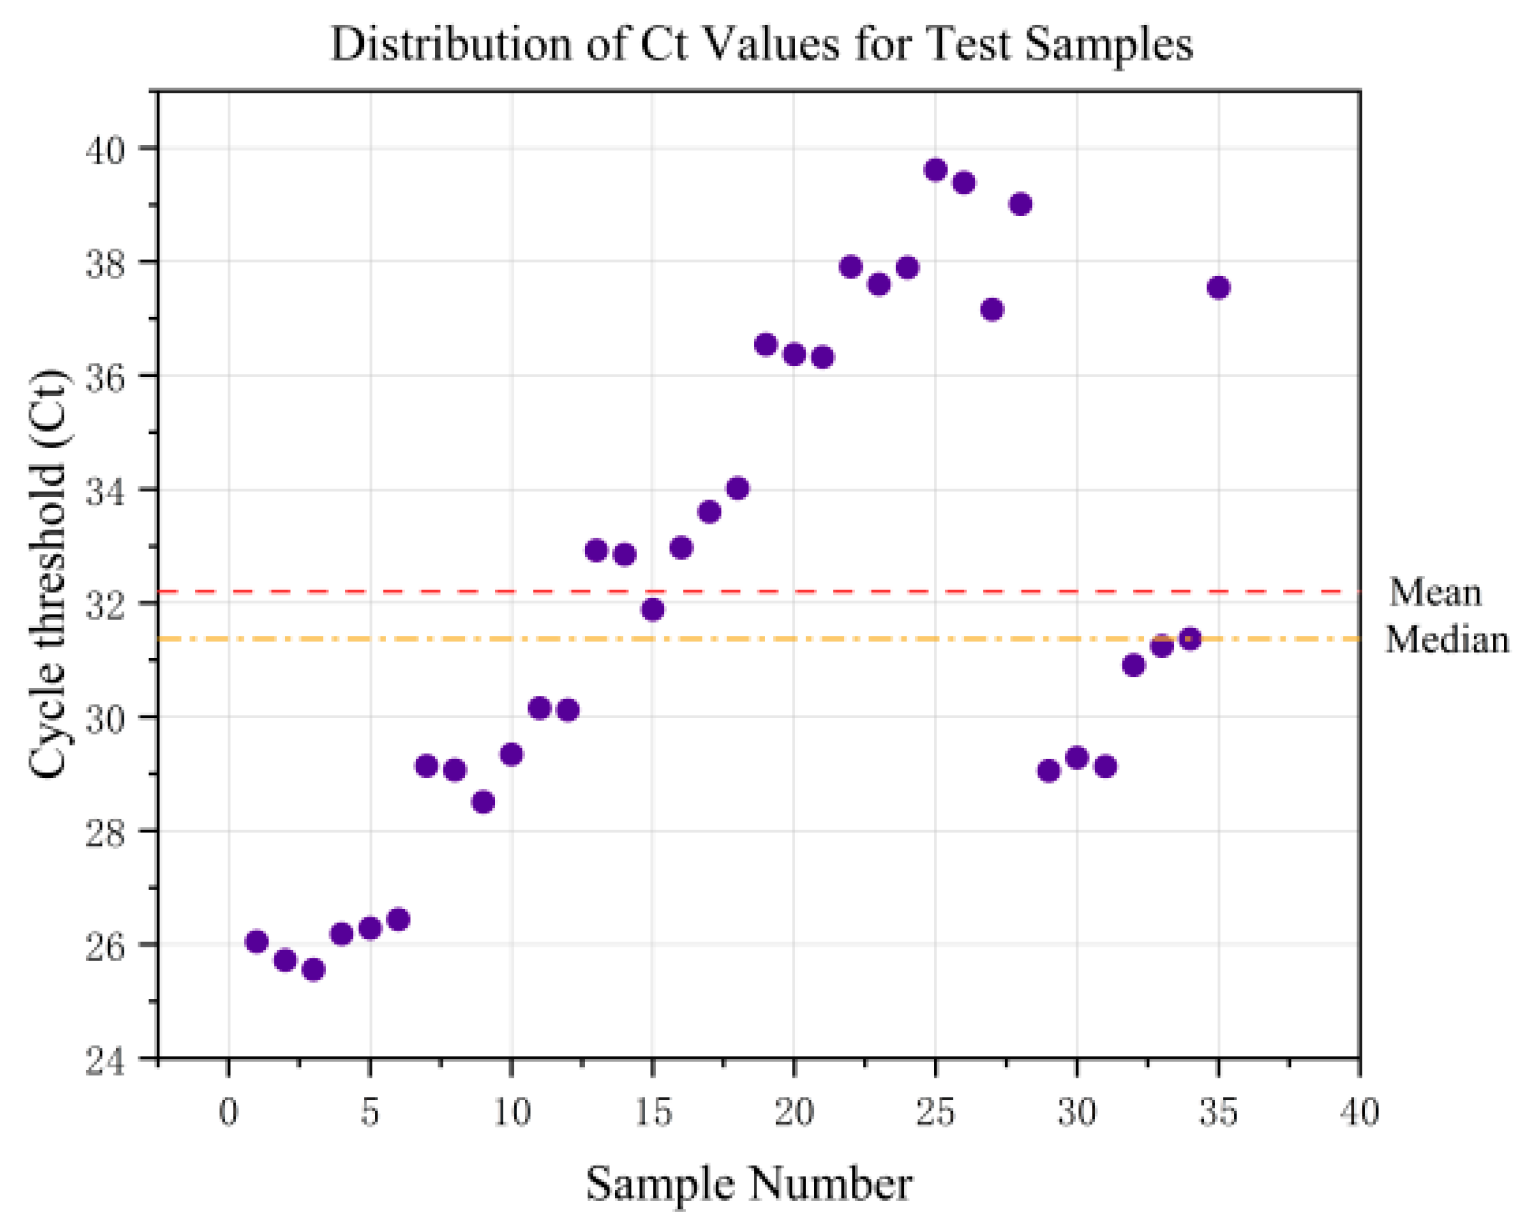
The test results for simulated clinical samples are shown in Figure 21. The Ct values of valid samples are concentrated in the range of 25–39, covering samples with both high and low concentrations, and the test results correlate well with the standards. The Ct values are clearly distributed without abnormal jumps, indicating excellent temperature uniformity between wells and stable, reproducible amplification reactions. The results confirm that the instrument not only meets the relevant standards in standard sample tests but also exhibits stable and reliable detection capability in actual clinical testing scenarios, providing solid technical support for clinical pathogen detection.
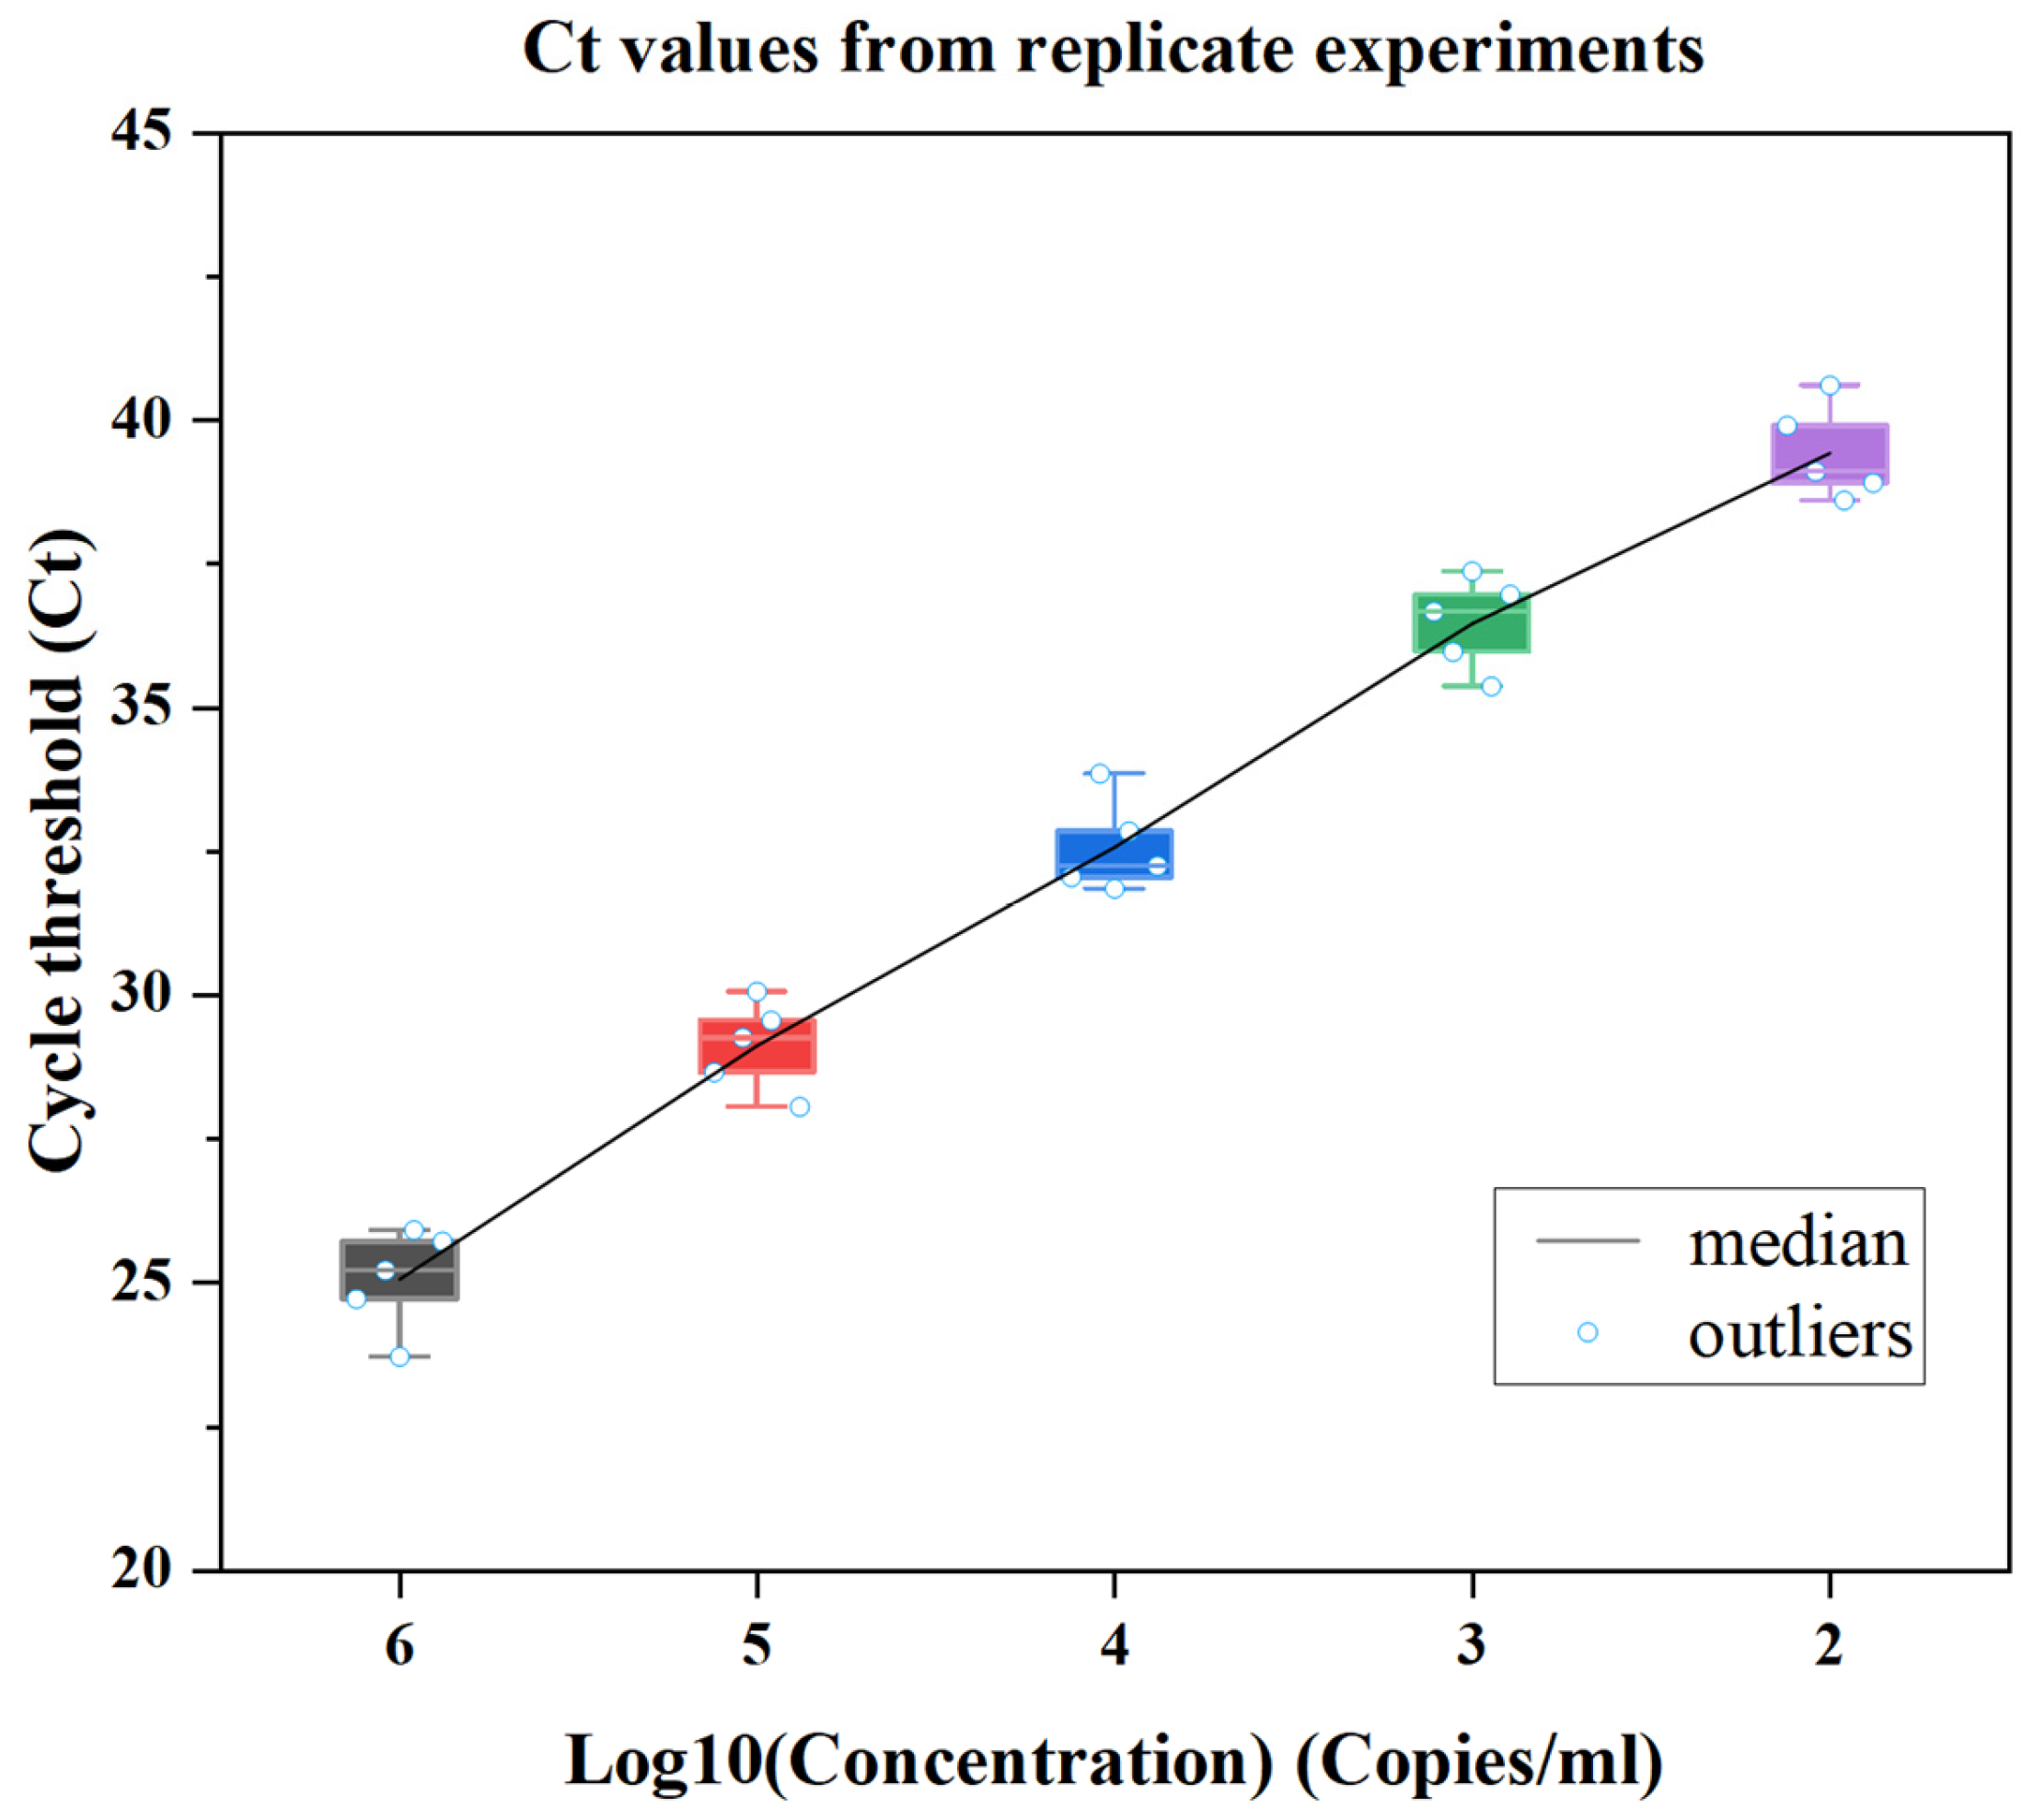
To further verify the repeatability, linear relationship, and result reliability of the amplification experiments, repeated amplification experiments with gradient concentration templates are conducted. The results are shown in Figure 22. The experiment sets up 5 concentration gradients from 102 to 106 Copies/mL, and multiple technical replicates are set for each concentration level. The distribution characteristics of Ct values at each concentration are presented in the form of box plots. The box represents the interquartile range, the middle line is the median, the scattered points are the original data of each repeated experiment, and the error lines show the data fluctuation range. As shown in the figure, the Ct values at each concentration gradient are concentratedly distributed, without obvious outliers. The mean and median are highly coincident, indicating excellent consistency of the repeated experiment results. Meanwhile, the Ct values show a significant linear negative correlation with the increase of the logarithm of the template concentration (Log10). The fitting trend line is clear and stable, indicating that the system has good amplification linearity and efficiency stability over a wide concentration range. Statistical analysis of the Ct values at each concentration shows that the intra-group coefficient of variation (CV) is less than 2%, which is far lower than the repeatability threshold of clinical molecular diagnostic experiments. This confirms that the intra-batch repeatability of this study is excellent, and the results are stable and reliable. It provides sufficient repeated experiments and statistical evidence for the performance evaluation of the temperature control system.
The fuzzy PID temperature control scheme proposed in this work is optimized for single-channel thermal convection-based nucleic acid amplification. However, its extension to multi-channel PCR systems and high-throughput amplification platforms still presents certain limitations. The fuzzy rules and inference model of the current algorithm are constructed solely from the thermal characteristics of a single reaction chamber and do not incorporate the thermal coupling and airflow crosstalk effects that arise when multiple chambers operate in parallel. Moreover, the algorithm has not been optimized for lightweight parallel computation, which increases the computational load on the main control chip during simultaneous multi-channel control. Additionally, the scheme lacks a spatial temperature deviation compensation mechanism for multiple reaction wells, making it difficult to fully satisfy the stringent temperature uniformity requirements demanded by high-throughput platforms.
In summary, the fuzzy PID temperature control algorithm provides a precise and stable temperature environment for nucleic acid amplification reactions, effectively improving the quality of the amplification reaction and the reliability of test results.

6. Conclusions

This study addresses the requirements of precision, speed, and uniformity for nucleic acid amplification temperature control. Through collaborative optimization of hardware and algorithms, a thermal convection nucleic acid amplification temperature control system and a fuzzy PID temperature control algorithm are proposed, which effectively solve the problems of slow response, large overshoot, poor robustness, and complex calculation of traditional thermal convection PCR instruments. In terms of hardware, cross-shaped framework heating wires are adopted, combined with air ducts and the optimized thermodynamic structures to form an orderly airflow circulation. The algorithm integrates fuzzy control and PID to construct a two-input three-output fuzzy PID and achieve dynamic self-tuning of parameters. Experiments and simulations show that the overshoot of the fuzzy PID decreases from 3 °C to 0.1 °C, the steady-state precision is ±0.05 °C, the system amplification efficiency is 98.7%, the whole machine temperature stability is ±0.1 °C, and the heating and cooling rates are 7.5 °C/s and 13.5 °C/s, respectively. All the indicators meet the design standards and national standards. This system achieves rapid, uniform and precise temperature control, breaking through the limitations of traditional technologies. The hardware and algorithm can be directly applied to the upgrade of existing equipment, providing core technical references for high-precision temperature control in precision instruments and biotechnology fields. It has significant application and promotion value. For future exploration, the thermal convection flow field and heat transfer components will be further optimized to improve robustness under complex working conditions. The fuzzy PID algorithm logic will be simplified to adapt to miniaturized portable devices. The application scenarios will be expanded to conduct multi-sample detection and cross-domain adaptation research, thereby promoting the large-scale implementation of the technology in rapid detection, microfluidic chips, and other directions.

Author Contributions

Conceptualization, Z.W. (Zhe Wang) and Y.Z.; methodology, Q.C.; software, Y.Y.; validation, Z.W. (Zexu Wei); formal analysis, L.S.; investigation, C.Y.; resources, H.Z.; data curation, Y.Y.; writing—original draft preparation, Z.W. (Zhe Wang) and Y.Z.; writing—review and editing, Y.Z.; visualization, Z.Z.; supervision, X.M.; project administration, Z.W. (Zhe Wang); funding acquisition, Z.W. (Zhe Wang). All authors have read and agreed to the published version of the manuscript.

Funding

This study is funded by the Jilin Province Science and Technology Development Plan Project (No. 20230203192SF). Changchun University of Science and Technology’s Undergraduate Innovation Training Program (S202510186133).

Data Availability Statement

The original contributions presented in this study are included in the article. Further inquiries can be directed to the corresponding author.

Conflicts of Interest

Author Chaonan Yan was employed by the company Changchun Chengshi Health Industry Co., Ltd. The remaining authors declare that the research was conducted in the absence of any commercial or financial relationships that could be construed as a potential conflicts of interest. The [company Changchun Chengshi Health Industry Co., Ltd.-companies in affiliation and funding] had no role in the design of the study; in the collection, analyses, or interpretation of data; in the writing of the manuscript, or in the decision to publish the results.

References

  1. Sarbaland, F.B.N.; Kobayashi, M.; Tanaka, D.; Fujita, R.; Tanaka, N.; Furuya, M. Temperature Control in Microfluidic Devices: Approaches, Challenges, and Future Directions. Appl. Sci. 2025, 15, 9902. [Google Scholar] [CrossRef]
  2. Liu, H.; Fang, Y.; Su, X.; Wang, Y.; Ji, M.; Xing, H.; Gao, Y.; Zhang, Y.; He, N. Temperature control algorithm for polymerase chain reaction (PCR) instrumentation based upon improved hybrid fuzzy proportional integral derivative (PID) control. Instrum. Sci. Technol. 2023, 51, 109–131. [Google Scholar] [CrossRef]
  3. Chen, J.; Lu, Q.; Bai, J.; Xu, X.; Yao, Y.; Fang, W. A Temperature Control Method for Microaccelerometer Chips Based on Genetic Algorithm and Fuzzy PID Control. Micromachines 2021, 12, 1511. [Google Scholar] [CrossRef]
  4. Kim, H.E.; Schuck, A.; Kim, W.-Y.; Jung, E.K.; Hong, Y.-H.; Kim, Y.-S. PID Temperature Control System-Based Microfluidic PCR Chip for Genetic Analysis. J. Electr. Eng. Technol. 2021, 17, 495–501. [Google Scholar] [CrossRef]
  5. Wang, Z.; Zhao, Y.; Wang, Y.; Shi, C.; Zhao, Z.; Chen, Q.; Shi, L.; Meng, X.; Zhang, H.; Yu, Y. Design and Simulation Analysis of a Temperature Control System for Real-Time Quantitative PCR Instruments Based on Key Hot Air Circulation and Temperature Field Regulation Technologies. Micromachines 2026, 17, 169. [Google Scholar] [CrossRef]
  6. Shao, S.; Wang, W.; Zuo, Z.; Liu, W.; Wang, H. Research on optimization strategies for thermal management system of digital microfluidic chips based on thermoelectric cyclic-thermal regulators. Int. J. Refrig. 2026, 182, 1–13. [Google Scholar] [CrossRef]
  7. Ji, P.-F.; Zhang, T.-P.; Li, Y.; Lu, C. PID Parameter Optimization of Temperature Control for Plastic Extruder Based on ISA-PSO Algorithm. Model. Simul. Eng. 2025, 2025, 8503137. [Google Scholar] [CrossRef]
  8. Zhou, X.; Zhang, C.; Jiang, H.; Wang, C.; Wang, Z.; Lu, C.; He, N. A Temperature Control System for Polymerase Chain Reaction Machine for Cell-Systematic Evolution of Ligands by Exponential Enrichment-Based Automated Screening of Nucleic Acid Aptamers. Nanosci. Nanotechnol. Lett. 2018, 10, 596–602. [Google Scholar] [CrossRef]
  9. Cheng, J.; Zhang, E.; Sun, R.; Zhang, K.; Zhang, F.; Zhao, J.; Feng, S.; Liu, B. Implementation of Rapid Nucleic Acid Amplification Based on the Super Large Thermoelectric Cooler Rapid Temperature Rise and Fall Heating Module. Biosensors 2024, 14, 379. [Google Scholar] [CrossRef]
  10. Peng, J.; Li, M.; Chen, Z.; Liu, H.; Wang, Z.; Su, E.; Elingarami, S.; Shah, M.A.; He, N. A Piecewise Fuzzy Proportional Integral Derivative Control for Polymerase Chain Reaction Thermal Cycling. Nanosci. Nanotechnol. Lett. 2017, 9, 1775–1780. [Google Scholar] [CrossRef]
  11. Zhai, W.; Dong, L.; Hu, Y. Self-tuning control of steam sterilizer temperature based on fuzzy PID and IPSO algorithm. J. Meas. Eng. 2024, 12, 638–655. [Google Scholar] [CrossRef]
  12. Ji, J.; Hu, C.; Pang, X.; Liang, J.; Huang, Q.; Hu, S.; Mei, Q.; Ma, H. Open Thermal Control System for Stable Polymerase Chain Reaction on a Digital Microfluidic Chip. ACS Omega 2024, 9, 10937–10944. [Google Scholar] [CrossRef]
  13. Li, Z.; Gao, Z.; Qian, K.; Liu, L.; Song, J.; Wu, S.; Liu, L.; Zhai, X. Study on Incremental Sheet Forming Performance of AA2024 Aluminum Alloy Based on Adaptive Fuzzy PID Temperature Control. Metals 2025, 15, 852. [Google Scholar] [CrossRef]
  14. Just, V.M.; Welzel, F.; Jacobs, H.; Gau, G.; Hauschultz, M.T.; Friedo, M.H.; Foitzik, A.H. Development of a Thermal Cycler for a Low-Cost Real-Time PCR Application. Key Eng. Mater. 2023, 968, 73–79. [Google Scholar] [CrossRef]
  15. Zhang, T.; Cai, G.; Zhang, Z.; Li, Q.; Cui, C. Temperature control technology for PCR. Int. J. Numer. Model. Electron. Netw. Devices Fields 2024, 37, e3280. [Google Scholar] [CrossRef]
  16. Ren, K.; Xie, Y.; Wang, C.; Yan, J.; Shi, Y.; Guo, J.; Guo, J. Application of the fuzzy proportional integral differential (PID) temperature control algorithm in a liver function test system based on a centrifugal microfluidic device. Talanta 2024, 268, 125330. [Google Scholar] [CrossRef] [PubMed]
  17. Zhang, F.; Wang, K.; Shu, X.; Su, D.; Yu, Y.; Chen, C.; Zhao, J.; Feng, S.; Liu, B. High-thermal-conductivity integrated EWOD chip for ultra-fast, low-cost pathogen detection. Anal. Chim. Acta 2026, 1398, 345227. [Google Scholar] [CrossRef] [PubMed]
  18. Wang, Z.; Huang, J.; Chen, Q.; Yu, Y.; Yu, X.; Zhao, Y.; Wang, Y.; Shi, C.; Zhao, Z.; Tang, D. Analytical Device and Prediction Method for Urine Component Concentrations. Micromachines 2025, 16, 789. [Google Scholar] [CrossRef] [PubMed]
  19. Dewi, K.A.; Gomez, M.M.; Hamdani, N.C. PID—Fuzzy Controller to Control System Temperature On Cooling Tower. IOP Conf. Ser. Earth Environ. Sci. 2025, 1504, 012007. [Google Scholar] [CrossRef]
  20. Cai, Y.; Zhao, Z.; Guo, W.; Xu, H.; Teng, Y.; Han, X.; Zhao, Q.; Wang, L. Smart Nutrient Solution Temperature Control System for Oversummering Lettuce Cultivation Based on Adaptive Dung Beetle Optimizer-Fuzzy PID. Appl. Sci. 2025, 15, 5381. [Google Scholar] [CrossRef]
  21. Hu, Z.; Guo, W.; Zhou, K.; Wang, L.; Wang, F.; Yuan, J. Optimization of PID control parameters for marine dual-fuel engine using improved particle swarm algorithm. Sci. Rep. 2024, 14, 12681. [Google Scholar] [CrossRef]
  22. Luo, Y.; Hu, W.; Wu, J.; Sun, B.; Jin, G.; Xu, Q. A reagent-centred thermal control system driven by a cascade temperature control algorithm for high-speed PCR. Analyst 2025, 151, 237–250. [Google Scholar] [CrossRef]
  23. Zhang, X.; Cao, Z.; Wang, S.; Yao, L.; Yu, H. High-Speed Temperature Control Method for MEMS Thermal Gravimetric Analyzer Based on Dual Fuzzy PID Control. Micromachines 2023, 14, 929. [Google Scholar] [CrossRef]
  24. Jian, M.; Zhu, S.; Du, W.; Yang, L.; Zhang, J. Design of a temperature control system for transient thermal measurement utilizing the backpropagation PID algorithm. Int. J. Therm. Sci. 2025, 210, 109654. [Google Scholar] [CrossRef]
  25. Liu, X.; Zhang, Z.; Peng, Z.; Yang, J. Optimization of fuzzy-PID temperature controller based on improved slime mould algorithm. J. Phys. Conf. Ser. 2024, 2862, 012017. [Google Scholar] [CrossRef]
  26. Yan, G.; Gong, X.; Bai, X.; Tang, Z. The Design of the Control Resistor Furnace Temperature System: Based on the Fuzzy PID Algorithm. J. Res. Sci. Eng. 2022, 4, 495–501. [Google Scholar] [CrossRef]
  27. Lin, Z.; Zhang, Z.; Chen, C.; Zhu, Z. Design and application of temperature controller based on BP neural network identification and adaptive fuzzy PID. Eng. Res. Express 2026, 8, 075411. [Google Scholar] [CrossRef]
  28. Xu, Z.; Liu, J. Research on Temperature Control of Liposome High Pressure Homogenizer Based on Genetic Algorithm Optimization PID. Procedia Comput. Sci. 2022, 208, 330–337. [Google Scholar] [CrossRef]
  29. Sun, Z.; Liu, C.; Li, M.; Zhao, J.; Xu, Y. Application of anti integral saturation cascade PID control algorithm in superheated steam temperature control. J. Phys. Conf. Ser. 2021, 2087, 012038. [Google Scholar] [CrossRef]
  30. Zhu, X.; Gu, T.; Wang, J.; Li, C.; Feng, X.; Li, H. Intelligent Dustbin Temperature Control System Based on Evaporative Cooling: Enhanced Prediction and Control of Temperature Systems Using Fuzzy PID strategies. J. Intell. Fuzzy Syst. 2025, 49, 1088–1106. [Google Scholar] [CrossRef]
  31. He, G.; Jiang, C.; Yang, M.; Li, J. Research on Cabin Temperature Control of UAV Based on Fuzzy PID Controller. J. Innov. Dev. 2025, 10, 1–4. [Google Scholar] [CrossRef]
  32. Wang, S.; Tian, H.; Tian, J.; Wu, Z.; Li, C.; Tao, Z. Smith GA-PID feedback control of hot strip final rolling temperature. J. Phys. Conf. Ser. 2024, 2816, 012039. [Google Scholar] [CrossRef]
  33. Gao, C.; Sun, M.; Guo, X.; Li, Y.; Zhang, X. Simulation Application of BPNN-PID Controller with Improved Ant Colony Algorithm in Temperature Control System. Front. Comput. Intell. Syst. 2024, 8, 90–94. [Google Scholar] [CrossRef]
Figure 1. Structure of closed-loop PID controller.
Processes 14 01889 g001
Figure 2. Working principle diagram.
Processes 14 01889 g002
Figure 3. Basic fuzzy control flow.
Processes 14 01889 g003
Figure 4. Architecture diagram of fuzzy adaptive PID controller.
Processes 14 01889 g004
Figure 5. Graph of membership functions for input variables. (a) Membership functions of E. (b) Membership functions of EC.
Processes 14 01889 g005
Figure 6. Graph of membership functions for output variables. (a) Membership functions of Kp. (b) Membership functions of Ki. (c) Membership functions of Kd.
Processes 14 01889 g006
Figure 7. Fuzzy control rules.
Processes 14 01889 g007
Figure 8. Nonlinear mapping of the fuzzy adaptive PID controller. (a) Nonlinear relationship of ΔKp. (b) Nonlinear relationship of ΔKi. (c) Nonlinear relationship of ΔKd.
Processes 14 01889 g008
Figure 9. Comparative simulation model of conventional PID and fuzzy adaptive PID.
Processes 14 01889 g009
Figure 10. Internal structure of the fuzzy adaptive PID subsystem.
Processes 14 01889 g010
Figure 11. Output response of PID control.
Processes 14 01889 g011
Figure 12. Output response of fuzzy adaptive PID control.
Processes 14 01889 g012
Figure 13. System test fixture.
Processes 14 01889 g013
Figure 14. Temperature response curves. (a) Output curves of fuzzy PID controllers with different parameter configurations. (b) Comparison curves of fuzzy PID and conventional PID.
Processes 14 01889 g014
Figure 15. Comparison of temperature control effect with and without fuzzy PID control. (a) With 1 s PID control. (b) With 15 s PID control. (c) With 30 s PID control. (d) Without 1 s PID control. (e) Without 15 s PID control. (f) Without 30 s PID control.
Processes 14 01889 g015
Figure 16. Heating test graphs. (a) PID heating test comparison. (b) Enlarged view. (c) Enlarged view.
Processes 14 01889 g016
Figure 17. PID cooling test graphs. (a) PID cooling test comparison. (b) Enlarged view. (c) Enlarged view.
Processes 14 01889 g017
Figure 18. Comparison of control output responses between fuzzy PID and conventional PID.
Processes 14 01889 g018
Figure 19. Comparison of temperature control performance under simulation and measured conditions. (a) Simulation response curve. (b) Measured response curve. (c) Three-dimensional error surface.
Processes 14 01889 g019
Figure 20. Standard curve.
Processes 14 01889 g020
Figure 21. Ct value distribution of test samples.
Processes 14 01889 g021
Figure 22. Box plot of Ct values from repeated experiments.
Processes 14 01889 g022
Table 1. ΔKp fuzzy control rule table.
ECNBNMNSZOPSPMPB
ΔKp
E
NB
NM
NS
ZO
PS
PM
PB
PB
PB
PM
PM
PS
PS
ZO
PB
PB
PM
PM
PS
ZO
ZO
PM
PM
PS
PS
PS
NS
NM
PM
PS
PS
ZO
NS
NM
NM
PS
PS
NS
NS
NS
NM
NM
ZO
ZO
NS
NM
NM
NM
NB
ZO
ZO
NS
NM
NM
NB
NB
Table 2. ΔKi fuzzy control rule table.
ECNBNMNSZOPSPMPB
ΔKi
E
NB
NM
NS
ZO
PS
PM
PB
NB
NB
NB
NB
NM
ZO
ZO
NB
NB
NM
NM
NS
ZO
ZO
NM
NM
NM
NS
PM
PS
PS
NM
NS
NS
ZO
PS
PS
PM
NS
NS
NM
PS
PM
PM
PM
ZO
ZO
PS
PM
PM
PB
PB
ZO
NS
PS
PM
PB
PB
PB
Table 3. ΔKd fuzzy control rule table.
ECNBNMNSZOPSPMPB
ΔKd
E
NB
NM
NS
ZO
PS
PM
PB
PS
PS
ZO
ZO
ZO
PB
PB
NS
NS
NS
NS
ZO
NM
PM
NB
NB
NM
NS
PM
PS
PM
NB
NM
NM
ZO
PS
PS
PM
NB
NM
NM
NS
PM
PS
PS
NM
NM
PS
NS
ZO
PS
PS
PS
PS
ZO
ZO
ZO
PB
PB
Table 4. Comparison of temperature control performance of the nucleic acid amplification instrument with and without fuzzy PID control.
Core Evaluation MetricsConventional PID ControlFuzzy PID ControlKey Advantages of Fuzzy PID Control
Temperature Control Steady-State Error±0.5 °C±0.1 °CMeets stringent accuracy requirements and prevents amplification failure caused by temperature deviations.
Average Heating/Cooling Rate4–5 °C/s7.5–13.5 °C/sDoubles the heating/cooling rate, significantly reduces amplification time, and improves detection efficiency.
Temperature Overshoot5–10%, prone to exceeding the temperature control safety threshold≤2%, nearly no overshootEliminates sample failure or enzyme inactivation caused by overshoot, ensuring reaction stability.
Ambient Temperature Disturbance Rejection CapabilityUnder ±5 °C ambient fluctuation, temperature control deviation reaches ±0.7 °CUnder ±5 °C ambient fluctuation, temperature control deviation ≤ ±0.1 °CMitigates ambient temperature interference and enhances the device’s environmental adaptability.
Long-Term Cyclic Temperature Fluctuation AmplitudeFluctuation amplitude of ±0.6 °C after 40 cyclesFluctuation amplitude ≤ ±0.1 °C after 40 cyclesEnsures full-cycle temperature control stability without cumulative deviation or drift.
System Thermal Runaway RiskFixed parameters, prone to temperature runaway under extreme operating conditionsAdaptive amplitude limiting and regulation capabilities, no runaway risk under all operating conditionsImproves operational safety and reliability, avoiding sample and reagent loss.
Nucleic Acid Amplification Efficiency85–90%95–100%Achieves near-optimal amplification efficiency, significantly improving detection sensitivity for low-concentration samples.
Table 5. Performance comparison of different intelligent temperature control algorithms.
Control StrategyOvershoot (°C)Settling Time (s)Steady-State Accuracy (°C)Heating Rate (°C/s)Cooling Rate (°C/s)Deviation Under Ambient Disturbance (°C)
Conventional PID3.055±0.54.55.2±0.7
PSO-PID2.28.5±0.126.810.1±0.25
GA-PID2.810.2±0.156.39.6±0.30
Fuzzy PID≤0.1<1.5±0.057.513.5≤±0.1
Table 6. Summary of performance indicators.
Performance CategoryEvaluation MetricTest ResultIndustry StandardCompliance Status
Linear PerformanceCoefficient of Determination (R2)0.999≥0.99Compliant
Amplification EfficiencyAmplification Efficiency (E)98.7%90–110%Compliant
Detection SensitivityLimit of Detection (LOD)109 Copies/mL<1000 Copies/mLCompliant
Detection RangeConcentration Coverage Range109–990,800 Copies/mL≥3 orders of magnitudeCompliant
Disclaimer/Publisher’s Note: The statements, opinions and data contained in all publications are solely those of the individual author(s) and contributor(s) and not of MDPI and/or the editor(s). MDPI and/or the editor(s) disclaim responsibility for any injury to people or property resulting from any ideas, methods, instructions or products referred to in the content.