Article

Visualized Characterization of Reservoir Pore–Throat Blockage Induced by Injection of Various Oily Sludges Using Micro-CT


1
College of Geosciences, Yangtze University, Wuhan 430100, China
2
Key Laboratory of Oil and Gas Resources and Exploration Technology of the Ministry of Education, Yangtze University, Wuhan 430100, China
3
Exploration and Development Research Institute, Liaohe Oilfield Company, PetroChina, Panjin 124000, China
4
Wuhan Zhongwang Yineng Technology Development Co., Ltd., Wuhan 430074, China
*
Author to whom correspondence should be addressed.
Processes 2026, 14(11), 1769; https://doi.org/10.3390/pr14111769
Submission received: 7 May 2026 / Revised: 25 May 2026 / Accepted: 26 May 2026 / Published: 28 May 2026
(This article belongs to the Section Petroleum and Low-Carbon Energy Process Engineering)

Abstract

This paper explores the internal rock plugging rules induced by oily sludge profile control systems in oilfields. Three typical sludges including wastewater tank bottom sludge (WTBS), crude oil tank bottom sludge (CTBS) and floating scum sludge (FSS) are adopted. Combined with micro-CT scanning and digital core technology, this paper systematically investigates the pore–throat structure evolution and damage mechanism before and after sludge injection into rock cores. Key parameters such as plugging rate, average pore radius, throat radius, coordination number, shape factor, pore–throat ratio and pore–throat volume are quantitatively characterized macroscopically and microscopically, which reveal diverse damage modes and plugging mechanisms of the three sludges. The results indicate that pores of 10–50 μm are preferentially blocked by all sludges. CTBS causes the severest core damage with an average plugging rate of 79.67%, and the average coordination number decreases from 4 to 1, governed by the mechanism of adsorption diameter reduction and structural destruction. WTBS leads to uniform jamming of fine particles. Its average parameters change slightly, yet permeability declines due to broken critical throats. It follows the mechanism of uniform filling and weak adsorption with an average plugging rate of 56.75%, showing mild reservoir modification capacity. FSS causes moderate damage. Retained emulsion droplets trigger uniform slight shrinkage of pore throats under partial and overall selective filling mechanism, with an average plugging rate of 63.36% and favorable selective plugging performance. This study clarifies the inherent correlation between macroscopic damage and microscopic behaviors of oily sludge, offering microscopic theoretical references for differentiated management of sludge reinjection and oil displacement with composite sludge profile control agents.

1. Introduction

Oily sludge is a heterogeneous mixture mainly composed of water, oil and solid particles [1]. Three major types of oily sludge are generated during produced water dehydration in oilfields and refining production. The first is wastewater tank bottom sludge formed by long-term sedimentation in settling, oil removal and filtration tanks, which is typical sludge from dehydration processes. The second is crude oil tank bottom sludge accumulated at the bottom of storage facilities, gathering pipelines and separators, representing sludge from gathering, transportation and storage stages. The third is floating scum sludge produced via chemical dosing, stirring and aeration, exclusive to chemical treatment procedures. These three types account for the largest output and pose the greatest disposal difficulty, covering major sludge-producing processes. They differ greatly in composition, particle size and solid–liquid ratio, serving as key research subjects for sludge reinjection disposal. Due to complex components and difficult separation, treatment and recycling of oily sludge remain challenging issues in oilfield chemistry [2]. Solid particles, asphaltenes and resins in sludge can severely damage near-wellbore reservoirs. Asphaltene particles dynamically aggregate and grow during migration in rock pores. When the particle size approaches or exceeds the pore–throat diameter, bridging trapping occurs at narrow throats, forming stable plugging masses and destroying the topological connectivity of pore networks. Meanwhile, asphaltenes continuously adsorb onto mineral surfaces to form organic films, reducing the effective flow radius and the critical passing size of particles, which further aggravates retention and plugging [3]. Adsorption, bridging and filling readily block pore throats and reduce permeability, bringing about increased injection pressure, lowered oil displacement efficiency and impaired regular production and recovery performance. Oily sludge profile control technology has been researched and applied in China for over a decade. Various sludge profile control systems have been developed, adapting to diverse reservoir conditions and achieving favorable field effects [4,5]. Nevertheless, the existing studies focus predominantly on practical application performance, lacking systematic insight into plugging laws within reservoir pore throats [6]. Clarification of distinct plugging mechanisms provides vital theoretical guidance for optimizing profile control schemes, alleviating reservoir damage and realizing sludge resource utilization.
Mercury intrusion porosimetry (MIP), low-pressure nitrogen adsorption, nuclear magnetic resonance and displacement tests are conventional microscopic characterization methods for reservoir pore–throat structure. These methods suffer from long test cycles and low accuracy, failing to precisely acquire microscopic pore–throat parameters [7,8]. With the rapid advancement of medical imaging and industrial non-destructive testing, X-ray computed tomography (CT) offers an effective breakthrough solution. Micro-CT can acquire high-precision 3D digital images of rock samples in a non-destructive and efficient manner. It constructs digital cores, restores the three-dimensional distribution of rock skeleton, pores and fluids, and enables simulation of pore structure and microscopic seepage characteristics. The distribution and structural parameters of pore throats can be analyzed qualitatively and quantitatively [9,10]. Aiming at the microscopic plugging effect of the three typical oily sludges, this study innovatively adopts micro-CT scanning technology and conducts experiments on natural sandstone cores with uniform physical properties. Combined qualitative and quantitative analysis is performed to clarify the varying influences and inherent mechanisms on pore–throat structure before and after sludge injection, providing a microscopic theoretical basis for the optimization of oily sludge profile control technology.

2. Experimental Section

2.1. Materials and Instruments

2.1.1. Oily Sludge Samples

Three types of oily sludge produced from three core process links in the production of an oilfield were selected in this study, namely WTBS, CTBS and FSS. The three types of oily sludge cover the full-process sludge types of oilfield dehydration, gathering and transportation, and reagent treatment, with typical and representative composition and particle size characteristics, which can fully reflect the reservoir damage potential of actual oily sludge in oilfields. Specifically, WTBS comes from the bottom of the settling tank of the oilfield dehydration treatment system, which is the type of oily sludge with the largest output in oilfields; CTBS is taken from the bottom of the crude oil gathering and transportation storage tank, with high organic matter content and coarse particle size; FSS is derived from the reagent stirring link of oilfield sewage treatment, with high solid phase particle content and wide particle size distribution range. The selection of the three types of oily sludge can fill the gap of single sludge research in existing studies and realize the systematic comparative analysis of reservoir damage caused by typical oily sludge in oilfields.
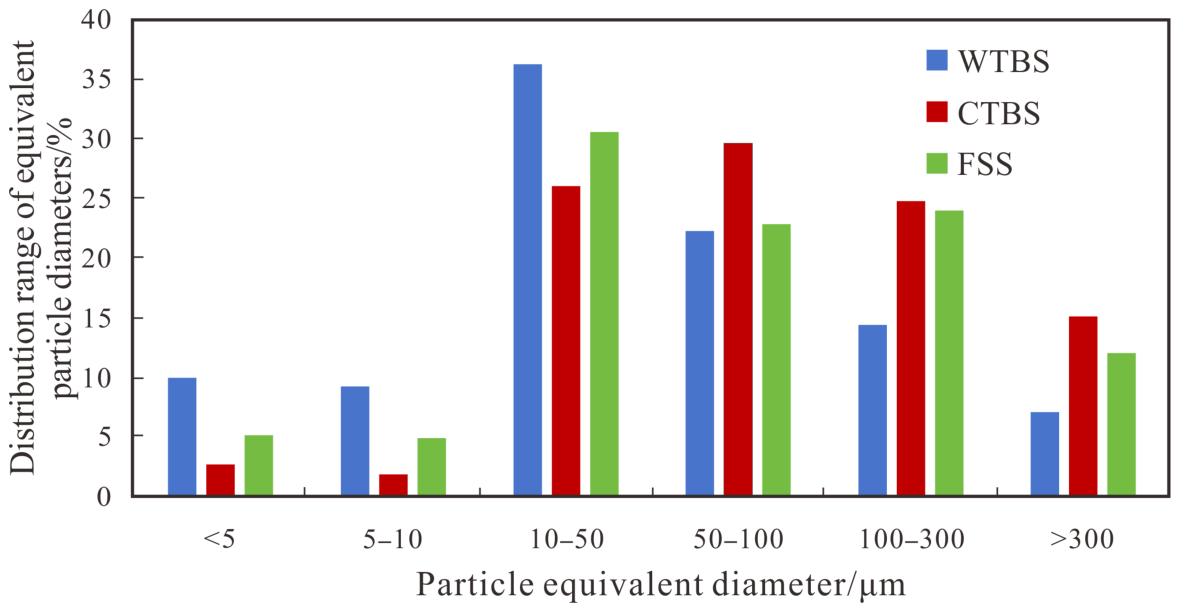
The water content of the samples was measured by the distillation method, the oil content and shale content were measured by thermogravimetric analysis (TGA), the number–particle size distribution of the three types of oily sludge was counted by an automatic particle image analyzer (Shandong Lanjing Electronic Technology Co., Ltd., Jinan, China), and the median particle diameters (d50) of WTBS, FSS, and CTBS were calculated to be 22.5 μm, 38.2 μm, and 67.8 μm, respectively. The data results are shown in Table 1 and Figure 1.
It can be seen from Table 1 and Figure 1 that the shale content of the three types of oily sludge ranges from 13.93% to 26.20%, with the highest shale content in FSS and the lowest in WTBS. The oil content ranges from 10.09% to 20.43%, with the highest oil content in CTBS and the lowest in WTBS. The equivalent particle size diameter of the three types of oily sludge is mainly distributed in the range of 10–300 μm.

2.1.2. Core Samples

Twelve natural sandstone cores with uniform physical properties were selected for the experiment, all taken from the same reservoir interval to eliminate the interference of core physical property differences on the comparison of sludge damage effects. The basic core parameters were unified as follows: diameter of 2.5 cm, length of 10 cm, average porosity of 28.3% (coefficient of variation <3%), average air permeability of 3512 mD (coefficient of variation <4%), and pore–throat radius mainly distributed between 5 and 25 μm, which is a typical representative of medium-porosity and medium-permeability reservoirs in oilfields. A parallel experimental design with 4 cores corresponding to a single sludge type was adopted; that is, each type of oily sludge was injected into 4 sandstone cores respectively to ensure the reliability and repeatability of the experimental results.

2.1.3. Experimental Instruments

The micro-CT scanning equipment is a nanoVoxel-3000 core X-ray CT scanning (Sanying Precision Instruments Co., Ltd., Tianjin, China), identification and analysis system. The basic performance parameters of the instrument are sample aperture size: diameter 2–25 mm; voltage: 20–190 KV; and power: 120 W, which can meet the requirements for the microscopic characterization of core pore–throat structure.

2.2. Experimental Design

The 12 natural sandstone cores were split in half along the axis respectively and divided into a blank control group and a sludge injection experimental group. The blank control group was directly subjected to micro-CT scanning of the original core to obtain the original pore–throat structure parameters of the cores; the experimental group was first subjected to physical simulation of oily sludge injection to simulate the pressure and flow rate conditions of on-site oily sludge reinjection in oilfields, and then, micro-CT scanning was performed after the completion of sludge injection. Through the comparison of the pore–throat structure of the same core before and after injection, the pore–throat blockage mechanism of different types of oily sludge on reservoirs was accurately analyzed, avoiding the experimental error caused by the difference in physical properties of different cores.

2.3. Micro-CT Scanning and Image Extraction

2.3.1. Principle of Micro-CT Scanning

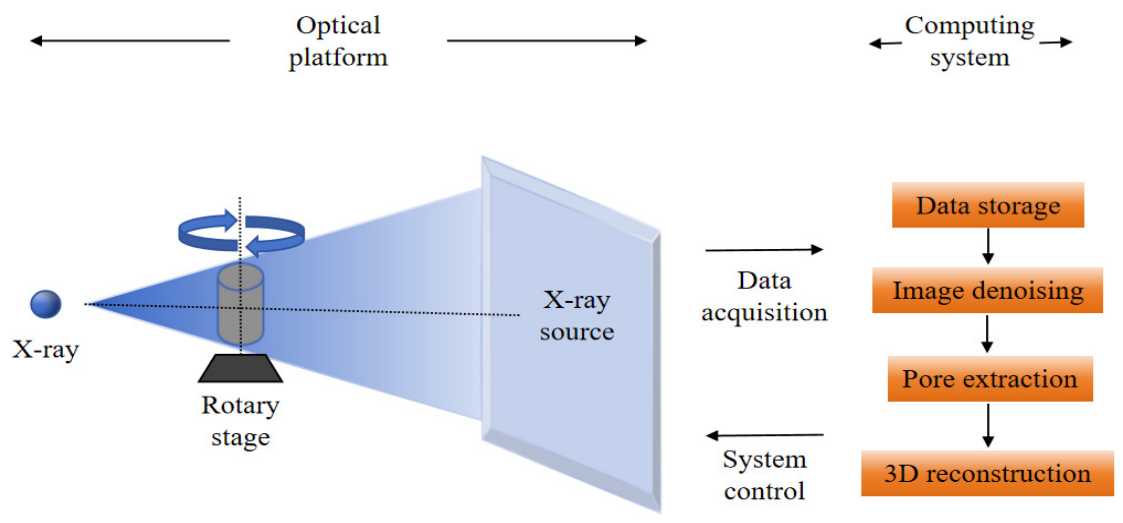
In this study, a micro-scale computed tomography scanning system was used to perform high-resolution 3D imaging of core samples. The system is mainly composed of a micro-focus X-ray source, a flat panel detector, a high-precision rotary stage, and an integrated control and image processing system. The core sample is fixed at the center of the rotary stage, and the X-ray source emits cone-beam rays to penetrate the sample. During the data acquisition process, the rotary stage drives the sample to rotate continuously by 360°, and the detector synchronously acquires 2D transmission projection images at different angles (Figure 2).
The entire acquisition process is coordinated by the system control module to ensure the synchronization of ray parameters, rotation angle and image acquisition. The acquired original projection data are subjected to 3D reconstruction through the filtered back projection algorithm to obtain a series of continuous 2D tomographic slice images. To reduce noise and improve the image signal-to-noise ratio (SNR), local mean filtering and wavelet threshold denoising were used for image smoothing filtering to eliminate the interleaved noise in the image while maintaining the edge details of the image to the greatest extent [11,12]. After preprocessing, the pixels in the rock CT image were divided into multiple regions or objects with specific attributes based on the threshold method. This type of method sets different gray threshold classifications according to the gray histogram of the image and accurately extracts pores, matrix and minerals [13].
Reasonable segmentation of digital core matrix and pores is the key to the quantitative characterization of the core microstructure. The watershed algorithm based on the regional characteristics of the image can accurately determine the boundary between the matrix and pores and precisely extract the pore phase from 2D slices [14]. On this basis, the 3D region growing algorithm and pore network model extraction algorithm were used to fuse and reconstruct the series of 2D segmentation results and finally establish a connected 3D digital core model of pore space. Based on the reconstructed 3D digital core model, the built-in algorithm of the professional image analysis software was used to quantitatively extract and calculate the microscopic parameters required for the study, including the pore volume, throat volume, equivalent radius distribution of pores and throats, average coordination number, throat length, pore–throat ratio, and throat shape factor. By comparing the differences of these parameters before and after oily sludge injection, the quantitative characterization of the damage mechanism was realized.

2.3.2. Oily Sludge Image Extraction

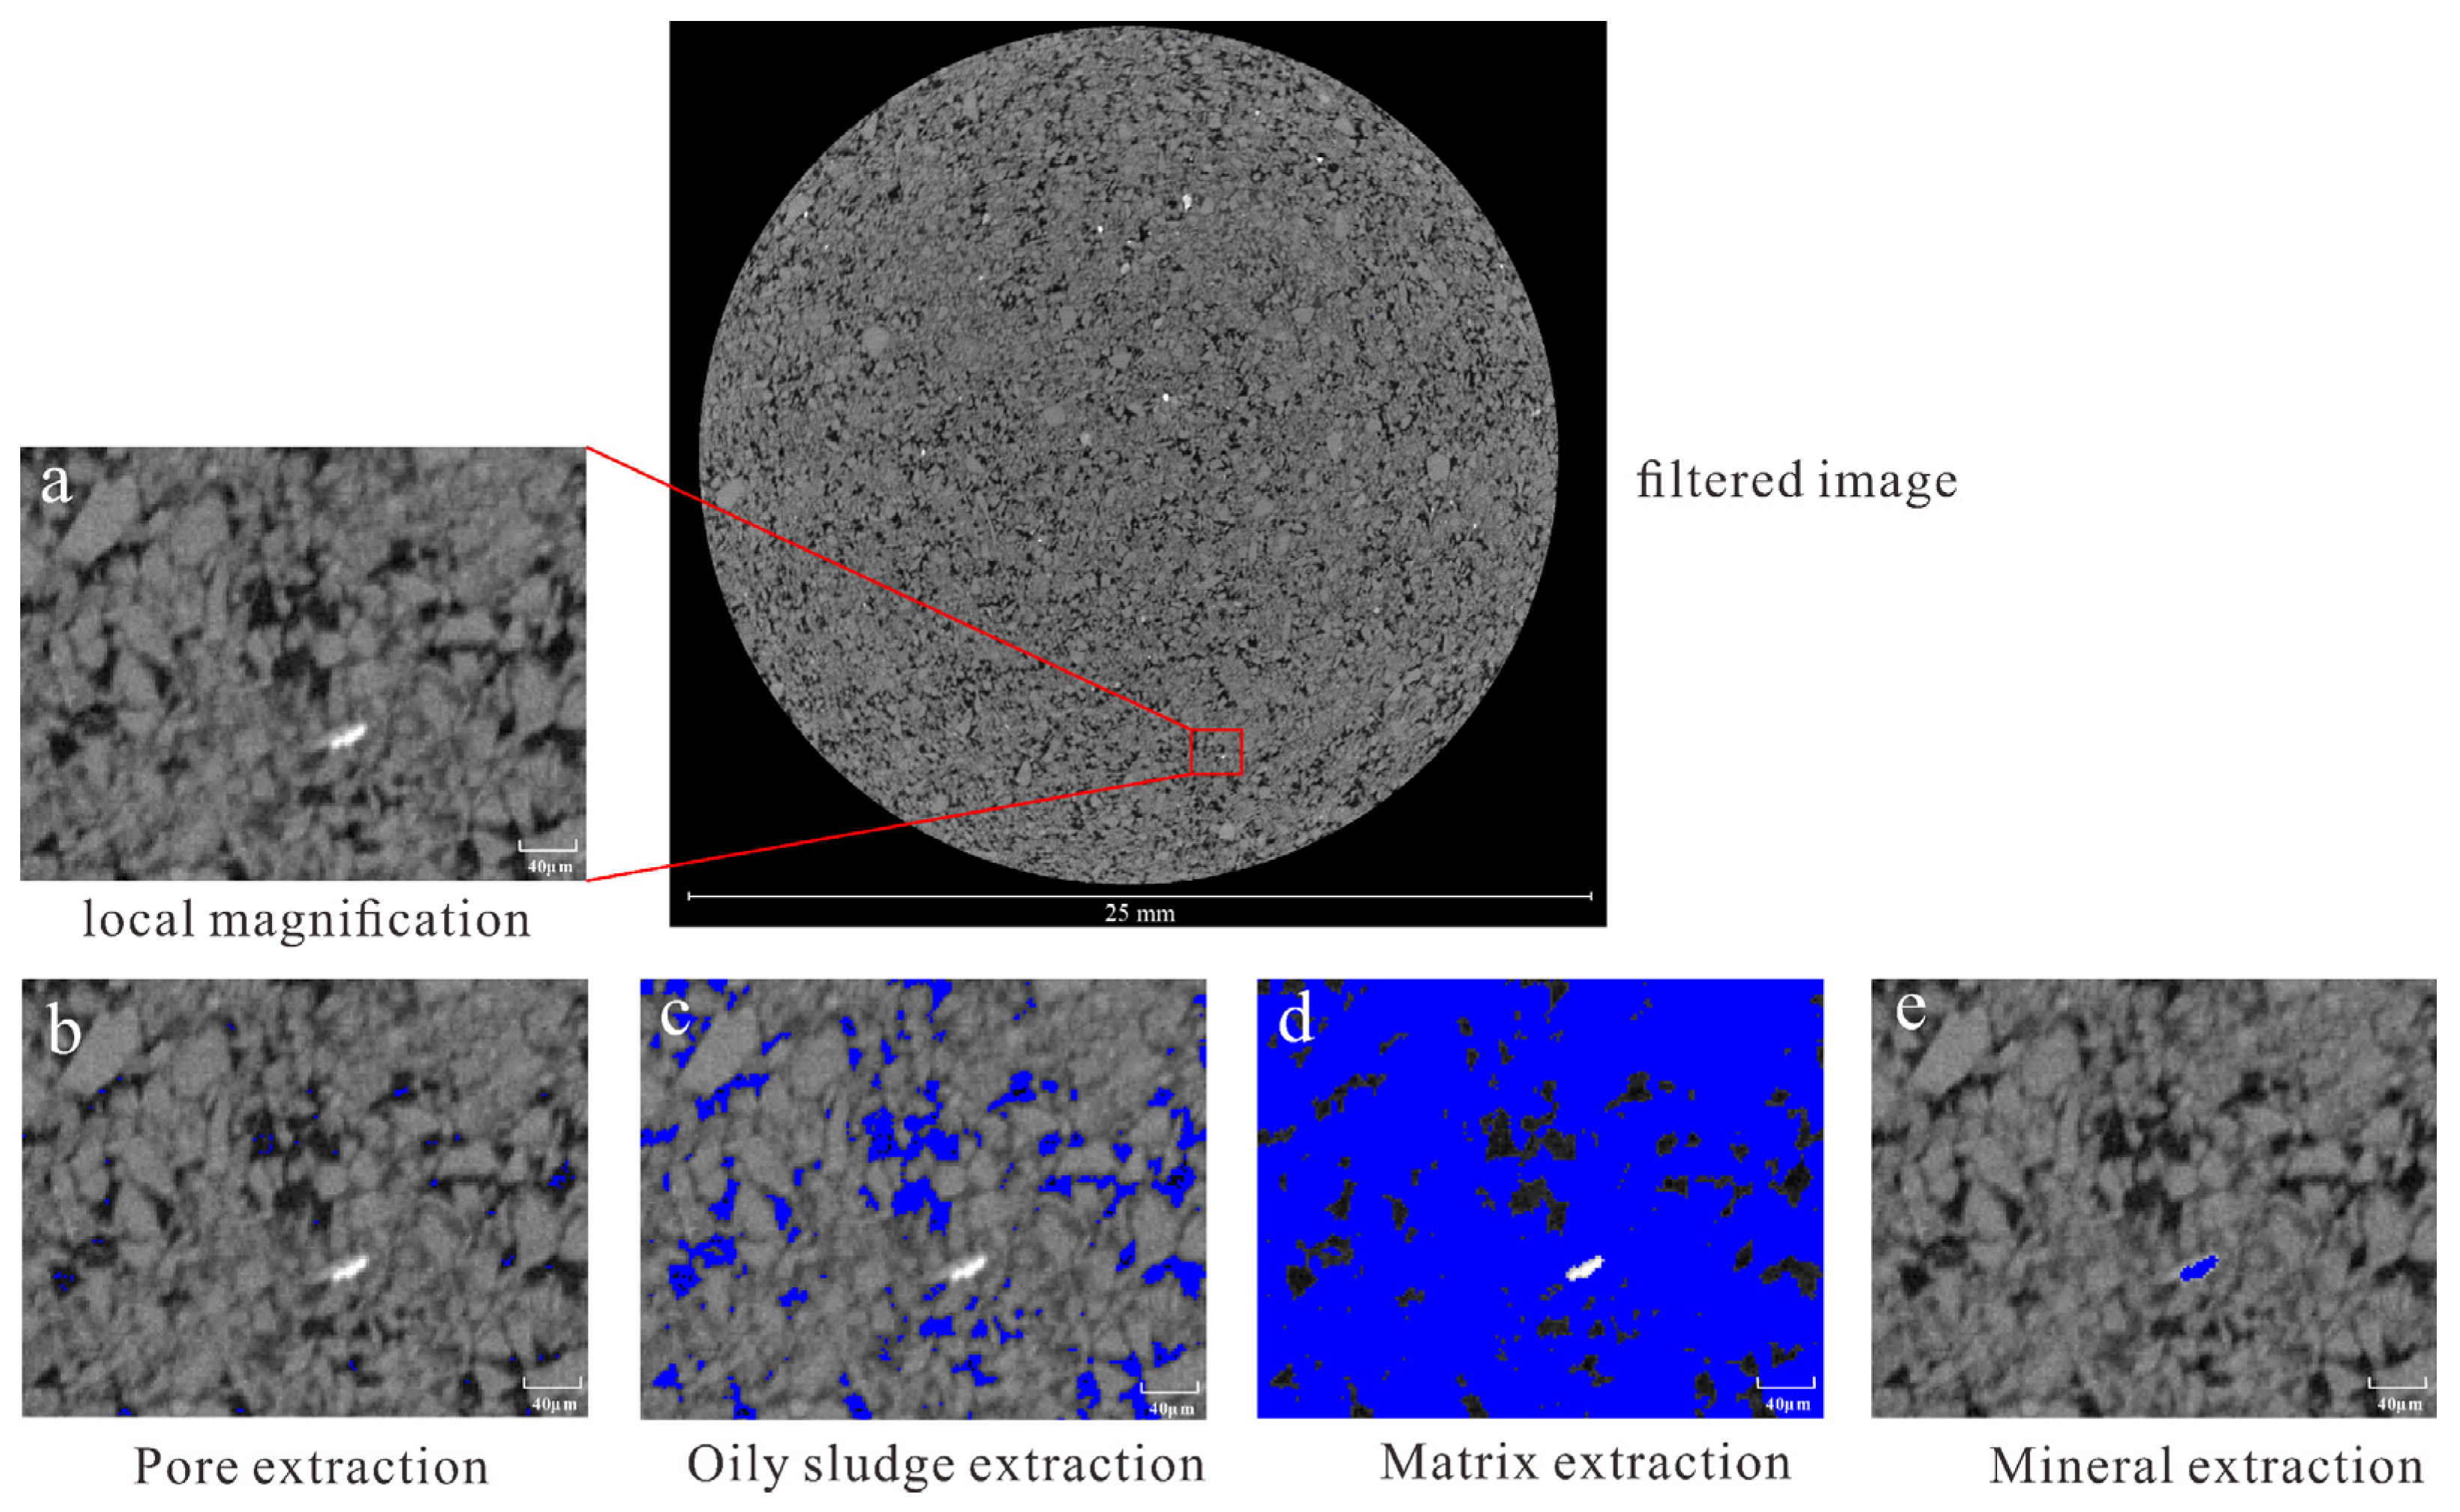
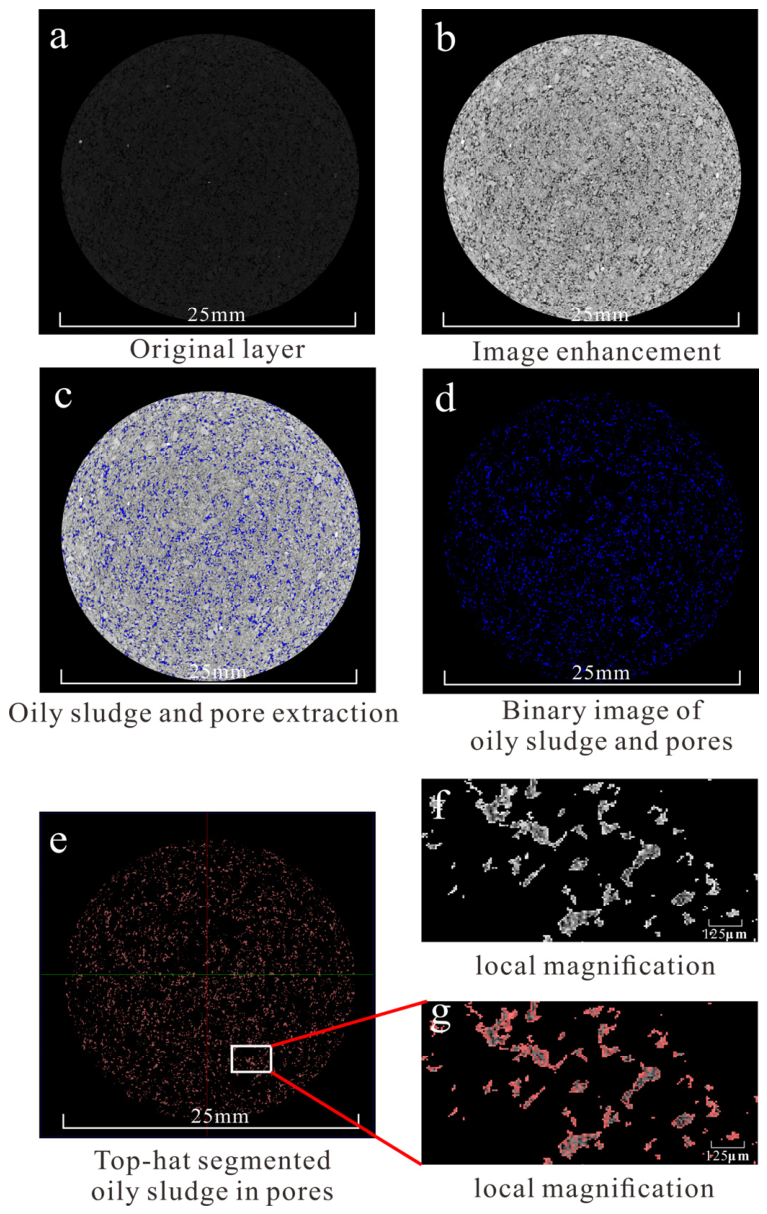
The threshold segmentation process of digital core images obtains target extraction images with different segmentation effects by setting different threshold values. The threshold segmentation method is applied to the pores of core samples before injection of different types of oily sludge, and this method is suitable for layers where there is a significant grayscale difference between the rock matrix and pores before oily sludge injection. Through experimental comparison after oily sludge injection, the combined method of threshold segmentation and top-hat segmentation is more effective for extracting oily sludge in pores. Top-hat segmentation achieves the extraction of targets at different scales by adjusting the size of structural elements and provides relatively accurate extraction results when there is a significant size difference between macroscopic and microscopic targets [13,15]. As shown in Figure 3, this extraction only uses threshold segmentation to extract oily sludge. It was found that the grayscale values of pores and oily sludge are similar, making them difficult to distinguish during extraction, resulting in either under-extraction of pores or over-extraction of oily sludge. Only the extraction of minerals and matrix is relatively accurate.
Figure 4 shows the extraction process using threshold segmentation followed by top-hat segmentation. Figure 4b is the layer after image enhancement. Figure 4c presents the overall extraction process of oily sludge and pores. Figure 4d is the binary image of pores containing oily sludge. Figure 4e shows the oily sludge extraction from pore regions containing only oily sludge using the top-hat segmentation method. A 3D white top-hat transform is performed on this layer with the radius of the structural element set to 5. The structural element is spherical in shape. From the local magnified view in Figure 4f, it can be clearly observed that the oily sludge particles in the image appear distinctly white at this time. By adopting the method of threshold segmentation followed by top-hat segmentation to extract oily sludge from sandstone cores, higher-quality binary images of oily sludge can be obtained.

3. Experimental Results and Analysis

3.1. Qualitative and Quantitative Analysis of CT Images Before and After Oily Sludge Injection

3.1.1. Qualitative Analysis of CT Images After Oily Sludge Injection

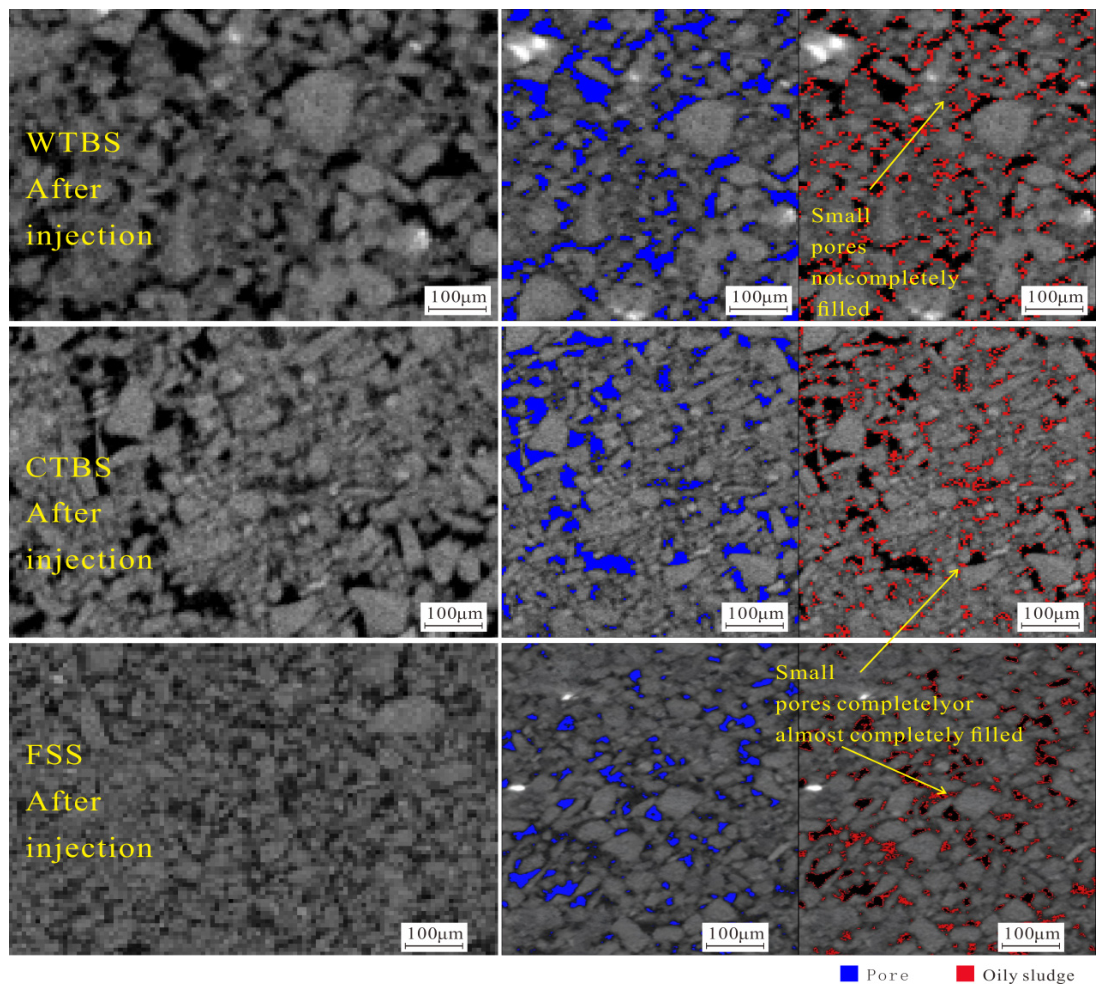
The gray level of CT images reflects the density change inside the core: the area with a high gray level has high density, representing the sandstone core matrix; the area with a low gray level has low density, representing the pore-fracture structure [16]. In CT scanning images, oily sludge presents pixel characteristics with a lower gray value than the core matrix. Pore and oily sludge extraction were performed on the core slice images after injection of the three types of oily sludge, respectively, with blue representing extracted pores and red representing extracted oily sludge (Figure 5). It can be seen from the figure that after WTBS is injected into the core, the sludge is mostly distributed intermittently and uniformly around large pores and does not completely fill small pores, showing relatively uniform deposition of solid particles, indicating that WTBS is difficult to retain in the core pores after injection. Through pore extraction, it is found that the distribution of large pores and small pores is relatively uniform, and the number is almost equal. After CTBS and FSS are injected into the core, the sludge is also intermittently and uniformly distributed around large pores, but it completely or almost fills the small pores and also completely blocks the throats between some pores. In addition, after pore extraction, it is found that the number of large pores is more than that of small pores.

3.1.2. 3D Visualized Quantitative Characterization of Oily Sludge

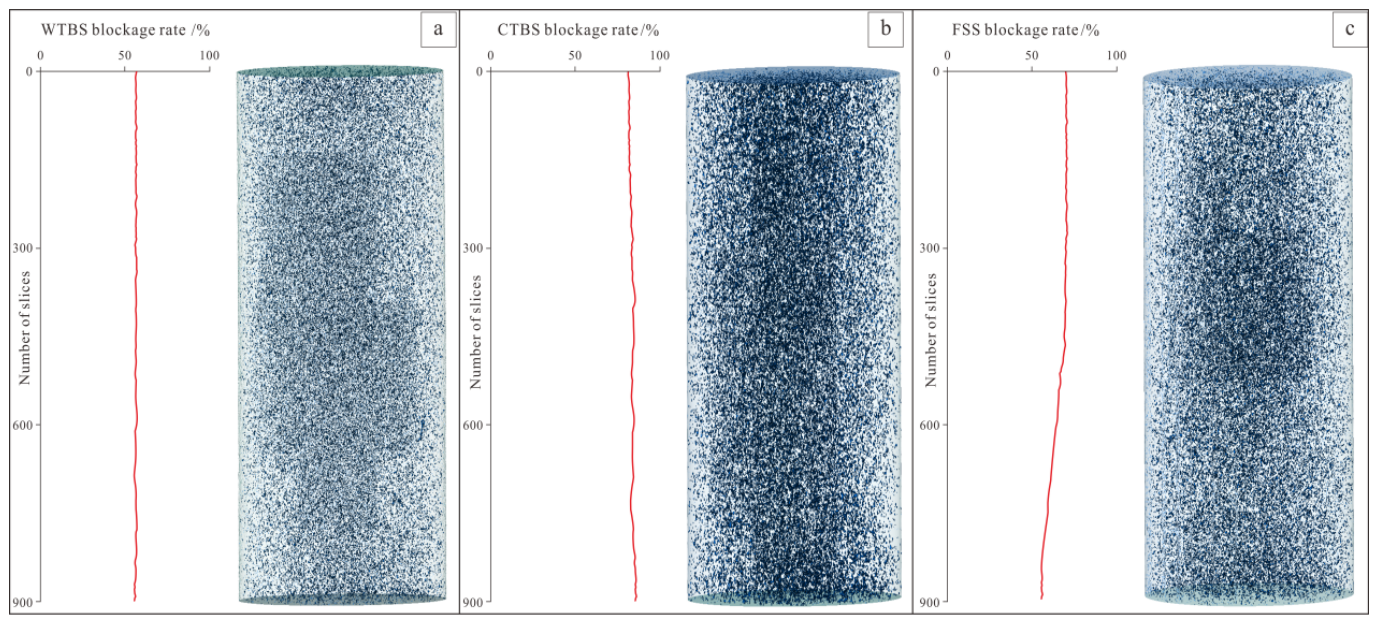
Through extraction using the combined threshold segmentation and top-hat segmentation method, the plugging rates of core samples caused by different types of oily sludge were calculated, and three-dimensional oily sludge models were obtained (Figure 6). The oily sludge plugging rate is defined as the ratio of the volume of oily sludge segmented and extracted from the post-injection CT images to the total pore volume of the original core. It can be seen from the three-dimensional oily sludge models that the sewage tank bottom sludge causes uniform dispersed plugging of the core, while the crude oil tank bottom sludge causes dense plugging of the core with a high filling degree. The plugging caused by scum sludge is between the two, showing dense plugging in the central part but uniform filling around the core sample, indicating that scum sludge may have a selective plugging ability for the core. In addition, the quantitative results show that the average plugging rates of sewage tank bottom sludge, scum sludge and crude oil tank bottom sludge are 56.75 ± 0.77%, 63.36 ± 0.92% and 79.67 ± 1.25%, respectively. One-way analysis of variance (ANOVA) was used for the overall difference test, and the results showed that there was an extremely significant difference among the three groups of data (p < 0.01). Further pairwise multiple comparisons were carried out by the LSD method, which confirmed that there were significant statistical differences in the degree of reservoir plugging caused by the three types of oily sludge between every two groups, and the overall plugging damage showed a gradient increasing trend.

3.2. Quantitative Changes of Core Pore–Throat Structure Before and After Oily Sludge Injection

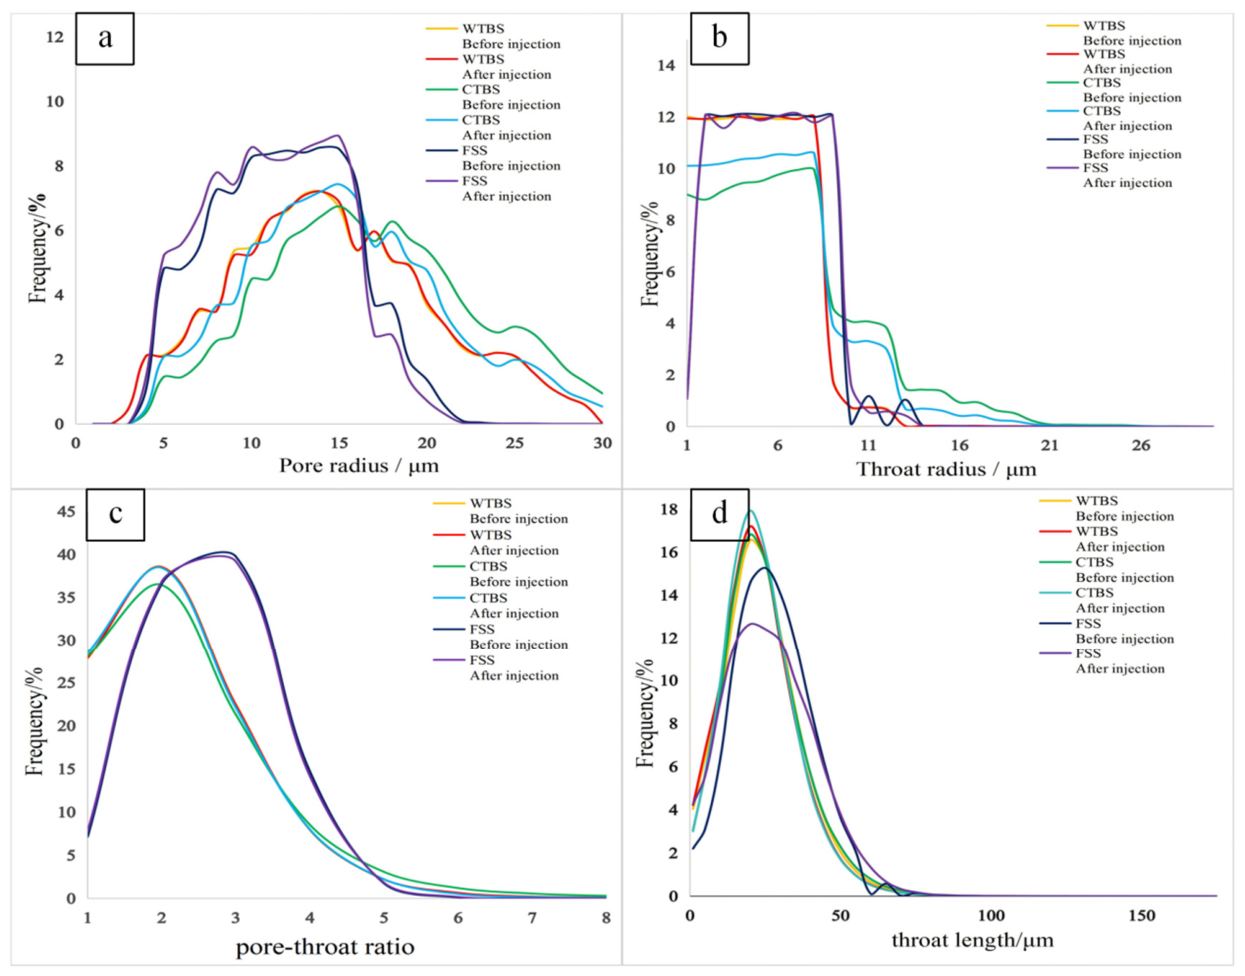
Pores of cores before and after injection of the three types of oily sludge were extracted, and after 3D image processing and model reconstruction, the pore–throat structure parameters of cores before and after injection of the three types of oily sludge were extracted and compared based on the maximum ball algorithm, which is a modeling method for pore network model inside porous media. Relevant parameters including the pore radius, throat radius, throat length, pore–throat ratio and coordination number were calculated [17,18] (Table 2, Figure 7). By comparing the tables of pore–throat structure parameters before and after core injection with different types of oily sludge, it can be seen that there are significant differences in the effects of the three types of sludge on the pore–throat structure. After WTBS injection, only the coordination number shows a significant decrease, while the changes in pore radius and throat radius are not obvious, indicating that it is mainly adsorbed on the pore walls in the form of thin layers and does not cause significant changes in pore–throat size. After CTBS injection, all pore–throat parameters undergo extremely significant changes, with the average throat radius decreasing by 5.36% and the coordination number decreasing by 75%, indicating that it forms continuous plugging bodies and completely destroys the pore–throat connectivity. After FSS injection, the pore radius, throat radius and coordination number all show extremely significant decreases, exhibiting the characteristic of the selective plugging of medium pore throats.
Based on the above parameter variations, the overall damage severity of different oily sludges to core pore–throats is ranked as CTBS > FSS > WTBS. Rich in asphaltene and resin, crude oil tank bottom sludge adsorbs and deposits on pore–throat walls, shrinking the effective flow space, deteriorating the pore network and impairing connectivity. Heavy oil components block throats and form solid fillings inside pores. Floating scum sludge causes moderate yet comprehensive contraction of pore–throats, consistent with the retention and filling of emulsion droplets and organic flocs. The initial average coordination number reaches 13, reflecting strong core heterogeneity. Partial flow paths are cut off after sludge injection. Pore–throat parameters change slightly after injection of wastewater tank bottom sludge, which induces uniform damage. Fine particles evenly plug a small number of pore–throats. The average coordination number drops from 4 to 3.5, indicating uniform plugging without collapse of the overall network structure.
The microscopic pore structure of a core refers to the size, distribution, geometry, and connectivity of pores and throats, while the size and abundance of pores determine the core’s storage capacity [19,20]. As shown in the pore radius distributions (Figure 7a,b), the pore radii of the three cores are mainly concentrated at 5–25 μm, accounting for 85.73%, and the throat radii are predominantly in the range of 1–11 μm, accounting for 96.45%. Although the average pore radius decreased after sludge injection (Table 2), the overall pore-size distribution remained highly stable in shape (Figure 7a,b). In contrast, sludge injection altered the throat distribution far more significantly than the pore distribution. After WTBS injection, the throat radius distribution remained nearly unchanged, with particles only adhering to throat surfaces and causing no obvious constriction. After FSS injection, the throat radius distribution shifted slightly leftward, with the peak decreasing to 5–6 μm, indicating selective plugging of partial throats by medium-sized particles. After CTBS injection, the throat radius distribution shifted significantly downward, with a large number of throats completely blocked or nearly constricted to failure.
For both WTBS and CTBS, the pore–throat ratio increased systematically across all pore-size intervals, with a more pronounced rise in large pores. This indicates that both sludges induced preferential throat constriction relative to pores, severely disrupting the coordination of large pore–throat systems. This behavior is consistent with strong asphaltene adsorption in CTBS and particle bridging in WTBS. In contrast, FSS exhibited a distinct response: the pore–throat ratio remained nearly unchanged or slightly decreased in small pores and only increased marginally in large pores. This suggests that emulsion droplets and flocs in FSS readily pass through small throats, with weak adsorption or bridging occurring primarily at large throats, resulting in much weaker overall disruption of pore–throat coordination. Changes in throat-length distributions further confirm the three damage patterns from a statistical perspective. WTBS caused uniform plugging of some throats, leaving the remaining effective throat network slightly longer and more homogeneous. CTBS induced throat constriction and pore segmentation, increasing the number of short throats while retaining some long throats, leading to significant broadening and rightward shift of the distribution, which reflects the depth of structural damage. FSS showed intermediate effects, with moderate distribution broadening. Although the average throat length decreased slightly (Table 2), the peak of the throat-length distribution shifted slightly rightward (Figure 7d). This phenomenon reveals the complexity of damage: the decrease in average length reflects overall throat constriction, while the rightward shift indicates that many short or medium throats were inactivated, leaving relatively longer throats to dominate the effective network. Among the three sludges, CTBS caused the most significant distribution broadening (peak height decreased by 1.3%), consistent with pore segmentation and new short-throat formation due to asphaltene filling, while WTBS slightly increased distribution concentration, supporting the pattern of weak structural modification.

3.3. Changes in Core Permeability Before and After Oily Sludge Injection

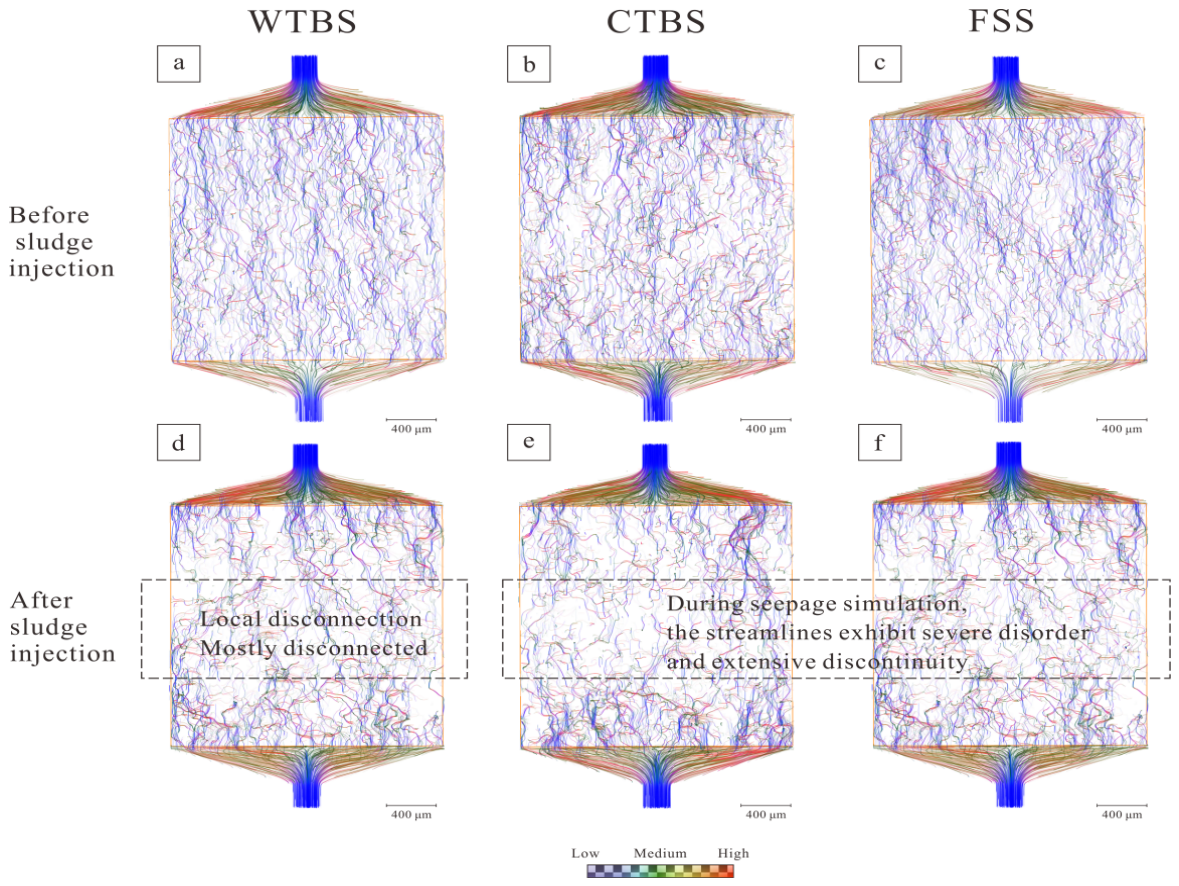
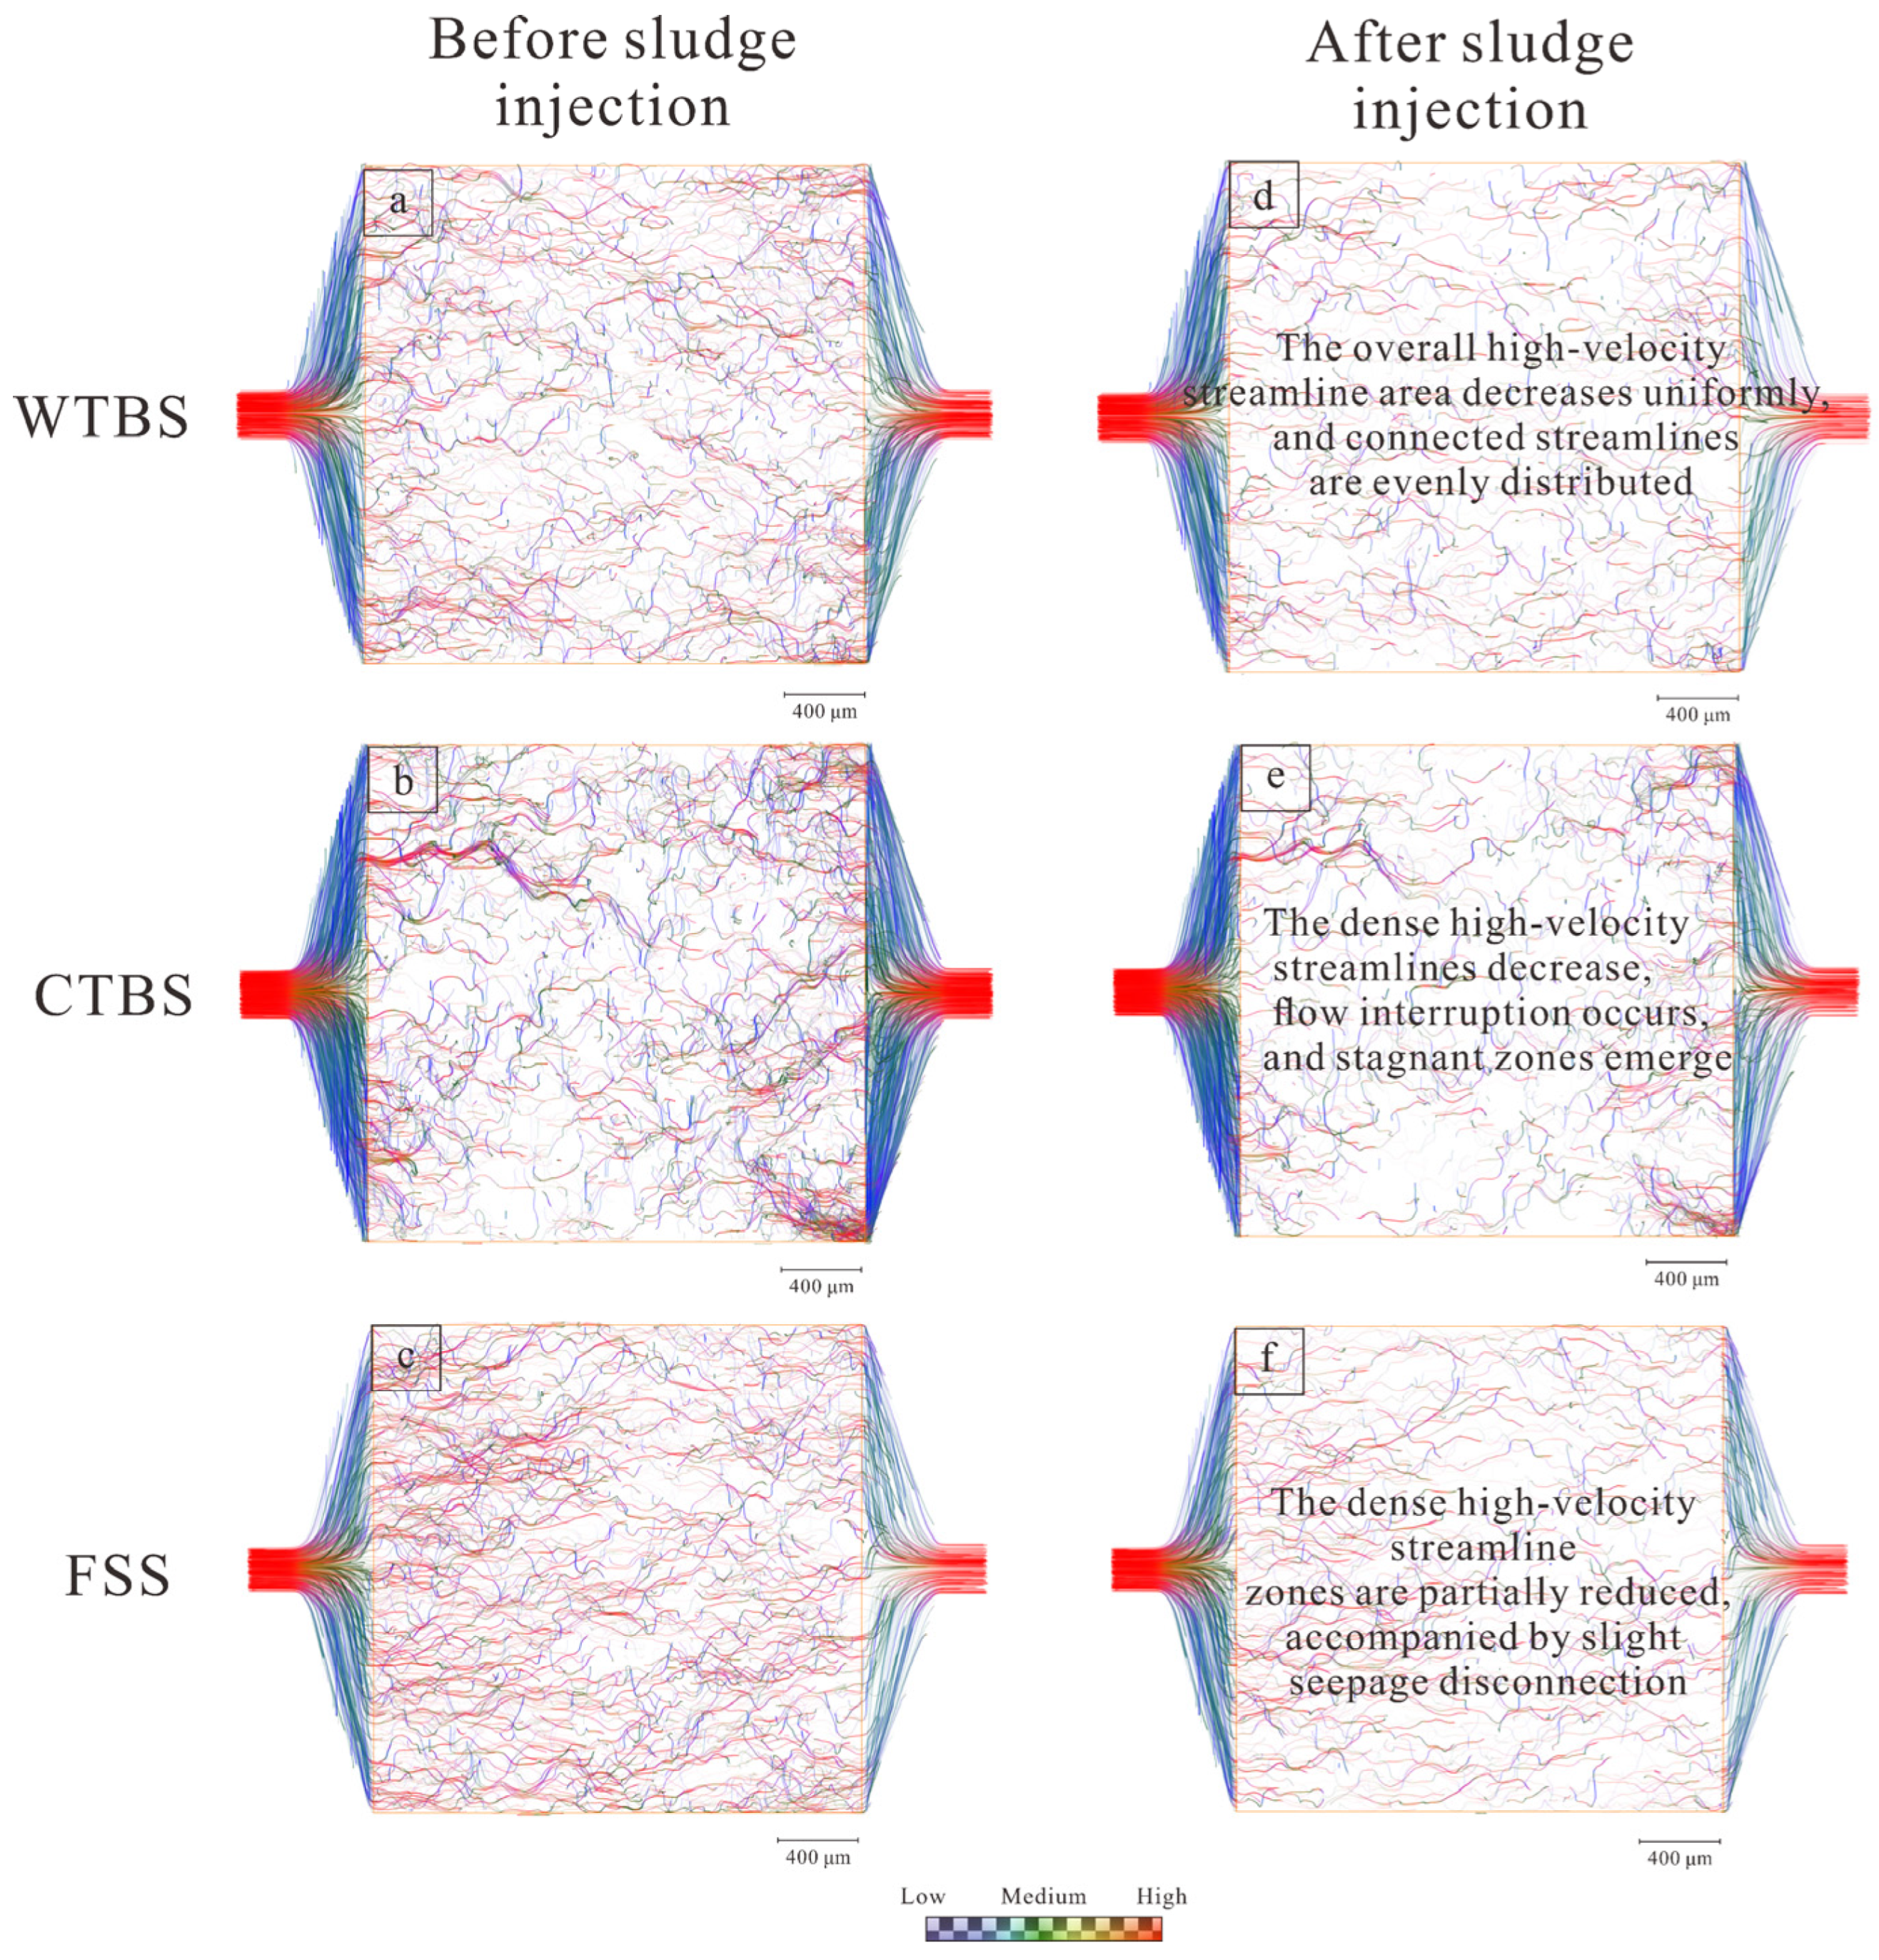
The pore structure of the reservoir directly affects the physical properties of the reservoir. The differences in the development characteristics and connectivity of the pore–throat structure will lead to different forms of reservoir seepage, thus affecting the seepage capacity of the reservoir. The pore structure model of a digital core represents the real complex pore space of porous media with a spatial network composed of simple geometric bodies. This model discretizes the continuous pore space into a spatial network formed by the interconnection of spherical pores and cylindrical throats, so as to characterize the pore and throat systems of real media respectively. With the help of the quasi-static flow model, the fluid flow in such a simplified network can be simulated, so as to reveal the microscopic seepage law in the corresponding real porous media [21,22,23]. The seepage velocity diagrams of cores before and after injection of different oily sludges were extracted (Figure 6). The seepage velocity maps extracted before and after the injection of different types of oily sludge into cores can serve as dynamic visual evidence for the mechanism of core damage caused by oily sludge. Figure 8 and Figure 9 show the distribution of seepage streamlines in the vertical and horizontal directions of the cores before and after the injection of different types of oily sludge. Table 3 Numerical Variations of Average Core Porosity and Permeability Before and After Injection of Different Types of Oil Sludge. Panels a, b, and c in both figures represent the seepage streamlines of the cores before the injection of the three types of sludge, while panels d, e, and f correspond to the seepage streamlines after sludge injection. Red indicates high flow velocity, green indicates medium flow velocity, and purple indicates low flow velocity or stagnant zones. It can be clearly observed that, before the injection of the three types of oily sludge, the seepage streamlines are continuous, uniform, and smooth, with the network distributed throughout the entire visible area. Red and green streamlines are dominant, indicating that the original cores have good connectivity and high effective permeability. Before injection, the streamlines of the three types of cores are uniformly distributed with good pore–throat connectivity. After injection, the three types of sludge exhibit significantly different seepage responses. After WTBS injection, the streamline density decreases uniformly with only local discontinuities, resulting in a small permeability loss. After CTBS injection, the streamlines are severely disordered, large-area stagnant zones appear, most of the pore–throat connectivity is destroyed, and the permeability loss reaches as high as 30.1%. After FSS injection, the area of high-velocity streamlines is partially reduced, showing the characteristics of selective plugging.

3.4. Pore–Throat Blockage Modes of Oil Layers Before and After Oily Sludge Injection

Changes in Total Pore–Throat Volume Before and After Injection

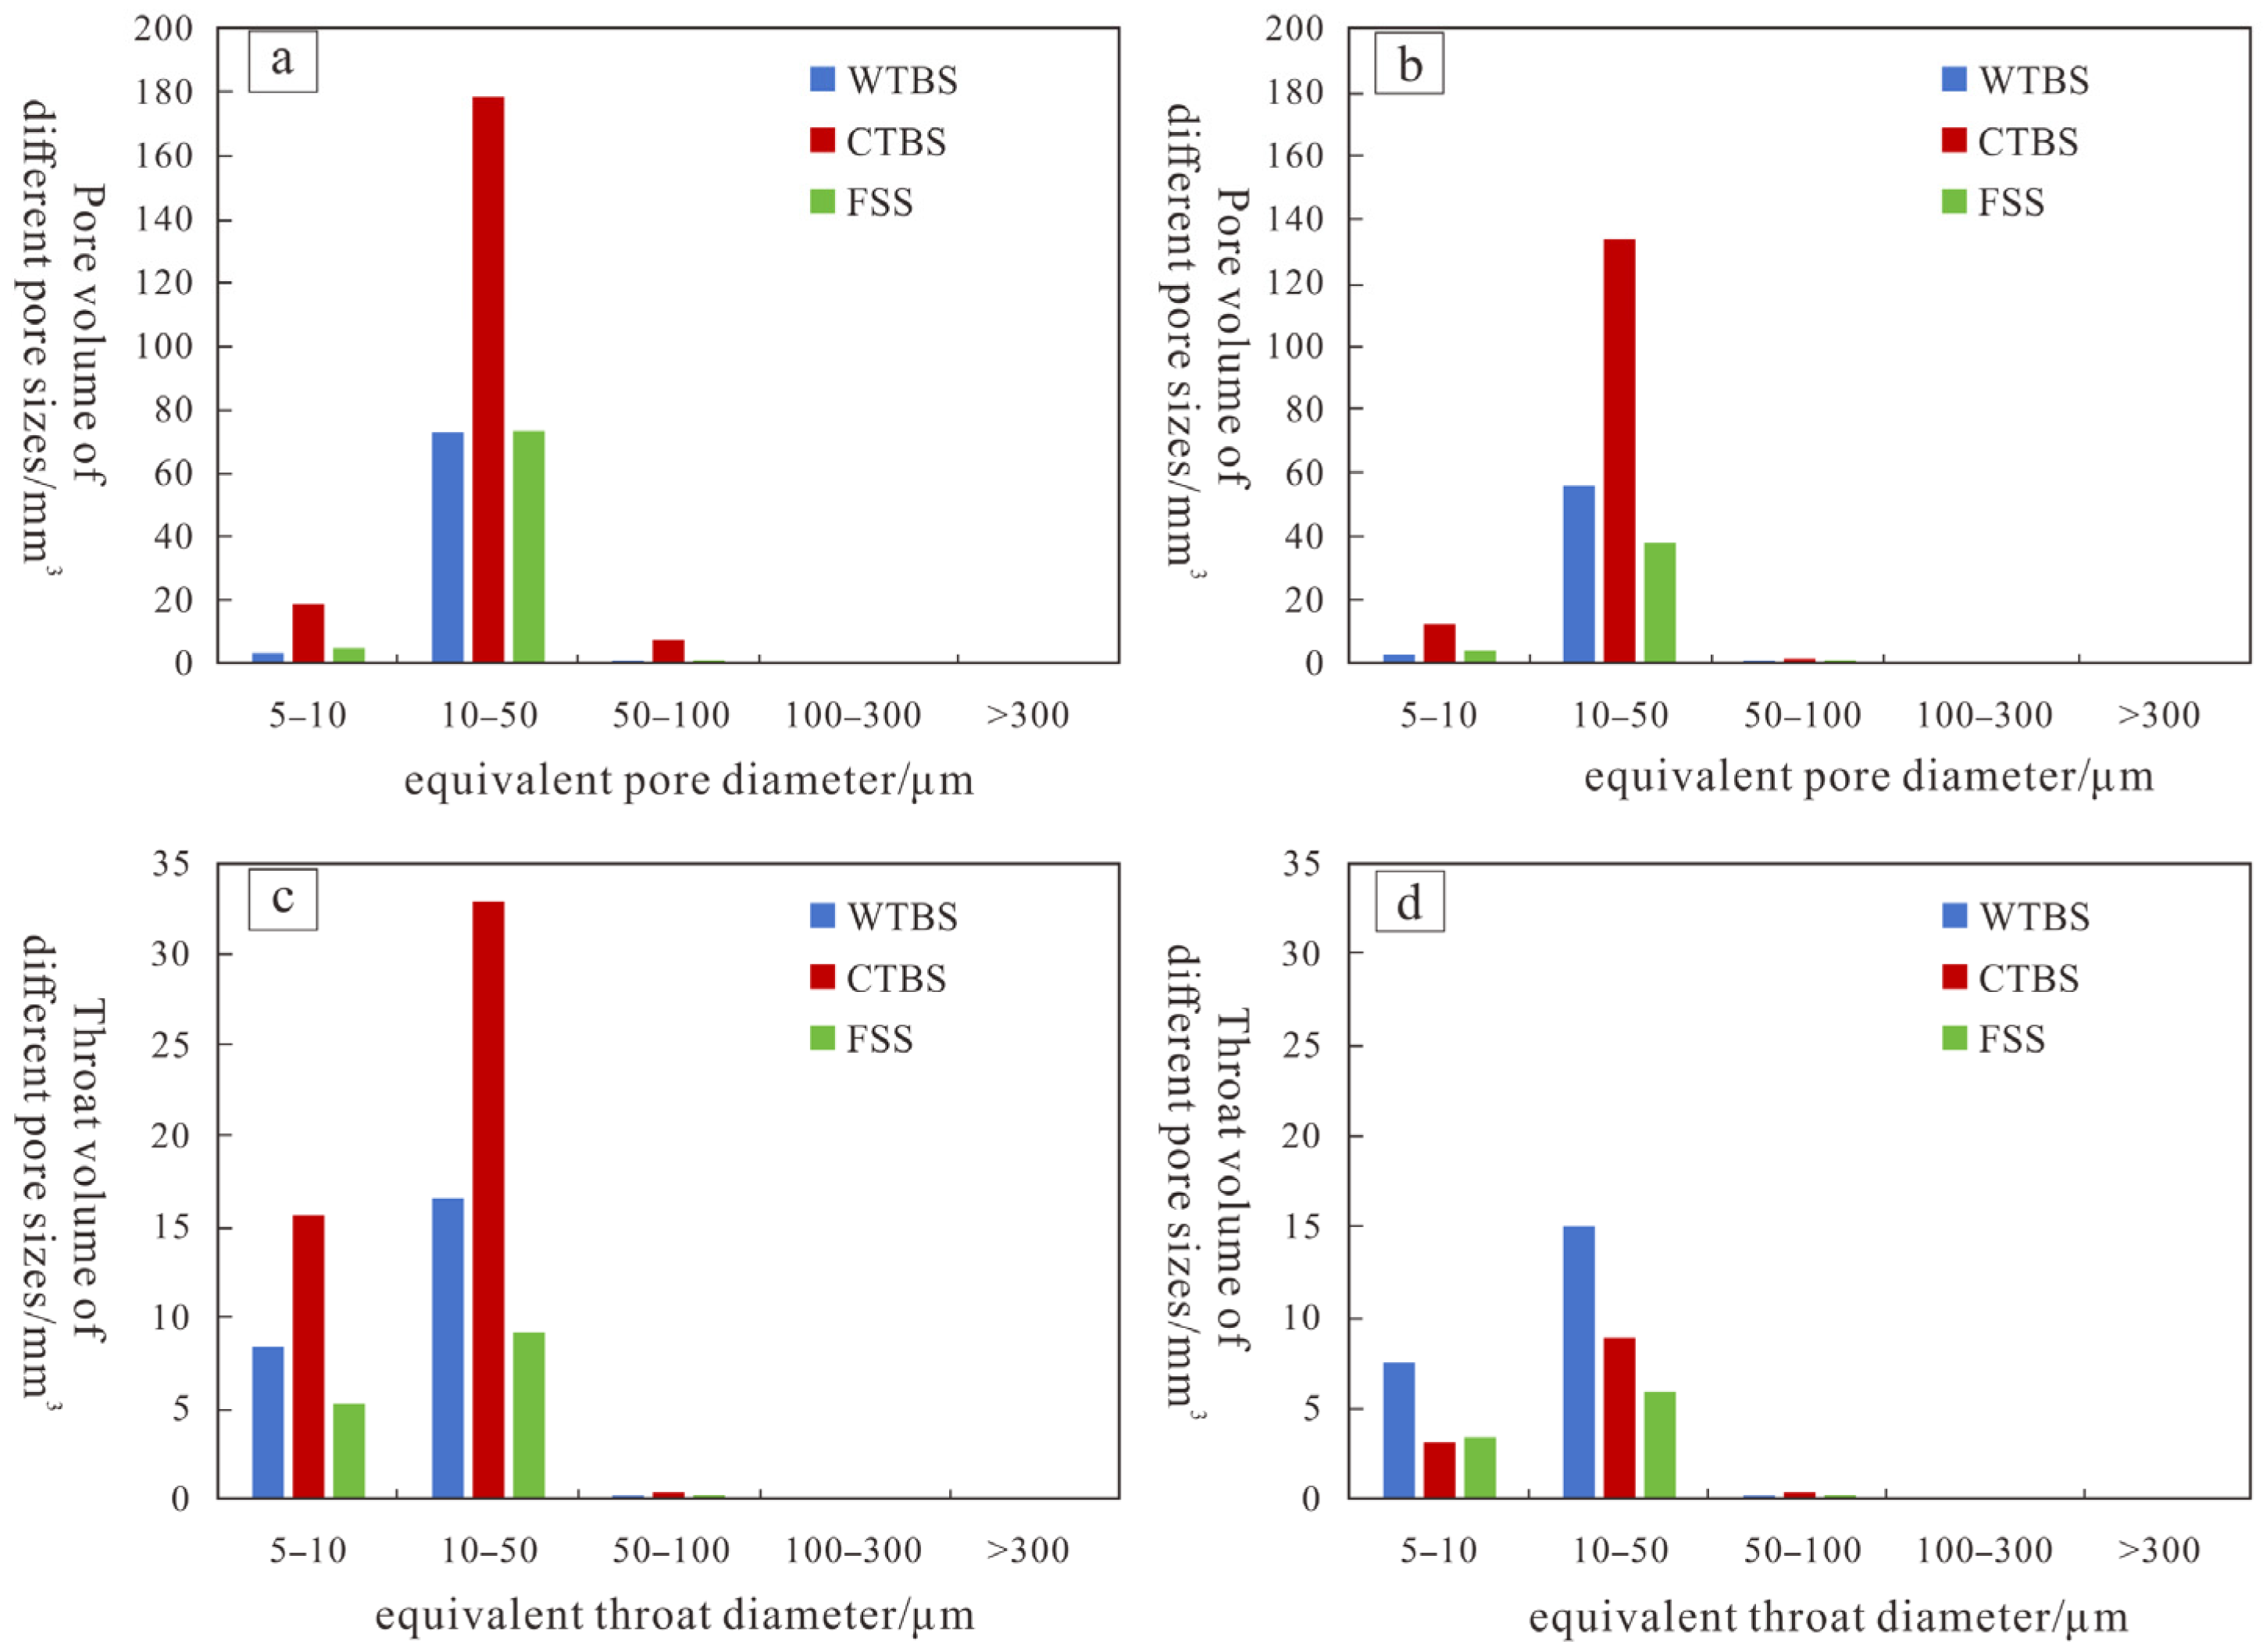
The total volume of pores and throats with different equivalent diameters of cores before and after injection of the three types of oily sludge was counted (Table 4, Figure 10). The changes in pore volume and throat volume before and after injection under different equivalent diameters can more intuitively and clearly show the blockage mechanism of the three types of oily sludge.
Through comparison, it is found that CTBS causes the most serious loss of pore–throat volume, especially for the throat volume, which is related to its asphaltene component. Asphaltenes are strongly adsorbed and deposited on the throat and pore wall and capture particles, resulting in a sharp shrinkage of the cross-sectional area of the effective seepage channel (i.e., throat). The loss of pore volume and throat volume caused by WTBS is relatively uniform, showing a synchronous and proportional decrease, which indicates that it is through a large number of dispersed uniform blockages. Although these blockages change the total volume, they do not significantly change the average size of the remaining connected pore–throats. The loss of total pore–throat volume caused by FSS is also relatively significant, and the damage may mainly come from the temporary retention of emulsion droplets, as well as the adsorption of solid particles and organic matter films. These particles or effects can effectively reduce the flow space and cause rigid loss to the pore volume.

4. Quantitative Discrimination and Plane Simulation of Oily Sludge Plugging Pattern

4.1. Dimensionless Parameters of the Discrimination Phase Diagram for Oil Sludge Plugging Modes

Plane Display of Microscopic Modes of Oily Sludge Blockage

To quantitatively characterize the intrinsic relationship between oily sludge plugging patterns and sludge properties, two parameters are established based on the experimental data in this study.
(1) Particle–throat diameter ratio (λ), defined as the ratio of the sludge median particle size (d50) to the core average throat radius (dt). A larger value indicates a higher tendency of particles to form bridging plugging at throats.
λ = d 50 d t
(2) Coordination number retention rate (C), defined as the ratio of post-injection coordination number to pre-injection coordination number, which quantifies the retained pore–throat connectivity. A smaller value represents more severe structural damage.
C = C N a f t e r C N b e f o r e
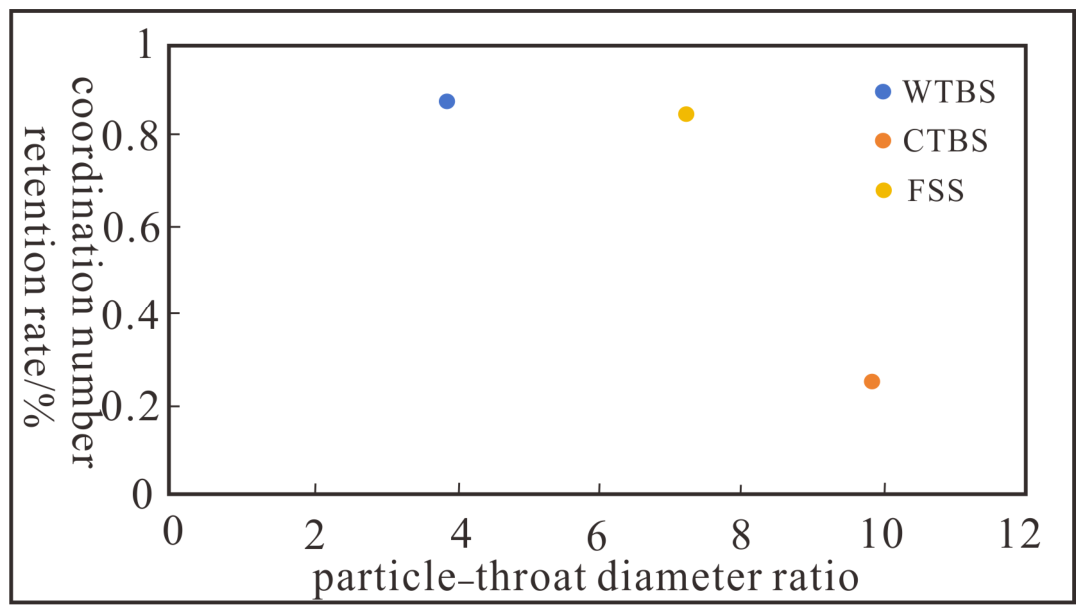
A phase diagram for oily sludge plugging pattern discrimination is constructed using the calculated values (Figure 11). When λ < 5, and C > 0.8, the sludge belongs to the uniform filling type. When 5 < λ < 9, and C > 0.8, it is classified as a selective local filling type. When λ > 9, and C < 0.5, the filling pattern is a structural damage type.

4.2. Plane Simulation Demonstration of Microscopic Oily Sludge Plugging Mode

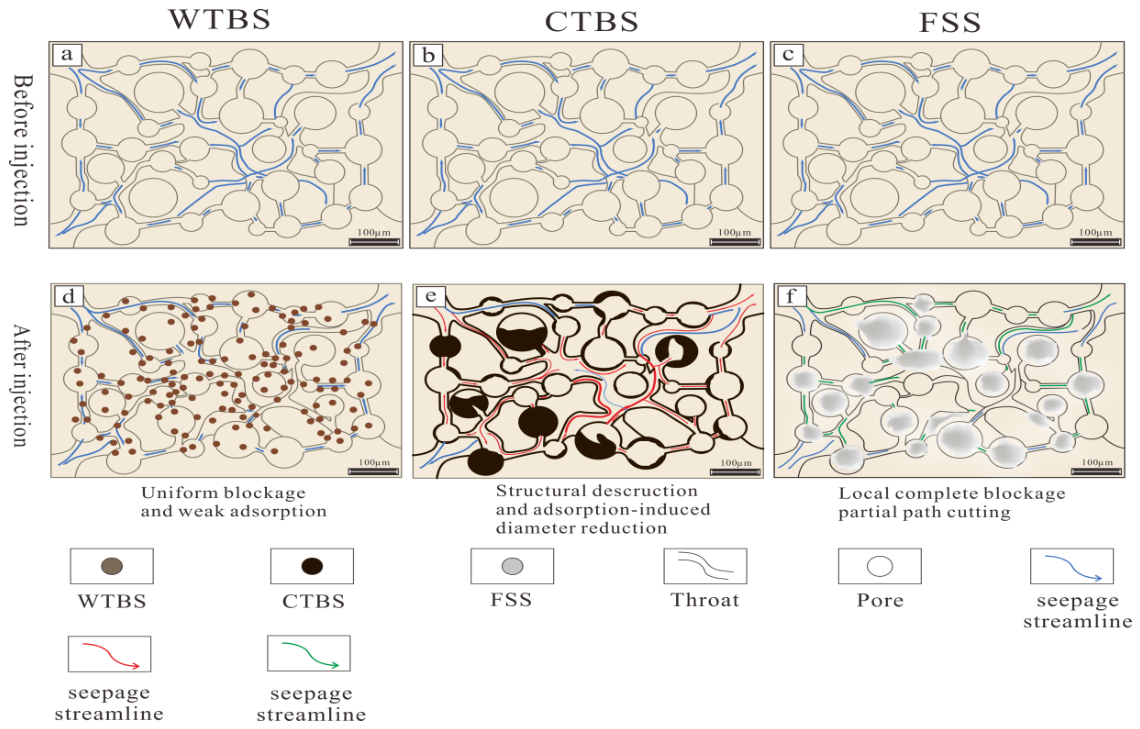
Based on the above inferences, the plane diagrams of microscopic blockage modes of different oily sludges were drawn (Figure 12). Figure 8a–c show the original core pores before sludge injection, and the blue arrows represent the seepage direction. Figure 8d shows the pore blockage mode after WTBS injection into the core, and the small solid brown circles represent oily sludge. It can be seen that WTBS is uniformly stuck in the throats or blocked at the connection between pores and throats. Due to the uniform weak filling of WTBS, the overall network morphology remains basically unchanged, but parts of the paths are cut off. The streamlines are interrupted and detoured at the blocking points, and the overall streamline density decreases slightly.
Figure 8e shows the pore blockage mode after CTBS injection into the core. It can be seen that a thin black layer covers the inner walls of all pores and throats, representing asphaltene/resin adsorption, and thick and irregular black fillers are formed in some pores, representing the adsorption-induced diameter reduction and structural destruction of CTBS. In this blockage mode, the throats are significantly narrowed due to the adsorption layer, many throats are almost closed, the seepage streamlines are sparse, and there are concentrated red high-velocity streamlines (channeling).
Figure 8f represents the blockage mode after FSS injection into the core. The throats and pores are locally filled with light gray flocculent clouds, representing organic flocs or emulsion droplets. In this mode, the size of pores and throats is uniformly slightly reduced. Due to local overall filling, the streamlines are sparse, the streamline color is green or purple (medium and low velocity), the streamlines are twisted, and the overall performance is local complete blockage and weak adsorption.

5. Conclusions

Based on micro-CT scanning and digital core technology, this study systematically reveals the microscopic plugging mechanism, pore–throat evolution law and seepage damage differences of three typical oily sludges in oil reservoirs. The main conclusions are drawn as follows:
  • The variations in pore size after sludge injection essentially result from the interaction between sludge compositions, including the solid particle size, viscosity and organic matter content, and the reservoir pore–throat structure such as the throat dimension and connectivity.
  • The particle–throat diameter ratio (λ) and coordination number retention rate (C) serve as core dimensionless parameters governing plugging types. The uniform filling type corresponds to WTBS when λ < 5 and C > 0.8; the selective plugging type belongs to FSS when 5 < λ < 9 and C > 0.8; and the structural damage type is CTBS when λ > 9 and C < 0.5. All three sludges preferentially block pore throats ranging from 10 to 50 μm with obvious discrepancies in damage degree and mechanism. The plugging intensity ranks as crude oil tank bottom sludge > floating scum sludge > wastewater tank bottom sludge.
  • With fine particles and low viscosity, wastewater tank bottom sludge hardly retains inside pore networks, leading to slight overall changes in the pore–throat parameters and volume. It causes uniform pore–throat damage via homogeneous filling and presents a mild reservoir modification effect. Crude oil tank bottom sludge features organic adsorption and moderate viscosity. It fills pores and alters wettability, triggering the structural destruction of pore throats. Its damage mode is intense adsorption and preferential throat closure, which uniformly shrinks the pore size and impairs the inter-pore connectivity. Floating scum sludge contains abundant solid particles and high viscosity. It changes the pore size through bridging plugging and segmentation, resulting in the systematic deterioration of pore–throats with selective plugging characteristic.

Author Contributions

Methodology, W.H.; Validation, P.H., C.W. and S.L.; Formal analysis, T.L.; Investigation, H.C.; Resources, C.Y.; Data curation, Y.W.; Writing—original draft, Y.W.; Funding acquisition, C.Y. All authors have read and agreed to the published version of the manuscript.

Funding

This research was funded by the Exploration and Development Research Institute, Liaohe Oilfield Company, PetroChina, grant number LHYT-KTKFYJY-2025-CL-10309.

Data Availability Statement

The original contributions presented in this study are included in the article. Further inquiries can be directed to the corresponding author.

Conflicts of Interest

Author Can Yang was employed by the Exploration and Development Research Institute, Liaohe Oilfield Company, PetroChina. Authors Hua Chai, Ping He, Chenglin Wang and Su Lyu were employed by the Wuhan Zhongwang Yineng Technology Development Co., Ltd. The remaining authors declare that the research was conducted in the absence of any commercial or financial relationships that could be construed as a potential conflict of interest. The Liaohe Oilfield Company, PetroChina and Wuhan Zhongwang Yineng Technology Development Co., Ltd. had no role in the design of the study; in the collection, analyses, or interpretation of data; in the writing of the manuscript, or in the decision to publish the results.

References

  1. Ye, R.; Zheng, W.; Shi, B. Research progress and prospect of oily sludge treatment technology. Chem. Eng. Oil Gas 2025, 54, 138–145. [Google Scholar] [CrossRef]
  2. Lin, D.Q.; Qiu, K.Q. Vacuum thermal cracking of oily sludge. J. Cent. South Univ. (Sci. Technol.) 2012, 43, 1239–1243. [Google Scholar]
  3. Wang, Q.; Yang, S.; Bai, J.; Zhao, W.; Li, J.; Chen, H. Effects of pore-throat structure on petrophysical properties of reservoir rocks during CO2 flooding. Acta Pet. Sin. 2021, 42, 654–668, 685. [Google Scholar] [CrossRef]
  4. Chang, H.; Yu, C.T.; Wang, B.K. Preparation of oilfield profile control agent from oily sludge. Environ. Prot. Chem. Ind. 2014, 34, 161–165. [Google Scholar]
  5. Wu, J.M.; Liu, J.J.; Wang, H.Z.; Duan, Q.F.; Han, H.L.; Li, X.M. Research and application of oily sludge profile control technology in Huoshan Oilfield. Pet. Nat. Gas Chem. 2020, 49, 87–91. [Google Scholar] [CrossRef]
  6. Teng, L.Y.; Song, H.; Jiang, Z.B.; Zhou, Y.; Zhong, L. Migration law of oily sludge in formation. Spec. Oil Gas Reserv. 2018, 25, 159–164. [Google Scholar]
  7. Hu, B.; Pu, J.; Gou, F.F. Quantitative characterization of microscopic pore-throat structure of tight sandstone based on digital core. Pet. Geol. Recovery Effic. 2022, 29, 102–112. [Google Scholar]
  8. Zhu, R.K.; Wu, S.T.; Su, L.; Cui, J.; Mao, Z.; Zhang, X. Key issues and future development of pore structure characterization for tight reservoirs in China. Acta Pet. Sin. 2016, 37, 1323–1336. [Google Scholar]
  9. Huang, X.S.; Luo, C.F.; Zhang, Q.; Chen, J.D.; Zhang, Y.Y.; Liu, X.W. Key technologies and application of micro-CT experiment in petroleum exploration. Pet. Geol. Exp. 2025, 47, 659–670. [Google Scholar]
  10. Shao, G.Y.; Xiong, W.; Shen, R.; Yang, Y.; Shang, Z.H.; Wang, G.D.; Yu, H. Application progress of CT scanning technology in microscopic structure characterization of shale oil and gas reservoirs. Appl. Chem. Ind. 2023, 52, 1785–1789, 1799. [Google Scholar]
  11. Zhang, W.; Liang, X.L.; Tang, X.Y.; Shi, B.; Xu, Y.D.; Xiao, R. Fine characterization of spatial pore structure of Nanjing silty sand by micro-CT scanning. Chin. J. Geotech. Eng. 2017, 39, 683–689. [Google Scholar]
  12. Zhu, H.X.; Zhang, Y.Z. Research progress of rock CT image processing. Prog. Geophys. 2025, 40, 1954–1976. [Google Scholar]
  13. Duan, J.M.; Zhan, Y.C.; Liu, G.Y. Three-lane detection method based on TopHat segmentation and curve model. J. Beijing Univ. Technol. 2016, 42, 1174–1181. [Google Scholar]
  14. Zhao, J.P.; Cui, L.K.; Chen, H.; Li, N.; Wang, Z.L.; Ma, Y.; Du, G. Quantitative characterization method of rock microstructure based on CT scanning digital core. Geoscience 2020, 34, 1205–1213. [Google Scholar]
  15. Wu, F.; Chen, X.W.; Zhao, H.; Wang, J.; Zhang, X.; Li, Y. Multi-scale fracture extraction method of core based on CT scanning and image processing technology. Pet. Geol. Exp. 2025, 47, 882–894. [Google Scholar]
  16. Wang, G.; Chen, X.C.; Han, D.Y.; Qin, X.J.; Feng, J. Threshold segmentation algorithm of coal CT image based on improved Otsu method. Coal Sci. Technol. 2021, 49, 264–271. [Google Scholar]
  17. Wang, H.M. Fractal Characteristics and Network Model of Pore Structure in Porous Media. Master’s Thesis, Dalian University of Technology, Dalian, China, 2013. [Google Scholar]
  18. Xie, Z.Y.; Zhang, W.; Yao, D.Y.; Shi, B. Quantitative characterization of soil spatial pore network based on maximal ball algorithm. J. Eng. Geol. 2020, 28, 60–68. [Google Scholar]
  19. Zhang, Y.H.; Ren, D.Z.; Sun, Z.; Zhang, H.T.; Zhao, M.Y.; Cao, L.X.; Zhang, D.L. Multi-scale joint characterization of pore structure of Chang 6 tight sandstone in Wuqi area. Geoscience, 2026; in press.
  20. Wang, M.Y.; Li, Y.; Wu, K.L.; Chen, Z.X.; Li, J.; Feng, D.; Zhu, Q.Y.; Guo, S.Q. Quantitative characterization of microscopic pore structure and oil displacement effect evaluation of porous carbonate reservoirs. Pet. Geol. Recovery Effic. 2024, 31, 96–107. [Google Scholar]
  21. Liu, J.Y.; Chen, S.M.; Shen, Z.Y.; Wang, X.Y.; Dong, X.P.; Zhang, W.; Zhu, Y.S. Microscopic pore structure characteristics and its influence on seepage properties: A case study of Chang 6 reservoir in Jiyuan area, Ordos Basin. J. Jilin Univ. (Earth Sci. Ed.) 2025, 55, 1434–1444. [Google Scholar]
  22. Wang, J.C.; Cui, P.X.; Liu, S.S.; Wang, Y.; Li, H.; Zhang, L. Microscopic pore structure characteristics and pore fluid division of shale oil reservoirs. Pet. Geol. Recovery Effic. 2023, 30, 46–54. [Google Scholar]
  23. Yang, P.; Hu, W.S.; Cui, Y.Y.; Chen, H.; Gu, N.L.; Zhao, M. Reservoir characteristics and seepage mechanism of Qing 1 Member in Changling Sag based on multi-scale CT scanning. Fault-Block Oil Gas Field 2025, 32, 211–220. [Google Scholar]
Figure 1. Histogram of particle size distribution range of different types of oily sludge.
Processes 14 01769 g001
Figure 2. Schematic diagram of CT scanner principle.
Processes 14 01769 g002
Figure 3. Samples extracted by threshold segmentation. (a) local magnification; (b) pore extraction; (c) oily sludge extraction; (d) matrix extraction; (e) mineral extraction.
Processes 14 01769 g003
Figure 4. Samples extracted by combined threshold and top-hat segmentation. (a) original layer; (b) image enhancement; (c) oily sludge and pore extraction; (d) binary image of oily sludge and pores; (e) top-hat segmented oily sludge in pores; (f) local magnification; (g) local magnification.
Processes 14 01769 g004
Figure 5. Core slice images, pore extraction and oily sludge extraction images after injection of different types of oily sludge.
Processes 14 01769 g005
Figure 6. Pore blockage rate of different oily sludge on cores and 3D oily sludge models. (a) 3D Model of WTBS; (b) 3D Model of CTBS; (c) 3D Model of FSS.
Processes 14 01769 g006
Figure 7. Probability distribution of pore–throat parameters of cores before and after injection of different types of oily sludge. (a) pore radius distribution frequency; (b) throat radius distribution frequency; (c) pore-throat ratio distribution frequency; (d) throat length distribution frequency.
Processes 14 01769 g007
Figure 8. Simulation diagram of seepage streamlines in Z direction of cores after injection of different oily sludges. (ac) permeability streamlines of original cores; (d) permeability streamlines in cores after WTBS injection; (e) permeability streamlines in cores after CTBS injection; (f) permeability streamlines in cores after FSS injection.
Processes 14 01769 g008
Figure 9. Simulation diagram of seepage streamlines in X direction of cores after injection of different oily sludges. (ac) permeability streamlines of original cores; (d) permeability streamlines in cores after WTBS injection; (e) permeability streamlines in cores after CTBS injection; (f) permeability streamlines in cores after FSS injection.
Processes 14 01769 g009
Figure 10. Histogram of pore and throat volume of cores before and after injection of different oily sludges: (a,c) represent the state before sludge injection, while (b,d) represent the state after sludge injection).
Processes 14 01769 g010
Figure 11. Phase diagram for discrimination of oily sludge plugging patterns.
Processes 14 01769 g011
Figure 12. Microscopic blockage mode diagrams of different oily sludges. (ac) planar microscopic simulation of original cores; (d) planar microscopic simulation of WTBS plugging; (e) planar microscopic simulation of CTBS plugging; (f) planar microscopic simulation of FSS plugging.
Processes 14 01769 g012
Table 1. Component analysis of oily sludge samples.
Sample NameWater Content/%Oil Content/%Shale Content/%
WTBS75.9810.0913.93
CTBS62.6520.4316.92
FSS55.3518.4526.20
Table 2. Pore–throat parameters of cores before and after injection of different types of oily sludge.
Average Pore Radius/μmAverage Throat Radius/μmAverage Throat Length/μmAverage Pore–Throat RatioAverage Coordination Number
Sludge TypesBefore
Injection
After
Injection
Before
Injection
After
Injection
Before
Injection
After
Injection
Before
Injection
After
Injection
Before
Injection
After
Injection
WTBS13.66 ± 0.1213.60 ± 0.115.82 ± 0.085.80 ± 0.0724.74 ± 0.1524.72 ± 0.142.55 ± 0.042.54 ± 0.034 ± 0.223.5 ± 0.18 *
CTBS16.79 ± 0.1815.98 ± 0.15 **6.90 ± 0.106.53 ± 0.09 **26.04 ± 0.1825.41 ± 0.16 **2.72 ± 0.052.53 ± 0.04 **4 ± 0.221 ± 0.15 **
FSS11.29 ± 0.1510.37 ± 0.13 **5.28 ± 0.095.01 ± 0.08 **30.20 ± 0.228.83 ± 0.182.18 ± 0.042.10 ± 0.03 *13 ± 0.8511 ± 0.76 **
Note: Data are presented as mean ± standard deviation (mean ± SD), n = 4 (4 parallel experiments were performed for each type of oily sludge); * indicates a significant difference compared with the values before injection (p < 0.05), and ** indicates an extremely significant difference (p < 0.01).
Table 3. Porosity and permeability changes in cores before and after injection of different types of oily sludge.
Porosity/%Absolute Permeability/mDPermeability Loss Rate/%
Sludge TypesBefore InjectionAfter InjectionBefore InjectionAfter Injection
WTBS28.32 ± 0.2121.85 ± 0.193408.6 ± 3.22687.4 ± 2.721.2 ± 1.5
CTBS29.15 ± 0.2519.23 ± 0.183587.3 ± 3.82509.6 ± 2.130.1 ± 0.95
FSS26.78 ± 0.2220.46 ± 0.203520.5 ± 2.92602.2 ± 1.826.1 ± 2.1
Table 4. Total pore and throat volume of cores with different pore sizes before and after injection of different oily sludges.
WTBSCTBSFSS
Total Pore
Volume/mm3
Total Throat
Volume/mm3
Total Pore
Volume/mm3
Total Throat
Volume/mm3
Total Pore
Volume/mm3
Total Throat
Volume/mm3
Equivalent
Diameter/μm
BeforeAfterBeforeAfterBeforeAfterBeforeAfterBeforeAfterBeforeAfter
5–103.31 2.098.33 7.44 18.82 11.03 15.562.994.76 2.72 5.293.24
10–5073.32 55.8816.6114.82178.69133.1332.938.9273.12 37.269.135.73
50–1001.02 0.210.003 07.141.03 0.33 00.84 0.008 0.003 0
Disclaimer/Publisher’s Note: The statements, opinions and data contained in all publications are solely those of the individual author(s) and contributor(s) and not of MDPI and/or the editor(s). MDPI and/or the editor(s) disclaim responsibility for any injury to people or property resulting from any ideas, methods, instructions or products referred to in the content.