Article

Numerical Simulation of Heat-Transfer Characteristics of Organic Heat Carrier Furnace Helical Coil Under Coking Conditions


1
School of Energy and Power Engineering, Jiangsu University, Zhenjiang 212013, China
2
Jiangsu Special Equipment Safety Supervision and Inspection Institute, Nanjing 210036, China
*
Author to whom correspondence should be addressed.
Processes 2026, 14(11), 1722; https://doi.org/10.3390/pr14111722
Submission received: 12 May 2026 / Revised: 21 May 2026 / Accepted: 22 May 2026 / Published: 26 May 2026
(This article belongs to the Section Process Control, Modeling and Optimization)

Abstract

Coke deposition on the inner wall of helical coils in organic heat carrier (OHC) furnaces imposes additional thermal resistance, which impairs heat transfer and may trigger tube over-temperature failure. However, the quantitative coupling among the coking degree, flow conditions, and wall temperature response in helical coils remains insufficiently characterized. To address this gap, a three-dimensional steady-state conjugate heat-transfer model that resolves the additional thermal resistance of the coke layer is established using computational fluid dynamics (CFD). A dimensionless coking degree ω, defined as the ratio of coke layer thickness to inner tube radius, is introduced to parameterize the deposition state. Parametric simulations are performed at ω = 0–20%, with oil inlet velocities of 1–3 m/s. As ω increases from 0% to 20%, the maximum outer wall temperature rises by 66.1% (344 °C to 572 °C), whereas the maximum inner wall temperature decreases by 6.5%. The inner–outer wall temperature difference increases by over two orders of magnitude (1.61 °C to 251 °C), and the heat absorption of thermal oil declines by 53.4%. Raising the inlet velocity lowers the outer-wall temperature under clean-wall conditions, whereas this cooling effect is markedly diminished under severe coking. These findings provide a quantitative basis for the early-stage diagnosis of coking and safety evaluation of OHC furnaces.

1. Introduction

Helical-coil organic heat carrier (OHC) furnaces, which use thermal oil as the working fluid, are widely employed for industrial heating in the chemical, textile, and wood-processing sectors, owing to their compact structure and high heat-transfer efficiency [1]. However, under sustained high-temperature operation, the thermal oil undergoes oxidative and pyrolytic degradation, resulting in coke deposition on the inner wall of the coil. The thermal conductivity of the coke layer is typically only 0.1–0.3 W/(m·K), more than two orders of magnitude lower than that of 20G boiler steel (∼48 W/(m·K)). The deposit therefore acts as a high-resistance element in series with the tube wall, causing heat accumulation at the outer wall and a consequent rise in the outer-wall temperature, which ultimately accelerates creep damage and tube rupture [1]. Recent experimental evidence has further confirmed that even thin coke deposits can measurably degrade the convective heat-transfer coefficient in heated tubes carrying organic fuels [2]. Quantifying how coking affects the heat-transfer behavior of helical coils is therefore essential to ensure the safe operation of OHC furnaces.
Considerable effort has been devoted to characterizing the impact of coke layers on heat transfer. Bott [3] established the classical analytical framework that incorporates fouling resistance as an additive term in the overall heat-transfer coefficient and identified three stages of the fouling process—induction, linear growth, and asymptotic stages. Ishiyama et al. [4] examined the interaction between heat-transfer-enhancement surfaces and fouling behavior, showing that enhanced tubes can paradoxically accelerate deposit formation under certain operating conditions. With the advent of computational fluid dynamics (CFD), more detailed numerical studies have emerged. Bayat et al. [5] developed a two-dimensional CFD model for crude-oil preheaters in which asphaltene, coke, and salt were tracked as pseudo-components, successfully reproducing field fouling rates. Li et al. [6] extended this approach to a three-dimensional gas–liquid–solid formulation for petroleum-refining furnaces and reported that the effective inner diameter could be reduced to 76% of its original value. Emani et al. [7] demonstrated a clear inverse correlation between wall shear stress and the deposition rate, whereas Vandewalle et al. [8] adopted a dynamic mesh strategy to capture coke layer growth in steam-cracking reactors. A recent review by Li et al. [9] summarized pyrolysis–coking kinetics and multi-physics CFD coupling for liquid hydrocarbons in heated pipes. Beyond conventional refining heaters, similar CFD methodologies have been applied to investigations of the coking of hydrocarbon fuels in aerospace cooling channels. Tao et al. [10] developed a three-dimensional model coupling pyrolytic kinetics and a coke deposition sub-model for n-decane in regenerative cooling tubes. Bao et al. [11] combined experiments and CFD to investigate the pyrolytic coking of RP-3 aviation kerosene in U-bend tubes and showed that curvature-induced flow asymmetry aggravates local coke deposition. Wang et al. [12] further extended this analysis to rectangular U-bend tubes under one-side heating, demonstrating that the coupling between the geometry and non-uniform thermal load governs the local coking pattern.
More broadly, similar CFD and multi-physics coupling methodologies have been applied in related energy engineering contexts: For instance, Li et al. [13] developed a solid–liquid coupling heat-transfer model to investigate the filtration behavior of hydraulic fracturing fluids in shale reservoir wellbores; Li et al. [14] employed a fluid–solid coupling numerical model to analyze the sedimentation behavior of solid particles in CO2 fracturing fluids within reservoir fractures; and Li et al. [15] performed a multi-field coupled sensitivity analysis of wellhead stability during hydrate reservoir development. These studies, however, have focused almost exclusively on refining heaters, shell-and-tube exchangers, or aerospace cooling tubes, and the helical-coil geometry typical of industrial OHC furnaces has received little attention.
Studies addressing coking in industrial furnace coils carrying thermal oil remain limited. Amini et al. [16] performed a three-dimensional steady-state CFD analysis of a radiant section coil and demonstrated that omitting the coke layer leads to substantial underprediction of the tube-wall temperature. More recently, Feng et al. [17] simulated an OHC furnace with inner and outer helical coils and examined the influence of coil spacing, oxygen content, and the excess-air ratio on the chamber temperature field; their work, however, focused on the combustion-side performance and did not quantify the coupling between coking and tube-side heat transfer. A further feature specific to helical coils is the centrifugally induced secondary flow—the Dean vortex—which produces markedly non-uniform velocities and temperature fields over the tube cross-section. This phenomenon was established in the classical review by Berger et al. [18] and has been confirmed by recent combined CFD–experimental studies on helical-coil heat exchangers [19]. This secondary flow has been shown to enhance convective heat transfer and to introduce a pronounced circumferential asymmetry in the wall-temperature field [19], both of which are expected to interact strongly with the additional thermal resistance imposed by an inner-wall coke layer. This secondary-flow structure fundamentally distinguishes the heat-transfer response of helical coils to coking from that of straight tubes. To the best of the authors’ knowledge, however, no parametric numerical study has systematically quantified the effect of varying coking degrees on the coupled temperature and flow fields in an OHC furnace helical coil.
Motivated by this gap, the present work develops a three-dimensional steady-state conjugate heat-transfer model of an OHC furnace helical coil that explicitly accounts for the additional thermal resistance of the coke layer through a thin-wall formulation. It should be acknowledged that the present work applies established CFD methodologies to a specific helical-coil geometry rather than introducing a fundamentally new modeling approach. Nevertheless, the systematic parametric investigation of coking effects in this particular configuration has not been previously reported, and the resulting quantitative insights are intended to complement existing studies on straight tubes and shell-and-tube exchangers. The principal contributions of this study can be summarized as follows:
(1) A parametric framework based on a dimensionless coking degree ω is introduced, enabling the systematic comparison of coking states over a wide range (ω = 0–20%) within a single conjugate heat-transfer model of a helical coil. The upper bound of ω = 20% (corresponding to δc = 5 mm on a tube with ri = 25 mm) is selected to represent a severe but physically plausible coking state: Field inspections of OHC furnaces have reported coke layer thicknesses ranging from less than 1 mm in well-maintained systems to several millimeters in neglected units, and Li et al. [6] reported that the effective inner diameter of petroleum-refinery furnace tubes can be reduced to 76% of its original value, corresponding to a coke-to-radius ratio well in excess of 20%. The selected range therefore covers the most industrially relevant conditions.
(2) The contrasting response of the inner- and outer-wall temperatures to coking—a pronounced “outer-hot, inner-cold” pattern—is quantified, and the underlying mechanism is rationalized through the superposition of fouling resistance and the suppression of internal convective cooling.
(3) The regulating capacity of the oil inlet velocity (1–3 m/s) is examined across the full range of coking degrees, revealing that flow-side intensification becomes progressively ineffective once the coke layer dominates the overall thermal resistance—a finding with direct implications for operational safety strategies in OHC furnaces.
The remainder of the paper is organized as follows. Section 2 describes the geometric, mathematical, and numerical model, including the grid-independence study and model validation. Section 3 presents and discusses the temperature and flow fields, the influence of the coking degree, and the role of inlet velocity. Section 4 concludes the study and outlines its limitations.

2. Model Description

2.1. Physical Model

The system considered in this study is the helical coil of an organic heat carrier (OHC) furnace, in which the thermal oil is heated inside the coil by the high-temperature flue gas circulating in the surrounding furnace chamber. The relevant heat-transfer processes are as follows: (1) forced convection between the high-temperature flue gas and the outer tube wall; (2) conduction through the tube wall; (3) conduction through the coke layer; and (4) forced convection between the inner surface of the coke layer and the thermal oil. Among these, conduction through the coke layer (process (3)) introduces an additional thermal resistance and is the central physical effect investigated in this study.
The coke layer is the central physical element examined in this study. Its thermal conductivity is taken as λc = 0.2 W/(m·K), approximately 240 times lower than that of 20G boiler steel (λs ≈ 48 W/(m·K)). Once deposited on the inner wall, the coke layer adds a high-resistance element in series with the tube wall. Thermal-resistance superposition substantially increases the overall thermal resistance and reduces the gas-to-oil heat flux.
The following simplifying assumptions are adopted: (1) The flow is three-dimensional, steady, and turbulent; radiation heat transfer between the flue gas and the outer tube wall is not modeled in the present study. At a gas temperature of approximately 700 °C, radiative heat transfer may contribute a substantial fraction of the total heat flux to the tube wall. Therefore, neglecting radiation represents an important limitation of the present model and may lead to underprediction of the absolute outer-wall temperature, particularly under severe coking conditions. The present study is primarily intended to investigate the relative thermal response trends associated with the increasing coke layer thermal resistance rather than to provide quantitatively exact industrial temperature predictions. Although the incremental effect of coking is expected to remain qualitatively valid, the incorporation of gas–radiation coupling would improve the quantitative accuracy of the wall temperature prediction and should therefore be included in future work. (2) The thermal oil and flue gas are treated as incompressible Newtonian fluids with constant thermophysical properties evaluated at their respective mean operating temperatures. This simplification is acknowledged as a limitation: In practice, the viscosity and thermal conductivity of thermal oil vary significantly with the temperature, and incorporating temperature-dependent properties would improve the accuracy of the predictions, particularly in regions with large temperature gradients. The constant-property assumption is adopted here to isolate the thermal-resistance effect of the coke layer as the primary variable, and future work should incorporate variable fluid properties for a more comprehensive analysis. (3) The chemical degradation of the thermal oil and the dynamic growth of the coke layer are not modeled. (4) The coke layer is assumed to be uniformly distributed in the circumferential and axial directions (uniform-deposition approximation). This idealization neglects the circumferential non-uniformity caused by Dean vortices and the associated variation in wall shear stress, as well as the secondary physical effects of the deposit such as increased surface roughness, turbulence modification, and the reduction in the hydraulic diameter with the consequent increase in pressure drop. These effects are expected to become increasingly significant at higher coking degrees and represent important directions for future modeling refinement. (5) The tube material (20G boiler steel) is treated as homogeneous and isotropic with a constant thermal conductivity.

2.2. Geometric Model

The three-dimensional geometry was constructed in ANSYS SpaceClaim 2021 R1 and is shown in Figure 1. The helical coil has a coil diameter of D = 1000 mm, an inner tube diameter of 50 mm, and an outer tube diameter of 55 mm. The flue gas domain, representing the furnace chamber surrounding the coil, is modeled as a rectangular block with overall dimensions of 1200 mm × 800 mm × 1100 mm (length × width × height). A Cartesian coordinate system is adopted, with the origin located at the geometric center of the helical coil. The Y-axis is aligned with the chamber height, and the X- and Z-axes lie in the horizontal plane along the length and width directions, respectively.

2.3. Mathematical Model

Under the assumptions of steady, incompressible, and chemically inert flow, the governing equations describing the conservation of mass, momentum, and energy can be written as follows:
Continuity:
ρ u i x i   =   0
Momentum:
ρ u i u j x j   =   P x i   +   τ i j x j   +   ρ g i
Energy:
ρ u j H x j   =   x j Γ h H x j
where ρ is the fluid density, ui is the velocity component, P is the static pressure, τij is the viscous stress tensor, gi is the gravity component in the i- direction, H is the total enthalpy, and Γh is the effective thermal diffusivity. Because steady flow is assumed, the unsteady terms vanish.
Turbulence is modeled using the RNG k–ε model with enhanced wall treatment. The RNG k–ε model was selected over the SST k–ω model for two principal reasons. First, the RNG formulation incorporates an additional strain-rate-dependent term (Rε) in the dissipation equation that improves the accuracy for strongly curved and swirling flows, which are the dominant flow features in helical coils. Second, the SST k–ω model, while offering advantages for flows with adverse pressure gradients and separation, is more sensitive to freestream turbulence boundary conditions; in the present configuration with a surrounding gas domain, this sensitivity would introduce additional uncertainty. Prior helical-coil CFD studies have consistently demonstrated that the RNG k–ε model with enhanced wall treatment provides reliable predictions for this class of flows. This combination has been shown to perform well for the swirling and curved flow patterns typical of helical coils [20,21]. The RNG k–ε model is derived from renormalization group theory and is particularly suitable for strongly curved and rotating flows [22], and the near-wall region is resolved using the enhanced wall treatment [23]. The steady-state transport equations for the turbulent kinetic energy k and the turbulent dissipation rate ε are written as:
ρ k u i x i   =   x j α k μ e f f k x j   +   G k   ρ ε
ρ ε u i x i = x j α ε μ e f f ε x j +   C 1 ε ε k G k C 2 ε ρ ε 2 k     R ε
with model constants C = 1.42 and C = 1.68. Buoyancy generation, compressibility correction, and user-defined source terms are set to zero, consistent with the incompressible-flow assumption.
The coke layer is treated using a thin-wall thermal-resistance formulation [3]: the layer is geometrically represented as a zero-thickness interface, while its thermal effect is captured through an equivalent thermal resistance, defined as:
R c   =   δ c λ c
A dimensionless coking degree ω is defined as
ω = ( δ c r i )   ×   100 %
where δc is the coke-layer thickness and ri = 25 mm is the inner tube radius. By varying δc (and hence Rc) within the thin-wall model, a parametric study of different coking conditions can be carried out without modifying the underlying mesh.
It should be noted that the thin-wall formulation solves a one-dimensional steady heat conduction equation across the coke layer and therefore does not resolve the radial temperature profile within the deposit. For thin coke layers (ω ≤ 5–10%, corresponding to δc ≤ 1.25–2.5 mm relative to ri = 25 mm), the approximation is well justified because the thermal resistance of the coke layer remains sufficiently limited for the thin-wall approximation to provide a reasonable first-order estimate, and the circumferential and axial temperature gradients within the deposit are negligible. At higher coking degrees (ω = 15–20%, δc = 3.75–5.0 mm), the coke layer thickness becomes a non-negligible fraction of the tube radius, and a fully meshed finite-thickness solid domain would, in principle, provide a more accurate representation of the radial temperature gradient, the curvature effect on the local heat flux, and the reduction in the hydraulic diameter. The present thin-wall approach therefore represents a reasonable first-order approximation that captures the dominant thermal-resistance effect of coking, while a future study employing a resolved solid coke domain is recommended to quantify the additional effects at high coking degrees. The following notation is used in the remainder of the paper: Tout denotes the outer-wall surface temperature; Tin denotes the inner-wall (i.e., coke layer/oil interface) temperature; and ΔT = ToutTin is the wall-to-interface temperature drop. The temperature at the steel/coke interface is not analyzed separately because it is essentially equal to Tout.

2.4. Mesh and Numerical Method

2.4.1. Mesh Generation

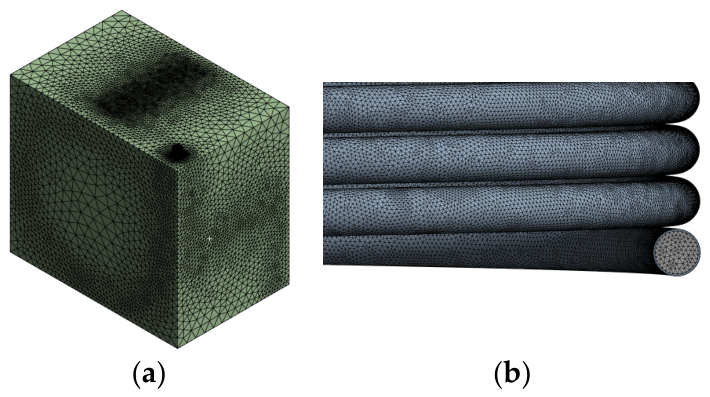
The computational domain was discretized using unstructured tetrahedral meshes generated in ANSYS Meshing, as shown in Figure 2. Figure 2a presents the overall mesh of the coupled gas–coil computational domain, while Figure 2b shows a close-up view of the helical-coil mesh, illustrating the local refinement near the tube wall. Local mesh refinement with a target cell size of approximately 5 mm was applied within the tube (oil) domain, while the surrounding gas domain was discretized with a baseline cell size of 100 mm; a global growth ratio of 1.4 was prescribed throughout the domain. Conformal coupling at fluid–solid interfaces was achieved by resolving geometric interferences and merging shared faces in the ANSYS SpaceClaim.

2.4.2. Grid-Independence Study

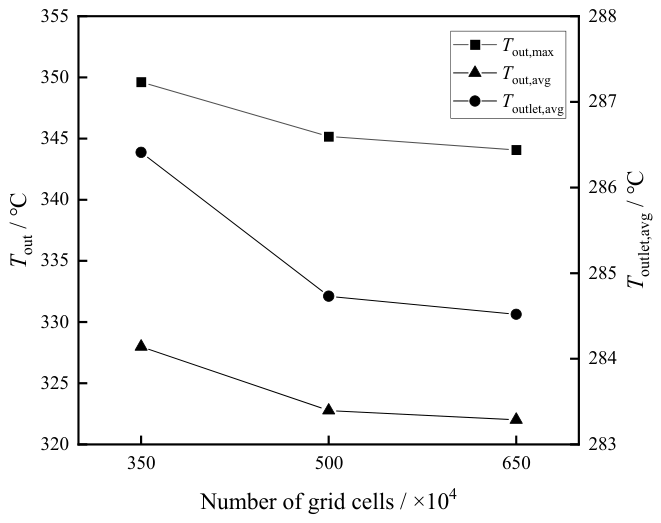
A grid-independence study was conducted under the clean-wall baseline condition (oil inlet: v = 2 m/s, T = 280 °C; gas inlet: v = 6 m/s, T = 700 °C) using three meshes with approximately 3.5 × 10⁶, 5.0 × 10⁶, and 6.5 × 10⁶ cells. The maximum outer-wall temperature, mean outer-wall temperature, and mean outlet oil temperature were selected as evaluation metrics, and the results are summarized in Figure 3. As the mesh was refined from 3.5 × 10⁶ to 5.0 × 10⁶ cells, the relative deviation in the maximum outer-wall temperature decreased from 1.27% to 0.32%, the deviation in the mean outer-wall temperature decreased from 1.37% to 0.20%, and the deviation in the mean outlet oil temperature decreased from 0.59% to 0.07%. All variations between the 5.0 × 10⁶ and 6.5 × 10⁶ meshes fell below 1%, indicating that grid independence had been adequately achieved with the 5.0 × 10⁶ mesh. Considering the trade-off between numerical accuracy and computational cost, the 5.0 × 10⁶ mesh was therefore adopted for all subsequent simulations. It should be noted that the same mesh configuration was employed for all coking cases investigated in this study, because the coke layer is modeled using a thin-wall thermal resistance formulation rather than as a geometrically resolved solid domain. Consequently, the coking degree ω does not alter the computational mesh; it only modifies the thermal boundary condition at the inner-wall interface. The grid-independence verification performed under the clean-wall baseline condition therefore remains applicable to all ω values. Should a future study adopt a resolved finite-thickness coke domain, dedicated mesh refinement near the coke–oil interface at higher ω values would be necessary to adequately resolve the steep temperature gradient within the deposit layer.

2.4.3. Numerical Solution Method

Pressure–velocity coupling was treated with the SIMPLE algorithm [24]. A second-order scheme was used for the pressure equation, and second-order upwind schemes were applied to the momentum, turbulent kinetic energy (k), turbulent dissipation rate (ε), and energy equations. Gradient evaluation employed the least-squares cell-based method. Convergence was considered to be achieved when all residuals fell below 10−8 and the monitored outer-wall and outlet temperatures had stabilized.

2.4.4. Boundary Conditions and Thermophysical Properties

The boundary conditions were specified as follows: The oil-side inlet was set as a velocity inlet with v = 2 m/s and T = 280 °C (baseline case); the gas-side inlet was set as a velocity inlet with v = 6 m/s and T = 700 °C; and both outlets were treated as pressure outlets. The thermophysical properties of the thermal oil, coke layer, and 20G boiler steel used in the simulations are summarized in Table 1.

2.5. Model Validation

The accuracy of the numerical model was assessed by comparing the predicted in-tube average Nusselt number against the Rogers–Mayhew correlation [25] for turbulent flow in helical coils, which has been extensively validated [26,27]:
Nu   =   0.023 R e 0.85 P r 0.4 ( d D ) 0.1
The comparison was carried out at oil inlet velocities of 1, 2, and 3 m/s under clean-wall conditions; the results are summarized in Table 2. Across the three cases, the deviation between the CFD prediction and the correlation lies between 1.6% and 7.7%, which is within the engineering tolerance commonly accepted for helical-coil heat-transfer correlations. The model is therefore considered sufficiently accurate for the parametric study of coking effects presented in the next section. It should be acknowledged that this validation was performed under clean-wall conditions only. Validation under actual coking conditions would require experimental measurements of wall temperatures in coke-affected helical coils, which are not currently available in the open literature. The present model captures the additional thermal resistance of the coke layer through well-established heat conduction theory, and the validated clean-wall heat-transfer predictions provide confidence that the underlying fluid dynamics and conjugate heat-transfer framework is sound. Nevertheless, dedicated experimental validation under coking conditions is an important direction for future work.

3. Results and Discussion

3.1. Temperature and Flow Field Analysis

The numerical simulations were conducted under the following baseline operating conditions: a flue gas inlet velocity of 6 m/s with an inlet temperature of 700 °C and a thermal-oil inlet velocity of 2 m/s with an inlet temperature of 280 °C. The coking degree ω was varied over the range 0–20% to assess the effect of coke layer thickness on the heat-transfer characteristics of the coil.

3.1.1. Outer-Wall Temperature Distribution

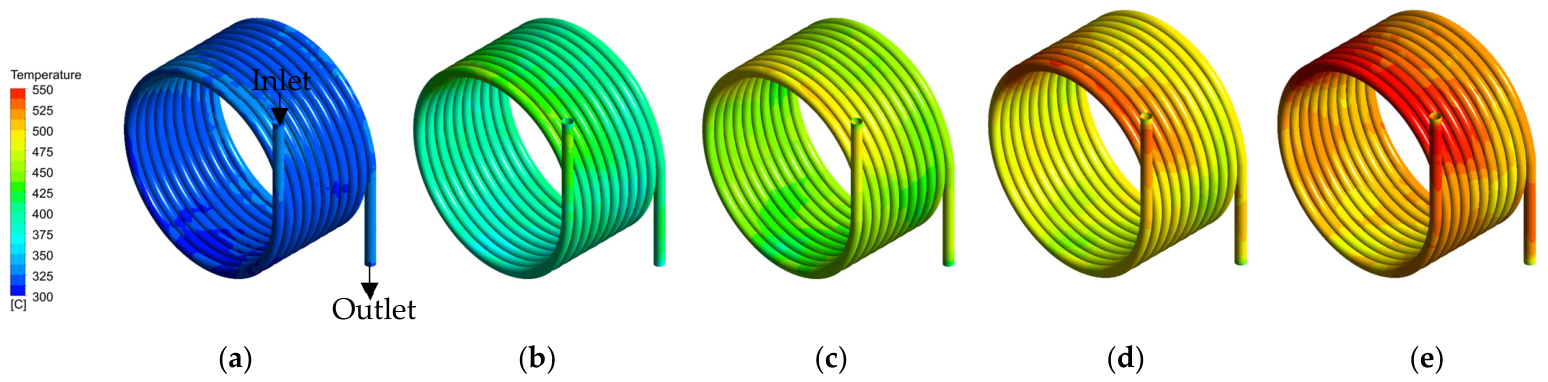
To visualize the thermal response of the coil to coking, contours of the outer-wall temperature for five representative coking degrees (ω = 0%, 5%, 10%, 15%, and 20%) are presented in Figure 4. At ω = 0%, the outer-wall temperature remains relatively low and is distributed uniformly along the coil axis. As ω increases, localized high-temperature bands first emerge and then progressively extend along the coil axis, eventually evolving into a system-wide elevated-temperature state, and the entire color scale of the contour shifts toward higher values. At ω = 20%, almost the entire outer-wall surface lies in a high-temperature regime. This pattern indicates that the coke layer significantly impedes the transfer of heat from the wall to the thermal oil, leading to progressive heat accumulation at the gas-facing surface and a substantial rise in the outer-wall temperature.

3.1.2. In-Tube Temperature Field

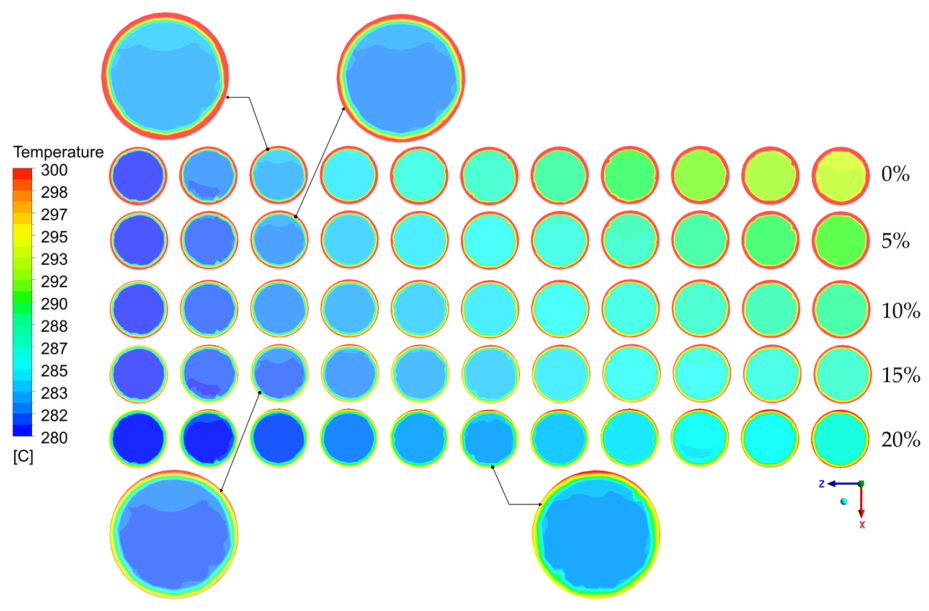
The thermal-oil temperature field on the Y = 0 horizontal cross-section is shown in Figure 5 for the same five coking degrees. Under the clean-wall condition (ω = 0%), the thermal oil is progressively heated along the coil, with the maximum near-wall oil temperature reaching 312 °C and a fully developed thermal boundary layer forming adjacent to the inner wall. As the ω increases, the axial temperature rise in the oil decays rapidly: at ω = 5%, the heating effect is already markedly weakened; at ω = 10%, only a slight temperature increase is observed at the coil outlet; at ω = 15%, the axial temperature rise is further reduced; and at ω = 20%, the axial temperature rise is substantially diminished, with only a modest increase observed near the coil outlet. This sequence visually demonstrates the “blocking” role of the coke layer in the gas-to-oil heat-transfer pathway: although the outer-wall temperature continues to rise with ω (cf. Figure 4), heat cannot effectively penetrate the low-conductivity coke layer to reach the oil, leading to a sharp reduction in the effective heat absorption and a limited oil-side temperature rise.
A closer inspection of the cross-sectional temperature field at ω = 0% (the magnified circular insets in Figure 5) reveals a pronounced temperature stratification within the tube cross-section: the centrifugal side (i.e., the side farther from the coil axis, corresponding to the positive X-direction) exhibits a lower oil temperature with a thinner near-wall thermal boundary layer, whereas the centripetal side shows a higher oil temperature with a thicker thermal boundary layer. This temperature stratification is a characteristic feature of flow in helical coils, arising from the Dean vortex secondary flow induced by the coil curvature. The driving mechanism and the corresponding velocity field will be examined in detail in Section 3.1.3.

3.1.3. Cross-Sectional Velocity Field and Dean Vortices

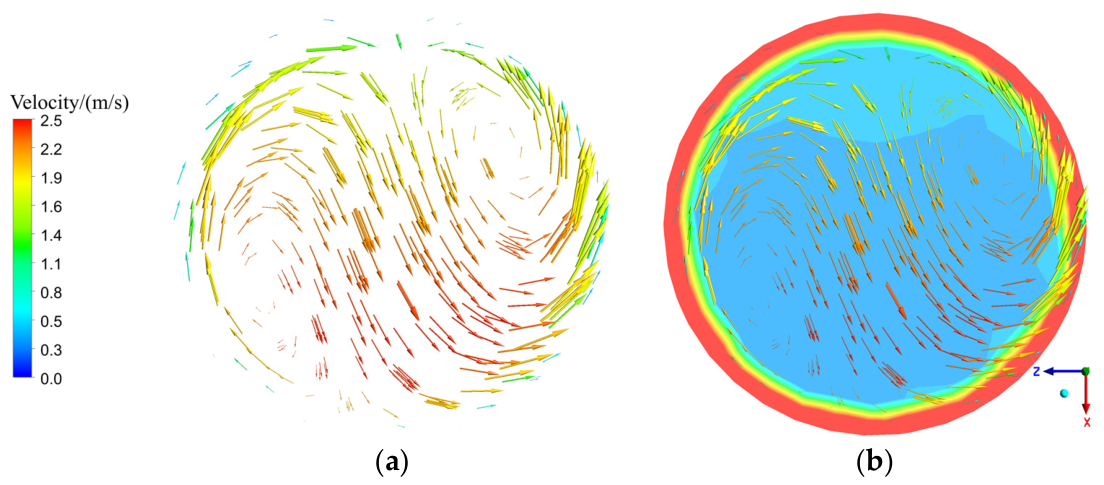
The flow inside a helical coil differs fundamentally from that in a straight tube. The centrifugal force induced by the coil curvature drives a characteristic secondary flow—the Dean vortex pair—which has been extensively documented in both classical analyses [18] and recent CFD–experimental studies [19]. Figure 6 shows the cross-sectional velocity field of a representative coil segment under the clean-wall condition (ω = 0%, v = 2 m/s). Figure 6a presents the velocity vector distribution, and Figure 6b superimposes the velocity vectors on the oil temperature field. The coordinate system is consistent with that of Figure 5 (positive X-direction = centrifugal side).
A pronounced asymmetric double-vortex structure is observed. The lower-right portion of the cross-section (positive X-direction) corresponds to the centrifugal side of the coil and exhibits a high-velocity sweeping zone, whereas the upper-left portion corresponds to the centripetal side and forms a low-velocity recirculation zone. The upper and lower halves of the cross-section each contain a counter-rotating vortex, which together constitute a complete Dean vortex ring. An S-shaped dividing streamline separates the two halves, with fluid migrating from the centripetal side toward the centrifugal side, splitting near the centrifugal wall, and returning along the centripetal wall both upwardly and downwardly. The axial velocity peaks near the centrifugal wall, with a maximum of approximately 2.5 m/s, while the minimum velocity (0.6–1.2 m/s) is located near the centripetal wall—a difference exceeding 1 m/s. This “fast outer, slow inner” axial velocity asymmetry is a direct consequence of the centrifugally driven secondary flow: The cooler, denser core fluid is convected toward the centrifugal-side wall by centrifugal force, where it impinges on the wall and produces the observed high-velocity sweeping zone; the heated near-wall fluid is then displaced along the upper and lower walls toward the centripetal side, where it accumulates in a low-velocity recirculation region. This transport pattern directly explains the temperature stratification observed in the cross-sectional insets of Figure 5—a lower oil temperature and thinner thermal boundary layer on the centrifugal side, and a higher oil temperature with a thicker thermal boundary layer on the centripetal side. This correspondence is also visually confirmed in Figure 6b, where the high-velocity sweeping zone on the centrifugal side coincides with the low-temperature (blue) oil region, while the low-velocity recirculation zone on the centripetal side corresponds to the higher-temperature region.
The Dean vortex secondary flow exerts a substantial enhancement effect on the in-tube heat transfer through two mechanisms. First, the secondary flow promotes lateral mixing between hot near-wall fluid and cold core fluid, disrupting the stability of the thermal boundary layer and intensifying the wall-side convective heat transfer. Second, the high axial velocity on the centrifugal side intensifies the near-wall convective transport and, together with the secondary-flow-induced lateral mixing, thins the local thermal boundary layer, thereby raising the local convective heat-transfer coefficient. These mechanisms also account for the close agreement between the CFD-predicted Nusselt number and the Rogers–Mayhew correlation in the validation study (Section 2.5): unlike the straight tube Dittus–Boelter correlation [28], the Rogers–Mayhew correlation incorporates a curvature correction term (d/D)0.1 that explicitly captures the heat-transfer enhancement attributable to the Dean vortex. An important implication of this secondary-flow structure for the coking problem is that, in actual OHC furnaces, coke deposition is unlikely to be circumferentially uniform. The Dean vortices produce a pronounced asymmetry in both the wall temperature and the wall shear stress around the tube perimeter: the centrifugal side experiences higher shear and lower wall temperatures, while the centripetal side is characterized by lower shear and higher wall temperatures. Because coke deposition is strongly promoted by elevated wall temperatures and retarded by high shear stress, the centripetal (inner curve) side of the coil is expected to accumulate coke more rapidly than the centrifugal side, leading to a non-uniform deposit profile. This circumferential non-uniformity further amplifies the temperature asymmetry observed in Figure 5 and Figure 6, creating positive feedback between local hot spots and preferential deposition. The present study adopts a uniform-deposition approximation for simplicity, which provides a useful baseline for quantifying the overall thermal-resistance effect of coking; however, future work incorporating a circumferentially resolved deposition model would be valuable for capturing the full interaction between Dean eddies and non-uniform coking.

3.2. Effect of Coking Degree on Heat-Transfer Characteristics

3.2.1. Effect on Inner- and Outer-Wall Temperatures

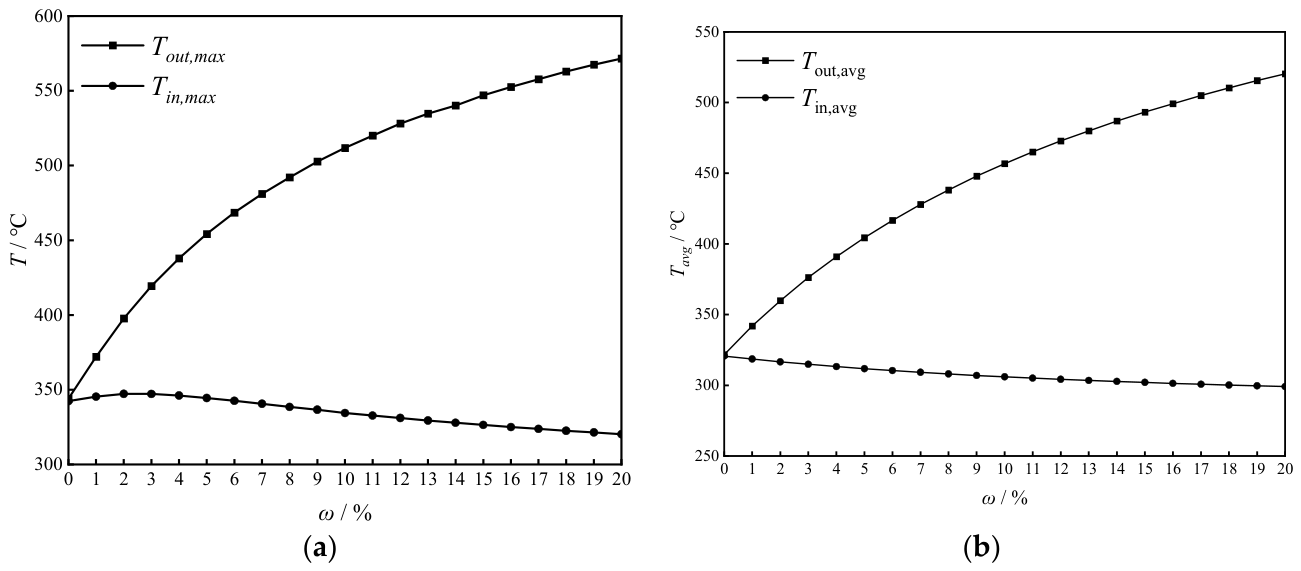
Quantitative results for the variation in wall temperatures with the coking degree are presented in Figure 7. The outer-wall temperature Tout exhibits a pronounced monotonic increase with ω. As ω rises from 0% to 20%, the maximum outer-wall temperature increases from 344 °C to 572 °C, there is an absolute rise of 228 °C, and a relative increase of 66.3%; the mean outer-wall temperature rises from 321 °C to 520 °C, there is an absolute rise of 198 °C, and a relative increase of 61.7%. In contrast, the inner-wall temperature Tin (i.e., the coke layer/oil interface temperature) follows a markedly different trend: its maximum value decreases gradually from 342 °C to 320 °C (a 6.5% reduction), and its mean value decreases from 320 °C to 299 °C (a 6.7% reduction).
This “outer-wall heating, inner-wall cooling” response, although counter-intuitive at first glance, directly follows from the modification of the wall-side heat-transfer process by the coke layer. Owing to the low thermal conductivity of the coke deposit, an additional thermal resistance is introduced at the inner-wall surface, which obstructs the transfer of heat from the gas side to the oil side. Heat therefore accumulates progressively in the vicinity of the outer wall, causing Tout to rise. Simultaneously, the heat flux arriving at the coke layer/oil interface is reduced; combined with the persistent convective cooling on the oil side, this leads to a slow but consistent decrease in Tin. In the early stage of coking (ω = 0–5%), the rate of increase in Tout is particularly steep, with the maximum outer-wall temperature rising by more than 100 °C over this narrow interval—clear evidence that even a thin coke layer is sufficient to trigger a substantial change in the heat-transfer behavior. At higher coking degrees, the rate of temperature rise gradually diminishes, indicating that the system progressively enters a regime in which the coke layer resistance dominates the overall thermal balance.
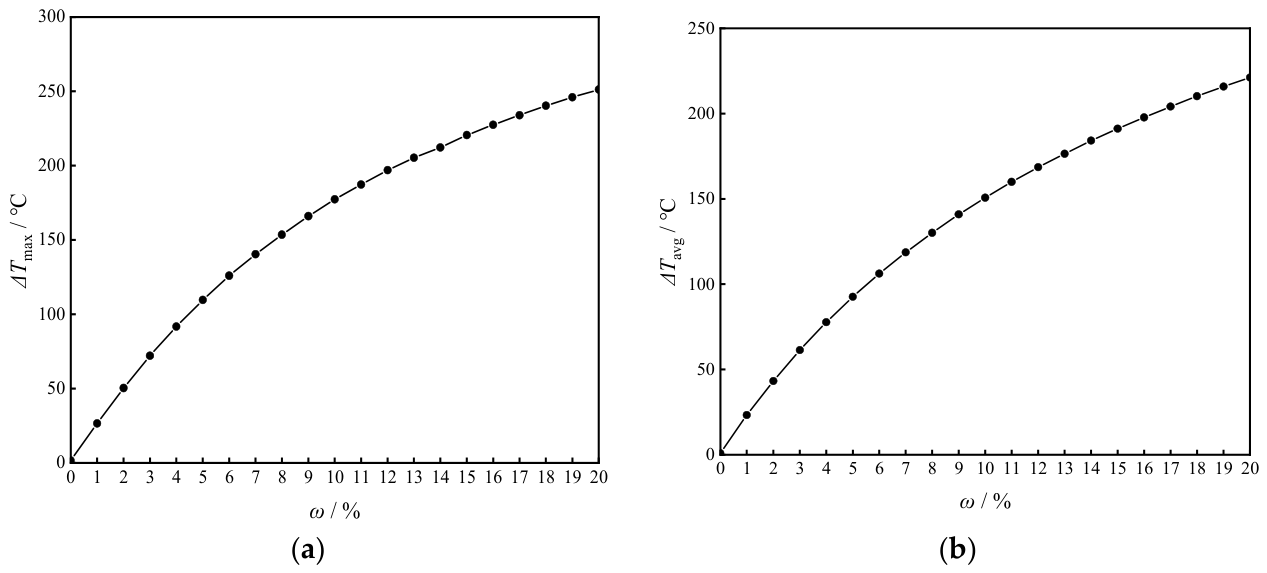
The corresponding variation in the wall-to-interface temperature drop ΔT = ToutTin is shown in Figure 8. ΔT increases sharply with ω, exhibiting a strongly non-linear growth pattern. Under the clean-wall condition, the maximum and mean values of ΔT are only 1.61 °C and 1.02 °C, respectively, reflecting a very small wall-side resistance. At ω = 20%, however, ΔTmax reaches 251 °C and ΔTmean reaches 221 °C—an increase of more than two orders of magnitude.
The growth of ΔT is most rapid in the low-coking regime: for instance, in the range ω = 0–6%, the ΔTmax increases from 1.61 °C to approximately 125 °C, indicating a rapid buildup of the additional thermal resistance during the early stage of coking. Beyond ω ≈ 10%, the growth rate of ΔT slows progressively, exhibiting a clear “saturation” tendency. This trend implies that, once the coke layer reaches a certain thickness, the overall thermal resistance of the system becomes coke-dominated, and further coking has a diminishing influence on the overall heat-transfer process.
From a heat-transfer-mechanism standpoint, the substantial increase in ΔT originates from the additional thermal resistance imposed by the coke layer. As the coke-layer thickness grows, the resistance encountered by the heat flux as it traverses the wall increases continuously.
Quantitatively, this trend directly follows behind Fourier’s law:
Δ T   =   q   ×   R c     =   q   ×   δ c λ c
where Rc is the coke layer’s thermal resistance, and q is the local heat flux through the wall. As δc increases, Rc grows linearly, while q simultaneously decreases, owing to the enhanced overall thermal resistance of the gas-to-oil pathway; however, because the growth of Rc outpaces the reduction in q, the product q × Rc—i.e., ΔT—increases continuously. The diminishing growth rate of ΔT at higher coking degrees reflects the progressive decrease in q as the coke layer resistance comes to dominate the overall thermal balance. The strongly insulating nature of the coke layer is rooted in its extremely low thermal conductivity, λc = 0.2 W/(m·K), approximately 1/240 of that of the 20G boiler steel tube (λs = 48 W/(m·K)), meaning that even a coke layer of only 1 mm thickness introduces a thermal resistance roughly 240 times greater than an equivalent thickness of steel. As a quantitative illustration, at ω = 5% (δc = 1.25 mm), the maximum ΔT already reaches approximately 110 °C—about 68 times its clean-wall value of 1.61 °C—confirming that even a slight degree of coking exerts a substantial influence on the heat-transfer process.
To further quantify the coking effect in dimensionless terms, the normalized temperature drop ΔTTω=0 and the Biot number of the coke layer are examined. From the data in Figure 8a, ΔTmaxTmax,ω=0 increases from 1 at ω = 0% to approximately 68 at ω = 5% (based on ΔTmax ≈ 110 °C and ΔTmax,ω=0 = 1.61 °C) and to about 156 at ω = 20% (ΔTmax = 251 °C). This strongly non-linear trend indicates that the most severe relative degradation occurs in the early coking stage (ω ≤ 5%), where the thermal bottleneck effect rapidly becomes established.
The Biot number of the coke layer, defined as B i   =   h o i l · δ c λ c , measures the temperature uniformity within the deposit. Using the oil-side heat-transfer coefficient hoil = 584.6 W/(m2·K) derived from the validated CFD results (Table 2, v = 2 m/s), the Bi increases linearly with ω: Bi = 73.1 × (ω/100) (where ω is in percent). At ω = 5%, Bi = 3.7; at ω = 20%, Bi = 14.6. Since Bi ≫ 1, even at ω = 5%, a significant temperature gradient exists across the coke layer. This justifies the present thin-wall model as a first-order approximation but also highlights that a fully resolved solid-domain approach would be more accurate at high coking degrees—a direction already noted in Section 2.3.
From an engineering perspective, the large Biot number (Bi ≫ 1) indicates that the dominant thermal resistance is located inside the coke layer rather than in the oil-side convective process. Consequently, once the coke layer reaches even a moderate thickness, increasing the oil flow velocity can no longer effectively remove heat from the outer wall because the thermal bottleneck is primarily controlled by conduction through the coke deposit. This explains why the flow-rate regulation strategy becomes progressively ineffective at high coking degrees and highlights the importance of early-stage decoking and preventive maintenance.
Together, these dimensionless quantities reinforce the conclusion that early-stage coking (up to ω ≈ 5%) is the critical period for heat-transfer deterioration, and that the coke layer becomes the dominant thermal resistance once ω exceeds a few percent.
A practically important consequence of this mechanism is the existence of a positive-feedback loop in OHC furnace operation: the formation of a coke layer raises the outer-wall temperature and, simultaneously, elevates the temperature of the near-wall oil film immediately adjacent to the coke surface, which accelerates local thermal degradation of the oil and promotes further coke deposition. This self-reinforcing cycle is widely recognized as a primary driver of tube-rupture incidents in OHC furnaces and underscores the importance of early-stage detection and control of coke deposition. It should be noted, however, that the present analysis is limited to the thermal domain and does not include a thermo-mechanical or structural stress analysis. Definitive conclusions regarding tube-rupture risk would require coupling the predicted temperature field with a creep or fatigue damage model, which is beyond the scope of this study.

3.2.2. Effect on Total Heat Absorption

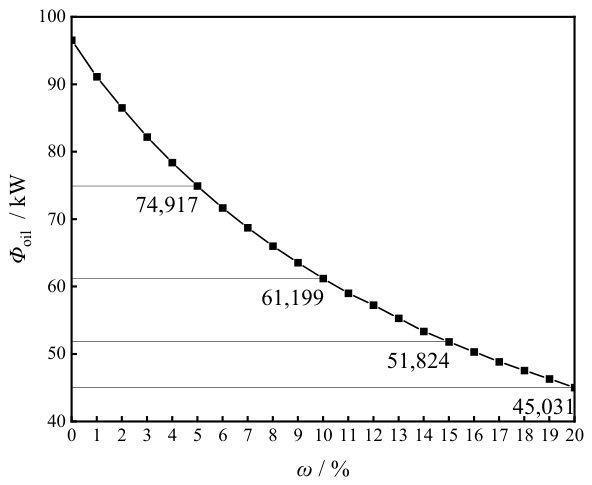
The coke layer also exerts a strong inhibiting effect on the overall heat-transfer capacity of the system. As shown in Figure 9, when ω increases from 0% to 20%, the total heat absorbed by the thermal oil decreases from 96,539 W to 45,031 W—a 53.4% reduction, indicating that more than half of the system’s heat-transfer capability is lost. The decline is non-linear: in the early stage of coking (ω = 0–5%), the average reduction in heat absorption is approximately 4320 W per 1% increment in ω, whereas in the higher coking range (ω = 15–20%), the corresponding reduction is only about 1360 W per 1% increment. This trend is fully consistent with the wall-temperature-difference behavior discussed above and reinforces the conclusion that coke layer resistance progressively becomes the dominant component of the overall thermal resistance.
In summary, the formation of a coke layer simultaneously raises the outer-wall temperature, sharply enlarges the wall-to-interface temperature drop, and substantially suppresses the total heat absorbed by the oil. These coupled responses indicate that coking exerts a strong inhibition on the overall heat-transfer process. These findings further indicate that the outer-wall temperature is highly sensitive to the coking degree and may, in principle, provide a useful basis for the development of non-invasive diagnostic indicators for coking assessment in operational OHC furnaces. To place these results in a broader context, the magnitude of the predicted heat-transfer degradation is consistent with trends reported in related numerical and field studies. Amini et al. [16] observed that neglecting the coke layer in a refinery radiant-coil simulation led to an underprediction of the tube-wall temperature by more than 100 °C, which is comparable to the present finding that a 5% coking degree raises the maximum outer-wall temperature by over 100 °C. Bayat et al. [5] reported that fouling resistance in crude-oil preheaters increased monotonically with the wall temperature and decreased with the flow velocity, a trend that is qualitatively consistent with the present velocity–coking interaction results (Section 3.3). Although direct field measurements of coking in OHC furnace helical coils are not publicly available for quantitative comparison, the qualitative agreement with these related studies supports the physical plausibility of the present predictions. Dedicated validation against field data from OHC furnace decoking operations is recommended as a priority direction for future research.

3.3. Effect of Inlet Velocity on Heat-Transfer Characteristics

Building upon the foregoing analysis of coking effects, this section examines the regulating role of the in-tube flow conditions under coking-affected operation. Holding the gas-side conditions in a fixed state (vgas = 6 m/s, Tgas = 700 °C), three thermal-oil inlet velocities (1, 2, and 3 m/s) were compared at five representative coking degrees (ω = 0%, 5%, 10%, 15%, and 20%).

3.3.1. Effect on Inner- and Outer-Wall Temperatures

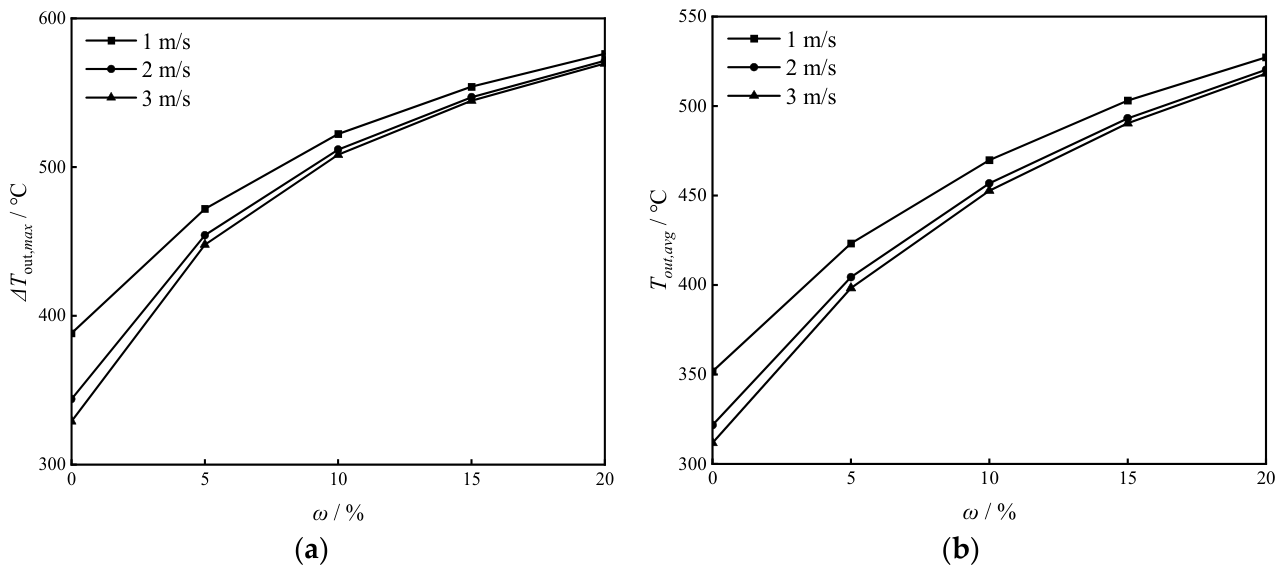
Figure 10 presents the variation in the outer-wall temperature with ω at the three inlet velocities. At every coking degree, both the maximum and mean outer-wall temperatures decrease as the inlet velocity increases. Under the clean-wall condition, increasing the inlet velocity from 1 m/s to 3 m/s lowers the maximum outer-wall temperature from 388 °C to 329 °C, a substantial reduction of 59 °C. At ω = 20%, however, the corresponding maximum temperatures are 576 °C, 572 °C, and 569 °C at v = 1, 2, and 3 m/s, respectively, yielding a reduction of only 6.6 °C across the same velocity range. The mean outer-wall temperature follows the same trend, with an even smaller absolute change. These results indicate that, while flow intensification is highly effective at suppressing outer-wall heat accumulation under clean-wall operation, its capacity to regulate the outer-wall temperature is markedly weakened once coking dominates the resistance balance.
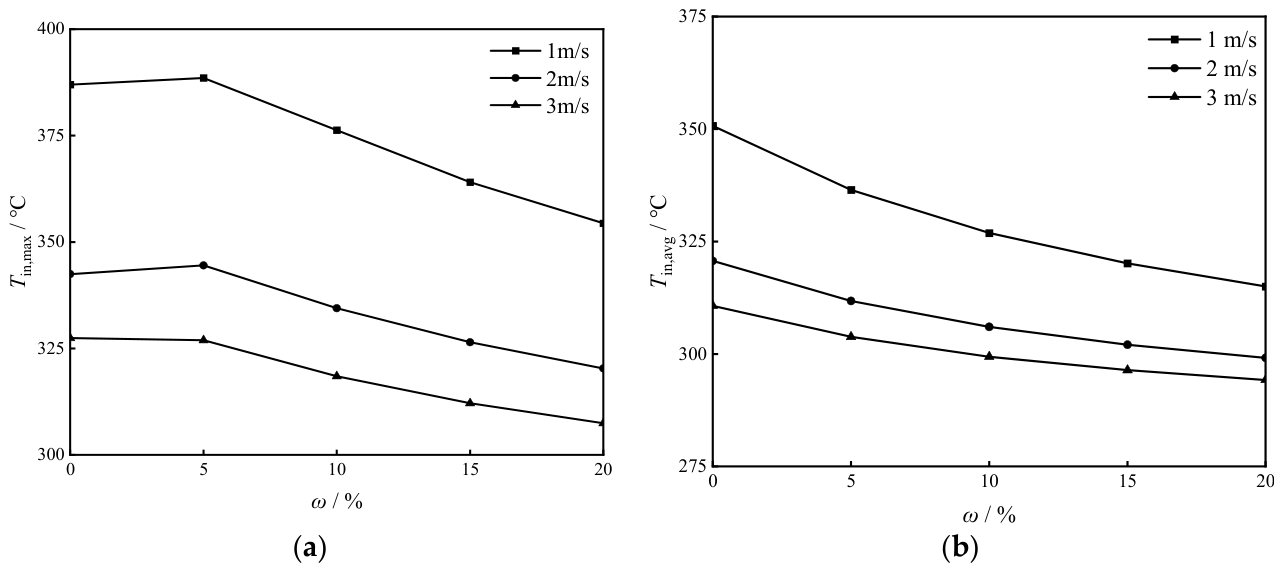
Figure 11 shows the corresponding variation in the inner-wall temperature. Both the maximum and mean inner-wall temperatures decrease with the increasing inlet velocity at each coking degree. At ω = 20%, the maximum inner-wall temperature drops from 354 °C at v = 1 m/s to 307 °C at v = 3 m/s—a reduction of 47 °C—whereas, over the same velocity range, the maximum outer-wall temperature decreases by only 6.6 °C (from 576 °C to 569 °C). This sharp contrast between the inner- and outer-wall thermal responses directly reflects the thermal bottleneck effect of the coke layer, which effectively decouples the two sides of the tube wall. The mean inner-wall temperature drops from 315 °C to 294 °C over the same velocity range, which is a reduction of 20 °C. The smaller variation in the mean temperature relative to the maximum indicates that the velocity primarily acts on local hot spots through enhanced convection. This result demonstrates that increasing the in-tube flow velocity strengthens the convective heat transfer on the oil side and effectively suppresses local peak temperatures on the inner wall, which is beneficial for the safe operation of the equipment.
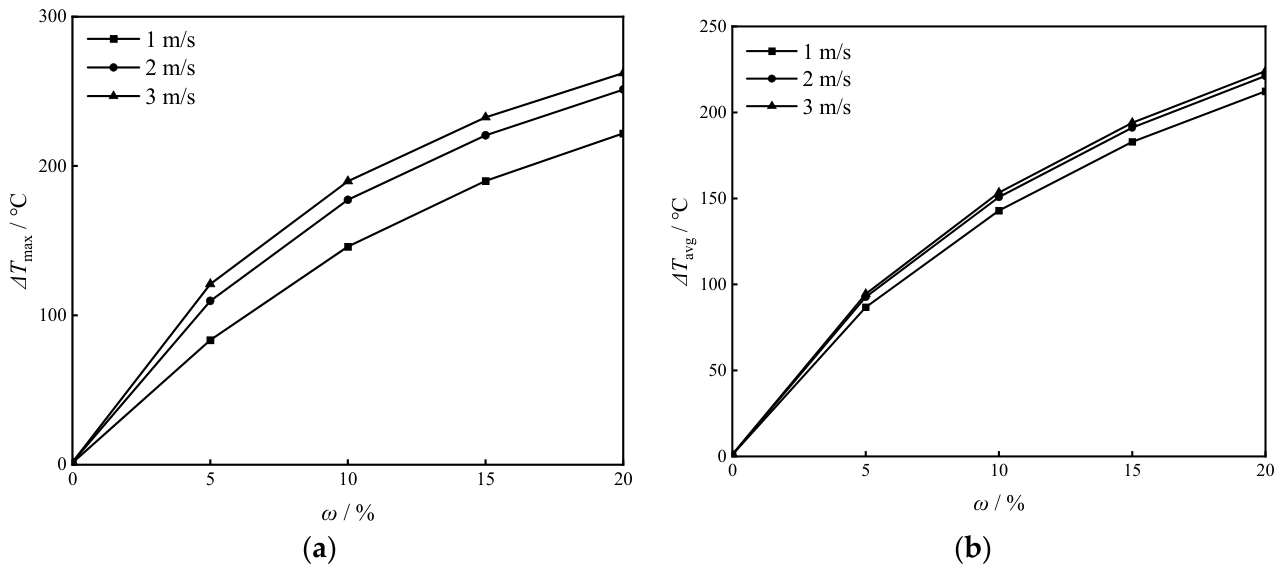
A direct consequence of the above is that the wall-to-interface temperature drop ΔT widens as the inlet velocity is increased, particularly at high coking degrees, as shown in Figure 12. At ω = 0%, the maximum ΔT only changes from 1.3 °C to 1.7 °C as the velocity is increased from 1 m/s to 3 m/s—a variation of less than 0.5 °C. By contrast, at ω = 20%, the maximum ΔT increases significantly from 222 °C to 262 °C over the same velocity range, a change of 40 °C. The mean ΔT exhibits the same monotonic increase with the velocity.
The mechanism underlying this widening of ΔT can be summarized through three coupled effects:
(1) Inner-side convective intensification: According to the Rogers–Mayhew correlation adopted in this study (Nu ∝ Re0.85), the in-tube convective heat-transfer coefficient hi approximately scales as hi ∝ Re0.85. Tripling the inlet velocity increases the Reynolds number by a factor of three and raises hi by a factor of approximately 2.5, which significantly lowers the inner-wall temperature.
(2) Limited outer-side response: The outer-wall temperature is primarily governed by the gas-side convective heat transfer and is therefore weakly coupled to the in-tube velocity at the fixed gas-side load.
(3) Combined effect—progressive decoupling of inner and outer walls: As a consequence of (1) and (2), the inner-wall temperature decreases substantially with the increasing velocity, while the outer-wall temperature remains nearly unchanged. Because the coke layer has an extremely low thermal conductivity (λc = 0.2 W/(m·K)), the temperature reduction on the oil side is not efficiently transmitted across the coke layer to the outer wall; the coke layer thus acts as a thermal bottleneck that increasingly decouples the two wall surfaces as its thickness grows, and the net effect is a widening of ΔT that is amplified at higher coking degrees.
Combined, these three effects imply that, at the same coking degree, increasing the inlet velocity lowers the inner-wall temperature substantially while leaving the outer-wall temperature nearly unchanged, thereby widening ΔT—and more so the higher the coking degree. This finding indicates that, under heavily coked conditions, simply increasing the inlet velocity cannot fundamentally restore the heat-transfer performance; moreover, the accompanying widening of ΔT indicates an increasing thermal gradient across the tube wall, which may have implications for structural integrity assessment—though a dedicated thermo-mechanical analysis is required to quantify this effect. Consequently, coking management should primarily rely on prevention and periodic cleaning rather than on flow-rate adjustment alone.

3.3.2. Effect on Total Heat Absorption

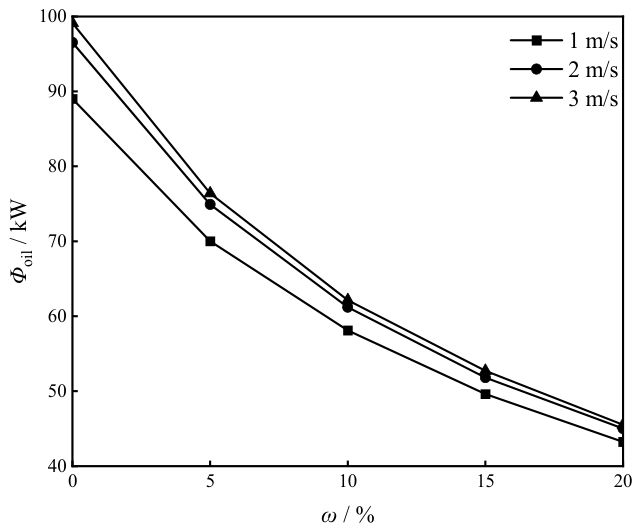
From the system-level perspective, the total heat absorbed by the thermal oil rises with increasing inlet velocity, but the strength of this trend weakens as the coking degree grows, as shown in Figure 13. Under the clean-wall condition, raising the inlet velocity from 1 m/s to 3 m/s increases the heat absorption from 89,007 W to 99,112 W, an increase of approximately 11%. At ω = 20%, the corresponding values are 43,245 W, 45,031 W, and 45,522 W at v = 1, 2, and 3 m/s, respectively, yielding an increase of only 5.3% across the same velocity range—roughly half the value obtained under clean-wall operation. The differences in heat absorption between different velocities thus shrink markedly with the increasing coking degree. This finding indicates that flow intensification is highly effective at enhancing heat absorption when the wall is clean but becomes substantially less effective once the coke-layer resistance dominates the overall thermal balance.
In summary, the in-tube inlet velocity exerts an important but bounded regulating role in coking-affected heat transfer. At low coking degrees, increasing the velocity significantly enhances the convective heat transfer, lowers the outer-wall temperature, and improves the overall heat absorption. At high coking degrees, however, the dominance of the coke layer’s thermal resistance limits the velocity’s regulating capacity, and the velocity increase additionally widens the wall-to-interface temperature drop. From an engineering standpoint, the sustained safe operation of OHC furnaces cannot be achieved through flow-rate adjustment alone; effective coking control requires a combined strategy that emphasizes coking prevention together with periodic decoking so as to achieve a balance between heat-transfer performance and operational safety.

4. Conclusions

A three-dimensional steady-state conjugate heat-transfer model of an organic heat carrier (OHC) furnace helical coil, incorporating the additional thermal resistance of the inner-wall coke layer through a thin-wall formulation, has been developed and validated. The effects of the coking degree (ω = 0–20%) and the thermal-oil inlet velocity (1–3 m/s) on the temperature field and overall heat-transfer performance have been systematically investigated. The principal conclusions are as follows:
(1) The Dean vortex secondary flow induced by the coil curvature governs both the heat-transfer enhancement and the circumferential non-uniformity of the temperature field. It raises the overall convective heat-transfer coefficient relative to a straight tube, while simultaneously producing a higher axial velocity and a thinner thermal boundary layer on the centrifugal side, leading to a pronounced circumferential asymmetry in both the in-tube oil temperature and the outer-wall temperature distributions.
(2) The coke layer induces a characteristic “outer-wall heating, inner-wall cooling” response. As ω increases from 0% to 20%, the maximum outer-wall temperature rises from 344 °C to 572 °C (an increase of 66.3%), while the maximum inner-wall temperature decreases by 6.5%. The wall-to-interface temperature drop ΔT increases from 1.61 °C to 251 °C—a rise of more than two orders of magnitude—with the most rapid growth occurring in the early coking stage (ω = 0–5%), demonstrating that even slight coking substantially alters the heat-transfer behavior.
(3) Coking strongly inhibits the overall heat-transfer capacity: the total heat absorbed by the thermal oil decreases from 96,540 W to 45,030 W (a 53.4% reduction) as ω increases from 0% to 20%, with the decline most pronounced in the early coking stage.
(4) The thermal-oil inlet velocity plays an important but bounded regulating role. Under clean-wall conditions, raising the velocity from 1 m/s to 3 m/s lowers the maximum outer-wall temperature by 59 °C, whereas at ω = 20%, the corresponding reduction is only 6.6 °C. Coking prevention and periodic decoking should therefore be regarded as the primary operational safeguards, with flow-rate optimization serving as a supplementary measure mainly applicable in the early coking stage.
From a practical standpoint, the simulation results indicate that, beyond ω ≈ 5% (δc ≈ 1.25 mm), the maximum outer-wall temperature exceeds 440 °C, and the heat absorption begins to decline rapidly. Operators of OHC furnaces are therefore recommended to consider periodic decoking when the outer-wall temperature rise exceeds approximately 100 °C above the clean-wall baseline. It should be noted that this threshold is a preliminary numerical estimate derived from the present simulations rather than a validated industrial maintenance criterion; the actual maintenance threshold will additionally depend on specific operating conditions, tube material properties, inspection standards, and safety regulations.

Author Contributions

Conceptualization, M.D. and B.L.; methodology, M.D. and B.L.; software, B.L.; validation, B.L. and T.Z.; formal analysis, B.L. and S.H.; investigation, B.L.; resources, M.D. and Y.Z.; data curation, B.L.; writing—original draft preparation, B.L.; writing—review and editing, M.D. and Y.Z.; visualization, B.L. and S.H.; supervision, M.D. and Y.Z.; project administration, M.D.; funding acquisition, M.D. and Y.Z. All authors have read and agreed to the published version of the manuscript.

Funding

This research was funded by the Science and Technology Program of the Jiangsu Administration for Market Regulation, grant number KJ2025029.

Data Availability Statement

The original contributions presented in this study are included in the article. Further inquiries can be directed to the corresponding authors.

Acknowledgments

The authors gratefully acknowledge the Jiangsu Special Equipment Safety Supervision Inspection Institute for providing experimental facilities and technical support during this research.

Conflicts of Interest

The authors declare no conflicts of interest.

References

  1. Ben-Mansour, R.; El-Ferik, S.; Al-Naser, M.; Qureshi, B.A.; Eltoum, M.A.M.; Abuelyamen, A.; Al-Sunni, F.; Ben Mansour, R. Experimental/Numerical Investigation and Prediction of Fouling in Multiphase Flow Heat Exchangers: A Review. Energies 2023, 16, 2812. [Google Scholar] [CrossRef] [Scilit]
  2. Cheng, Y.; Wang, Y.; Jiang, P.-X.; Zhu, Y. Oxidative and Pyrolytic Coking Characteristics of Supercritical-Pressure n-Decane and Its Influence Mechanism on Heat Transfer. Fuel 2024, 362, 130874. [Google Scholar] [CrossRef] [Scilit]
  3. Bott, T.R. Fouling of Heat Exchangers; Elsevier: Amsterdam, The Netherlands, 1995; ISBN 978-0-08-053190-8. [Google Scholar]
  4. Ishiyama, E.M.; Pugh, S.J.; Watkinson, A.P. Interaction of Heat Transfer Enhancement and Fouling in Operating Heat Exchangers. Heat Transf. Eng. 2024, 45, 1327–1337. [Google Scholar] [CrossRef] [Scilit]
  5. Bayat, M.; Aminian, J.; Bazmi, M.; Shahhosseini, S.; Sharifi, K. CFD Modeling of Fouling in Crude Oil Pre-Heaters. Energy Convers. Manag. 2012, 64, 344–350. [Google Scholar] [CrossRef] [Scilit]
  6. Li, X.-G.; Zhang, L.-H.; Zhang, R.-Y.; Sun, Y.-L.; Jiang, B.; Luo, M.-F.; Li, X.-G. CFD Modeling of Phase Change and Coke Formation in Petroleum Refining Heaters. Fuel Process. Technol. 2015, 134, 18–25. [Google Scholar] [CrossRef] [Scilit]
  7. Emani, S.; Ramasamy, M.; Shaari, K.Z.B.K. Effect of Shear Stress on Crude Oil Fouling in a Heat Exchanger Tube Through CFD Simulations. Procedia Eng. 2016, 148, 1058–1065. [Google Scholar] [CrossRef] [Scilit]
  8. Vandewalle, L.A.; Van Cauwenberge, D.J.; Dedeyne, J.N.; Van Geem, K.M.; Marin, G.B. Dynamic Simulation of Fouling in Steam Cracking Reactors Using CFD. Chem. Eng. J. 2017, 329, 77–87. [Google Scholar] [CrossRef] [Scilit]
  9. Li, H.; Lan, H.; Sun, Y.; Song, Q.; Wang, X.; Li, F.; Zhang, W. A Review on Pyrolysis and Coking of Liquid Hydrocarbons in Heated Pipe. Appl. Energy 2025, 394, 126159. [Google Scholar] [CrossRef] [Scilit]
  10. Tao, Z.; Hu, X.; Zhu, J.; Cheng, Z. Numerical Study of Flow and Heat Transfer of N-Decane with Pyrolysis and Pyrolytic Coking under Supercritical Pressures. Energy Fuels 2017, 31, 8698–8707. [Google Scholar] [CrossRef] [Scilit]
  11. Bao, Z.; Ye, T.; Wang, R.; Zhu, Q. Experiment and Modelling of Supercritical Pyrolysis and Coking of RP-3 Aviation Kerosene in a U-Bend Tube. Chem. Eng. J. 2023, 454, 140234. [Google Scholar] [CrossRef] [Scilit]
  12. Wang, R.; Ye, T.; Bao, Z.; Zhu, Q. Numerical Analysis of Pyrolysis and Coking of Aviation Kerosene in a Rectangular U-Bend Tube under One-Side Heating. Int. J. Heat Mass Transf. 2023, 214, 124379. [Google Scholar] [CrossRef] [Scilit]
  13. Li, Q.; Li, Q.; Wang, F.; Wu, J.; Wang, Y.; Jin, J. Effects of Geological and Fluid Characteristics on the Injection Filtration of Hydraulic Fracturing Fluid in the Wellbores of Shale Reservoirs: Numerical Analysis and Mechanism Determination. Processes 2025, 13, 1747. [Google Scholar] [CrossRef] [Scilit]
  14. Li, Q.; You, D.; Li, Q.; Wang, F.; Wang, Y.; Yang, Y. Analysis of Sedimentation Behavior and Influencing Factors of Solid Particles in CO2 Fracturing Fluid. Processes 2025, 13, 4049. [Google Scholar] [CrossRef] [Scilit]
  15. Li, Q.; Li, Q.; Wu, J.; He, K.; Xia, Y.; Liu, J.; Wang, F.; Cheng, Y. Wellhead Stability During Development Process of Hydrate Reservoir in the Northern South China Sea: Sensitivity Analysis. Processes 2025, 13, 1630. [Google Scholar] [CrossRef] [Scilit]
  16. Amini, E.; Peyghambarzadeh, S.M.; Zarrinabadi, S.; Hashemabadi, S.H. Simulation of Heat Transfer and Fluid Flow of Hot Oil in Radiation Section of an Industrial Furnace Considering Coke Deposition. J. Therm. Anal. Calorim. 2022, 147, 4821–4835. [Google Scholar] [CrossRef] [Scilit]
  17. Feng, J.; Yan, Y.; Zhang, L.; Liu, Y.; Zhou, C. Numerical Study of Heat Transfer Characteristics of Organic Heat Carrier Furnace Chamber. Int. Commun. Heat Mass Transf. 2023, 148, 107020. [Google Scholar] [CrossRef] [Scilit]
  18. Berger, S.A.; Talbot, L.; Yao, L.-S. Flow in Curved Pipes. Annu. Rev. Fluid Mech. 1983, 15, 461–512. [Google Scholar] [CrossRef] [Scilit]
  19. Flayyih, R.A.; Alwan, K.J.; Aljaberi, H.A. Comparative Heat Transfer Analysis of Helical Coil and Straight Tube Heat Exchangers. Case Stud. Therm. Eng. 2025, 76, 107386. [Google Scholar] [CrossRef] [Scilit]
  20. Fallah Najafabadi, M.; Farhadi, M.; Talebi Rostami, H. Numerically Analysis of a Phase-Change Material in Concentric Double-Pipe Helical Coil with Turbulent Flow as Thermal Storage Unit in Solar Water Heaters. J. Energy Storage 2022, 55, 105712. [Google Scholar] [CrossRef] [Scilit]
  21. Basit Shafiq, M.; Allauddin, U.; Qaisrani, M.A.; Rehman, T.; Ahmed, N.; Usman Mushtaq, M.; Ali, H.M. Thermal Performance Enhancement of Shell and Helical Coil Heat Exchanger Using MWCNTs/Water Nanofluid. J. Therm. Anal. Calorim. 2022, 147, 12111–12126. [Google Scholar] [CrossRef] [Scilit]
  22. Yakhot, V.; Orszag, S.A. Renormalization Group Analysis of Turbulence. I. Basic Theory. J. Sci. Comput. 1986, 1, 3–51. [Google Scholar] [CrossRef] [Scilit]
  23. Kader, B.A. Temperature and Concentration Profiles in Fully Turbulent Boundary Layers. Int. J. Heat Mass Transf. 1981, 24, 1541–1544. [Google Scholar] [CrossRef] [Scilit]
  24. Patankar, S.V. Numerical Heat Transfer and Fluid Flow; Series in Computational Methods in Mechanics and Thermal Sciences; CRC Press: Boca Raton, FL, USA, 1980. [Google Scholar]
  25. Rogers, G.F.C.; Mayhew, Y.R. Heat Transfer and Pressure Loss in Helically Coiled Tubes with Turbulent Flow. Int. J. Heat Mass Transf. 1964, 7, 1207–1216. [Google Scholar] [CrossRef] [Scilit]
  26. Jayakumar, J.S.; Mahajani, S.M.; Mandal, J.C.; Vijayan, P.K.; Bhoi, R. Experimental and CFD Estimation of Heat Transfer in Helically Coiled Heat Exchangers. Chem. Eng. Res. Des. 2008, 86, 221–232. [Google Scholar] [CrossRef] [Scilit]
  27. Hardik, B.K.; Baburajan, P.K.; Prabhu, S.V. Local Heat Transfer Coefficient in Helical Coils with Single Phase Flow. Int. J. Heat Mass Transf. 2015, 89, 522–538. [Google Scholar] [CrossRef] [Scilit]
  28. Dittus, F.W.; Boelter, L.M.K. Heat Transfer in Automobile Radiators of the Tubular Type. Univ. Calif. Publ. Eng. 1930, 2, 443–461. [Google Scholar] [CrossRef] [Scilit]
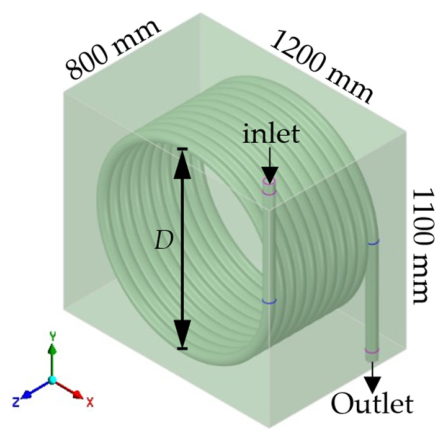
Figure 1. Schematic of the 3D computational domain.
Processes 14 01722 g001
Figure 2. Computational mesh used in the simulations: (a) overall mesh of the coupled gas–oil domain; (b) close-up view of the helical-coil mesh.
Processes 14 01722 g002
Figure 3. Grid-independence study showing the variation in the maximum outer-wall temperature, mean outer-wall temperature, and mean outlet oil temperature with mesh size.
Processes 14 01722 g003
Figure 4. Temperature distribution contour maps of the outer wall of furnace tubes under different degrees of coking: (a) ω = 0%; (b) ω = 5%; (c) ω = 10%; (d) ω = 15%; and (e) ω = 20%.
Processes 14 01722 g004
Figure 5. Oil-domain temperature field on the Y = 0 cross-section at different coking degrees.
Processes 14 01722 g005
Figure 6. Cross-sectional velocity vector field at ω = 0%, v = 2 m/s: (a) velocity vector distribution; (b) velocity vectors superimposed on the oil temperature field.
Processes 14 01722 g006
Figure 7. Variation in inner- and outer-wall temperatures with coking degree: (a) maximum value; (b) average value.
Processes 14 01722 g007
Figure 8. Variation in the wall-to-interface temperature drop ΔT with coking degree: (a) maximum value; (b) average value.
Processes 14 01722 g008
Figure 9. Variation in total heat absorption of thermal oil with coking degree.
Processes 14 01722 g009
Figure 10. Variation in outer-wall temperature with coking degree at different inlet velocities: (a) maximum value; (b) average value.
Processes 14 01722 g010
Figure 11. Variation in inner-wall temperature with coking degree at different inlet velocities: (a) maximum value; (b) average value.
Processes 14 01722 g011
Figure 12. Variation in the wall-to-interface temperature drop with coking degree at different inlet velocities: (a) maximum value; (b) average value.
Processes 14 01722 g012
Figure 13. Variation in total heat absorption of thermal oil with coking degree at different inlet velocities.
Processes 14 01722 g013
Table 1. Thermophysical properties of the thermal oil, coke layer, and tube material used in the simulations.
Materialρ (kg/m3)cp (J·kg−1·K−1)λ (W·m−1·K−1)μ (kg·m−1·s−1)
Thermal oil868.221000.120.01867
Coke layer120012000.20/
20G boiler steel785046048/
Table 2. Validation against Rogers–Mayhew correlation.
Flow Rate (m/s)ReNu (CFD)Nu (Rogers)Deviation (%)
12324131.20125.544.5
24648243.64226.287.7
36972324.61319.401.6
Disclaimer/Publisher’s Note: The statements, opinions and data contained in all publications are solely those of the individual author(s) and contributor(s) and not of MDPI and/or the editor(s). MDPI and/or the editor(s) disclaim responsibility for any injury to people or property resulting from any ideas, methods, instructions or products referred to in the content.