1. Introduction
The design of column internals is crucial for efficient gas–liquid mass transfer, as it precisely governs the spatial distribution and contacting mode of the two phases. Among these internals, the liquid distributor plays a particularly critical role: it uniformly distributes the incoming liquid over the entire cross-section of the packing or trays [
1], establishes stable and uniform inlet conditions for downstream mass transfer, and promotes the dispersion of the liquid as ideal films or droplets, thereby creating a large, fully developed, and continuously renewed interfacial area. Through the synergistic integration of the liquid distributor, packings, or trays, the liquid-phase flow is effectively equalized, localized flooding and weeping are suppressed [
2], a uniform radial and axial flow pattern is maintained, and the effective specific surface area is maximized [
3]. This systematic structuring of the flow field directly amplifies the utilization of the mass transfer driving force and ultimately determines the separation efficiency, product purity, and energy consumption [
4,
5]. However, poor initial liquid distribution remains a major bottleneck limiting the overall performance of columns [
6,
7]: maldistribution characterized by liquid channeling, wall flow, and non-uniform radial coverage creates dry zones in the packing, drastically reducing the effective interfacial area [
8], and inevitably leads to a decline in separation efficiency, loss of theoretical stages, and increased energy consumption [
9]. As process intensification drives ever-larger column diameters and increasingly wide turndown ratios, maintaining excellent liquid distribution under extreme conditions—such as ultra-high or ultra-low liquid loads, and fluids with complex physicochemical properties—has become a key challenge for the continued advancement of column technology [
10,
11,
12,
13].
From a fundamental gas–liquid mass transfer perspective, the overall volumetric mass-transfer coefficients (
KGa and
KLa) and the height equivalent to a theoretical plate (HETP) or height of a transfer unit (HTU) of a column are exquisitely sensitive to the quality of the initial liquid distribution. Both experimental evidence and industrial practice have repeatedly demonstrated that initial liquid maldistribution can increase HETP by 25~40% [
14], and, in severe cases, can cause complete separation failure [
15].
Modern high-performance structured packings such as Sulzer MellapakPlus™ or Koch-Glitsch Flexipac HC can significantly cut pressure drop while boosting capacity and theoretical stage count. But here is the catch: their natural ability to spread liquid sideways is extremely limited. So, they are very picky about how evenly liquid is initially distributed. Even small design or installation imperfections can cause notable efficiency losses, wiping out the benefits these advanced packings are supposed to bring [
16]. On top of that, real industrial separations often need to run reliably over a wide turndown range, sometimes as broad as 1:3 or even wider. That means the liquid distributor has to handle high loads without flooding, splashing, or excessive gas pressure drop, yet at low loads still give enough drip points, keep flow paths clear, and resist fouling. These conflicting needs have turned the liquid distributor from a simple flow-splitter into the key component that sets the separation efficiency and operating flexibility of the whole column.
Despite this recognized criticality, conventional trough-type liquid distributors still suffer from a fundamental and persistent shortcoming: the transverse momentum imparted by the feed stream generates undesirable liquid-level gradients and outflow non-uniformity, yet no systematic fluid-mechanic strategy has been devised to dissipate, redirect and re-distribute this kinetic energy within the trough. This bottleneck becomes particularly acute under high liquid loads and wide operating windows, where uncontrolled transverse flow severely degrades distribution fidelity. The central question addressed in this work is therefore: under high liquid loads and a wide operating window, how can the transverse flow kinetic energy inside a trough-type distributor be directionally harnessed and converted—starting from rigorous fluid mechanics—to achieve a stable liquid surface and highly uniform outflow? To answer this, we propose a novel design strategy grounded in the synergy between flow resistance and guidance. By integrating transverse baffles with vertical guide vanes, the strategy accomplishes a sequential process of dissipation, redirection, and redistribution of transverse kinetic energy, thereby reconstructing the velocity and hydrostatic pressure fields inside the trough. As a result, a uniformly distributed outflow—whether through orifices or over weirs—is obtained across the entire cross-section.
Industrial liquid distributors can be broadly categorized into three main categories: pipe distributors, disk distributors, and trough distributors [
17,
18,
19,
20].
Pipe distributors, operating as pressure-type devices, offer advantages such as high spray density, low pressure drop, compact footprint, and ease of installation and maintenance. However, their applicability is largely confined to clean, low-load systems with an absence of solid or particulates, as nozzle fouling quickly impairs uniformity [
21].
Disk distributors, which are gravity-type devices, can achieve high orifice density for potentially excellent uniformity. Nevertheless, the presence of risers constrains drip point arrangement, and the orifice diameter renders them susceptible to fouling, limiting their use in solid-containing or scaling systems. Furthermore, their performance is highly sensitive to installation levelness and can be destabilized by fluctuations in operating conditions.
Trough distributors, also operating on the gravity-driven principle, excel at high liquid loads. Their key strengths include large vapor passage area resulting in low gas-phase pressure drop, open construction (facilitating installation, maintenance, and leveling), high capacity, and flexibility under challenging conditions. Limitations include significant occupation of column cross-section and internal space. Distribution performance is sensitive to the support design, installation height, and levelness deviations. Critically, under high liquid loads, the feed stream entering the main trough can generate significant turbulence, vortices, and splashing, compromising effluent uniformity and consequently undermining mass transfer efficiency and operational stability [
18,
19].
In summary, although trough distributors dominate many industrial applications due to their operational flexibility and adaptability, they fall short in terms of spatial efficiency, liquid surface stability, and distribution uniformity under high liquid loads. Researchers have therefore pursued structural refinements and flow-control strategies to overcome these shortcomings, particularly under high loads and complex fluids. These efforts mark a shift from empirical modifications toward mechanism-driven, integrated designs.
Early single-stage troughs offered simplicity but poor flow regulation, leading to unstable distribution and large rate variations. Multi-stage troughs enhance stability by staged kinetic-energy dissipation and became industry standard. Subsequent developments incorporated baffles for flow rectification and wave damping under high liquid loads. Recent advances favor the increasingly adopted use of side orifices instead of bottom orifices, enlarging aperture size to reduce fouling susceptibility while mitigating the disruptive effect of cross-flow on effluent uniformity. Frank et al. (1983) [
22] designed a dual-weir trough distributor utilizing serrated overflow weirs and guide vanes to enhance cross-sectional uniformity. Lucero et al. (1991) [
23] proposed a multi-layer orifice-trough distributor with drip orifices at different elevations to increase capacity and turndown. Heggemann et al. (2007) [
24] employed CFD to elucidate the influence of transverse velocity on orifice coefficients and flow fluctuations, subsequently proposing a multi-baffle structure for flow stabilization. Yu et al. (2013) [
18] suggested increasing the distance from the orifice center to the trough bottom and adding baffles to mitigate adverse cross-flow effects. More recently, Xue et al. (2022) [
19] introduced a stepped-baffle narrow-groove distributor, utilizing compartmentalization and guide vanes to redirect high-velocity transverse flow into radial flow, achieving velocity homogenization within the trough and improving distribution performance.
These studies collectively illustrate a design evolution from passive energy dissipation towards active flow rectification and redistribution. The core objective is to reconstruct liquid momentum transfer pathways and stabilize the downstream flow field within the confined spatial constraints of the column, thereby counteracting the detrimental inertial and vortical effects prevalent at high Reynolds numbers to achieve superior distribution uniformity and operational stability. Addressing the challenges posed by wide operational windows and complex fluid properties, this paper builds upon the inherent fouling-resistant characteristics of trough distributors to propose a novel structural design concept based on resistance–diversion synergy, specifically aimed at enhancing distribution uniformity under high liquid loads. Concretely, this work advances beyond third-generation designs, utilizing the stepped-baffle narrow-groove distributor as a foundation and introducing a combined unit comprising transverse baffles and vertical guide vanes. This integrated unit aims to orchestrate a controlled conversion of the kinetic energy of the high-velocity fluid and optimize the allocation of its static pressure energy, thereby promoting uniform and stable liquid distribution. Maintaining uniform initial liquid distribution over a wide operating range provides a favorable initial distribution for the column, thereby ensuring stable separation efficiency.
The paper is organized as follows.
Section 2 analyzes hydrodynamic behavior and distribution mechanisms in trough distributors under varying baffle geometries and conditions, leading to the resistance-optimized structure.
Section 3 and
Section 4 detail the experimental setup and the numerical simulation methodology, respectively.
Section 5 presents the results and discussion, covering the effects of baffle configurations, operating conditions, and the regulatory mechanisms of key components.
Section 6 summarizes the main conclusions.
2. Analysis of Flow Mechanism
Laws [
25] provided a comprehensive review of perforated baffles as flow distributors, summarizing their primary effects on flow field homogenization: (i) introduction of flow resistance, which shifts the driving force from dynamic pressure to differential static pressure for pressure equalization; (ii) geometrical configuration of the distributor—such as baffle height, number, and spacing—modulates flow direction and rate; (iii) downstream flow separation, reattachment, and vortex shedding that can induce flow instability. These coupled phenomena collectively determine the distributor’s efficacy in regulating the overall flow distribution.
Stepped-baffle liquid distributors harness both flow resistance and deflection to achieve uniform liquid distribution, yet flow instability at high loads remains a critical limitation. This elevated pressure drives transverse redistribution: fluid flows from high- to low-pressure regions across the section, homogenizing the velocity field. As a result, transverse velocity disparities diminish, enabling more uniform flow rates through downstream orifices and improved overall distribution.
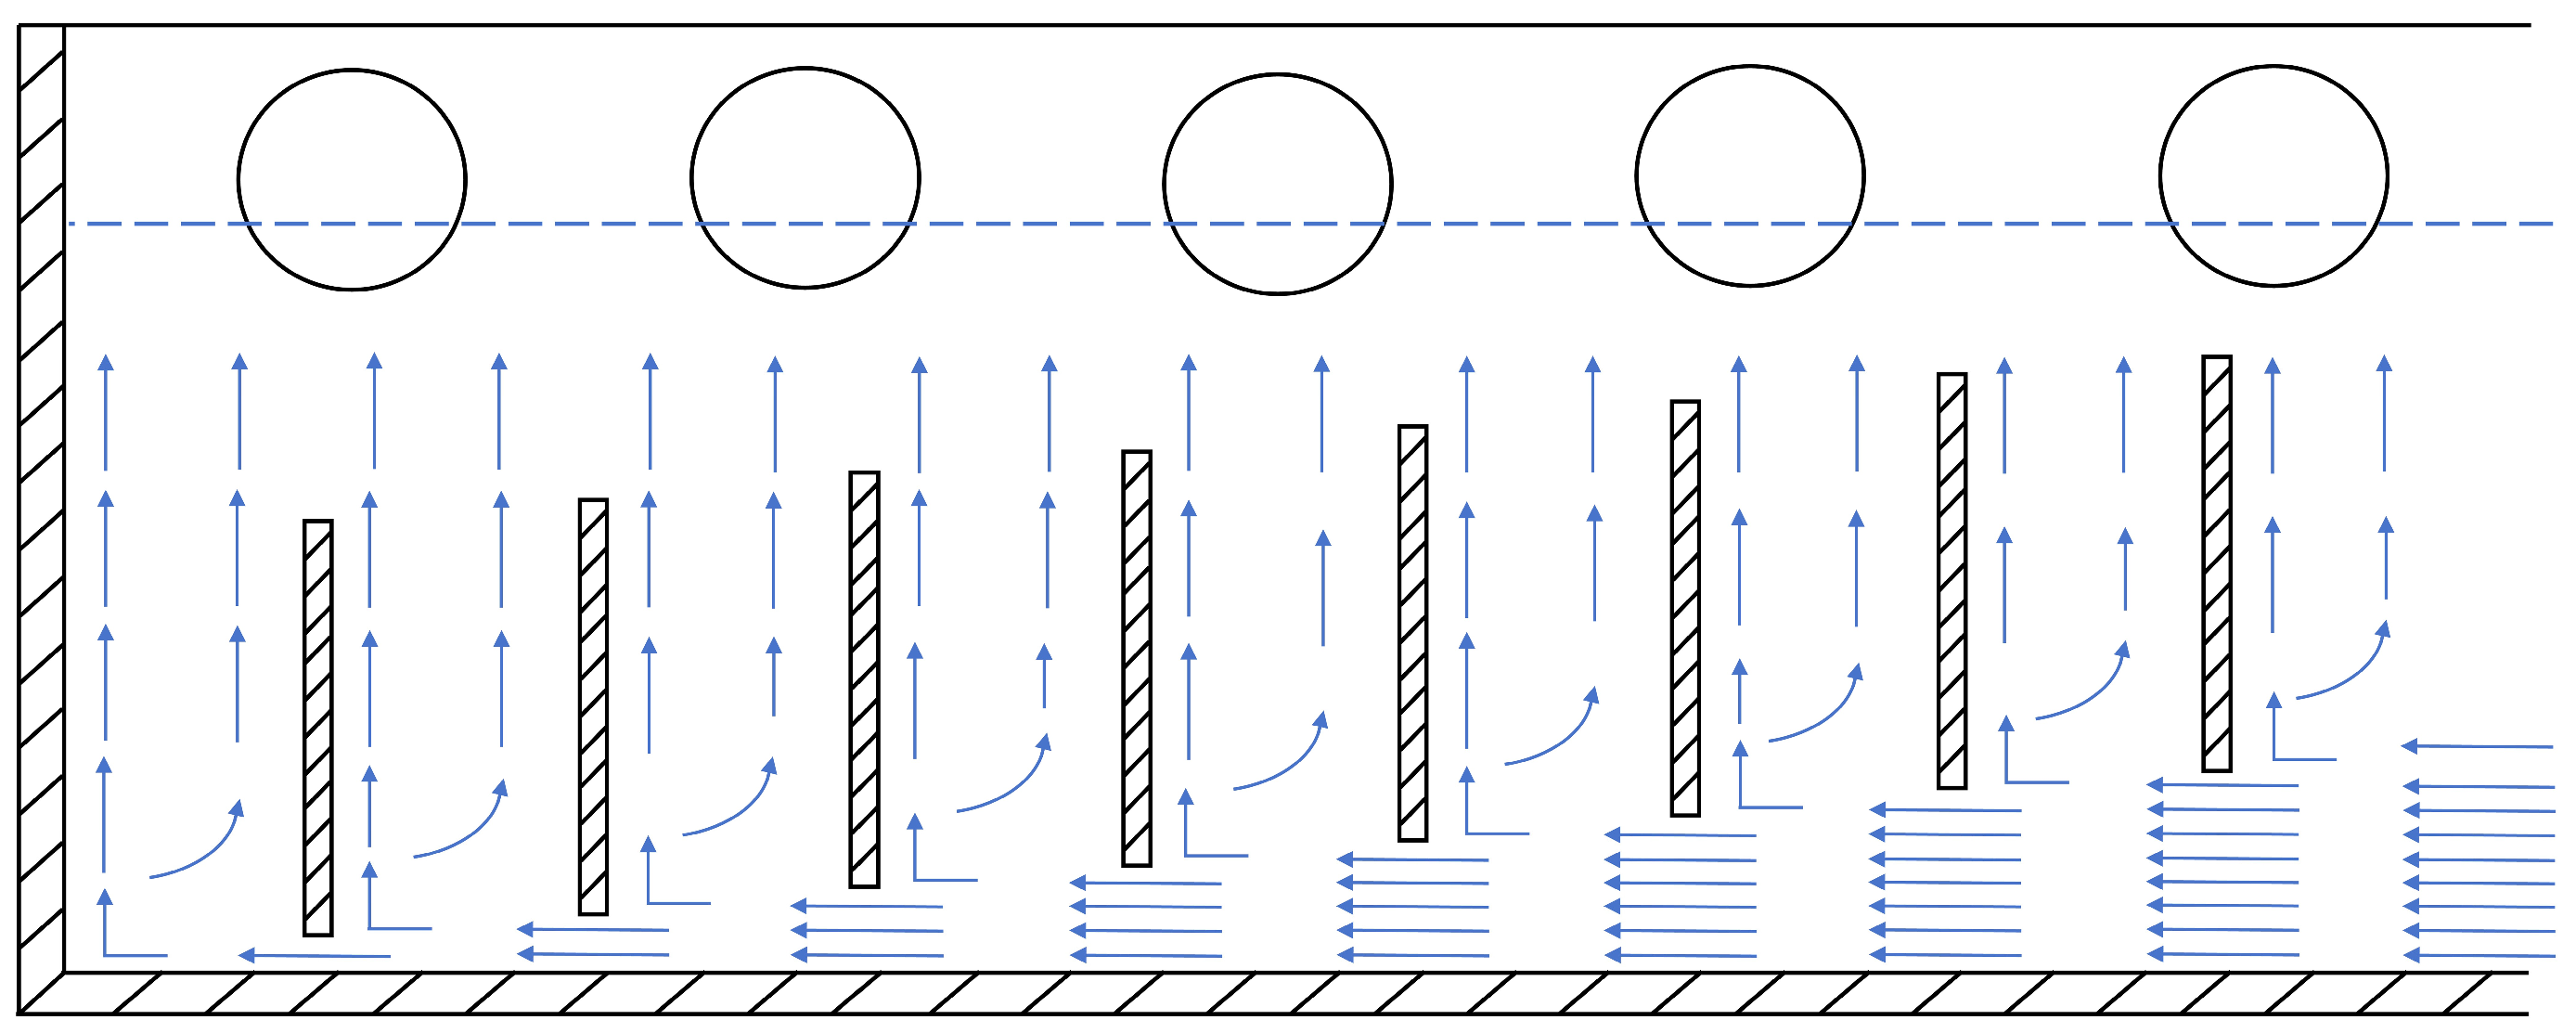
At low liquid loads (
Figure 1), fluid impinging upon a stepped baffle generates a stagnation zone on the upstream face near the base, converting the incoming kinetic energy into localized static pressure. This elevated static pressure drives transverse redistribution: fluid flows from the high-pressure to the low-pressure zone across the section, homogenizing the velocity field. This energy redistribution mechanism effectively mitigates transverse velocity disparities, significantly improving downstream velocity uniformity. Consequently, each effluent orifice receives a comparable flow rate, culminating in a relatively uniform liquid distribution.
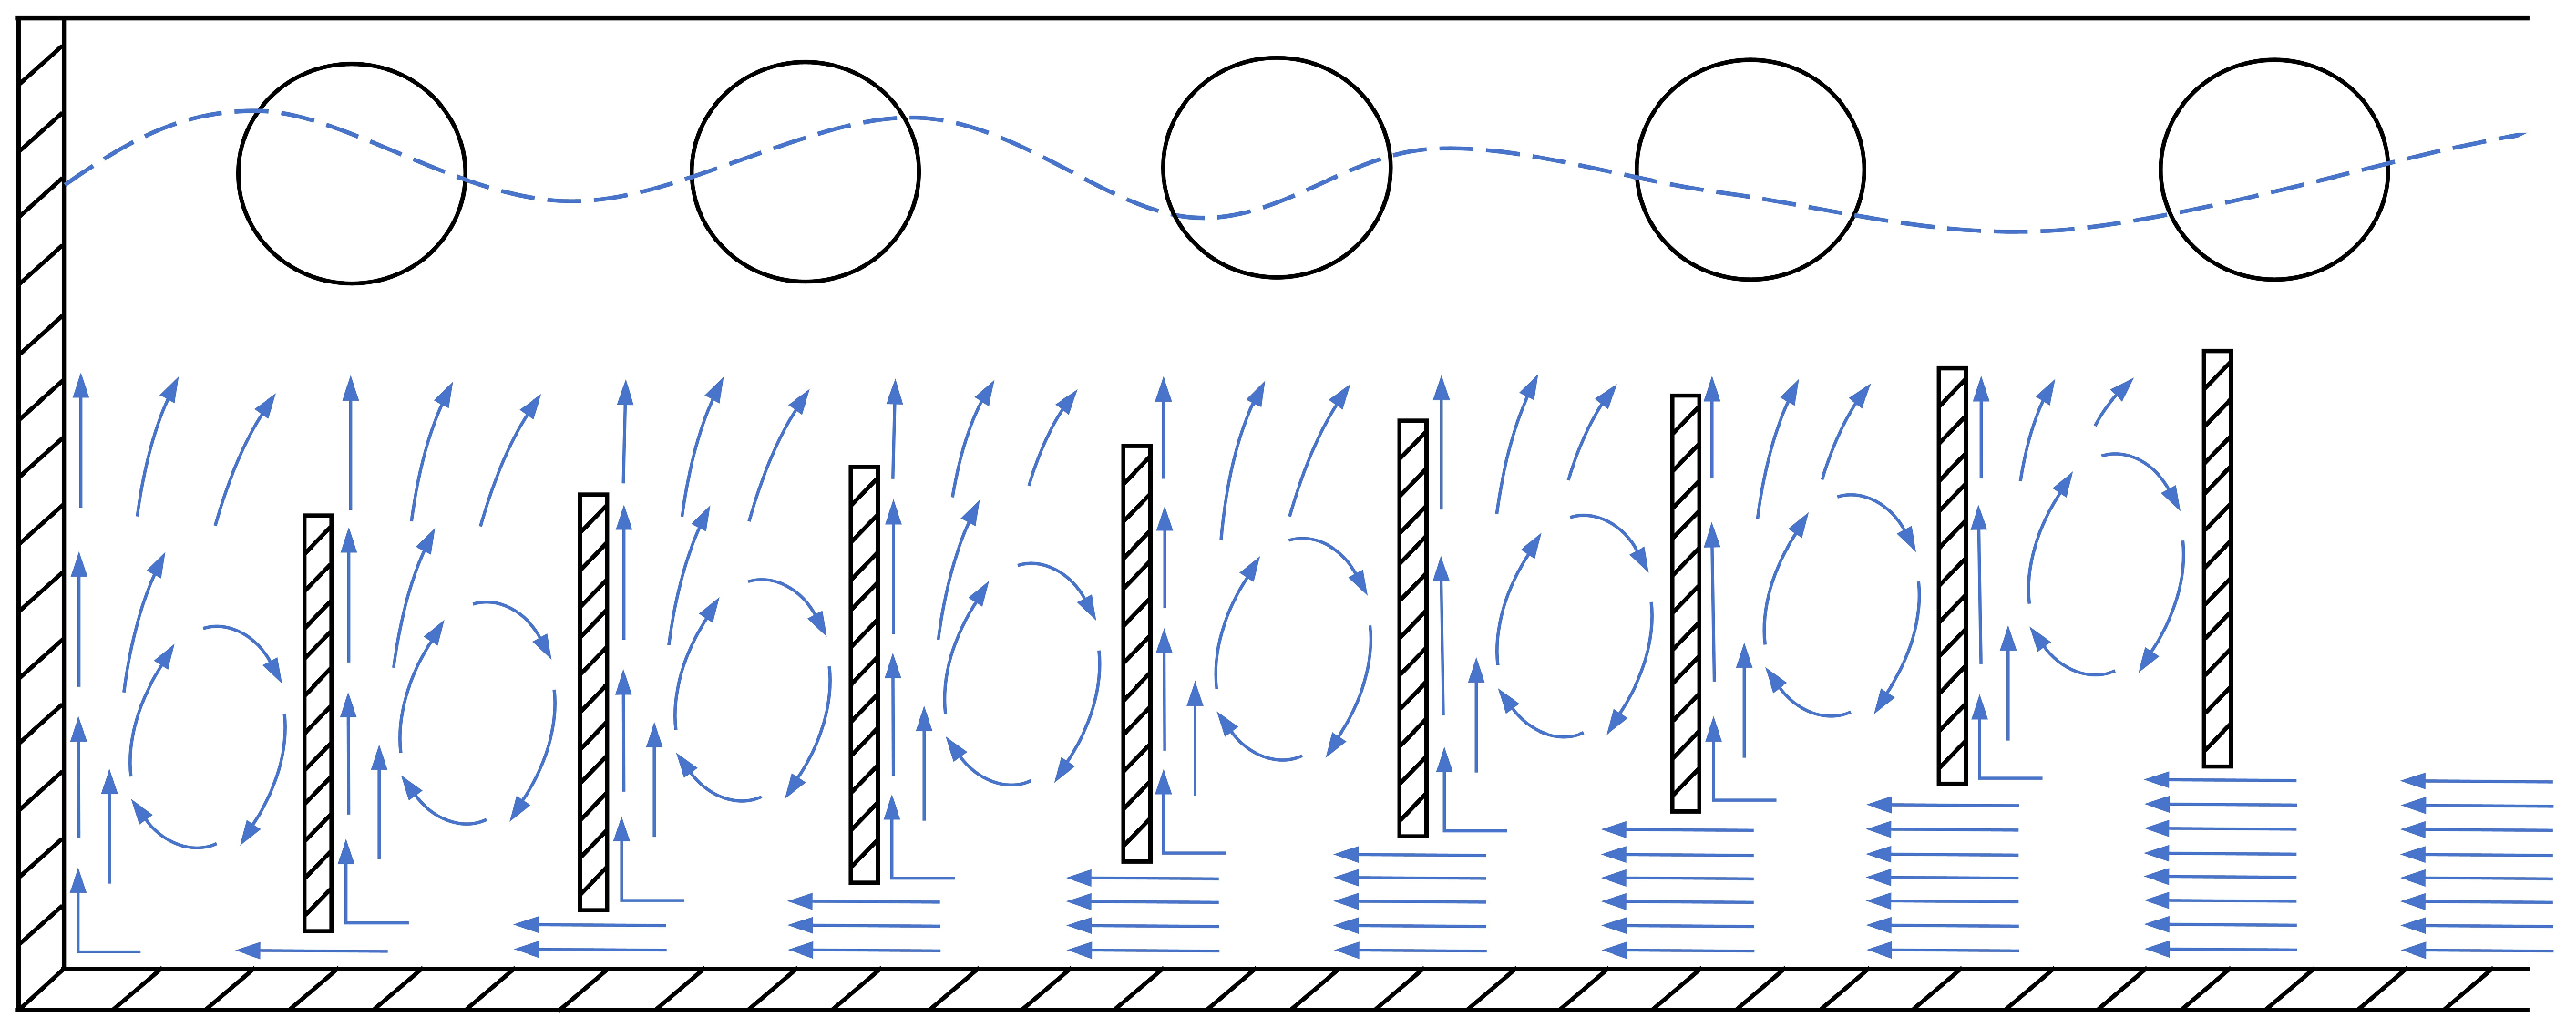
At high liquid loads (
Figure 2), the elevated inlet velocity amplifies inertial forces within the high-Reynolds-number flow. Strong adverse pressure gradients downstream of baffle edges trigger more extensive flow separation and the formation of large-scale, high-energy vortices. Concurrently, the intensity of secondary flows generated as the high-speed fluid navigates the channel increases markedly, excessively transporting fluid to specific zones and exacerbating transverse maldistribution. Moreover, at higher Reynolds numbers, turbulent fluctuations increase in both intensity and frequency, with violent eddy breakup and coalescence disrupting the flow field further. Consequently, the beneficial transverse pressure-gradient-driven redistribution is undermined, leading to significant non-uniformities in velocity and discharge rates [
26,
27].
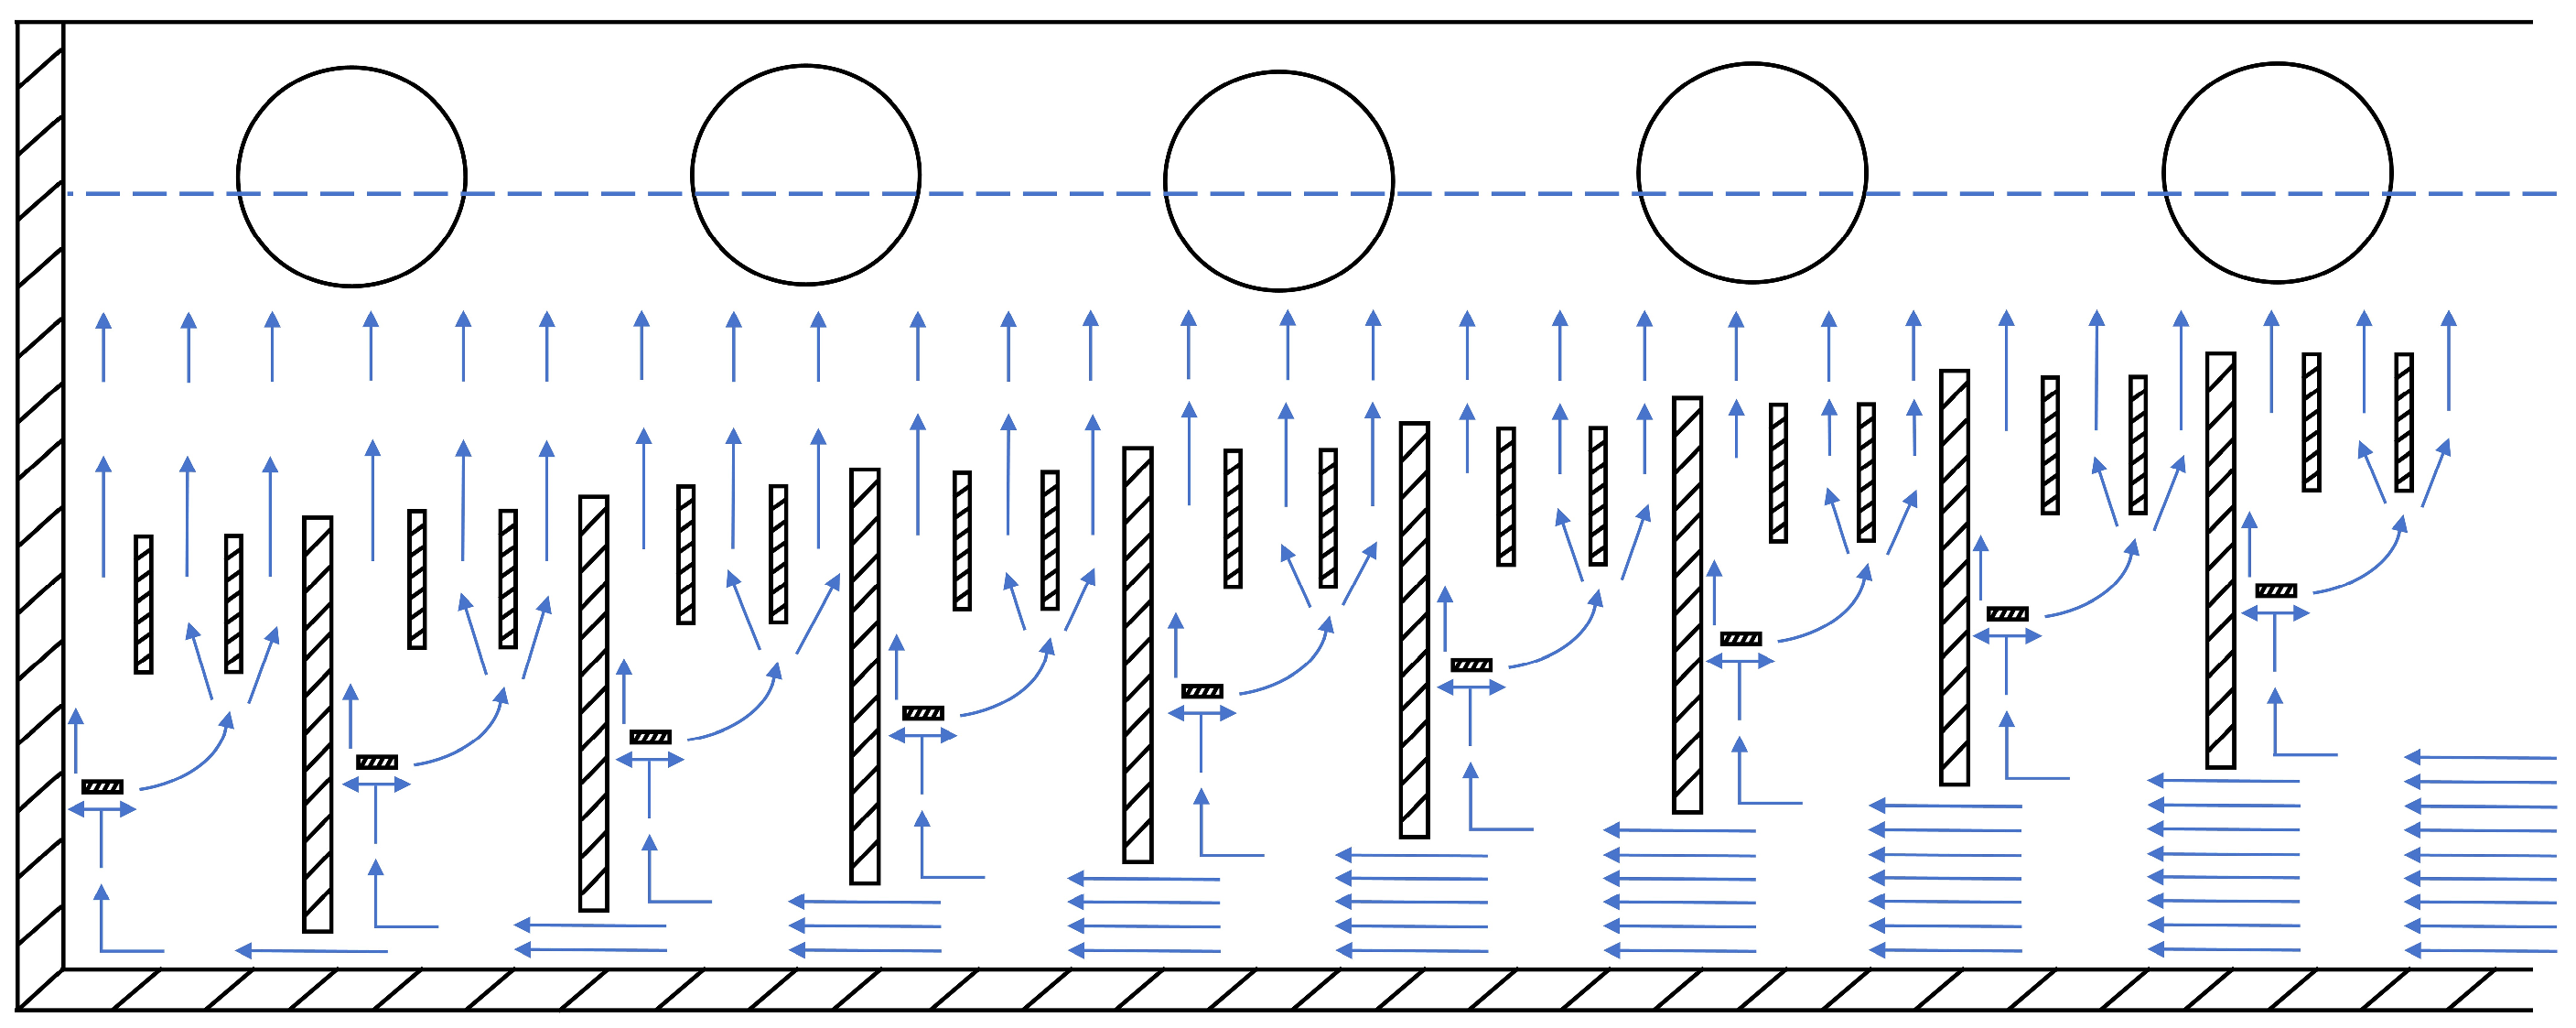
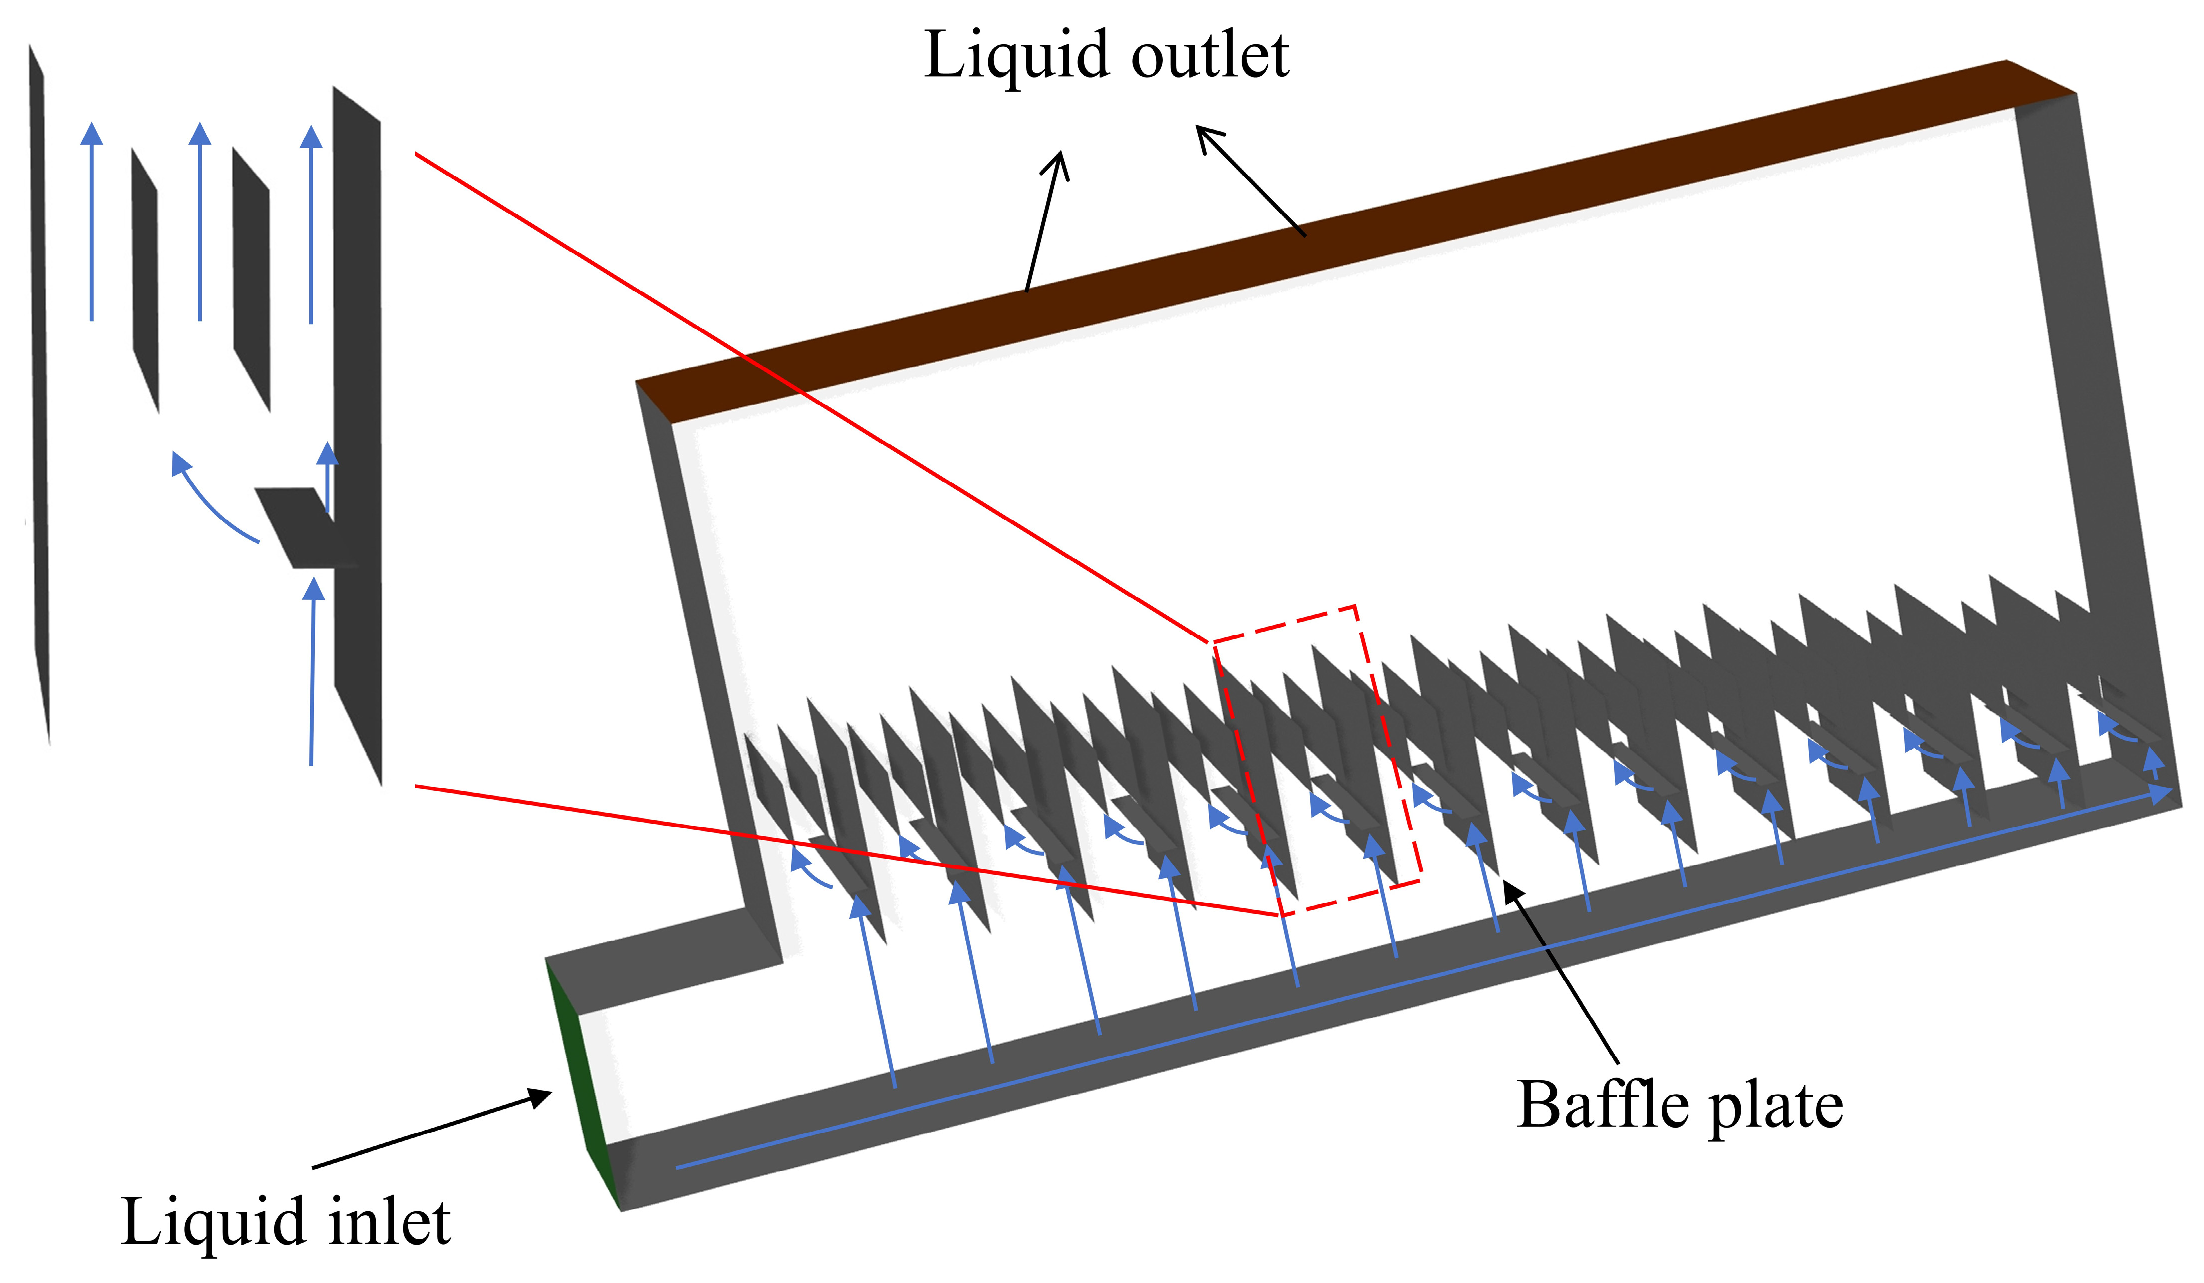
To ameliorate distribution performance under high-flow-rate conditions, this study proposes an optimized design based on resistance allocation, as depicted in
Figure 3. This design incorporates an additional transverse baffle and two symmetrically arranged vertical guide vanes between adjacent stepped baffles, establishing a synergistic resistance–diversion mechanism. The transverse baffle introduces a secondary throttling point within the flow channel, forcing a portion of the axially flowing fluid to undergo conversion of kinetic energy into static pressure energy, creating a localized high-pressure zone. This zone furnishes an additional driving force for transverse energy redistribution. It also partitions the primary separation zone, suppressing large-scale vortex development. Complementarily, the vertical guide vanes leverage the Coanda effect to rectify efflux trajectories. By establishing a controlled pressure gradient, they further inhibit the formation of large-scale recirculating vortices. This coordinated action ultimately promotes uniform flow-rate distribution at the outlets.
Through this synergy, the design can achieve balanced distribution of flow resistance, preventing excessive flow separation locally. It implements a two-stage energy conversion and redistribution pathway from stepped baffles to the transverse baffle, which is anticipated to enhance the stability and robustness of the static-pressure-gradient-driven redistribution. Furthermore, large-scale detrimental vortices are reorganized into smaller, ordered systems, with their energy dissipated into high-frequency turbulence, thereby reducing macroscopic disruption.
This configuration is expected to effectively suppress large-scale separation and vortex intensity at high Reynolds numbers, confine secondary flows, restore the efficacy of transverse energy redistribution, minimize flow rate disparities among effluent orifices, and extend the stable operational range of the distributor under high liquid loads.
3. Experimental Setup
The liquid distributor geometry employed in this work was adapted from the stepped-baffle distributor proposed by Xue et al. [
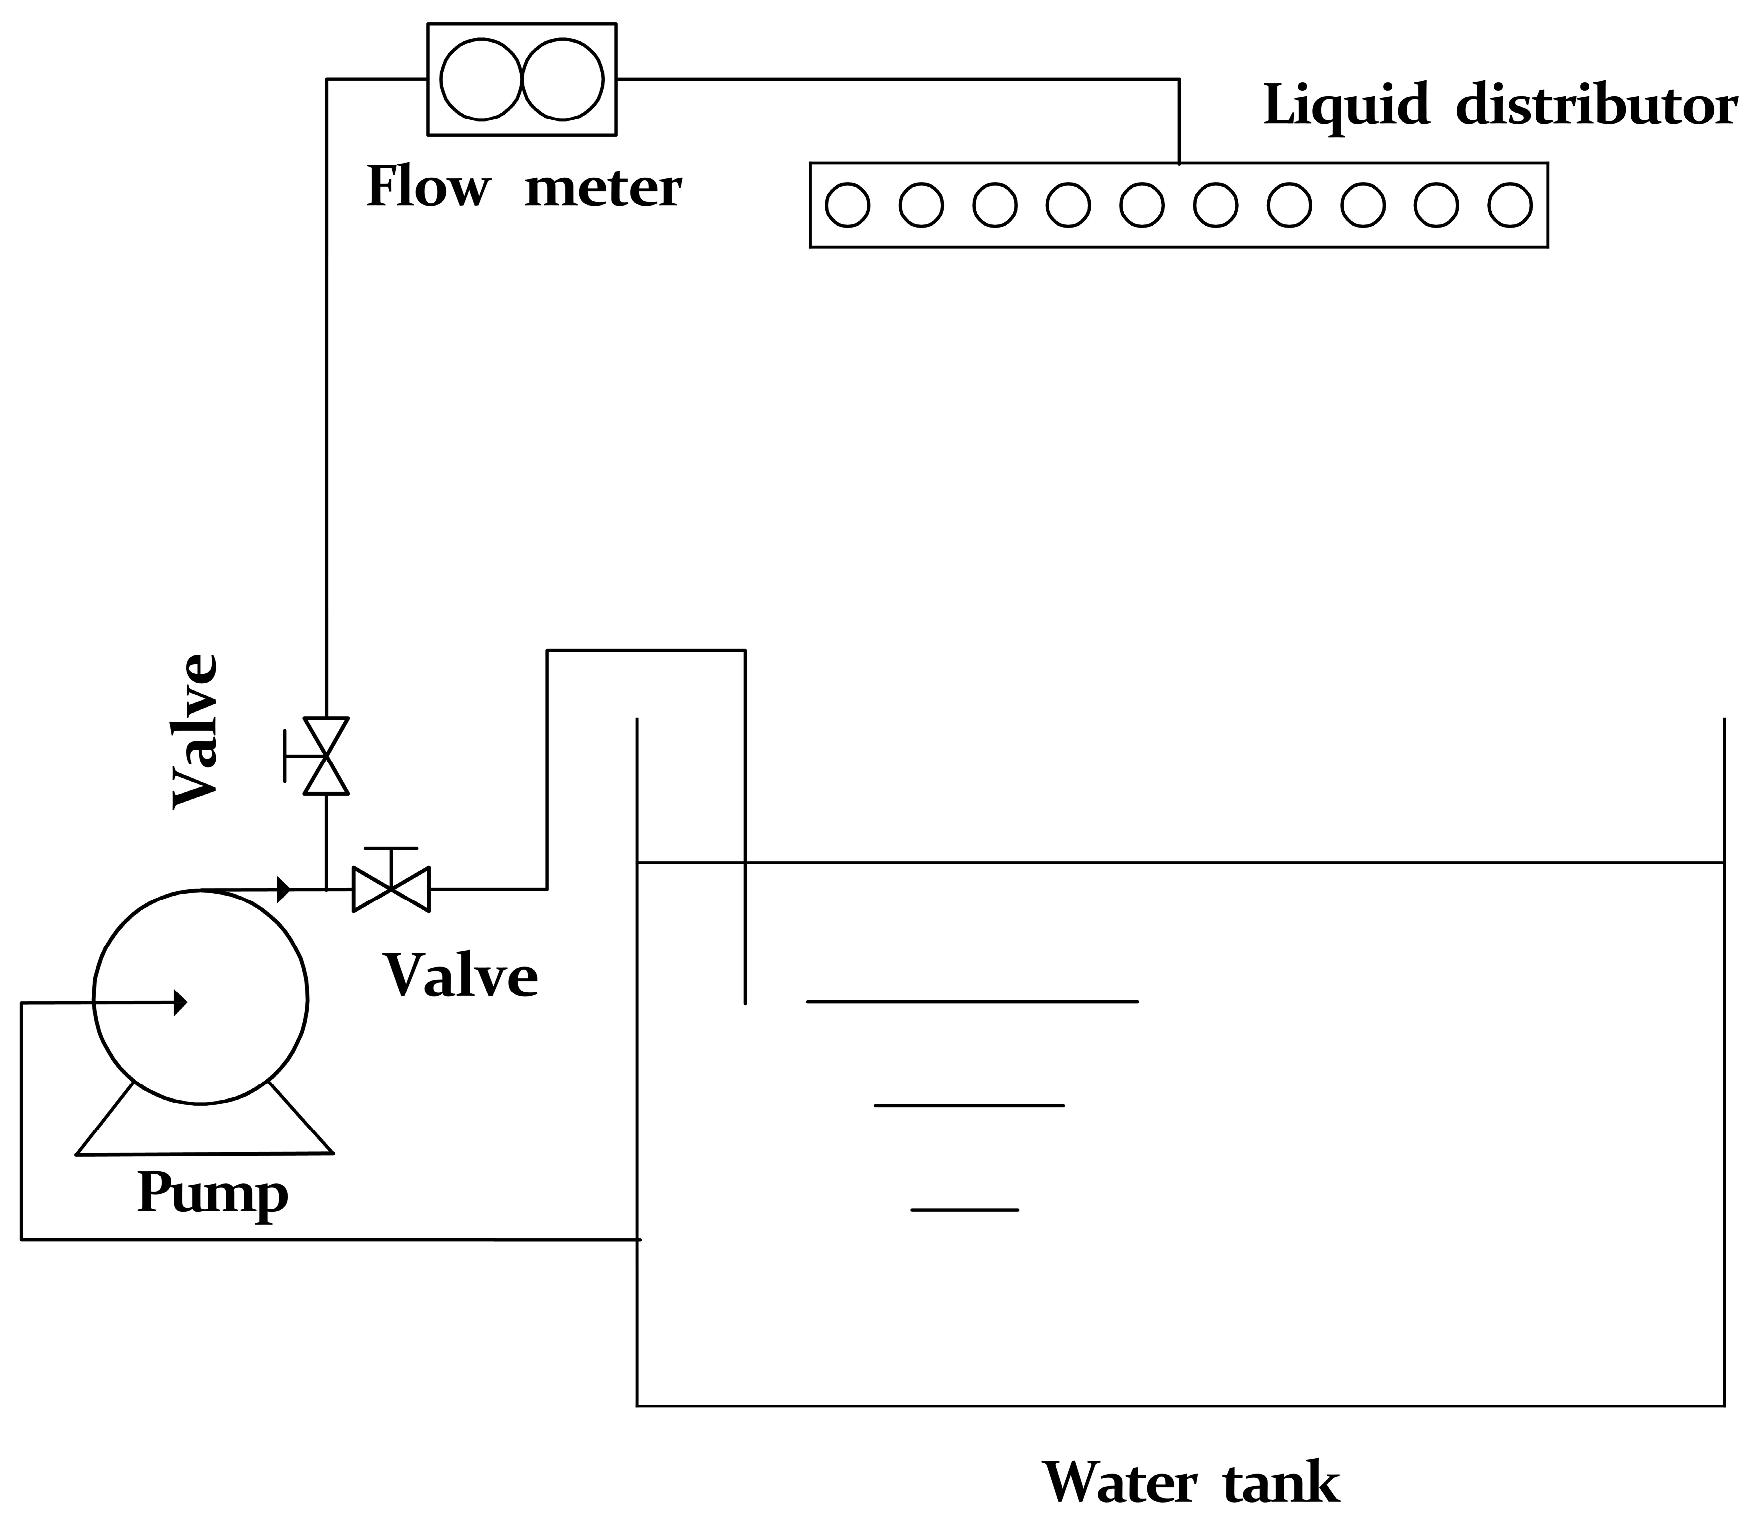
19] and was subsequently structurally modified. To compare the performance of the modified design with that of the original stepped-baffle distributor, a numerical model was first constructed for a distributor intended for a column with an inner diameter of 600 mm; the corresponding primary trough dimensions were 240 mm × 30 mm × 100 mm. To further validate the accuracy of the numerical results, an experimental setup was built as illustrated in
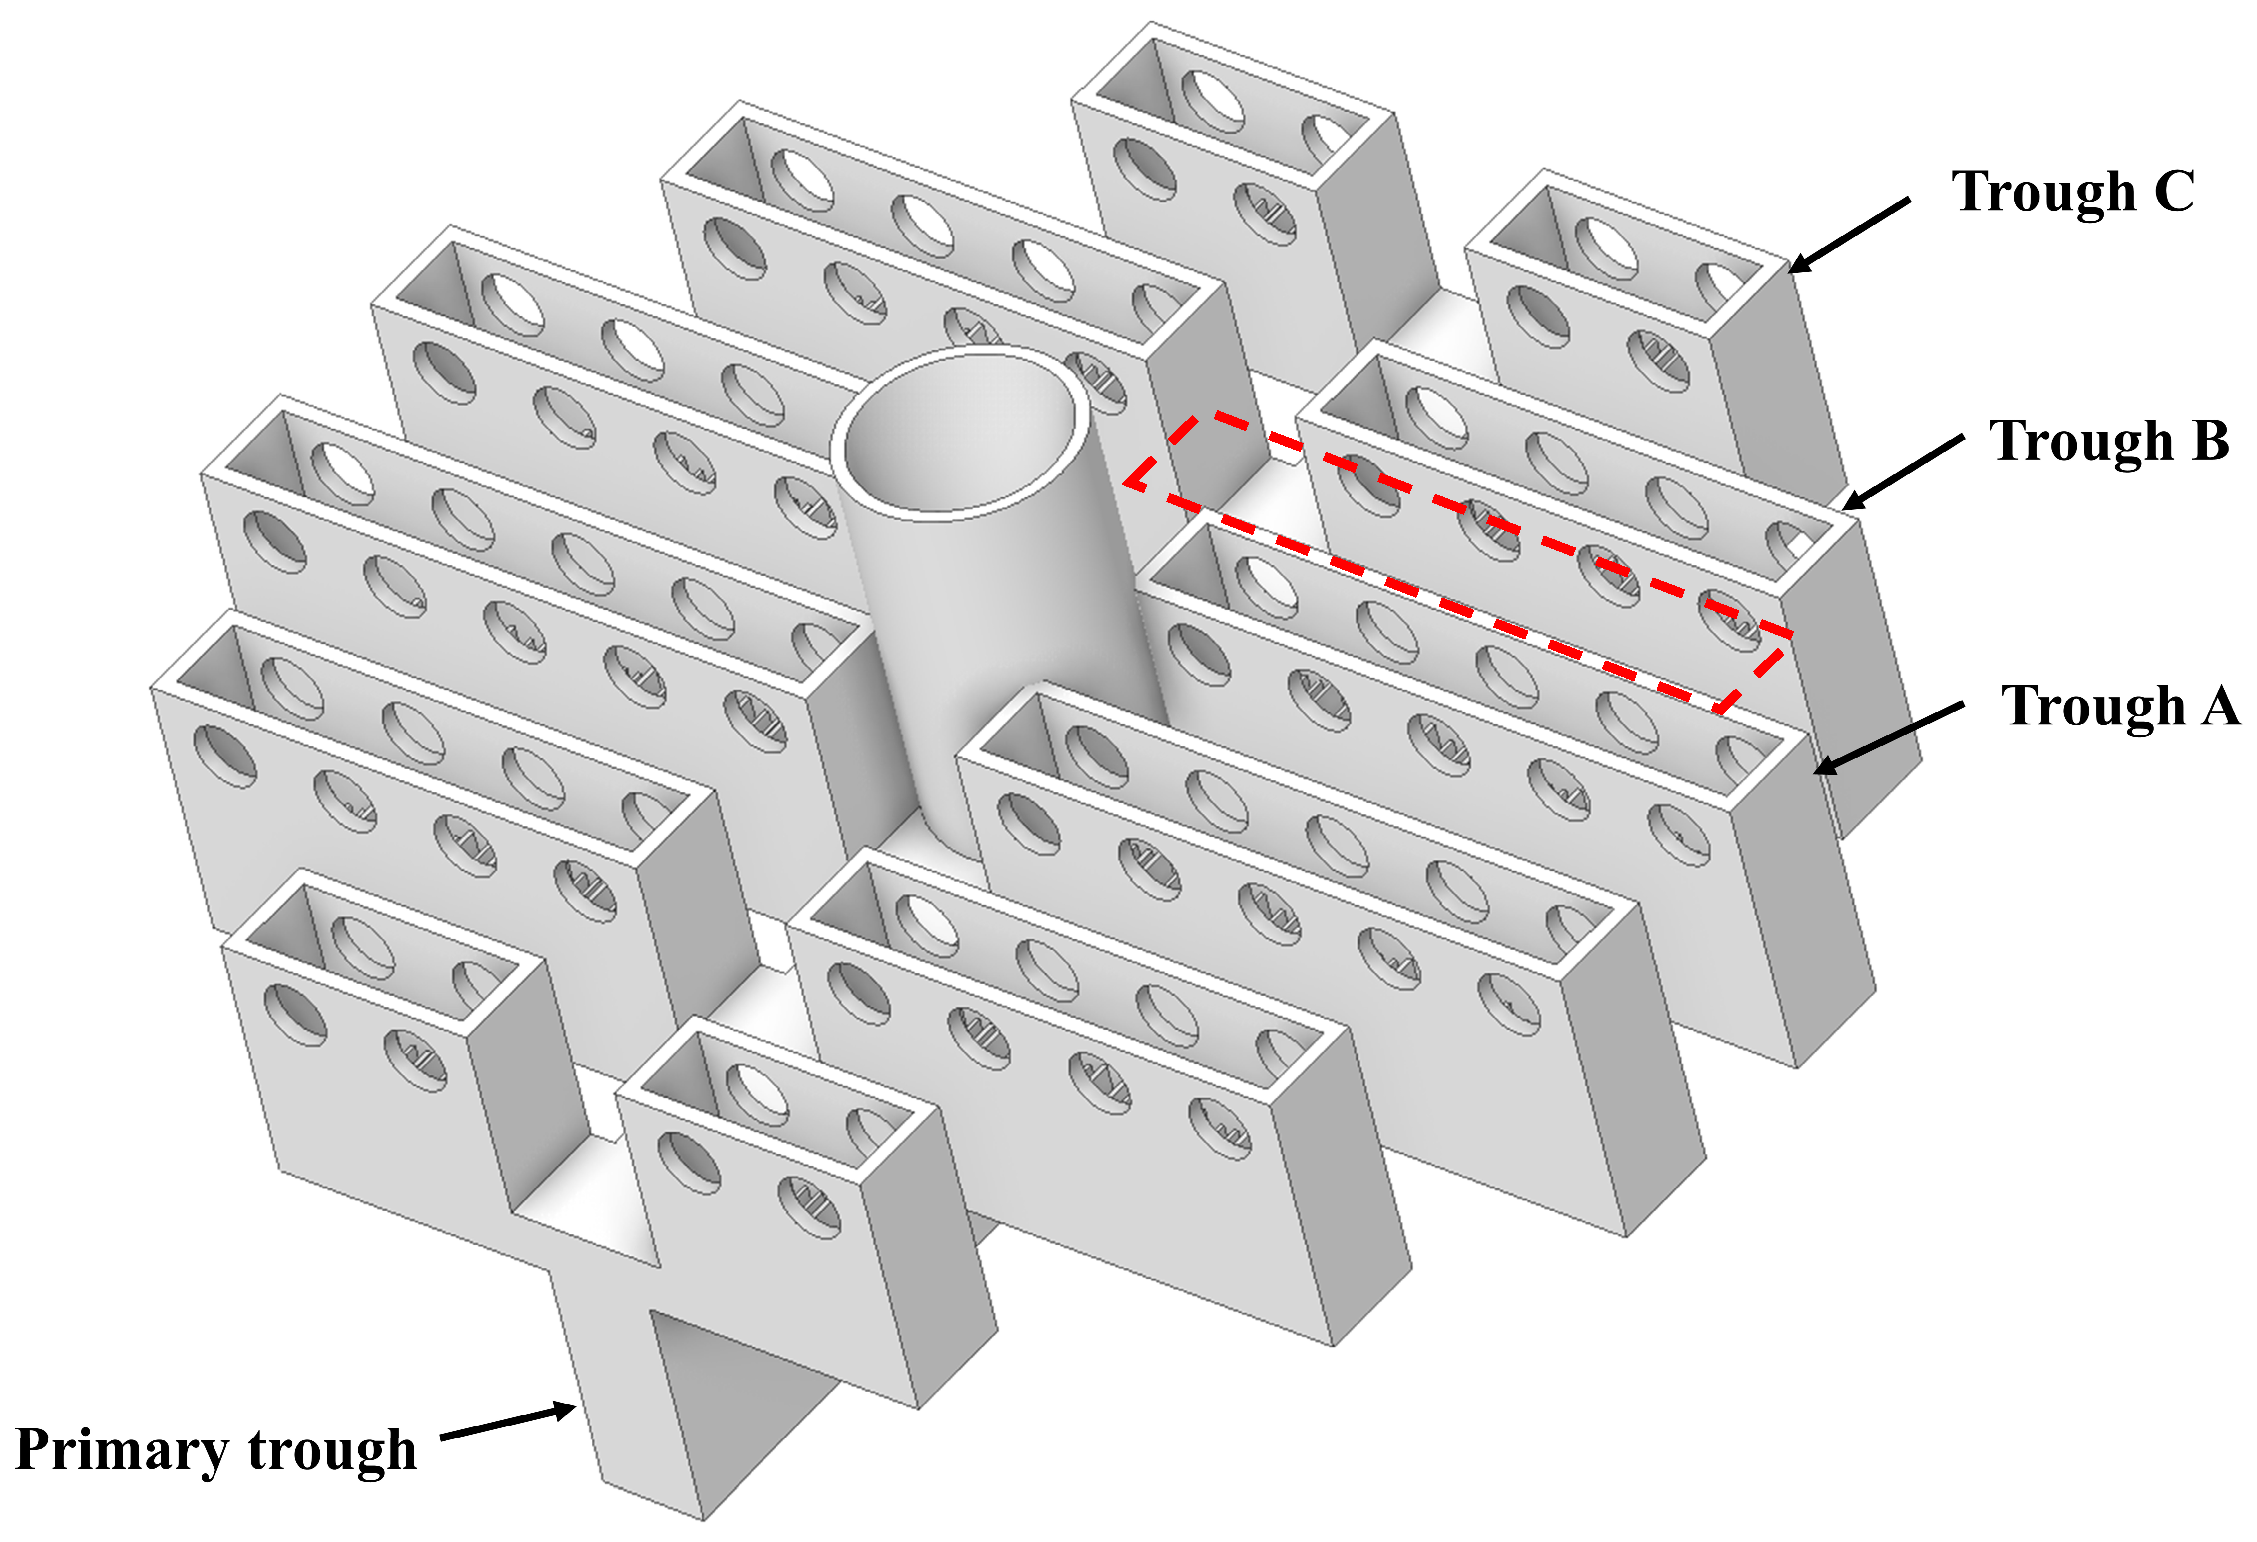
Figure 4. Because all packed columns available in the laboratory have a diameter of 190 mm, the distributor was scaled down proportionally with the column diameter for experimental validation, yielding a primary trough size of 76 mm × 9.5 mm × 31.7 mm. The experimental distributor was fabricated by 3D printing, and its geometry is shown in
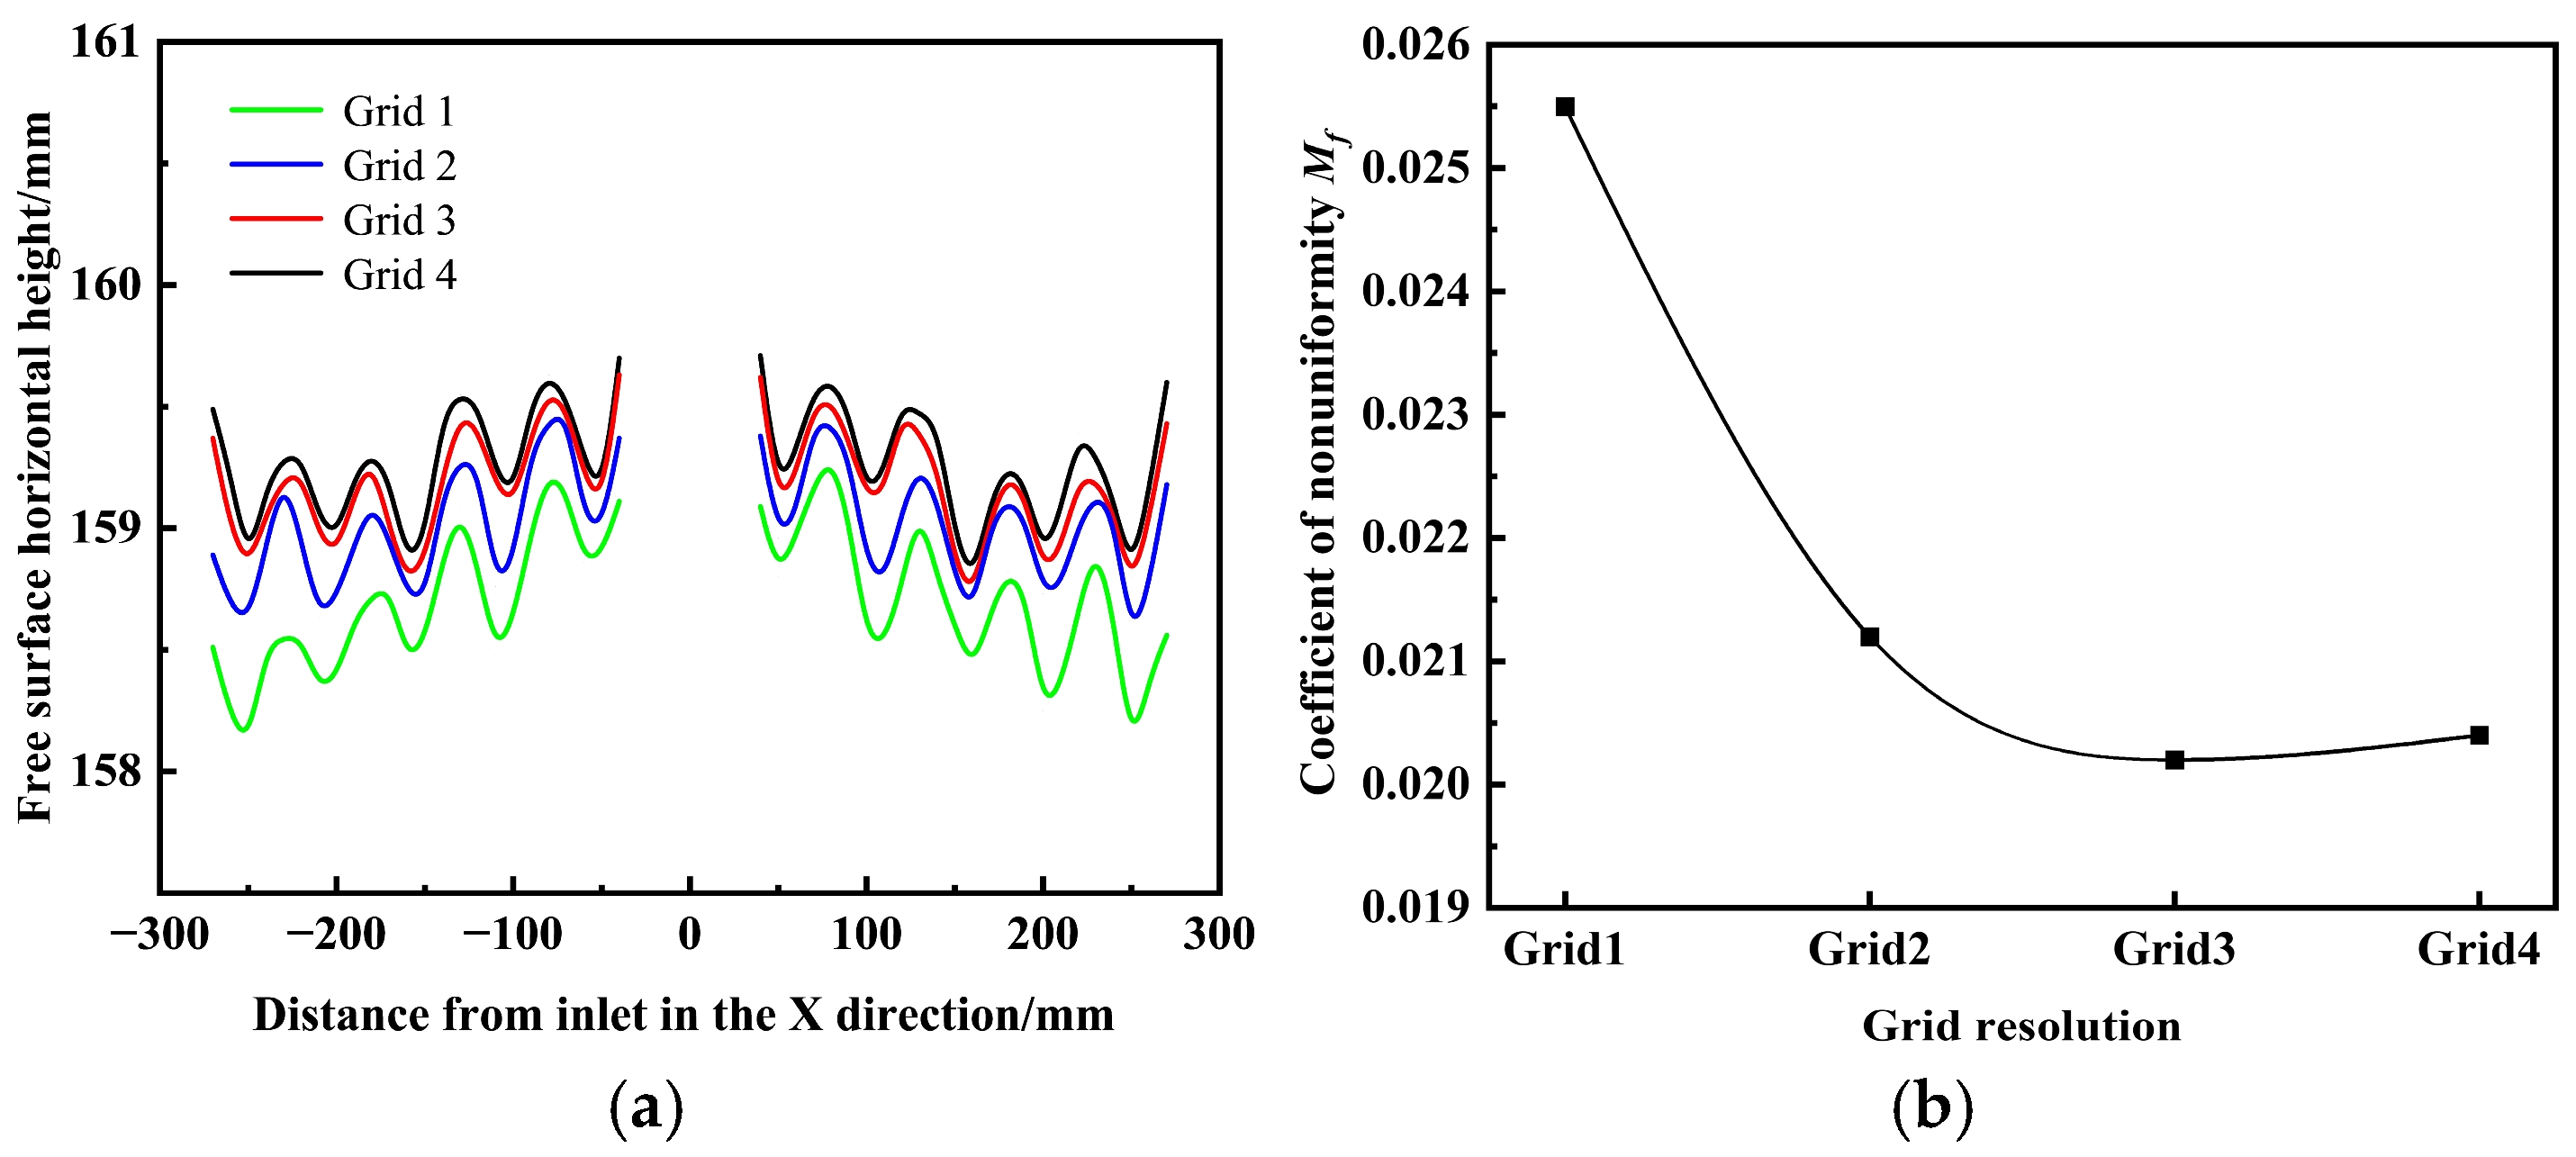
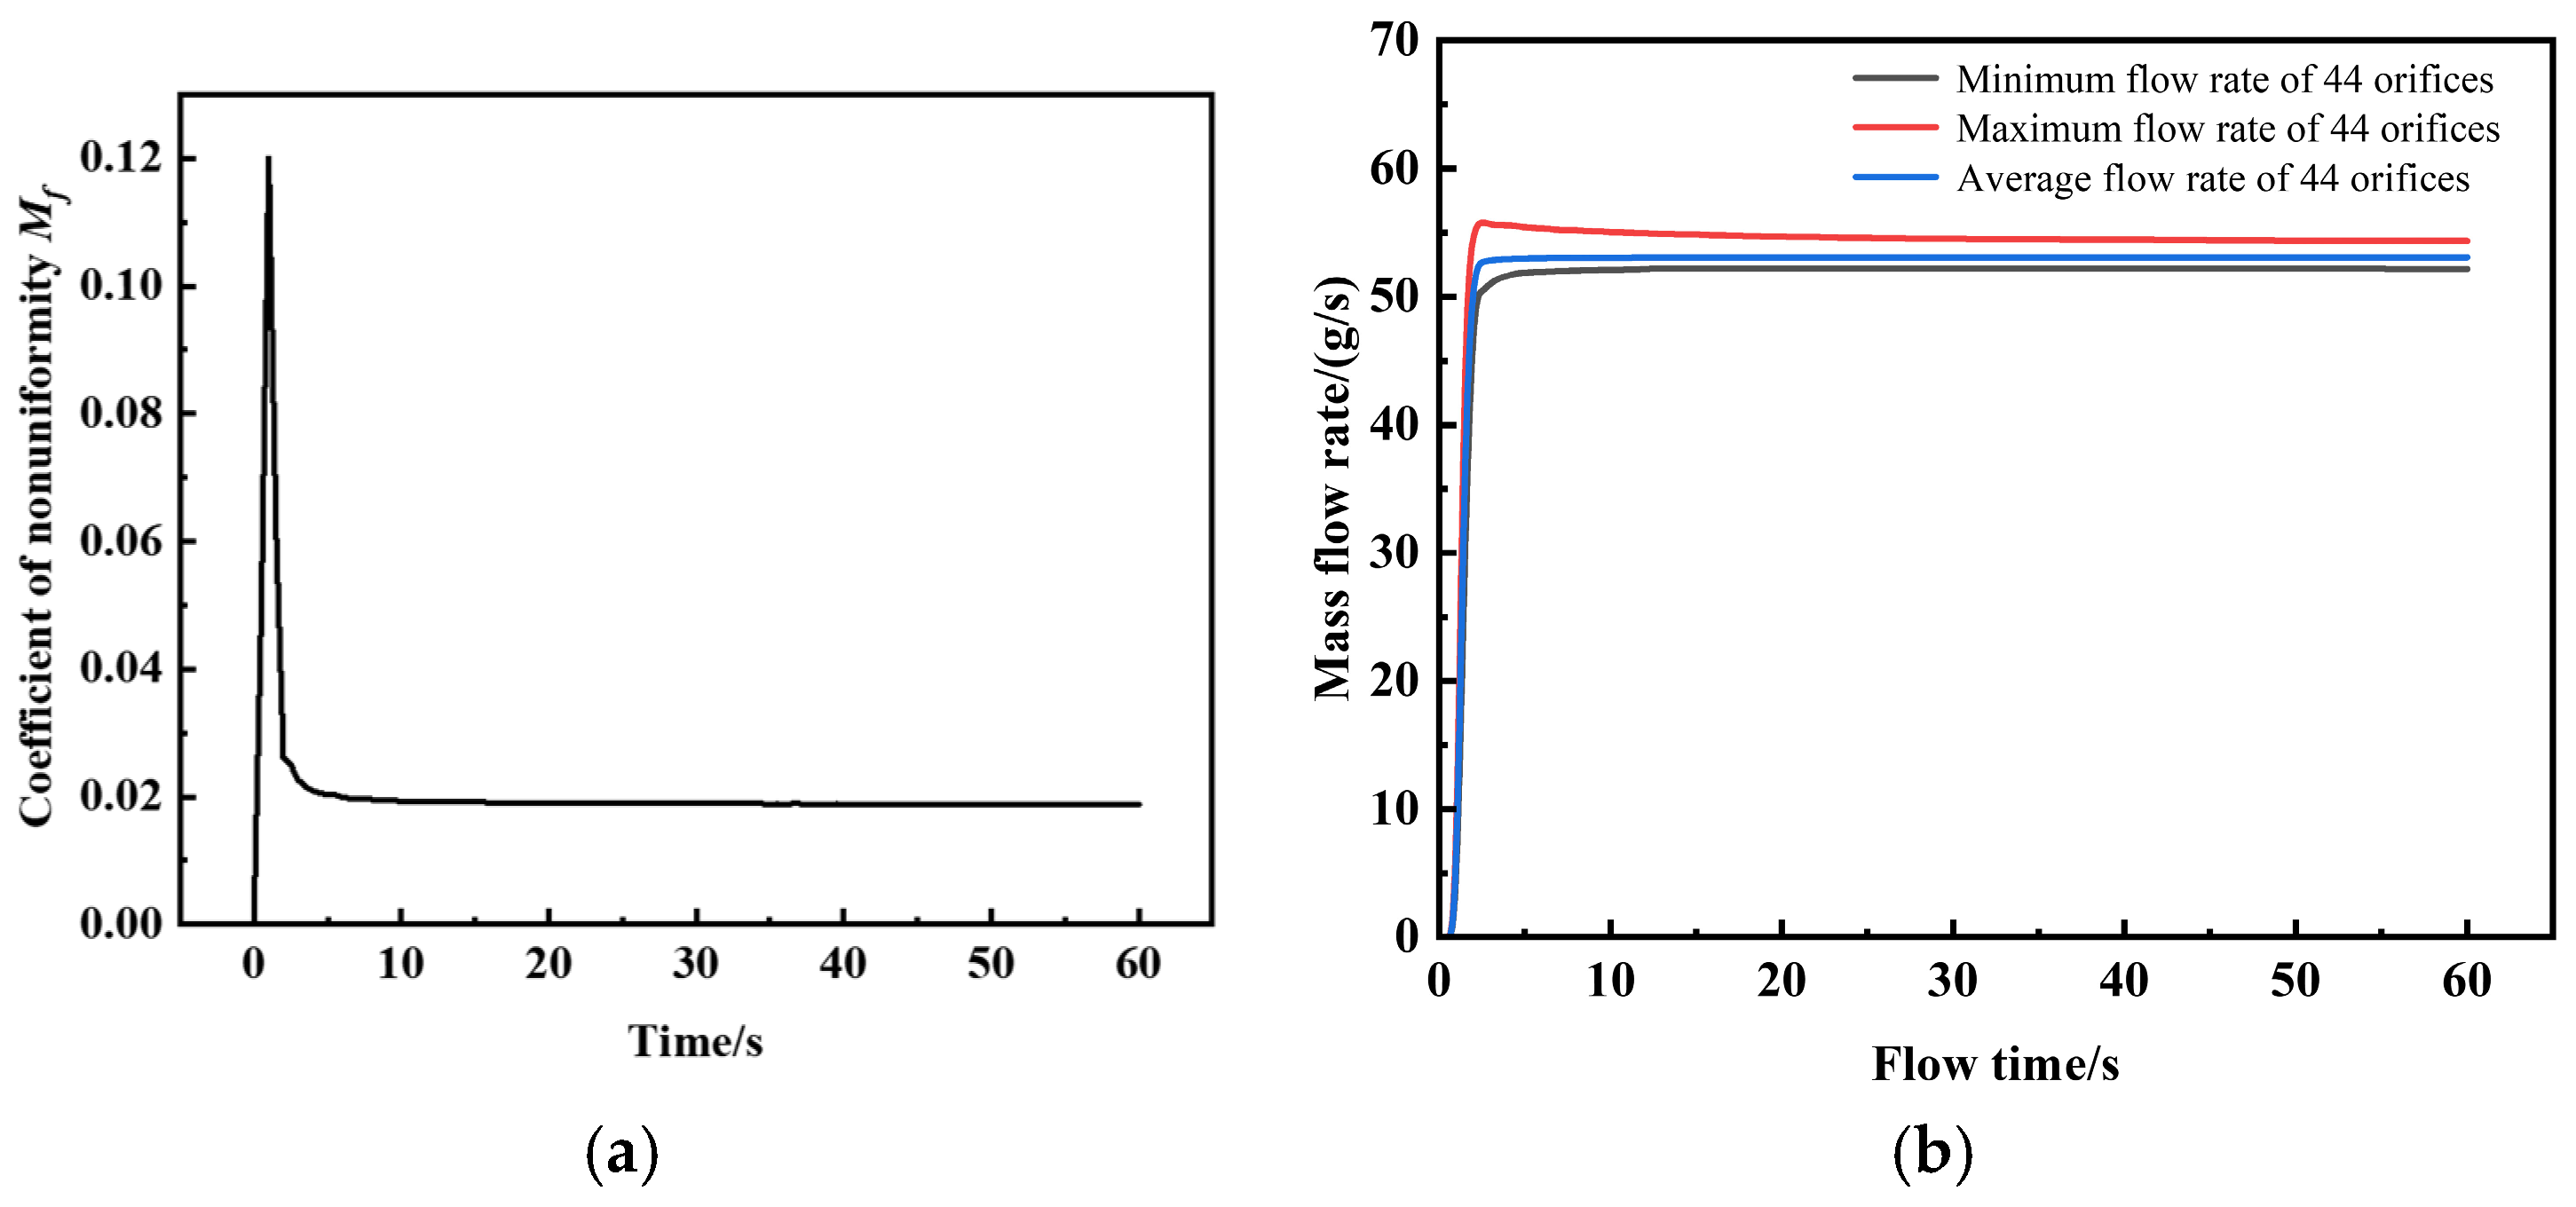
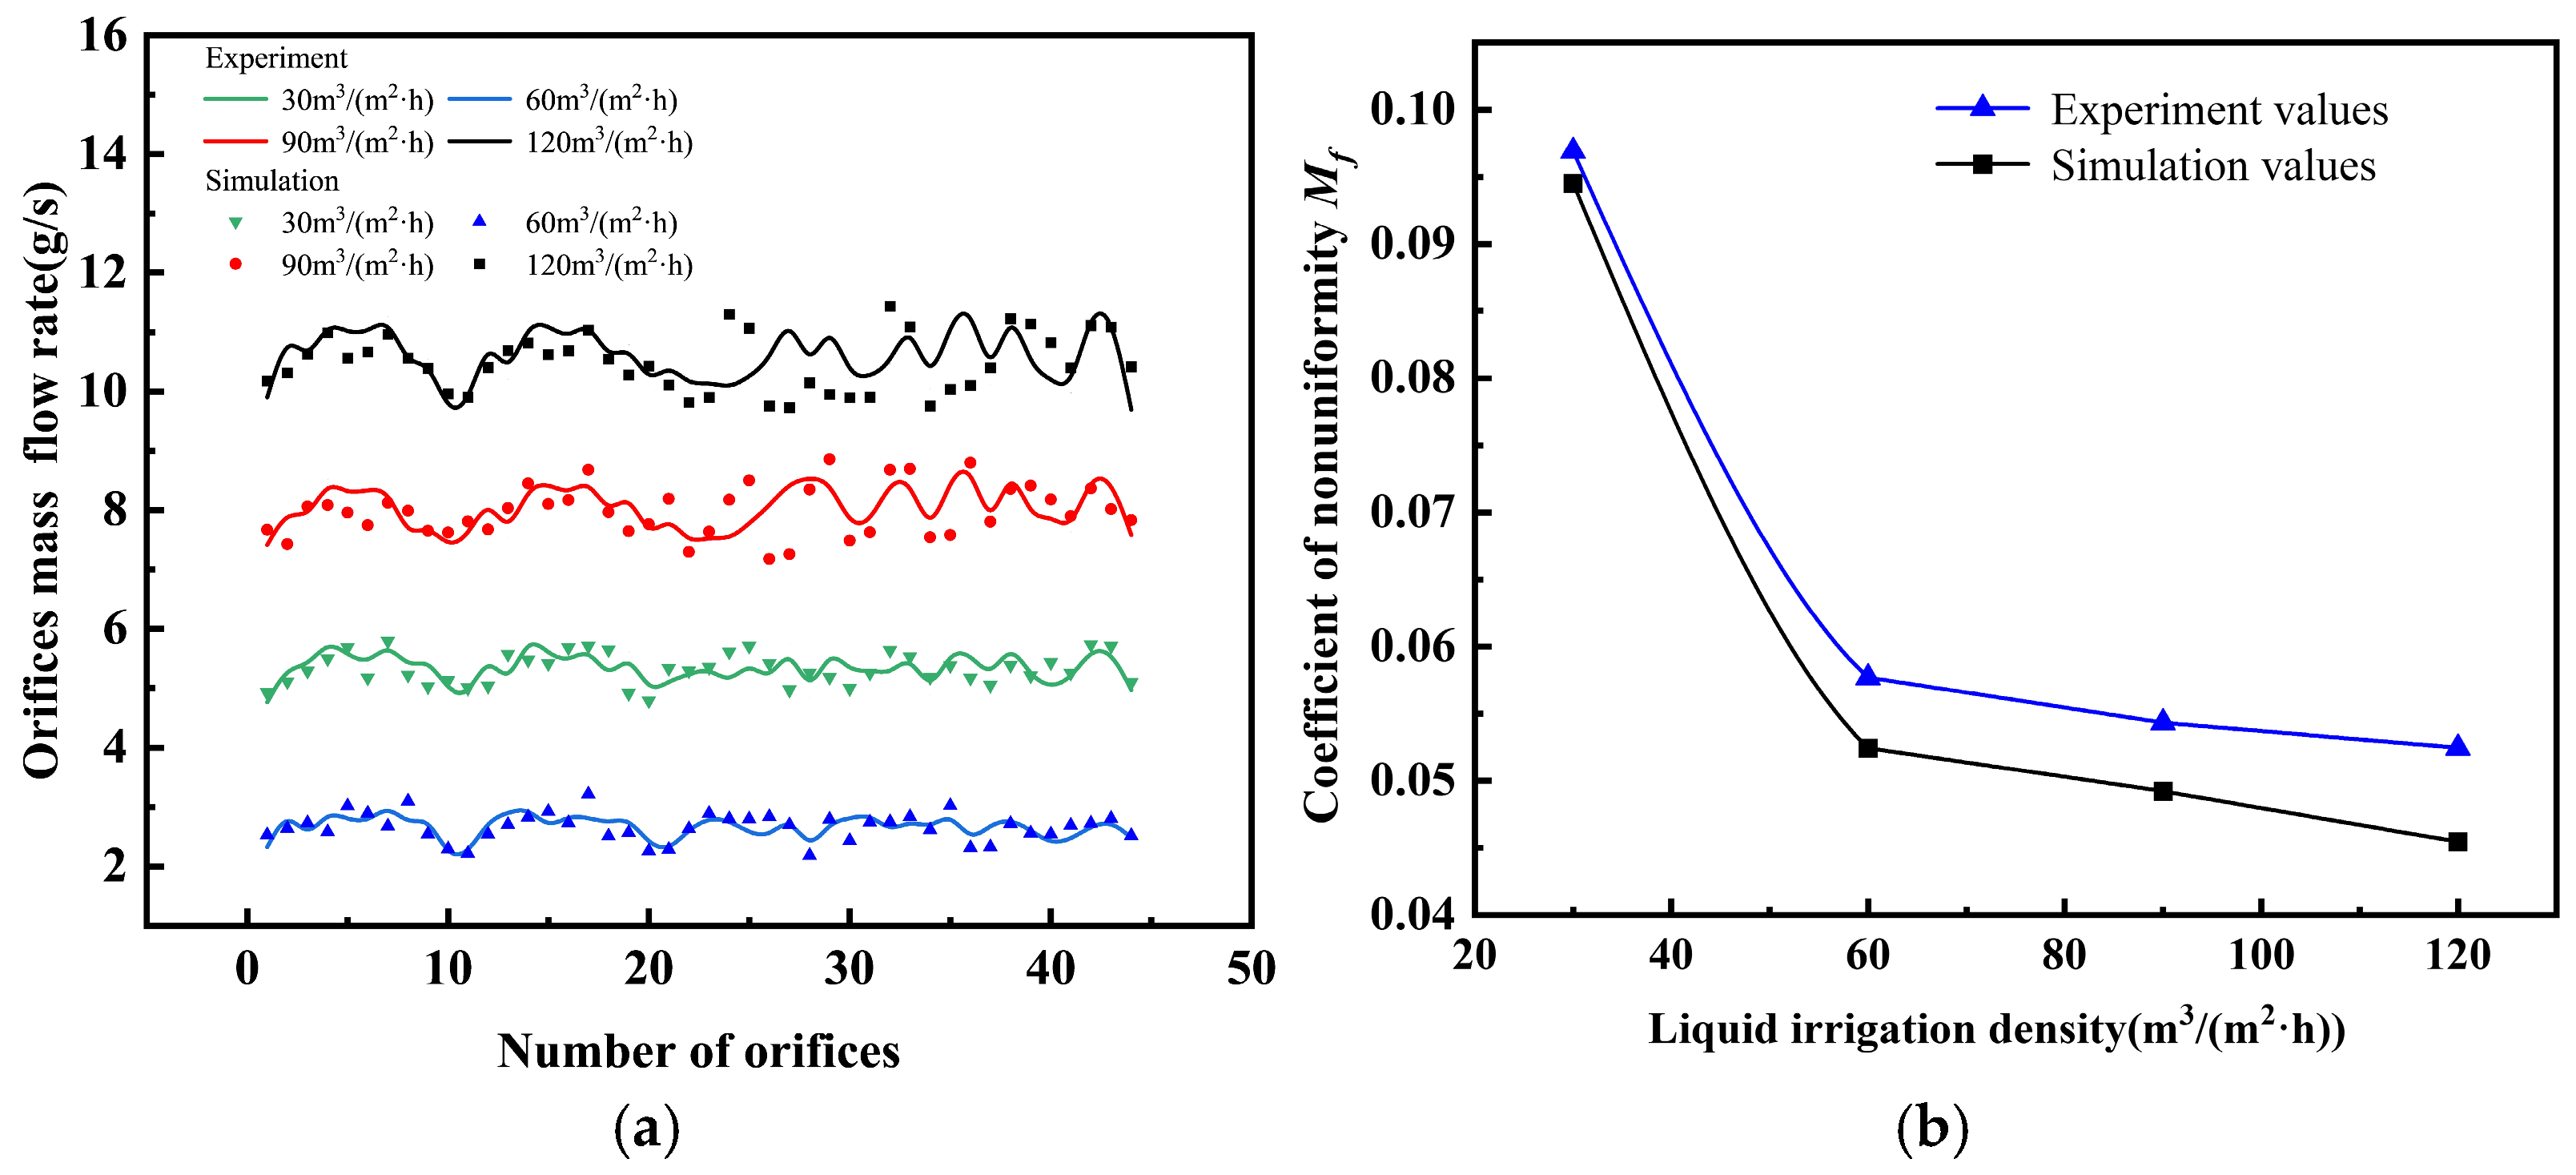
Figure 5. Concurrently, a separate CFD model with the same 190 mm-scale geometry as the experimental distributor was constructed, and the flow characteristics were computed under the same operating conditions as those used in the experiment. The numerical model was validated by comparing the simulation results with the experimental data obtained under the same dimensional conditions.
As shown in
Figure 5, the bottom of the liquid distributor was configured with two symmetrically arranged primary distribution troughs of a rectangular channel geometry, measuring 76 mm in length, 9.5 mm in width, and 31.7 mm in height. Three sets of stepped-baffle arrays were integrated inside these troughs to optimize the liquid flow distribution.
Figure 5.
3D model of the full liquid distributor for the 190 mm column (specific data are shown in
Table 1).
Figure 5.
3D model of the full liquid distributor for the 190 mm column (specific data are shown in
Table 1).
Table 1.
The specific dimensions of the liquid distributor for a column diameter of 190 mm.
Table 1.
The specific dimensions of the liquid distributor for a column diameter of 190 mm.
| Variable | Values (mm) |
|---|
| Primary distribution trough (length × width × height) | 76 × 9.5 × 31.7 |
| Secondary distribution trough A (length × width × height) | 76 × 9.5 × 31.7 |
| Secondary distribution trough B (length × width × height) | 60.2 × 9.5 × 30.4 |
| Secondary distribution trough C (length × width × height) | 28.5 × 9.5 × 27.8 |
| Secondary distribution trough spacing | 19 |
| Liquid outlet orifices diameter | 7.9 |
Among these, the top of the distributor is equipped with six symmetrically arranged secondary distribution troughs, consisting of two sets each of Trough A (Trough A is the single-distribution trough studied in
Section 5.1), Trough B, and Trough C. Their specific dimensions are as follows.
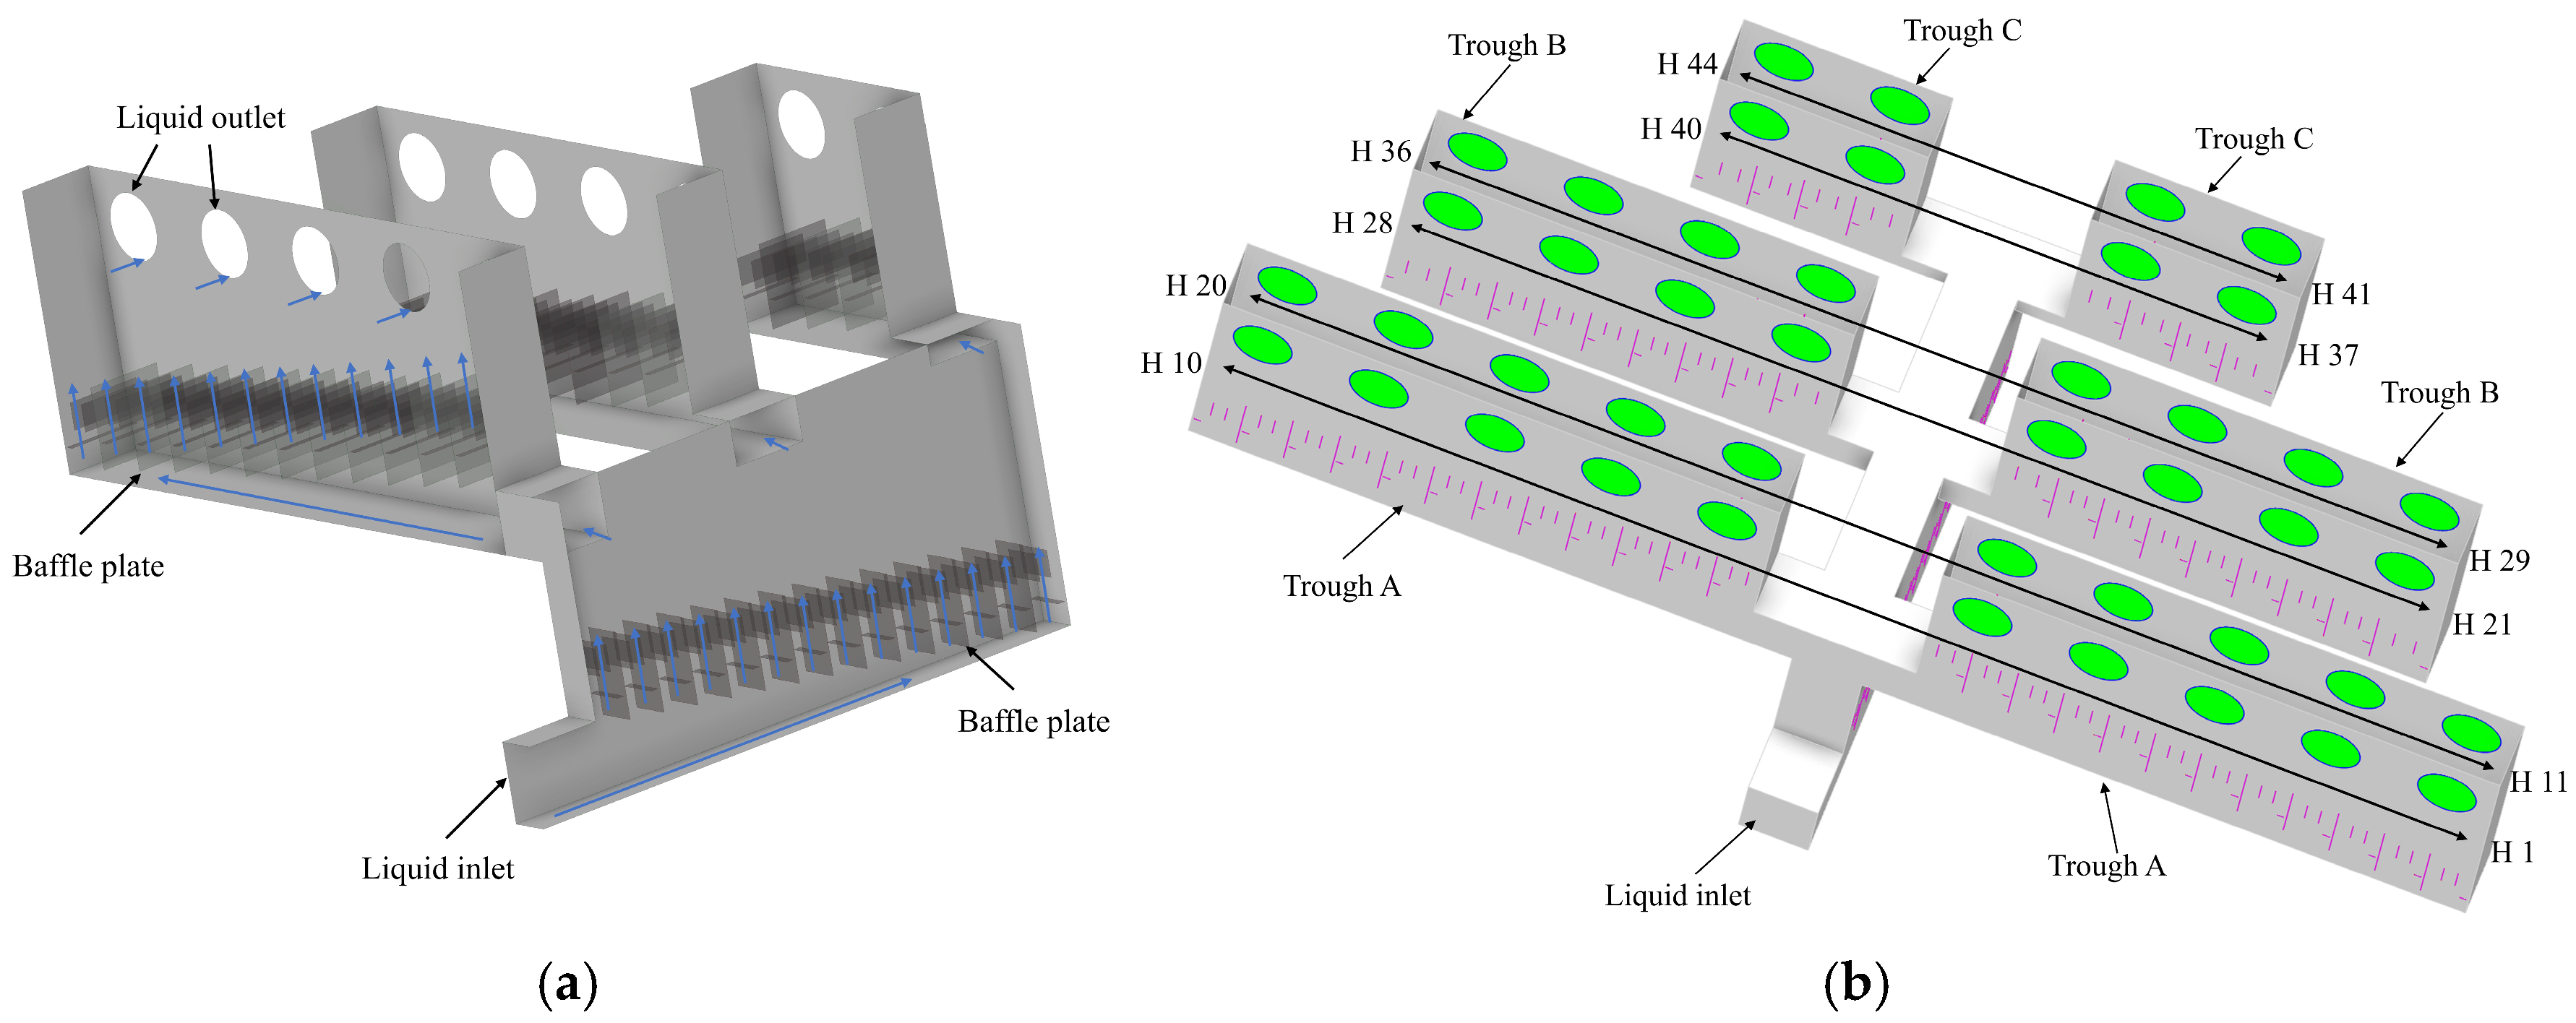
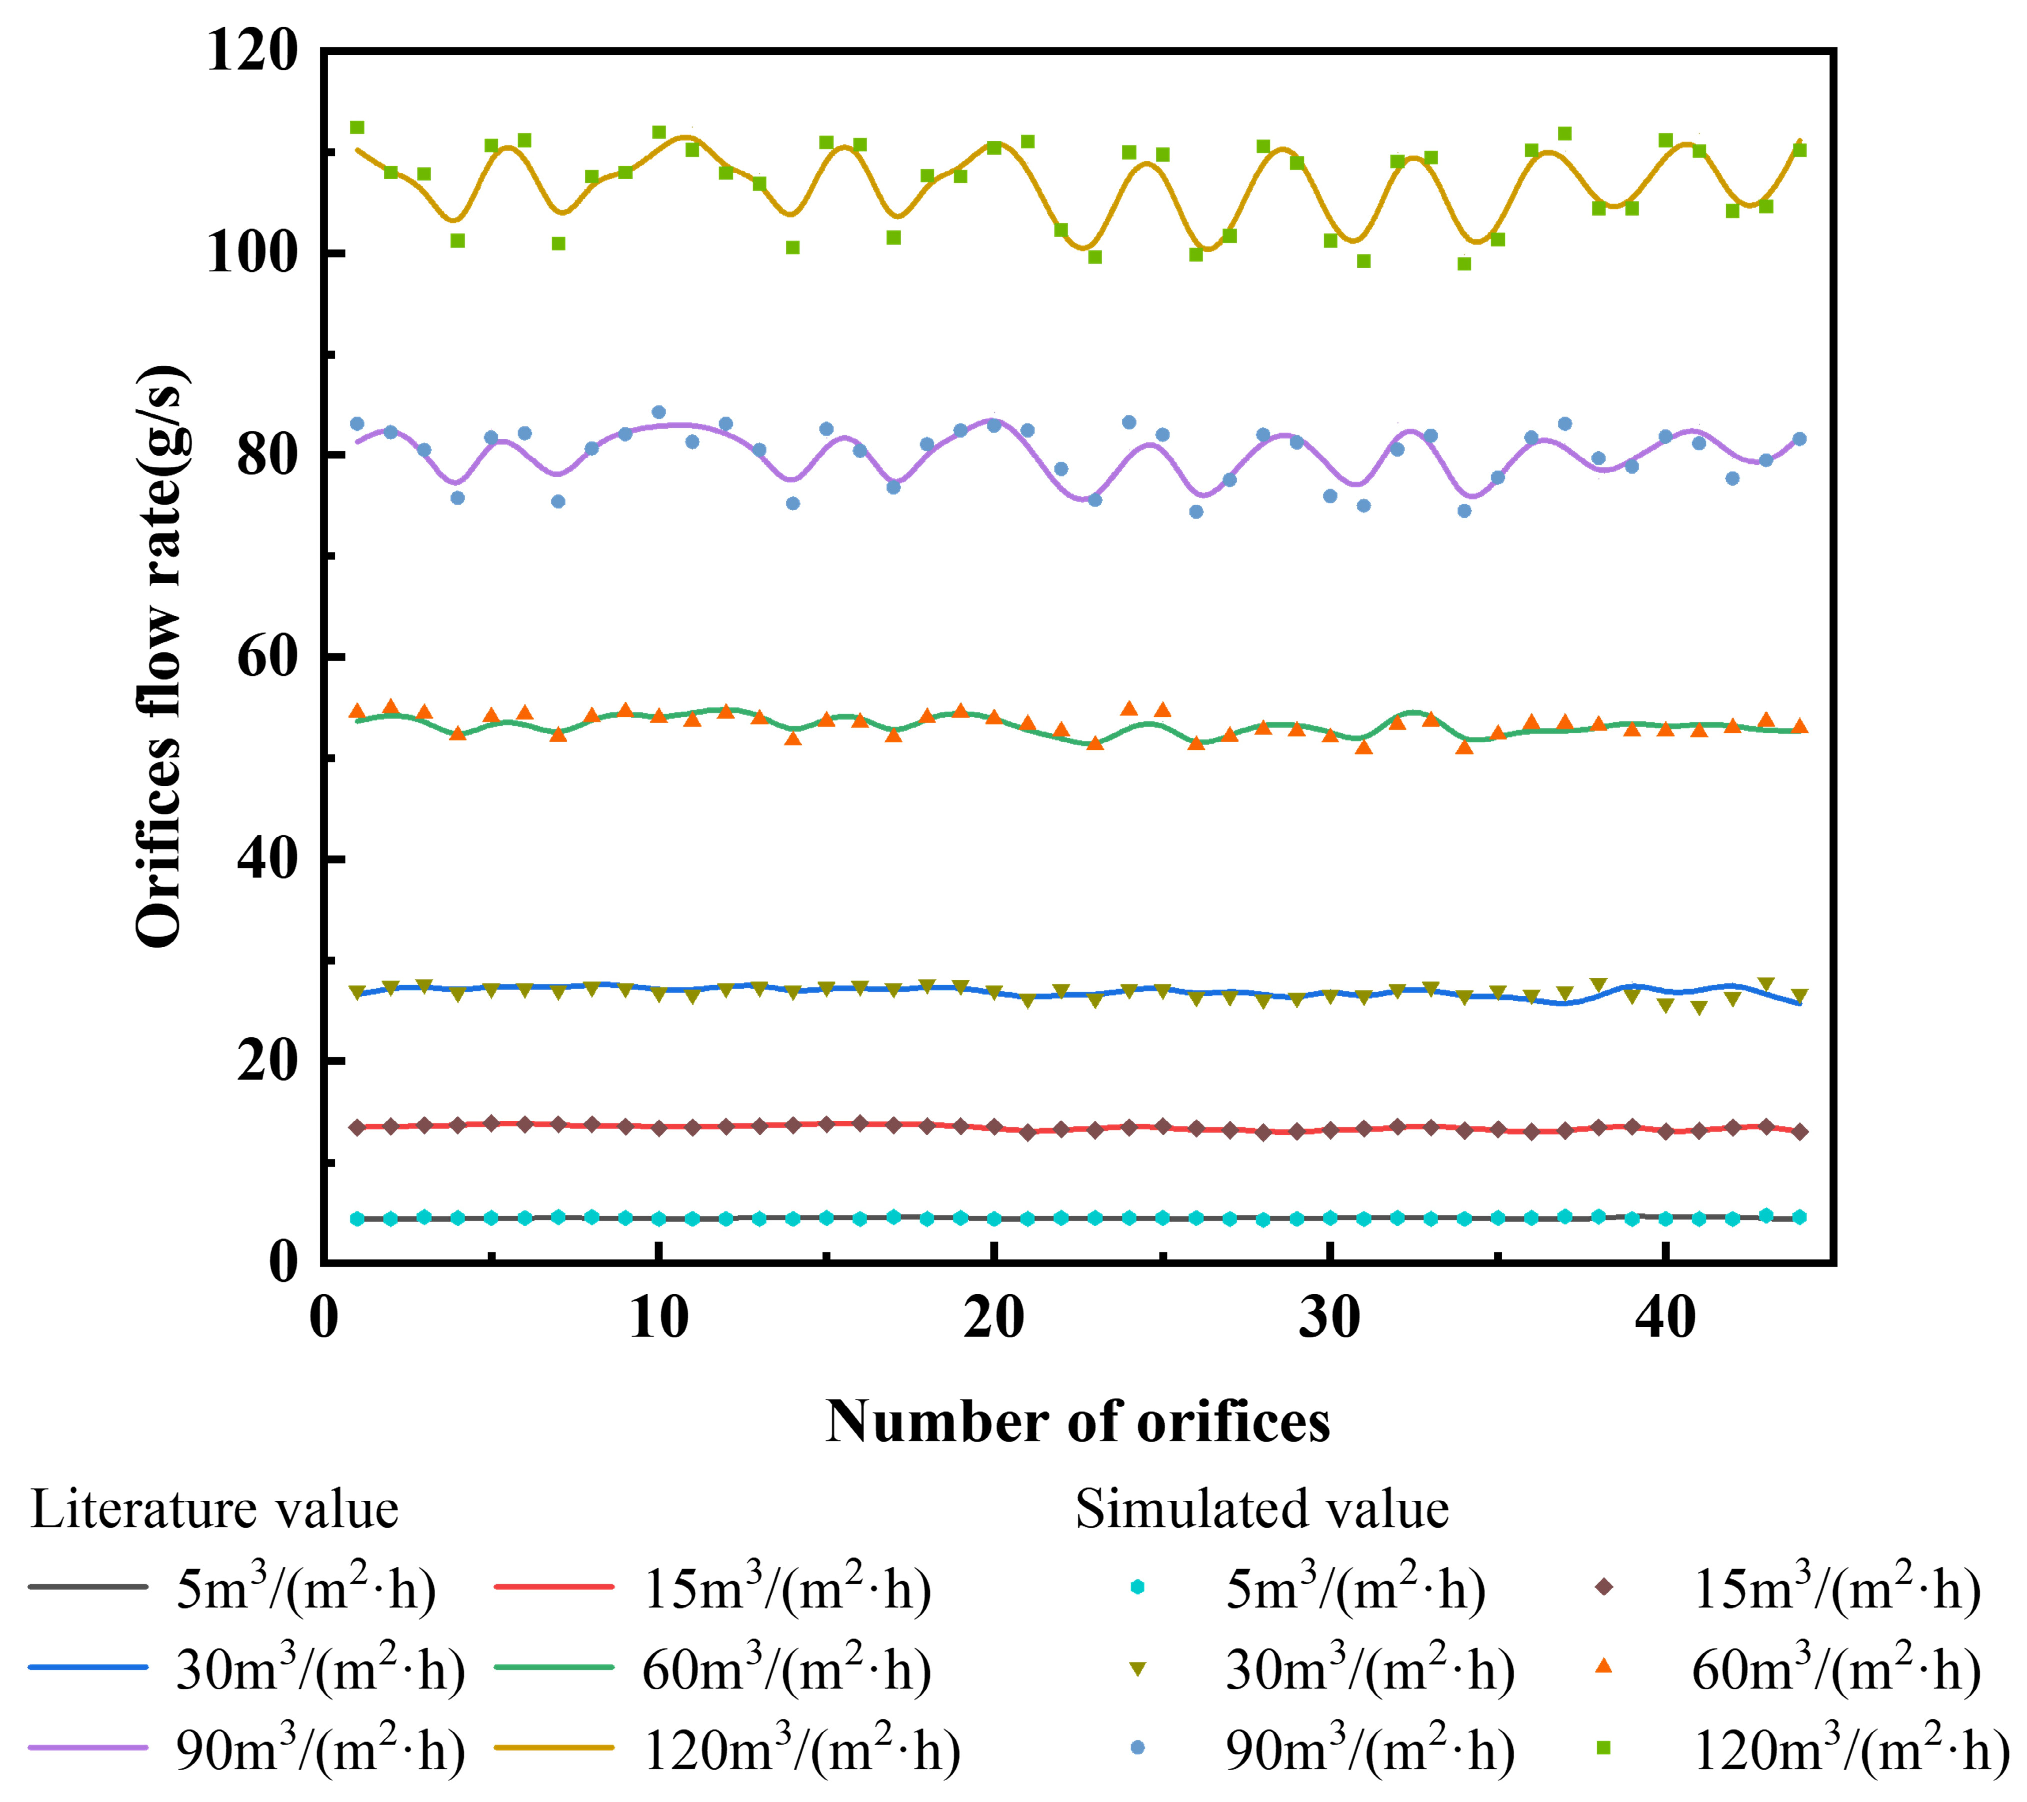
Experiments were performed using purified water at 30 °C as the working fluid, and the volumetric method was employed to measure the flow rate from each outlet orifice. The liquid was delivered from a water tank to the distributor via a centrifugal pump. A total of 88 outlet orifices were arranged symmetrically on both sides of the distributor, and each orifice was connected to a flexible hose to drain the effluent. After the flowmeter reading stabilized, the discharge from a single orifice was collected in a graduated cylinder over a 30 s interval. The flow rate of that orifice was then calculated from the collected volume and the timed duration. To ensure consistency with the symmetry-reduced computational domain used in the numerical simulations, which contained 44 effluent orifices, the flow rates from all 88 orifices were first measured. The results showed that the flow rates from symmetrically positioned orifices were nearly identical. After this symmetry check, the 44 orifices corresponding to the CFD outlet positions H01~H44 were measured in subsequent tests and used for quantitative comparison with the numerical predictions. The spray density at the distributor inlet was controlled by adjusting the rotational speed of the centrifugal pump (since the liquid distributor is intended for use in column equipment, the liquid flow rate is reported throughout this paper in terms of the liquid spray density, which is referenced to the column cross-sectional area. In the experiments, the liquid flow rate covered a range from 30~120 m3/(m2·h)). All experiments were conducted in a constant-temperature environment. For each operating condition, independent measurements were repeated five times. The maximum and minimum values were discarded, and the arithmetic mean of the remaining three measurements was taken as the effective result to reduce random errors and operational bias, thereby ensuring the reliability and reproducibility of the data.
In this study, the distribution performance of the liquid distributor was quantitatively evaluated using the liquid maldistribution factor
Mf. This factor, proposed by Klemas [
28] in 1995, characterizes the distribution behavior of a distributor by the statistical standard deviation of the liquid flow rates at the individual drip points, and has been adopted by a number of researchers for assessing liquid distributor performance. A smaller value of
Mf corresponds to more uniform liquid distribution. The maldistribution factor is defined as follows:
where
Qi is the volumetric flow rate from orifice
i,
is the mean flow rate averaged over all orifices, and
N is the number of outlet orifices included in the calculation. For both the CFD results and the experimental data used for comparison,
N was taken as 44, corresponding to the outlet orifices H01~H44 in the symmetry-reduced computational domain. In the experiment, these 44 outlets were selected after confirming the symmetry of the full 88-orifice distributor.
5. Results and Discussion
5.1. Hydrodynamic Characteristics of Liquid Flow in a Single-Distribution Trough
To isolate the intrinsic hydrodynamic mechanisms governing liquid maldistribution, this section focuses on a single-distribution trough as the fundamental unit of the distributor, as illustrated in trough A in
Figure 5. The effects of baffle number and structural configuration on flow morphology, vortical structures, and energy dissipation are systematically investigated.
5.1.1. Effect of the Number of Step Baffles
To elucidate the role of geometric confinement on liquid distribution, the influence of stepped baffle number was systematically investigated under a constant spray density of 60 m
3/(m
2·h) by monitoring the liquid velocity profile at the trough outlet cross-section. Meanwhile, to quantitatively characterize the non-uniformity of the liquid phase distribution across the section, a sectional non-uniformity coefficient,
ML, was defined based on the outlet velocities:
where
Ncell is the total number of grid cells in the outlet cross-section,
vi is the Y-velocity component (the upward direction along the stepped baffles) in cell
i (m/s), and
vi is the arithmetic mean of the Y-velocity component over all cells in the section (m/s). Employing the velocity component, rather than the magnitude, provides a more sensitive indicator of flow distribution non-uniformity within the section.
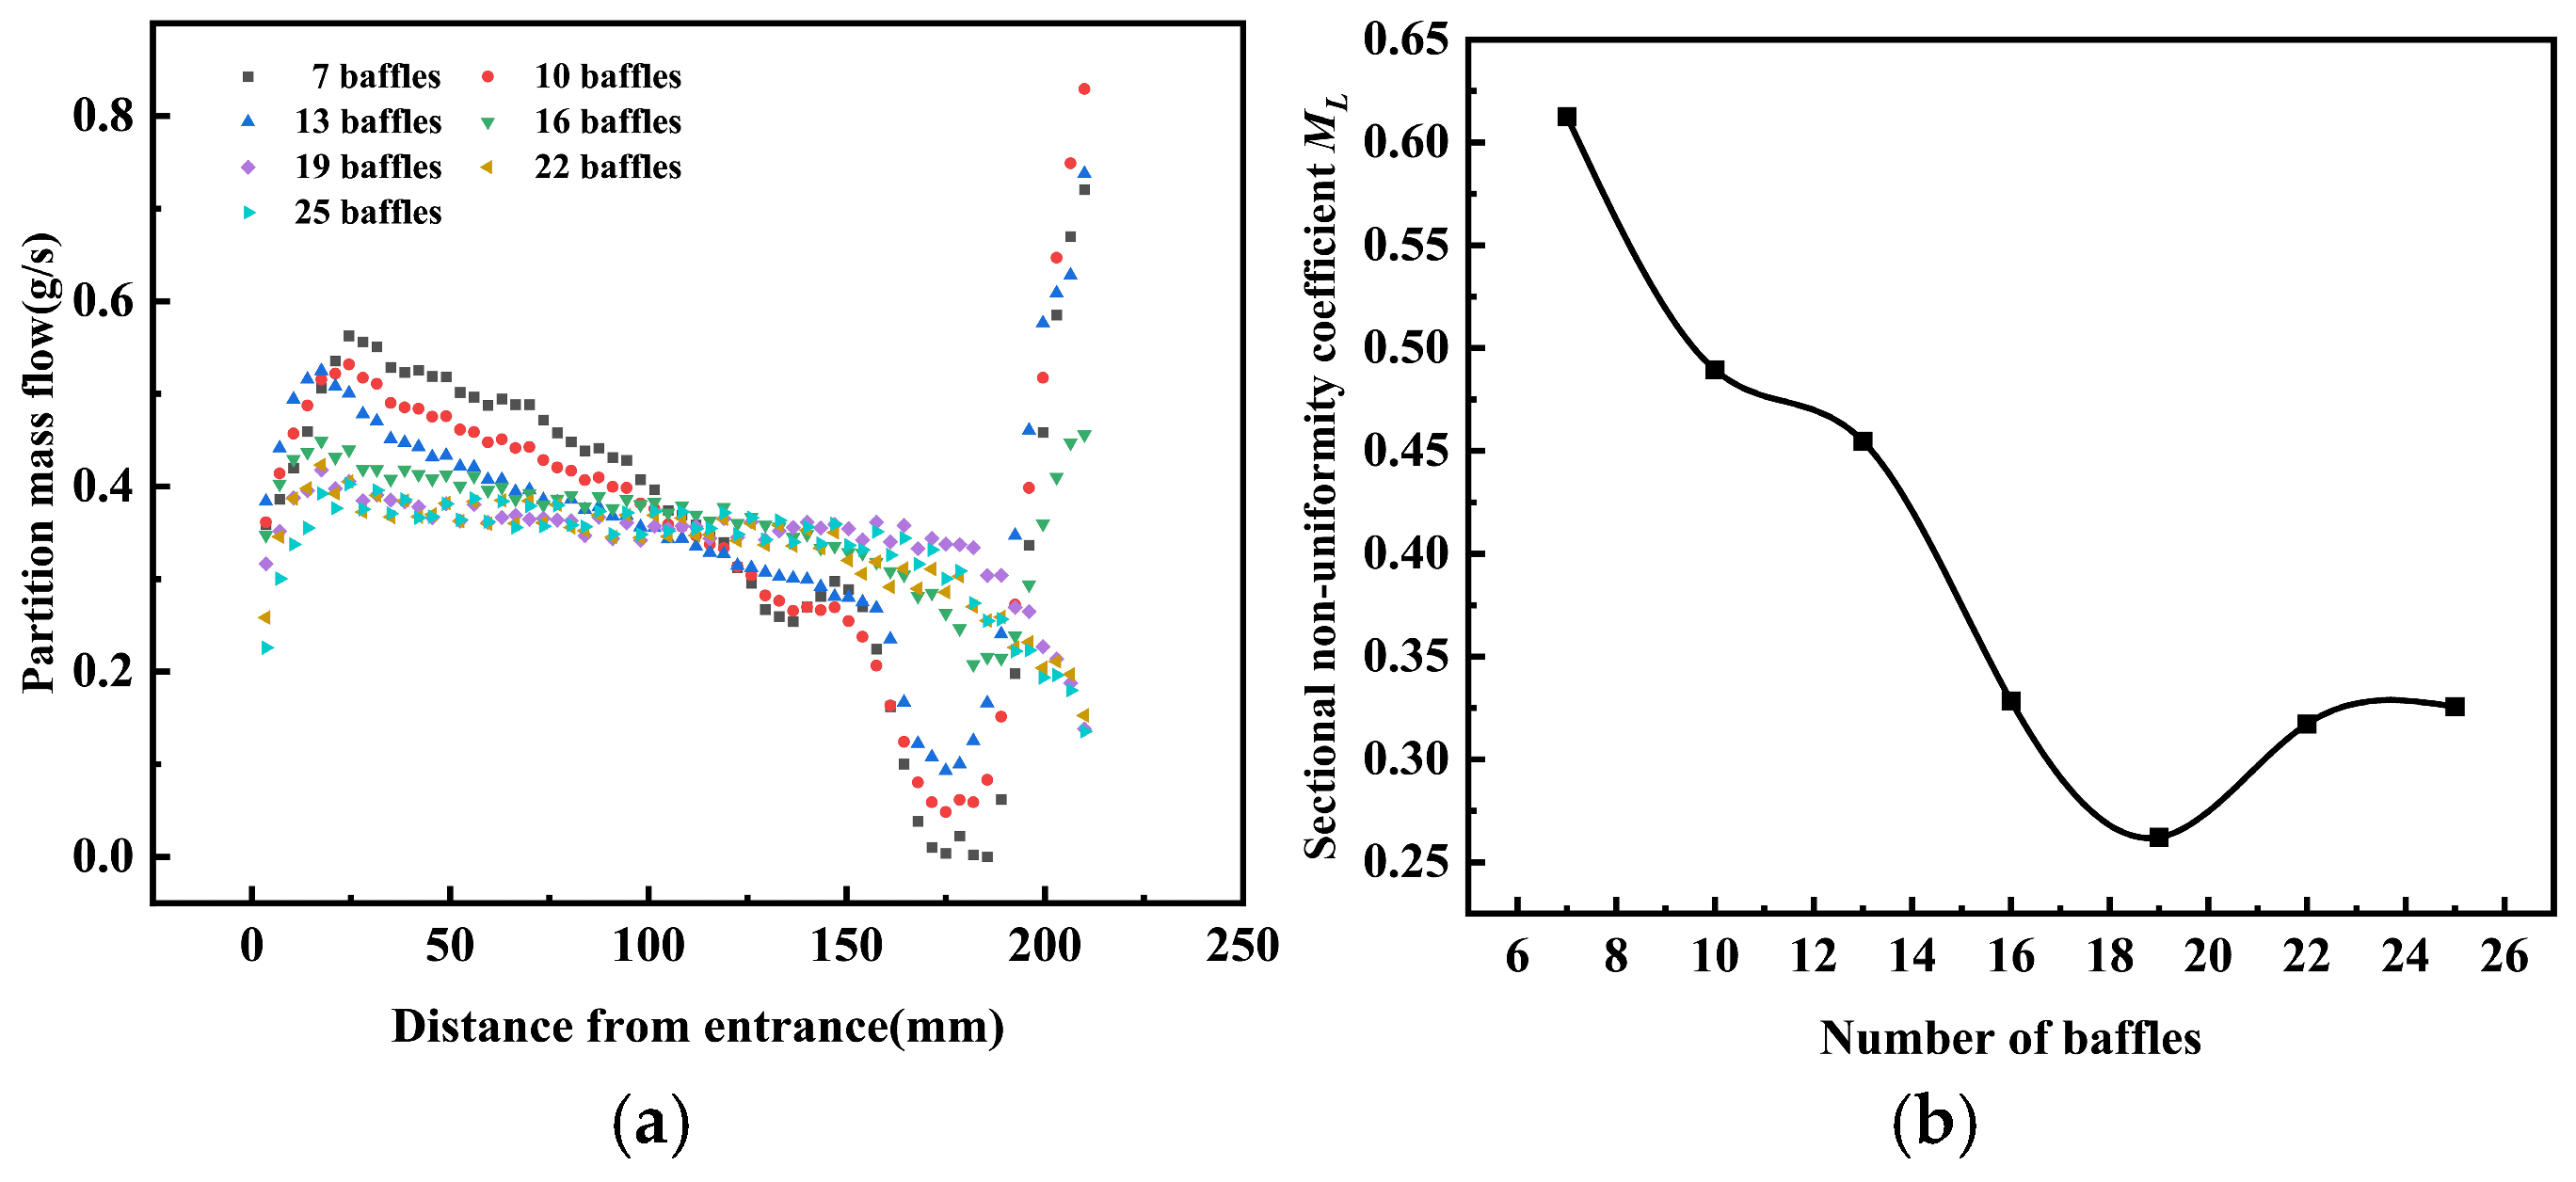
The velocity distribution curves in
Figure 11a demonstrate that as the number of baffles increases, the liquid velocity profile across the outlet section becomes progressively flatter, indicating a significant improvement in uniformity. However, beyond a critical threshold (≈19 baffles), further increase leads to a deterioration in uniformity, as evidenced by the non-monotonic variation in the sectional non-uniformity coefficient
ML (
Figure 11b).
This non-monotonic behavior originates from the competing effects of flow channel refinement and increased flow resistance. When the number of baffles is moderate, the subdivision of the flow channels promotes momentum redistribution and suppresses large-scale flow bias. In contrast, excessive baffle density significantly compresses the channel width (from 15 mm to 8 mm), fundamentally altering the internal flow regime.
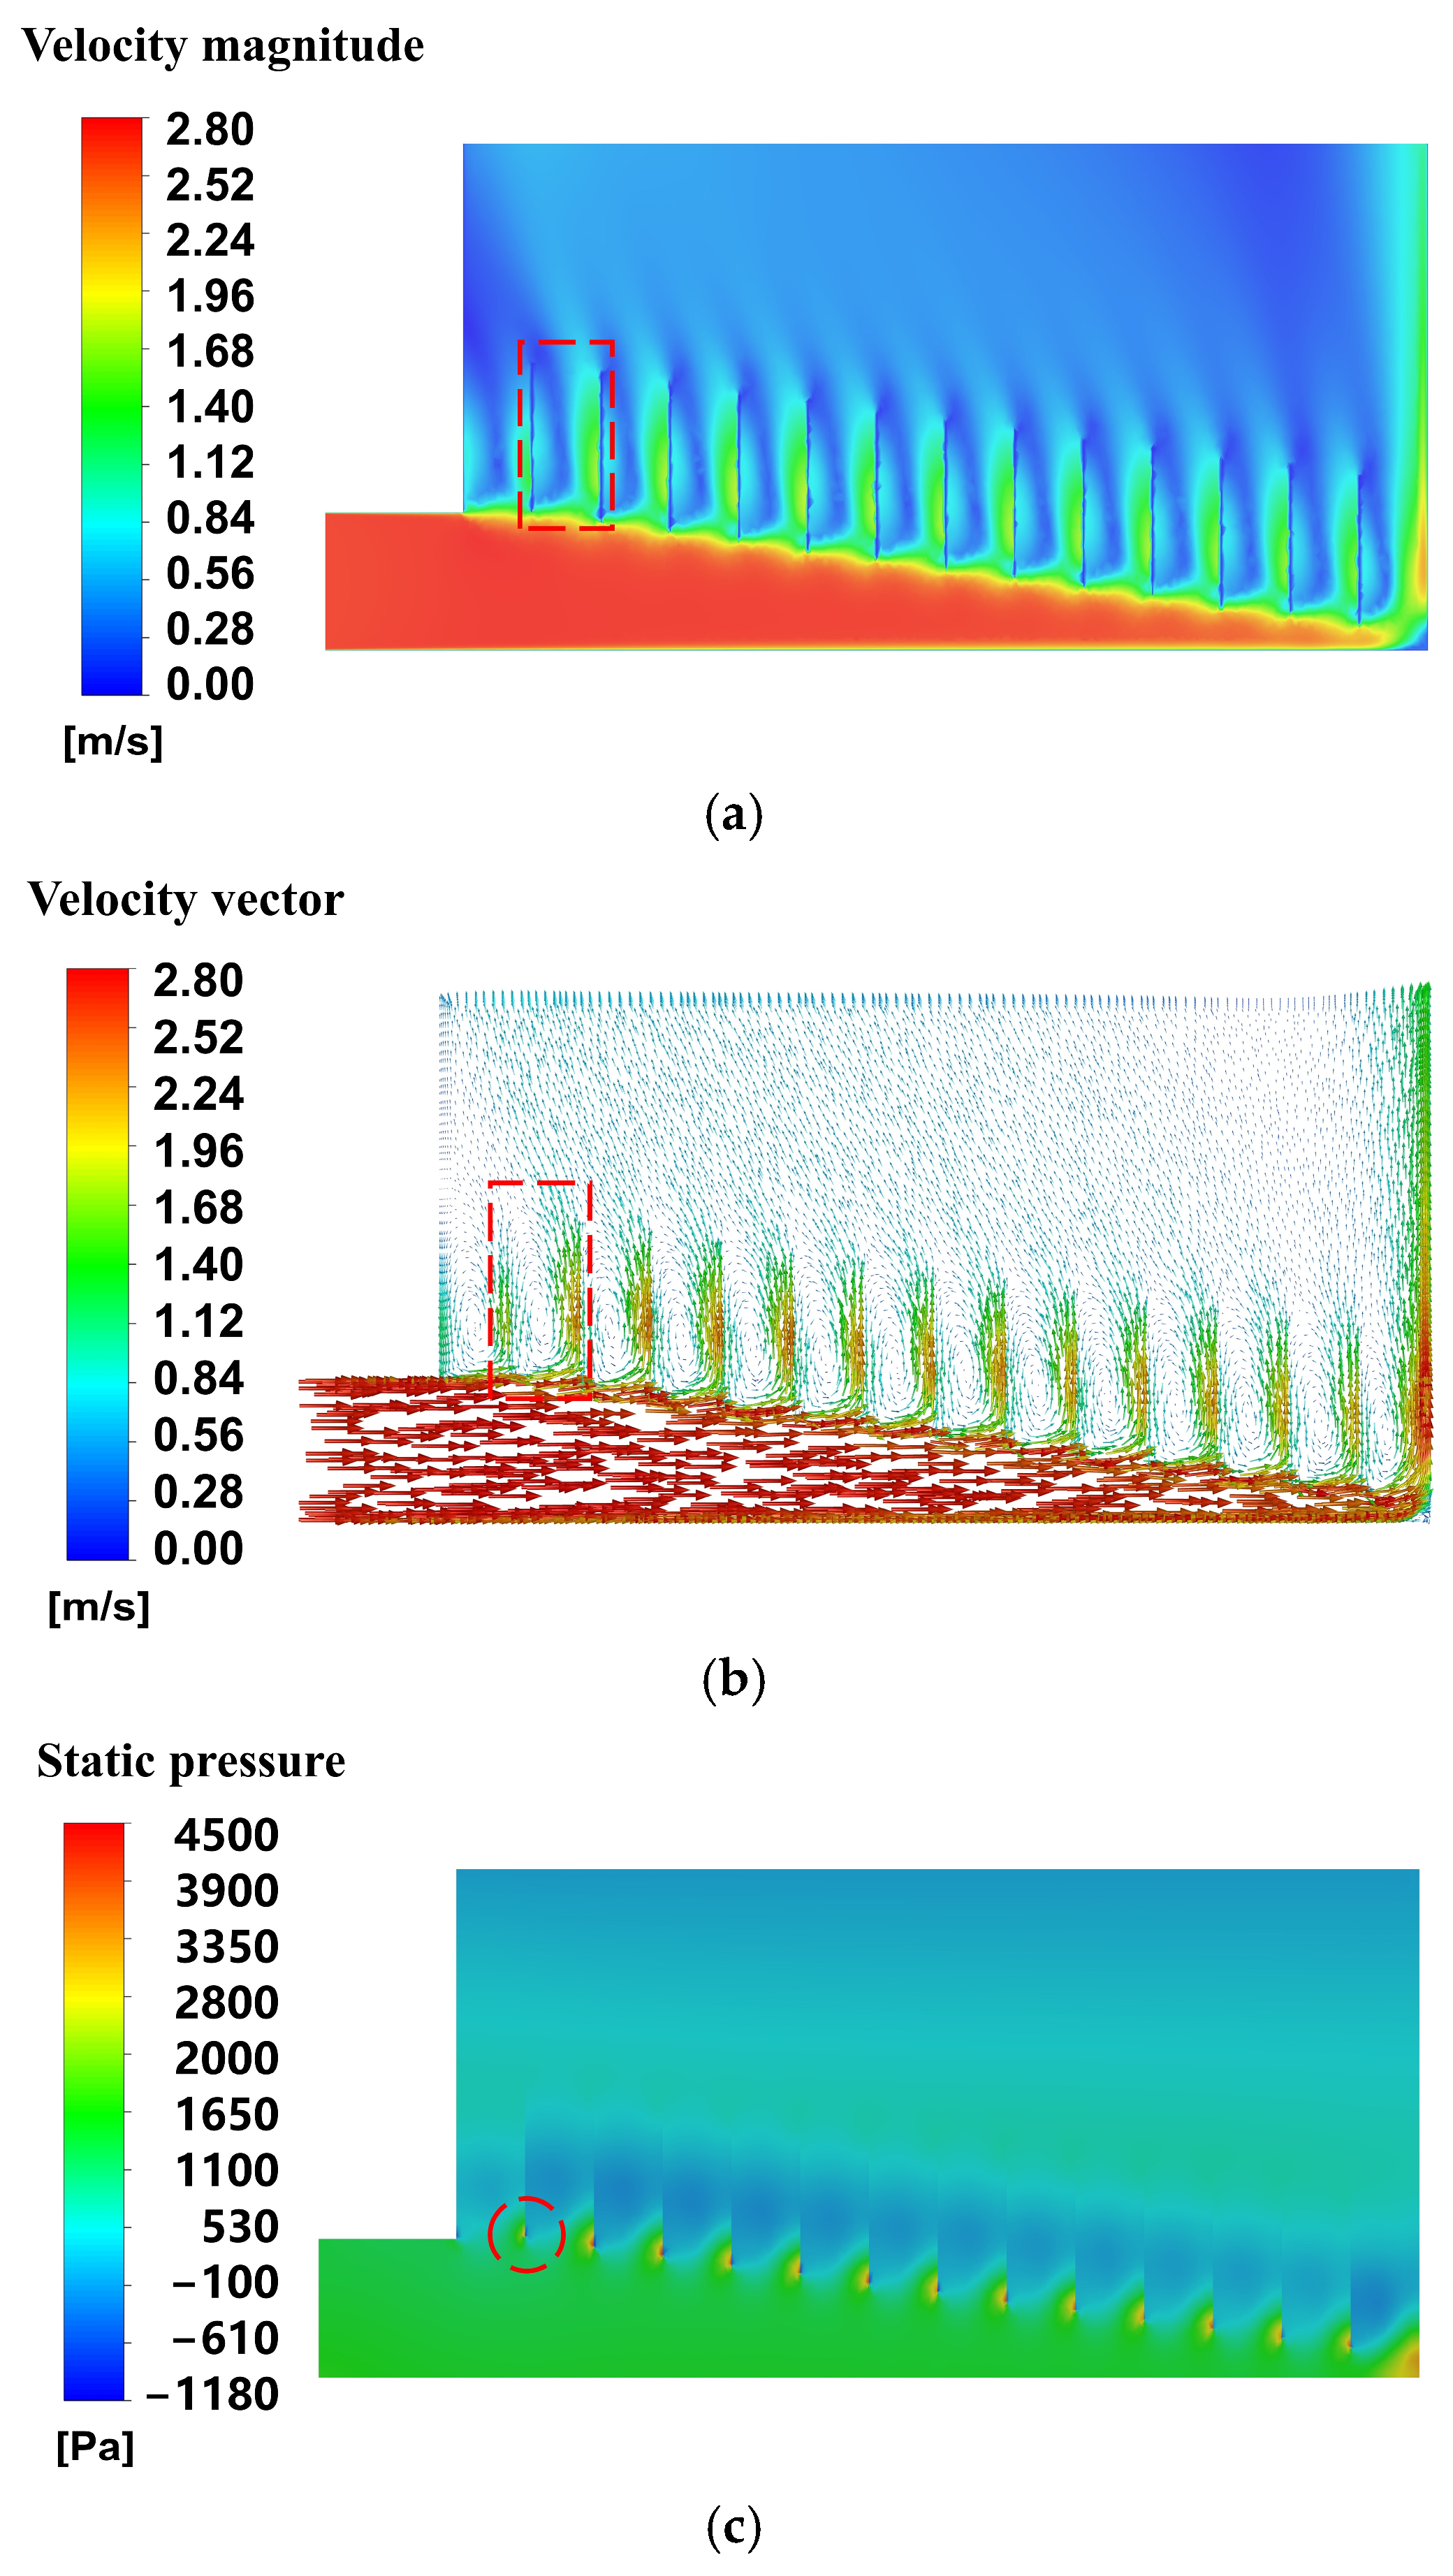
To elucidate the underlying cause of this phenomenon, the detailed flow field for the case with 13 baffles was extracted and presented in
Figure 12. The space enclosed by two adjacent baffles is defined as a single flow channel, with specific locations being indicated by red boxes in
Figure 12a. The liquid velocity contour in
Figure 12a clearly shows that high-velocity liquid from the inlet impinges upon the axially oriented stepped baffles. This impact redirects the flow from a transverse direction to an axial direction, moving upward along the baffles. During this process, the high-velocity fluid predominantly accumulates in the right-side region of the channel. It exerts strong entrainment and shear effects on the surrounding lower-velocity fluid, thereby inducing the formation of local recirculation vortices (
Figure 12b). These vortices significantly intensify energy dissipation within the channel and exacerbate the non-uniformity of transverse momentum transport. The velocity vector diagram in
Figure 12b further confirms the presence of prominent large-scale recirculating vortices within the channels formed by adjacent baffles. These distinctive flow structures directly lead to a markedly asymmetric velocity profile at the outlet section, characterized by significantly higher velocities on the right side compared to the left. Furthermore, the flow undergoes a secondary deflection upon exiting the channel, ultimately adversely affecting the overall uniformity of liquid distribution.
The static pressure contour in
Figure 12c elucidates the driving mechanism behind this flow phenomenon. As highlighted in the circled region, a local high-pressure zone (static pressure reaching 3200 Pa) develops in the lower right corner of the channel. This creates a transverse pressure difference of up to 3000 Pa relative to the low-pressure zone on the left (approximately 200 Pa). While this pressure gradient drives fluid transport towards the left, 85% of the high-velocity fluid (>1.4 m/s) remains attached to the right side of the baffle due to the Coanda effect (
Figure 10a). This caused the failure of the static-pressure-energy-driven mechanism, generating a recirculation vortex within the trough as shown in
Figure 2 and consequently resulting in poor liquid distribution quality.
When the number of baffles was increased from 13 to 19, the channel width decreased from 15 mm to 10.5 mm. In the flow passages formed between adjacent baffles, the difference in liquid velocity between the left and right sides of the channel was thereby reduced to 1 m/s. At this stage, a static-pressure-driven mechanism became operative, redistributing the energy of the liquid flowing upward along the baffles, thereby homogenizing the distribution and achieving an optimal maldistribution factor ML of 0.26.
However, when the number of baffles was further increased to 25, the channel width decreased from 10.5 mm to 8 mm. Under this configuration, the velocity difference between the left and right sides of the flow channel did not decrease significantly; instead, the excessively narrow channel caused a sharp increase in frictional resistance losses, raising the overall static pressure level within the passage. Meanwhile, the effective static pressure differential that drives lateral fluid migration diminished to approximately 2400 Pa owing to the pressure recovery effect induced by the increased velocity. More importantly, the residence time of the main flow within the channel was markedly shortened, and the transverse pressure gradient could no longer redistribute the energy sufficiently within the limited available time, allowing inertial forces to regain dominance. The high-velocity fluid once again adhered to one side of the baffle, and the low-pressure region on the left side received insufficient fluid replenishment, leading to a significant deterioration in liquid distribution quality, with
ML rebounding from 0.26 to 0.45. This indicates that the 10.5 mm channel width, corresponding to 19 baffles, represents the critical point at which the static-pressure-driven redistribution mechanism and the residence time are optimally balanced under the current operating conditions. Excessively increasing the number of baffles disrupts the established energy redistribution equilibrium and degrades the distribution uniformity. This is consistent with the findings of Heggemann et al. [
24], who reported that densely packed baffles intensify flow disturbances.
5.1.2. Effect of Horizontal Baffles and Guide Vanes
To overcome the limitations induced by excessive confinement, a composite structure comprising a transverse baffle and vertical guide vanes was proposed, as shown in
Figure 13, aimed at rectifying the flow field through a synergistic mechanism of resistance allocation and flow guidance. The transverse baffle introduces a secondary throttling point within the mid-channel, which counteracts the inertial forces at high liquid velocities and compensates for the deficiency in the static pressure gradient driving force identified above. Simultaneously, the vertical guide vanes, leveraging the Coanda effect, constrain the direction of the mainstream to suppress the right-side bias flow observed at the baffle region outlet. As a result, the synergy between these elements achieves a two-stage energy redistribution.
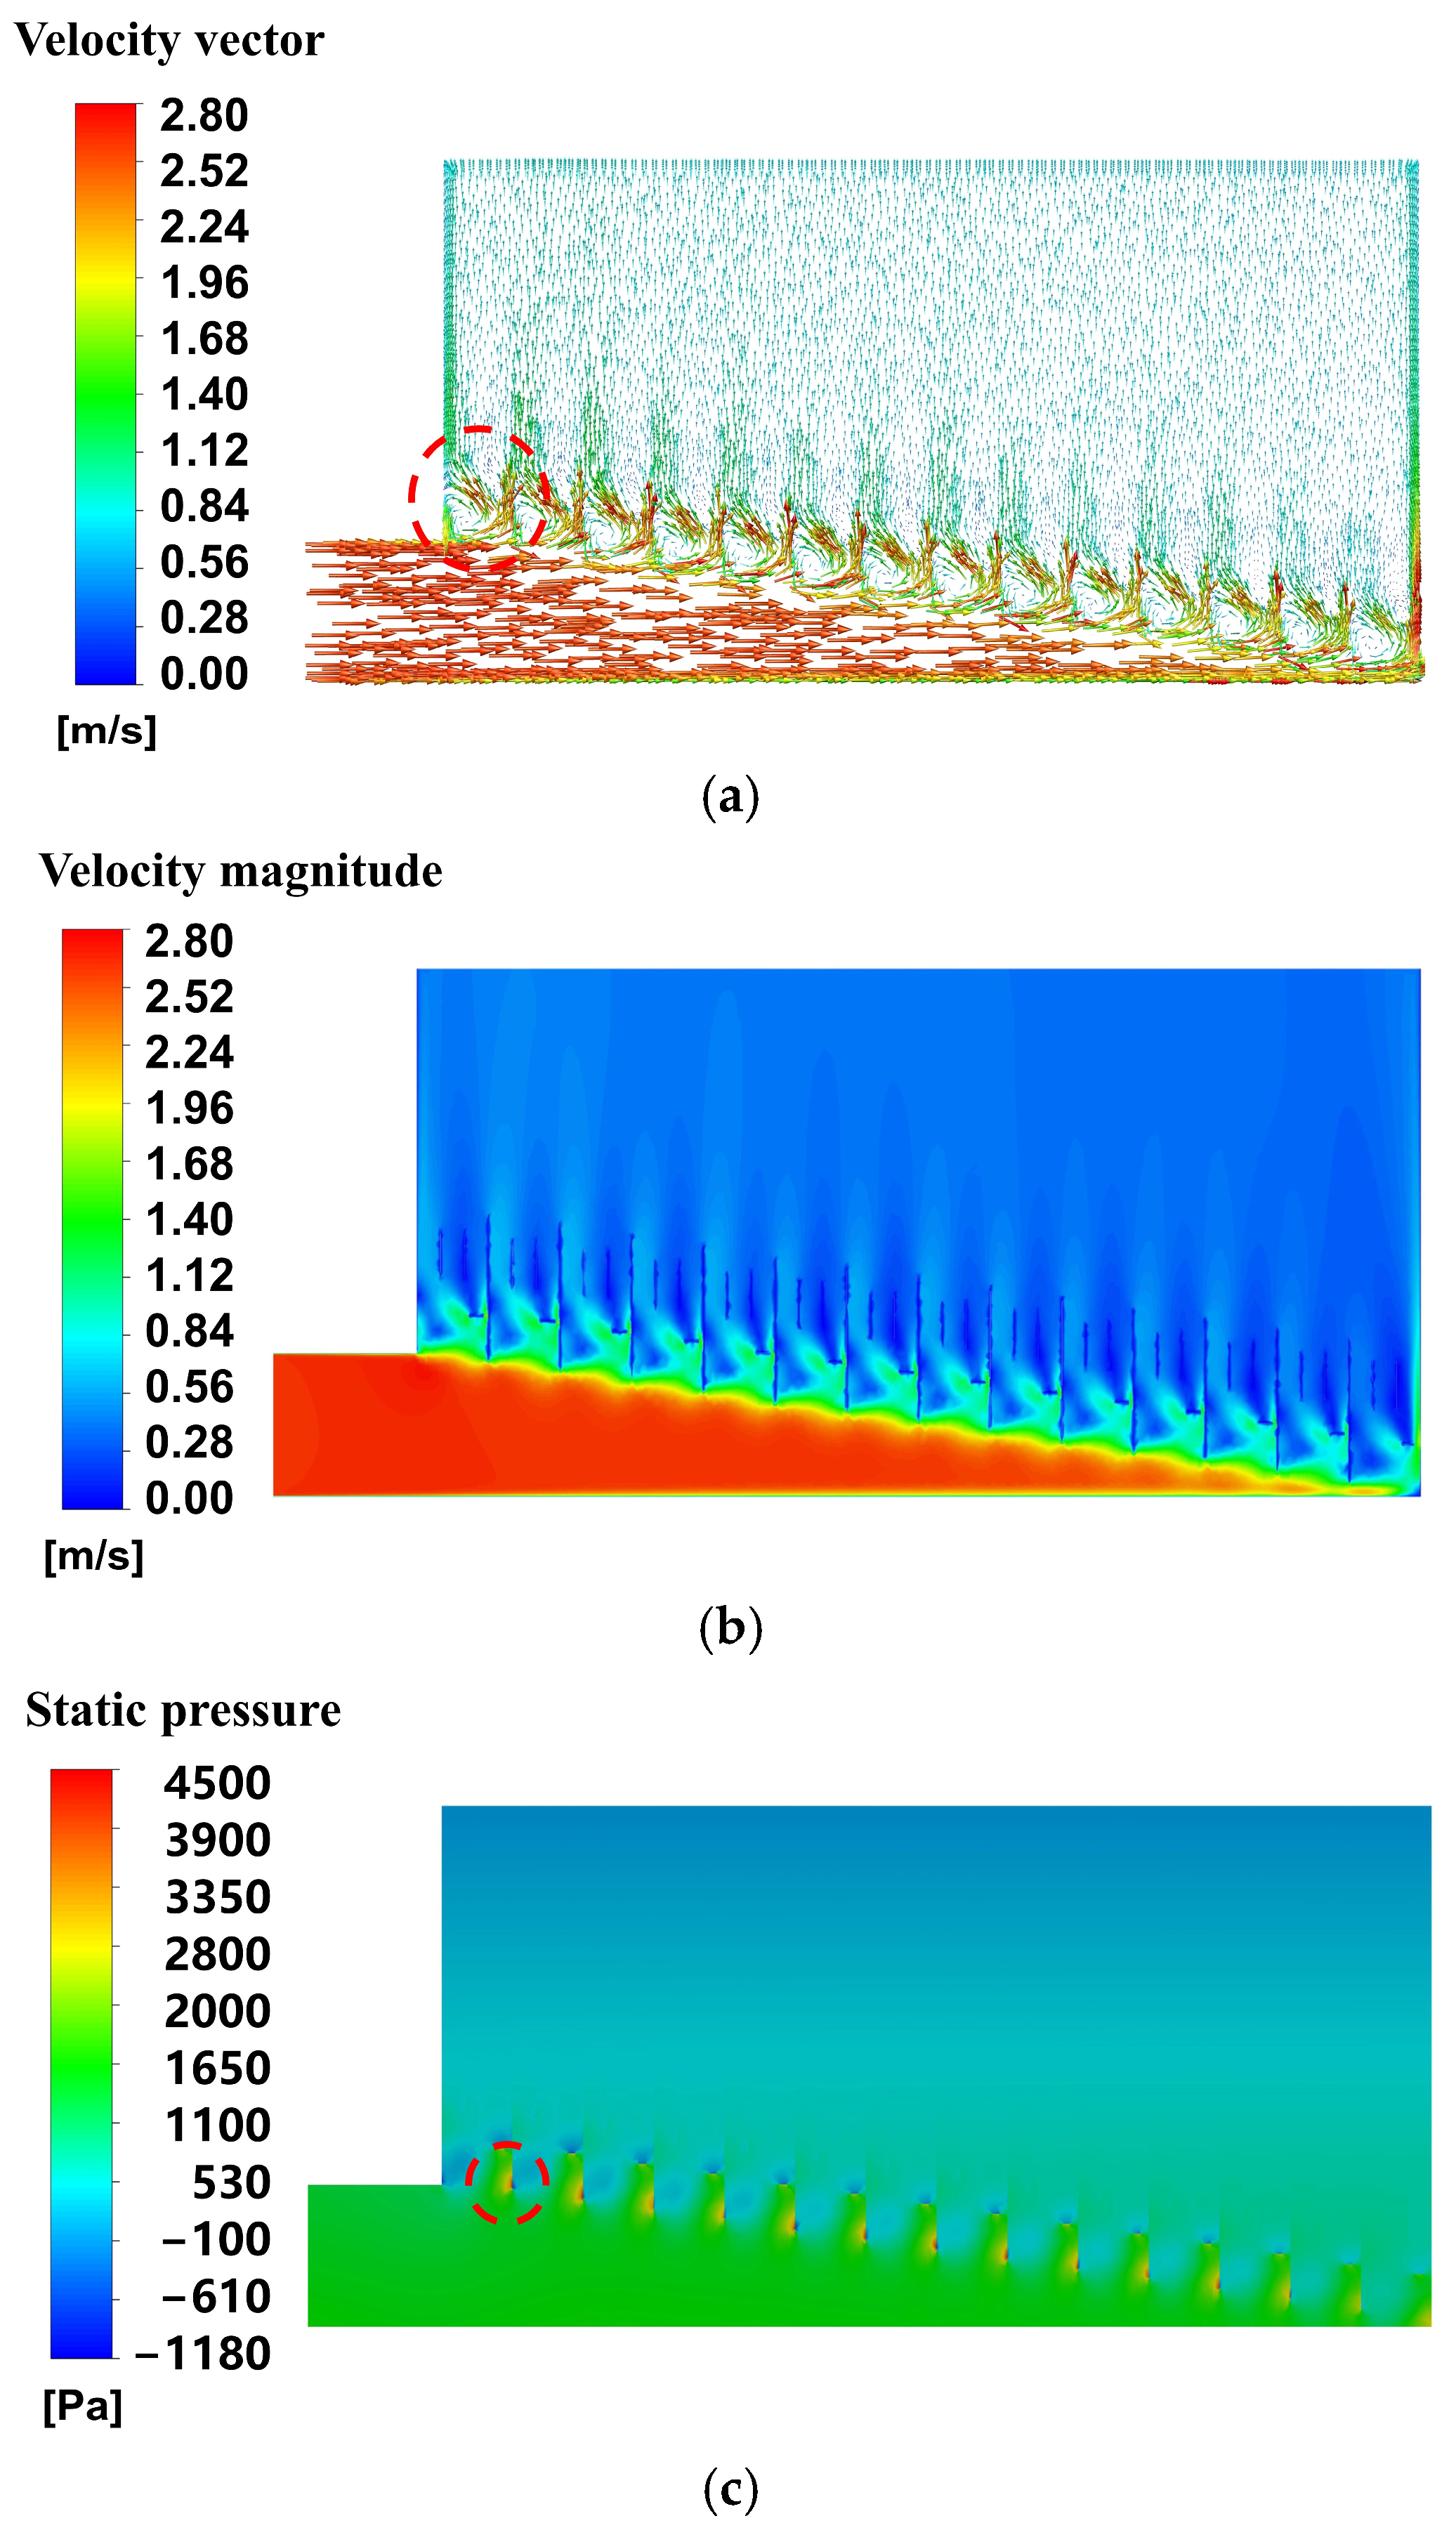
As shown in
Figure 14, this composite structure fundamentally reorganizes the internal flow morphology. The vector field clearly shows that the axial liquid flow ascending along the stepped baffles encounters the physical obstruction of the transverse baffle in the velocity development region, resulting in pronounced flow deflection and splitting. This structure enhances the driving force for transverse liquid movement and achieves a secondary resistance allocation of flow energy. And the previously dominant large-scale recirculating vortices are effectively broken into more ordered, small-scale vortices, which are localized below the transverse baffle and significantly suppress the secondary flows. This, in turn, promotes a more uniform and stable velocity distribution at the outlet.
Figure 14b,c present the velocity magnitude contour and static pressure distribution contour, respectively. A comparison reveals that the conversion between static pressure energy and kinetic energy by this modified structure is primarily concentrated in the vicinity of the transverse baffle. After the fluid passes the transverse baffle, the static pressure distribution rapidly equalizes, and the differences in liquid velocity diminish significantly. This indicates that the flow field, after undergoing structural adjustment, restores a favorable energy balance, laying a hydrodynamic foundation for enhanced outlet distribution uniformity.
To clarify the flow regulation mechanisms exerted by the transverse baffles and guide vanes within the distribution trough, liquid-phase flow was computed at a spray density of 60 m3/(m2·h) for a trough equipped only with transverse baffles (designated as Trough X), a trough equipped only with guide vanes (designated as Trough Y), and a trough incorporating both structures (designated as Trough XY); the results were then compared.
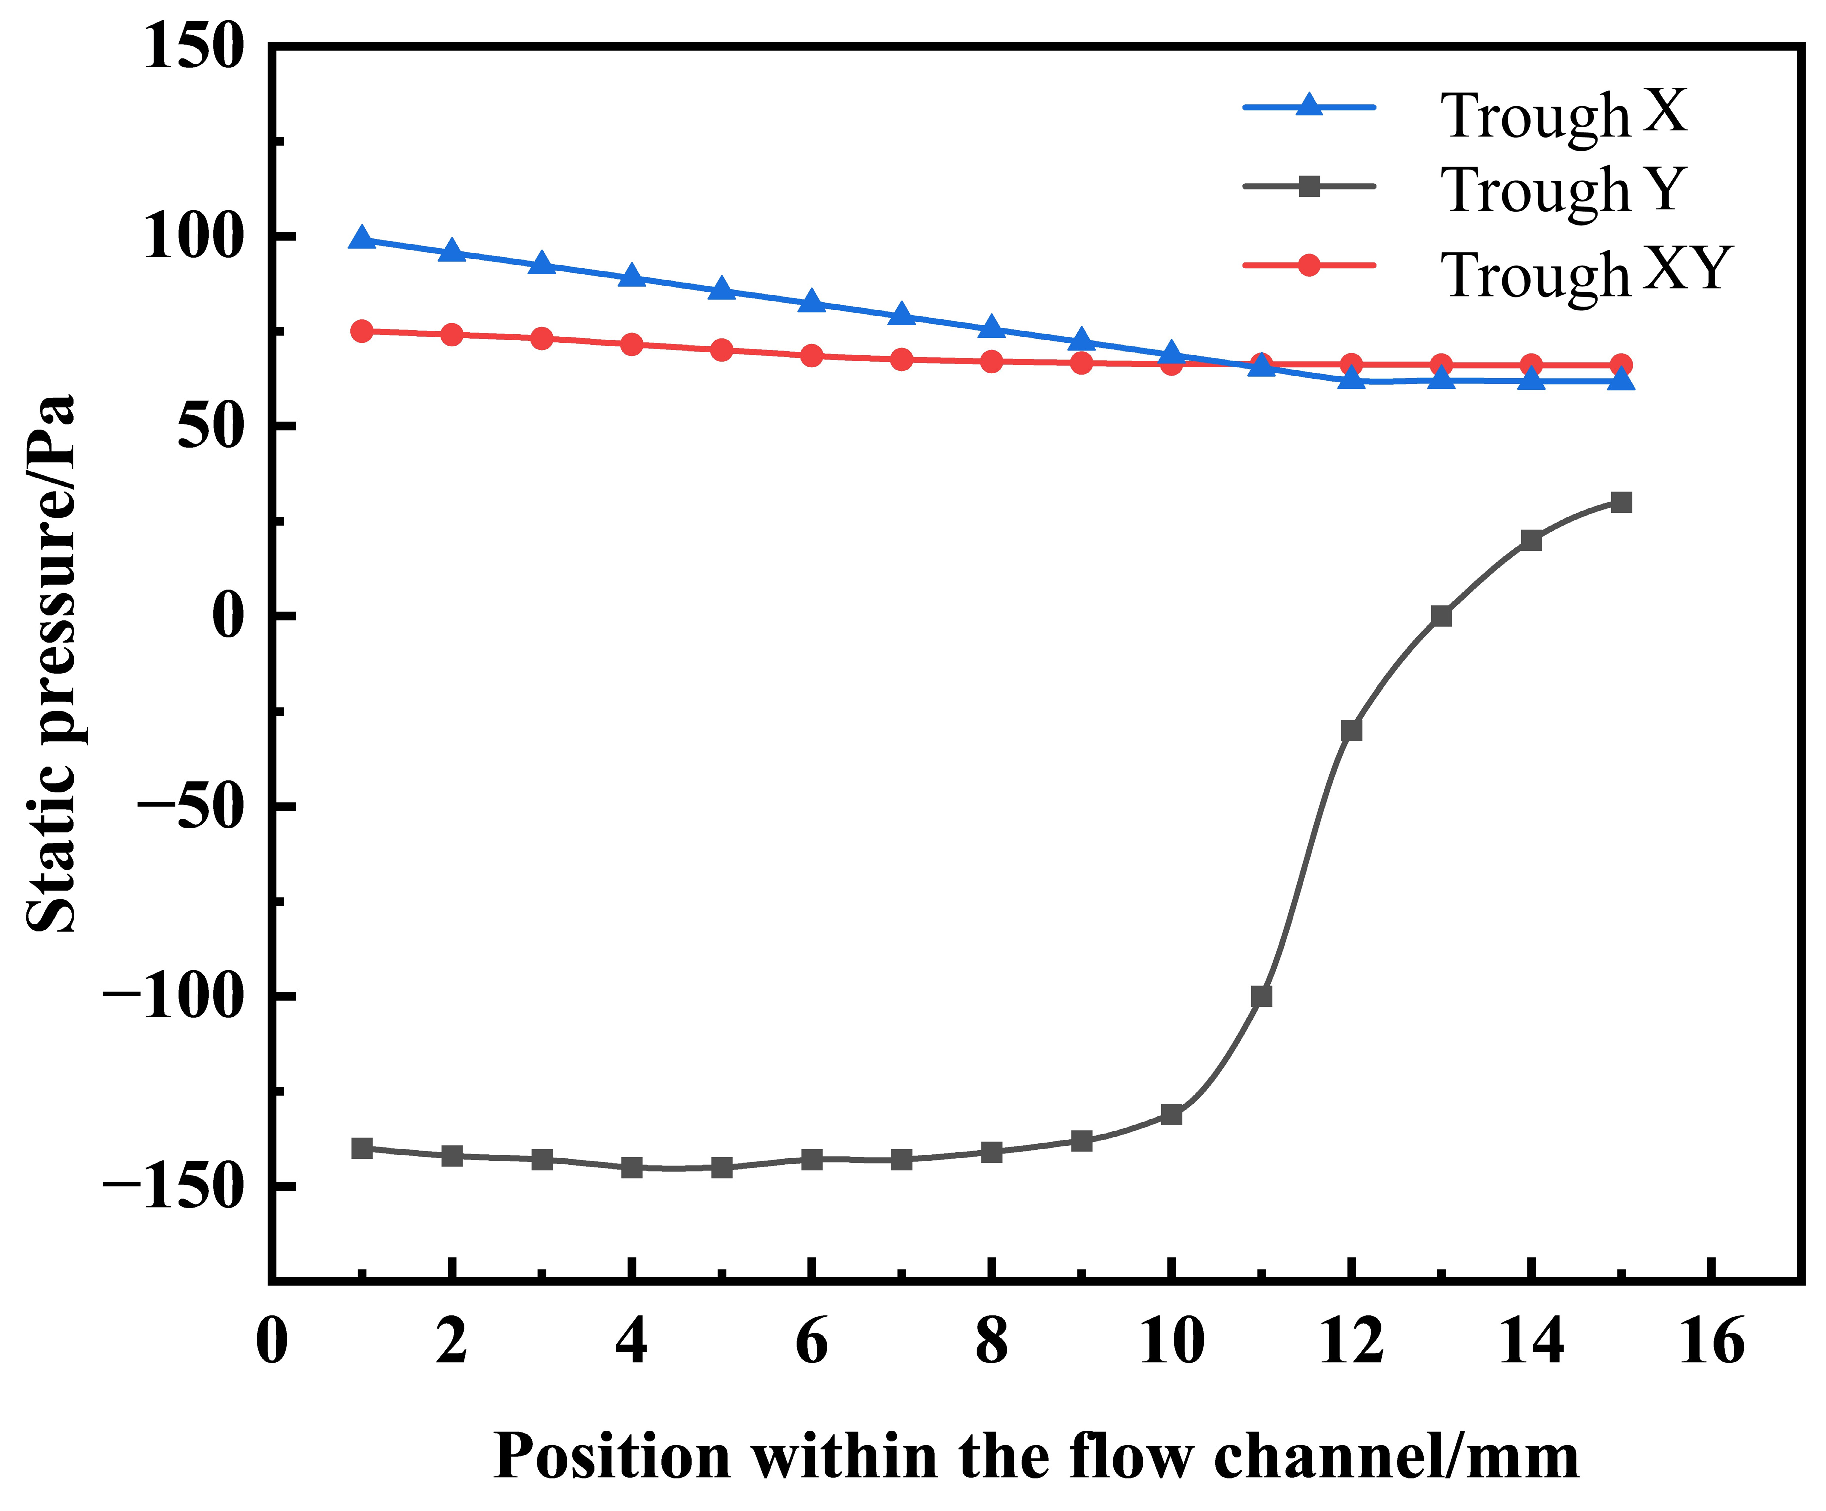
First, the static pressure distribution was analyzed at a common cross-sectional location within the three distribution troughs, and the corresponding pressure profiles are plotted in
Figure 15. This cross-section was located downstream of the transverse baffle (for the troughs equipped with one) and was intended to verify the effectiveness of the transverse baffle in redistributing the static pressure energy. As shown in
Figure 15, for Trough Y, the static pressure profile exhibited markedly lower pressure on the left side of the flow channel and relatively higher pressure on the right side, resulting in a pronounced lateral pressure difference. In contrast, Trough X, fitted with transverse baffles, and Trough XY, which incorporated both transverse baffles and guide vanes, displayed considerably more uniform static pressure distributions. These results indicate that the transverse baffle can effectively redistribute the static pressure energy, thereby improving the flow uniformity within the distribution trough.
The total pressure drop (the difference in total pressure between the inlet and outlet) for the three troughs was 7090 Pa for Trough X, 5758 Pa for Trough Y, and 5680 Pa for Trough XY. When only transverse baffles were present, the liquid flow was severely disturbed and large-scale vortices were generated, resulting in significant energy dissipation and a total pressure drop as high as 7090 Pa. With the introduction of guide vanes, the flow was pre-conditioned. When the transverse baffles and guide vanes were used in combination, a synergistic rectification effect was achieved: the guide vanes suppressed flow maldistribution and impingement upstream of the transverse baffles, while the transverse baffles eliminated local recirculation that could otherwise be induced by the guide vanes. The Q-criterion analysis results for the three troughs, presented in
Table 5, provide further support for this interpretation.
Based on the fluent simulation analysis, vortical structures in the baffle region of the three troughs were predominantly concentrated in areas where the Q-criterion exceeded 5000 s−2. To enable a quantitative comparison, the volume of this region was calculated for each configuration. In Trough X, because of the absence of the flow partitioning effect of guide vanes, the Q-value was generally high throughout the trough, and the vortex volume in the baffle region reached 7.20 × 10⁻⁴ m3, which was far larger than those in the other two troughs. Trough Y, fitted only with guide vanes, exhibited a markedly lower overall Q-value than Trough X; however, lacking the energy dissipation provided by transverse baffles, the liquid velocity remained relatively high, resulting in Q-values that still exceeded those of Trough XY.
A comparison of the liquid-phase flow simulation results for the three troughs shows that the cross-sectional maldistribution factor ML was 0.19, 0.35, and 0.14 for Trough X, Trough Y, and Trough XY, respectively. The highest ML was observed for Trough Y, which was equipped only with guide vanes, indicating the poorest liquid distribution uniformity; the guide vanes alone failed to effectively suppress local liquid accumulation. For Trough X, which contained only transverse baffles, ML decreased to 0.19, representing a significant improvement in distribution uniformity and demonstrating that the transverse baffles exerted a more direct and effective role in laterally obstructing and redistributing the flow. Notably, Trough XY, which incorporated both transverse baffles and guide vanes, achieved the lowest ML of 0.14, corresponding to a reduction of approximately 26.3% compared with Trough X and 60.0% compared with Trough Y.
Taken together, the three metrics—total pressure drop, volume of the high-Q region, and cross-sectional maldistribution factor ML—reveal the following comprehensive performance. Trough X reduced ML to 0.19 through the strong turbulent dissipation induced by the transverse baffles; however, its total pressure drop (7090 Pa) and vortex volume (7.20 × 10⁻⁴ m3) were both markedly higher, indicating that the rectification strategy came at the cost of high energy consumption and was therefore economically unfavorable. Trough Y, with guide vanes alone, exhibited a moderate total pressure drop (5758 Pa) but had the highest ML (0.35) and a vortex volume still larger than that of Trough XY, indicating that guide vanes by themselves were insufficient to eliminate local liquid accumulation and residual recirculation within the trough. Trough XY achieved the best overall performance among the three configurations: the lowest total pressure drop (5680 Pa), the smallest ML (0.14), and the smallest volume of high-Q vortices. These results demonstrate a pronounced synergistic rectification mechanism between the transverse baffles and the guide vanes. The transverse baffles, through lateral obstruction and fluid redistribution, effectively prevented the non-uniform advancement of the liquid layer along the main flow direction. The guide vanes partitioned the liquid flow passing through the transverse baffles, thereby effectively suppressing the generation of large-scale vortices. The combined “baffle first, guide second” action not only avoided the excessive energy dissipation associated with transverse baffles alone but also remedied the poor distribution uniformity of using guide vanes alone.
5.2. Hydrodynamic Instability and Liquid Distribution Under High Spray Densities
High spray density is a critical operating condition in industrial gas–liquid contactors, which is essential for maintaining adequate packing wetting and mass transfer efficiency. However, increasing liquid spray density fundamentally alters the hydrodynamic regimes within the distributor, potentially amplifying flow instability and degrading distribution performance. In this section, the adaptability of both original and modified distributor structures is systematically evaluated under varying spray densities, with particular emphasis on the underlying mechanisms linking flow instability, surface fluctuation, and distribution deterioration.
5.2.1. The Original Liquid Distributors
The performance of the original distributor is first examined under varying spray densities.
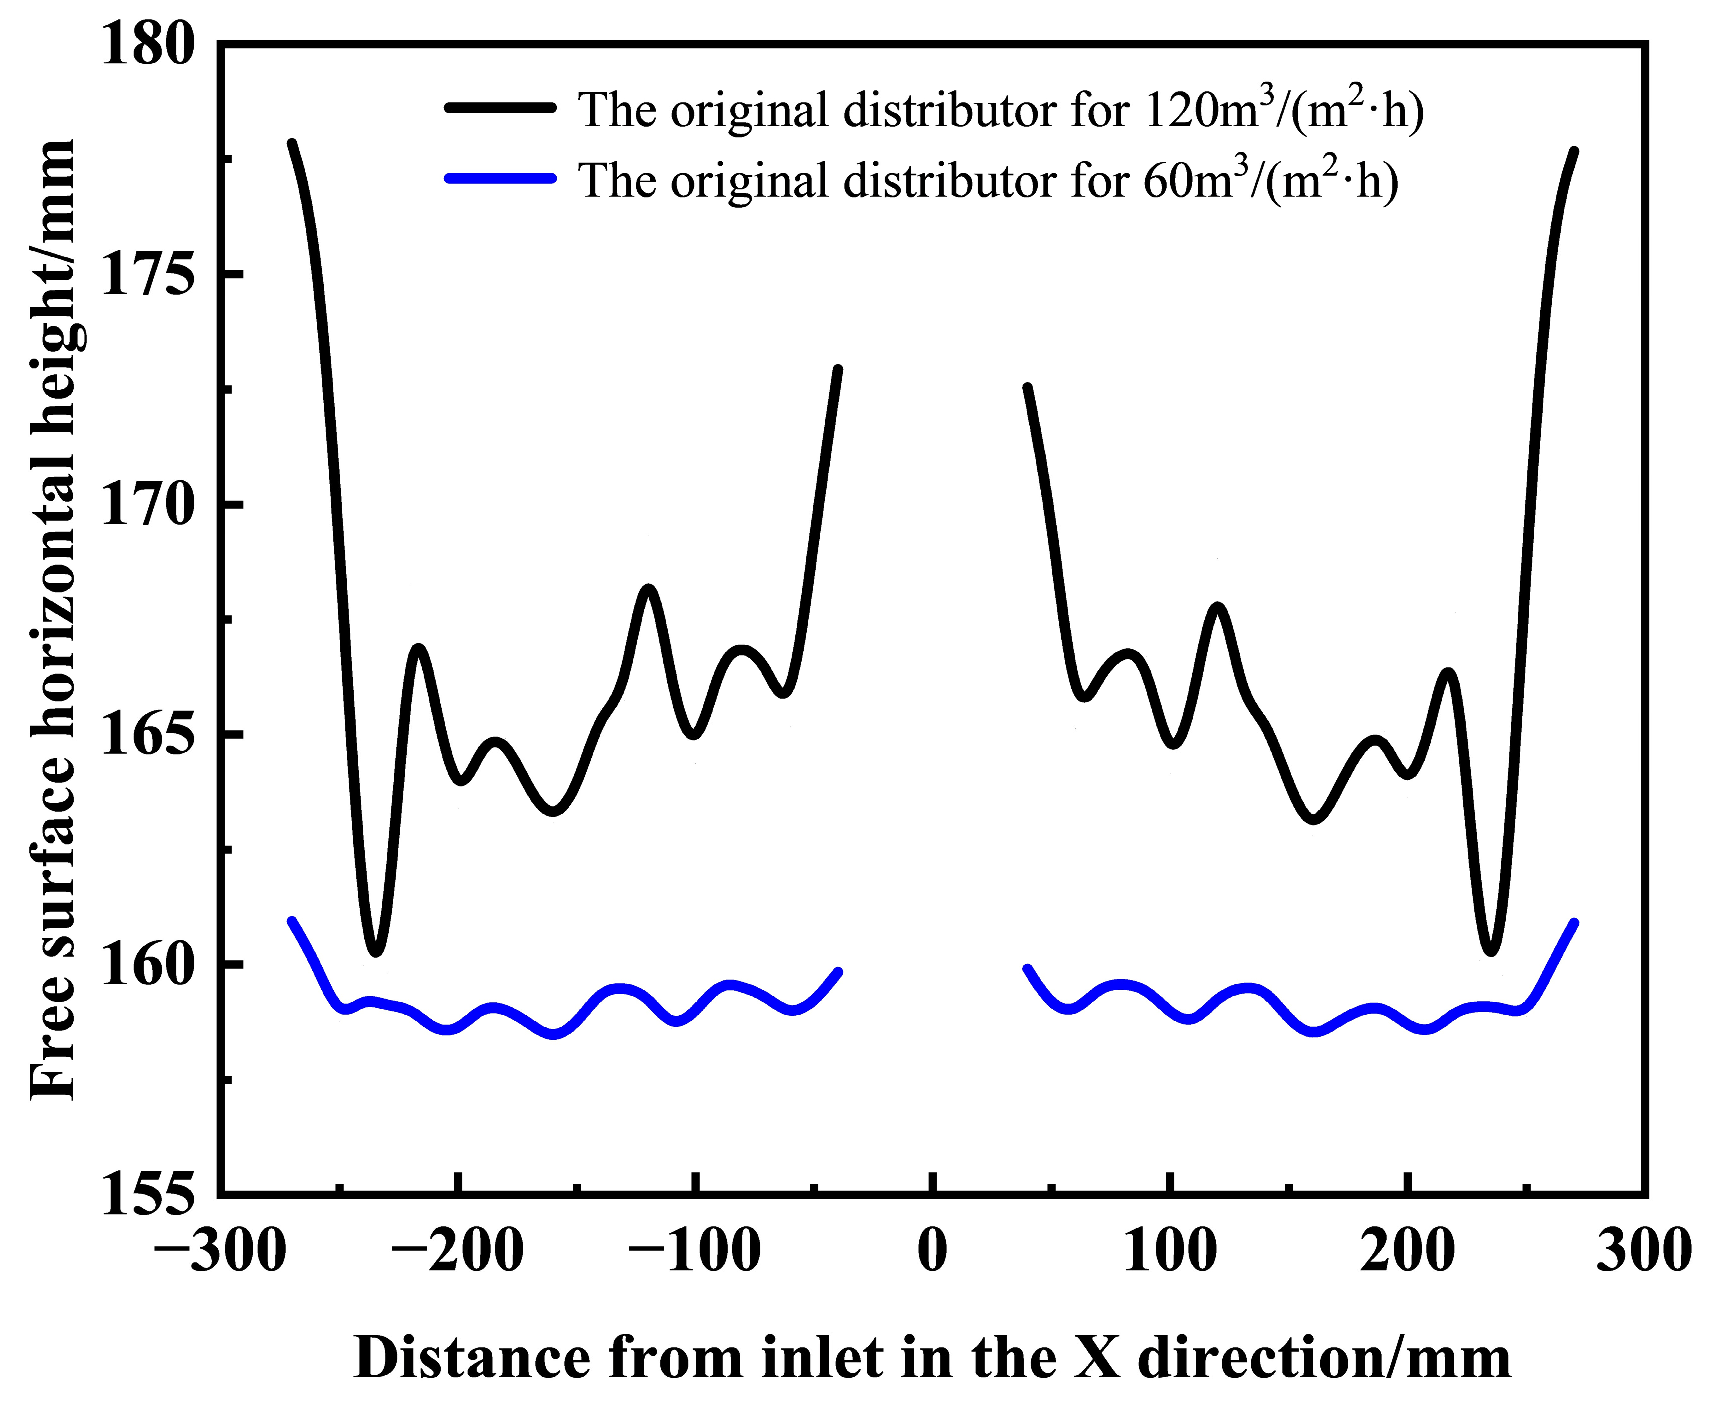
Figure 16 shows the height of the gas–liquid interface at two representative spray densities, 60 m
3/(m
2·h) and 120 m
3/(m
2·h). At the lower spray density (60 m
3/(m
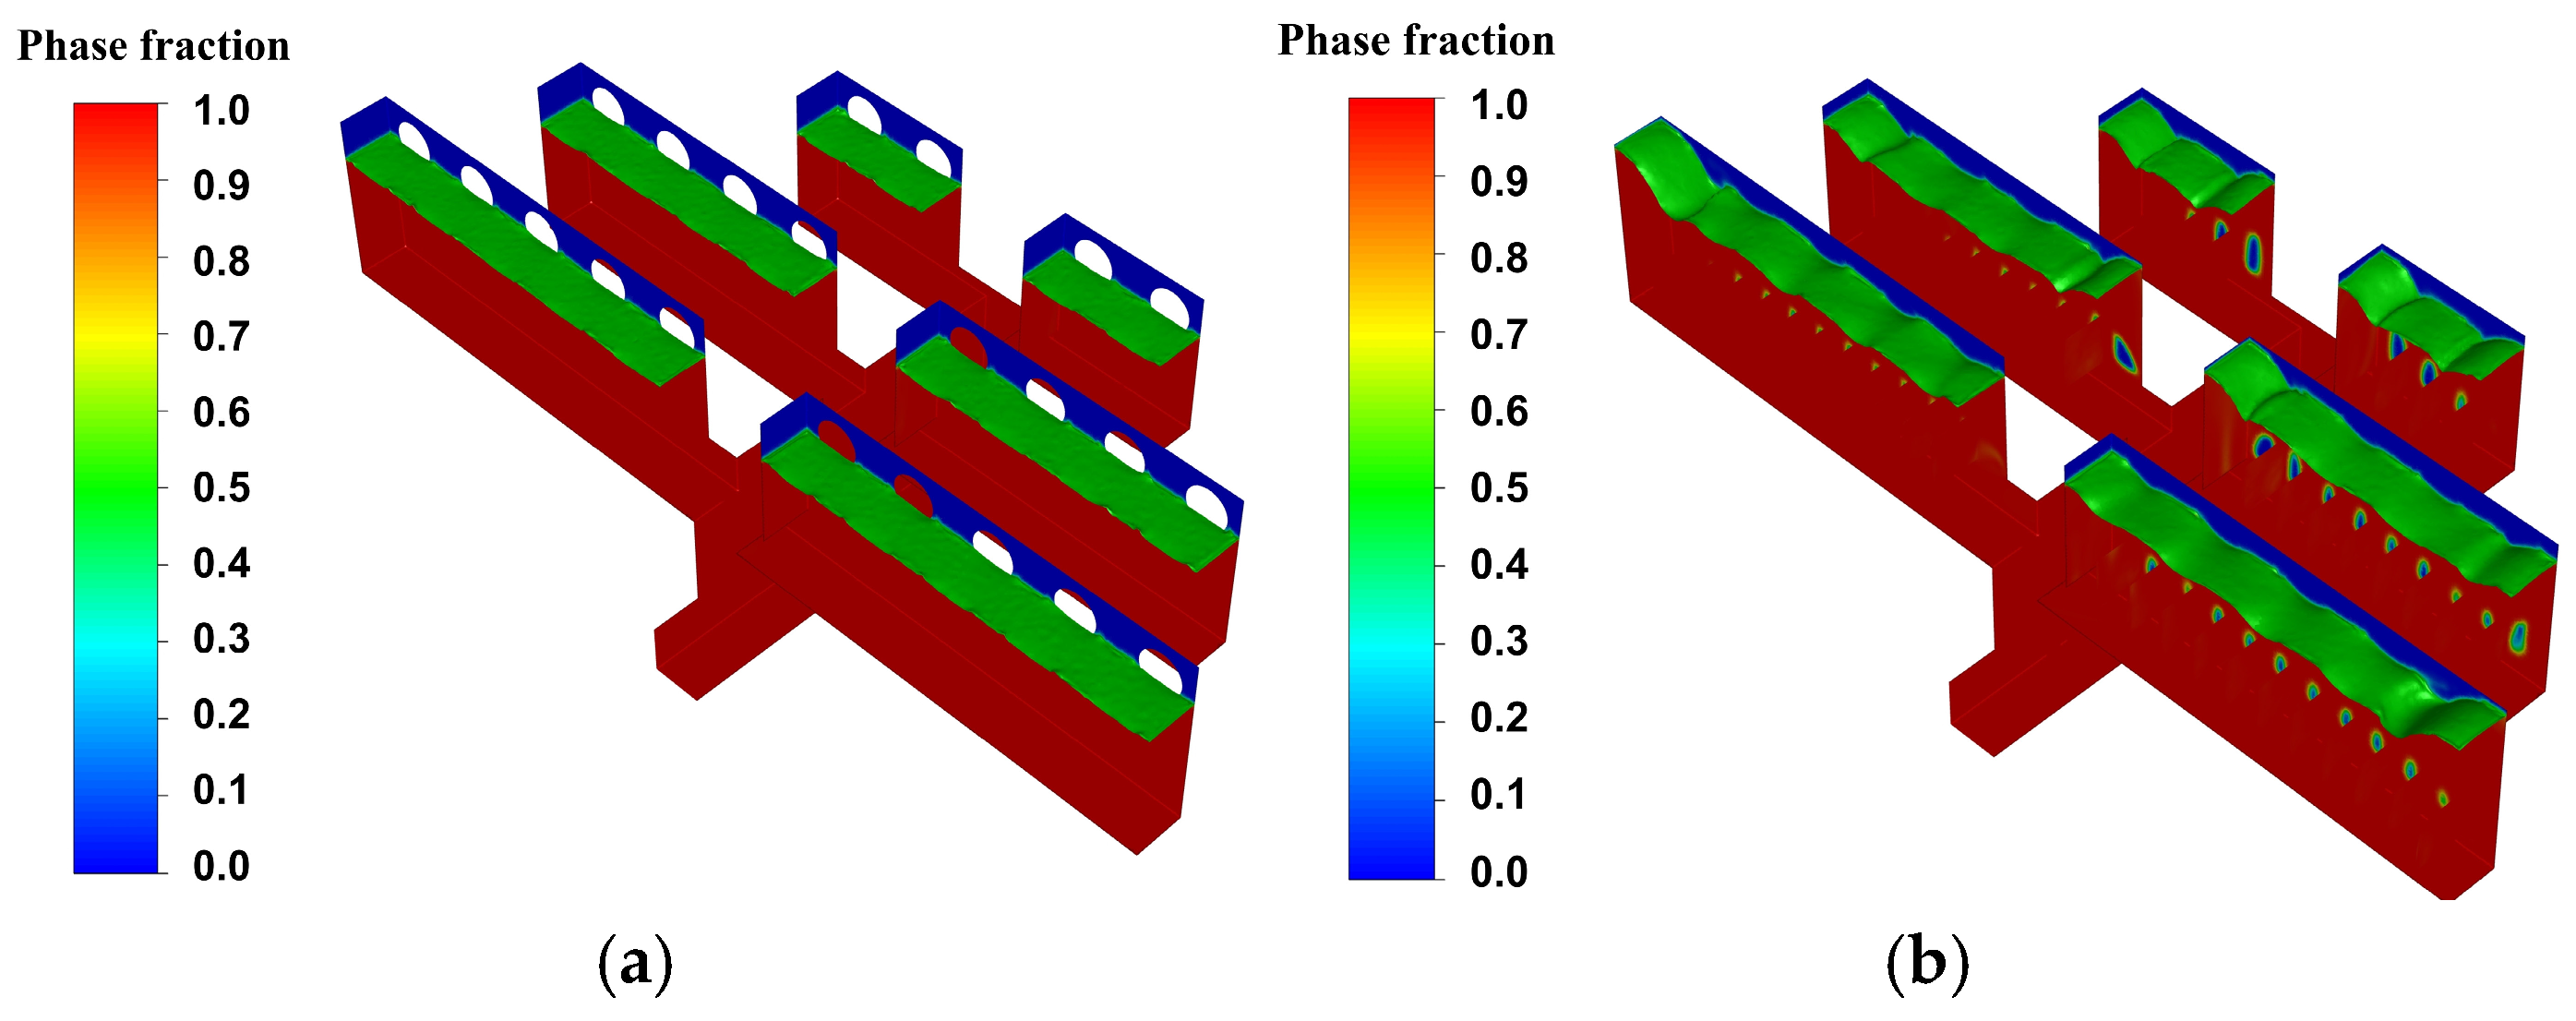
2·h)), the flow remains relatively stable, as indicated by the nearly constant gas–liquid interface coordinates at around 160 mm and smooth liquid surface within the trough (
Figure 17a). It reveals the internal flow regime is well-organized, and energy distribution among the secondary trough outlets is relatively balanced, resulting in satisfactory distribution performance.
However, upon increasing the spray density to 120 m
3/(m
2·h), a transition to a highly unstable regime is observed. The liquid surface exhibits violent fluctuation (
Figure 16), accompanied by strong internal flow agitation (
Figure 17b).
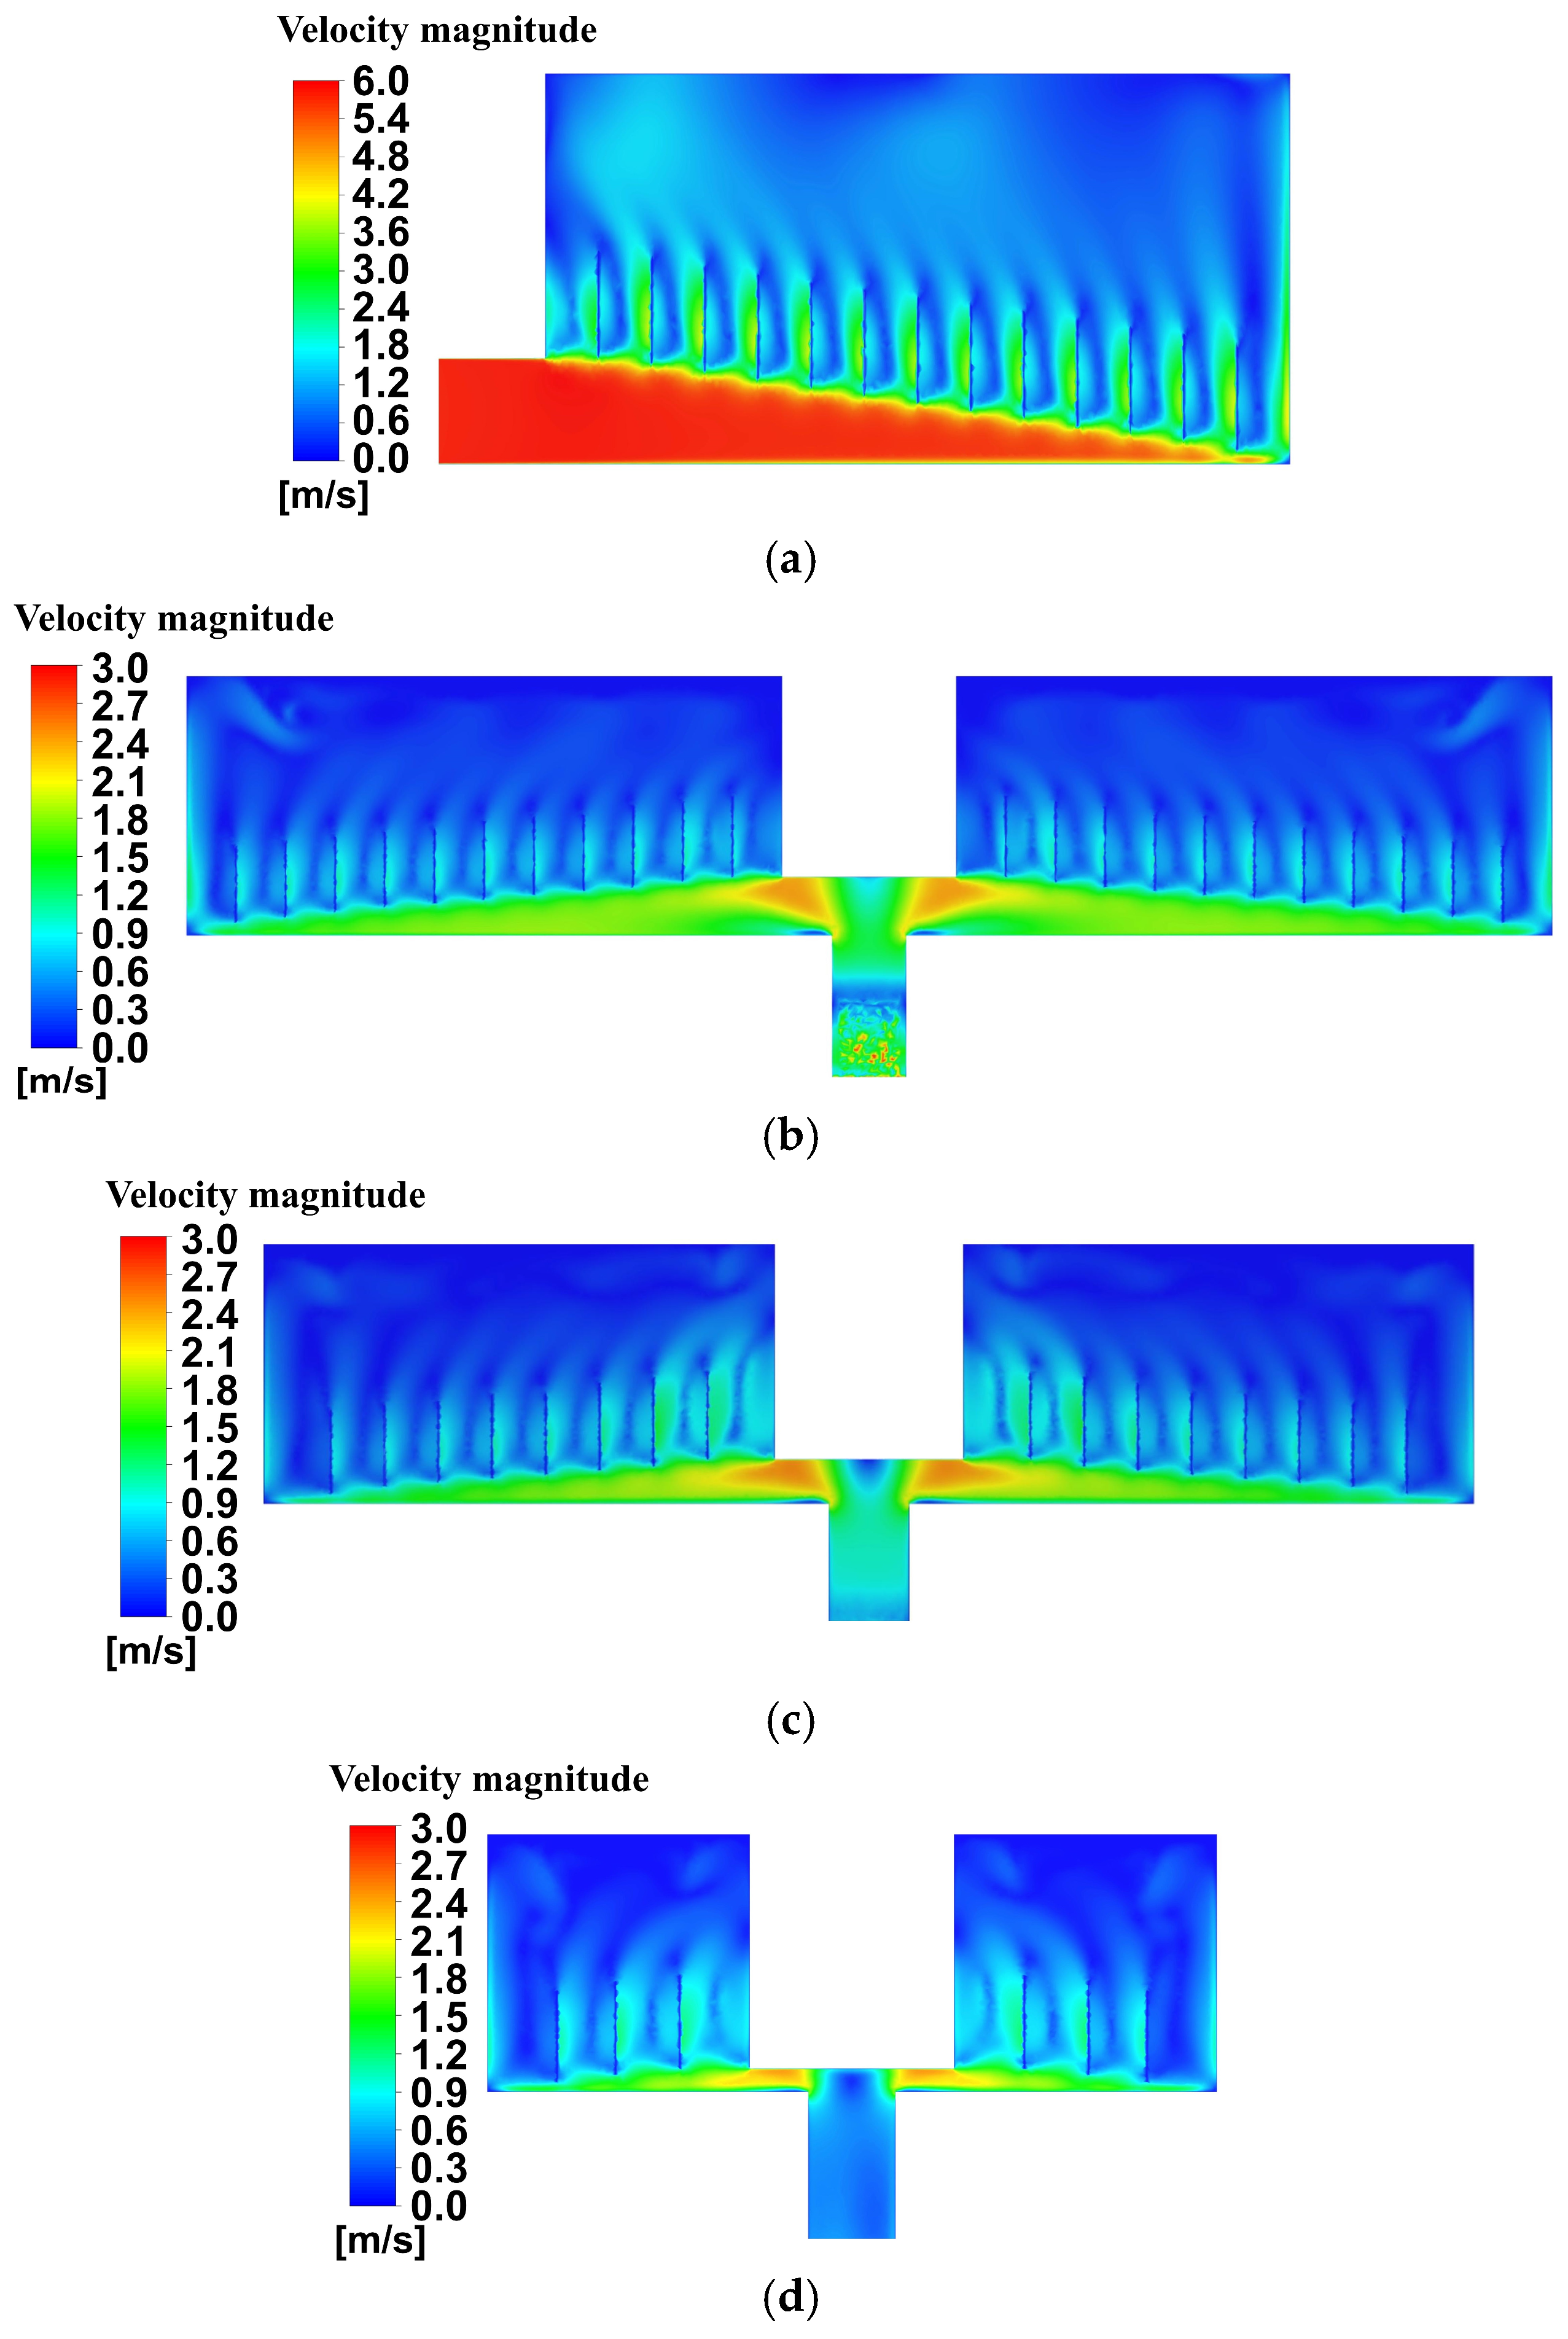
Figure 18 further illustrates the velocity distribution contours within the distributor under the high liquid spray density of 120 m
3/(m
2·h). The upper regions of
Figure 18b–d clearly show the development of high-velocity jet zones and low-velocity recirculation zones in the area downstream of the baffles, creating a pronounced biased flow phenomenon. This non-uniform velocity distribution not only hinders adequate liquid mixing within the trough but also causes an energy imbalance, which in turn induces the intense surface fluctuations observed, directly contributing to the degradation of distribution uniformity.
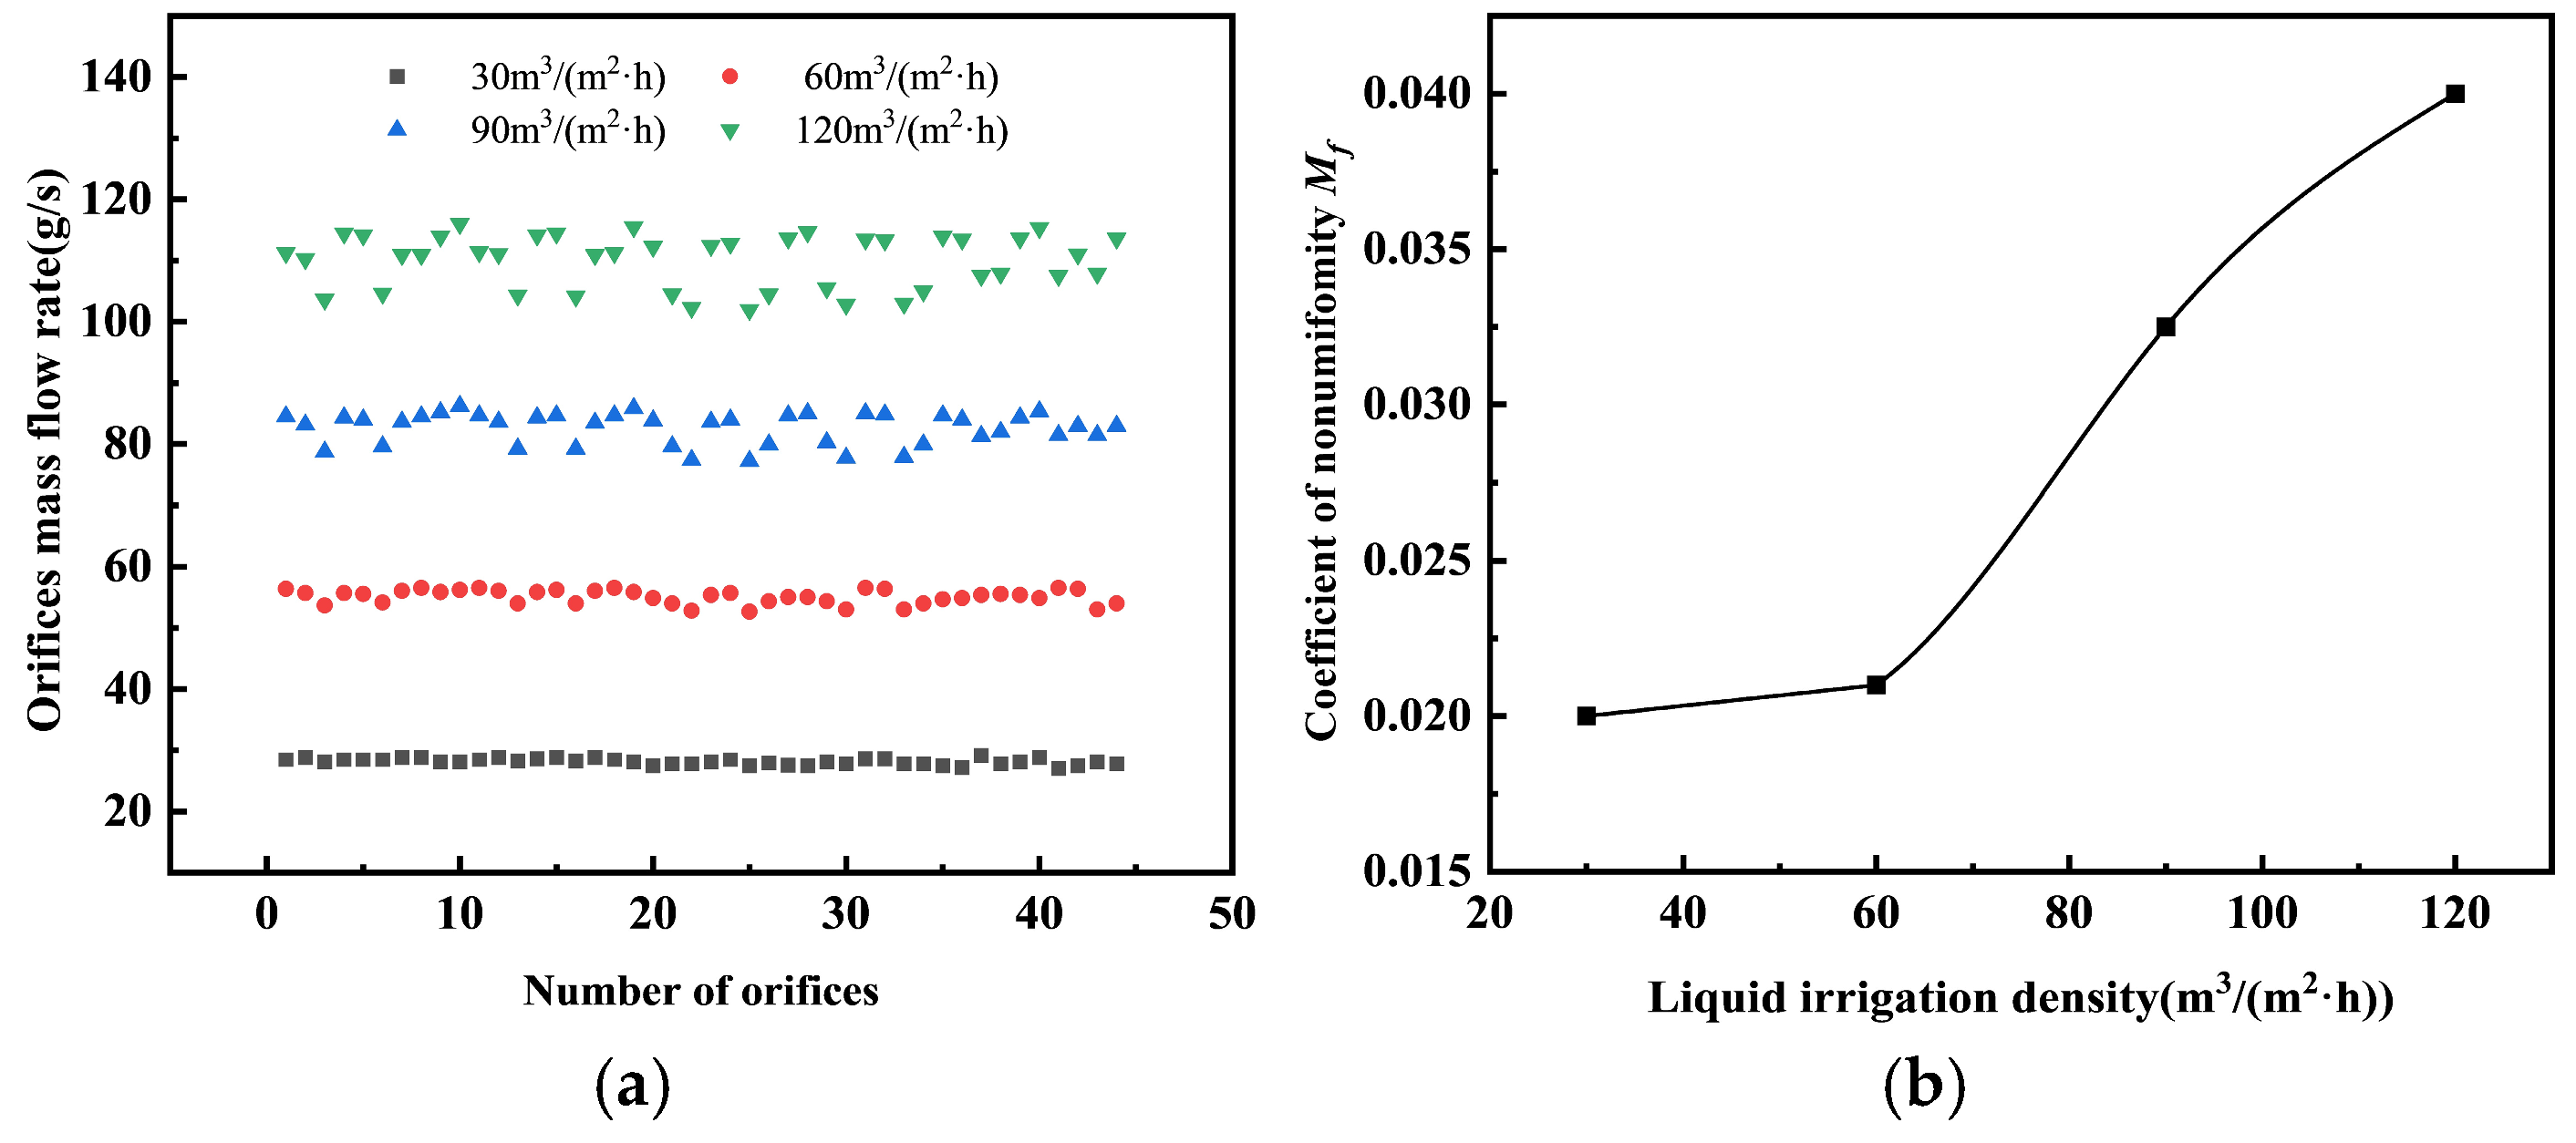
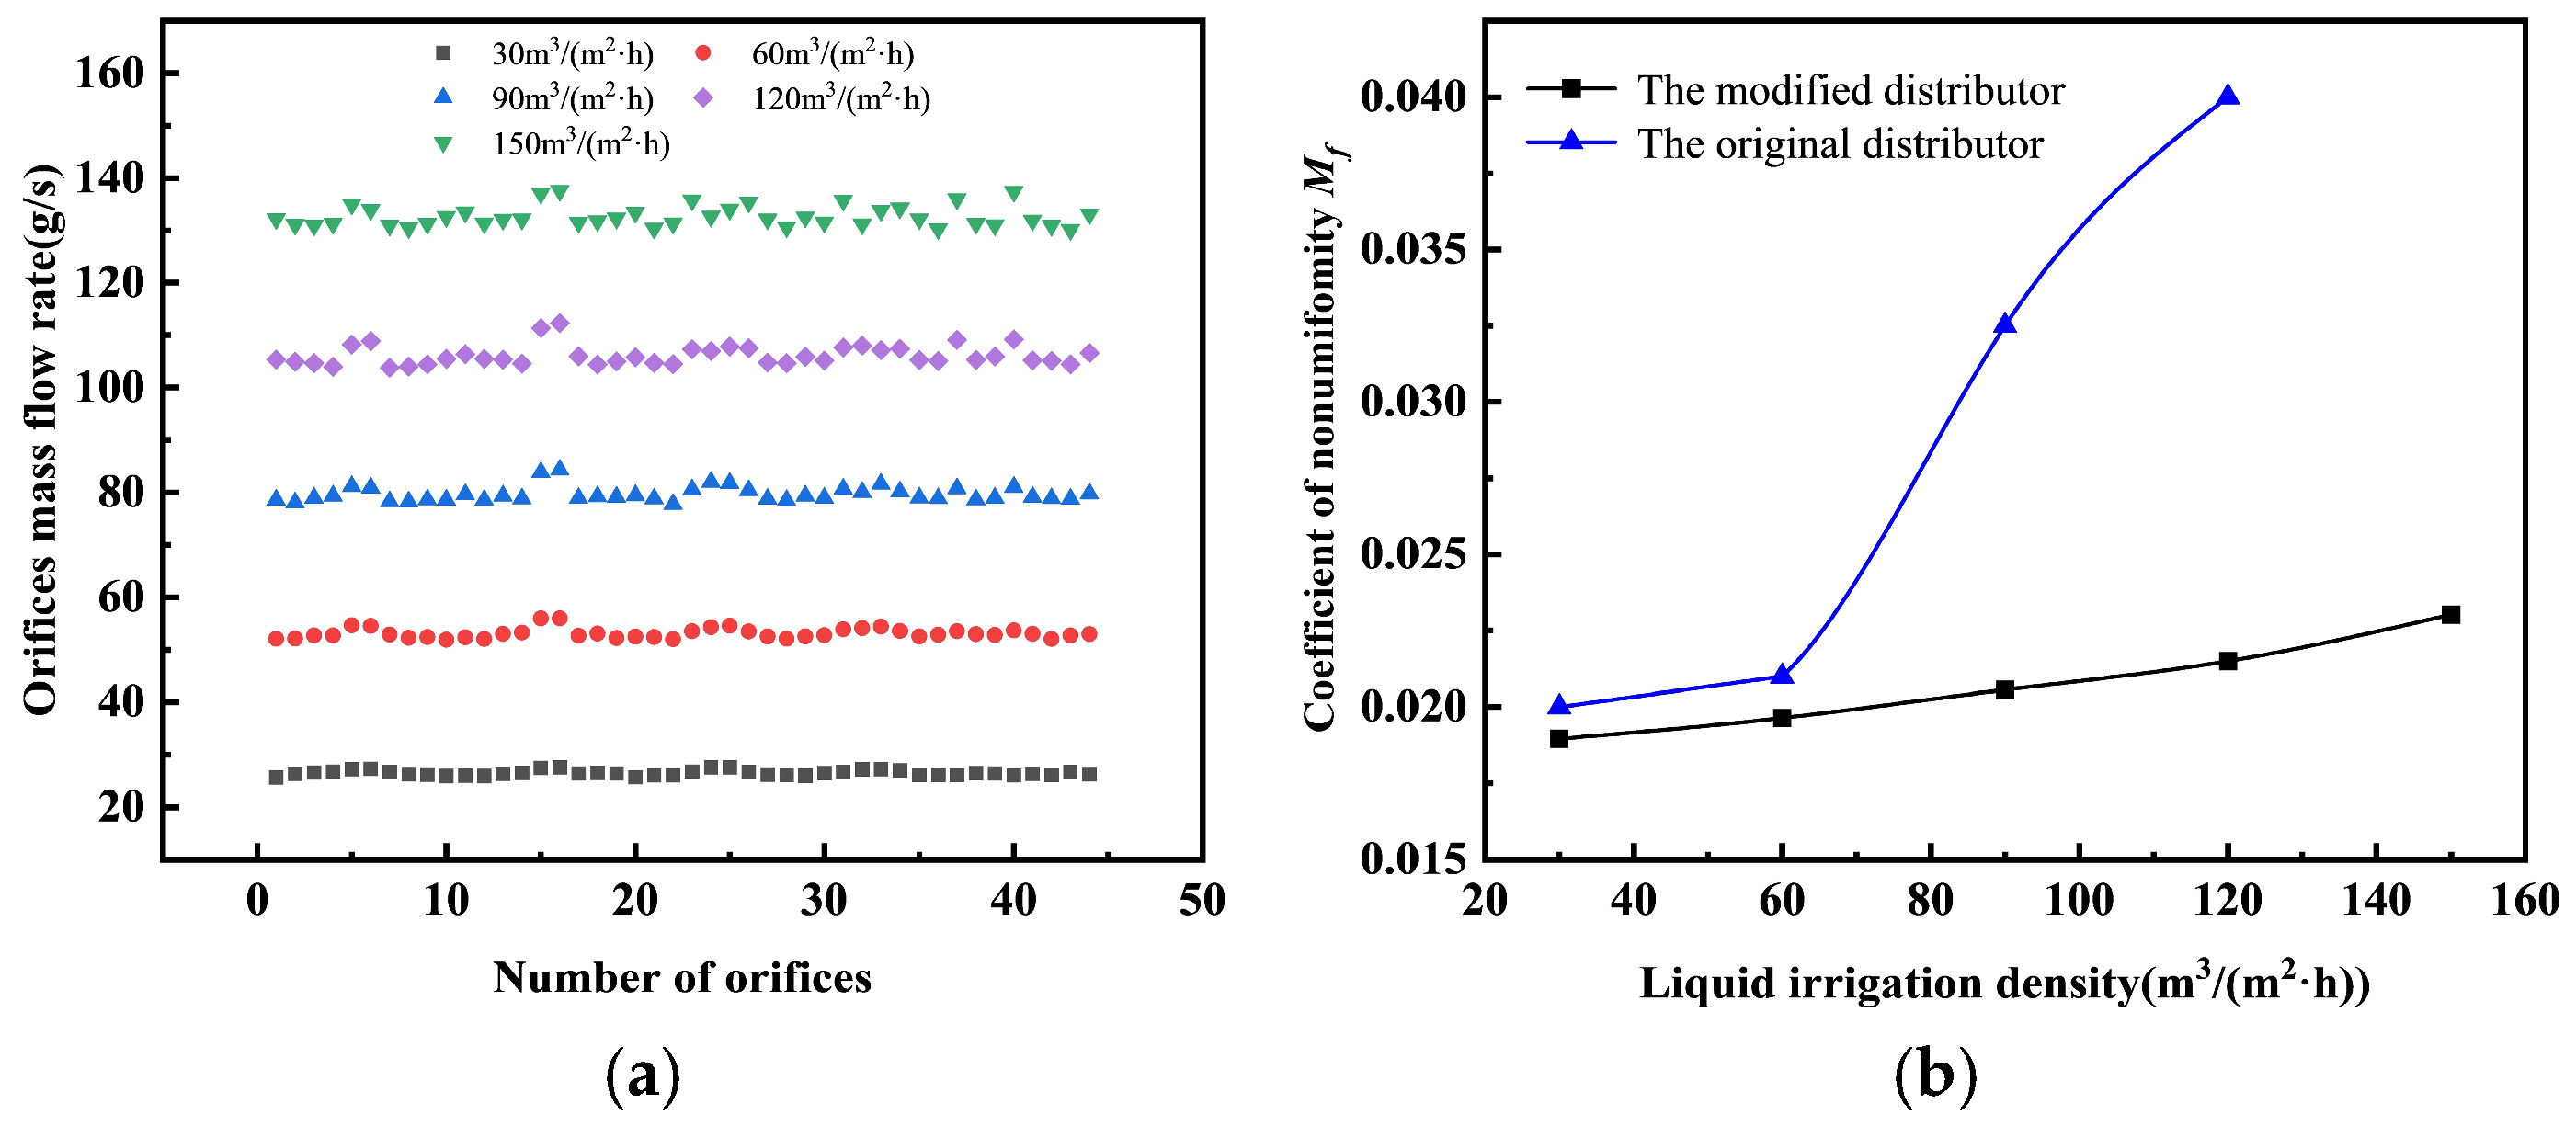
This hydrodynamic instability directly translates into distribution deterioration. As shown in
Figure 19, increasing spray density leads to a widening disparity in orifice flow rates and an almost monotonic increase in the liquid non-uniformity coefficient
Mf, indicating a continuous decline in distribution uniformity. Notably, the rate of increase in
Mf accelerates significantly beyond a spray density of 60 m
3/(m
2·h). This quantitatively confirms the limitations of the original stepped-baffle design under high liquid loads, highlighting that its operational flexibility and distribution performance are insufficient for demanding high-capacity applications.
Overall, the failure of the original distributor under high liquid loads can be attributed to the amplification of surface fluctuations, large-scale vortex generation leading to flow disruption, and the resulting disruption of transverse energy transport. These findings provide a clear direction for the development of novel distributors tailored for high-load conditions, such as through optimized baffle geometries or multi-stage distribution designs.
5.2.2. The Modified Liquid Distributors
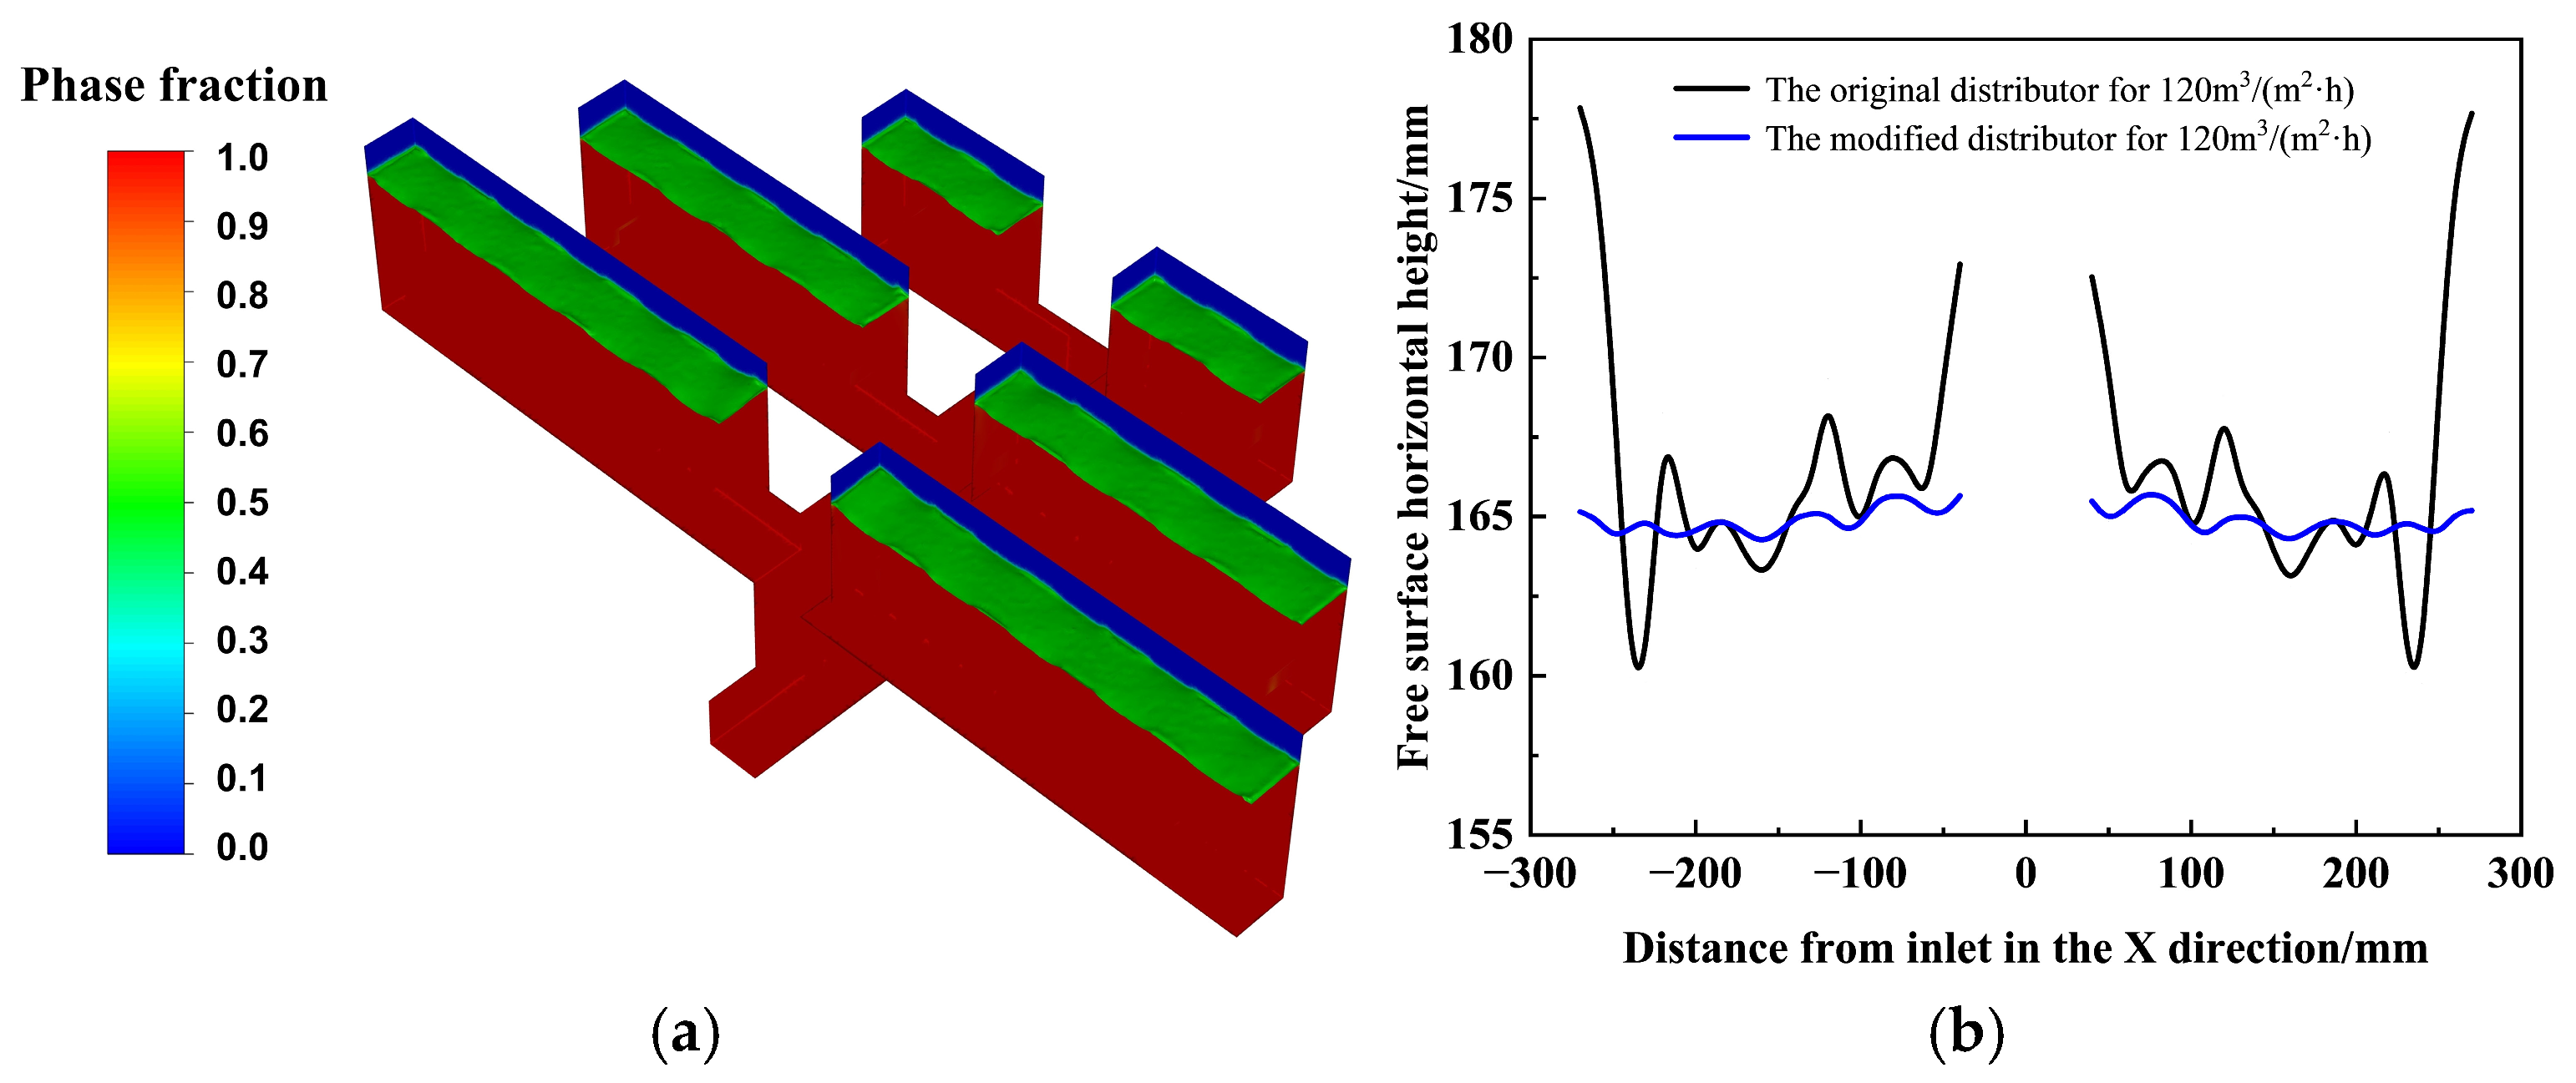
In contrast, the modified distributor incorporating transverse baffles and guide vanes demonstrates significantly enhanced stability under high spray densities. Observation of the phase fraction contour for the novel distributor incorporating the transverse baffle and guide vanes at a liquid spray density of 120 m
3/(m
2·h) (
Figure 20a) reveals minimal surface fluctuation and a highly uniform liquid distribution within the trough. A direct comparison of the gas–liquid interface coordinates between the original and modified distributors at this high spray density is presented in
Figure 20b. Following the modification, the interface coordinates remain remarkably stable, centered around 165 mm, with a significantly reduced amplitude of fluctuation compared to the original design.
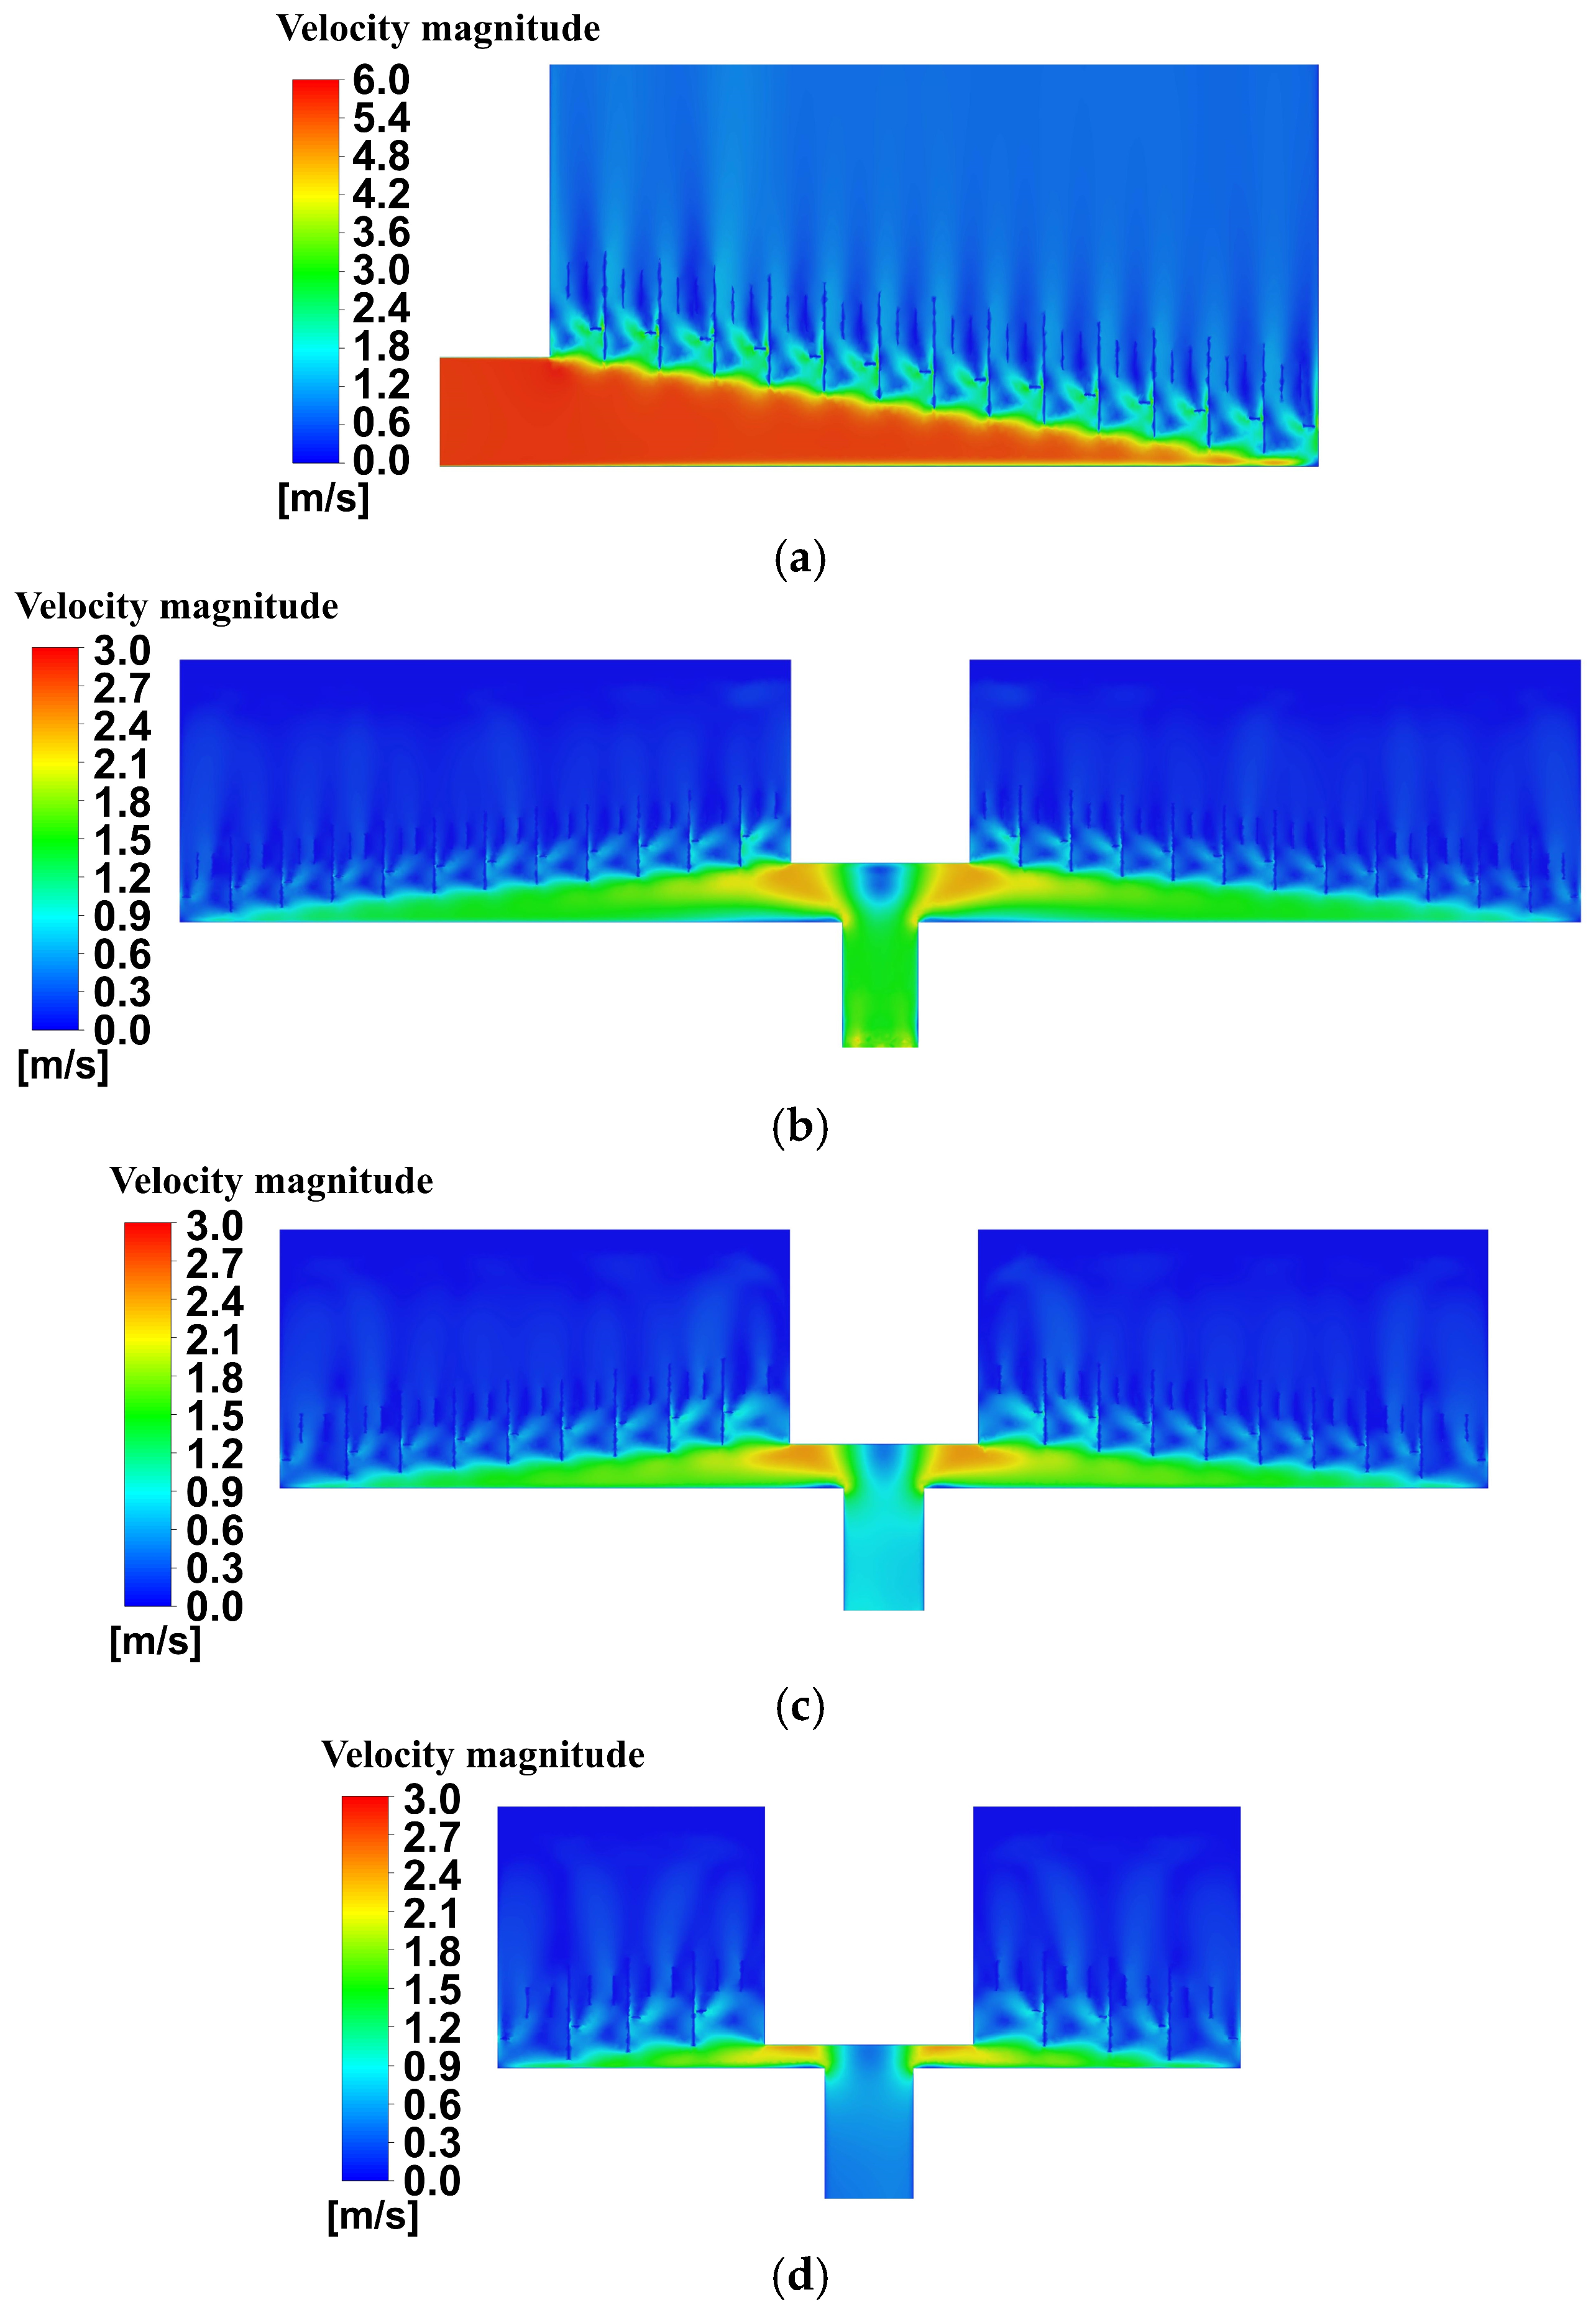
The improved performance originates from the restructuring of the internal flow field. As illustrated in
Figure 21, the velocity distribution within the modified distributor is considerably more uniform than that of the original distributor, with suppressed high-velocity jets and reduced recirculation intensity. This is owing to the resistance–diversion synergy, which maintains a high degree of distribution consistency even under this high liquid load.
Figure 22 directly compares the non-uniformity coefficient
Mf for the original and modified distributor structures across a range of spray densities. At low liquid loads, the
Mf values for both structures are similar. However, once the spray density reaches 60 m
3/(m
2·h) and above, the distribution performance of the modified structure significantly surpasses that of the original structure. The reduction in
Mf is extremely large, indicating a dramatic improvement in distribution uniformity. Furthermore, the novel structure maintains good distribution quality even at an extremely high spray density of 150 m
3/(m
2·h), demonstrating its strong adaptability and robustness under high-load conditions. This performance enhancement is primarily attributed to the added transverse baffle and guide vanes, which effectively ameliorate the internal flow field, suppress the formation of detrimental vortices and biased flow, and consequently substantially broaden the stable operating range of the liquid distributor.
Based on the validated CFD model, the distribution performance of the original and modified distributors was compared over a liquid spray density range of 30~150 m3/(m2·h). This range was used to evaluate the high-load performance of the modified structure within the systematically investigated numerical conditions. At 150 m3/(m2·h), the modified distributor still maintained better outlet-flow uniformity than the original stepped-baffle structure, indicating that the resistance–guidance composite unit effectively improves high-load distribution performance within the investigated range.
5.3. Mechanisms Governing Energy Dissipation and Distribution Performance
For the design of a liquid distributor, achieving uniform distribution inevitably involves a delicate balance between flow homogenization and system energy consumption. From a fluid dynamics perspective, improving distribution uniformity is fundamentally reliant on the momentum redistribution process occurring within the distributor, which is invariably accompanied by the dissipation of mechanical energy. Previous studies [
32] have established a typical non-linear relationship between pressure drop and distribution performance. In the low Reynolds number regime, a moderate increase in pressure drop can significantly enhance distribution uniformity. Conversely, in the high Reynolds number regime, the marginal benefit of further increasing pressure drop on uniformity improvement diminishes markedly, exhibiting classic diminishing returns.
To holistically evaluate distributor performance, this study introduces a dimensionless performance coefficient,
, defined as the product of the distribution uniformity index (
Mf) and the dimensionless pressure drop (Δ
P*):
where
, and
is the characteristic inlet velocity. This coefficient effectively quantifies the trade-off between energy consumption and performance, providing a unified metric for comparing different structural designs.
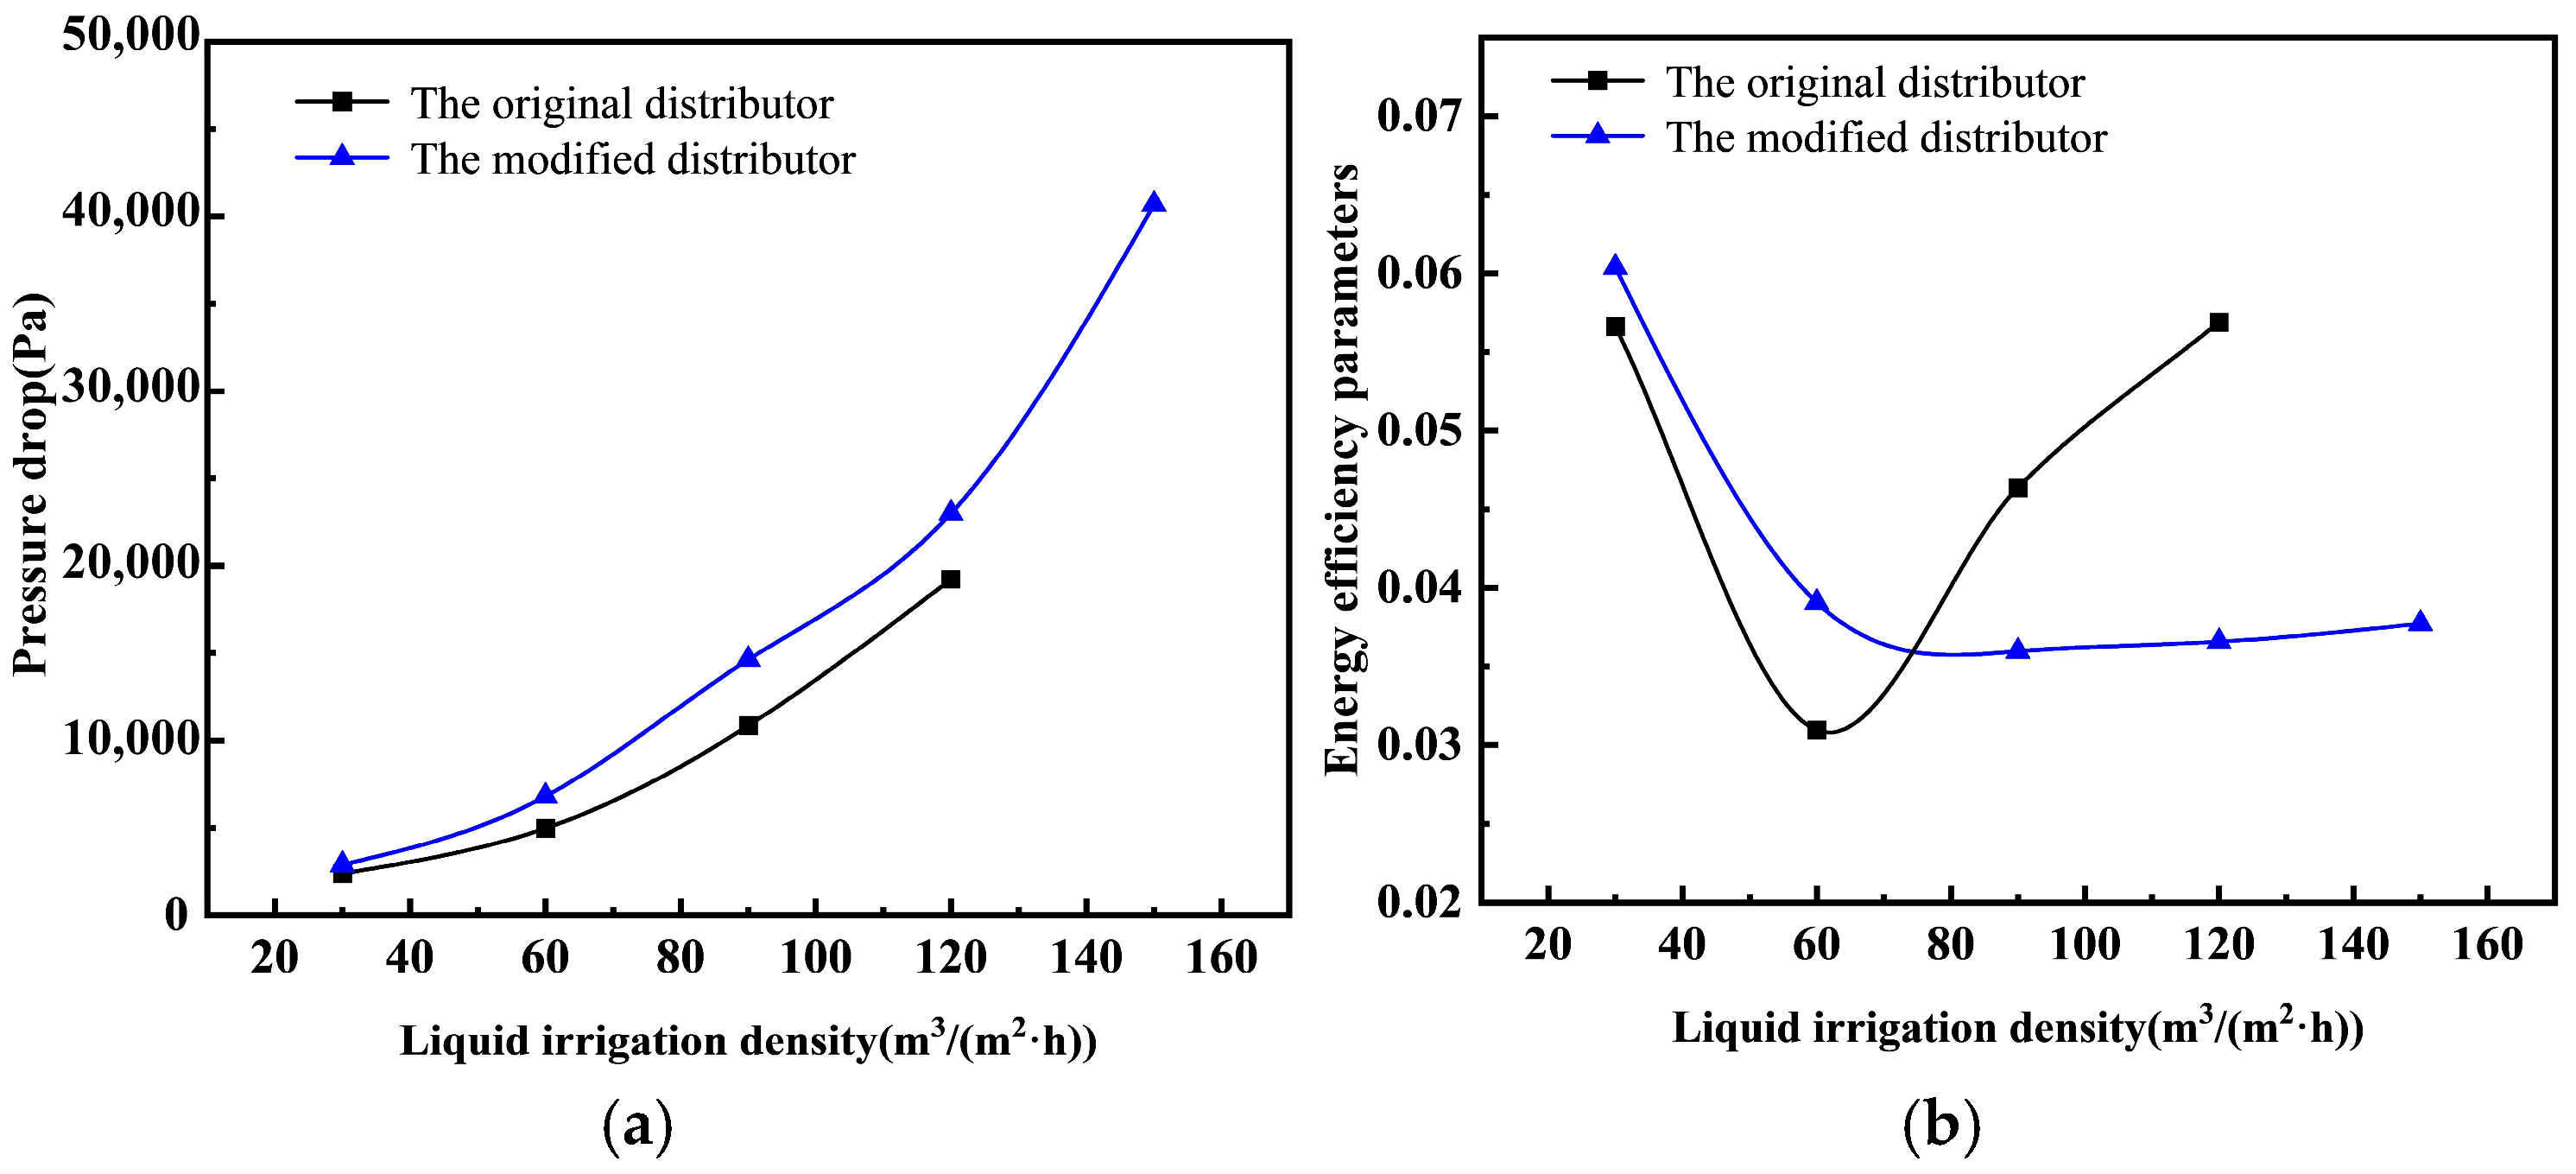
As shown in
Figure 23b, the performance coefficients of the two structures exhibit distinct differences with increasing spray densities. Under low-load conditions (spray density ≤ 60 m
3/(m
2·h)), their values are comparable. However, at spray densities above 90 m
3/(m
2·h), the modified distributor demonstrates a significantly lower performance coefficient than the original one. This indicates that, despite a moderate increase in pressure drop, the improvement in distribution uniformity is substantially greater. This behavior renders the modified distributor particularly suitable for industrial applications under high-load conditions, offering reliable technological support for achieving energy-efficient operation of column equipment.
The structural optimization in this work was conducted through a mechanism-based parametric procedure rather than a black-box mathematical optimization. The optimization objective was to improve outlet-flow uniformity under high liquid spray densities while avoiding excessive pressure drop and maintaining stable discharge from the outlet orifices. Accordingly, the main evaluation criteria included the liquid maldistribution factor Mf, total pressure drop, gas–liquid free-surface stability, outlet discharge regime, and structural feasibility. The optimization route consisted of three steps. First, identify the flow defects of the original stepped-baffle trough through single-trough analysis. Second, introduce the resistance–guidance composite unit to suppress biased flow and large-scale vortices. And third, refine the key structural parameters through controlled-variable numerical experiments.
To further clarify the mechanisms by which structural parameters govern the energy–performance trade-off, a systematic parametric analysis was performed, categorizing their effects in terms of resistance, flow guidance, and discharge control.
The key design variables examined included the transverse baffle opening ratio, number of guide vanes, orifice height, and stepped-baffle height. Using a controlled variable approach, four sets of numerical experiments were designed, covering parameter ranges acceptable in practical engineering.
The opening ratio of the transverse baffle determines the pressure drop magnitude at the secondary throttling point, the effectiveness of static pressure energy supplementation, and the degree of vortex suppression, making it a key structural parameter governing liquid distribution uniformity. In this work, this value is defined as:
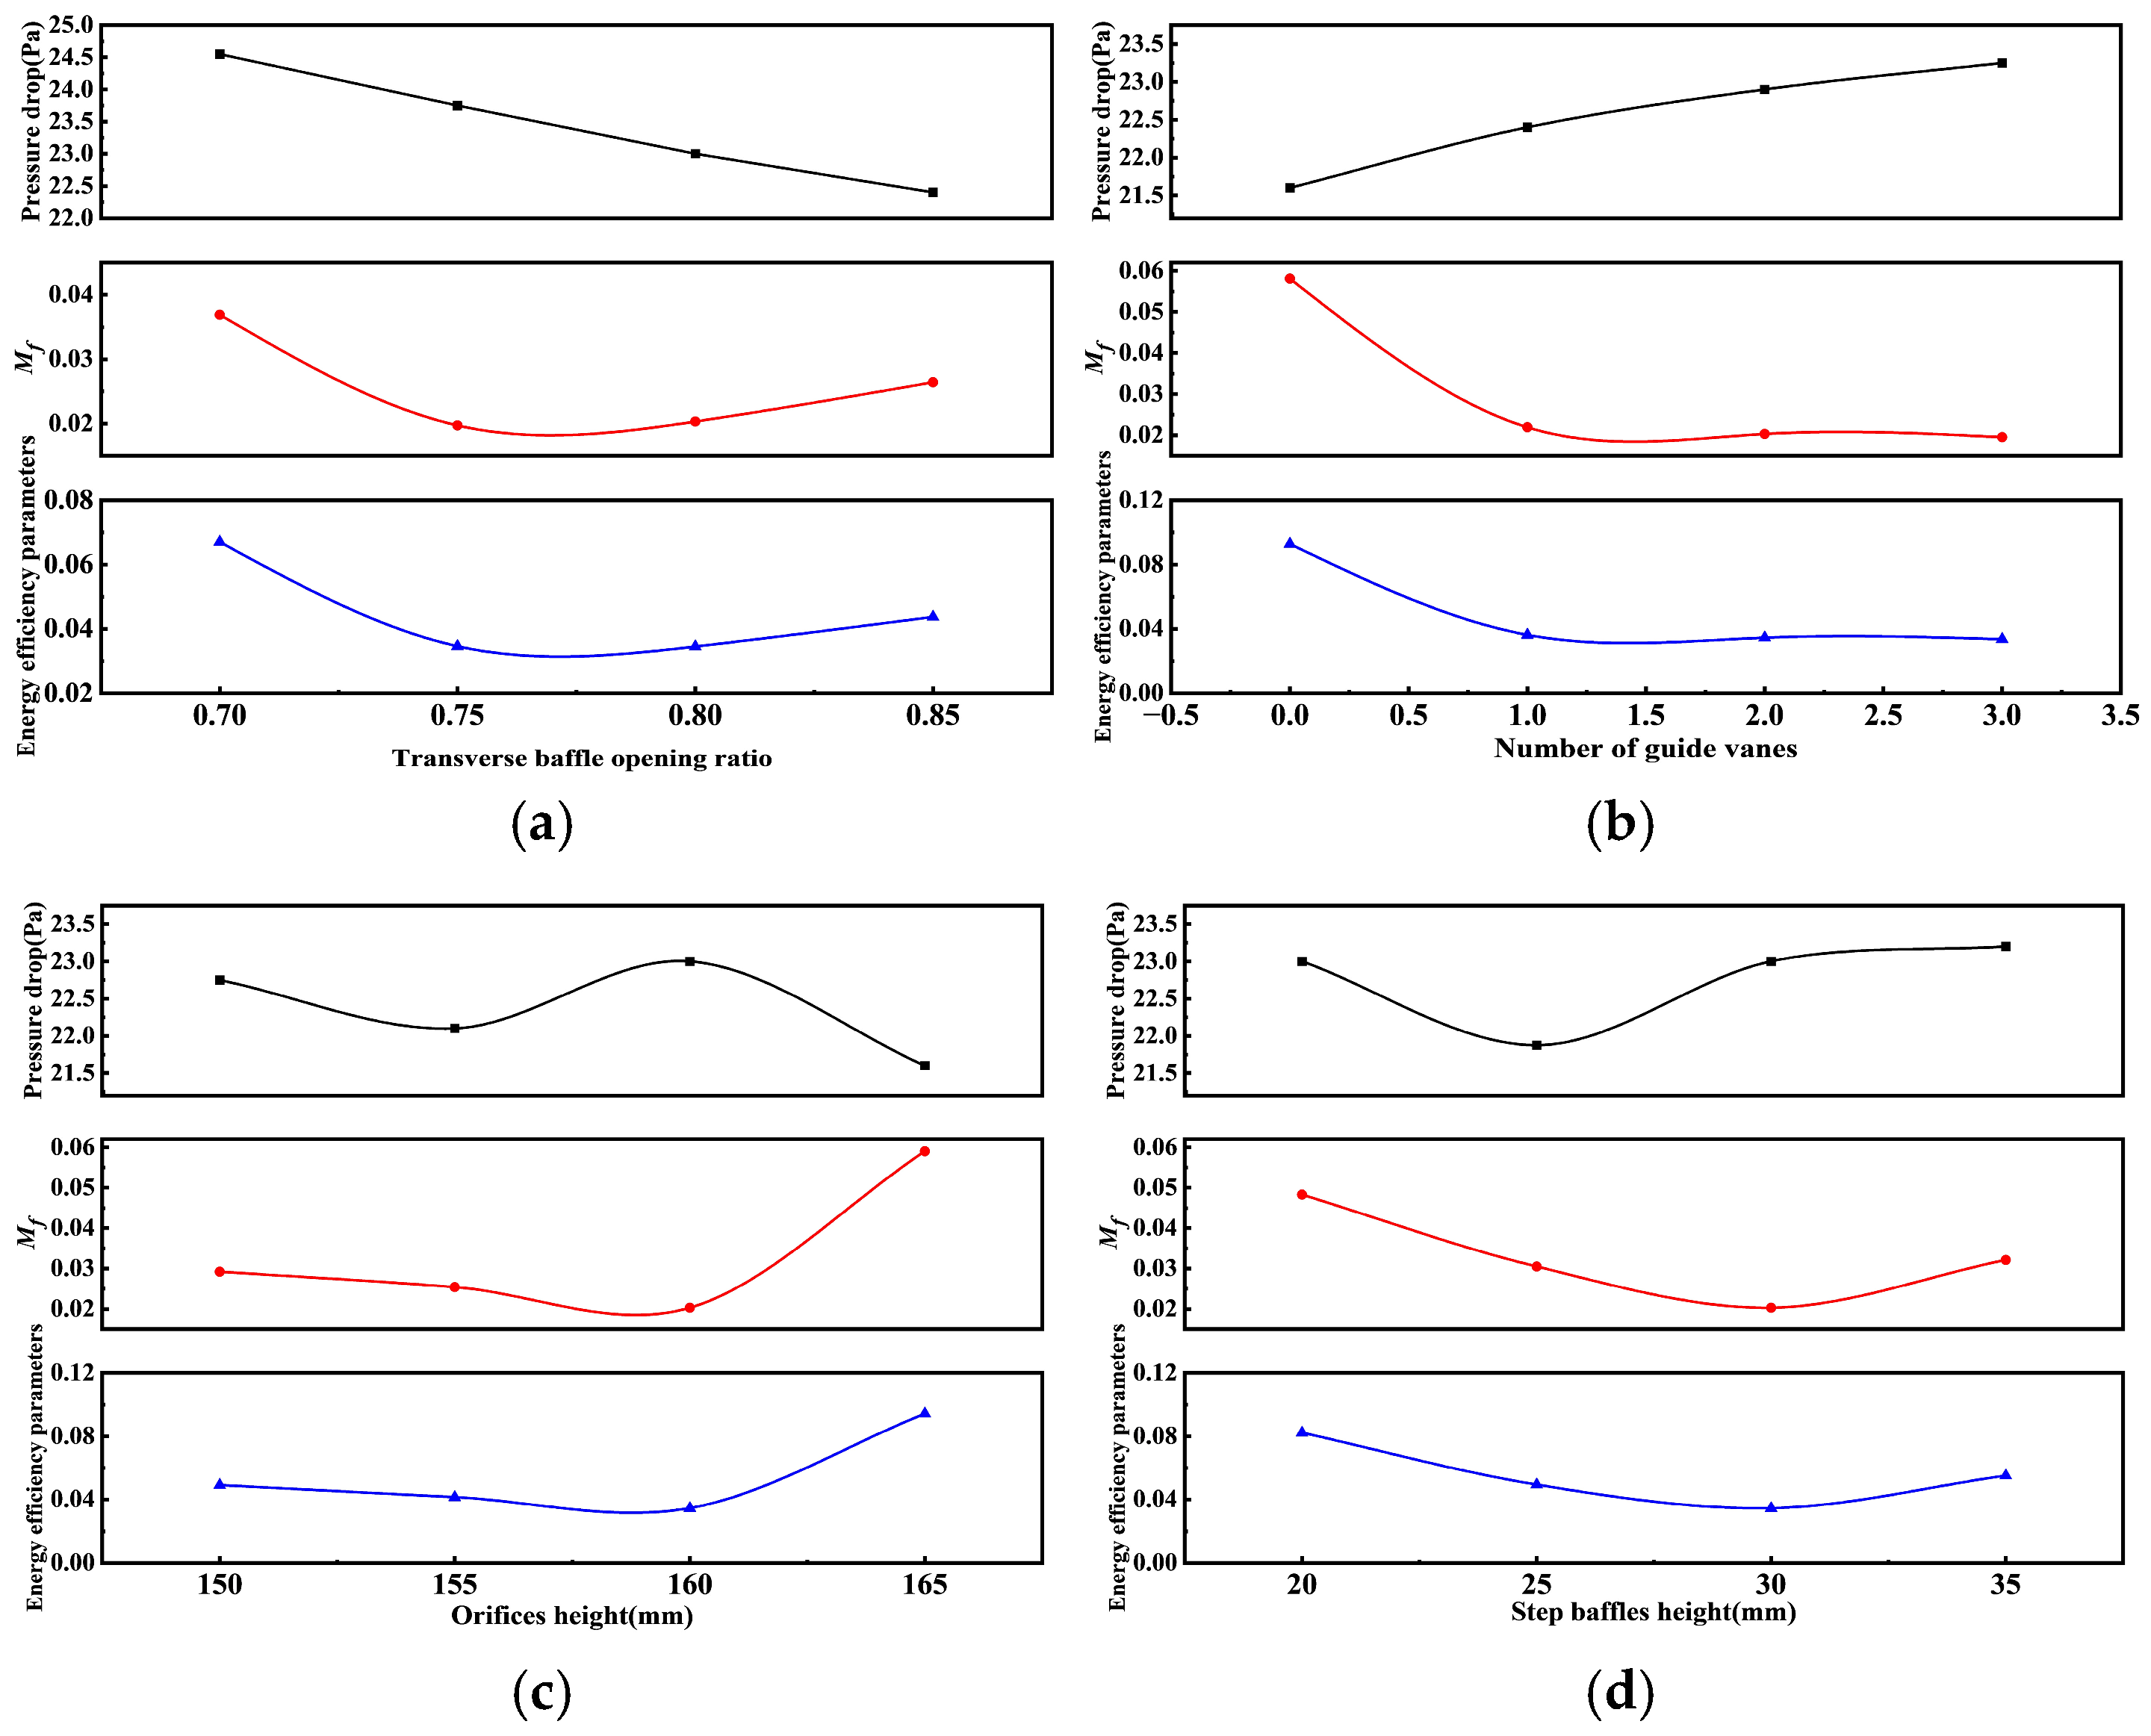
Among all parameters, the transverse baffle opening ratio exhibited the most significant influence on the total system pressure drop. As shown in
Figure 24a, increasing the opening ratio from 0.70 to 0.85 reduced the total pressure drop from 24,550 Pa to 22,400 Pa, a decrease of 9.5%. This trend aligns with local resistance theory: a smaller opening ratio (i.e., reduced flow area) drastically increases the contraction and expansion losses as fluid passes the baffle, leading to a substantial rise in mechanical energy dissipation (pressure drop).
Notably, the relationship between distribution quality (Mf) and the transverse baffle opening ratio is non-monotonic. Increasing the transverse baffle opening ratio from 0.70 to 0.75 decreased the peak pressure drop from 24,550 Pa to 23,750 Pa (a 3.2% reduction), while simultaneously improving Mf from 0.0369 to 0.0197. This indicates that this range of opening ratios achieves a favorable balance between low pressure drop and high uniformity. However, when the transverse baffle opening ratio exceeded 0.80, the peak pressure drop further decreased to 22,400 Pa, but Mf deteriorated to 0.0264. This suggests that excessively reducing resistance weakens the baffle’s ability to reorganize the flow. Consequently, an optimal opening ratio range exists between 0.75 and 0.80 in this study.
The number of guide vanes primarily affects the organization of the flow field rather than the overall resistance. As illustrated in
Figure 24b, increasing the guide vane number from 0 to 3 raised the total pressure drop by only about 7.6%, while
Mf decreased dramatically from 0.0581 to 0.0195, an optimization of over 66%. This confirms that the primary function of guide vanes is to suppress large-scale vortices and stabilize the flow direction, thereby enhancing transverse momentum redistribution efficiency. Although adding guide vanes slightly increases pressure drop, the substantial gain in distribution quality far outweighs this cost, enhancing the overall distributor efficiency.
Variations in orifice height mainly influence the discharge pattern, regime and flow stability. As illustrated in
Figure 24c, when the orifice was positioned above the trough base reference level (orifice height 165 mm), it operated predominantly in a free discharge regime, which is sensitive to liquid level fluctuations within the trough. This configuration yielded the lowest total pressure drop (21,600 Pa) but the poorest distribution quality (
Mf = 0.0590), indicating that the low pressure drop was achieved at the expense of stability and uniformity. Lowering the orifice to or below the reference level (160, 155, 150 mm) transitioned the flow to a submerged discharge regime, resulting in more stable efflux. The reference height (160 mm) achieved the optimal
Mf value (0.0203). This underscores that ensuring stable submerged discharge from the orifices under operational liquid loads is a key prerequisite for achieving good distribution performance.
As depicted in
Figure 24d, varying the stepped baffle height within the range of 25 mm to 35 mm had a relatively small effect on total pressure drop (approximately ±5%) but a significant impact on
Mf. The reference height of 30 mm yielded the best performance. Heights that were too high (35 mm) or too low (20 mm) led to a deterioration in distribution quality, suggesting the existence of an optimal height matched to the trough dimensions and flow velocity for effective initial kinetic energy dissipation.
This parametric study clearly establishes liquid distributor design as a classic multi-objective optimization problem that demands balancing low pressure drop, high distribution uniformity, and structural reliability. The transverse baffle opening ratio is the most critical parameter governing the trade-off between pressure drop and distribution performance, with an optimal balance achieved in the range of 0.75–0.80. Guide vanes act as highly efficient performance enhancers, substantially improving distribution quality at a modest pressure-drop cost, and two to three vanes per channel generally suffice to meet stringent uniformity requirements. For a 600 mm diameter column, the best overall performance was achieved using a single transverse baffle together with two axial guide vanes, as shown in
Figure 25a. When the distributor is scaled to larger sizes, the increased channel dimensions amplify the liquid-phase velocity differences and readily induce adverse flow structures such as recirculation vortices; in such cases, the number of guide vanes can be appropriately increased according to the actual flow-field characteristics to partition the large channels, suppress local vortices, and thereby enhance distribution uniformity. Regarding the transverse baffles, if a single baffle cannot adequately homogenize the trough velocity—leaving significant liquid accumulation and velocity non-uniformity in the downstream region—a second transverse baffle can be introduced at the location of liquid concentration (
Figure 25b) to further dissipate the kinetic energy of the high-velocity liquid and achieve a more effective homogenization of the flow field. Operationally, it is essential to ensure that the orifices maintain a stable submerged outflow and that the number of orifices is matched to the design liquid flow rate; enlarging the orifice openings solely for the purpose of reducing pressure drop should be avoided, as this can compromise distribution stability.
6. Conclusions
At high liquid loads, the performance of the original trough liquid distributors deteriorates markedly as the increased liquid Reynolds number allows inertial forces to overwhelm the transverse energy redistribution driven by static pressure gradients. This induces large-scale recirculating vortices and uneven liquid spreading, ultimately compromising distribution uniformity. To overcome this limitation, this study introduced a synergistic “resistance regulation–flow guidance” mechanism through the strategic addition of a transverse baffle and guide vanes to the original design. The transverse baffle creates a secondary throttling point that supplements static pressure energy and suppresses large-scale recirculation, while the guide vanes direct the flow and mitigate harmful secondary currents. Their combined action facilitates two-stage energy conversion and redistribution, substantially improving liquid distribution uniformity. At its core, this regulatory mechanism achieves a synergy between resistance regulation and optimized static pressure distribution through structured design, effectively reconstructing the liquid momentum transfer pathway to realize the coupled objectives of energy redistribution and vortex structure suppression.
Performance validation demonstrates that, within the experimentally tested liquid spray density range of 30~120 m3/(m2·h), the modified trough distributor agrees well with the numerical predictions and exhibits substantially improved liquid distribution uniformity compared with the original design. At a liquid spray density of 120 m3/(m2·h), the modified distributor maintains an Mf value below 0.025, representing a substantial reduction compared with the original distributor. Based on the validated CFD model, the distribution performance of the modified structure was further evaluated up to 150 m3/(m2·h), where it still maintained better outlet-flow uniformity than the original stepped-baffle distributor. These results indicate that the resistance–guidance composite structure effectively enhances the high-load adaptability of the trough distributor within the investigated operating range.
When scaling down the distributor, the flow channels in the baffle region become narrower, increasing the risk of clogging and degrading liquid distribution quality; when scaling up, the number of guide vanes can be appropriately increased to partition the flow field and suppress large-scale vortices, and if a single transverse baffle is insufficient to dissipate the energy of the incoming liquid, additional baffles should be introduced downstream. Together with the demonstrated high-load performance, these scaling considerations provide both a clear mechanistic basis and a viable technical pathway for the structural design and performance optimization of liquid distributors under high-liquid-load conditions.