Article

Study of the Impact of Combustion Parameters on Cylinder-to-Cylinder Working Uniformity in Oilfield Tail Gas Engines

by
Mengzhen Yuan
,
Juan Tang
*,
Hui Shang
,
Ziyuan Wang
and
Yunping Hu
School of Mechanical and Automotive Engineering (School of Precision Manufacturing), Liaocheng University, Liaocheng 252000, China
*
Author to whom correspondence should be addressed.
Processes 2026, 14(11), 1705; https://doi.org/10.3390/pr14111705
Submission received: 21 April 2026 / Revised: 12 May 2026 / Accepted: 21 May 2026 / Published: 25 May 2026
(This article belongs to the Special Issue Advances in Alternative Fuel Engines and Combustion Technology)

Abstract

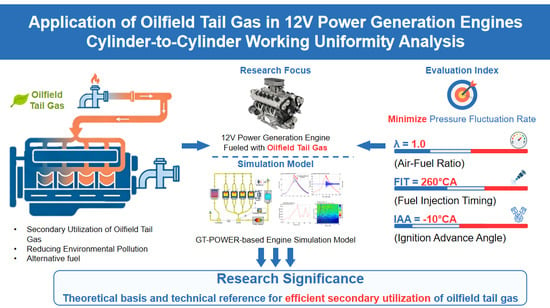
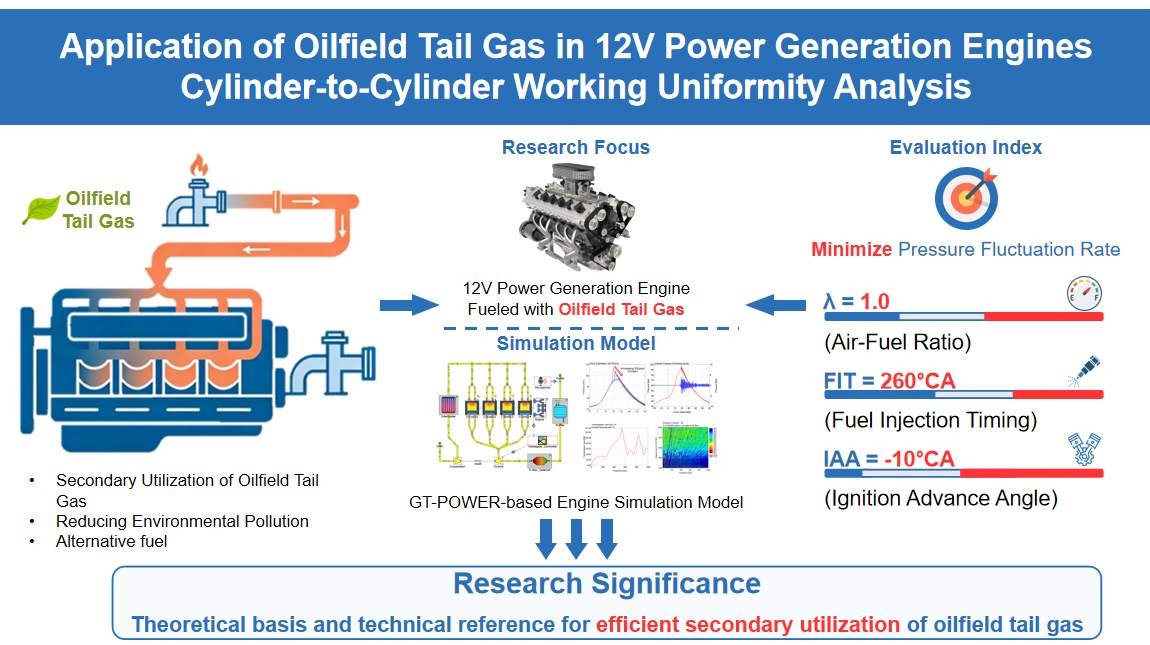
As a promising alternative fuel, oilfield tail gas can reduce environmental pollution while achieving secondary utilization. Studying the cylinder-to-cylinder working uniformity is crucial for evaluating the feasibility of such oilfield tail gas as a source of engine fuel. This study establishes a single-bank six-cylinder model based on GT-POWER using a 12V190 V-type natural gas generator engine with a symmetrical structure. The effects of air–fuel ratio ( λ ), fuel injection timing (FIT), and ignition advance angle (IAA) on cylinder-to-cylinder working uniformity are analyzed through in-cylinder pressure fluctuation rate, using the univariate method. Base values:  λ = 1.0, FIT = 270° crank angle before top dead center (° CA BTDC), IAA = 10° CA BTDC. Tested values:  λ = 1.0, 1.3, 1.6, 2.2; FIT = 260, 270, 280° CA BTDC; and IAA = 10, 8, 6° CA BTDC. Results show that the minimum fluctuation rate occurs at  λ = 1.0, FIT = 260° CA BTDC, IAA = 10° CA BTDC. Deviating from this optimal condition—by increasing  λ , retarding FIT, or advancing IAA—increases fluctuation rate, indicating poorer uniformity. Thus, optimal cylinder-to-cylinder working uniformity is achieved at these specific conditions. This research provides a theoretical basis and technical reference for the efficient secondary utilization of oilfield tail gas in power-generation engines.

Graphical Abstract

1. Introduction

Oilfield tail gas, a by-product of air-assisted oil recovery, contains methane as the dominant combustible species along with a high fraction of inert diluents, and holds dual value for energy recovery and emission reduction when used as an engine fuel. However, in multi-cylinder engines firing this fuel, severe cylinder-to-cylinder working non-uniformity—manifested as large disparities in combustion pressure peaks and indicated mean effective pressure (IMEP) across cylinders—has been observed in pre-experiments of this study on a target 12V190 engine. Such non-uniformity directly degrades thermal efficiency, amplifies cycle-to-cycle variations, and elevates misfire risk, presenting a critical barrier to oilfield tail gas’s reliable application in stationary power generation [1,2,3,4].
Aiming at the cylinder-to-cylinder working uniformity of multi-cylinder gas engines, existing studies have carried out systematic exploration from the perspective of influencing factors, and consistently confirmed that uneven mixture distribution and inter-cylinder charge difference are the core causes of inter-cylinder performance discrepancies [4,5,6,7,8]. Specifically, Jia D et al. [4] confirmed that improving mixture uniformity can effectively reduce the relative standard deviation of in-cylinder peak pressure in a six-cylinder natural gas engine; Kassa M et al. [5] verified the significant effect of intake valve closing timing on IMEP uniformity and fuel distribution in an inline six-cylinder heavy-duty dual-fuel engine; Chen Z et al. [6] revealed the influence law of fuel substitution rate and intake temperature on inter-cylinder non-uniformity; Galindo J et al. [7] clarified the mechanism of EGR dispersion on combustion stability and cylinder-to-cylinder uniformity through CFD simulation; and Coverdill R E et al. [8] investigated the regulation effect of injection strategy on fuel distribution uniformity among multiple cylinders.
In terms of quantitative evaluation and optimization control of cylinder-to-cylinder uniformity, researchers have developed a mature technical system, whose core logic is fully applicable to pre-mixed gas engines [9,10,11,12,13]. For evaluation methods, Wang Y et al. [9] realized real-time monitoring of inter-cylinder non-uniformity based on crankshaft segmented signals; Xie L et al. [10] proposed a control strategy for cylinder-to-cylinder uniformity based on single-cylinder exhaust temperature; and Korczewski Z [11] verified the effectiveness of exhaust temperature measurement in the technical diagnosis of engine cylinders. For optimization strategies, Shin J et al. [12] confirmed that optimizing intake manifold geometry can effectively reduce inter-cylinder charge deviation through CFD simulation; Chen Z et al. [13] revealed the regulation law of fuel injection position on inter-cylinder differences in a dual-fuel engine.
Existing studies have conducted extensive research on the issue of cylinder-to-cylinder uniformity in conventional gaseous fuel engines: in the field of natural gas engines, Felayati F M et al. [14] systematically studied the effect of injection timing on the cylinder-to-cylinder work uniformity of natural gas engines; Wei H et al. [15] systematically investigated the impact of ignition energy on combustion stability, flame development characteristics, and cylinder-to-cylinder/cycle combustion consistency under lean-burn conditions in natural gas engines. In the field of methanol engines, research has revealed the effect of methanol substitution rate on engine performance [16,17]; relevant studies on hydrogen engines [18] have focused on the intrinsic causes of cycle-to-cycle variations in lean-burn hydrogen spark-ignition engines. The aforementioned studies provide a theoretical basis for regulating cylinder-to-cylinder uniformity in gaseous fuel engines, but the related conclusions are all based on conventional gaseous fuels with stable composition and cannot be directly extended to special fuels such as oilfield tail gas.
While cylinder-to-cylinder uniformity has been extensively studied for conventional natural gas with low inert fractions, the high proportion of inert diluents in oilfield tail gas significantly reduces the laminar flame speed [19,20], making the combustion process extremely sensitive to minor inter-cylinder charge disturbances. Under this high-dilution combustion condition, systematic understanding of how key combustion control parameters—relative air–fuel ratio ( λ ), fuel injection timing (FIT), and ignition advance angle (IAA)—influence cylinder-to-cylinder uniformity remains incomplete [21], and the quantitative contribution of each parameter to inter-cylinder differences has not been clearly identified [22,23].
To address this research gap, the present work adopts pure methane as a baseline surrogate fuel representing the predominant combustible component of raw oilfield tail gas. This simplification eliminates the interference of fuel composition fluctuation, thereby isolating the independent influence of the three core parameters on cylinder-to-cylinder uniformity trends. Since all simulation conditions are controlled via the relative air–fuel ratio  λ , the difference in volumetric heating value caused by inert diluents is fully compensated by adjusting the fuel injection quantity to meet the target  λ , and therefore does not alter the relative variation trends of combustion uniformity across cylinders. This surrogate scheme does not affect the validity of the regularity analysis, and is a common practice in system-level simulation studies of similar gas engines. Based on GT-POWER 2016 software, a single-bank six-cylinder one-dimensional simulation model of the target 12V190 engine is established and validated against pre-experimental data [24,25]. This study uses the model to systematically investigate the effects of  λ , FIT, and IAA on cylinder-to-cylinder working uniformity. In order to assess the feasibility of using such oilfield tail gas as engine fuel, this study provides a theoretical basis and technical reference for the efficient secondary utilization of oilfield tail gas in power generation engines.

2. Simulation Model Construction

2.1. Overall Model Construction

This study takes the power generation 12V190 engine as the research subject. The main parameters of the engine are shown in Table 1.
This 12V engine features a strictly symmetrical structure, with two symmetrical sets of cylinders having identical lengths, diameters, and geometrical designs in both the intake and exhaust systems. Therefore, the intake flow distribution and exhaust backpressure of these two cylinder sets are consistent, and there is no systematic deviation between corresponding cylinders. To simplify the simulation process and reduce computational cost, this study adopts a single cylinder bank six-cylinder model. This model fully preserves the geometric characteristics within a cylinder set that lead to differences between cylinders, enabling accurate reproduction of the non-uniform patterns within the cylinder sets of the full engine. The coupling between cylinder sets caused by the shared chamber only produces common-mode effects on the overall performance of the complete engine and does not affect the relative variation trends between cylinders within the cylinder set. The purpose of this study is to investigate the variation of cylinder-to-cylinder working uniformity with operating parameters and to assess the feasibility of such oilfield tail gas as engine fuel, rather than to predict the absolute performance of the engine. Therefore, the trends observed in the single six-cylinder column model can be reliably extended to the complete 12V engine. This symmetry-based single-bank simplification has been validated in prior V-type engine studies [24,25] and does not compromise the assessment of cylinder-to-cylinder working uniformity.
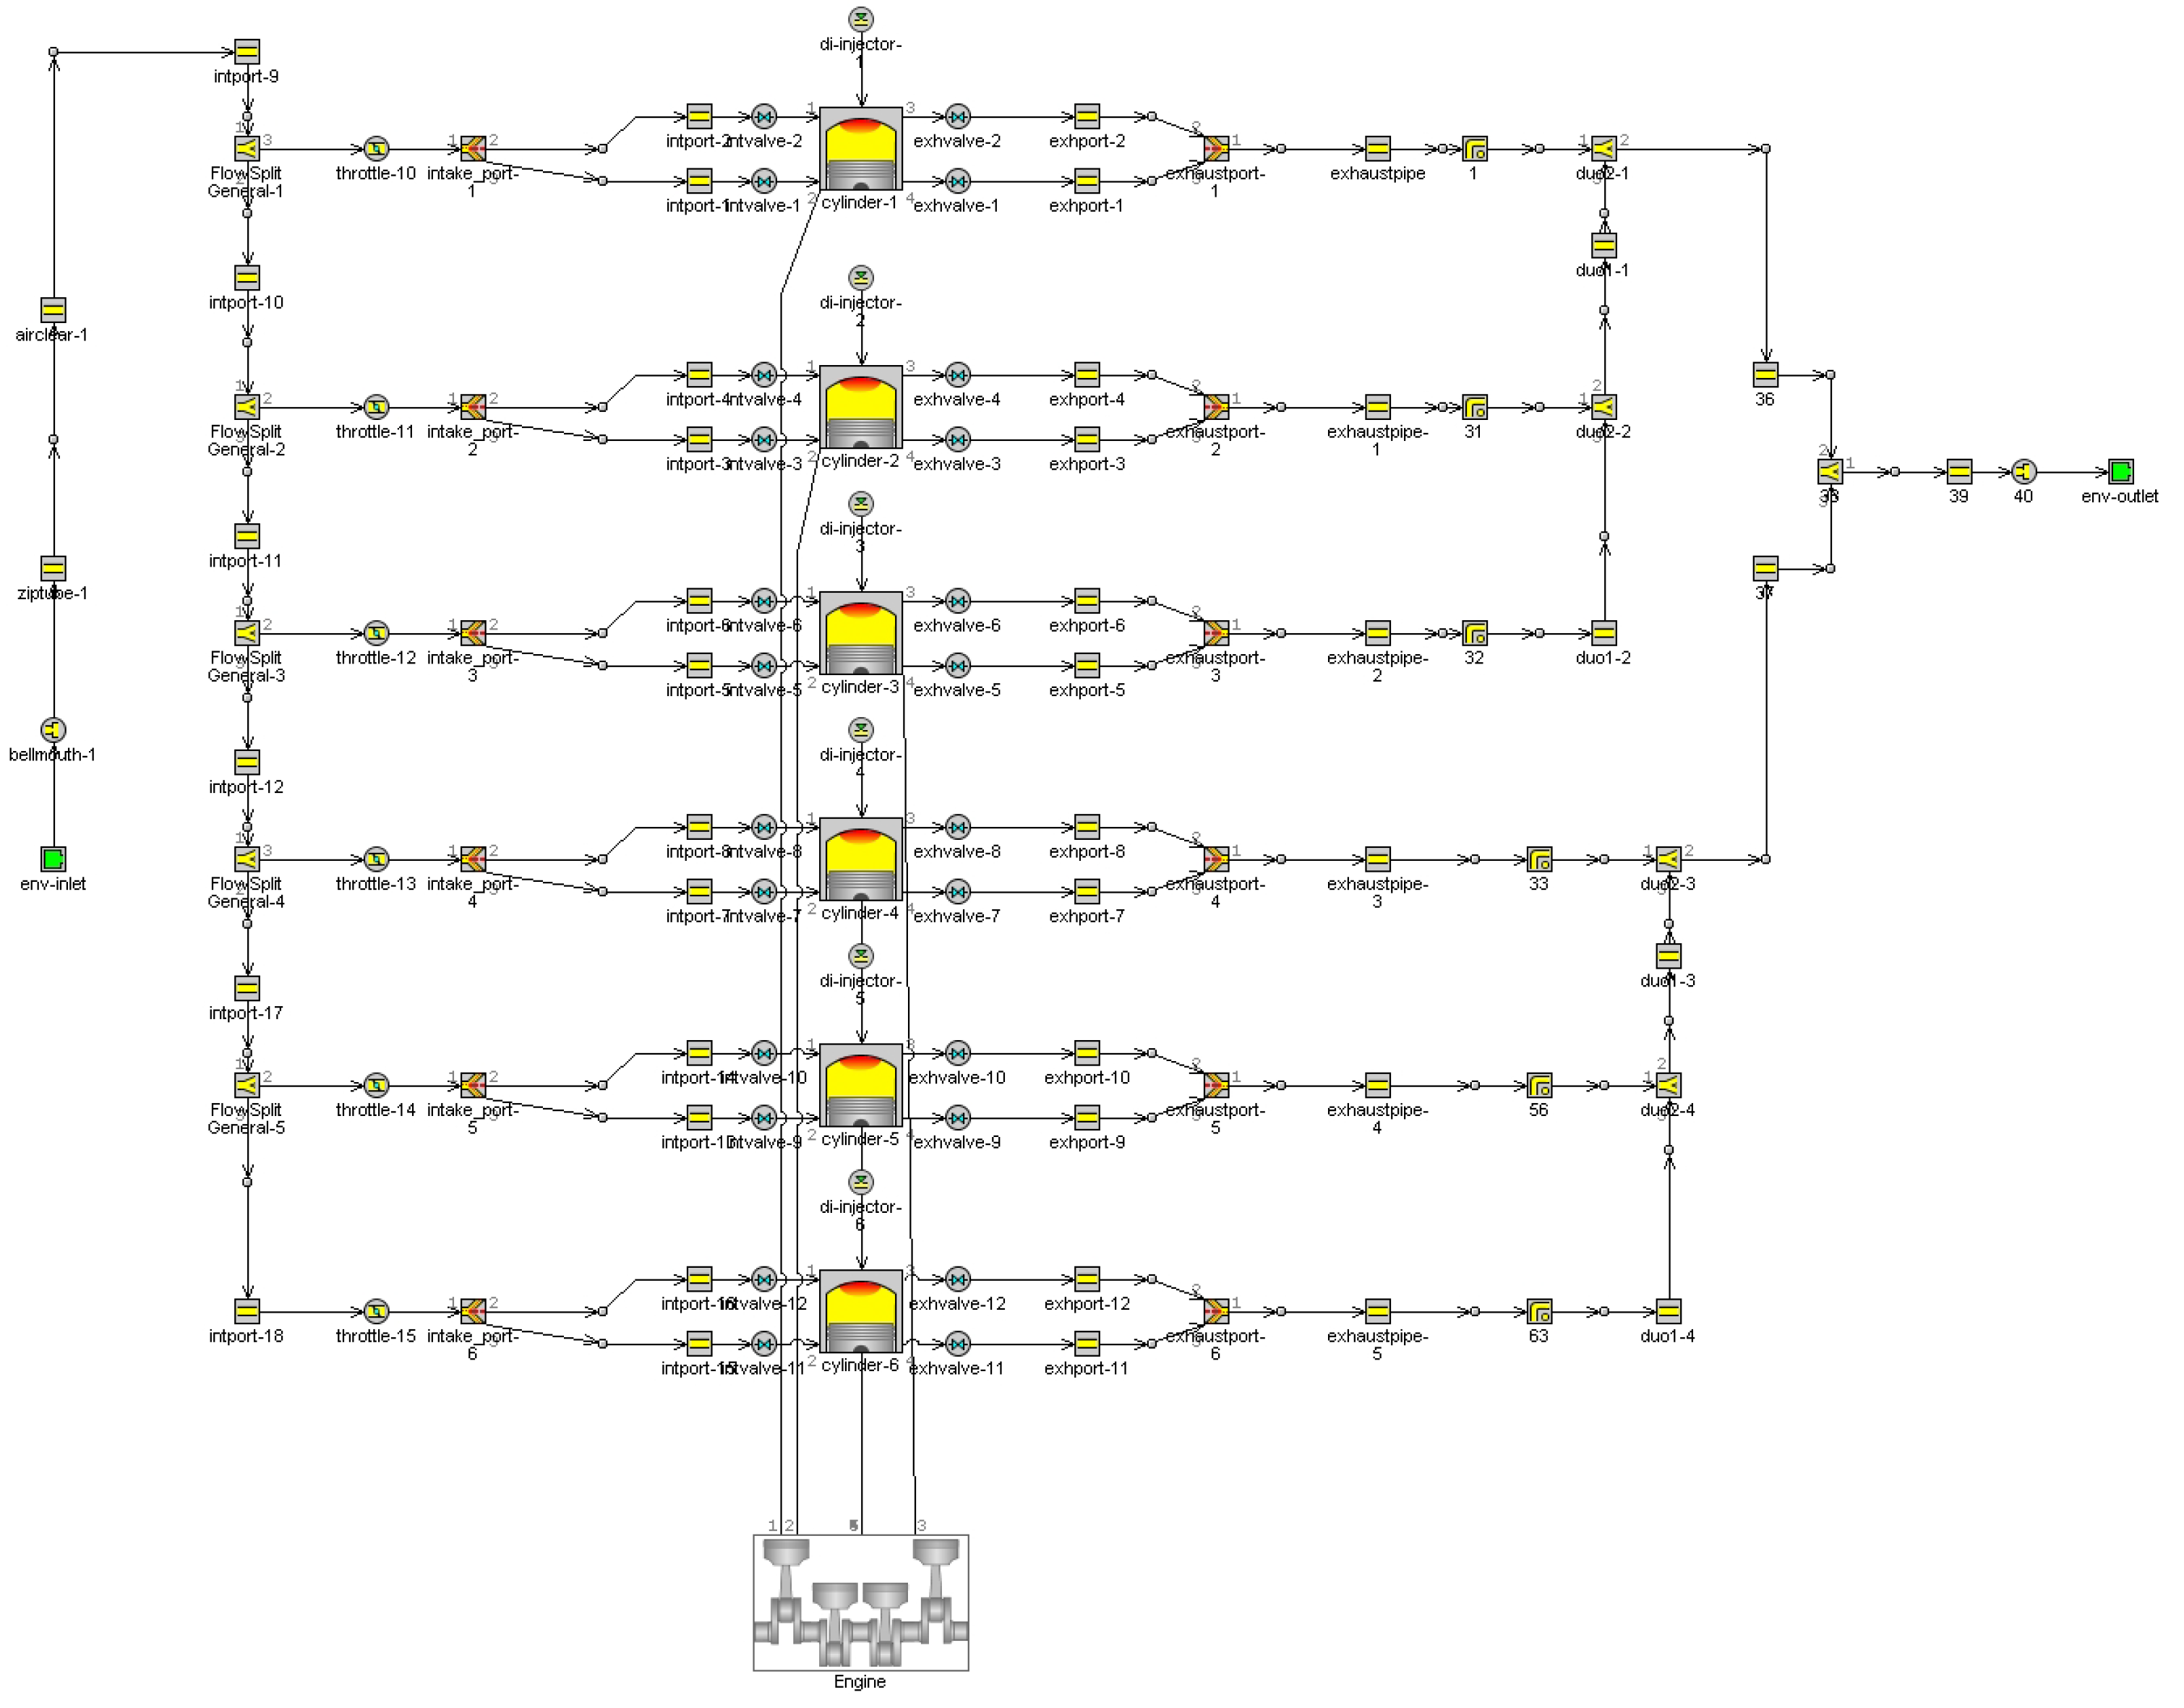
The simulation model of the 6-cylinder engine based on GT-POWER is shown in Figure 1.
The model is mainly composed of several modules including the environment inlet (env-inlet), intake system, intake valves, cylinder module, crankcase module, and exhaust system. The parameters of each module are set as follows.

2.2. Basic Model Parameter Settings

2.2.1. Env-Inlet Parameter Setting

The main parameter of env-inlet model is environment temperature. This study takes the 12V190 engine as the research object. The fuel of this engine is oilfield tail gas, and its main application area is oilfield extraction regions. According to the literature, the normal temperature in oilfield extraction regions ranges from 263.15 K to 303.15 K. Considering that most extraction takes place during the daytime, the ambient temperature is set as 290 K. In addition, the initial wall temperature of all tubular components in the intake and exhaust systems is set to approximately 293.15 K as the initial temperature condition.

2.2.2. Intake System Parameter Settings

The main technical parameters of the engine intake system (intake plenum and intake manifold) are shown in Table 2 and Table 3.

2.2.3. Intake Valve Parameter Settings

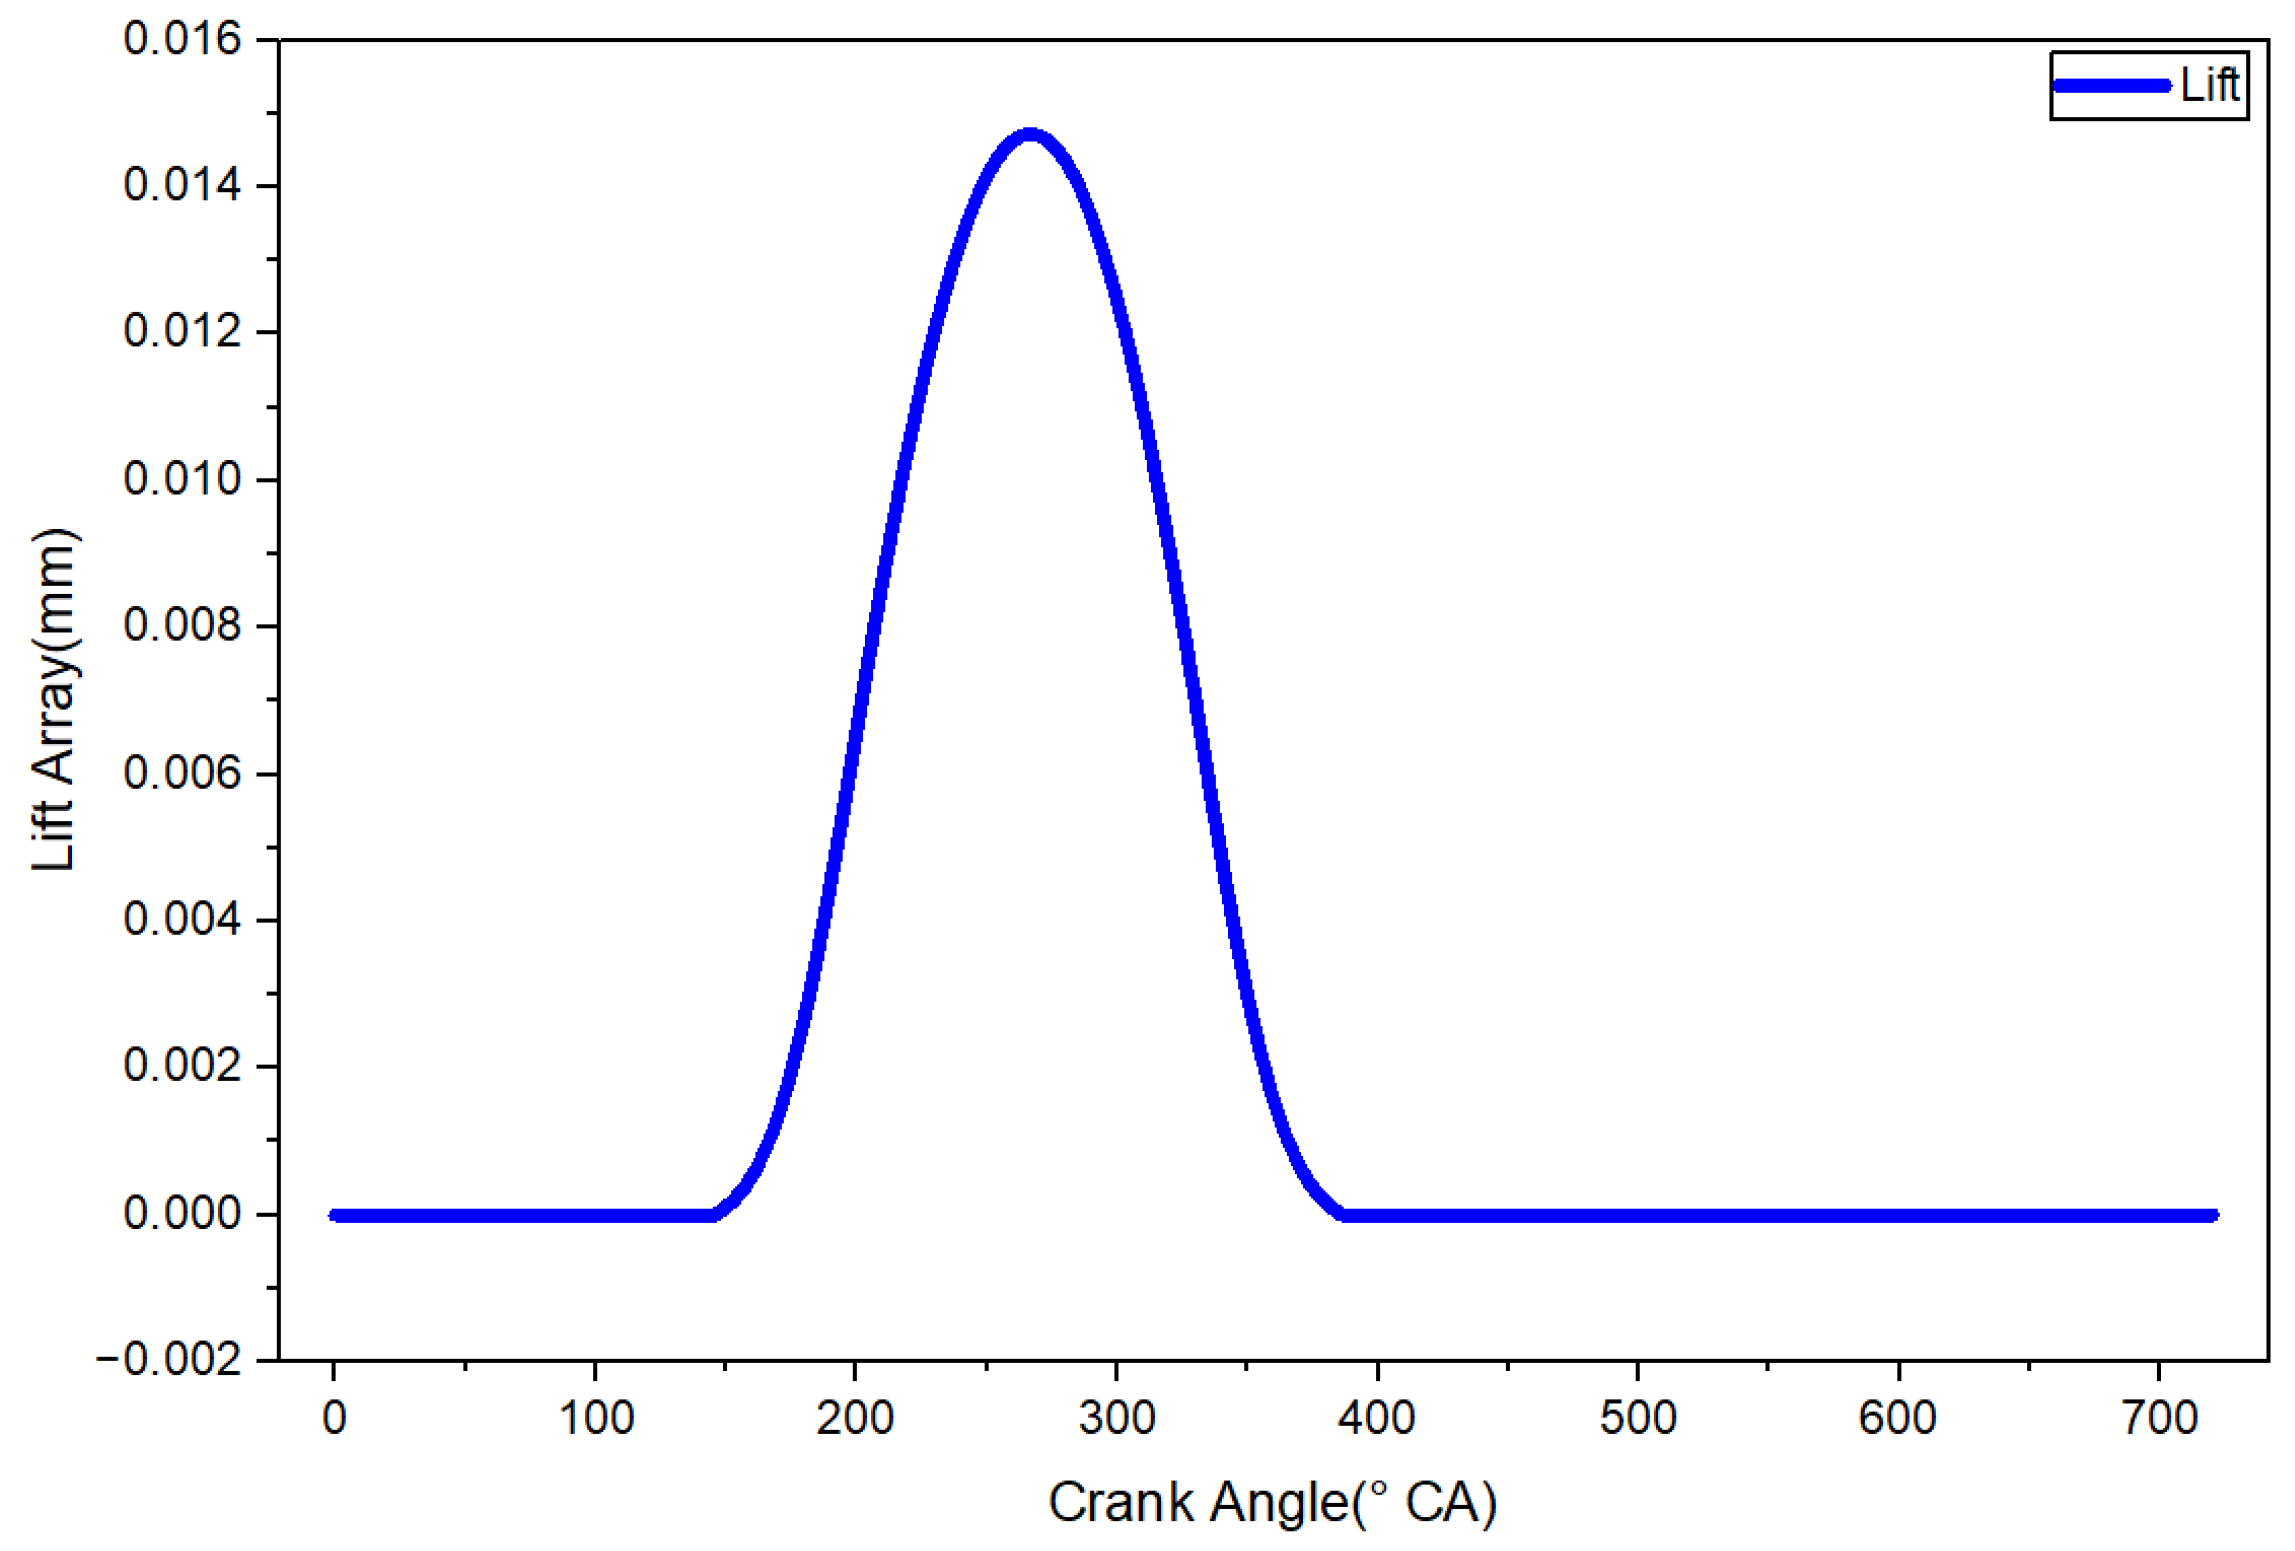
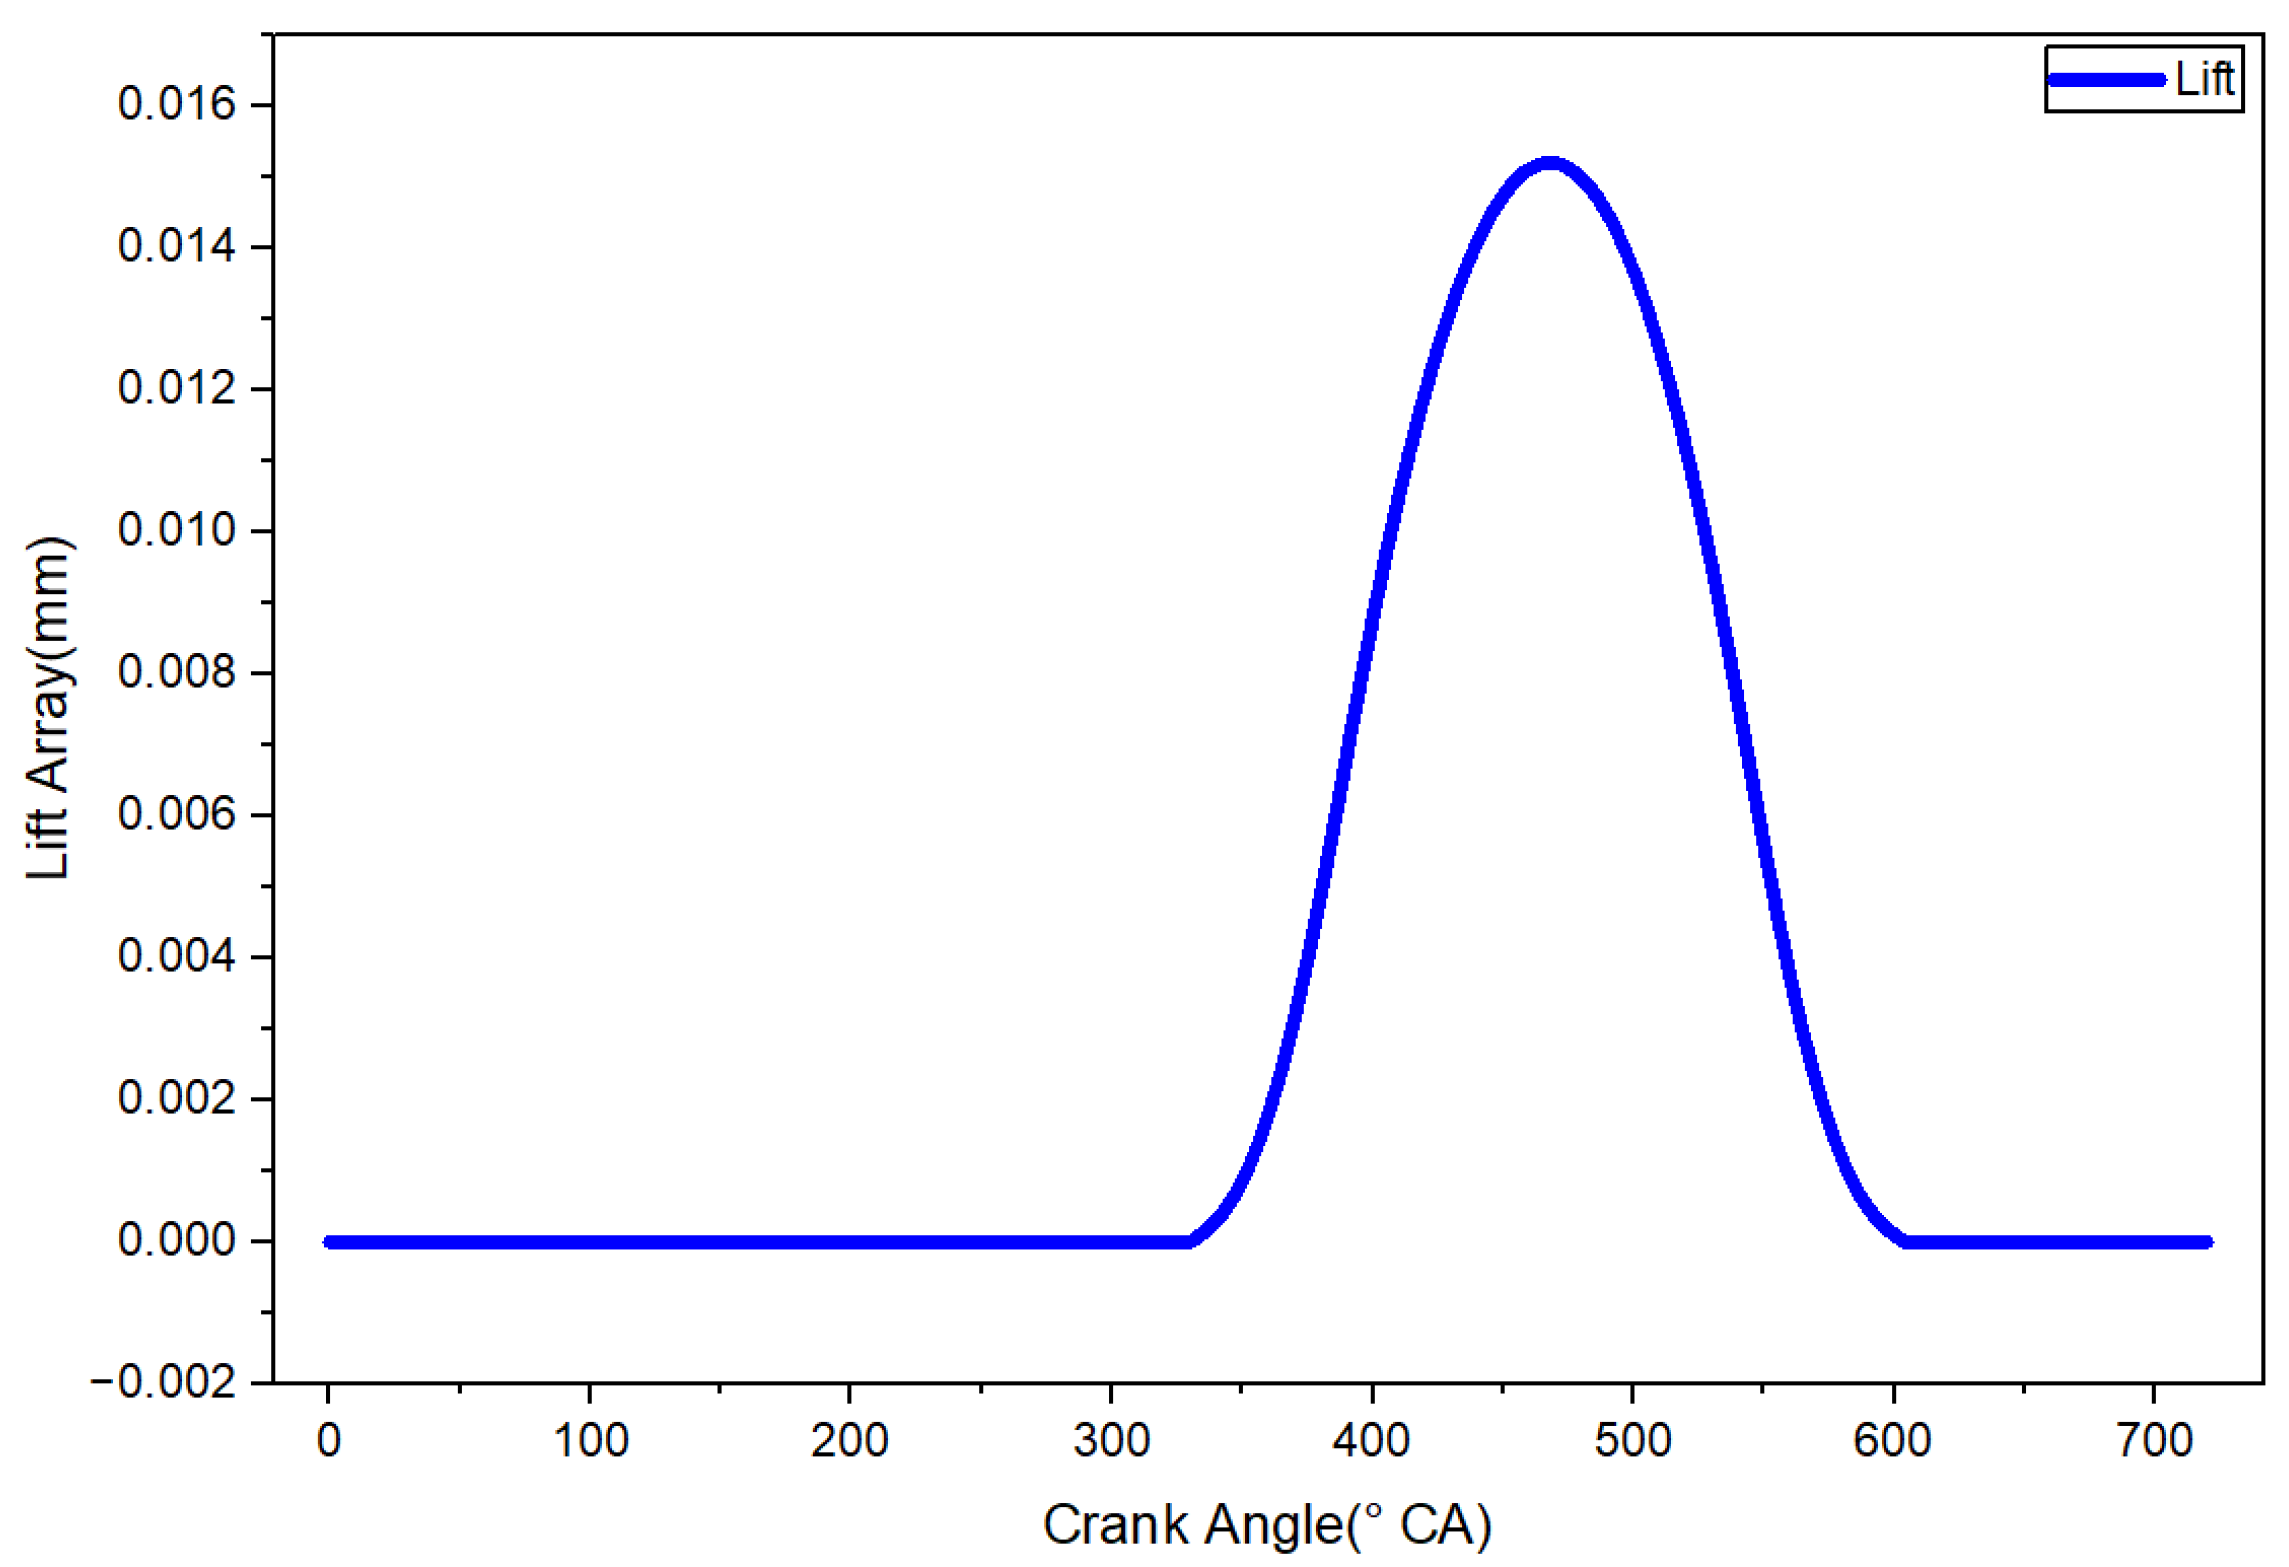
The parameters of the intake valve module include intake valve lift, crankshaft timing angle. In this paper, the position of the combustion top dead center of each cylinder is set as 0° crank angle (° CA). The intake valve lift is set according to the actual lift of the engine. Figure 2 shows the intake valve lift curve. As shown in Figure 2, the intake valve opens at 330° after top dead center (° CA ATDC).

2.2.4. Cylinder Module Parameter Settings

The main parameters in the cylinder module are set as shown in Table 4.

2.2.5. Crankcase Parameter Settings

In the crankcase, the Engine Type is set to four-stroke; the firing order of the cylinders is set to 1-5-3-6-2-4. Engine Speed, Cylinder Geometry Object stroke settings, connecting rod length settings, and compression ratio settings are set as shown in Table 1.

2.2.6. Exhaust Valve Parameter Settings

The parameters of the exhaust valve module include exhaust valve lift, crankshaft timing angle, etc. The exhaust valve lift curve is shown in Figure 3. Each cylinder has its own exhaust timing set at 142° CA ATDC.

2.3. Simulation Condition Parameter Settings

To study the effects of different parameters, including the  λ , FIT, and IAA, on the cylinder-to-cylinder working uniformity of oilfield tail gas engines, the simulation condition parameters are set as follows.
Figure 3. Exhaust valve lift curve.
Processes 14 01705 g003

2.3.1. Engine Air–Fuel Ratio Setting

This study uses oilfield tail gas, a typical multi-component low-calorific-value gas fuel. Its main combustible component is methane (volume fraction 15–20%), accompanied by a small amount of alkanes, non-combustible inert components (nitrogen and carbon dioxide, total volume fraction 70–75%) and trace oxygen. The key combustion parameters of the fuel are as follows: the lower volumetric heating value is 12 MJ/m3; at 20° CA, and the stoichiometric  λ of its combustible components is approximately 16.46.
To avoid calculation uncertainty caused by complex multi-component chemical kinetics and focus on the analysis of cylinder-to-cylinder working uniformity, pure methane (stoichiometric AFR = 17.2) is used as the surrogate fuel in the established GT-POWER numerical model. The heating value difference between the actual tail gas and pure methane is automatically compensated by the closed-loop control of the relative  λ , which will not affect the relative variation law of cylinder-to-cylinder combustion uniformity.
Under the stoichiometric condition ( λ = 1.0), the single-stroke fuel injection quantity is set to 129 mg. Combined with the lean combustion demand of large-bore gas engines and the lean combustion limit of methane ( λ 2.2 ), four typical operating conditions are set with  λ of 1.0, 1.3, 1.6 and 2.2, and the corresponding single-stroke injection masses are 129 mg, 100 mg, 80 mg and 60 mg, respectively.

2.3.2. Fuel Injection Timing Setting

FIT, as a key parameter in internal combustion engine combustion control, directly affects the engine’s power performance, fuel economy, and emission characteristics. For the 12-cylinder generator engine used in this study, the default fuel injection timing is 270° CA ±30° CA BTDC. Using 270° CA BTDC as the reference injection timing, two comparative operating conditions were set at 260° CA BTDC and 280° CA BTDC, respectively.
For comparative analysis, the simulation results under standard operating conditions are used as a reference. The parameter settings for the standard operating conditions are shown in Table 5.

2.3.3. Ignition Advance Angle Setting

IAA is a key parameter in the combustion control of internal combustion engines. By changing the ignition timing value, the influence of the ignition advance angle on the combustion process can be analyzed. Taking 10° CA before the top dead center of compression as the reference value, the ignition advance angles are set to 8° CA BTDC and 6° CA BTDC respectively for a comparative study.
Table 5. Standard operating conditions.
Operating ConditionsParameter ValueUnit
Engine speed1000r/min
Injection mass129mg
Injection timing270° CA
Absolute pressure1bar
Temperature290K
Discretization length30mm
The parameter sweep range in this study was selected strictly in accordance with the stable operating boundary of the 12V190 oilfield tail gas engine. Owing to the inherently fluctuating composition of the fuel, exceeding this range would induce abnormal combustion phenomena—including misfire, partial burn, and knock—that are incompatible with normal engine operation. The parameter ranges adopted in this study therefore represent the practical feasible operating window for this specific fuel, within which the engine can operate reliably and the cylinder-to-cylinder working uniformity trends can be meaningfully evaluated.

2.3.4. Governing Equations Setting

This simulation is based on the one-dimensional unsteady compressible flow equations, consisting of the continuity, momentum, and energy conservation equations, closed by the ideal gas equation of state. Pipe friction and wall heat transfer are treated with the standard in-pipe turbulent flow correlations provided by the software.
  • Continuity Equation
ρ t + ( ρ u A ) x = 0
Momentum Equation
( ρ u ) t + ( ρ u 2 + p ) x + f ρ u | u | 2 D = 0
Energy Conservation Equation
( ρ e ) t + u ( ρ e + p ) x + 4 h D ( T T w ) = 0
Ideal Gas Equation of State
p = ρ R T
where  ρ is the density, u is the velocity, p is the pressure, A is the cross-sectional area, f is the friction factor, D is the pipe diameter, e is the specific total energy, h is the heat transfer coefficient, T is the fluid temperature, and  T W is the wall temperature. The pipe friction factor f is determined from an empirical correlation for turbulent pipe flow, such as the Colebrook formula, and the heat transfer coefficient is obtained from an analogous correlation.

2.3.5. Combustion Model Setting

The EngCylCombProfile model in GT-POWER was used. A standardized heat release rate curve (rate type) can be directly imported, and this curve represents the fraction of mass burned as a function of crank angle. This method has been validated in previous studies. For example, Liu et al. [26] used the same EngCylCombProfile model to simulate engine exhaust noise: they first calculated the heat release rate based on the measured cylinder pressure, and then imported it into the model; after calibration, the deviation of the simulation results from experimental data was controlled within 5%, fully confirming the engineering reliability of this method.

2.3.6. Turbulence Model Setting

In GT-POWER software, in-cylinder turbulence is handled by the standard flow model. The initial turbulence intensity, integral length scale, swirl ratio, and tumble ratio are set to default values, and the subsequent evolution of turbulence is calculated using a built-in semi-empirical model. The combustion rate is predetermined by the imported heat release curve, eliminating the need to use a two-equation turbulence model to simulate the interaction between turbulence and flame in real-time. The built-in semi-empirical model can accurately capture the process of turbulence evolution and its impact on in-cylinder flow and heat transfer. The built-in semi-empirical model still accounts for turbulence evolution and its effect on in-cylinder flow and heat transfer. This simplification is common in system-level simulations driven by experimental burn rates [26].

3. Model Validation

3.1. Experimental Results

This paper conducted an experimental study on the 12V190 engine with oilfield tail gas as fuel. To systematically evaluate the cylinder-to-cylinder working uniformity, under each test condition, after the engine has reached a stable operation, the in-cylinder pressure signals of all six cylinders were continuously collected synchronously using a crankshaft angle encoder. For each condition, 30 consecutive cycles were recorded. Based on these 30-cycle data, the average pressure curve, IMEP, and peak pressure for each cylinder were calculated. All subsequent figures and charts in this section are based on this unified collection and processing procedure.
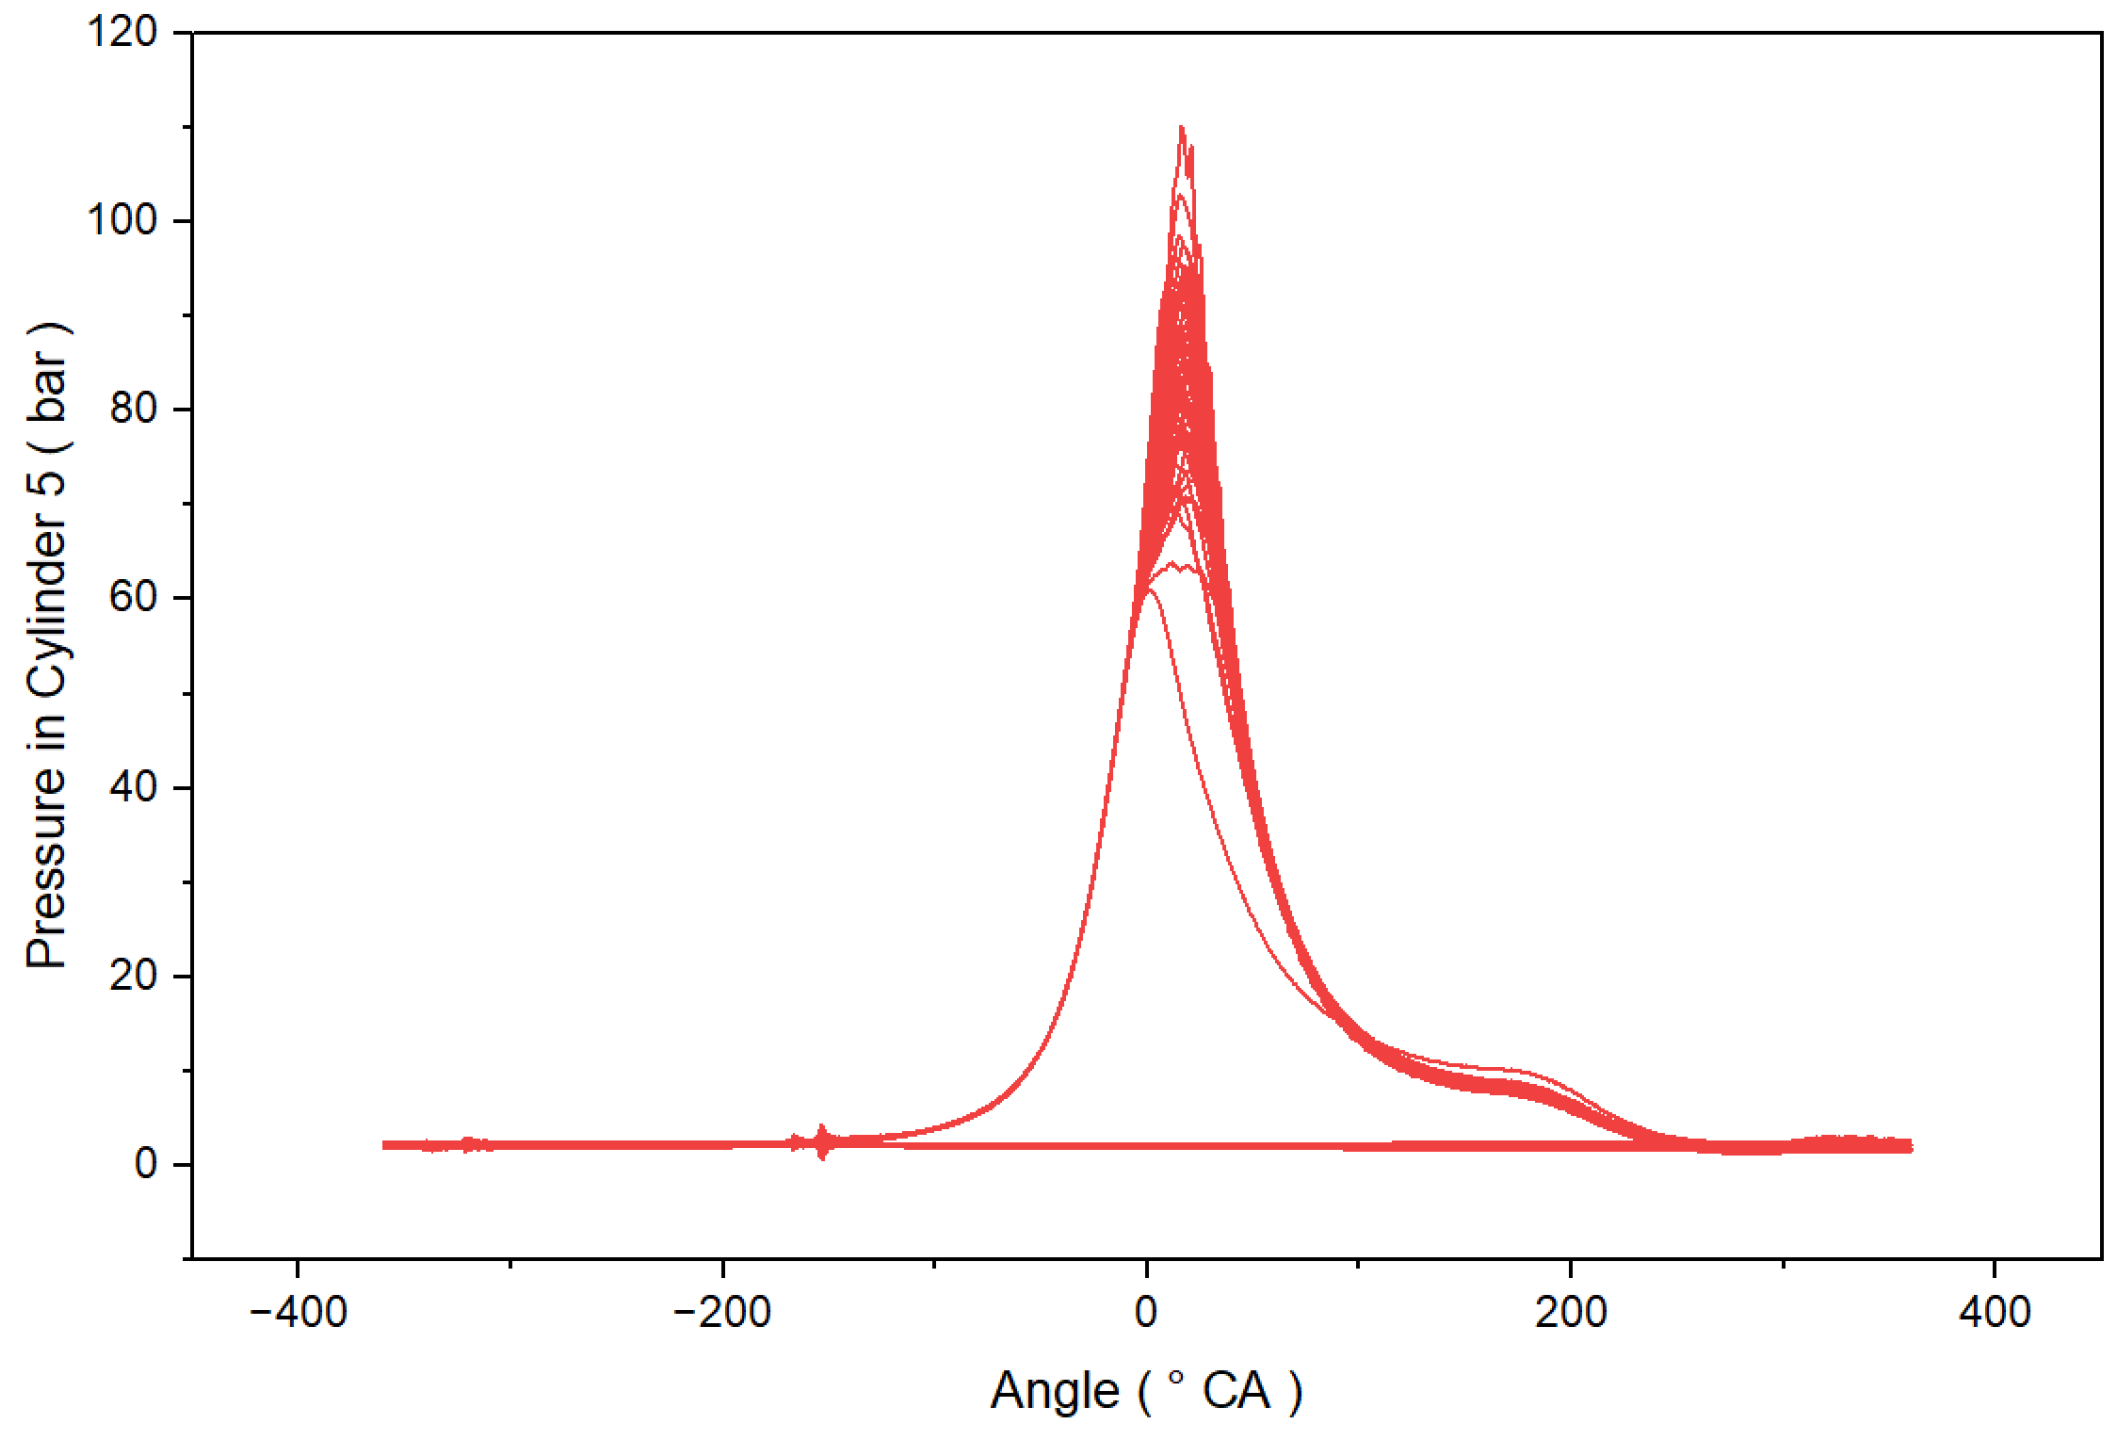
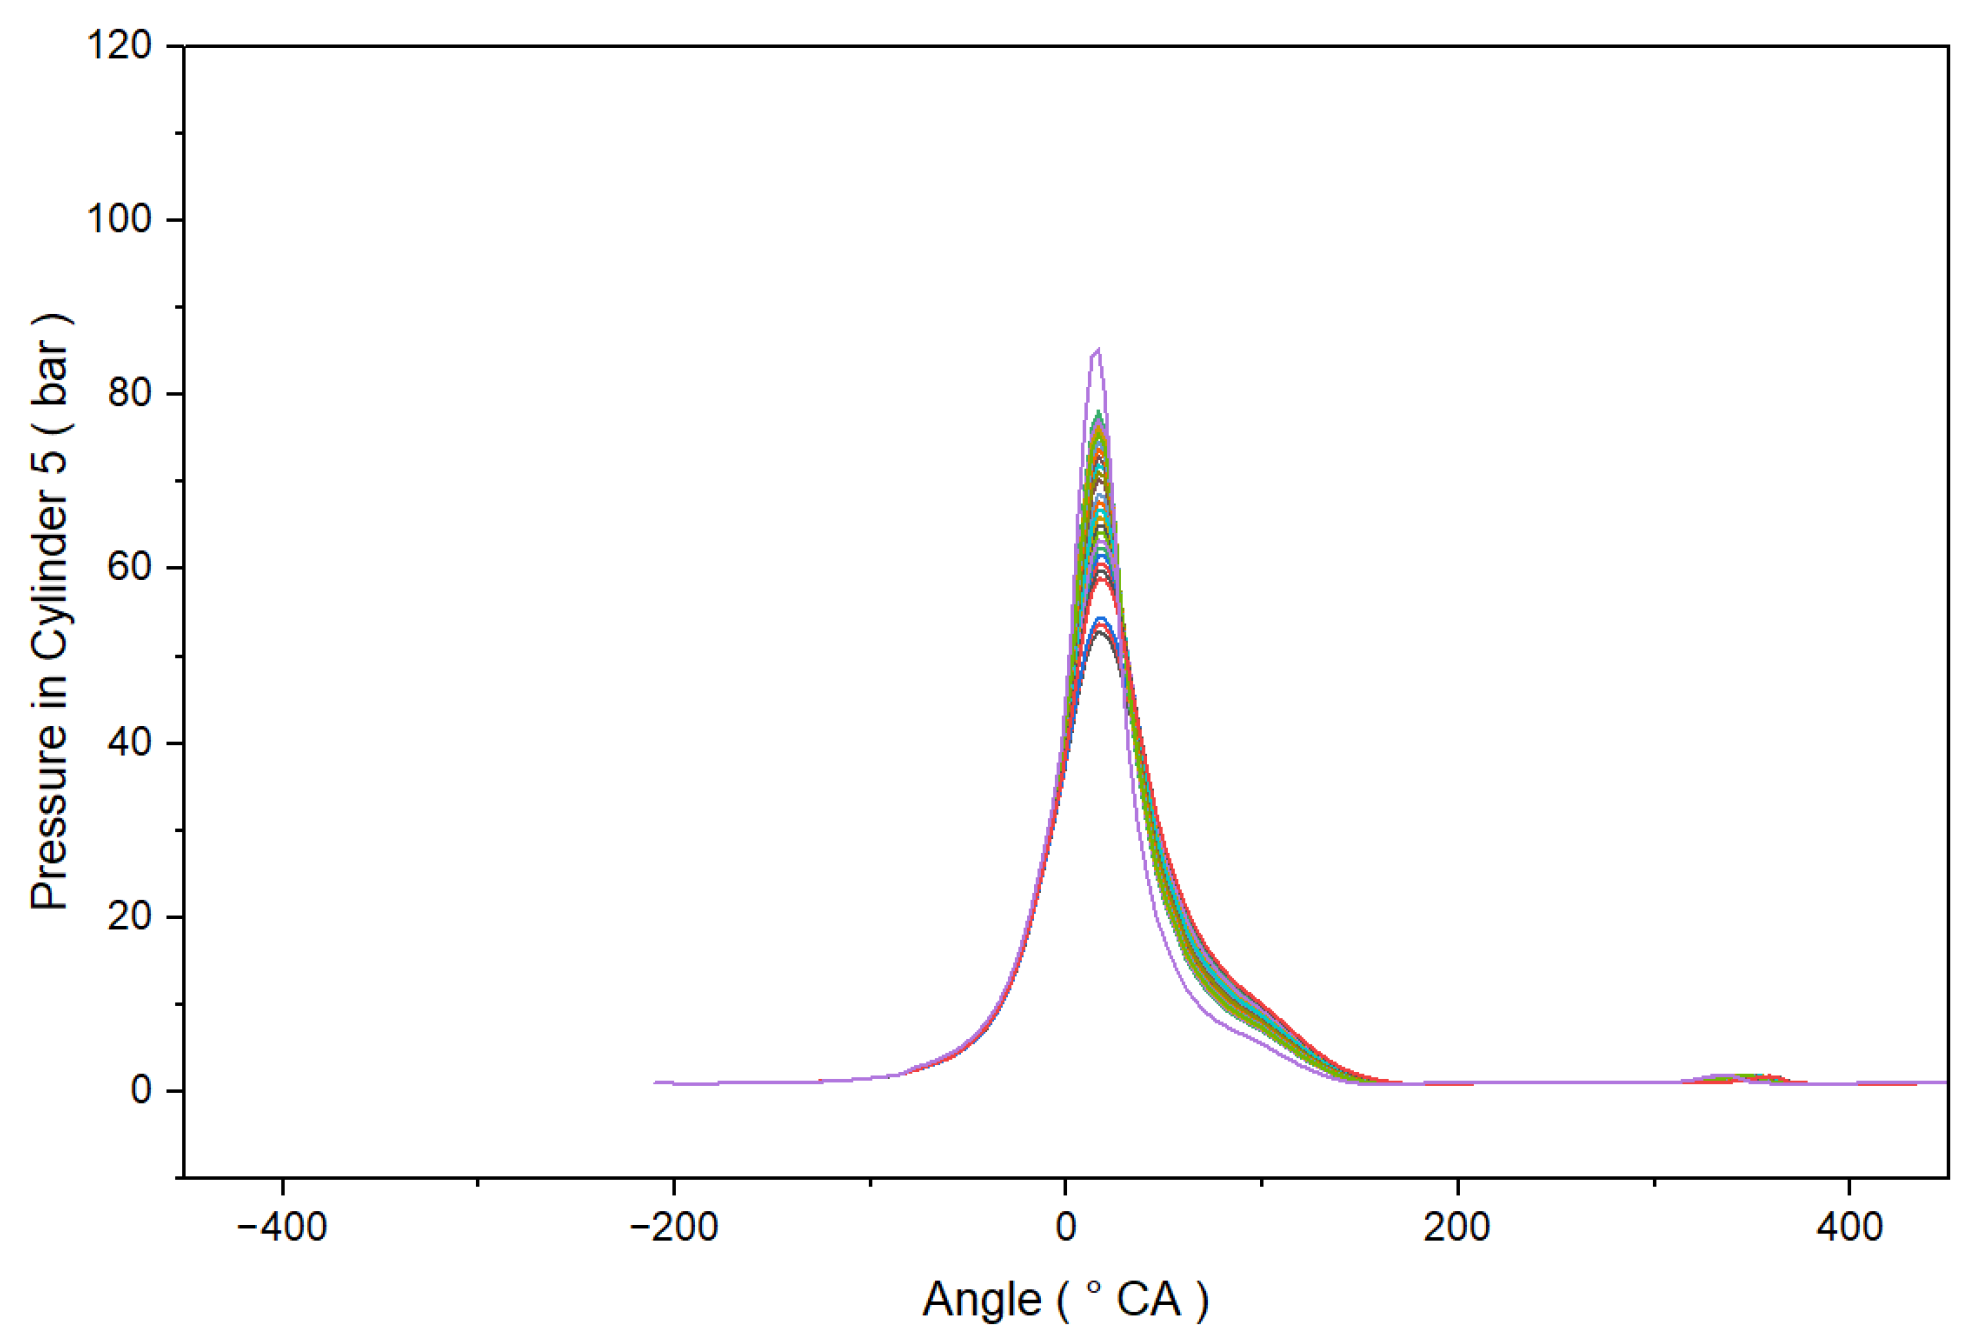
The single-cylinder cycle pressure fluctuation rate is defined as the ratio of the peak pressure range  ( P max P min ) to the mean peak pressure over 30 consecutive cycles. Cylinder 5’s combustion pressure curve from 30 different cycles are shown in Figure 4. As shown in the figure, peak pressures of the 30 different cycles fluctuate significantly, with a maximum peak pressure reaching 110 bar, while the minimum peak pressure is only 60 bar, resulting in a cycle fluctuation rate of 58.82%.

3.2. Simulation Results

Based on the simulation model, the in-cylinder pressure of cylinder 5 under standard operating conditions is shown in Figure 5.
It should be noted that the simulated single-cylinder cycle pressure fluctuation rate amplitude is systematically lower than the experimentally observed values, particularly for cylinder 5. This difference is not a unique defect of the research model, but rather an inherent limitation of 0-D/1-D simulation methods themselves. As Vitek et al. [27] pointed out, standard one-dimensional simulation tools cannot naturally reproduce single-cylinder cycle pressure fluctuations; specialized disturbance methods must be superimposed on the combustion model parameters in order to artificially simulate the stochastic characteristics of single-cylinder cycle pressure fluctuations. In the model used in this study, the combustion process is defined by a single standardized heat release rate curve imported through the EngCylCombProfile object. This curve is applied consistently to every cycle. This essentially assumes that the combustion process is perfectly repeatable, and naturally cannot capture fluctuations such as cycle-to-cycle variations in local turbulence intensity, residual gas fraction, and mixture inhomogeneity that are common in actual engines. Furthermore, this simulation uses pure methane as a surrogate fuel, which is not affected by the real-time random variations in the content of combustible components in actual oilfield tail gas. In practice, the volume fraction of methane in oilfield tail gas fluctuates significantly, which is also the main reason for the extreme pressure pulses observed in the experiments.
It should be noted that there is a systematic deviation in the absolute rate of single-cylinder cycle pressure fluctuations, but this does not affect the model’s assessment of the relative intensity of in-cylinder pressure fluctuations. Taking cylinder 5 as an example, calculated according to the same definition in Section 3.1, the simulated fluctuation index is 48.53%, which differs from the experimental value by 10.29 percentage points. The results confirm that the model can reliably reproduce the relative severity of pressure fluctuations. Since the systematic deviation is proportional across all cylinders and operating conditions, the relative ranking of cylinder-to-cylinder non-uniformity and the sensitivity ranking of the three parameters  λ , FIT, and IAA are not affected. The model is therefore sufficient for the comparative analysis and the conclusions presented in this study.

3.3. Data Processing

In this study, the cylinder-to-cylinder working uniformity is quantitatively evaluated using the fluctuation rate of IMEP and peak pressure of each cylinder. Specifically, this indicator is defined as the ratio of the overall standard deviation of key combustion parameters (IMEP or peak pressure) to their arithmetic mean under the same operating conditions, expressed as a percentage, and is used to quantify the differences in operational uniformity among the cylinders of a multi-cylinder engine. The calculation formulas are as follows:
First, the average value of the parameter for all cylinders under the same condition is calculated:
x ¯ = 1 n i = 1 n x i
Then, the standard deviation of the parameter is obtained:
σ = 1 n i = 1 n ( x i x ¯ ) 2
Finally, the fluctuation rate, which reflects the cylinder-to-cylinder variation, is defined as follows:
δ x = σ x x ¯ × 100 %
where x represents the target parameter (IMEP or peak pressure),  x i is the parameter value of the i-th cylinder, n is the number of cylinders (n = 6 in this study),  x ¯ is the average value,  σ x is the standard deviation, and  δ x is the fluctuation rate (%).
Compared with directly comparing the differences in parameters between cylinders, the fluctuation rate eliminates the influence of parameter dimensions and magnitudes, enabling a more objective quantification of the level of cylinder-to-cylinder working non-uniformity under different operating conditions and facilitating horizontal comparisons across different conditions.

4. Results and Discussion of Simulation

4.1. Influence of Air–Fuel Ratio on Cylinder-to-Cylinder Working Uniformity

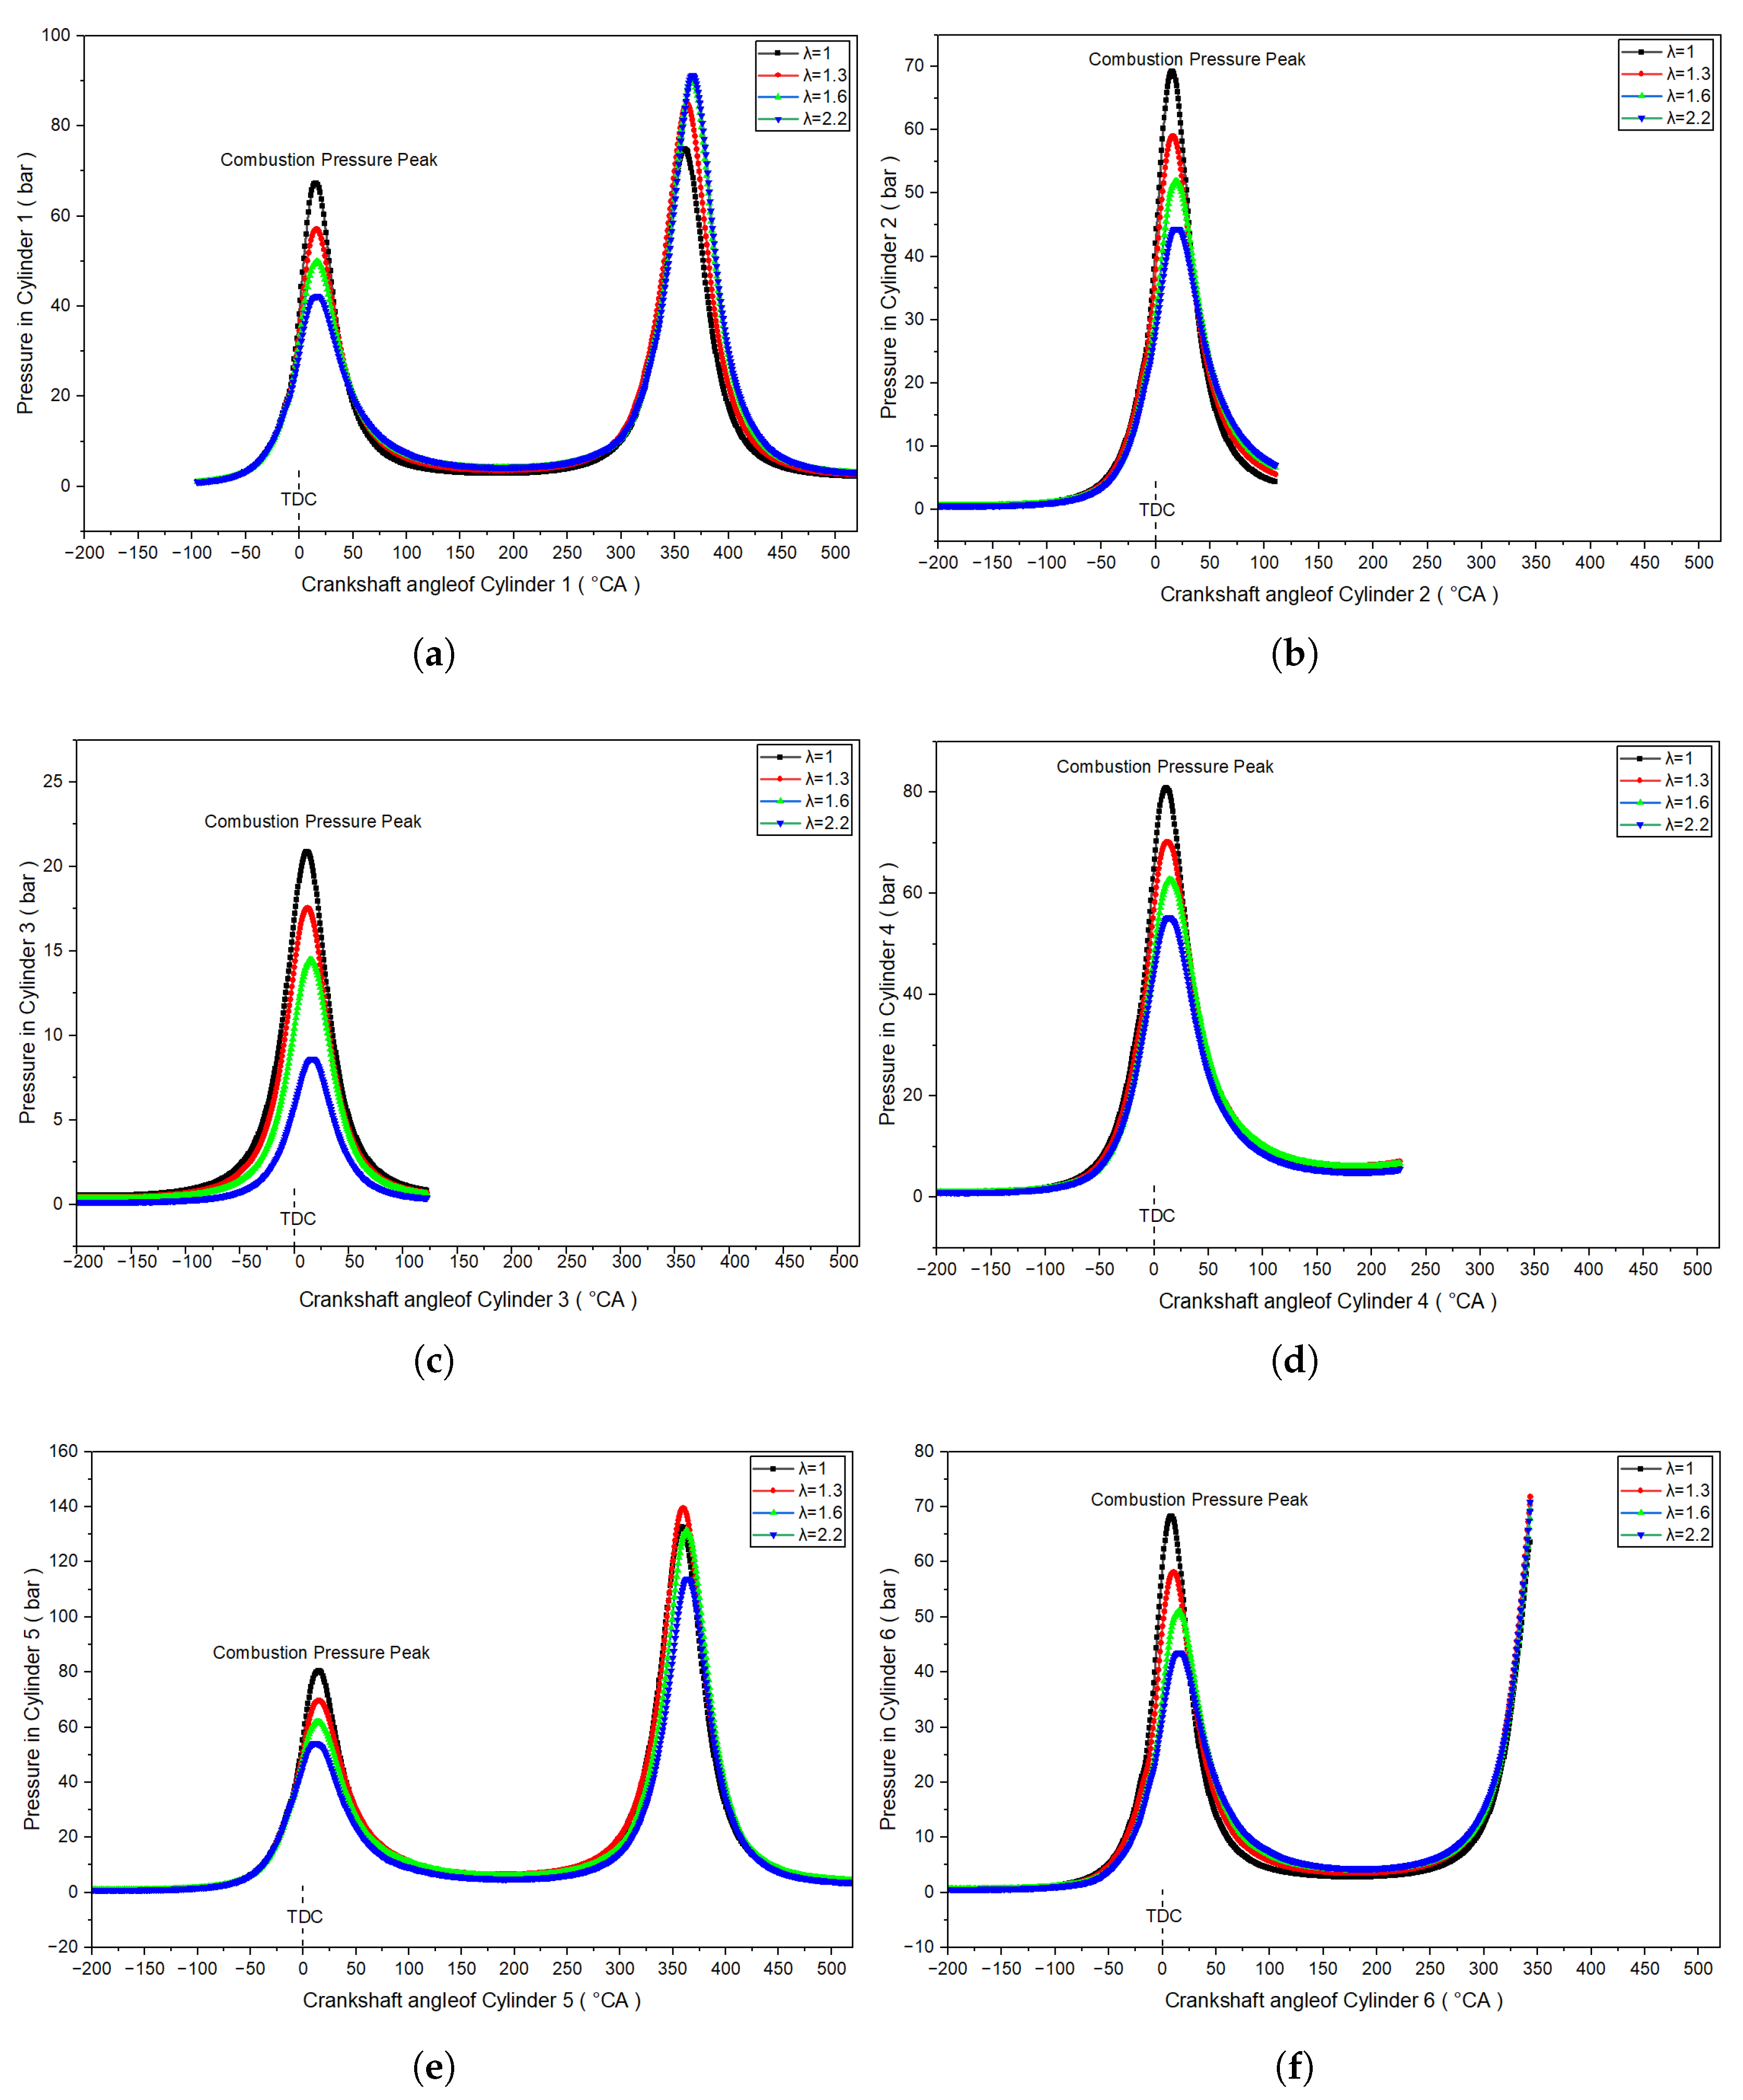
As mentioned earlier, the  λ are set as 1.0, 1.3, 1.6, and 2.2. The cylinder pressure corresponding to different cylinders and different  λ are shown in Figure 6, where Figure 6a, Figure 6b, Figure 6c, Figure 6d, Figure 6e, and Figure 6f correspond to the in-cylinder pressure data of cylinders 1–6, respectively.
Based on the simulation data, the IMEP and peak pressure of each cylinder are extracted, and the fluctuation rates under different  λ are calculated, as shown in Table 6 and Table 7.
As shown in Table 6 and Table 7, with the increase of the  λ from 1.0 to 2.2, the cylinder-to-cylinder fluctuation rates of IMEP and peak pressure both exhibit a trend of slightly increasing first and then decreasing. Among all tested conditions, when  λ = 1.0 , the IMEP fluctuation rate (53.42%) and the peak pressure fluctuation rate (45.64%) are the lowest, indicating the best cylinder-to-cylinder working uniformity.
Its underlying mechanism can be elaborated from the following perspectives: The air–fuel ratio dictates the mixture concentration and combustion characteristics of the low-calorific-value oilfield tail gas employed in this study.
(1) Mixture formation and combustion phase matching: For the low-calorific-value oilfield tail gas investigated,  λ = 1.0 corresponds to the stoichiometric mixture, at which the flame propagation speed is the fastest and combustion is the most stable. Consequently, combustion exhibits the lowest sensitivity to mixture variations—both between cylinders and within a single cylinder—and deviations in combustion phase across cylinders are minimized. As  λ value rises to lean-burn conditions, the sensitivity of the low-calorific-value exhaust gas to changes in the composition of the mixture significantly increases. The sensitivity of the in-cylinder mixture concentration to intake fluctuations and differences in the inter-cylinder flow field also noticeably rises, leading to reduced stability in mixture formation among cylinders. This can cause combustion phase shifts, increased differences in heat release rates, and deterioration in cylinder-to-cylinder working uniformity.
(2) Coupling between charging efficiency and combustion efficiency: As  λ increases, the proportion of excess air in the intake charge rises. This amplifies even minor differences in flow distribution across the intake manifold, directly widening deviations in the actual air–fuel ratio between cylinders. In contrast, at  λ = 1.0, the impact of intake distribution deviations across cylinders on the air–fuel equivalence ratio is negligible. Combustion efficiency and heat release characteristics across cylinders thus remain more consistent, resulting in substantially lower fluctuations in IMEP and peak pressure between cylinders.
Overall, when the  λ is 1, the cylinder-to-cylinder working uniformity is the best.

4.2. Influence of Fuel Injection Timing on Cylinder-to-Cylinder Working Uniformity

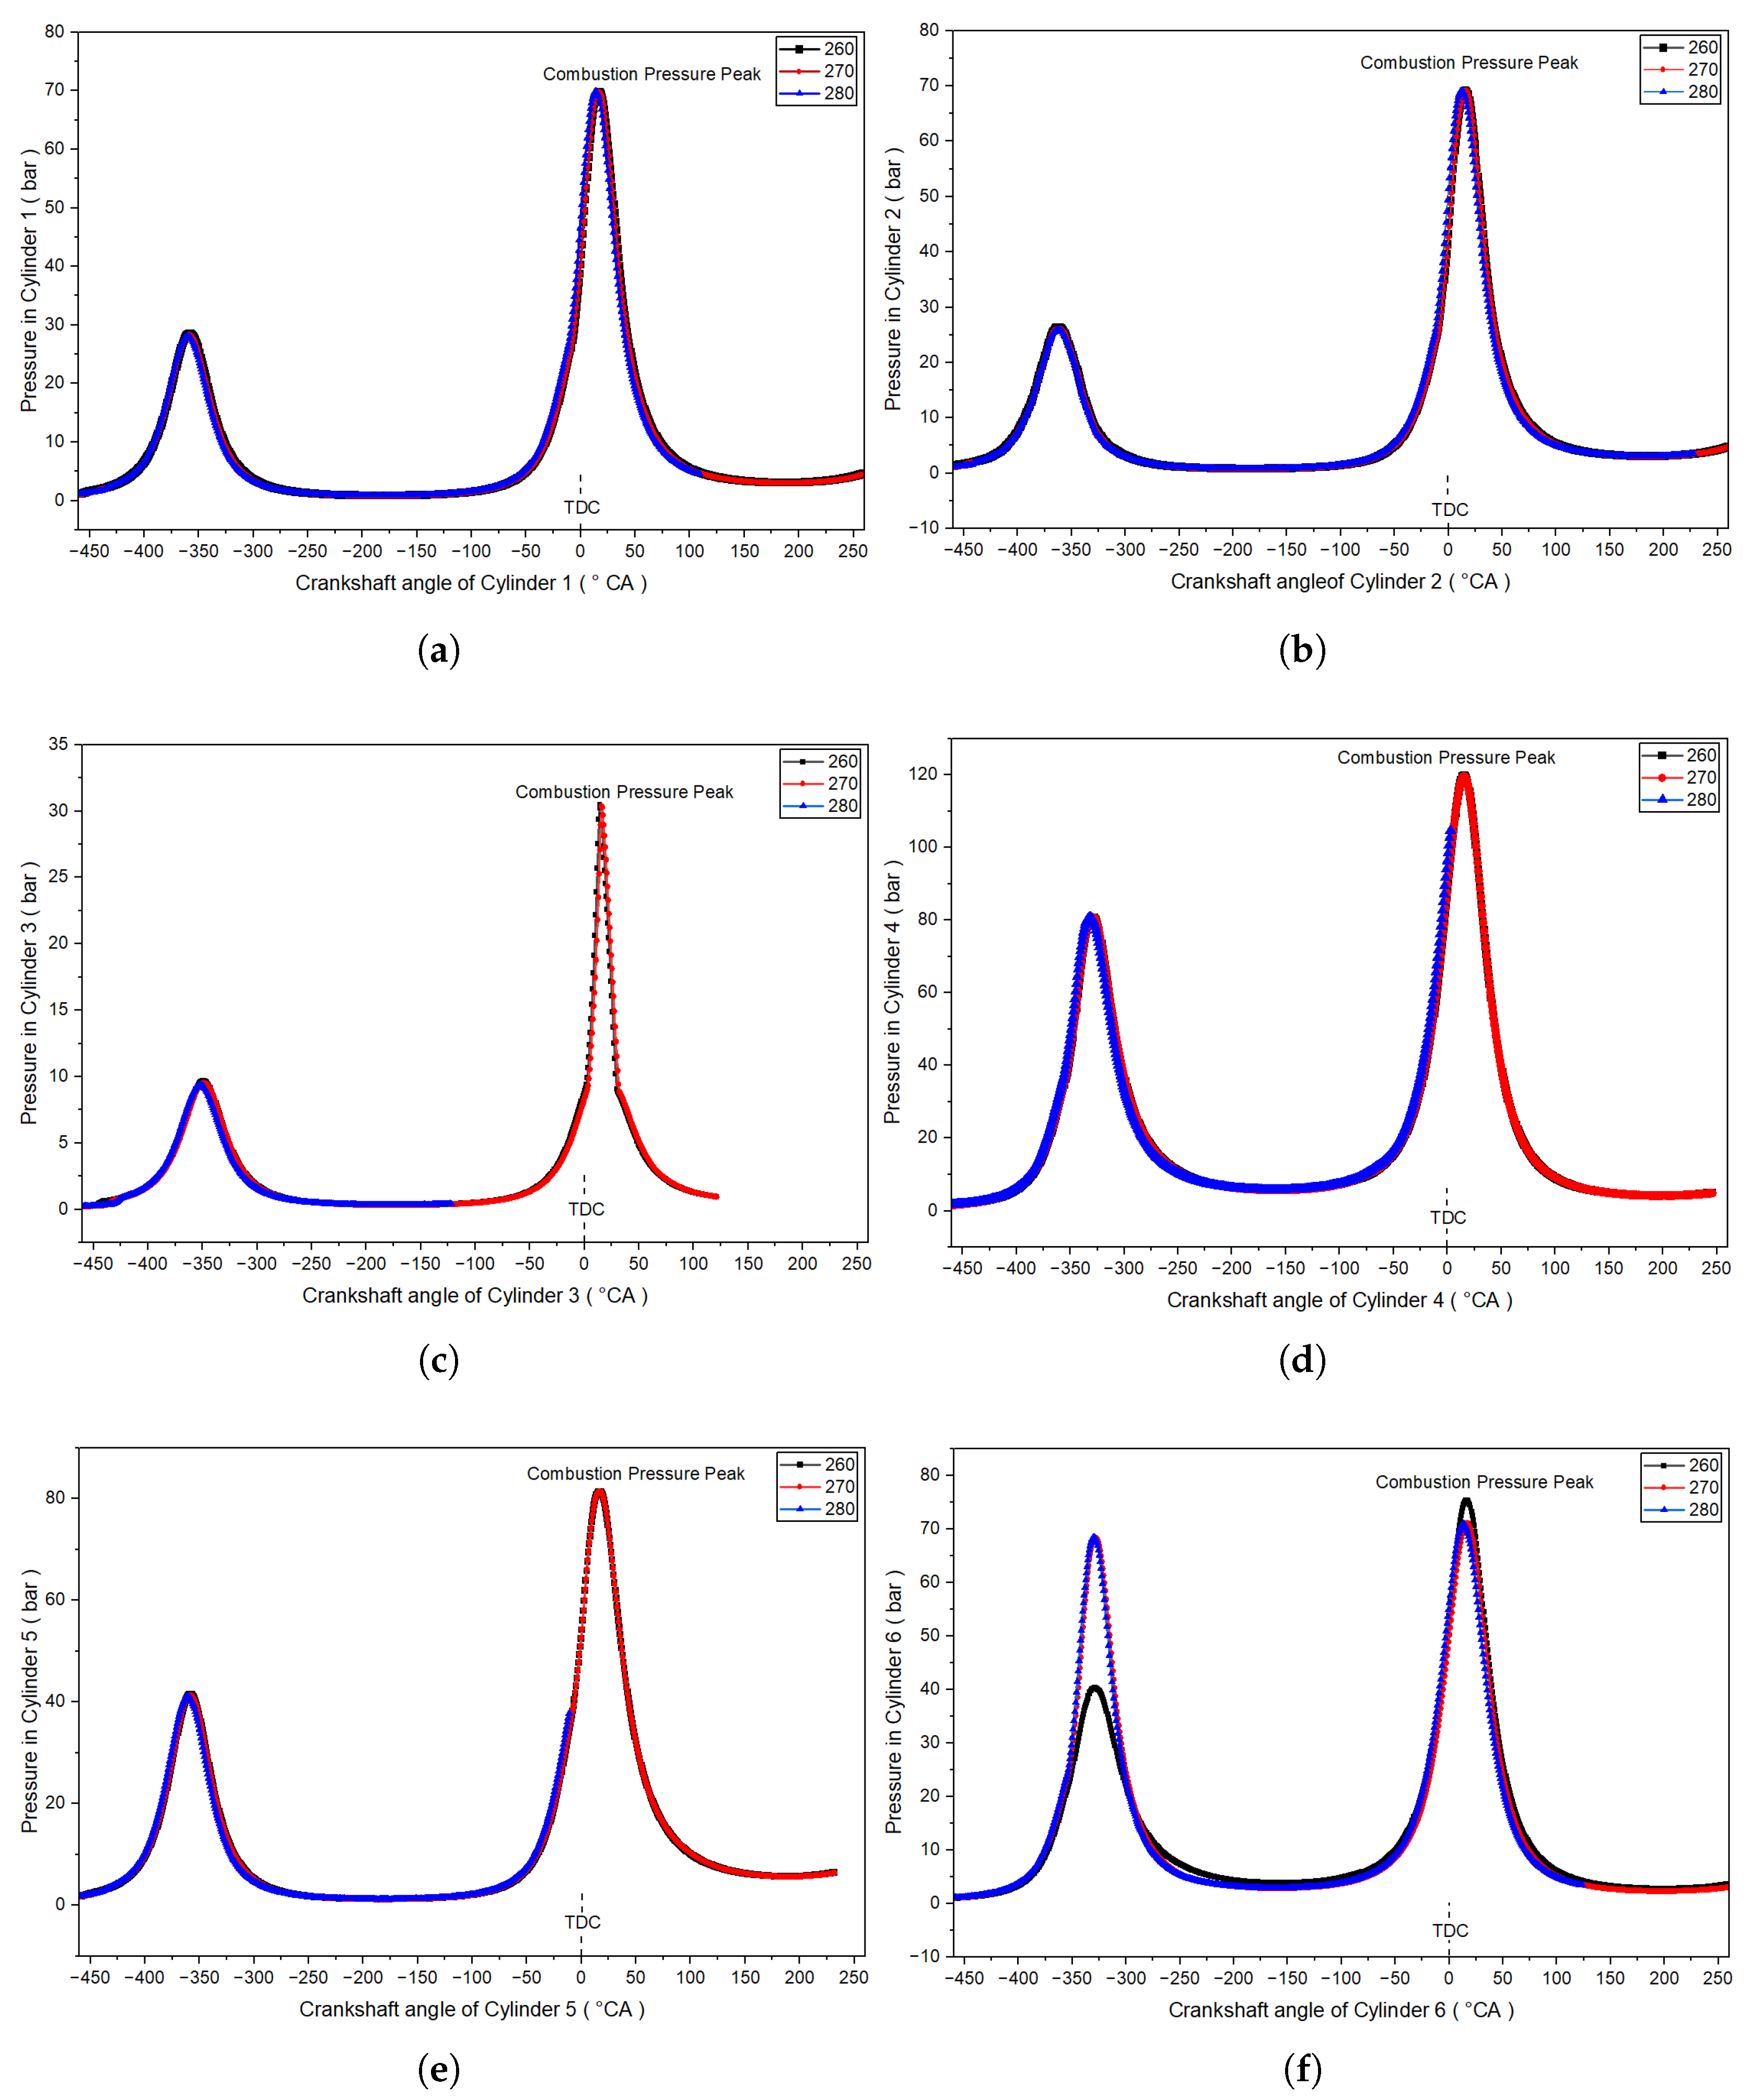
As mentioned earlier, the FITs are set as 260° CA BTDC, 270° CA BTDC, and 280° CA BTDC. The pressure corresponding to different cylinders and different FITs are shown in Figure 7, where Figure 7a, Figure 7b, Figure 7c, Figure 7d, Figure 7e, and Figure 7f correspond to the in-cylinder pressure data of cylinders 1 to 6, respectively.
Based on the simulation data, the IMEP and peak pressure of each cylinder are extracted, and the fluctuation rates under different FITs are calculated, as shown in Table 8 and Table 9.
As shown in Table 8 and Table 9, as the fuel injection advance angle is delayed from 260° CA BTDC to 280° CA BTDC, the cylinder-to-cylinder fluctuation rates of IMEP and peak pressure show an overall increasing trend. At 260° CA BTDC, the IMEP fluctuation rate (45.70%) and the peak pressure fluctuation rate (37.94%) are both the lowest, indicating the best cylinder-to-cylinder working uniformity.
This trend mainly originates from two major mechanisms related to the fuel–air mixture. FIT is the duration for which the fuel atomizes and mixes with air in the cylinder, which is particularly important for the low-calorific-value fuel used in this study.
(1) Fuel atomization and mixture preparation time: When the FIT is set to 260° CA BTDC, the fuel enters the cylinder earlier, providing more time for atomization, evaporation, and mixture formation. This effectively mitigates the impact of intake swirl intensity and temperature differences between cylinders on mixture uniformity. However, when the fuel injection timing is delayed to 270° CA BTDC or 280° CA BTDC, there is insufficient time for complete fuel evaporation, leading to increased wetting of the cylinder liner surfaces. Differences in cylinder wall temperature and in-cylinder flow further reduce the consistency of the mixture formation process, resulting in greater deviations in combustion conditions between cylinders.
(2) Consistency of heat release characteristics: Advancing fuel injection can align the combustion phases of each cylinder closer to the optimal combustion window of this oilfield waste gas engine, reducing deviations in the timing of peak heat release and improving the consistency of pressure rise rates between cylinders. Conversely, delayed fuel injection postpones the overall combustion phase, causing noticeable post-combustion phenomena in some cylinders. This further amplifies the differences in peak pressure and IMEP between cylinders, leading to a significant deterioration in cylinder-to-cylinder working uniformity.
Overall, when FIT is 260° CA BTDC, the cylinder-to-cylinder working uniformity is the best.

4.3. Influence of Ignition Advance Angle on Cylinder-to-Cylinder Working Uniformity

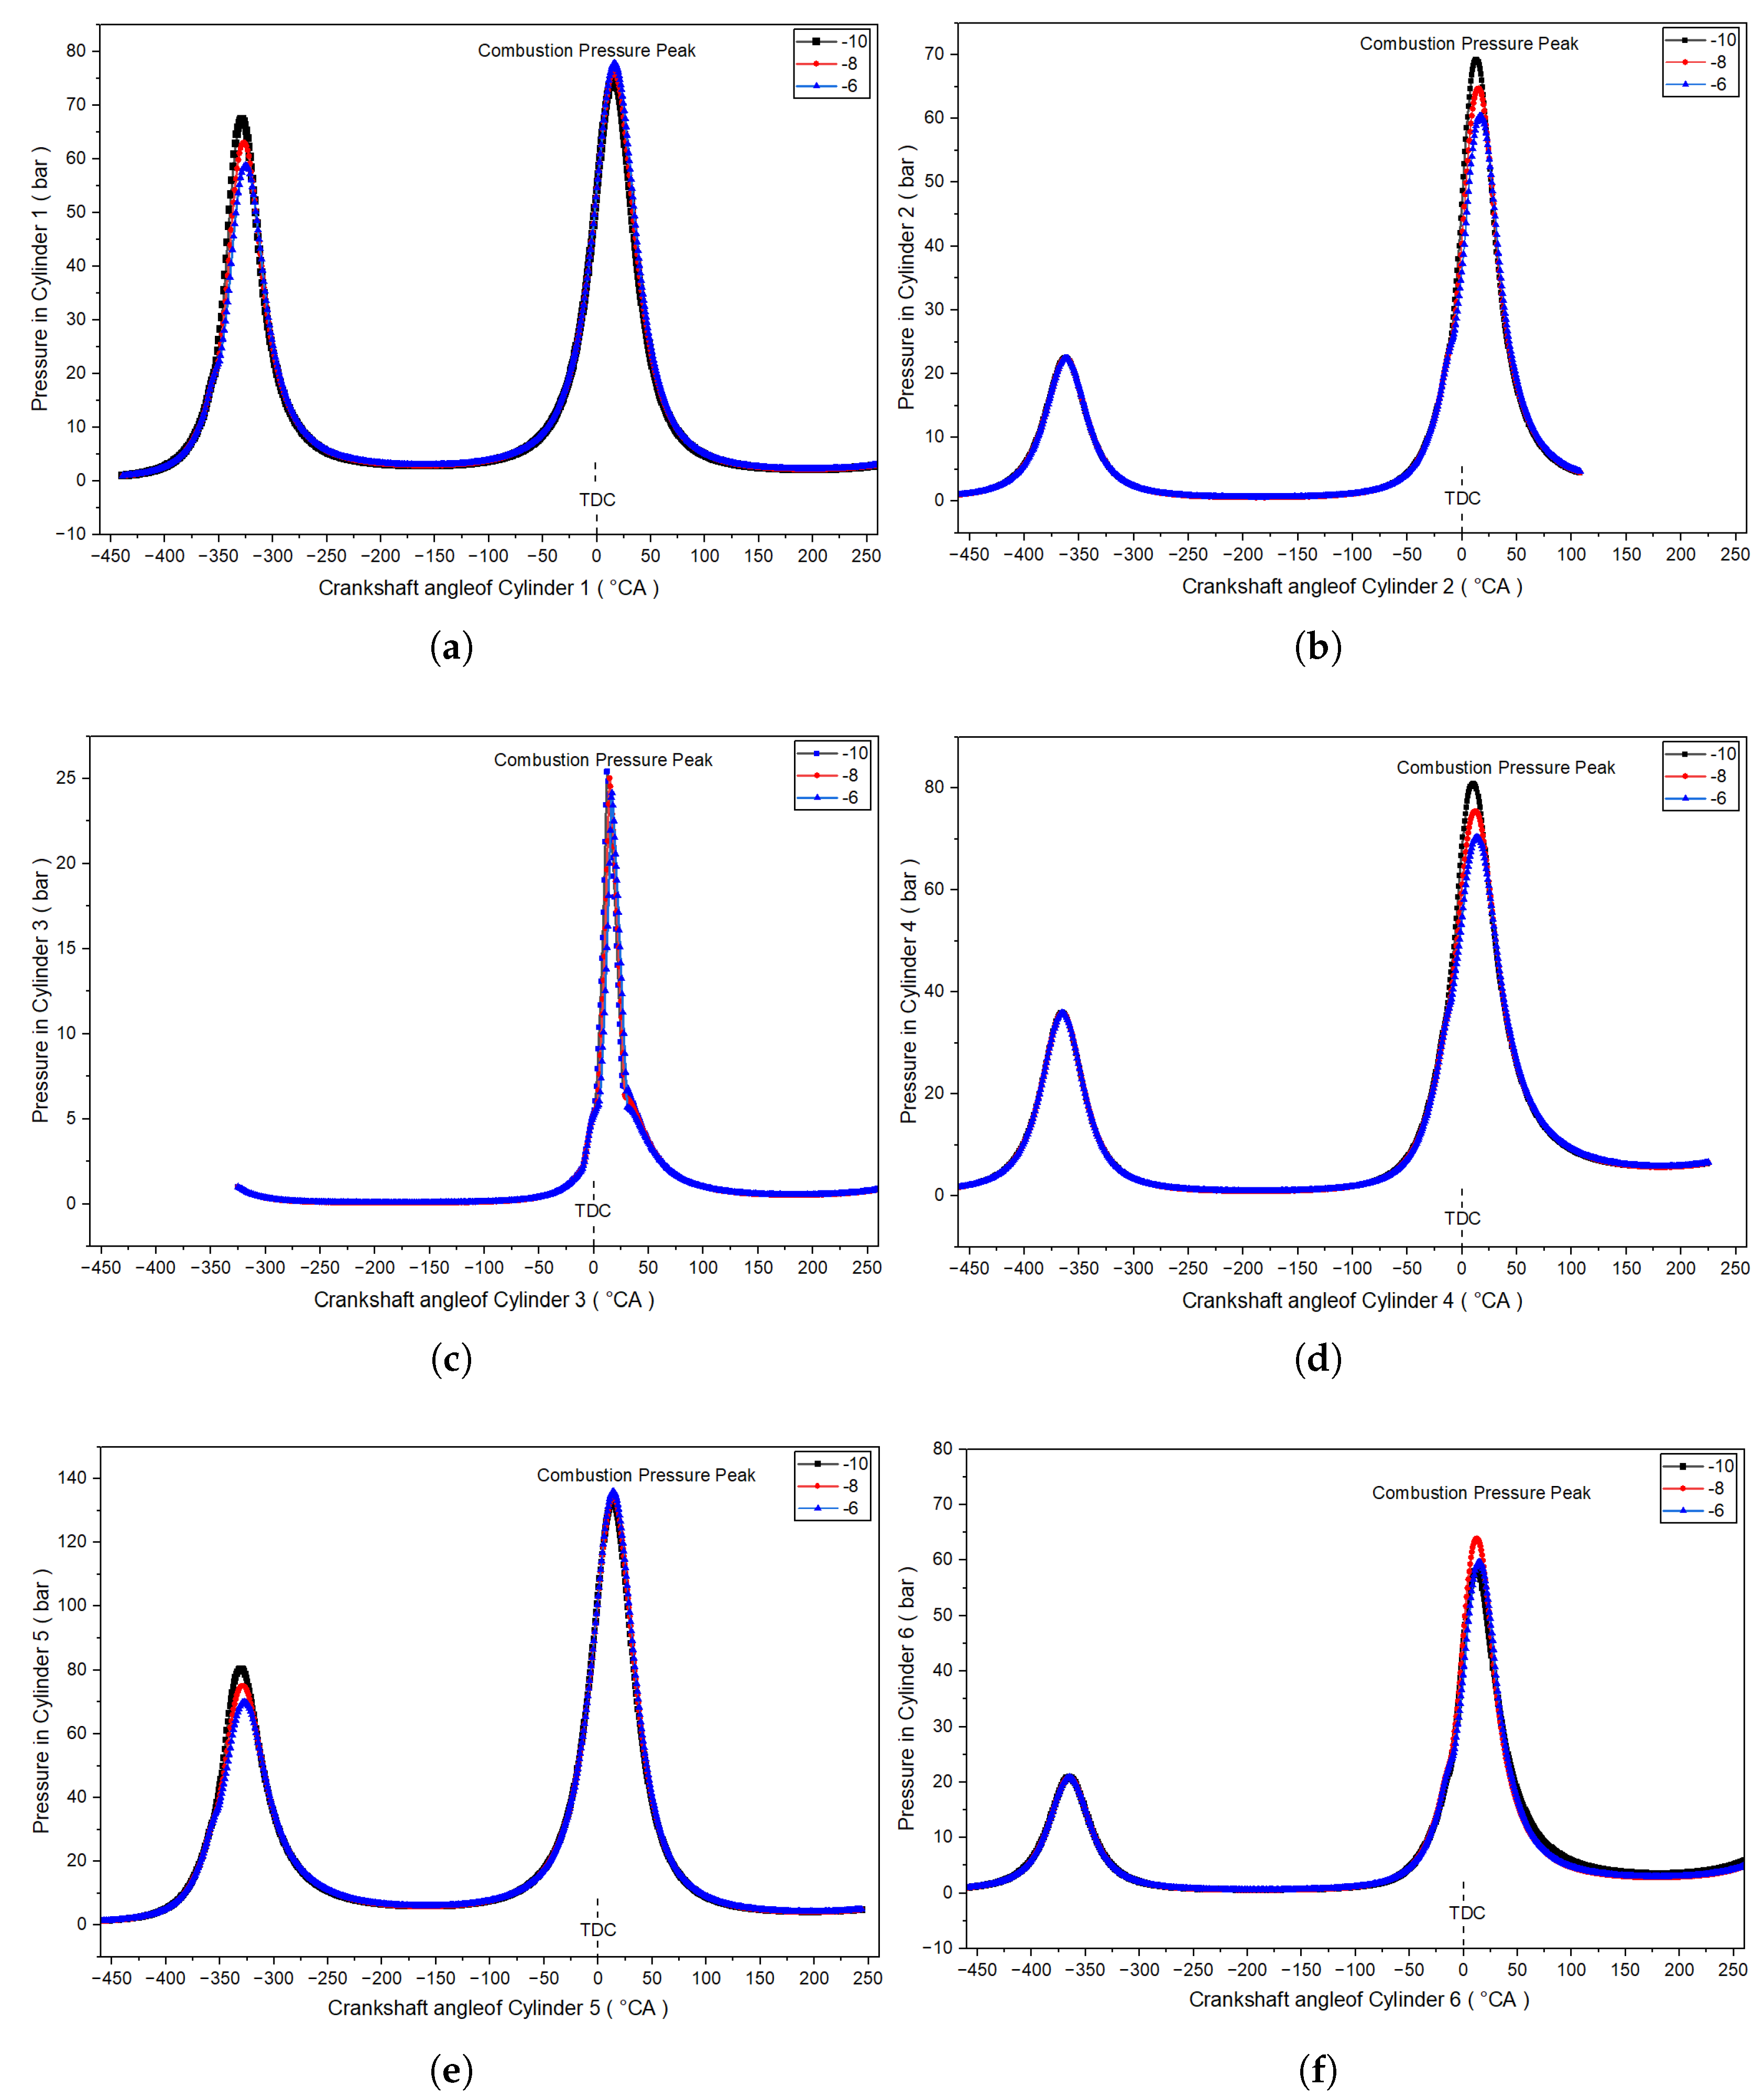
As mentioned earlier, the IAA are set as 10° CA BTDC, 8° CA BTDC, and 6° CA BTDC. The pressure corresponding to different cylinders and different IAA are shown in Figure 8, where Figure 8a, Figure 8b, Figure 8c, Figure 8d, Figure 8e, and Figure 8f correspond to the in-cylinder pressure data of cylinders 1–6, respectively.
Based on the simulation data, the IMEP and peak pressure of each cylinder are extracted, and the fluctuation rates under different IAAs are calculated, as shown in Table 10 and Table 11.
As shown in Table 10 and Table 11, as IAA is retarded from 10° CA BTDC to 6° CA BTDC, the cylinder-to-cylinder fluctuation of IMEP and peak pressure continues to increase. At 10° CA BTDC, the IMEP fluctuation rate (53.00%) and peak pressure fluctuation rate (45.13%) are both the lowest, indicating the best cylinder-to-cylinder working uniformity.
This trend can be interpreted through two underlying mechanisms. IAA exerts a decisive influence on the ignition delay period, combustion phasing and heat release evolution of oilfield tail gas, which is categorized as a typical low-calorific-value fuel. For such fuel, even small inter-cylinder discrepancies in mixture concentration and intake charging condition can induce obvious deviations in ignition delay characteristics.
(1) Matching of the combustion phase with the heat release process: When IAA is advanced by 10° CA BTDC, the combustion phase falls within the optimal thermal efficiency range, with the peak pressure occurring within a reasonable crank angle after top dead center, and the heat release process of each cylinder is more consistent. As the ignition timing is delayed, the overall combustion phase shifts backward, causing the peak heat release timing of some cylinders to deviate from the engine-calibrated optimal combustion phase. This significantly increases the differences in heat release rates between cylinders, resulting in higher fluctuation rates in IMEP and peak pressure.
(2) Disturbance resistance and suppression of cylinder-to-cylinder differences: Within a reasonable range (not approaching the knock limit), appropriately advancing the ignition timing can enhance the engine’s robustness to intake fluctuations and mixture concentration differences across cylinders, making the combustion process less affected by initial condition variations between cylinders, which helps improve disturbance resistance. Conversely, when ignition is delayed, the combustion process becomes more sensitive to the initial conditions in each cylinder, amplifying differences in intake volume and residual exhaust gas coefficient across cylinders, thereby further exacerbating the cylinder-to-cylinder working non-uniformity.
Overall, when IAA is set to 10° CA BTDC, the cylinder-to-cylinder working uniformity is the best.


5. Conclusions

This paper takes a 12-cylinder engine fueled with oilfield tail gas as the study object. The effects of the  λ , FIT, and IAA on the cylinder-to-cylinder working uniformity of the engine are investigated. The conclusions are as follows:
  • Under different  λ , the fluctuation rates of the IMEPs and peak pressures of different cylinders are relatively high, and the cylinder-to-cylinder working uniformity is poor. When the  λ is 1, the fluctuation rates of IMEP and peak pressure are at their lowest, and the cylinder-to-cylinder working uniformity of the engine is relatively optimal. Quantitatively, compared with lean operating conditions ( λ = 1.3–2.2), the optimal stoichiometric condition reduces IMEP fluctuation by 2.85 percentage points (decreasing from 56.27% to 53.42%), while the peak pressure fluctuation is reduced by 4.87 percentage points (decreasing from 50.51% to 45.64%). This parameter matching scheme is suitable for the steady and rated-load operation of oilfield tail gas power generation units, and provides a reliable calibration benchmark for the air–fuel ratio closed-loop control of multi-cylinder engines, and offers theoretical basis and technical reference for the stable and efficient operation of oilfield tail gas engine systems.
  • Under different FITs, the fluctuation rates of the IMEPs and peak pressures of different cylinders are relatively large, and the cylinder-to-cylinder working uniformity is poor. When the FIT is 260° CA BTDC, the fluctuation rates of IMEP and peak pressure are at their lowest, and the cylinder-to-cylinder working uniformity of the engine reaches the optimal state. Compared with the worst delayed injection condition (280° CA BTDC, where the fluctuations reach their maxima of 52.43% for IMEP and 52.83% for peak pressure), the optimal injection timing reduces the IMEP fluctuation by 6.73 percentage points (from 52.43% to 45.70%) and the peak pressure fluctuation by 14.89 percentage points (from 52.83% to 37.94%), showing a significant improvement in cylinder-to-cylinder working uniformity. This timing range is applicable to the conventional medium-high load operation of medium-speed gas-fired power generation engines, and provides a key calibration parameter for FIT partitioned closed-loop control strategies, and provides practical technical support for the regulation and balance optimization of oilfield tail gas power generation engines.
  • Under different IAA, the fluctuation rates of the IMEPs and peak pressures of different cylinders are relatively significant, and the cylinder-to-cylinder working uniformity is poor. When the IAA is 10° CA BTDC, the fluctuation rates of the IMEP and peak pressure are the lowest, and the cylinder-to-cylinder working uniformity of the engine is relatively optimal. Quantitatively, compared with the late ignition condition (6° CA BTDC), the optimal IAA reduces the IMEP fluctuation by 1.12 percentage points (from 54.12% to 53.00%) and the peak pressure fluctuation by 4.06 percentage points (from 49.19% to 45.13%). This phasing is highly suitable for long-term continuous operation conditions of oilfield tail gas utilization units, and the results can guide the design of adaptive ignition control and cylinder-to-cylinder working uniformity optimization for oilfield tail gas engines.
Overall all the optimal parameter combinations obtained in this study are highly applicable to the steady-state rated and medium-high load continuous operation of the target engine, matching the long-term stable power generation requirements of oilfield tail gas utilization units. This research provides theoretical basis and technical reference for the efficient secondary utilization of oilfield tail gas in power-generation engines.

Author Contributions

Writing—original draft preparation, M.Y.; writing—review and editing, J.T.; validation, H.S.; investigation, Z.W. and Y.H. All authors have read and agreed to the published version of the manuscript.

Funding

This work was supported by the Postdoctoral Foundation of Shandong Province, China, [Grant Number SDCX-ZG-202203009].

Data Availability Statement

The data presented in this study are available upon request from the corresponding author. The data are not publicly available due to privacy reasons.

Conflicts of Interest

The authors declare that the research was conducted in the absence of any commercial or financial relationships that could be construed as a potential conflict of interest. The funders had no role in the design of the study; in the collection, analyses, or interpretation of data; in the writing of the manuscript, or in the decision to publish the results.

References

  1. Teodosio, L.; Tornatore, C.; Marchitto, L. Numerical evaluation of heat transfer effects on the improvement of efficiency of a spark ignition engine characterized by cylinder variability. Case Stud. Therm. Eng. 2022, 35, 102125. [Google Scholar] [CrossRef]
  2. Yamaizumi, R.; Shi, H.; Kuboyama, T.; Moriyoshi, Y. Analysis of Cylinder to Cylinder Variations in a Turbocharged Spark Ignition Engine at Lean Burn Operations; SAE Technical Paper; SAE International: Warrendale, PA, USA, 2022; Volume SAE 2022-32-0044. [Google Scholar] [CrossRef]
  3. Debotton, G.; Sher, E.; Frenkel, E.; Rivin, B.; Watts, M. Online Detection of Cylinder-to-Cylinder Variations by a Vibration Analysis System; SAE Technical Paper; SAE International: Warrendale, PA, USA, 2002; Volume SAE 2002-01-0848. [Google Scholar] [CrossRef]
  4. Jia, D.; Cao, Q.; Xu, X.; Wang, Z.; Wang, D.; Wang, H. Simulation Study of Cylinder-to-Cylinder Variation Phenomena and Key Influencing Factors in a Six-Cylinder Natural Gas Engine. Energies 2025, 18, 4078. [Google Scholar] [CrossRef]
  5. Kassa, M.; Hall, C.; Ickes, A.; Wallner, T. Modeling and control of fuel distribution in a dual-fuel internal combustion engine leveraging late intake valve closings. Int. J. Engine Res. 2017, 18, 797–809. [Google Scholar] [CrossRef]
  6. Chen, Z.; Yao, C.; Wang, Q.; Han, G.; Wu, T. Study of cylinder-to-cylinder variation in a diesel engine fueled with diesel/methanol dual fuel. Fuel 2016, 170, 67–76. [Google Scholar] [CrossRef]
  7. Galindo, J.; Climent, H.; Navarro, R.; García-Olivas, G.; Guilain, S.; Boubennec, R. Effect of Numerical Configuration on Predicted EGR Cylinder-to-Cylinder Dispersion; SAE Technical Paper; SAE International: Warrendale, PA, USA, 2020; Volume SAE 2020-01-1113. [Google Scholar] [CrossRef]
  8. Coverdill, R.E.; Kirwan, J.E.; Brandon, L.E.; Peters, J.E. The Effects of Throttle Body Injection on Fuel/air Distribution in a Spark Ignition Engine. Combust. Sci. Technol. 1989, 66, 189–198. [Google Scholar] [CrossRef]
  9. Wang, Y.; Wang, G.; Yao, G.; Shen, L. Research on the Characteristics of Operating Non-Uniformity of a High-Pressure Common-Rail Diesel Engine Based on Crankshaft Segment Signals. IEEE Access 2021, 9, 64906–64917. [Google Scholar] [CrossRef]
  10. Xie, L.; Sun, S.; Dong, F. The Non-Uniformity Control Strategy of a Marine High-Speed Diesel Engine Based on Each Cylinder’s Exhaust Temperature. Processes 2023, 11, 1068. [Google Scholar] [CrossRef]
  11. Korczewski, Z. Exhaust Gas Temperature Measurements in Diagnostics of Turbocharged Marine Internal Combustion Engines Part I Standard Measurements. Pol. Marit. Res. 2015, 22, 47–54. [Google Scholar] [CrossRef]
  12. Shin, J.; Kim, D.; Son, Y.; Park, S. Effect of intake manifold geometry on cylinder-to-cylinder variation and tumble enhancement in gasoline direct injection engine. Sci. Rep. 2022, 12, 19862. [Google Scholar] [CrossRef]
  13. Chen, Z.; Yao, C.; Yao, A.; Dou, Z.; Wang, B.; Wei, H.; Liu, M.; Chen, C.; Shi, J. The impact of methanol injecting position on cylinder-to-cylinder variation in a diesel methanol dual fuel engine. Fuel 2017, 191, 150–163. [Google Scholar] [CrossRef]
  14. Felayati, F.M.; Fajar, R.; Octaviani, N.S.; Sugeng, D.A. A Numerical Investigation of Natural Gas Injection Timing Effect on Low-Load Dual-Fuel Engines Combustion and Emissions. Int. J. Eng. Appl. 2025, 13, 538–546. [Google Scholar] [CrossRef]
  15. Wei, H.; Zhang, R.; Chen, L.; Pan, J.; Wang, X. Effects of High Ignition Energy on Lean Combustion Characteristics of Natural Gas Using an Optical Engine with a High Compression Ratio. Energy 2021, 223, 120053. [Google Scholar] [CrossRef]
  16. Liu, X.Y.; Zhu, J.; Wang, Z.C.; Wang, Z.H.; Zhao, Z.H.; Wang, W.H.; Cai, H.P. Research on the Impact of Blending Dissociated Methanol Gas on the Performance and Emissions of Marine Medium-Speed Methanol Engines. J. Mar. Sci. Eng. 2024, 13, 7. [Google Scholar] [CrossRef]
  17. Xu, C.C.; Wen, H.B.; Jing, H.G.; Li, J.R.; Cho, H.M.; Chen, D.F. Effects of methanol substitution rate on combustion and emission characteristics of methanol/diesel dual fuel engines. Int. J. Oil Gas Coal Technol. 2024, 36, 509–531. [Google Scholar] [CrossRef]
  18. Azeem, N.; Beatrice, C.; Vassallo, A.; Pesce, F.; Gessaroli, D.; Biet, C.; Guido, C. Experimental study of cycle-by-cycle variations in a spark ignition internal combustion engine fueled with hydrogen. Int. J. Hydrogen Energy 2024, 60, 1224–1238. [Google Scholar] [CrossRef]
  19. Xie, M.; Fu, J.; Zhang, Y.; Shu, J.; Ma, Y.; Liu, J.; Zeng, D. Numerical analysis on the effects of CO2 dilution on the laminar burning velocity of premixed methane/air flame with elevated initial temperature and pressure. Fuel 2020, 264, 116858.1–116858.11. [Google Scholar] [CrossRef]
  20. Zahedi, P.; Yousefi, K. Effects of pressure and carbon dioxide, hydrogen and nitrogen concentration on laminar burning velocities and NO formation of methane-air mixtures. J. Mech. Sci. Technol. 2014, 28, 377–386. [Google Scholar] [CrossRef]
  21. Einewall, P. Study and Development of Techniques to Improve Engine Stability and Reduce Emissions from Natural Gas Engines; Lund University: Lund, Sweden, 2003; Available online: https://api.semanticscholar.org/CorpusID:107092236 (accessed on 11 May 2026).
  22. Xu, Z.; Shen, T. Symbol-sequence statistics-based cylinder-to-cylinder variation control in spark-ignition engines. Appl. Energy 2020, 261, 114406. [Google Scholar] [CrossRef]
  23. Wang, X.; Zhou, L.; An, S. Closed-loop Control of Cylinder-to-Cylinder Non-uniformity for Diesel Engines Based on GT-Power and Simulink. Ship Eng. 2019, 41, 77–81+144. (In Chinese) [Google Scholar] [CrossRef]
  24. Jafarabadi, M.; Chamani, H.; Malakizadi, A.; Jazayeri, S.A. A Fast Coupled CFD-Thermal Analysis of a Heavy Duty Diesel Engine Water Cooling System. In Proceedings of the ASME 2008 International Mechanical Engineering Congress and Exposition, Boston, MA, USA, 31 October–6 November 2008; pp. 663–670. [Google Scholar] [CrossRef]
  25. Fontanesi, S.; Giacopini, M. Multiphase CFD–CHT optimization of the cooling jacket and FEM analysis of the engine head of a V6 diesel engine. Appl. Therm. Eng. 2013, 52, 293–303. [Google Scholar] [CrossRef]
  26. Liu, Y.; Zuo, C.; Li, X. Simulation Prediction and Experimental Research on Exhaust Noise of Engine. China Mech. Eng. 2011, 22, 1664–1668. Available online: https://kns.cnki.net/kcms2/article/abstract?v=8kKd7LBMH3zC0zBoNcYBkO9UBfFq3D2nB7mQZFc0P4RynR6z2zsc-XkNY82rMNukfY9Fm2iLBrVCffgok5vw_M9HObeTR_9nmvgcjfX0jqkNAmSV3VUuAqGpcZPdQqqaJCdu-AF08C0m4bUrIVax3J-oFY82DZwwejINo32QdVmb6Nj0Od83oQ==&uniplatform=NZKPT&language=CHS (accessed on 11 May 2026). (In Chinese)
  27. OLDřich, V.; Jan, M.; Christoph, P.; Reinhard, T. Modeling Cycle-to-Cycle Variations in 0-D/1-D Simulation by Means of Combustion Model Parameter Perturbations based on Statistics of Cycle-Resolved Data. SAE Int. J. Eng. 2013, 6, 1075–1098. [Google Scholar]
Figure 1. Engine simulation model.
Processes 14 01705 g001
Figure 2. Intake valve lift curve.
Processes 14 01705 g002
Figure 4. Cylinder pressure curve of cylinder 5.
Processes 14 01705 g004
Figure 5. In-cylinder pressure curve of cylinder 5.
Processes 14 01705 g005
Figure 6. In-cylinder pressure curves under different air–fuel ratios. (a) In-cylinder pressure curve of Cylinder 1. (b) In-cylinder pressure curve of Cylinder 2. (c) In-cylinder pressure curve of Cylinder 3. (d) In-cylinder pressure curve of Cylinder 4. (e) In-cylinder pressure curve of Cylinder 5. (f) In-cylinder pressure curve of Cylinder 6.
Processes 14 01705 g006
Figure 7. In-cylinder pressure curves under different fuel injection timings. (a) In-cylinder pressure curve of Cylinder 1. (b) In-cylinder pressure curve of Cylinder 2. (c) In-cylinder pressure curve of Cylinder 3. (d) In-cylinder pressure curve of Cylinder 4. (e) In-cylinder pressure curve of Cylinder 5. (f) In-cylinder pressure curve of Cylinder 6.
Processes 14 01705 g007
Figure 8. In-cylinder pressure curves under different ignition advance angles. (a) In-cylinder pressure curve of Cylinder 1. (b) In-cylinder pressure curve of Cylinder 2. (c) In-cylinder pressure curve of Cylinder 3. (d) In-cylinder pressure curve of Cylinder 4. (e) In-cylinder pressure curve of Cylinder 5. (f) In-cylinder pressure curve of Cylinder 6.
Processes 14 01705 g008
Table 1. Main parameters of the engine.
ParameterValueUnit
Engine speed1000r/min
Cylinder bore190mm
Number of cylinders12
Stroke230mm
Connecting rod length410mm
Compression ratio11
Table 2. Intake plenum parameters.
Parameter NameValue/mm
Inlet Diameter124.96
Outlet Diameter121.92
Length199.20
Discretization Length124.94
Table 3. Intake manifold parameters.
Parameter NameValue/mm
Inlet Diameter50.4
Outlet Diameter52
Length31
Discretization Length96.52
Table 4. Cylinder parameter settings.
PropertiesObject Status
Wall temperature defined by reference objectWall surface temperature (Twall)
Wall temperature defined by FEA structural componentNo
Flow domainFlow
Combustion domainEngine Combustion Cycle Properties
Heat transfer domainhtr
Piston initial temperature290 K
Cylinder initial wall temperature290 K
Table 6. IMEP under different air–fuel ratios ( λ ).
λ Cylinder IMEP (bar)Fluctuation
Cylinder 1 Cylinder 2 Cylinder 3 Cylinder 4 Cylinder 5 Cylinder 6
1.013.187.482.9110.8819.749.4453.42%
1.314.5637.3032.53610.64820.3759.83456.27%
1.615.2677.1522.2110.1219.009.96355.75%
2.215.1366.8511.659.27716.489.80355.23%
Table 7. Peak pressure under different air–fuel ratios ( λ ).
λ Cylinder Peak Pressure (bar)Fluctuation
Cylinder 1 Cylinder 2 Cylinder 3 Cylinder 4 Cylinder 5 Cylinder 6
1.074.8869.2025.4480.79132.6668.3445.64%
1.384.9159.0524.2470.22139.6271.8850.39%
1.690.4651.8823.0962.70131.3877.8750.51%
2.291.2244.4021.3555.26113.9879.0649.86%
Table 8. IMEP under different fuel injection timings (FITs).
FITCylinder IMEP (bar)Fluctuation
Cylinder 1 Cylinder 2 Cylinder 3 Cylinder 4 Cylinder 5 Cylinder 6
260° CA BTDC8.8910.6762.1016.0610.45811.3445.70%
270° CA BTDC8.81910.682.09116.06410.47711.45945.81%
280° CA BTDC8.5827.6561.3314.107.2312.4552.43%
Table 9. Peak pressure under different fuel injection timings (FITs).
FITCylinder Peak Pressure (bar)Fluctuation
Cylinder 1 Cylinder 2 Cylinder 3 Cylinder 4 Cylinder 5 Cylinder 6
260° CA BTDC69.7773.5730.45119.6881.3675.3337.94%
270° CA BTDC69.8373.4630.38119.5681.4271.1138.35%
280° CA BTDC69.8873.469.38104.6041.1670.9452.83%
Table 10. IMEP under different ignition advance angles (IAAs).
IAACylinder IMEP (bar)Fluctuation
Cylinder 1 Cylinder 2 Cylinder 3 Cylinder 4 Cylinder 5 Cylinder 6
10° CA BTDC13.167.472.89910.85719.719.8153.00%
8° CA BTDC13.3957.312.86410.65419.689.62953.74%
6° CA BTDC13.6567.1852.8410.4719.639.64854.12%
Table 11. Peak pressure under different ignition advance angles (IAAs).
IAACylinder Peak Pressure (bar)Fluctuation
Cylinder 1 Cylinder 2 Cylinder 3 Cylinder 4 Cylinder 5 Cylinder 6
10° CA BTDC74.8869.1925.4480.79132.6571.8845.13%
8° CA BTDC76.2964.7425.0375.46134.3668.3247.44%
6° CA BTDC77.7960.4324.1770.35135.9972.4049.19%
Disclaimer/Publisher’s Note: The statements, opinions and data contained in all publications are solely those of the individual author(s) and contributor(s) and not of MDPI and/or the editor(s). MDPI and/or the editor(s) disclaim responsibility for any injury to people or property resulting from any ideas, methods, instructions or products referred to in the content.