Article

Comparative Study of Batch and Continuous Lubricant Supply Strategies in Internal Combustion Engines

by
Saúl Domínguez-García
1,
Maximino Pérez-López
1,
Andrés López-Velázquez
2,
Marco Antonio Espinosa-Medina
1 and
Rafael Maya-Yescas
3,*
1
Facultad de Ingeniería Mecánica, Universidad Michoacana de San Nicolás de Hidalgo, Morelia 58030, Michoacán de Ocampo, Mexico
2
Facultad de Ingeniería Mecánico-Eléctrica, Universidad Veracruzana, Xalapa de Enríquez 91000, Veracruz de Llave, Mexico
3
Facultad de Ingeniería Química, Universidad Michoacana de San Nicolás de Hidalgo, Morelia 58030, Michoacán de Ocampo, Mexico
*
Author to whom correspondence should be addressed.
Processes 2026, 14(7), 1155; https://doi.org/10.3390/pr14071155
Submission received: 12 January 2026 / Revised: 24 March 2026 / Accepted: 31 March 2026 / Published: 3 April 2026
(This article belongs to the Special Issue Advances in Alternative Fuel Engines and Combustion Technology)

Abstract

This study presents a comparative analysis of batch and continuous lubricant supply strategies in internal combustion engines (ICEs), focusing on precursor consumption and material efficiency. A phenomenological model based on mass balance equations was developed to describe the dynamics of lubricant precursor depletion, film formation, and film removal under both supply strategies. The results demonstrate that the continuous supply strategy achieves a steady-state condition that ensures stable film thickness and a significant reduction in precursor consumption compared with the batch strategy. Sensitivity analyses reveal that both the kinetic constant and the film removal rate strongly influence lubricant make-up requirements, defining a feasibility region for system operation. Under supercritical conditions, the batch strategy exhibits rapid precursor overconsumption; in contrast, the continuous strategy maintains minimal excess. The proposed framework provides a system-level tool for evaluating lubrication strategies based on precursor utilization efficiency. The findings suggest that continuous lubrication strategies can improve material efficiency and environmental performance, with associated economic benefits, when properly designed and operated within feasible kinetic and mechanical limits.

1. Introduction

Internal combustion engines (ICEs) remain as one of the most widely used technologies for mobility and emergency electricity generation worldwide. Despite the growing shift in investment and policy towards electric mobility [1], the global fleet of ICE vehicles is still immense, and several projections even suggest that their production will continue for the upcoming decades [2,3,4]. In this scenario, improving the efficiency and sustainability of ICEs remains essential to meeting global mobility demand.
Among the key systems in ICEs, lubrication processes play a fundamental role in controlling friction and wear. There are previous studies that highlighted the enormous amounts of energy losses, economic costs, and pollutant emissions directly related to friction and wear, as tribological phenomena, in ICE [5,6]. Therefore, even small improvements in lubrication management can provoke significant economic and environmental impacts.
Conventional ICE lubrication operates within two limiting regimes, hydrodynamic and boundary lubrication. In the first one, surfaces are separated preventing direct contact and ensuring protection. In the second one, boundary lubrication provides the last line of defense against friction and wear. This regime is governed by complex physicochemical and mechanical interactions that lead to the formation of a protective solid film between surfaces [7,8,9,10]. This interaction establishes a coupling between mechanical operating variables, determined by engine performance, and chemical variables, strongly influenced by lubricant formulation and replacement strategy.
Recent experimental and modeling studies have also emphasized the importance of additive depletion dynamics and tribofilm stability in determining lubricant performance and durability in modern engine lubrication systems [11,12,13,14,15,16].
In batch lubrication systems, selecting the optimal lubricant formulation and determining the most efficient replacement intervals is challenging, even when guided by manufacturer recommendations. Furthermore, the material efficiency of lubrication use is not only defined by purchase cost, but also by the rate of consumption, the supply strategy, and the excess of lubricant precursors required to maintain adequate protection [17,18].
Current internal combustion engine lubrication practice is predominantly based on batch or quasi-batch oil replacement, in which lubricant properties are periodically restored at discrete intervals. While effective for lubricant renewal, this approach is associated with increased lubricant consumption, material waste, and energy loss [5,6], as well as temporal fluctuations in film stability [7,10]. Continuous lubrication strategies, although less common in engine applications, have been explored in other tribological systems to stabilize lubricant supply and reduce material usage. However, quantitative comparisons between batch and continuous lubrication strategies under comparable operating conditions remain limited [17,18].
This work addresses this gap by analyzing the material efficiency of lubrication consumption in ICE lubrication systems from a phenomenological perspective. The analysis builds upon a previously developed tribokinetic mass-balance framework describing tribofilm precursor depletion and film dynamics. In the present study, this framework is extended to compare batch and continuous lubricant supply strategies, introducing a continuous make-up flow and steady-state analysis to identify operational regimes in which lubricant precursor utilization can be improved while maintaining tribofilm stability.

2. Methodology

A mathematical model describing lubricant depletion under batch and continuous supply conditions is used as the basis for the subsequent material efficiency comparison. The formulation builds upon a tribokinetic mass-balance framework previously developed for tribofilm dynamics and is here extended to analyze lubrication supply strategies and steady-state operating regimes.

2.1. The Physical System

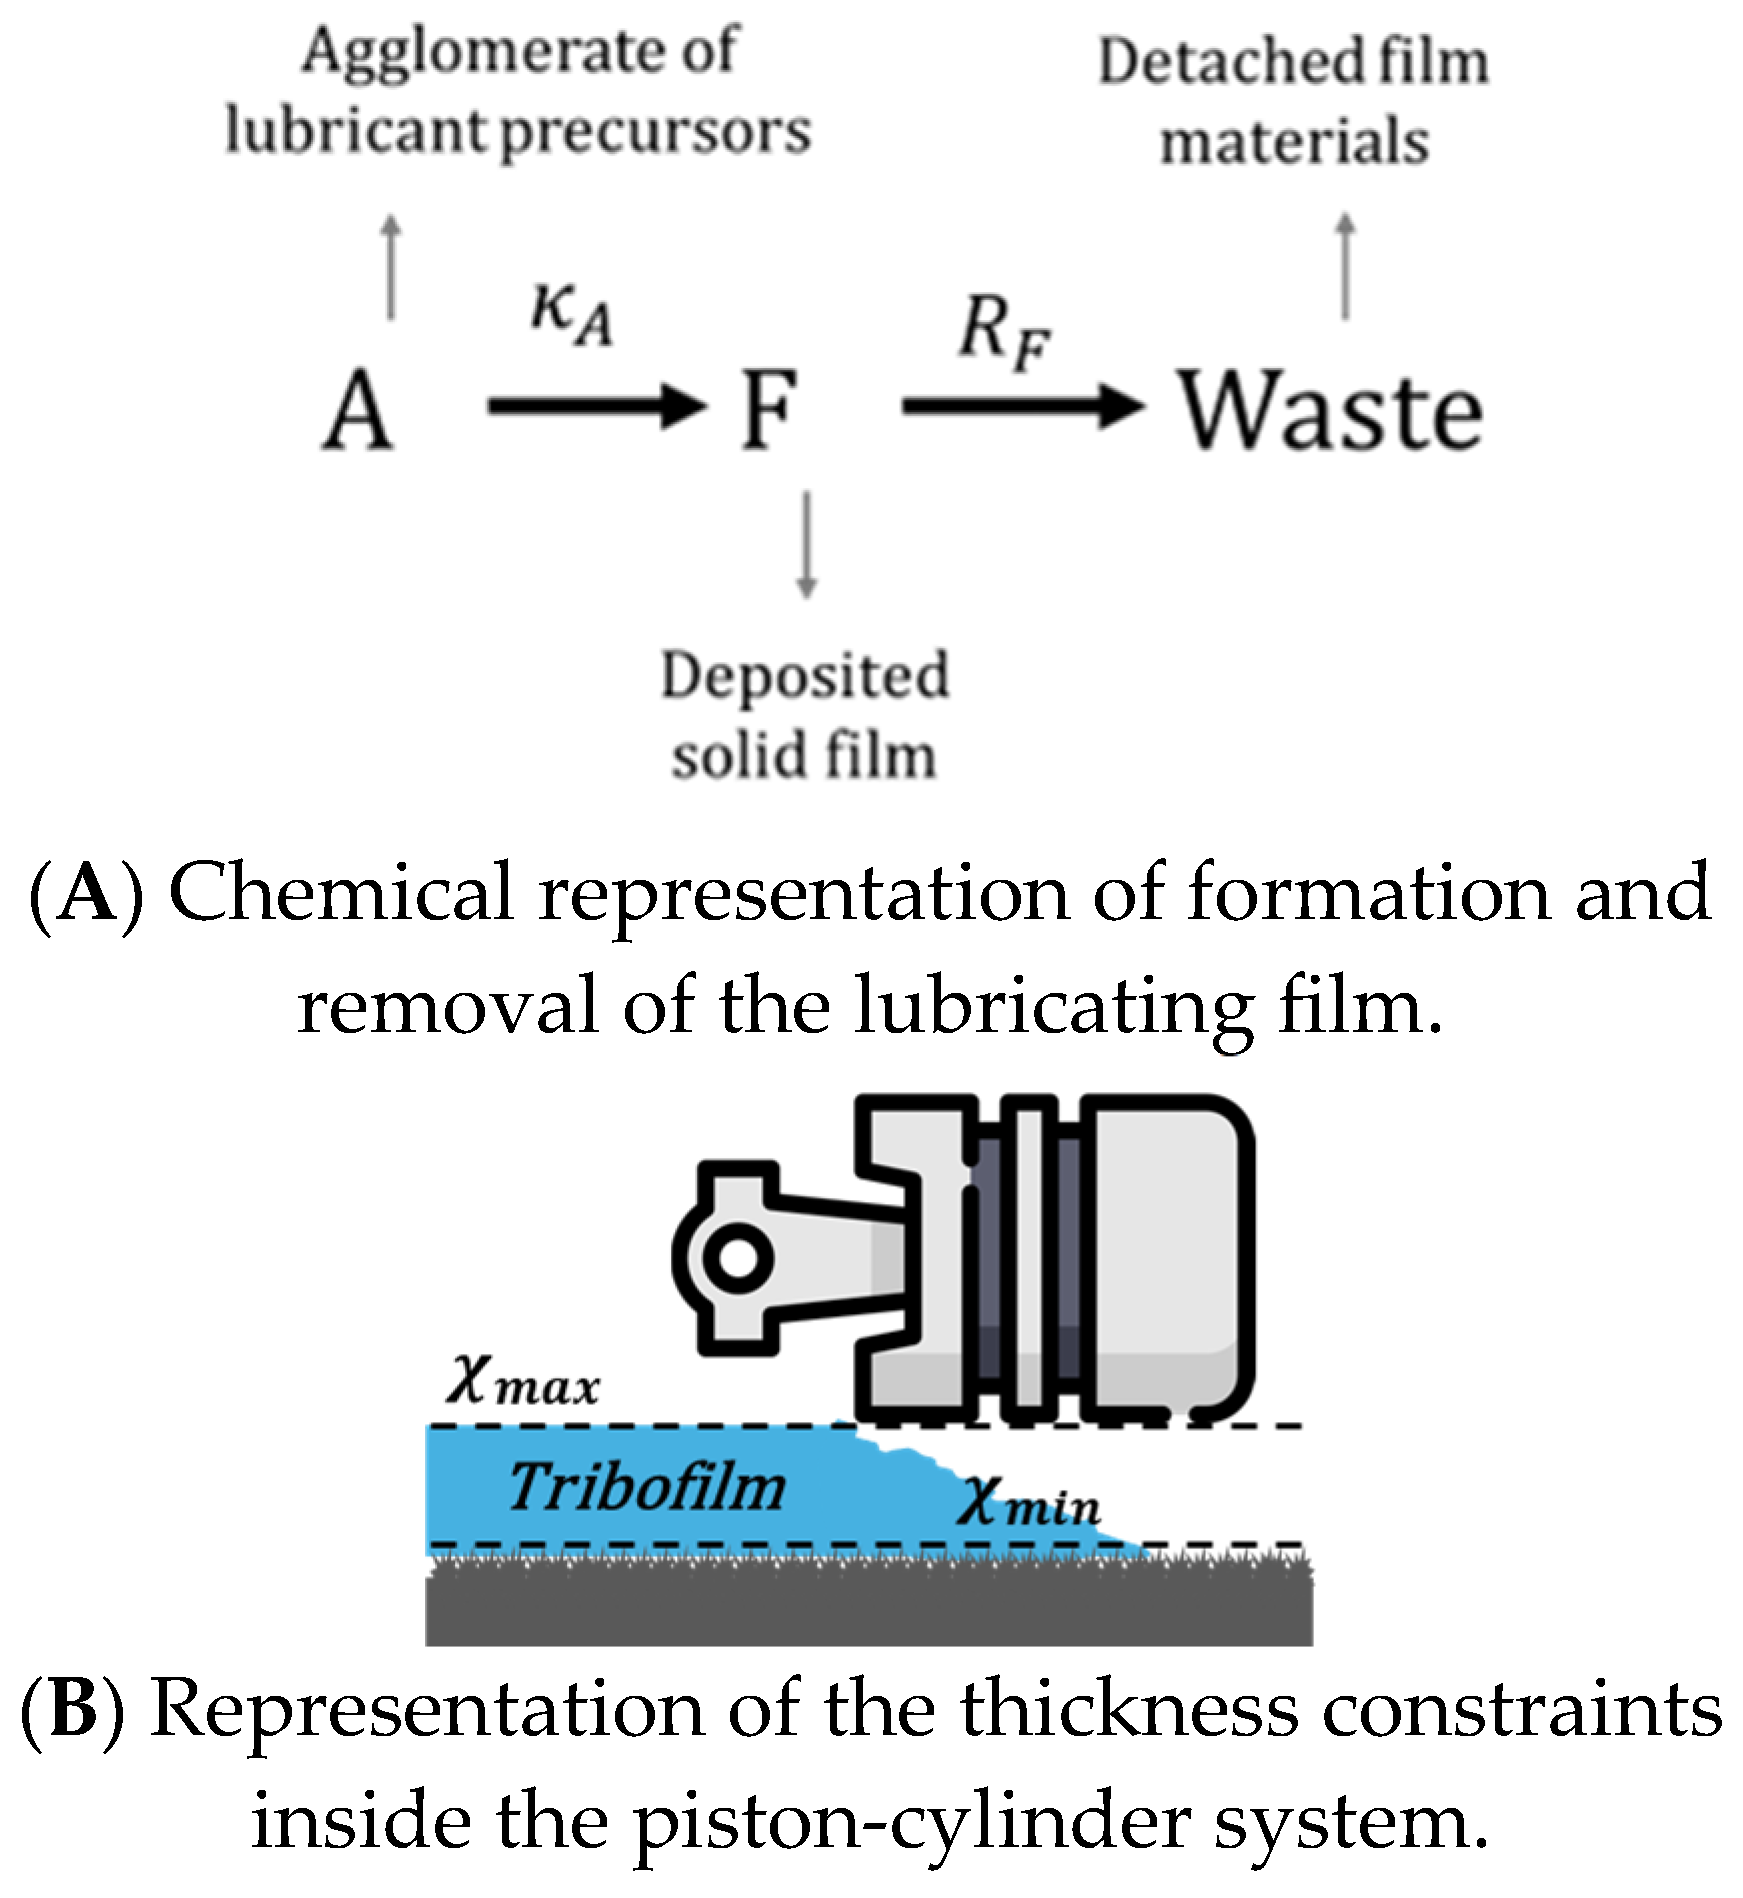
Firstly, liquid lubricants bring molecules of lubricant precursors inside the piston-cylinder system (Figure 1A). The variety of additives contained in the lubricant formula [8,17,18] is conceived as the agglomerate ‘A’, which adsorbs on both surfaces [8,9]. Secondly, deposited molecules chemically react to form a solid film, called ‘F’, which is microstructurally modified by mechanical contacts [8,9]. If the strength over this film is large enough, then it is detached from the surfaces and, simultaneously, it is renovated by chemical reactions [9]. It is assumed that detached film materials (waste) cannot regenerate the film [9]. A kinetic representation of formation and removal of the lubricating film is described ahead. As consequence of the competition between formation and removal of the lubricant film inside ICEs, some amount of film is accumulated between the surfaces. This film thickness is constrained between two practical limits; the minimum thickness (χmin) required to avoid direct contact of the surface roughness, and the maximum thickness (χmax) of separation between the shearing surfaces [17], (Figure 1B).
Although the present physical description does not explicitly distinguish between commercial lubricant brands or specific formulations, variations in lubricant composition can influence the lubrication system through their physicochemical properties. Differences in additive chemistry, concentration, and base oil characteristics affect the availability of active precursors, the kinetics of tribofilm formation, and the resistance of the deposited film to mechanical removal. Within the proposed framework, these formulation-dependent effects are implicitly captured through the model parameters, allowing different lubricant types to be represented by distinct operating conditions within the same physical system.
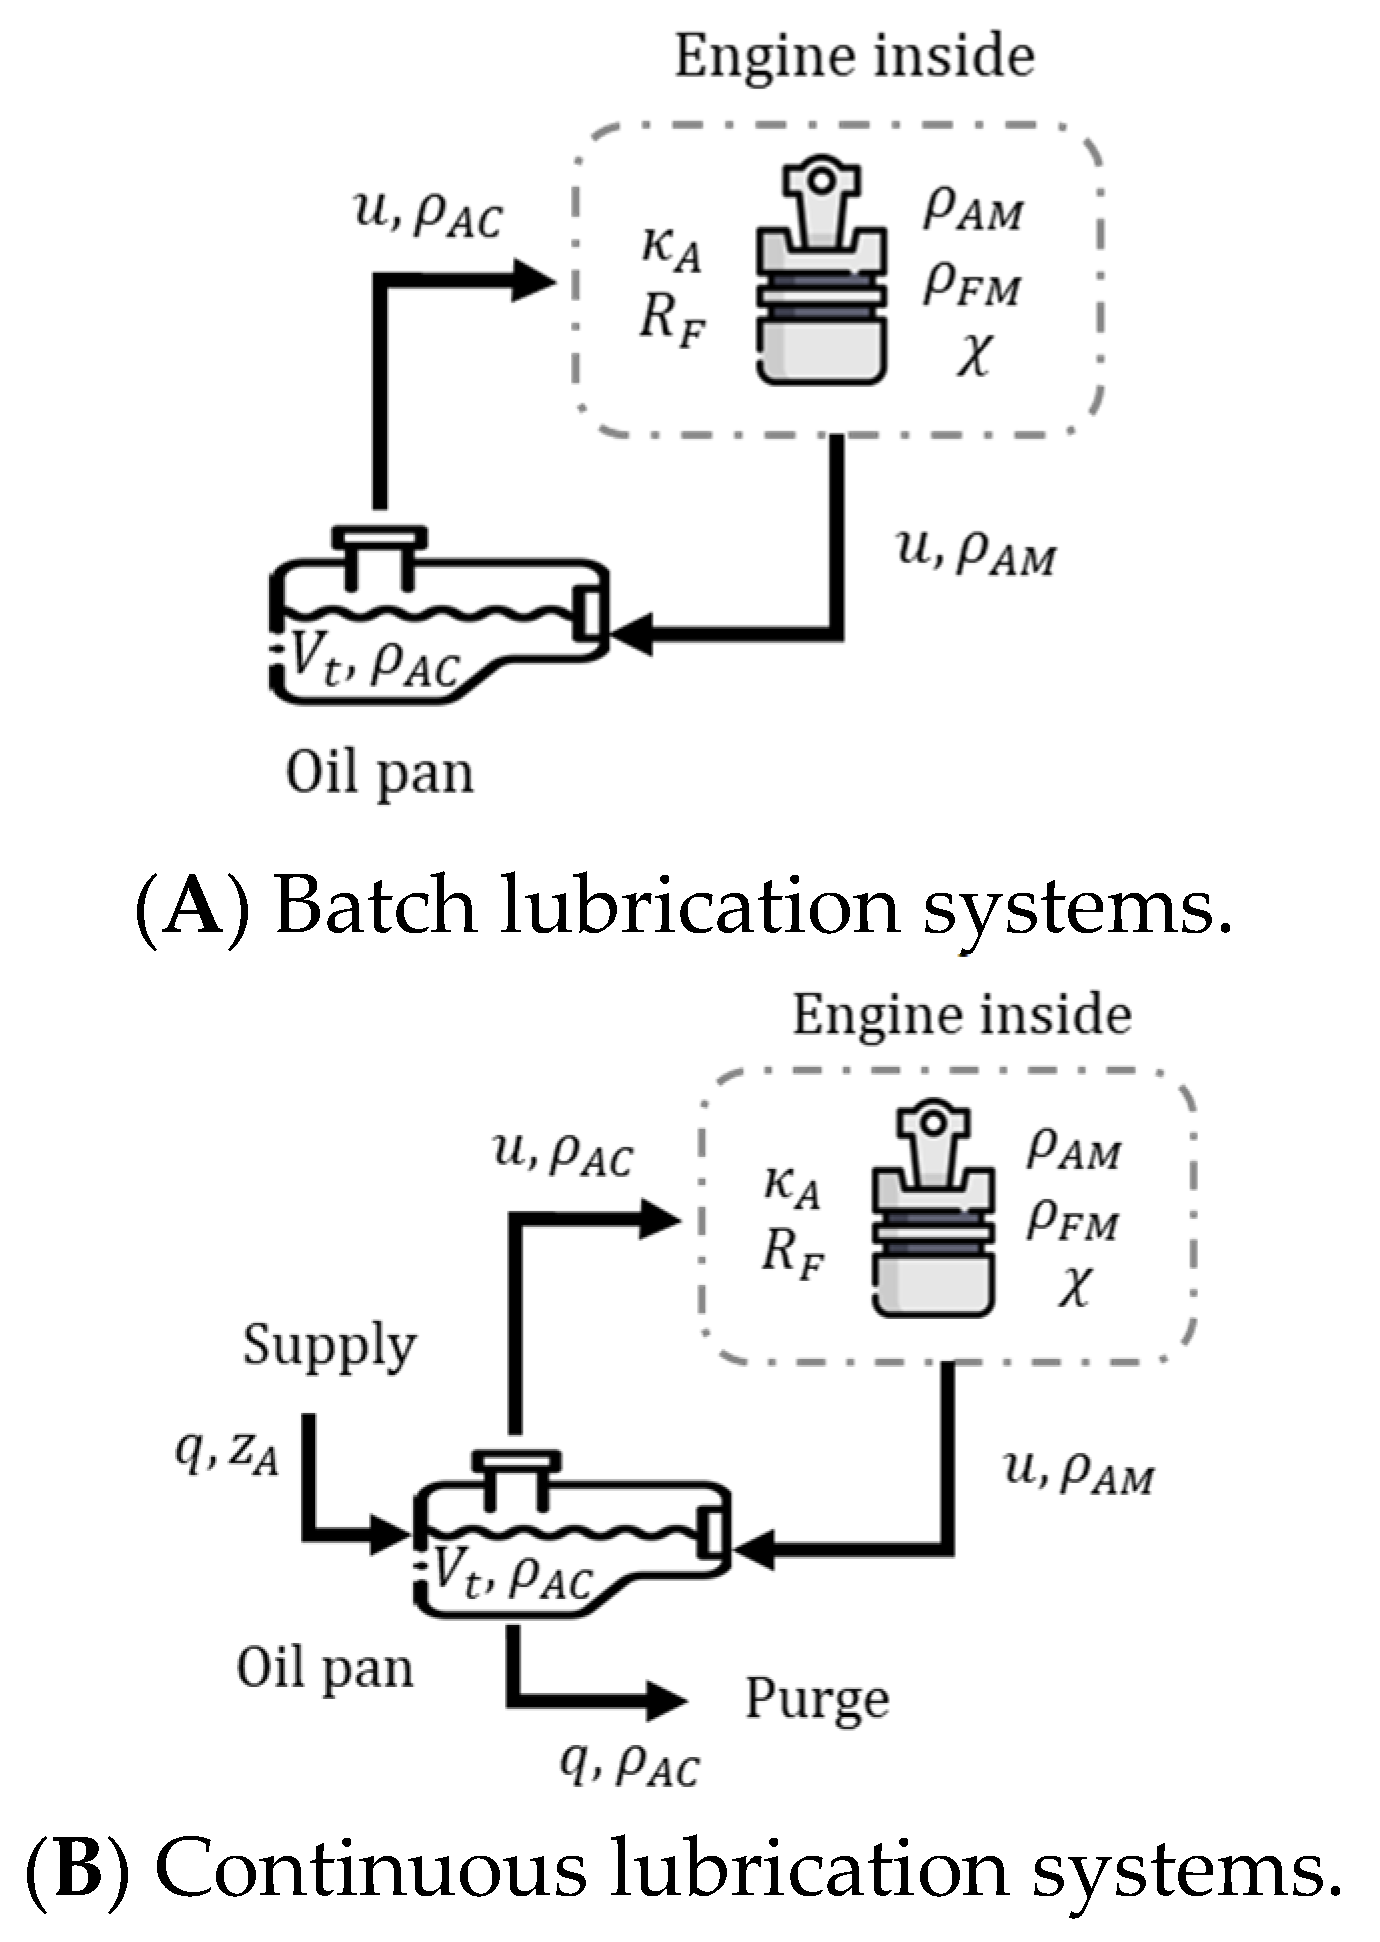
Commonly, batch lubrication systems for ICEs store a volume of working lubricant in a vessel called ‘oil pan’. Then, a lubricant flow is filtered, circulated through the engine, and then returns to the oil pan (Figure 2A). This recirculation gradually depletes the lubricant’s properties and defines its service lifetime. In contrast, continuous lubrication systems also circulate lubricant flows between the oil pan and the engine inside. However, in this strategy, a fresh lubricant flow is supplied while a corresponding purge is discharged from the oil pan preventing the total depletion of the lubricant precursors (Figure 2B).
The mathematical model describing the variation in lubricant precursors available for film renewal is based on macroscopic mass balances that quantify accumulation, input, output, generation, and consumption of lubricant precursors within two coupled control volumes: the oil sump and the engine interior [17,18]. From a chemical reaction engineering perspective, the oil sump can be interpreted as a well-mixed reservoir (batch or continuous stirred tank, depending on the supply strategy), while the engine interior behaves as a flow-through reactive zone where precursor consumption and tribofilm formation occur. The model formulation for both supply strategies, batch and continuous, analyzed in this article is presented below.
The proposed framework applies to spark–ignition and compression–ignition internal combustion engines operating under steady or quasi-steady conditions, where lubrication behavior is dominated by hydrodynamic and mixed-lubrication regimes. The lubricant is modeled as a generic Newtonian engine oil with properties typical of conventional mineral and synthetic lubricants, and although engine displacement and oil capacity are not explicitly parameterized, the analysis focuses on lubrication strategy and film stability, allowing extension to different engine sizes and system capacities under comparable operating assumptions.
It is important to note that the present model focuses on the depletion dynamics of tribofilm precursors and does not explicitly account for additional lubricant degradation mechanisms commonly observed in real engines, such as oxidation, soot contamination, viscosity increase, or depletion of detergent and dispersant additives. These physicochemical processes may influence lubricant lifetime and film stability under practical operating conditions. Nevertheless, the simplified framework adopted here allows isolating the influence of tribofilm precursor dynamics on lubrication strategy performance, providing a tractable system-level framework for comparing lubricant supply strategies. The incorporation of additional degradation pathways represents a natural extension of the model for future work.
The proposed tribokinetic framework is based on several simplifying assumptions. The lubricant is treated as a homogeneous Newtonian fluid, and the variety of chemical additives is represented as a single agglomerated precursor species. Film formation and removal are described using lumped kinetic expressions, without explicitly resolving molecular-scale mechanisms or surface heterogeneities. The oil pan is assumed to behave as a well-mixed reservoir, while the engine interior is modeled as a flow-through reactive zone. Additionally, mechanical and physicochemical degradation processes such as oxidation, soot contamination, and viscosity changes are not explicitly considered. These assumptions allow the formulation of a tractable system-level model focused on precursor depletion and tribofilm dynamics.

2.2. Reserve of Lubricant Precursors in the Oil Pan

The reserve of precursors A in the oil pan is described by a mass balance equation. For batch supply, it is expressed by Equation (1), and for continuous supply by Equation (2).
V C d ρ A C d t = u ρ A M ρ A C + q z A ρ A C
V C d ρ A C d t = u ρ A M ρ A C
Here, V C is the control volume within the oil pan; ρ A C is the partial density of precursors A inside the oil pan; ρ A M is the partial density of precursors A inside the engine; u is the volumetric flow rate between the oil pan and the engine interior; q is the volumetric flow rate of fresh lubricant and of purge; and z A is the concentration of precursors A in the fresh lubricant. The only difference between the mathematical models describing batch and continuous lubrication strategies lies in Equations (1) and (2). All other mass balances, constraints, and initial conditions are formulated here and are consistent with established lubrication mass-balance approaches [17,18].

2.3. Concentration of Lubricant Precursors Inside the Engine

The concentration of precursor A inside of the engine is obtained from a mass balance over the volume of lubricant flowing through the engine (Equation (3)).
V M d ρ A M d t = u ρ A C ρ A M κ A ρ A M
Here, V M is the control volume of the engine; ρ A M is the partial density of precursors A inside the engine; and κ A is the kinetic constant of the reaction of A inside the engine.

2.4. Deposited Lubricating Film Inside the Engine

The amount of lubricant film deposited inside the engine is obtained from a dynamic mass balance of the agglomerate F over the volume of lubricant flowing through (Equation (4)).
V M d ρ F M d t = σ   κ A ρ A M ς   R F
The growth (σ) and removal (ς) constraints are defined by (Equations (5) and (6)), respectively.
σ = 0 , χ χ m a x 1 , χ < χ m a x
ς = 1 , χ χ m i n χ χ m i n , χ < χ m i n
Here, ρ F M is the partial density of lubricant film inside the engine; σ is a growing constrain; ς is a removal constraint; and R F is the removal base rate.
The growing and removal constraints were defined, previously, by [17],: σ becomes zero once the maximum film thickness χ m a x is reached, deactivating further accumulation of F beyond the separation between shearing surfaces (Equation (5)); Conversely, ς is the ratio between the film thickness χ and the minimum thickness required to avoid the direct surface-to-surface contact. This ratio accounts for the slowing down effect on film removal caused by surface roughness interactions when χ < χ m i n (Equation (6)).

2.5. Thickness of the Lubricating Film

Following the mathematical relationship between the film mass F and the film thickness, it requires distributing the film volume over the contact surface [9,17,18]. Generally, this distribution of film volume is not uniform due to the surface asperities of the metallic substrate. The total film volume v M is estimated by (Equation (7)) by integrating its derivative with respect to the variation in film thickness χ (Equation (8)). Simultaneously, the definition of the film mass m F M is generated (Equation (9)).
v M = m F M ϱ F
d v M d χ = A R ς
m F M = ρ F M V M
Here, ϱ F is the actual density of the deposited film, and A R is the internal surface of the engine.
Combining Equations (6)–(9), an analytical solution for film thickness as a function of the film accumulated (Equation (10)) is obtained.
χ = χ m i n + V M ϱ F A R ρ F M ρ F M m i n , ρ F M ρ F M m i n χ m i n ρ F M ρ F M m i n 1 / 2 , ρ F M < ρ F M m i n
Here, ρ F M m i n is the partial density of film required to cover the surface asperities up to χ m i n , setting the minimum operational thickness. An alternative derivation of (Equations (6)–(9)), by definite integration, yields ρ F M m i n as a function of ϱ F , A R , V M , and χ m i n (Equation (11)).
ρ F M m i n = ϱ F A R χ m i n 2   V M

2.6. Lifetime of Each Lubricant Fill

In the batch supply strategy, each lubricant volume protects the engine only for a limited operating period, denoted as τ (Equation (12)). This interval ends when the film thickness decreases up to the critical thickness χ m i n . Beyond this point, surface asperity interactions intensify, leading to wear and damage [17].
τ = t χ m i n

2.7. Critical Supplying Rate of Lubricant for the Batch System

The total lubricant volume consumed per batch ( V ) corresponds to the sum of the engine control volume ( V M ) and the oil pan control volume ( V C ) (Equation (13)). By combining (Equations (12) and (13)), the critical supplying rate ( s ) during an operation period τ can be estimated for the batch supply strategy (Equation (14)).
V = V M + V C
s = V τ

2.8. Critical Supplying Rate of Lubricant for the Continuous System

For the continuous supply strategy, the critical make-up rate required to maintain the film thickness above χ m i n is determined when the accumulation terms in the mass balance equations (Equations (1), (3) and (4)) vanish (Equation (15)). These conditions indicate that the film formation and depletion rates are equivalent, a state referred to as the equilibrium film.
d ρ A C d t = d ρ A M d t = d ρ F M d t = 0
The critical partial densities of precursors A in the oil pan ( ρ A C e ) and within the engine ( ρ A M e ), together with the minimum lubricant make-up rate ( q e ), required to form the equilibrium film that maintains the film thickness above χ m i n (for σ = ς = 1), are obtained by combining (Equations (1), (3), (4) and (15)) into an algebraic system (Equations (16)–(18)).
0 = u ρ A M e ρ A C e + q e z A ρ A C e
0 = u ρ A C e ρ A M e κ A ρ A M e
0 = κ A ρ A M R F
After straightforward algebraic manipulation, the model for the critical supplying rate yields the following expressions for the system at critical conditions, depending solely on the parameters κ A , R F , z A , and u , (Equations (19)–(21)).
ρ A C e = R F 1 κ A + 1 u
q e = 1 z A R F 1 κ A + 1 u
ρ A M e = R F κ A
Since in the continuous supply strategy, (Equations (19)–(21)) are independent of operating time, the precursor concentration ρ A M e can be maintained indefinitely. In contrast, under the batch strategy, ρ A M e is reached instantaneously, only once, at the end of the operating period τ .

2.9. Excess of Lubricant Precursors in Lubrication Systems

Once the equilibrium film condition has been established, real lubrication systems rarely operate exactly at this point. During practical operation, the precursor concentration in the oil pan ( ( ρ A C ) ) fluctuates due to cycles of lubricant replenishment and consumption. These deviations from the equilibrium concentration within the engine ( ( ρ A M e ) ) represent the “excess” of lubricant precursors temporarily available beyond the critical requirement for sustaining the film thickness.
To quantify this deviation, the instantaneous excess concentration can be defined as ( ( ρ A C ρ A M e ) ). Over the total operating period t of actual time, the accumulated or average deviation provides a measure of how much the system operates above the equilibrium demand. This allows defining a dimensionless “excess ratio” (Equation (22)) by normalizing the time-averaged deviation with respect to the maximum possible concentration difference z A ρ A M e .
%   ρ A C   E x c e s s = Δ t ρ A C ρ A M e z A ρ A M e t 100
Here, %   ρ A C   E x c e s s is the excess in consumed lubricant precursors; Δ t is the time step; and t is the total operating time. This expression provides a dimensionless indicator of how efficiently the lubricant precursors are utilized relative to the equilibrium condition.

2.10. Feasibility Limit of Actual Lubrication

In (Equation (20)), an implicit constraint of the continuous lubrication strategy emerges; if the value in the denominator becomes null or negative, the minimum make-up rate turns infinite or negative. Therefore, the continuous strategy is feasible only for certain values of κ A and R F . This condition (Equation (23)) defines the range for the parameter values that ensure physically meaningful make-up rates.
R F < z A 1 κ A + 1 u
In contrast, the batch strategy does not yield an explicit analytical restriction on the supply rates. However, parametric exploration of κ A and R F , shows that the same condition (Equation (23)) also governs the feasibility of batch lubrication systems. The demonstration of this affirmation is presented in the results section.

2.11. Supercritical Conditions of Lubrication Systems

Any non-critical operating condition can be analyzed by reducing the operation time ( t ) for the batch strategy; and by increasing make-up rate ( q ) for the continuous strategy. In both cases, the comparison criteria are the supplying rates s and q versus the excess of lubricant ( %   ρ A C   E x c e s s ) .
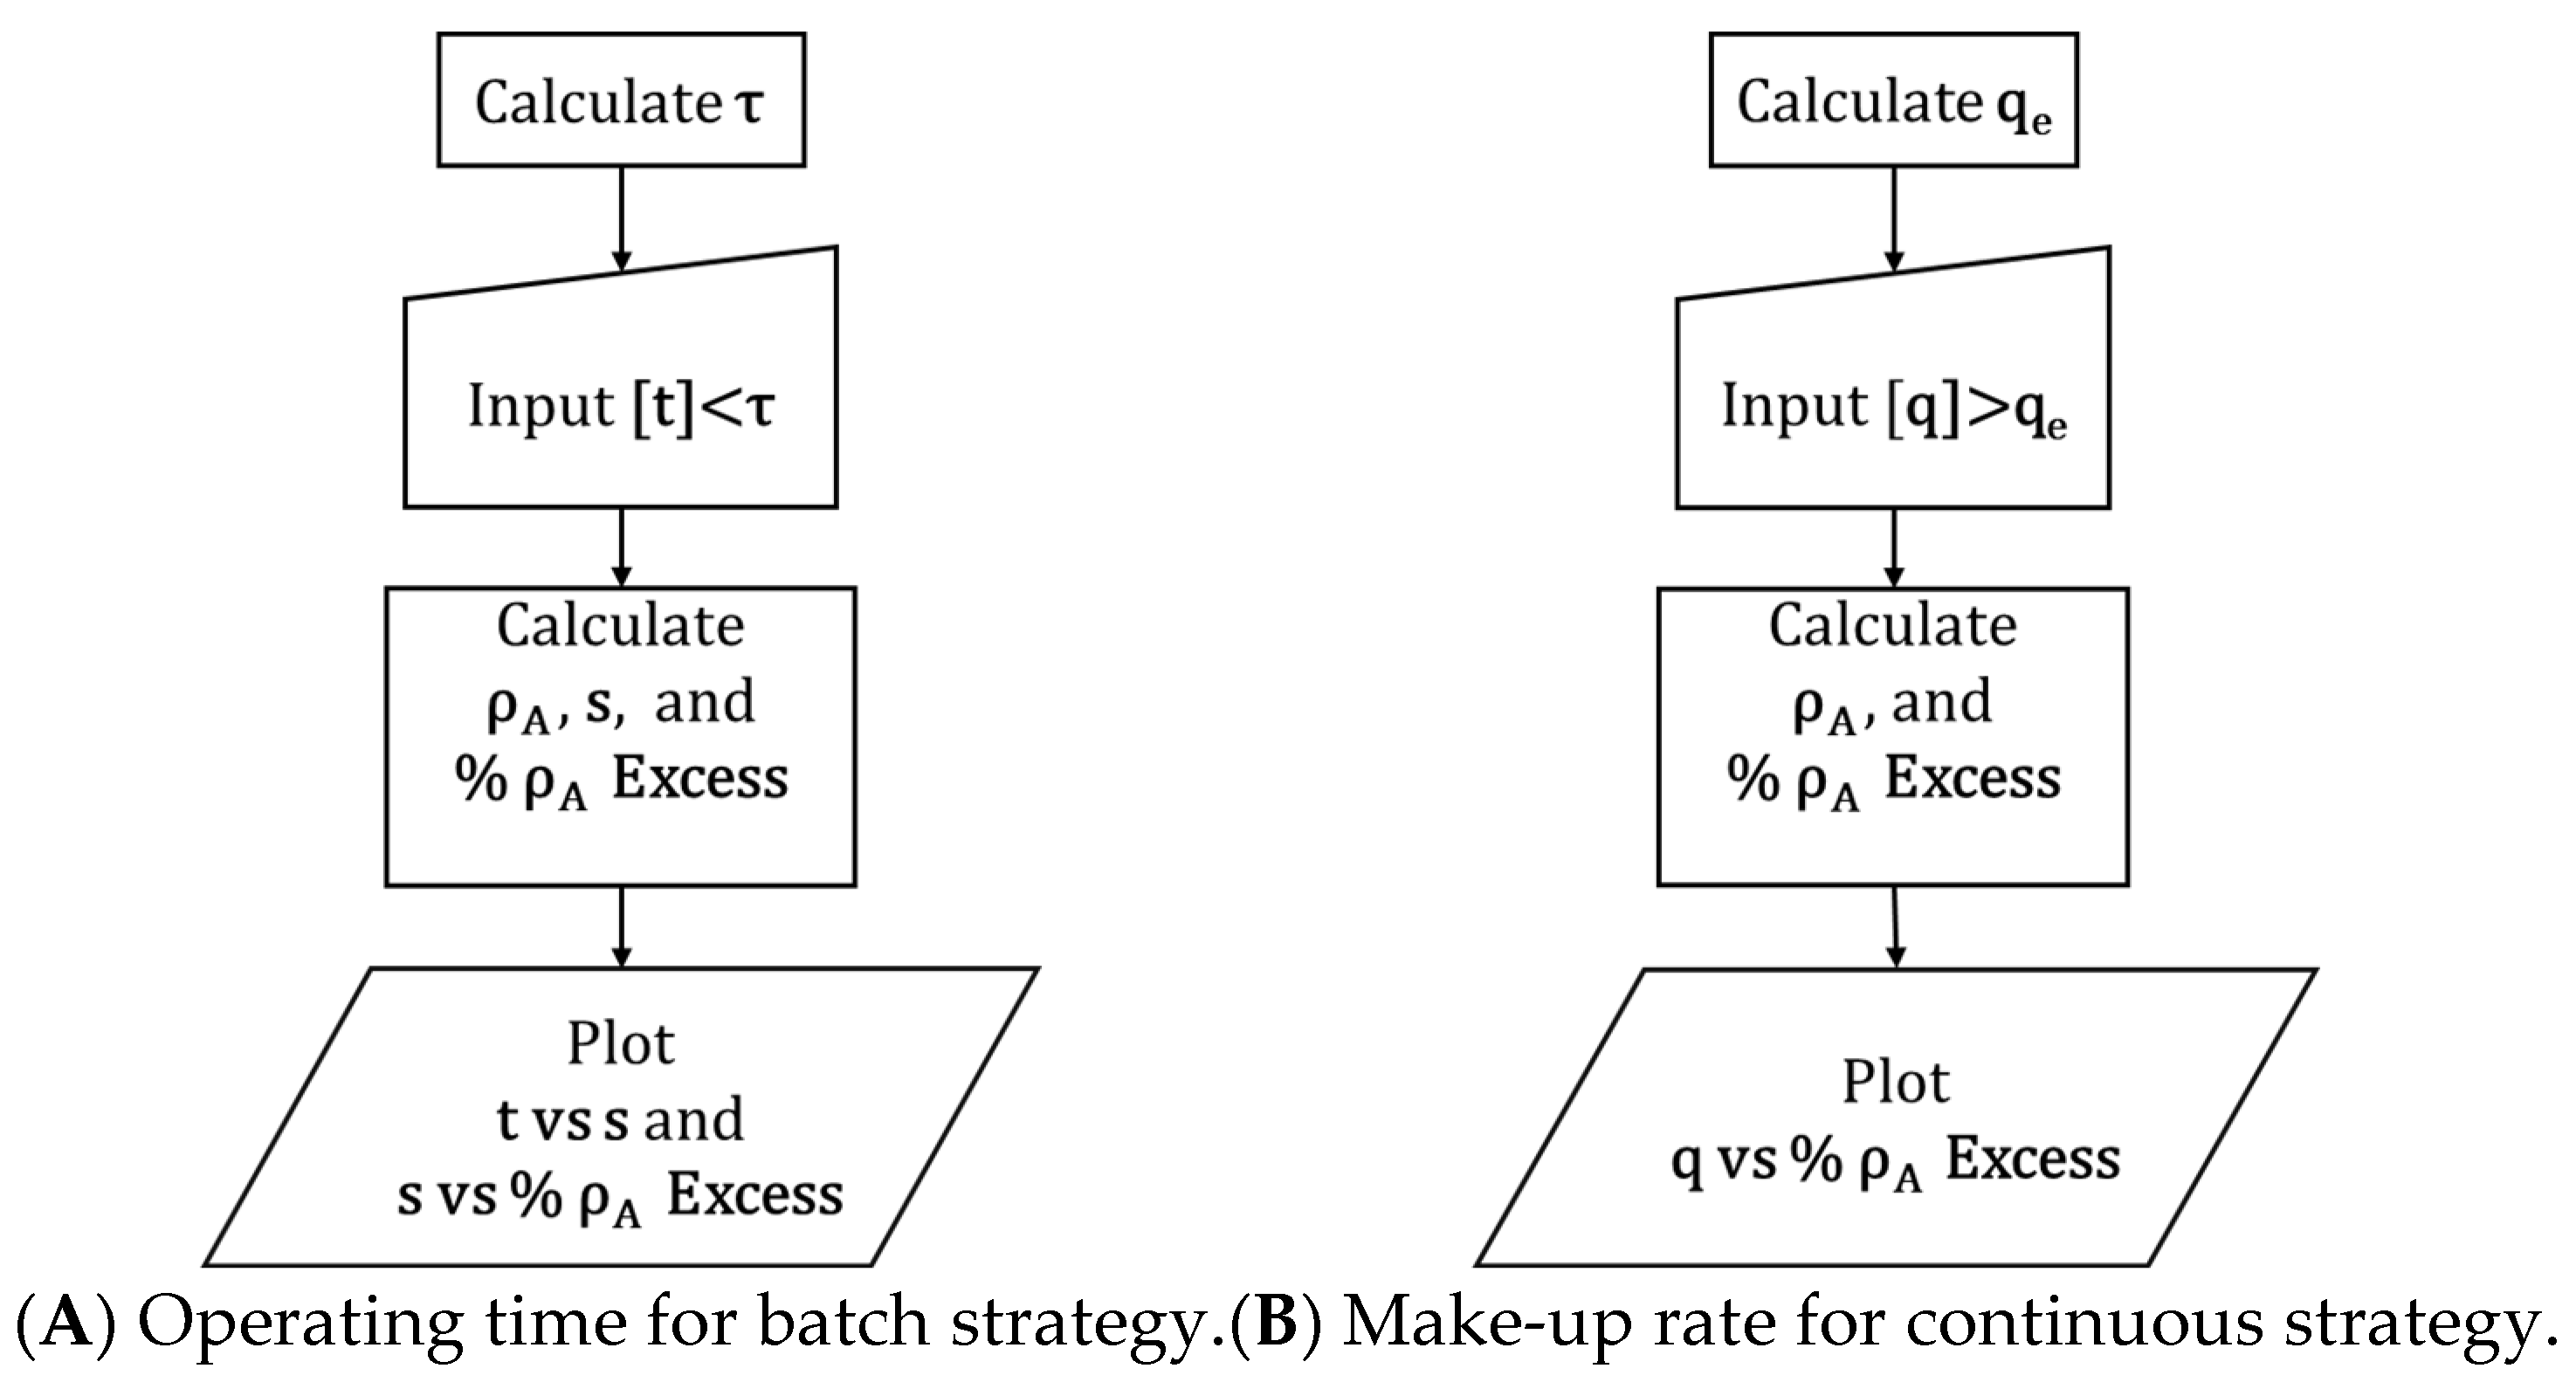
Two algorithms are proposed to obtain the supply rates versus the excess of lubricant. The computational solution allows the user to observe two lubrication strategies: Behavior of the batch system if operation time is reduced (Figure 3A), and behavior of the continuous system if lubricant make-up rate is increased (Figure 3B).

2.12. Simulations Design

Firstly, a detailed analysis of ρ A C , ρ A M , ρ F M , and χ was performed for base cases of both strategies: batch and continuous. The response of the base cases was calculated using κ A = 6.40 × 10 5   L / s , and R F = 1.92 × 10 5   g / s as kinetic parameters, ϱ F = 0.8   g / c m 3 and z A = 40   g / L as lubricant properties, and the parameters in Table 1 as system sizing and initial conditions. Subsequently, the mathematical models (Equations (1)–(11)) were simulated to compare the performance of both ICE lubrication strategies.
The selected parameter values were chosen to be representative of typical lubrication system sizes, operating conditions, and kinetic parameters reported in the literature [17,18], providing a consistent baseline for the comparative analysis between batch and continuous supply strategies rather than representing a specific engine or lubricant formulation. Accordingly, the scope of the present study is methodological and scalable, and its applicability is not limited to a particular commercial engine model.
After the analysis of the base cases, a study on the sensitivity of the critical supply rates s ( τ ) and q e to variation on κ A and R F is developed. This time, the target is to observe how the variation on kinetic parameters modifies the critical supply rates of lubricant for both lubrication strategies (Equations (14) and (20)). The parameters’ space considered for the analysis was defined as κ A [ 10 6 , 10 3 ] and R F [ 10 6 , 10 3 ] .
The final part of this study focuses on analyzing the behavior of the two lubrication strategies under supercritical supply rates, defined as supply rates exceeding the minimum lubricant make-up required to maintain adequate film thickness. This analysis is conducted by applying the computational procedures outlined in Figure 3, using the base-case conditions listed in Table 1. The values employed to calculate the supercritical supply rates for the batch strategy (Equation (14)), as well as the corresponding excess lubricant consumption, expressed as %   ρ A C   E x c e s s (Equation (20)) for both strategies, are summarized in Table 2.

3. Results

The data analyzed in this work were obtained by numerically solving the mass balance equations (Equations (1)–(11)). The complete numerical solution was implemented using a student version of MATLAB R2022b (MathWorks Inc., Natick, MA, USA). The governing equations were solved using a fourth-order Runge–Kutta time-integration scheme. Since the solution is obtained through direct time integration rather than an iterative procedure, no residual-based convergence criterion is required; instead, numerical accuracy is controlled through time-step selection.

3.1. The Behavior of the Base Cases for Both Lubrication Strategies

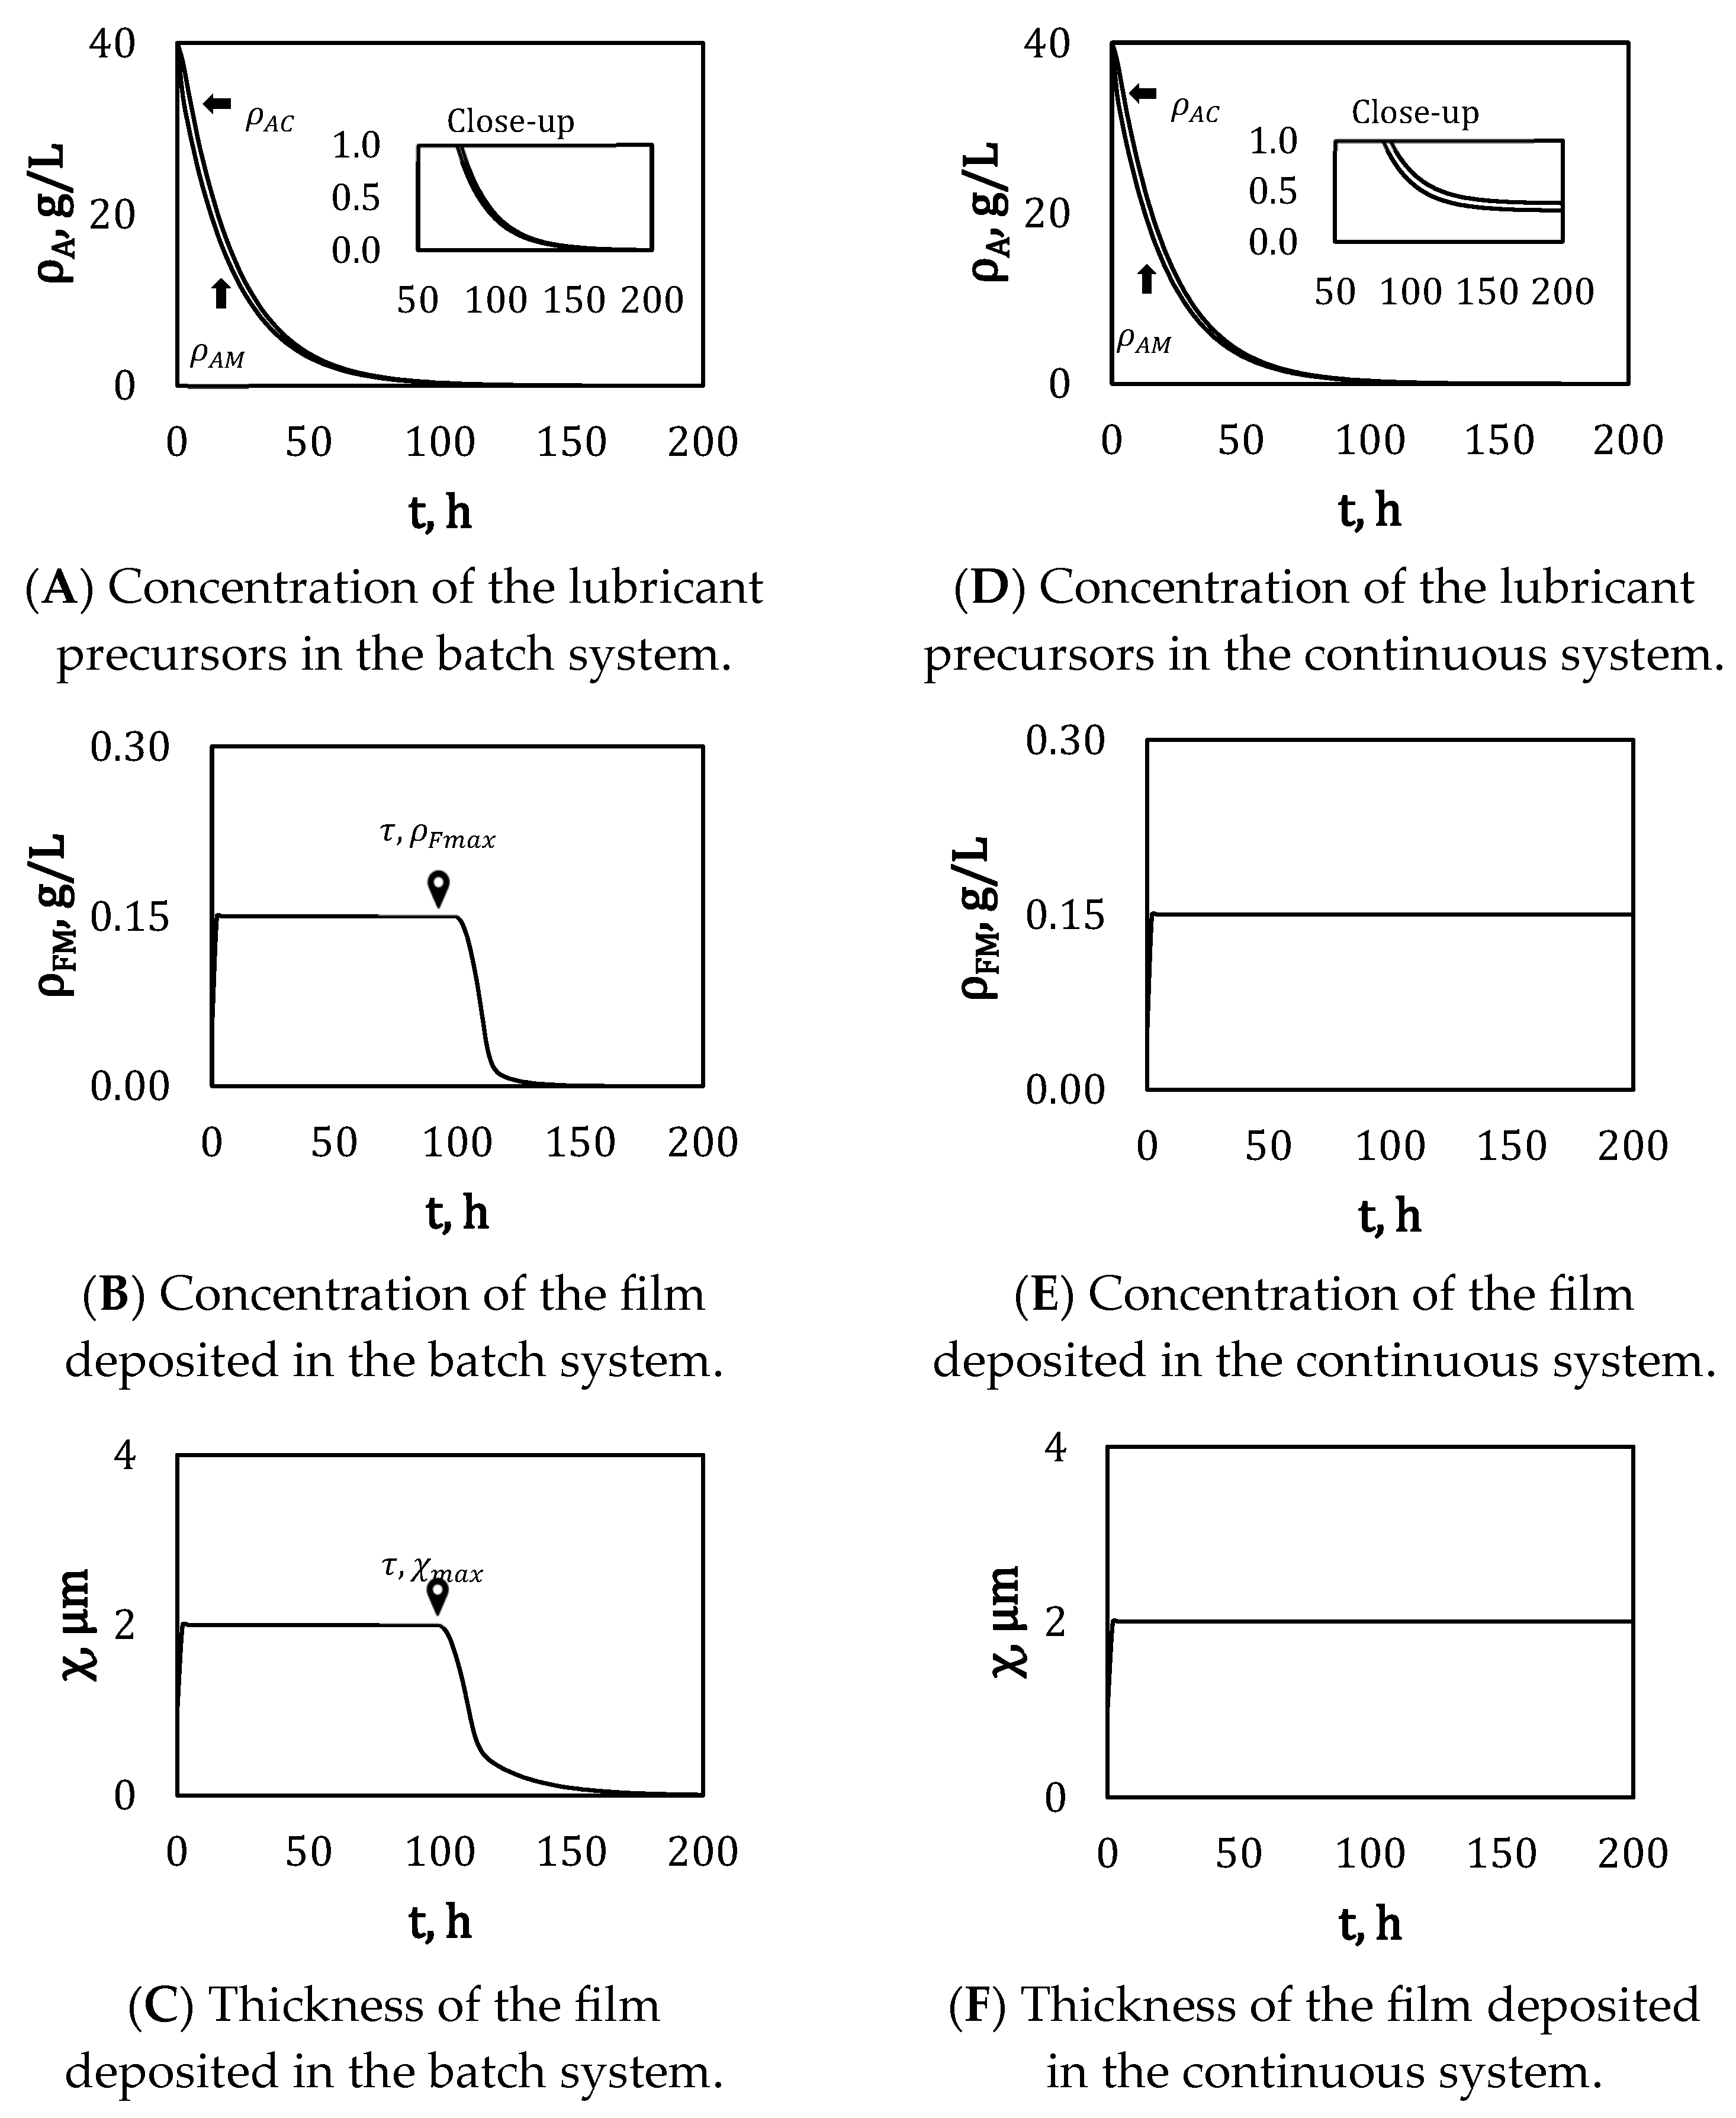
For the batch strategy, the reserve of lubricant precursors within the oil pan and inside the engine decreases as the operation time increases (Figure 4A). At the beginning of the simulation, both partial densities, ρ A C and ρ A M , exhibit the same value z A = 40   g / L . However, the concentration of lubricant precursors tends toward zero by the end of the simulation (200 h). During the initial simulated hours, a gap appears between the precursor concentrations in the oil pan and inside the engine, but a close-up of both profiles shows their convergence toward zero in the final hours of the simulation (Figure 4A).
The partial density of the lubricating film accumulated inside the engine increases rapidly up to approximately 0.15 g/L and remains stable until 100 h of simulation (Figure 4B). This period corresponds to the limited operating time τ for the base case. After this τ , the accumulated film progressively decreases to zero by the end of the simulation (Figure 4B). Similarly, the film thickness remains stable at χ m a x = 2   μ m only during the limited operating time τ , after which it gradually decreases to zero (Figure 4C).
For the continuous strategy, the reserve of lubricant precursors within the oil pan and inside the engine also decreases as the operation time increases (Figure 4D). At the beginning of the simulation, both partial densities, ρ A C and ρ A M , exhibit the same initial value z A = 40   g / L . However, the concentrations of lubricant precursors tend toward stable partial densities by the end of the simulation. During the initial hours, a gap appears between the precursor concentrations in the oil pan and inside the engine, but a close-up of both profiles shows their convergence toward approximately ρ A C e = 0.4   g / L and ρ A M e = 0.3   g / L for the final simulated hours (Figure 4D).
For the continuous strategy, the partial density of the lubricating film accumulated inside the engine increases rapidly up to approximately 0.15 g/L and remains stable until the end of the simulation (Figure 4E). Similarly, the film thickness remains constant at χ m a x = 2   μ m throughout the entire simulation period (Figure 4F).
In the batch strategy, the lubricant—comprising both, V C plus V M , must be completely replaced every 100 h of operation time to maintain the film thickness at appropriate levels. Conversely, the continuous strategy does not require replacement of the total lubricant volume in the system; instead, it sustains a constant lubricant flow q e = 5.05   ×   10 5 L / s to preserve the film thickness within the desired range. Despite these operational differences, both strategies can fulfill the lubrication requirements.
The sudden drop in film thickness and precursor concentration observed in Figure 4B,C arises from the simplified treatment of film removal kinetics, which is modeled independently of tribofilm mechanical properties and contact conditions. Under these assumptions, when removal kinetics transiently dominate over formation, the model predicts a rapid collapse toward the minimum film thickness. In real lubrication systems, film degradation is often more gradual due to the coupling between mechanical response, contact conditions, and removal mechanisms. This simplification therefore constitutes a limitation of the present model and motivates future extensions incorporating mechanically coupled removal processes.

3.2. Comparison of the Lubricant Consumption for Both Strategies at the Base Case

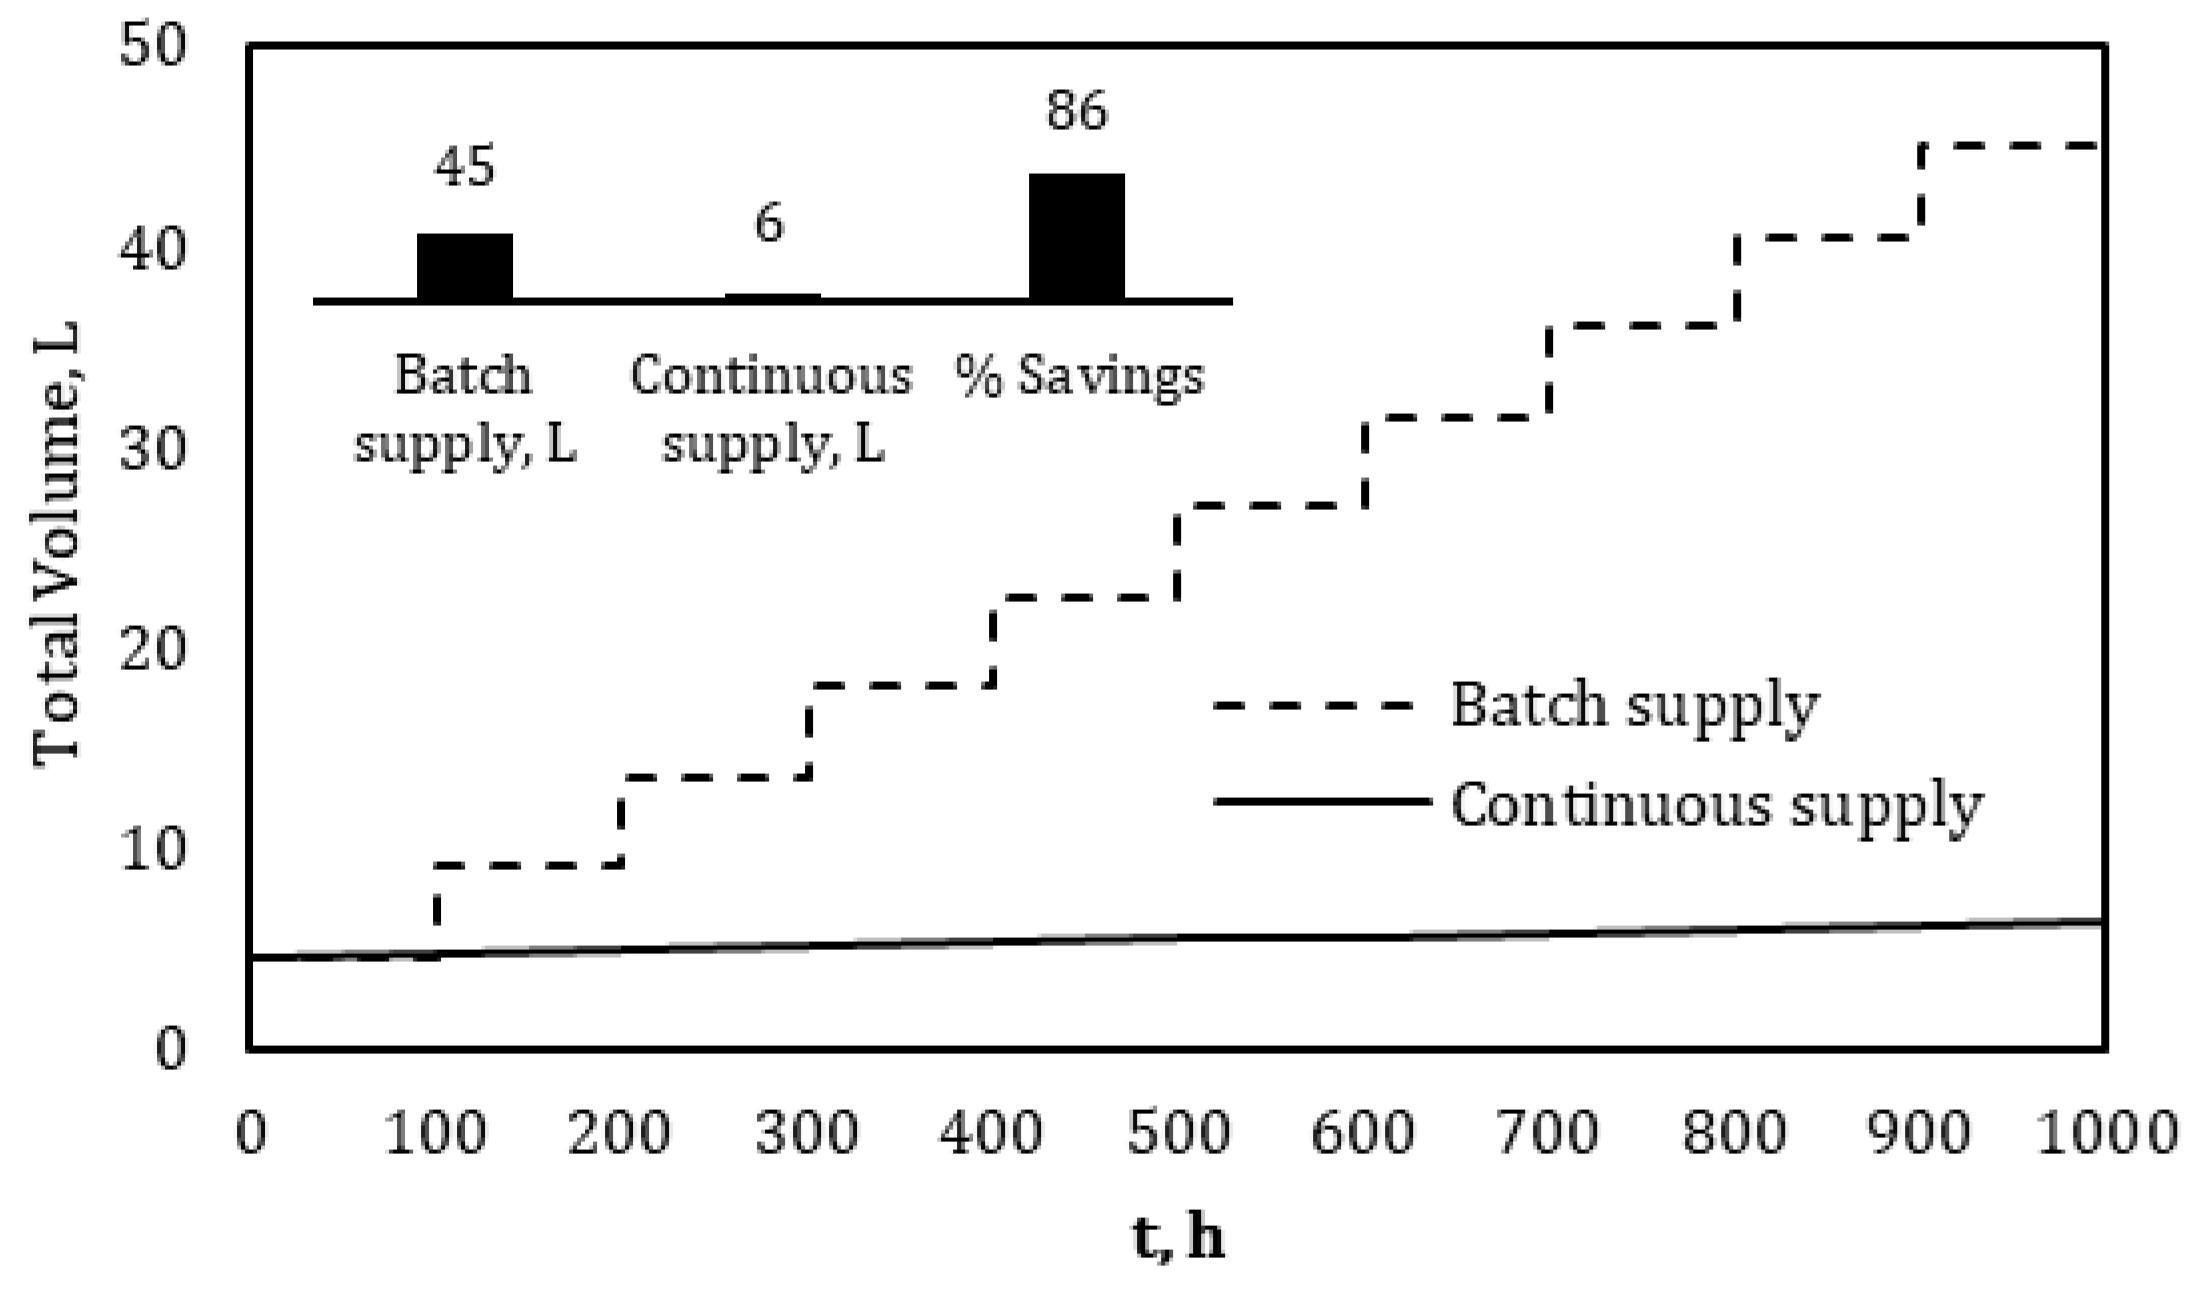
The batch and continuous lubrication strategies consume different lubricant volumes over comparable operation times. Figure 5 illustrates the total lubricant consumption (associated with precursor demand) during 1000 h of operation. In the batch strategy, the entire lubricant volume is replaced every 100 h, increasing by 4.5 L per interval. Consequently, the consumption profile exhibits a step-like shape, reaching a total volume of 45 L by the end of the operation period.
In contrast, using the continuous strategy, the oil pan is initially filled with 4.5 L of lubricant, and a continuous make-up flow of q e = 4.85 × 10 7 L / s is maintained throughout the operation. Thus, the consumption profile follows a linear trend, reaching approximately 6 L at the end of the 1000 h period. Overall, the continuous lubrication strategy reduces lubricant consumption by about 86% compared with the batch strategy.
The reported savings correspond to the base-case conditions analyzed and should be interpreted as illustrative rather than universal, as their magnitude depends on model parameters and operating assumptions. Moreover, in the continuous supply strategy, the reported total lubricant volume corresponds to cumulative make-up only, whereas in the batch strategy it includes full lubricant replacement events, which explains the large difference between both cases.
It should be noted that this reduction refers specifically to the lubricant consumption predicted by the present tribokinetic model, which evaluates the precursor demand required to sustain tribofilm formation within the defined control volumes. In real engines, additional loss mechanisms such as evaporation, blow-by losses, and oil burning may alter the total lubricant consumption.

3.3. Study on the Sensitivity of the Two Lubrication Strategies

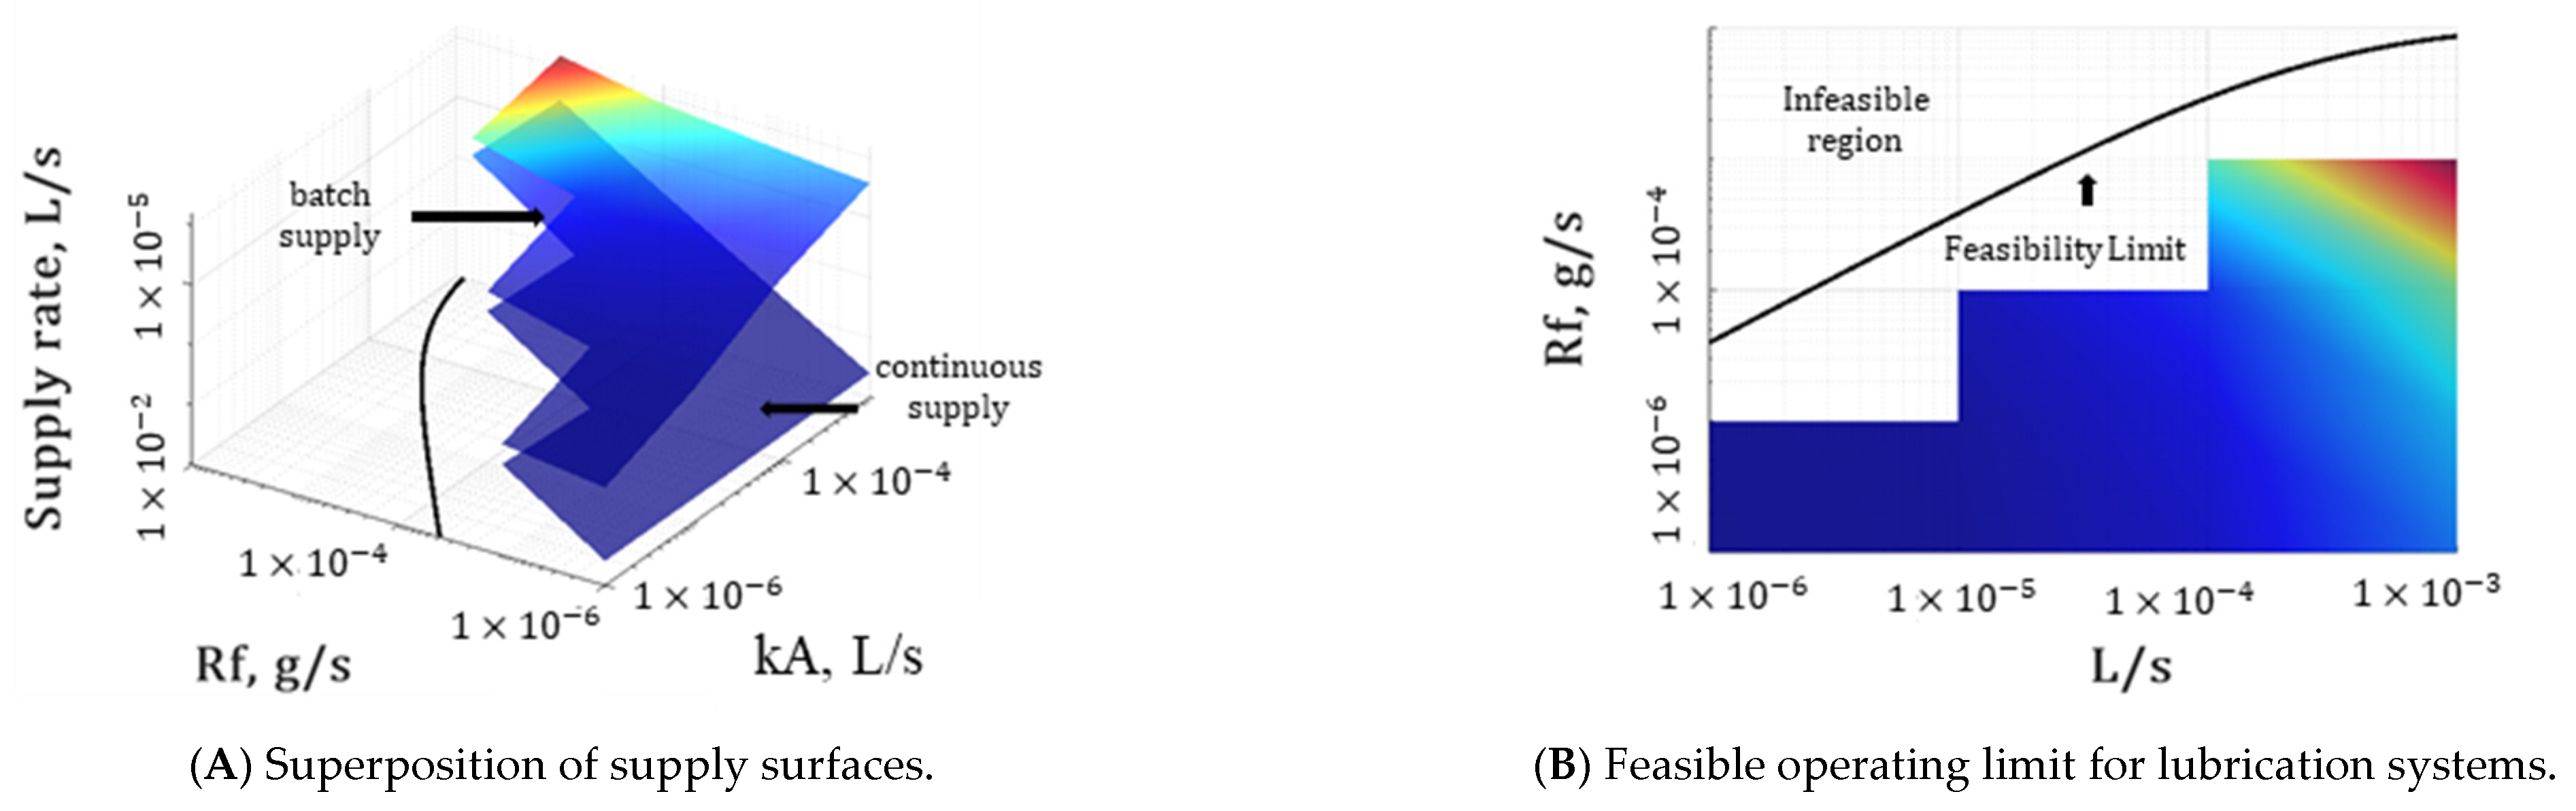
The sensitivity analysis generated two lubricant supply surfaces (Figure 6A), both bounded by the feasibility limit defined in (Equation (23)). The surface corresponding to the continuous supply strategy consistently lies below that of the batch strategy. In both cases, the supply rate increases with the removal rate R F and the kinetic parameter κ A ; however, the influence of κ A is less significant than that of R F (Figure 6A). Non-positive lubricant supply rates were obtained for the kinetic parameter pairs ( R F and κ A ) of ( 10 5 , 10 3 ) , ( 10 6 , 10 3 ) , and ( 10 6 , 10 4 ) . These points are located within the infeasible region (Figure 6B), beyond the operational limit established by (Equation (23)).
For the continuous lubrication strategy, (Equation (23)) restricts the range of R F and κ A into all combinations that provide positive supply rates. In contrast, in the batch lubrication strategy, infinite supply rates appear when the operating period τ approaches zero (Equation (14)).

3.4. Supercritical Operation of the Batch Supply Lubrication Strategy

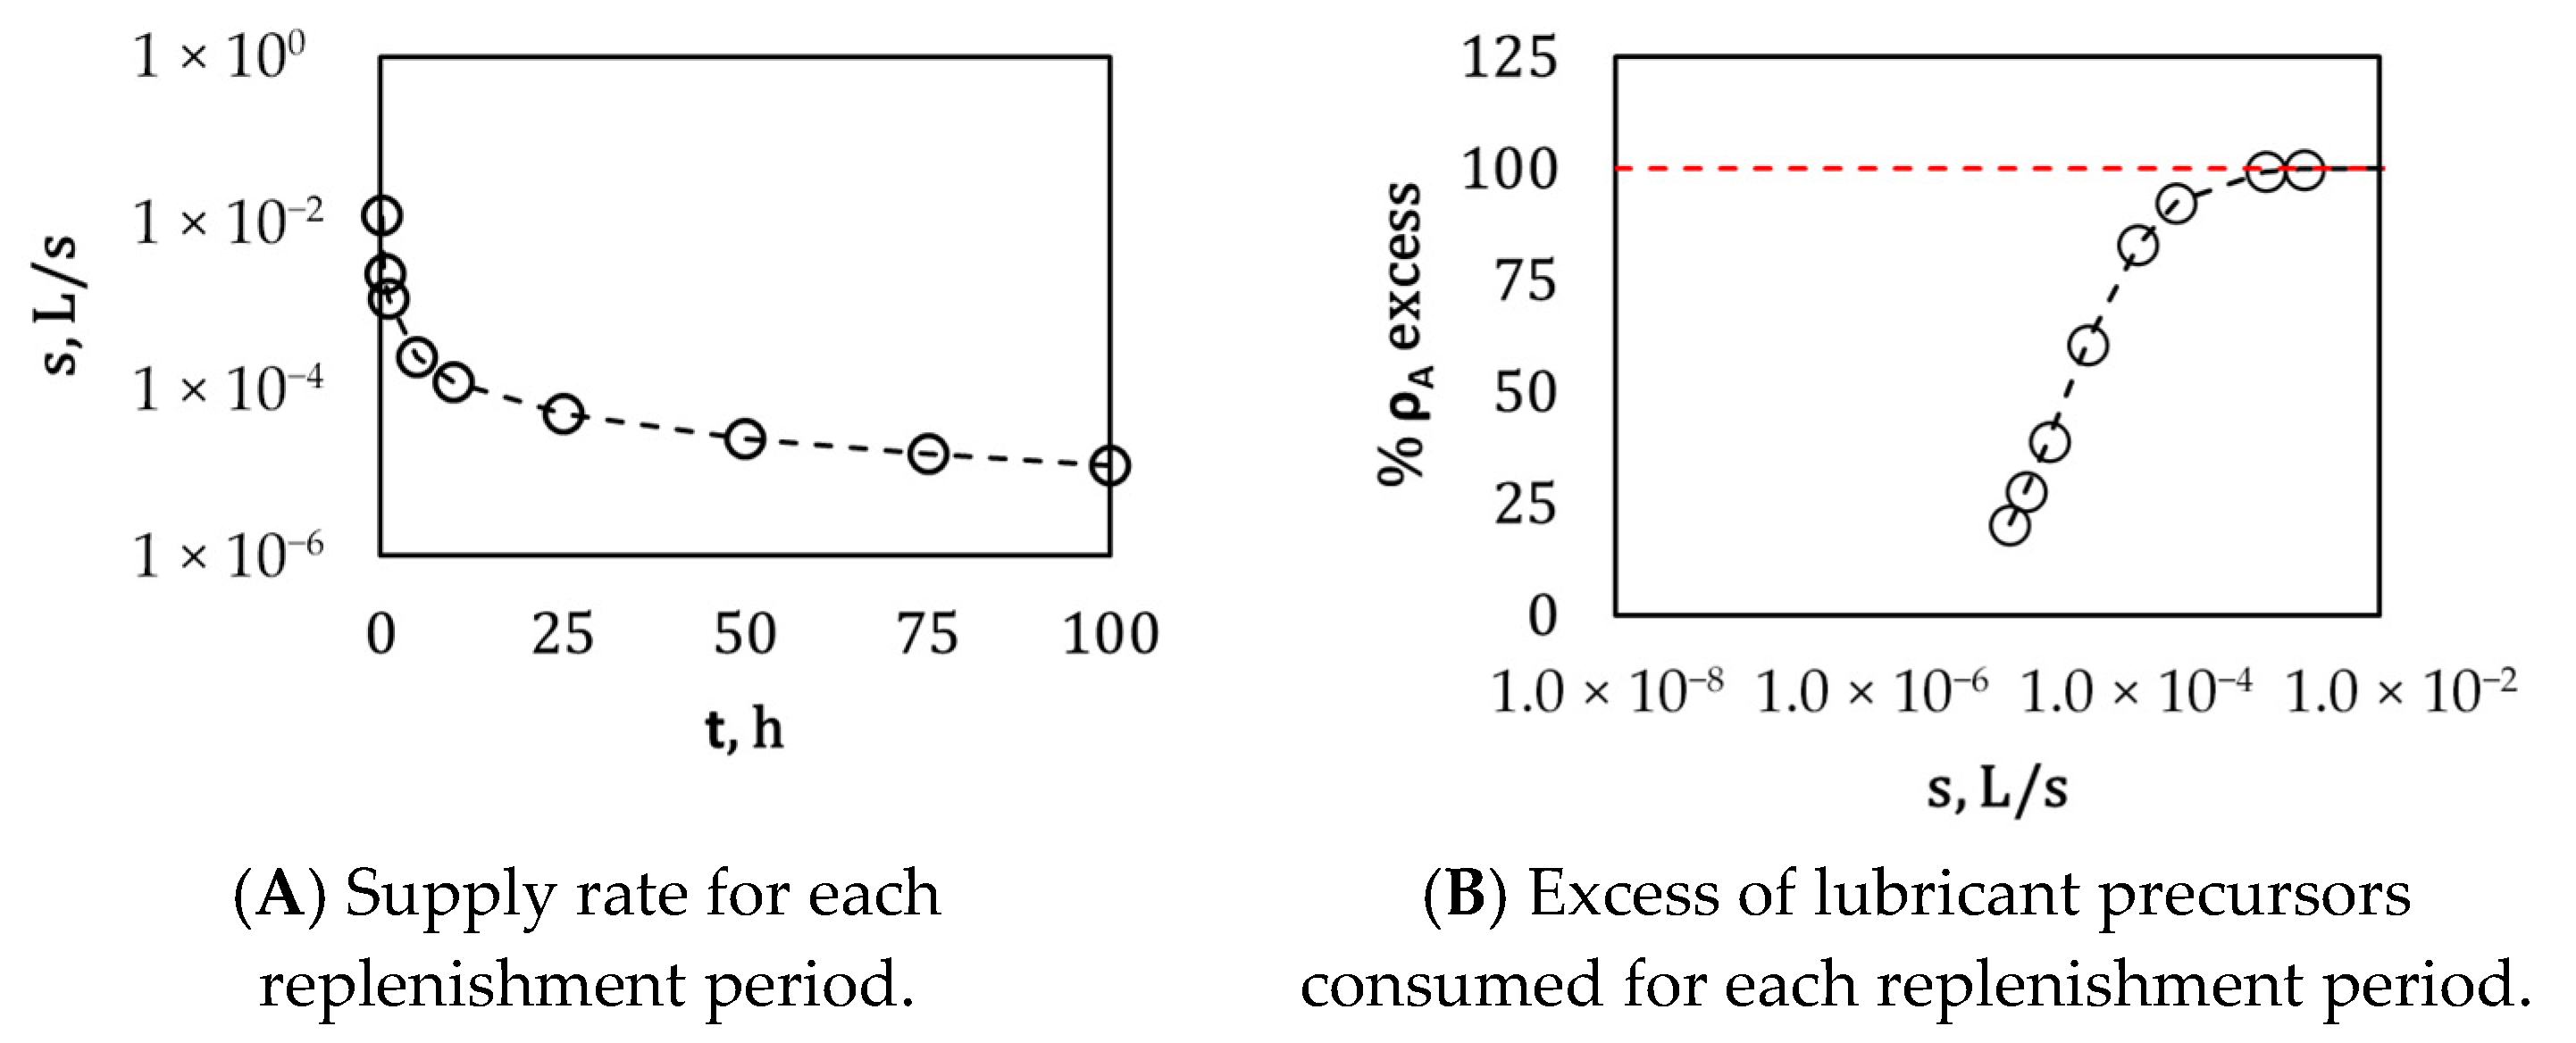
The supercritical supply rates ( s ) calculated for operating periods shorter than τ exhibit a hyperbolic increasing trend, tending toward infinity as time approaches zero (Figure 7A). Similarly, the trajectory of the excess lubricant precursors consumed under supercritical conditions follows a hyperbolic increase; however, in this case, the profile is horizontally bound, asymptotically approaching 100% excess as the supply rate ( s ) increases (Figure 7A). The minimum excess of lubricant precursors corresponds to 20%, which represents the critical condition for τ (Figure 7A).

3.5. Supercritical Operation of the Continuous Supply Lubrication Strategy

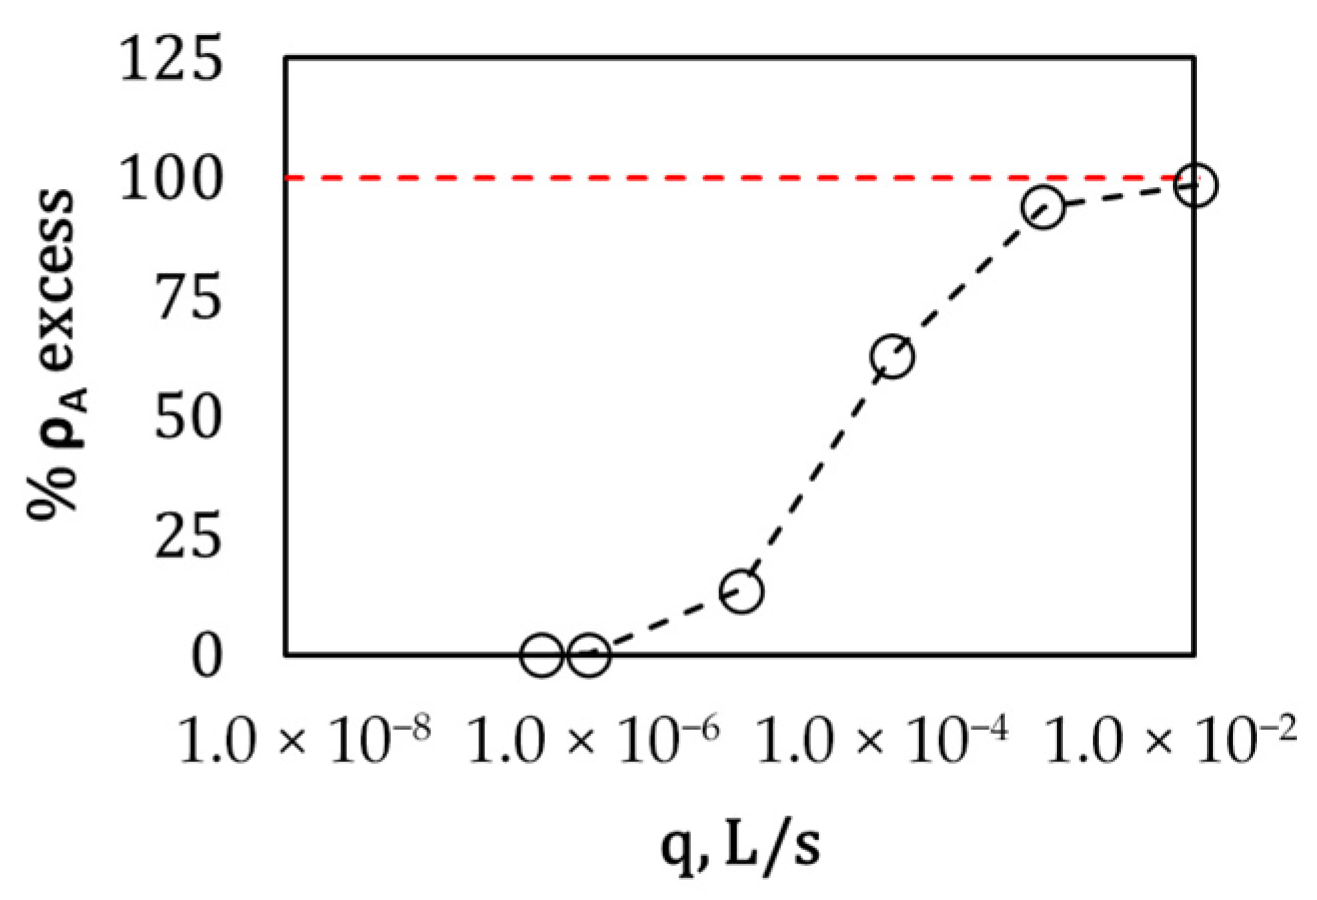
For the continuous strategy, the trajectories of the excess of lubricant precursors consumed under supercritical conditions also follow a hyperbolic increase. The profile is horizontally bound, asymptotically approaching 100% excess as the supply rate ( q ) increases (Figure 8). The minimum excess of lubricant precursors approximates 0%, which represents the critical condition at q e (Figure 8).

3.6. Comparison of Lubricant Economy for Supercritical Conditions

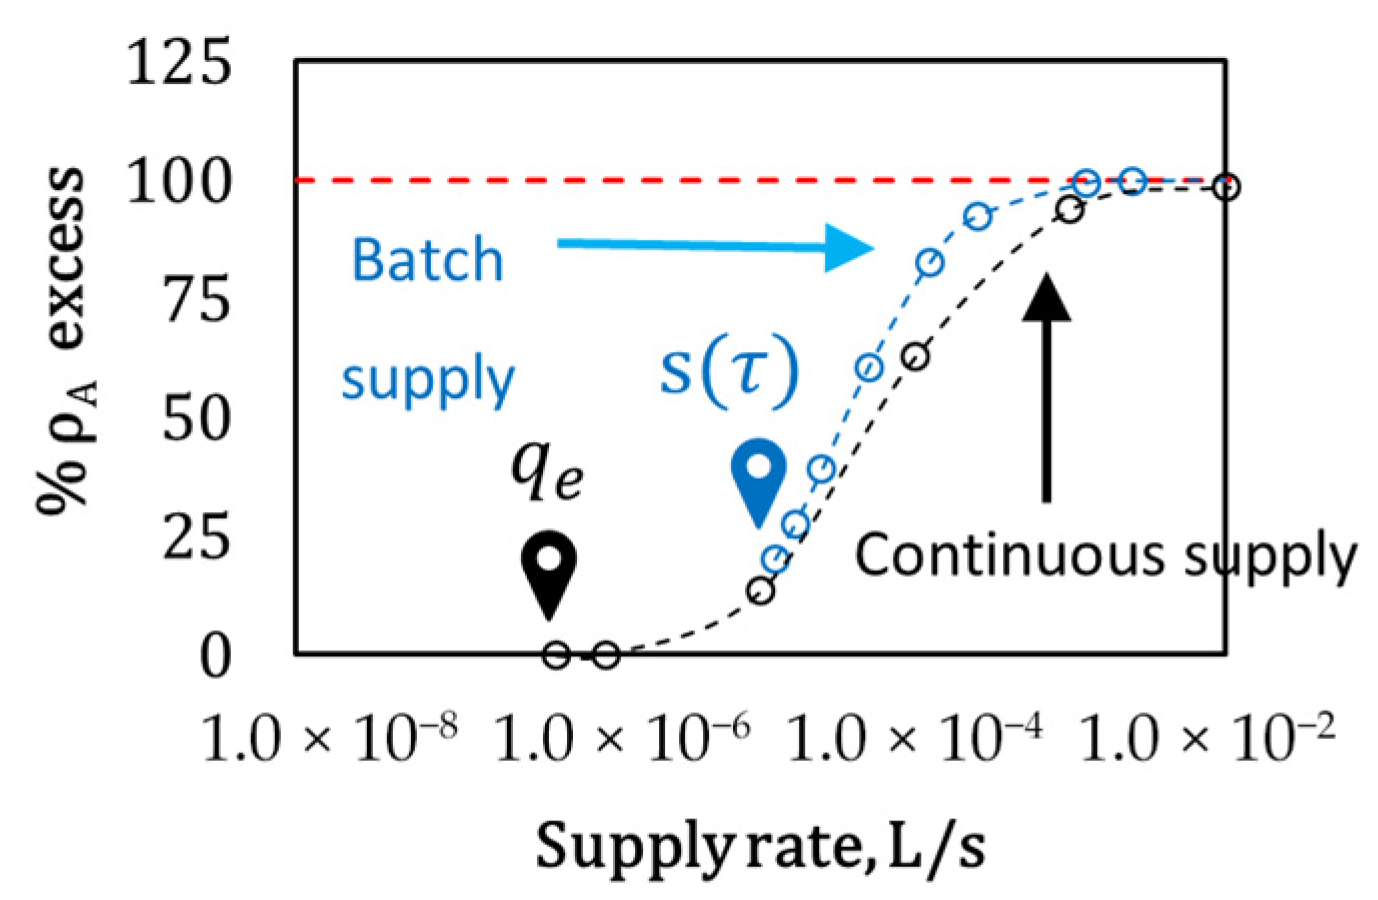
By comparing the minimum excess of lubricant precursors consumed in the batch (20%) and continuous (0%) strategies, it is evident that, under critical conditions, the batch strategy consumes more lubricant precursors than the continuous strategy (Figure 9).
Moreover, the minimum lubricant consumption occurs at different supply rates: 1.25 × 10 5   L / s for batch lubrication and 4.85 × 10 7   L / s for continuous lubrication. Therefore, the continuous strategy enables the lubrication system to operate at supply rates significantly lower than those required by the batch strategy (Figure 9).
For equivalent supply rates ( s and q ), the calculated values for ρ A C   e x c e s s for the batch strategy consistently follow a trend located above that of the continuous strategy. This behavior indicates that, even when both systems operate at the same supply rate, the batch strategy inherently requires more lubricant precursors to maintain the lubrication conditions. In other words, the batch lubrication system is less efficient in precursor utilization than the continuous system (Figure 9).

4. Discussion

4.1. Technical Comparison of the Base Cases

The results obtained for both base cases (Figure 4 and Figure 5) clearly highlight the operational and material-efficiency implications between the batch and continuous lubrication strategies. In the batch system, lubricant replacement occurs in discrete intervals, which guarantees a complete renewal of the lubricant properties after each cycle but leads to substantial precursor consumption and periodic loss of film stability. In contrast, the continuous system maintains the lubricant properties through a steady inflow of fresh oil and simultaneous discharge of degraded lubricant, achieving a more uniform film thickness and significantly lower precursor consumption.
Quantitatively, the continuous strategy reduced lubricant consumption by approximately 86% compared to the batch strategy during 1000 h of operation (Figure 5). This improvement stems from the ability of the continuous system to sustain steady-state concentrations of lubricant precursors, while the batch system experiences complete depletion at the end of each operating period.
Thus, the continuous strategy demonstrates higher efficiency and film stability, whereas the batch strategy remains simpler to operate but less efficient in precursor utilization. From a modeling perspective, the relevance of this work lies in extending tribofilm mass-balance analysis beyond film kinetics to evaluate lubrication supply strategies at the system level, enabling a direct comparison of precursor utilization efficiency between batch and continuous lubrication processes.
The steady-state behavior observed for the continuous lubrication strategy is consistent with previous tribological studies reporting improved film stability under controlled and continuous supply conditions, particularly in boundary and elastohydrodynamic contacts [10,12,14,17,18]. However, most of these studies primarily focus on friction coefficients or film thickness evolution, without explicitly accounting for lubricant precursor depletion or excess consumption. In this context, the present model extends existing approaches by incorporating an explicit mass balance of lubricant precursors, enabling a direct comparison of lubrication strategies in terms of precursor consumption and material efficiency, with associated economic implications.

4.2. Influence of the Kinetic Constant and Film Removal Rate

The sensitivity analysis (Figure 6) showed that both the kinetic constant ( κ A ) and the film removal rate ( R F ) exert a direct influence on the lubricant supply rates of both strategies. Increasing κ A enhances the regeneration of the lubricating film, thereby lowering the required make-up rate when R F is moderate. However, excessive values of κ A may accelerate precursor depletion without proportional gains in tribofilm durability, thereby diminishing overall lubrication efficiency, as also suggested by model-based studies on additive consumption [19,20,21].
Conversely, an increase in R F provokes higher supply requirements due to the accelerated detachment of the lubricating film. The combined effect of these parameters defines the feasible operation region described by (Equation (23)). Within this region, the continuous strategy always exhibits lower supply demands than the batch system. To improve efficiency, the system design should aim to minimize R F —for example, by optimizing surface topography or reducing mechanical shear—and to select lubricants with kinetic constants balanced to sustain steady film renewal avoiding overconsumption of precursors.
Trends associating higher film removal rates with increased lubricant demand have also been reported in experimental studies addressing additive depletion and tribofilm wear under severe contact conditions [12,13,19,20,21]. However, these studies generally provide qualitative assessments of film loss without explicitly linking removal kinetics to lubricant supply requirements. In this regard, the present sensitivity analysis offers a quantitative framework that connects film removal mechanisms with lubricant consumption, enabling a more systematic comparison of lubrication strategies.

4.3. Expected Effects of Varying Additional System Parameters

Although the present study focused primarily on κ A and R F , other system parameters can also influence lubrication performance. Increasing the concentration of active precursors in the fresh lubricant ( z A ) would extend the period of effective film protection but could also increase viscosity and alter flow distribution in the oil circuit, potentially affecting additive transport and degradation pathways [16,19].
Similarly, modifying the lubricant exchange rate between the oil pan and the engine interior may provide a means to fine-tune the balance between regeneration and removal of the lubricating film. Higher exchange rates could accelerate precursor homogenization and improve the responsiveness of the system to degradation, while lower rates would favor lower overall consumption. These aspects represent promising directions for future optimization of lubricant formulations and circulation design, as previously discussed in recent lubrication modeling and system-level analyses [17,18,21].
Finally, recent advances in smart lubrication systems and adaptive oil management indicate that continuous supply strategies can be dynamically optimized in real time by adjusting make-up rates according to operating conditions and lubricant health indicators [17]. Within this context, the present mass-balance framework provides a quantitative theoretical basis for such adaptive control strategies, linking lubricant chemistry, tribofilm evolution, and supply management [18,19,20,21].

4.4. Practical Applicability of Each Lubrication Strategy

Each lubrication strategy presents advantages under specific operational contexts. The batch system is suitable for conventional engines where lubricant replacement intervals are already established, and maintenance accessibility is straightforward. Its simplicity and robustness make it the appropriate choice for small- to medium-scale systems or laboratory setups. The continuous system, on the other hand, is better suited to long-duration or high-performance applications—such as heavy-duty engines, turbines, or closed-loop systems—where lubricant degradation must be minimized, and operational interruptions are undesirable.
Beyond these operational considerations, the choice between both strategies involves a trade-off of control complexity, material efficiency, and maintenance logistics. The findings presented here demonstrate that continuous lubrication systems can significantly reduce lubricant consumption and precursor waste, thereby improving material efficiency and contribute to environmental sustainability.
From a material-efficiency perspective, this material efficiency translates into lower operational costs and reduced waste-management requirements. For instance, considering the base cases comparison (Figure 5), the continuous strategy could reduce the lubricant volume required by up to 86% compared to the batch strategy. Assuming similar lubricant unit costs, this difference implies not only monetary savings but also reduced logistics associated with lubricant storage, handling, and disposal. Additionally, maintaining stable film thickness reduces the frequency of maintenance interventions and engine downtime, further improving operational efficiency. These benefits align with global assessments identifying friction and lubrication losses as major contributors to energy consumption and operating costs in mechanical systems [5,6].
Unlike previous studies focused primarily on tribofilm formation and additive depletion, the present work employs a mass-balance framework as a system-level tool to compare lubricant supply strategies and quantify their implications in terms of precursor consumption and material efficiency, with associated economic implications.
Although the present model is not calibrated against a specific experimental dataset, the simulated trends are consistent with experimental observations reported in the tribology literature, where increased lubricant supply rates lead to higher lubricant consumption and reduced lubricant lifetime, whereas stable replenishment strategies promote improved film persistence and lubrication stability [7,8,9,10,18,21]. Future work will focus on validating the model predictions using tribological testing and engine lubrication measurements.
The implementation of continuous lubrication systems in conventional engines may require additional control hardware, monitoring systems, and oil-management infrastructure to regulate make-up flows and maintain lubricant quality. Therefore, the feasibility of continuous lubrication depends not only on tribological performance but also on system integration and operational reliability, aspects that should be evaluated in future experimental and engineering implementations.
Despite these advantages, the practical implementation of continuous lubrication systems in industrial environments presents several challenges. These include the need for precise control of make-up and purge flows, real-time monitoring of lubricant condition, and additional infrastructure for fluid management. Furthermore, integration with existing engine designs may require modifications to lubrication circuits and control systems. Operational reliability, maintenance complexity, and cost of implementation must therefore be carefully evaluated before adopting continuous lubrication strategies in real applications.

5. Conclusions

This study employed a phenomenological mass-balance framework as a system-level tool to compare the lubricant consumption and material efficiency of batch and continuous lubricant supply strategies in internal combustion engines. The main conclusions can be summarized as follows:
  • The batch lubrication strategy, while operationally simpler, inherently requires higher lubricant precursor consumption due to its discrete replenishment nature and limited operating lifetime.
  • The continuous lubrication strategy achieves a steady-state operating regime that ensures stable film thickness while minimizing lubricant precursor excess, resulting in significantly higher material efficiency.
  • By introducing the concepts of critical supplying rate, precursor excess, and feasibility region, the proposed framework enables a direct and quantitative comparison between batch and continuous supply strategies under both critical and supercritical conditions.
  • The kinetic constant and the film removal rate were identified as key parameters governing lubricant demand in both strategies, defining operational limits beyond which lubricant consumption increases disproportionately.
  • Within the feasible operating region, continuous lubrication systems can substantially reduce precursor consumption and lubricant waste, improve material efficiency and contribute to environmental sustainability, with associated economic advantages over batch strategies, provided that operating conditions remain within appropriate kinetic and mechanical limits.
  • A key contribution of this work is the system-level comparison of batch and continuous lubrication strategies through a tribokinetic mass-balance framework, enabling the explicit quantification of lubricant consumption differences under consistent operating assumptions.
Future work should focus on experimental validation of the proposed framework under controlled laboratory and real operating conditions, as well as on extending the model to account for long-term physicochemical changes in lubricant composition and additive depletion.

Author Contributions

S.D.-G.; Conceptualization, methodology, validation, writing—original draft preparation, project administration, M.P.-L.; methodology, resources, A.L.-V.; validation, resources, M.A.E.-M.; validation, resources, supervision, R.M.-Y.; Conceptualization, methodology, writing—review and editing, project administration. All authors have read and agreed to the published version of the manuscript.

Funding

This research received no external funding.

Data Availability Statement

The data, algorithms, and scripts used in this study are available upon reasonable request.

Acknowledgments

Authors greatly thanks the economic support by the grant 20315 from the “Sistema Nacional de Investigadores e Investigadoras (SEHICTI)” and the kind accompaniment by the project 20.20 from the “CIC-UMSNH”.

Conflicts of Interest

The authors declare no conflicts of interest.

Abbreviations

The following abbreviations are used in this manuscript:
Aagglomerate of additives contained in the lubricant formula.
Fdeposited molecules forming the solid film.
A R internal surface of the engine.
χthickness of the film.
χmaxmaximum thickness of separation between the shearing surfaces.
χminminimum thickness required to avoid direct contact of the surface roughness.
V C control volume within the oil pan.
V M control volume of the engine.
V sum of the engine control volume and the oil pan control volume.
uvolumetric flow rate between the oil pan and the engine interior
qvolumetric flow rate of fresh lubricant and of purge.
s critical supplying rate during an operation period τ .
q e minimum lubricant make-up rate required to form the equilibrium film.
z A concentration of precursors A in the fresh lubricant.
ρ A M partial density of precursors A inside the engine.
ρ A C partial density of precursors A inside the oil pan.
ρ F M amount of lubricant film deposited inside the engine.
ρ A M e critical partial densities of precursors A within the engine.
ρ A C e critical partial densities of precursors A in the oil pan.
ϱ F actual density of the deposited film
ρ F M m i n partial density of film required to cover the surface asperities up to χ m i n .
m F M film mass.
κ A kinetic constant of the reaction of A inside the engine.
R F removal base rate.
σgrowing constrain
ςratio between the film thickness χ and the minimum thickness required to avoid direct surface-to-surface contact.
τlimited operating period in the batch supply strategy.
%   ρ A C   E x c e s s excess in consumed lubricant precursors.
Δ t time step.

References

  1. Neuhausen, J.B.; Riedl, J.-H.; Ploetz, W.; Müller, M.; Popp, P.; Langenmayr, S.; Faltenbacher, F.; Gruschwitz, T. European Fleet Electrification: From Electric Vehicle Sales to a Complete Fleet Transition; Strategy&, PwC and Fraunhofer ISI: Munich, Germany, 2023; Available online: https://www.isi.fraunhofer.de (accessed on 10 January 2026).
  2. Business Research Insights. Internal Combustion Engine Market: Global Analysis by 2035; Business Research Insights: Pune, India, 2024; Available online: https://www.businessresearchinsights.com/market-reports/internal-combustion-engine-market-119484 (accessed on 10 January 2026).
  3. Fortune Business Insights. Internal Combustion Engine Market Size, Share and Industry Report, 2023–2032; Fortune Business Insights: Pune, India, 2023; Available online: https://www.fortunebusinessinsights.com/internal-combustion-engine-market-112866 (accessed on 10 January 2026).
  4. Mordor Intelligence. Global Internal Combustion Engines Market: Size and Share Analysis (2024–2029); Mordor Intelligence: Hyderabad, India, 2024; Available online: https://www.mordorintelligence.com/industry-reports/global-internal-combustion-engines-market (accessed on 10 January 2026).
  5. Holmberg, K.; Andersson, P.; Erdemir, A. Global energy consumption due to friction in passenger cars. Tribol. Int. 2012, 47, 221–234. [Google Scholar] [CrossRef] [Scilit]
  6. Holmberg, K.; Erdemir, A. Influence of tribology on global energy consumption, costs and emissions. Friction 2017, 5, 263–284. [Google Scholar] [CrossRef] [Scilit]
  7. Bonaventure, J.; Cayer-Barrioz, J.; Mazuyer, D. Transition between mixed lubrication and elastohydrodynamic lubrication with randomly rough surfaces. Tribol. Lett. 2016, 64, 33. [Google Scholar] [CrossRef] [Scilit]
  8. Domínguez-García, S.; Béjar-Gómez, L.; Huirache-Acuña, R.; Lara-Romero, J.; Maya-Yescas, R. Delumping strategy to infer lubrication reaction pathways in internal combustion engines. Int. J. Chem. React. Eng. 2020, 18, 20190043. [Google Scholar] [CrossRef] [Scilit]
  9. Domínguez-García, S.; Aguilar-Ramírez, C.E.; Béjar-Gómez, L.; Maya-Yescas, R. Mass balance of the tribofilm in lubricated systems. Tribol. Int. 2021, 155, 106757. [Google Scholar] [CrossRef] [Scilit]
  10. Liu, S.; Wang, Q.J.; Chung, Y.W.; Berkebile, S. Lubrication–contact interface conditions and novel mixed/boundary lubrication modeling methodology. Tribol. Lett. 2021, 69, 142. [Google Scholar] [CrossRef] [Scilit]
  11. Dawczyk, J.; Morgan, N.; Russo, J.; Spikes, H. Film thickness and friction of ZDDP tribofilms. Tribol. Lett. 2019, 67, 50. [Google Scholar] [CrossRef] [Scilit]
  12. Khaemba, D.N.; Jarnias, F.; Thiebaut, B.; Neville, A.; Morina, A. The role of surface roughness and slide–roll ratio on the decomposition of MoDTC in tribological contacts. J. Phys. D Appl. Phys. 2017, 50, 085302. [Google Scholar] [CrossRef] [Scilit]
  13. Liñeira del Río, J.M.; Guimarey, M.J.G.; Prado, J.I.; Lugo, L.; López, E.R.; Comuñas, M.J.P. Improving the tribological performance of a biodegradable lubricant by adding graphene nanoplatelets as additives. J. Mol. Liq. 2022, 345, 117797. [Google Scholar] [CrossRef] [Scilit]
  14. Spikes, H.A. The history and mechanisms of ZDDP. Tribol. Lett. 2004, 17, 469–489. [Google Scholar] [CrossRef] [Scilit]
  15. Taylor, L.J.; Spikes, H.A. Friction-enhancing properties of ZDDP antiwear additive. Tribol. Trans. 2003, 46, 303–309. [Google Scholar] [CrossRef] [Scilit]
  16. Al Sheikh Omar, A.; Motamen Salehi, F.; Farooq, U.; Morina, A.; Neville, A. Chemical and physical assessment of engine oils degradation and additive depletion by soot. Tribol. Int. 2021, 160, 107054. [Google Scholar] [CrossRef] [Scilit]
  17. Domínguez-García, S.; Béjar-Gómez, L.; López-Velázquez, A.; Maya-Yescas, R.; Nápoles-Rivera, F. Maximizing lubricant life for internal combustion engines. Processes 2022, 10, 2070. [Google Scholar] [CrossRef] [Scilit]
  18. Domínguez-García, S.; Maya-Yescas, R.; Béjar-Gómez, L. Reduction of lubricant life in lubrication systems for internal combustion engines due to high lubricant supply rates. Mater. Lett. 2022, 313, 131785. [Google Scholar] [CrossRef] [Scilit]
  19. Minami, I. Molecular Science of Lubricant Additives. Appl. Sci. 2017, 7, 445. [Google Scholar] [CrossRef] [Scilit]
  20. Hsu, S.M.; Zhang, J.; Yin, Z. The nature and origin of tribochemistry. Tribol. Lett. 2002, 13, 131–139. [Google Scholar] [CrossRef] [Scilit]
  21. Tsai, A.E.; Komvopoulos, K. Dynamics of Tribofilm Formation in Boundary Lubrication Investigated Using In Situ Measurements of the Friction Force and Contact Voltage. Materials 2024, 17, 1335. [Google Scholar] [CrossRef] [Scilit] [PubMed]
Figure 1. Conceptual representation of tribofilm formation and thickness constraints in the lubrication process of internal combustion engines. Panel (A) illustrates the chemical processes involved in film formation and removal, including the adsorption of lubricant precursors on surfaces and their transformation into a solid tribofilm, followed by mechanical removal. Panel (B) shows the definition of film thickness limits within the piston–cylinder system, bounded by a minimum thickness required to avoid direct asperity contact (χmin) and a maximum thickness associated with surface separation (χmax). These schematics provide the physical basis for the tribokinetic model formulation.
Processes 14 01155 g001
Figure 2. Schematic representation of lubricant circulation between the oil pan and the engine interior for batch and continuous lubrication strategies. Panel (A) shows the batch system, where lubricant is recirculated within a closed loop and replaced entirely at discrete intervals. Panel (B) shows the continuous system, in which lubricant is continuously recirculated while a fresh make-up flow is introduced and an equivalent purge is removed, maintaining the availability of lubricant precursors over time. The diagrams highlight the fundamental difference in supply mechanisms between both strategies.
Processes 14 01155 g002
Figure 3. Computational procedures used to determine the relationship between lubricant supply rate and precursor excess under non-critical (supercritical) operating conditions. Panel (A) illustrates the algorithm for the batch strategy, where the operating period τ is progressively reduced to evaluate its effect on supply rate and precursor excess. Panel (B) illustrates the algorithm for the continuous strategy, where the lubricant make-up rate is progressively increased to analyze its impact on system behavior. These procedures enable systematic comparison of both lubrication strategies beyond critical operating conditions.
Processes 14 01155 g003
Figure 4. Time evolution of lubricant precursor concentration, deposited film amount, and film thickness for batch and continuous lubrication strategies under base-case conditions. Panels (AC) correspond to the batch system, showing the depletion of precursor concentration in both the oil pan and engine, the accumulation and subsequent decay of deposited film, and the corresponding reduction in film thickness after the operating period τ. Panels (DF) correspond to the continuous system, where precursor concentrations reach steady-state values, and both the deposited film and film thickness remain stable over time. These results illustrate the transient depletion behavior of the batch strategy and the steady-state stabilization achieved by the continuous strategy.
Processes 14 01155 g004
Figure 5. Total lubricant consumption over 1000 h of operation for batch and continuous lubrication strategies. The batch strategy exhibits a stepwise increase due to periodic full lubricant replacement, while the continuous strategy shows a linear increase associated with constant make-up flow.
Processes 14 01155 g005
Figure 6. Influence of the kinetic constant and film removal rate on the critical lubricant supply rates for batch and continuous lubrication strategies. The magnitude of the supply rate increases from blue (low values) to red (high values). Panel (A) shows the superposition of the critical supply surfaces for both strategies as functions of the kinetic parameter and the film removal rate, highlighting that the continuous strategy consistently requires lower supply rates than the batch strategy. Panel (B) presents the feasible operating region defined by the positivity of the supply rate, together with the feasibility limit separating physically meaningful and infeasible parameter combinations. The results illustrate how the interplay between kinetic and removal processes governs lubricant demand and defines the operational limits of both lubrication strategies.
Processes 14 01155 g006
Figure 7. Supercritical behavior of the batch lubrication strategy as a function of the operating period τ. Panel (A) shows the variation in the lubricant supply rate with decreasing operating time, exhibiting a hyperbolic increase as τ approaches zero. Panel (B) presents the corresponding excess of lubricant precursors consumed, which increases asymptotically toward 100% as the supply rate rises. The minimum excess corresponds to the critical operating condition, highlighting the intrinsic overconsumption of precursor associated with batch operation under supercritical regimes.
Processes 14 01155 g007
Figure 8. Supercritical behavior of the continuous lubrication strategy as a function of the lubricant make-up rate. The figure shows the variation in the excess of lubricant precursors consumed as the make-up rate increases beyond the critical condition. The excess exhibits a hyperbolic increase, asymptotically approaching 100% at high supply rates, while approaching zero near the critical make-up rate. This behavior highlights the ability of the continuous strategy to operate with minimal precursor excess under near-critical conditions.
Processes 14 01155 g008
Figure 9. Comparison of precursor excess as a function of lubricant supply rate for batch and continuous lubrication strategies under supercritical operating conditions. The batch strategy exhibits consistently higher precursor excess across the entire range of supply rates, with a minimum excess significantly above zero at the critical condition. In contrast, the continuous strategy approaches zero excess near the critical make-up rate and increases asymptotically with higher supply rates. This comparison highlights the superior material efficiency of the continuous strategy, which achieves lower precursor consumption for equivalent supply rates.
Processes 14 01155 g009
Table 1. Simulation parameters for the base cases [17,18].
Batch StrategyContinuous Strategy
Sizing ParameterInitial ConditionSizing ParameterInitial Condition
V C = 2.5   L ρ A C = z A V C = 2.5   L ρ A C = z A
V M = 2.0   L ρ A M = z A V M = 2.0   L ρ A C = z A
A R = 0.25   m 2 ρ F M = ρ F M m i n A R = 0.25   m 2 ρ F M = ρ F M m i n
χ m i n = 1   μ m χ = χ m i n χ m i n = 1   μ m χ = χ m i n
χ m a x = 2   μ m t = 0   h χ m a x = 2   μ m t = 0   h
u = 2.28   ×   10 4   L / s u = 2.28   ×   10 4   L / s
q = 0   L / s q e = 5.05   ×   10 7   L / s
Table 2. Supercritical lubricant supplying rates.
Batch StrategyContinuous Strategy
t, hs, L/sq, L/s
( τ ) 100 1.25 × 10 5 ( q e ) 4.85 × 10 7
75 1.67 × 10 5 1.00 × 10 6
50 2.50 × 10 5 1.00 × 10 5
25 5.00 × 10 5 2.00 × 10 5
10 1.25 × 10 4 2.50 × 10 5
5 2.50 × 10 4 3.00 × 10 5
1 1.25 × 10 3 1.00 × 10 4
0.5 2.50 × 10 3 1.00 × 10 3
0.1 1.25 × 10 2 1.00 × 10 2
Disclaimer/Publisher’s Note: The statements, opinions and data contained in all publications are solely those of the individual author(s) and contributor(s) and not of MDPI and/or the editor(s). MDPI and/or the editor(s) disclaim responsibility for any injury to people or property resulting from any ideas, methods, instructions or products referred to in the content.