Article

Variable-Frequency Ventilation Monitoring System Based on Collaborative Wind Speed Prediction Using Environmental Parameters

1
School of Resources and Safety Engineering, University of Science and Technology Beijing, Beijing 100083, China
2
School of Mechanical Engineering, University of Science and Technology Beijing, Beijing 100083, China
*
Author to whom correspondence should be addressed.
Processes 2026, 14(10), 1660; https://doi.org/10.3390/pr14101660
Submission received: 8 April 2026 / Revised: 3 May 2026 / Accepted: 15 May 2026 / Published: 20 May 2026
(This article belongs to the Special Issue Research Progress in Dust Control Technology)

Abstract

In order to predict the wind speed of the excavation roadway, control the frequency conversion operation of the local fan in real-time, and realize the real-time monitoring, collaborative prediction, and frequency conversion control of the ventilation state of the excavation face, the frequency conversion ventilation control system of the excavation face is designed. Based on the theory of frequency conversion control, the genetic-neural network wind speed prediction optimization model was established, and the frequency conversion ventilation control system of the excavation face was designed by using S7-200 SMART PLC. The system test results show that the genetic-neural network optimization model can collaboratively predict wind speed according to the environmental parameters (dust concentration, methane concentration, temperature, and humidity, etc.) of different working conditions. The frequency conversion ventilation control system realizes the real-time monitoring of the environmental parameters of the excavation surface, and also provides two control modes: automatic and manual. Compared with the traditional constant power frequency control fan wind speed, the PID wind speed closed-loop control technology can control the fan wind speed by frequency conversion, so that the actual wind speed of the roadway continues to approach the predicted value stably. The variable frequency ventilation control system can be widely used in different types of mines to realize the adaptive control response of ventilation equipment.

1. Introduction

Fans are crucial for ventilation in plateau inclined shafts, impacting temperature, humidity, and pollutant levels [1,2,3]. Traditional ventilation systems use fixed calculations to set wind speed, but shaft length variations and resistance changes during excavation affect fan performance [4]. Real-time harmful gas and dust levels also fluctuate [5]. Thus, static-speed ventilation systems are inadequate. Intelligent ventilation requires integrating environmental monitoring with predictive wind speed adjustments to control fan frequency converters effectively [6,7].
However, the frequency converter is only a speed control device and cannot calculate the optimal operating frequency or wind speed. During the excavation of the inclined shaft, the environment is complex and variable, requiring a system that can analyze the working face environment and calculate the fan’s operating frequency [8,9]. Therefore, Yang et al. [10] enhanced ventilation system reliability by creating a neural network to adjust fan frequency. Ren et al. [11] developed an artificial neural network for rapid CO2 prediction. However, while the neural network improves the accuracy through gradient descent, it will also fall into local optimum [12,13]. So, genetic algorithms, mimicking natural evolution, offer a parallel search for model optimization and have been applied to refine prediction models [14]. Inspired by biological evolution and genetic phenomena in nature, this method forms a parallel random search for optimal parameters. Genetic algorithms can be used to continuously search for the optimal parameters of a model and establish an optimal prediction model [15,16]. However, the process and method of the intelligent ventilation control system for collaborative prediction of wind speed based on environmental parameters within the scope of regulations are still unclear.
Variable-frequency drives have been widely used to reduce fan energy consumption by adjusting motor speed according to actual ventilation demand. In mine ventilation, the value of VFD technology is not limited to energy saving; it also provides an actuator basis for intelligent wind speed regulation under changing excavation and pollutant-release conditions. Therefore, recent studies on intelligent mine ventilation, ventilation-network assessment, fault diagnosis, and fan operating-mode optimization are more directly relevant to the present work [17,18,19,20].
Automatic control theory enables precise management of linear systems with clear input-output relations [21]. Yet, deriving physical relationships for control is often challenging [22,23]. PID controllers excel in managing systems with uncertain input-output dynamics due to their robustness and simplicity. They are widely used in various applications, including turbines and motors [24,25,26]. In mining, adaptive PID-based ventilation systems have proven effective in smoke diffusion control in tunnels, with real-time adjustments ensuring wind speed regulation [27,28]. Additionally, combining PID ventilation with 3D CFD simulations has shown potential in automatic smoke management, confirming PID’s feasibility and stability in such applications [29].
Recent international studies have also emphasized the need for intelligent and field-verifiable mine ventilation systems. Shen et al. [30] developed a machine-learning model for windage-alteration fault diagnosis of mine ventilation systems under unbalanced samples, demonstrating the value of wind-speed monitoring data for ventilation-state identification. Nguyen et al. [31] conducted a practical assessment of the ventilation system at Khe Cham Coal Mine in Vietnam, including field wind speed surveys, air-pressure evaluation, and fan operating-mode calculation. These studies indicate that intelligent ventilation should combine monitoring data, model-based diagnosis or prediction, and engineering verification. The present study follows this direction by integrating environmental monitoring, GA-BP wind-speed prediction, PID control, and PLC-based fan-frequency regulation for inclined-shaft ventilation.
In this study, the plateau inclined shaft refers to a high-altitude inclined excavation roadway where low air density, long-distance air supply, and time-varying pollutant release jointly affect the ventilation demand. When the fan installed in the plateau inclined shaft is operating, it runs at a constant frequency. However, the actual demand for wind speed in the plateau inclined shaft changes in real-time and does not match its design capacity. This situation leads to two disadvantages: wasted ventilation energy consumption and low efficiency. In order to maintain a suitable underground environment and climate while reducing the cost of the ventilation system, it is necessary to improve the operational efficiency of the ventilation and dust removal system [32,33,34]. Applying PID ventilation control technology to fans can effectively solve the above problems.
Dust concentration was included as a key control-related environmental parameter because it directly reflects pollutant-release intensity and occupational exposure risk during drilling, blasting, and slag-cleaning operations. For an inclined-shaft excavation face, the ventilation demand varies with the temporal evolution of dust generation. If the fan operates at a constant frequency, excessive ventilation may cause unnecessary energy consumption, whereas insufficient ventilation may increase dust accumulation in the working area. Therefore, real-time dust concentration, together with toxic gas concentration, temperature, and humidity, was used to predict the required wind speed and guide variable-frequency fan regulation.
The main contribution of this study lies in the construction of a field-oriented variable-frequency ventilation monitoring and control system for plateau inclined-shaft excavation. Different from conventional constant-frequency ventilation or single-parameter feedback control, the proposed system uses multi-source environmental parameters to collaboratively predict the required wind speed, converts the prediction result into a fan frequency-control target through PID regulation, and implements real-time closed-loop control through a PLC platform. The engineering novelty is reflected in the integration of environmental sensing, GA-BP wind-speed prediction, PID-based fan regulation, and PLC execution into a unified ventilation-control framework, which enables adaptive adjustment of ventilation intensity under dynamically changing dust-release and excavation conditions.

2. Inclined Shaft Intelligent Ventilation Control Theory

2.1. Extraction of Key Environmental Parameters of Wind Speed in Inclined Shaft

The field monitoring was conducted in an inclined shaft used for the construction of the Sichuan–Tibet Railway in the Sejila Mountain area, at an altitude of approximately 3500 m. The monitored excavation face was subjected to periodic drilling, blasting, and slag-cleaning operations. Compared with ordinary low-altitude underground roadways, the plateau inclined shaft is characterized by lower air density, longer air-supply distance, larger ventilation resistance, and stronger temporal variation in dust and gas release. These characteristics make the actual ventilation demand at the excavation face change continuously with both the working process and the environmental state.
Under conventional constant-frequency ventilation, the fan operating condition is usually determined according to a fixed design value, which is difficult to match the real-time ventilation demand during different excavation stages. Therefore, the present study uses field-monitored environmental parameters, including dust concentration, toxic gas concentration, temperature, humidity, and wind speed, to establish a collaborative wind-speed prediction model and provide the control target for PLC-PID-based variable-frequency ventilation.
The supply wind speed of the inclined well fan is determined by the real-time changing required wind speed. The total wind pressure on the blade surface is determined by both the air resistance and the air supply volume [35,36].
V = f C gas 1 , C gas 2 C gas n , C p , C T , T , H
N 1 N 2 = n 1 n 2 3
E = 1 ( n 2 n 1 ) 3 × N 1 × t
In the formula: C gas is the mass concentration of n toxic and harmful gases on the working face, mg/m3; C p is the mass concentration of respirable dust on the working face, mg/m3; C T is the total dust mass concentration of the working face, mg/m3; H is humidity, %; T is temperature, °C; n 1 , n 2 is the fan speed, r/min; N 1 , N 2 is the fan speed before and after the power, kW; E is the theoretical power saving, kW·h; t is the working time of the fan, s.
From the above equation, it is evident that there exists a strong nonlinear mapping relationship between the environmental parameters of the inclined shaft and the wind speed. Therefore, through the analysis of data acquired from monitoring apparatuses, it is feasible to forecast wind speed with precision. This prognostication enables the strategic operation of variable-frequency fans, ensuring they supply the requisite volume of air to the working face. Concurrently, this approach optimizes energy efficiency by curtailing superfluous electrical usage. Therefore, it is very important to establish a mapping relationship between multiple environmental parameters and wind speed to guide variable frequency ventilation.
The environmental input parameters were selected according to two criteria: regulatory relevance to mine safety and availability of continuous field-monitoring data. The monitored variables included total dust concentration, respirable dust concentration, temperature, humidity, nitrogen dioxide, carbon monoxide, hydrogen sulfide, and methane concentration. Among them, total dust, respirable dust, temperature, humidity, nitrogen dioxide, carbon monoxide, and hydrogen sulfide were used as candidate variables for grey correlation analysis because they exhibited continuous variation during the monitoring period. Methane concentration was retained as an independent safety-alarm variable in the PLC control system. Since methane remained at a low and nearly constant level during the test period, it was not included in the GA-BP training dataset to avoid introducing a weakly informative input variable. Roadway ventilation resistance and tunneling progress are important slowly varying boundary conditions. Their effects are partly reflected by the measured wind speed and fan operating state, but they were not directly included in the present prediction model because continuous resistance and advance-rate data were not available.
In order to improve the accuracy of the above mapping relationship, the grey correlation analysis algorithm is used to extract the key factors affecting the wind speed and improve the prediction accuracy. Eight fundamental environmental parameters are selected, namely, the concentration of nitrogen dioxide on the working face X k ( 1 ) , carbon monoxide concentration X k ( 2 ) , hydrogen sulfide concentration X k ( 3 ) , respirable dust concentration X k ( 4 ) , total dust concentration X k ( 5 ) , temperature X k ( 6 ) , and humidity X k ( 7 ) , as indicators for predicting the wind speed in inclined shaft. The analysis sequence of the prediction indicators can be obtained from the monitoring data of h groups of environmental parameters.
X 1 ( 0 ) X 1 ( 1 ) X 1 ( 7 ) X 2 ( 0 ) X 2 ( 1 ) X 2 ( 7 ) X h ( 0 ) X h ( 1 ) X h ( 7 ) ( k = 1 , 2 , , h )
Each data group in the monitoring sequence contains one historical wind-speed value and seven environmental prediction indicators, including total dust concentration, respirable dust concentration, temperature, humidity, nitrogen dioxide concentration, carbon monoxide concentration, and hydrogen sulfide concentration. The Lth environmental indicator vector X ( l ) can be represented as: X ( l ) = X 1 ( l )   X 2 ( l ) X h ( l ) T , l = 1 , 2 , , 7 . Normalizing the environmental monitoring data can eliminate the impact caused by different units and value ranges among the original data. The normalization of X ( l ) is obtained by averaging it.
X ( 0 ) ( l ) = X 1 ( l ) X ¯ ( l )   X 2 ( l ) X ¯ ( l )     X h ( l ) X ¯ ( l ) T
In the formula, X ( 0 ) ( l ) represents the result after averaging, and X ¯ ( l ) represents the mean value of the Lth environmental index vector.
Calculate the correlation coefficient between each predicted indicator and the required wind speed:
ξ l , 0 ( k ) = min l min k Δ l ( k ) + ρ max l max k Δ l ( k ) Δ l ( k ) + ρ max l max k Δ l ( k )
In the formula, ξ l , 0 ( k ) is the correlation coefficient of the kth group prediction point to the wind speed; Δ l ( k ) = X k ( l ) X k ( 0 ) , Δ l ( k ) is the absolute difference between the Lth prediction index value of the kth prediction point and the required wind speed; min l min k Δ l ( k ) is the minimum value of Δ l ( k ) , max l max k Δ l ( k ) is the maximum value of Δ l ( k ) ; ρ is the resolution coefficient, usually 0.5.
Calculate the correlation between wind speed and various predictive indicators:
ε l , 0 = 1 h k = 1 h ξ l , 0 ( k )
The following seven environmental parameters were measured on-site: wind speed, total dust, respirable dust, temperature and humidity, nitrogen dioxide, carbon monoxide, and hydrogen sulfide. When the correlation coefficient is greater than or equal to 0.8, the environmental parameter is highly correlated with wind speed. When the correlation coefficient is between 0.5 and 0.8, the environmental parameter is moderately correlated with wind speed. When the correlation coefficient is between 0.3 and 0.5, the environmental parameter is weakly correlated with wind speed. When the correlation coefficient is less than 0.3, the environmental parameter is essentially unrelated to wind speed. The correlation coefficients between each environmental parameter and wind speed are shown in Table 1 after calculation.
According to the results shown in the table above, the importance ranking of various environmental parameters is displayed. Based on these rankings, we have identified the crucial factors that affect the wind speed in inclined wells. Using the aforementioned extracted crucial factors, they will serve as the training set for the multiple linear regression prediction model and the genetic-neural network wind speed prediction model to forecast environmental wind speeds. This will establish a data foundation for the subsequent construction of wind speed prediction models.
Humidity showed the highest comprehensive grey correlation degree among the monitored variables. During drilling, blasting, and slag-cleaning operations, humidity is affected by water spraying, evaporation from wet surfaces, dust-suppression activities, and wind speed exchange. These processes are also closely associated with dust concentration and ventilation demand. Therefore, humidity can act as an integrated indicator reflecting the microclimatic and operational state of the excavation face, which explains its high correlation with the required wind speed in the present monitoring dataset.

2.2. Inclined Shaft Variable Frequency Wind Speed Control Technology Based on PID Control

The PID controller enables feedback closed-loop control based on actual environmental parameters. It primarily consists of perceiving the actual wind speed, setting control objectives, determining deviations, adjusting parameters, and implementing actions. The PID controller is composed of proportional, integral, and derivative controllers, which interact and interconnect to reduce the difference in control signals, gradually approaching the predicted value of wind speed monitored by wind sensor. The PID control rate can be expressed as Equation (7).
u ( t ) = K p e ( t ) + 1 T I 0 t e ( t ) d t + 1 T D d e ( t ) d t
In the formula, u ( t ) is the system control quantity; e ( t ) is the deviation between the measured wind speed value and the predicted wind speed value at time t; Kp is proportional gain; TI is the integral time constant; TD is a differential time constant.
When the proportional gain approaches zero, the controller’s output is not affected by the input error e ( t ) , which is equivalent to the control system being in a non-operational state. When the proportional gain is large, even a small error can cause a significant change in the controller’s output u ( t ) . The larger the error e ( t ) , the greater its contribution to the feedback. Although the proportional control term can achieve control over the system, it may result in steady-state error and oscillations near the target control value, thus failing to ensure stability of the control system. The integral control term K i e ( t ) d t can eliminate oscillations and steady-state error, maintaining system stability. The integral time is inversely proportional to the integral action, meaning that a shorter integral time leads to a greater integral action, allowing for faster correction of deviations. However, an excessively short integral time may lead to instability. The derivative control term K d d e ( t ) d t can predict the trend of error changes and proactively suppress the control effect of errors to avoid excessive regulation of the controlled variable. However, sometimes it can also cause system instability.

3. Prediction Model and Control Characteristics of the Intelligent Ventilation System

3.1. Wind Speed Prediction Model of Intelligent Ventilation System in Inclined Shaft

3.1.1. Multiple Linear Regression Prediction Wind Speed Model

The environmental parameters measured on-site were imported into MATLAB R2024a. A multivariate linear regression algorithm was utilized to establish a predictive mathematical model for nitrogen dioxide, total dust, respirable dust, temperature, and humidity in relation to the required wind speed in the inclined shaft. Please refer to Equation (8) for more details.
y = 0.45 x 1 + 0.69 x 2 + 0.31 x 3 0.19 x 4 0.11 x 5
In the formula, y is the predicted wind speed of inclined shaft, m/s; x 1 is the concentration of nitrogen dioxide, mg/m3; x 2 is total dust concentration, mg/m3; x 3 is respirable dust concentration, mg/m3; x 4 is the operating temperature, °C; x 5 is the operating humidity, %.
The regression coefficients for the predictive algorithm are measured as R 2 = 0.87 , F = 79.43 , p < 0.00001 , and s 2 = 0.14 . The results indicate that this multiple regression analysis holds some significance. The predicted wind volume from the obtained multiple linear regression model is compared with the original wind volume. Please refer to Figure 1 for the comparison results.

3.1.2. Genetic-Neural Network Prediction Wind Speed Model

(1) Neural network algorithm
The artificial neural network utilizes a three-tier logical structure that resembles the cognitive recognition of the human brain. The initial tier serves as the input layer, responsible for feeding crucial environmental parameters into the network. The hidden layer may consist of multiple nodes, depending on the requirements for information volume and predictive accuracy. Lastly, the output layer utilizes the strength of connections between the input layer, hidden layer, and nodes to forecast the required wind speed.
(2) Genetic algorithm
In order to enhance the accuracy of neural network prediction, highly correlated environmental parameters are selected as input neurons, and the data are extracted as the input sample set of the prediction model. The output neurons are determined by the wind speed in inclined shaft, and the activation function of the hidden layer can be represented as:
R x a c i = exp 1 2 b i 2 x a c i 2
In the formula, x a ( a = 1 , 2 , , h ) is the a th input sample; c i = c i 1 , c i 2 , , c i j T ( j = 1 , 2 , , p ) is the i th center point vector of the hidden layer; b i is the width of the i th center point of the hidden layer.
The predicted value Y of the network output wind speed is:
Y = a = 1 q ω a exp 1 2 b i 2 x a c i 2
In the formula, ω a represents the weight of the output of the ath training sample value, and q represents the number of hidden layer nodes.
Genetic algorithms are utilized to optimize the model using historical ventilation data. The essence of this approach lies in updating the weight thresholds based on the error between the output values of the neural network and the expected values, until the specified error between the output and expected values is minimized. The objective function is defined as follows:
E g = i = 1 h e ( a )
In the formula, e ( a ) is the error between the network output and the corresponding historical wind speed, and a is the group a monitoring data.
When the optimal solution is found, the generated weight and threshold values represent the optimal training parameters. After undergoing genetic operations, the individual with the highest fitness is selected to decode the offspring’s neural network for predicting wind speed in palm leaf fans.
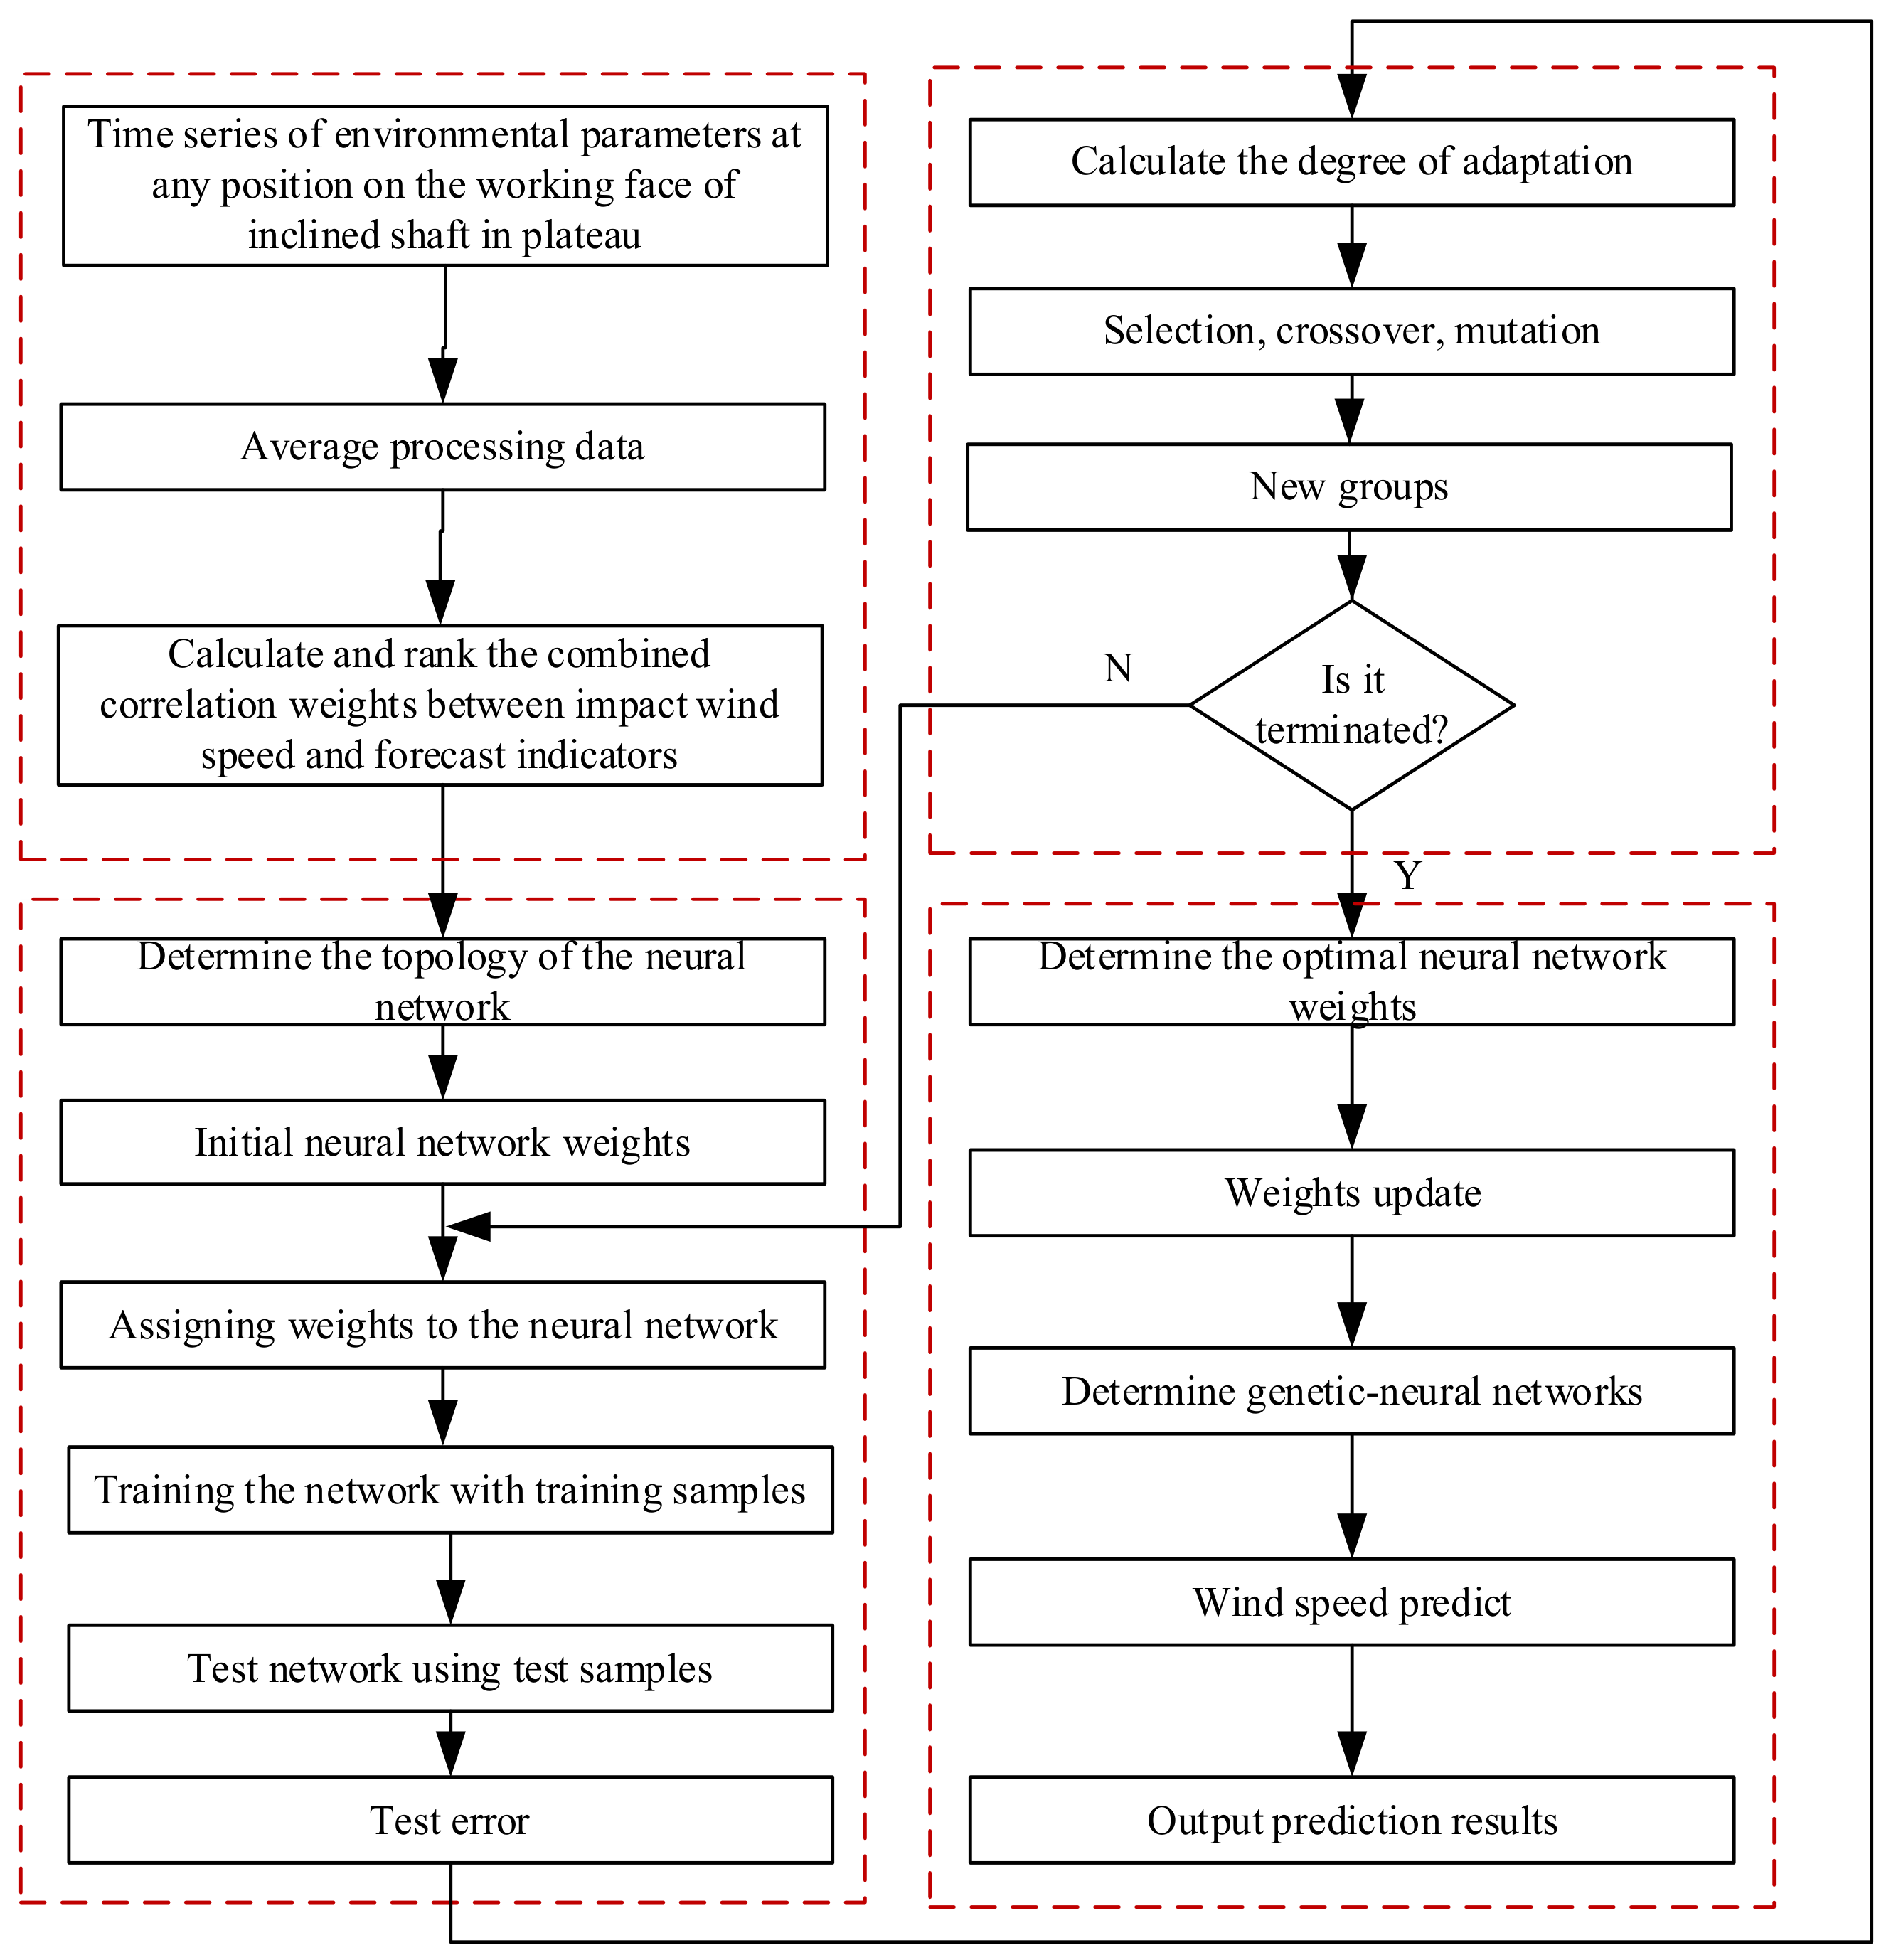
Based on historical monitoring data at the corresponding monitoring location, the grey correlation analysis algorithm is utilized to extract the crucial environmental parameters that affect the wind volume in inclined wells. Subsequently, a neural network wind speed prediction model is trained. The process of co-predicting wind speed based on environmental parameters is illustrated in Figure 2.
(3) Genetic-neural network training
The dataset was divided into training, validation, and testing subsets according to a ratio of 70%:15%:15%. Before model training, abnormal values caused by sensor interruption, communication failure, or instantaneous abnormal fluctuation were removed. All input variables were normalized to eliminate the influence of different units and magnitude ranges among environmental parameters.
After organizing the on-site test data, statistical analysis was conducted on the average values of various environmental parameters during different time periods. These values were then entered into MATLAB for training the genetic-neural network model. The network structure of the genetic-neural network model was trained based on the aforementioned design model.
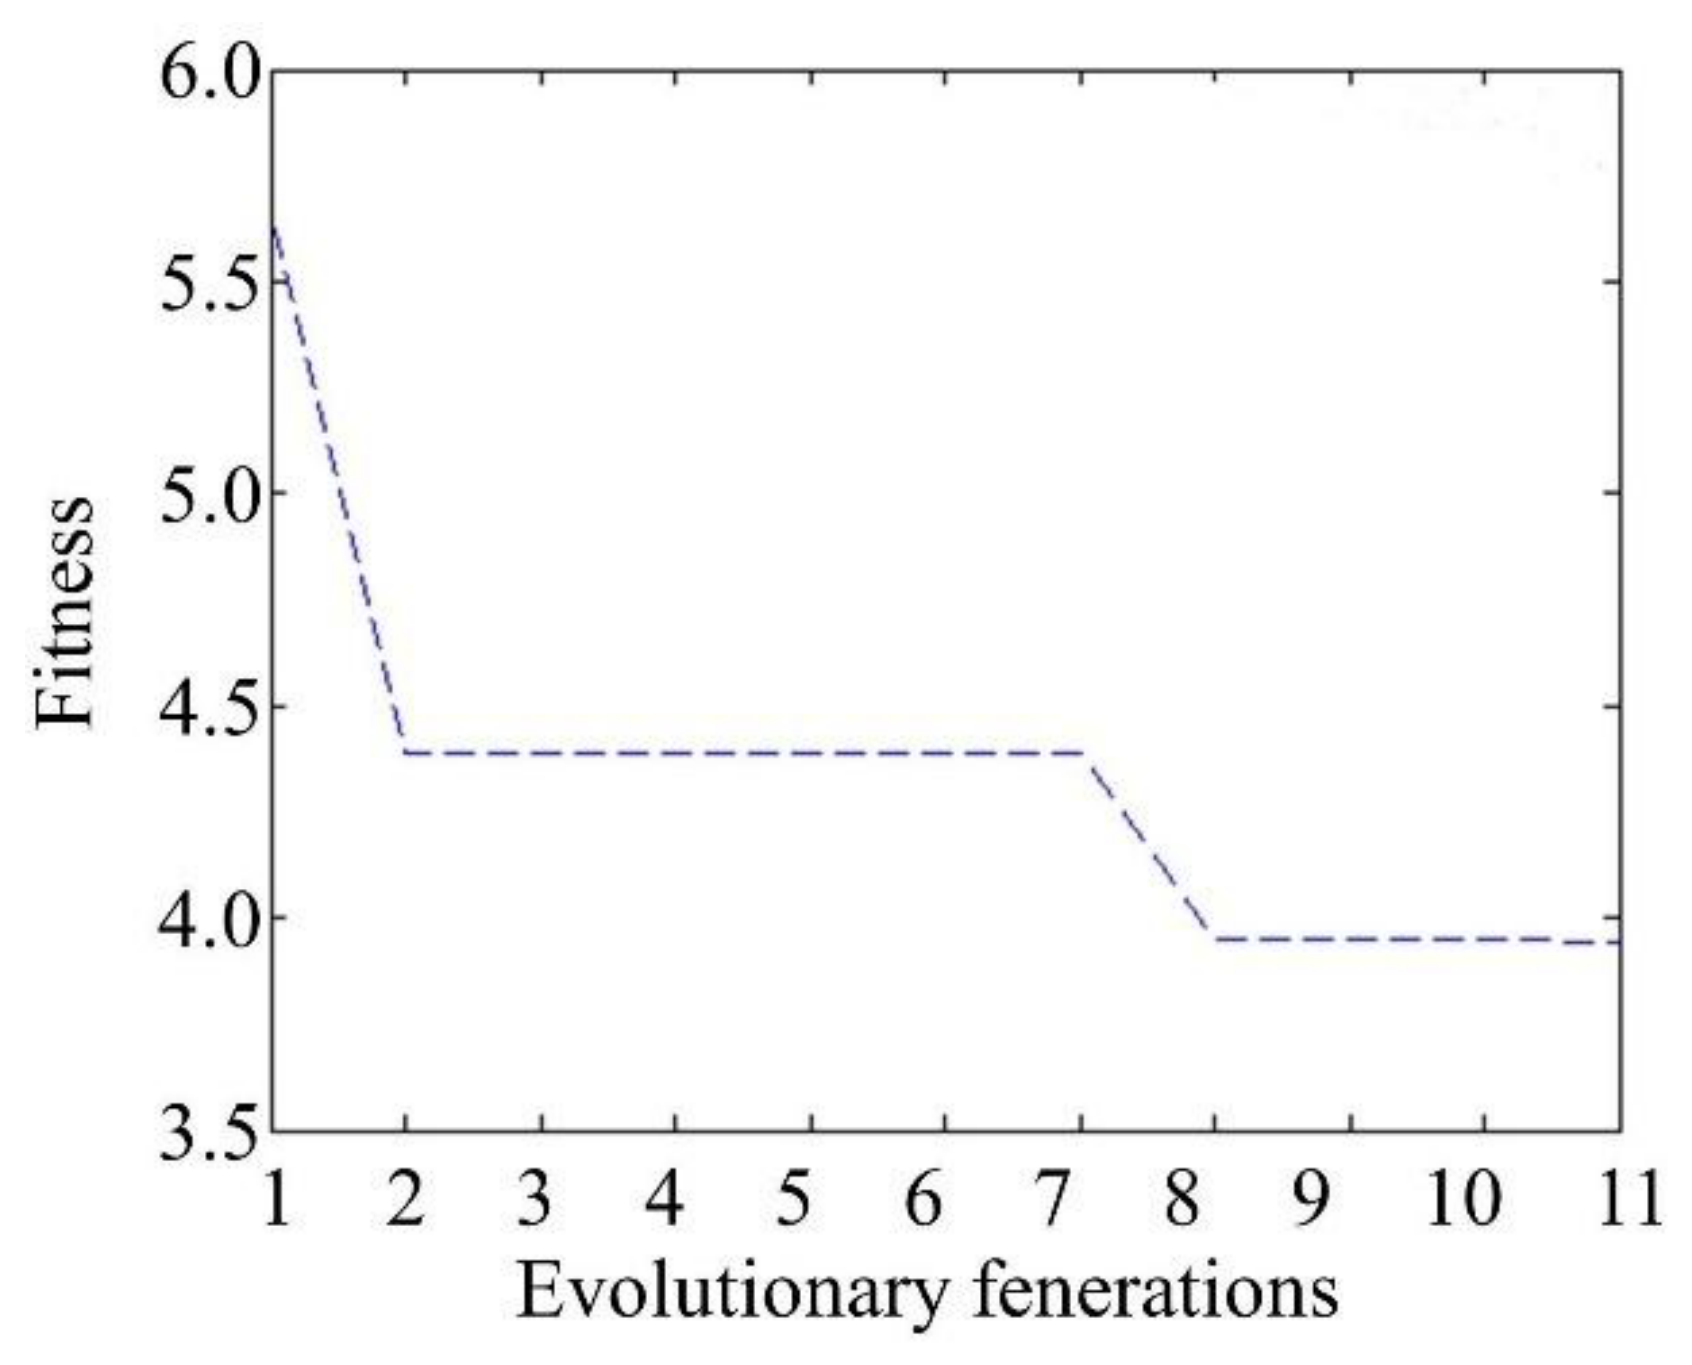
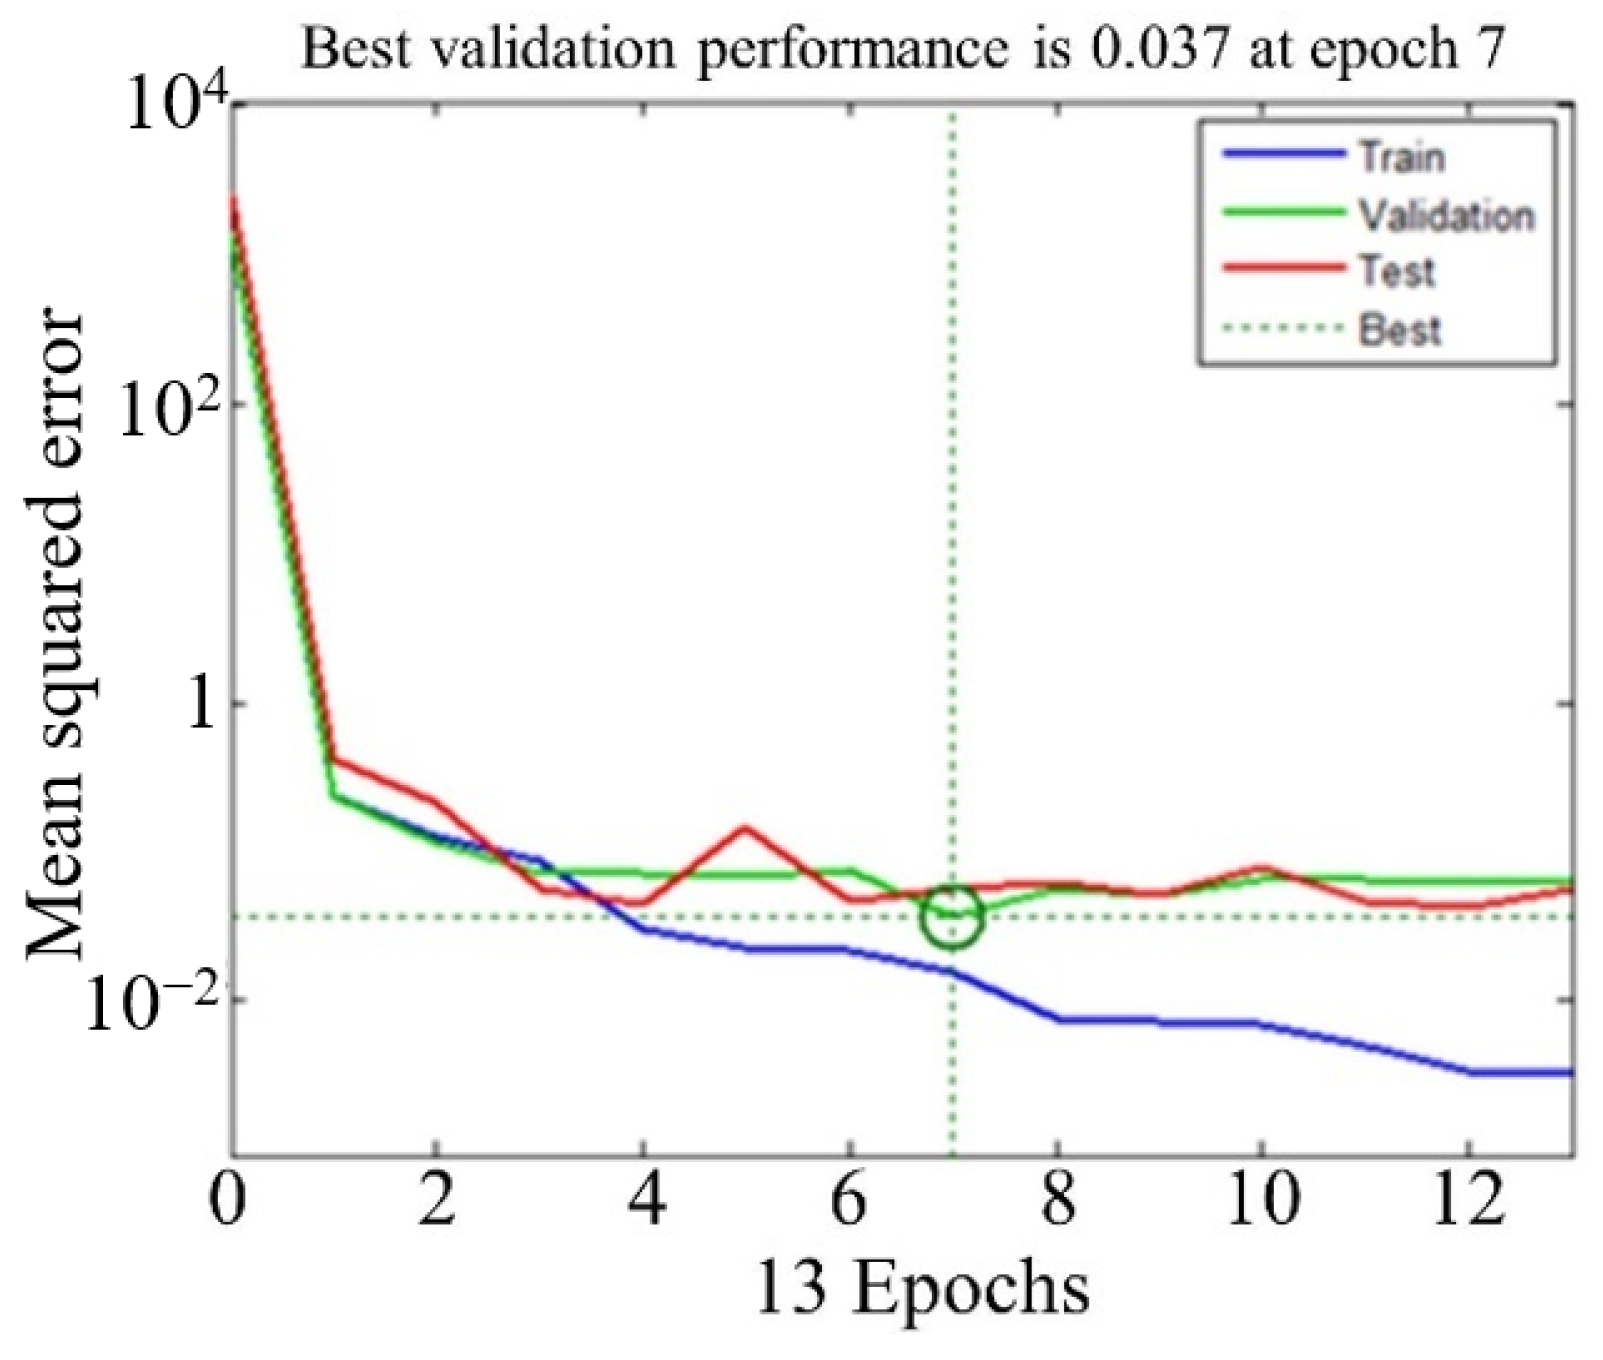
In the process of training the BP neural network, we obtained the fitness curve (Figure 3) and the error performance curve (Figure 4) after training. From Figure 3, it can be observed that the output error of the training samples reached the desired error of 0.036 after the 7th training iteration. Under the input of confirmation and testing samples, the network’s output error exhibited a declining trend, indicating that the BP neural network possesses excellent fitting capability.
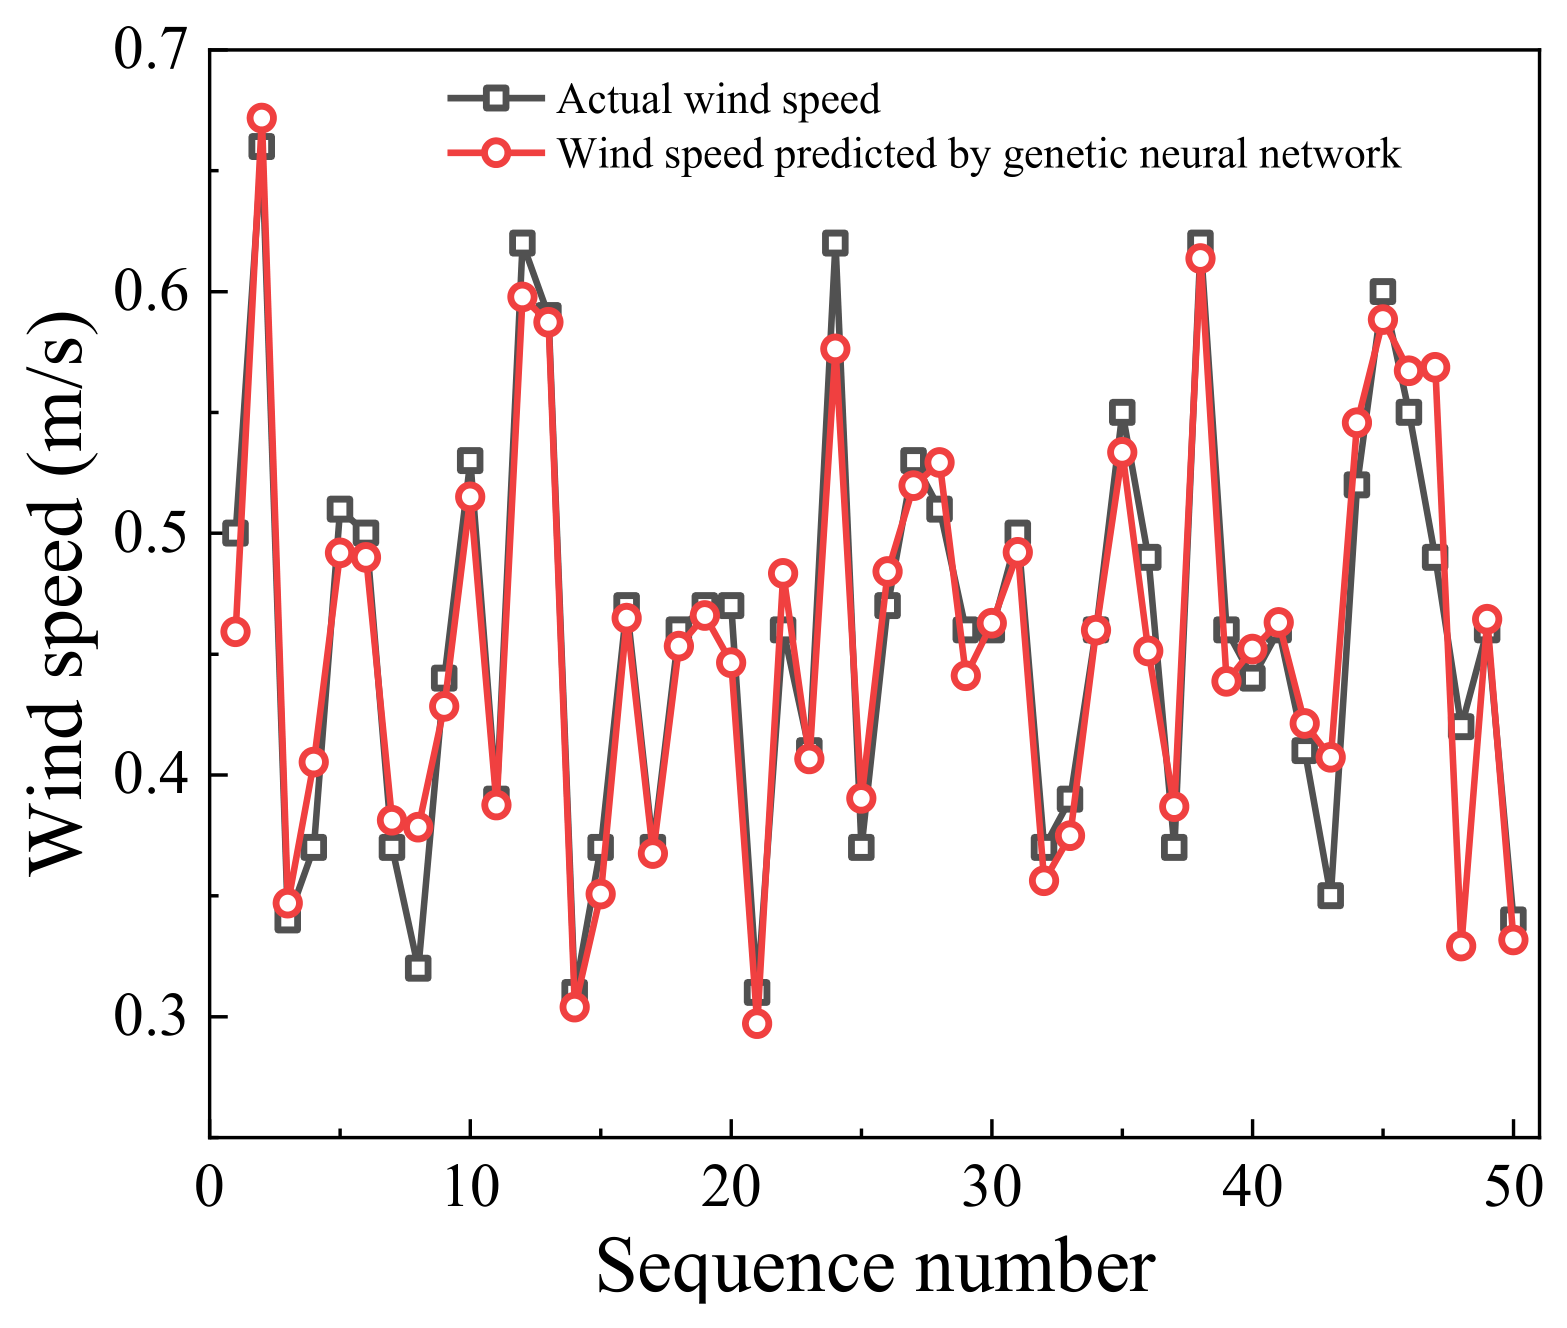
To verify the reliability of the algorithm, the GA-BP neural network prediction model was compared with the wind speed of the inclined well palm noodle. The data comparison results are shown in Figure 5. From the figure, it can be observed that the GA-BP neural network exhibits a good fitting effect, with an error between the original and predicted data ranging from −0.095 to 0.07.
(4) Genetic-neural network simulation
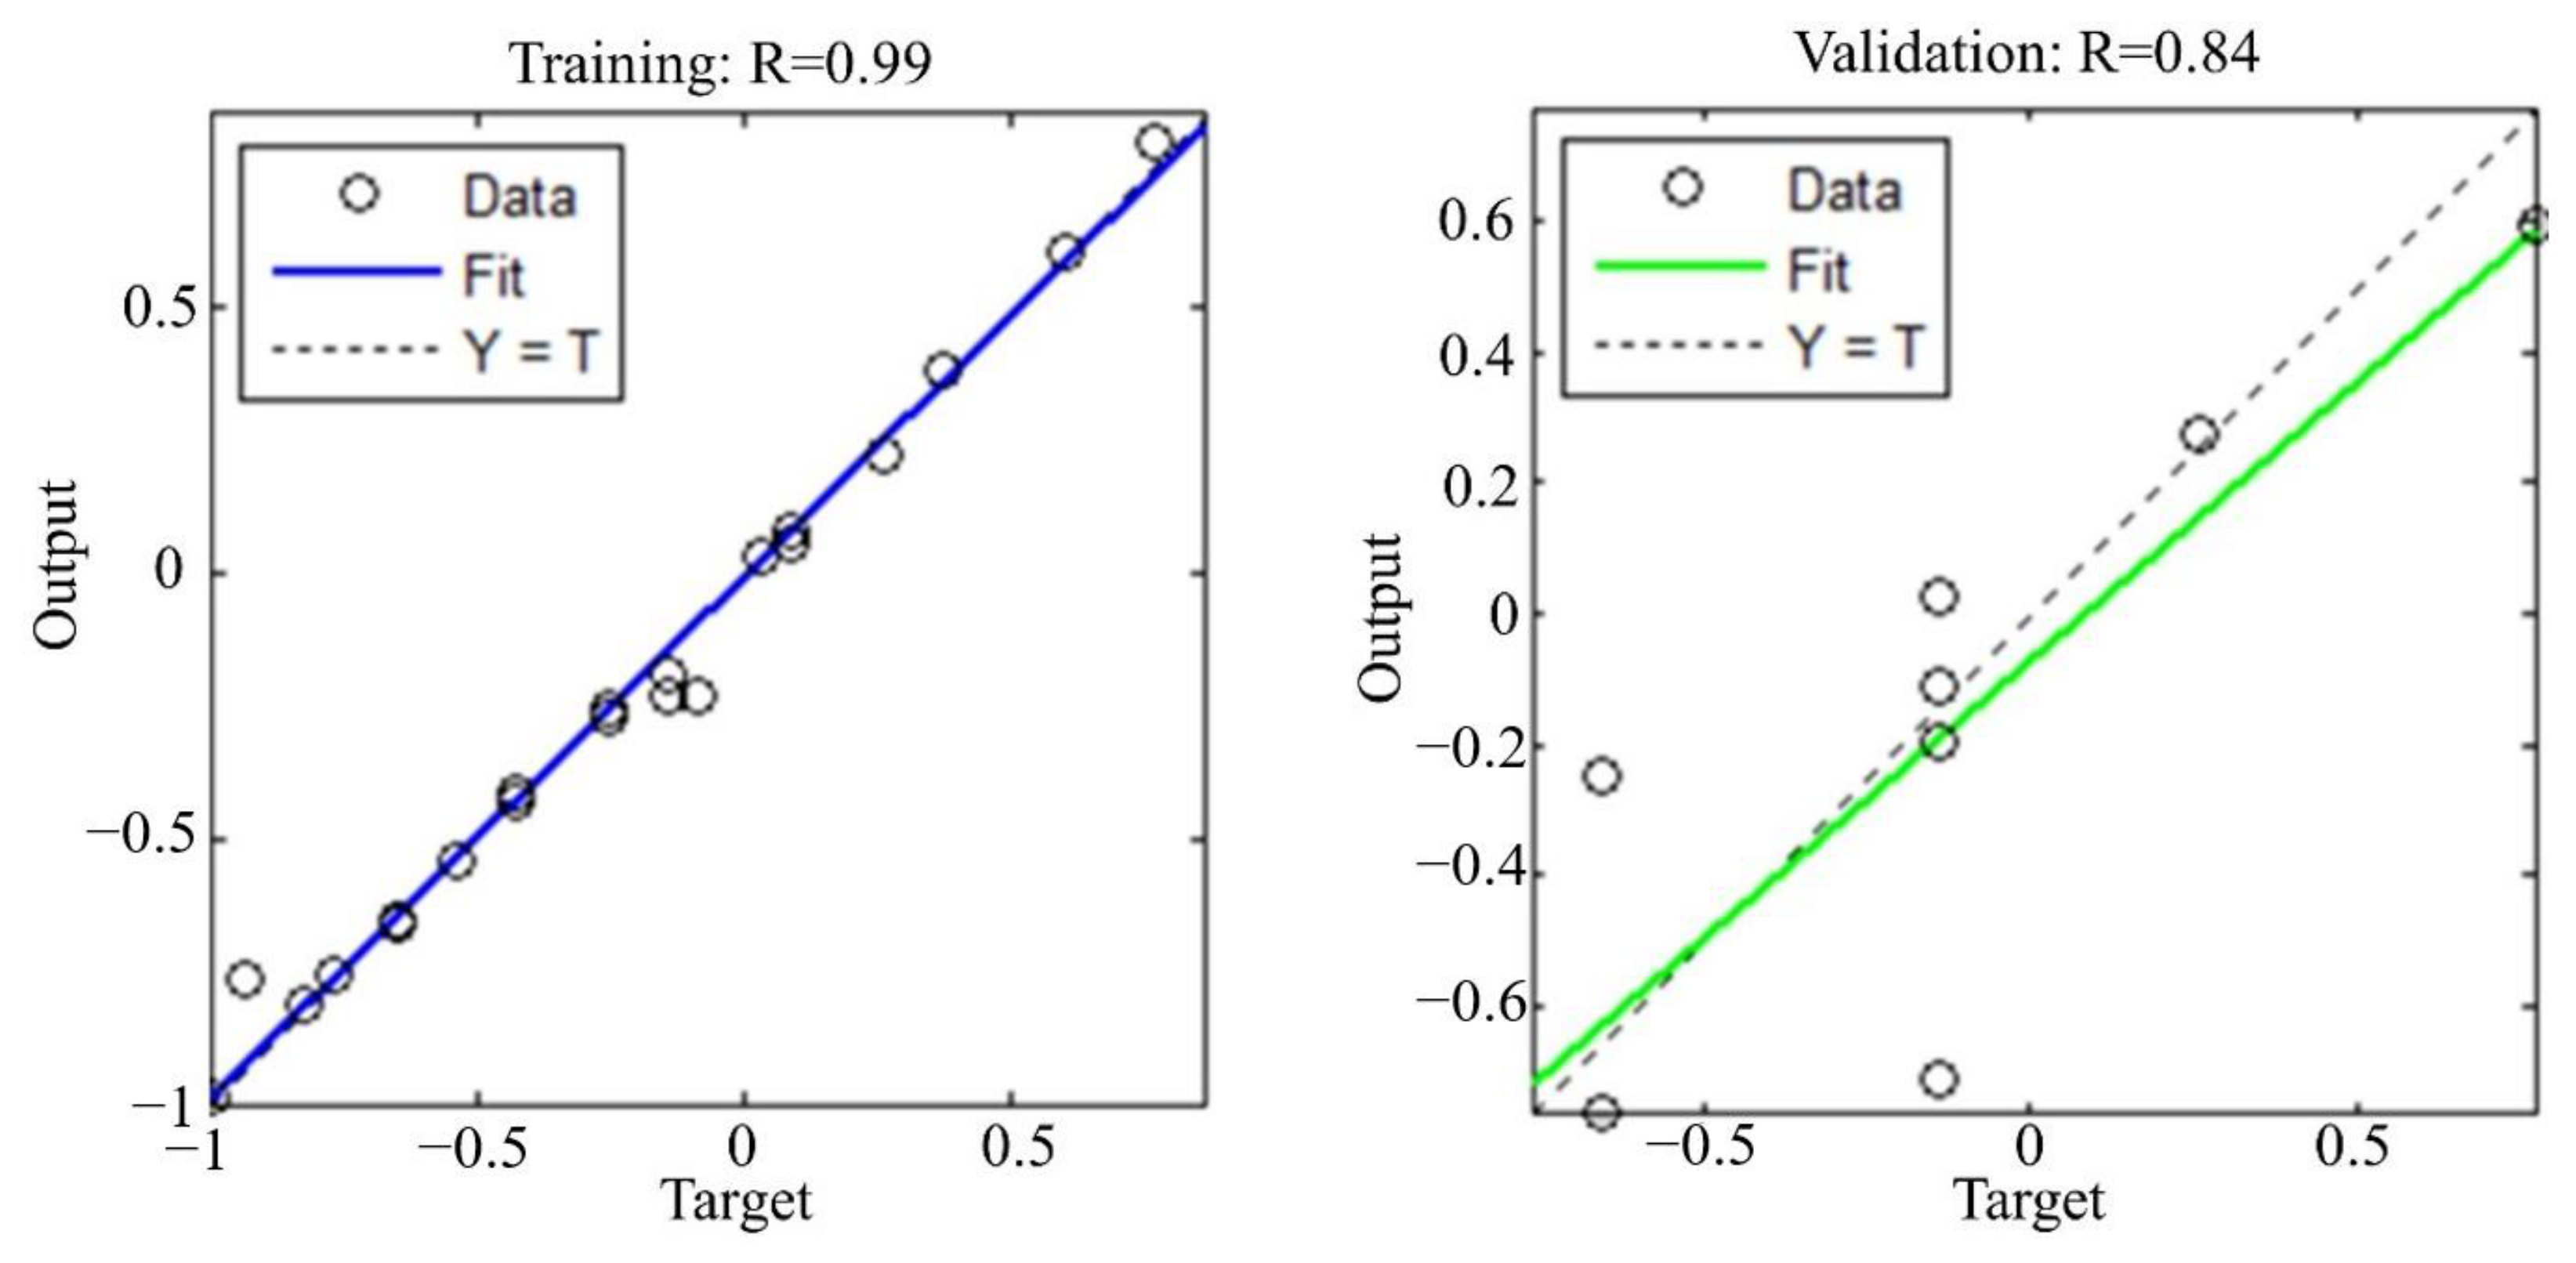
In the training and validation samples, the performance of the genetic-neural network simulation is measured by the correlation coefficient R between the actual output and the target output. As shown in Figure 6, the correlation coefficient between the actual output and the target output in the training sample is approximately R = 0.994, indicating a nearly perfect match. In the validation sample, the correlation coefficient between the actual output and the target output is R = 0.84368, demonstrating a good match between the actual and target outputs. The fitting performance curve indicates that the genetic-neural network exhibits excellent fitting capability.
The generalization ability (i.e., predictive ability) and training ability (i.e., learning ability) of a network are positively correlated to some extent. As the training ability strengthens, the predictive ability also improves accordingly. However, once the training ability reaches a certain limit, the network’s generalization ability actually decreases, resulting in overfitting. This phenomenon occurs because there is an excessive pursuit of minimizing training errors during the process of training neural networks.
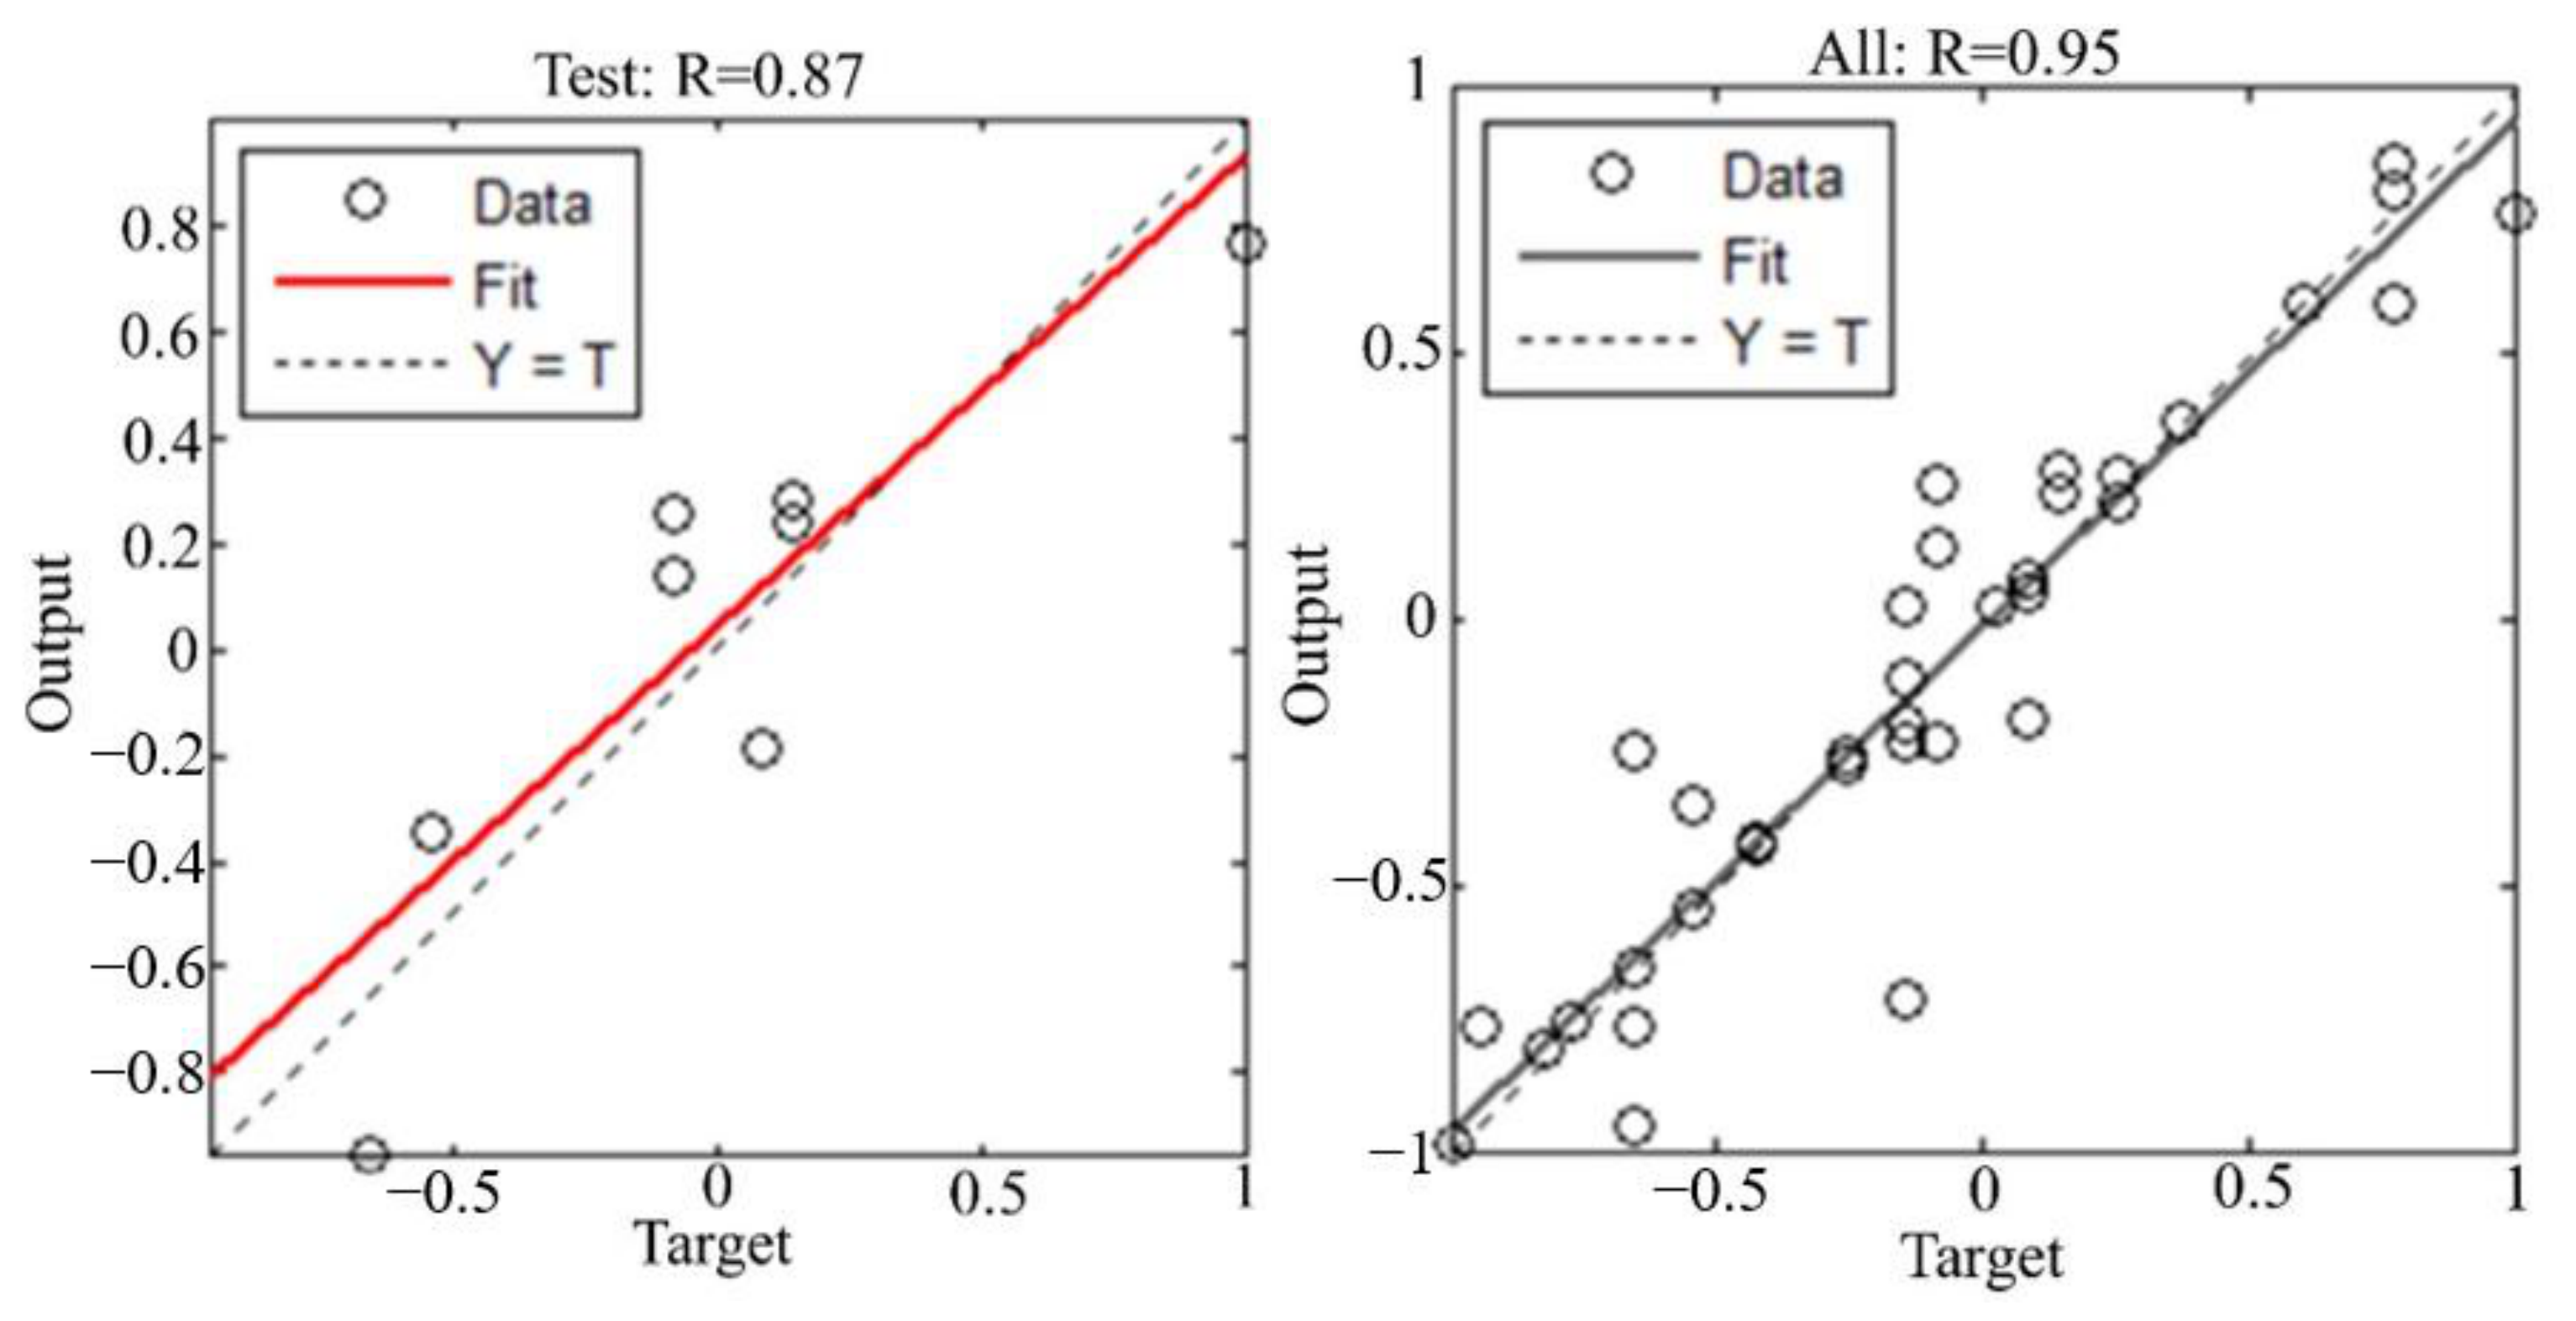
A good neural network is not only reflected in its ability to fit existing data, but more importantly, in its ability to predict unknown data, known as generalization ability. To verify the generalization ability of a well-trained BP network model, six sets of test samples were randomly selected, and the results are shown in Figure 7.
The fitting and predictive abilities of the BP network can be measured by the correlation coefficient R = 0.8685 between the actual output and the target output of the network on the test samples, indicating a strong generalization capability. By considering the correlation coefficients of the training, validation, and test samples, we can accurately assess the excellent fitting and predictive abilities of the BP network.

3.1.3. Comparison of the Effect of Inclined Shaft Wind Speed Prediction Model

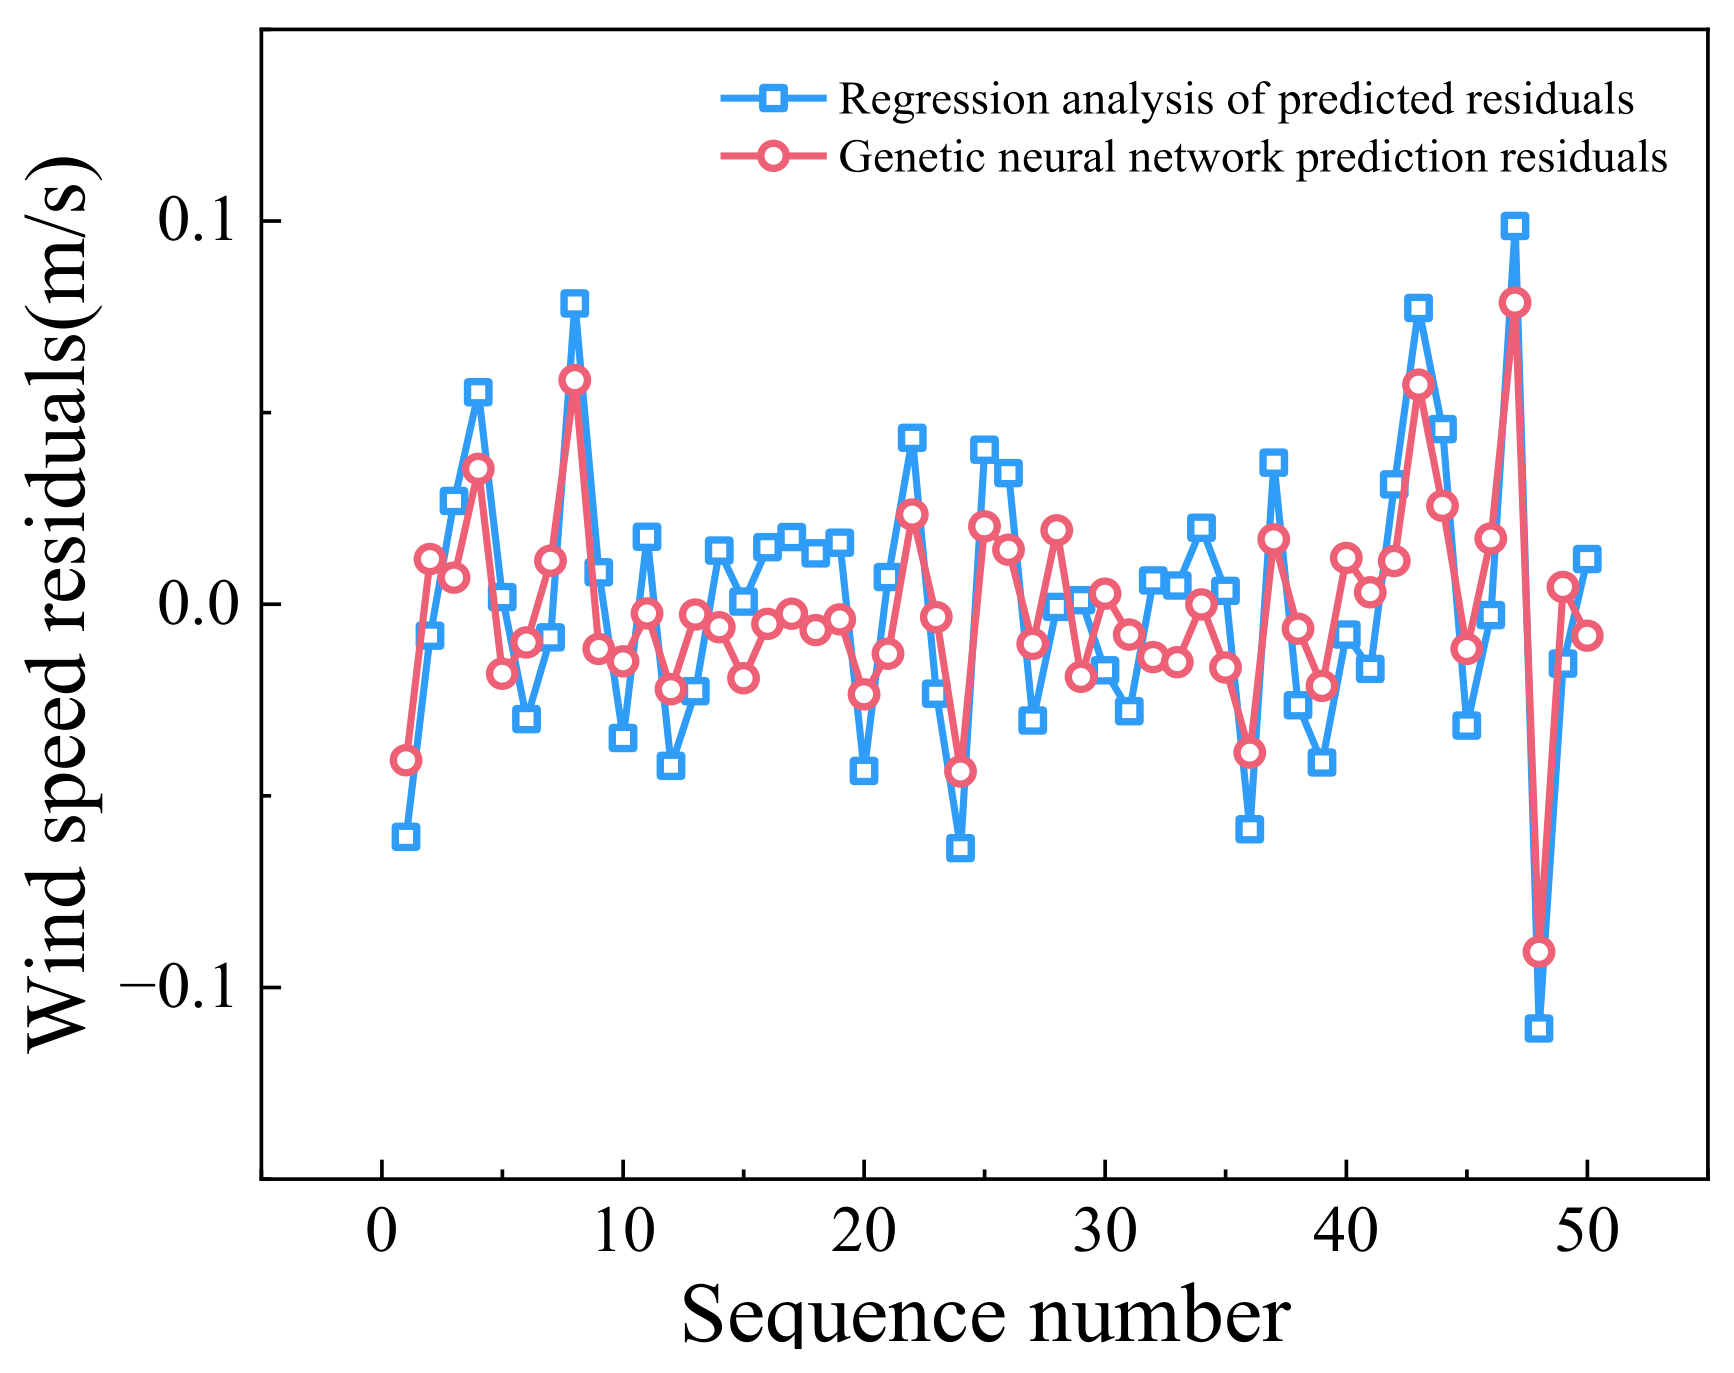
Upon comparing Figure 1 and Figure 5, it is evident that there are certain disparities between the multiple linear regression analysis prediction model and the genetic-neural network wind speed prediction model. By calculating the residual values between the actual and predicted wind speeds for different prediction models, the predictive performance of these models can be observed in Figure 8.
According to Figure 8, the predictive performance of the genetic neural network is superior to that of multiple linear regression analysis. The standard deviation of the predictive results for multiple linear regression analysis is 0.0015, while the standard deviation for the genetic neural network wind speed prediction model is 0.0007. It is evident that the genetic neural network exhibits better predictive performance and a more stable effect.
To further evaluate the prediction performance of the proposed GA-BP model, random forest, RBF neural network, and LSTM models were introduced as benchmark methods. All models were trained and tested using the same monitoring dataset and the same input variables. The model performance was assessed using MAE, RMSE, MAPE, R2, training time, and prediction time.
As shown in Table 2, the GA-BP neural network achieved the lowest MAE, RMSE, and MAPE among the tested models, with an R2 value of 0.914. Compared with the multiple linear regression model, the GA-BP model reduced MAE and RMSE by 55.9% and 53.9%, respectively, indicating that the nonlinear relationship between environmental parameters and wind speed can be better captured by the optimized neural network. Although the LSTM model has advantages in long time-series prediction, its performance was limited by the relatively small number of continuous monitoring samples in this study. The random forest model showed relatively stable prediction accuracy, but its piecewise output was less suitable for smooth closed-loop fan-frequency regulation. The RBF neural network converged rapidly, but its prediction accuracy was more sensitive to the selection of hidden-layer parameters. Therefore, considering prediction accuracy, computational cost, output smoothness, and engineering applicability, the GA-BP neural network was selected as the wind-speed prediction model for the proposed PLC-PID variable-frequency ventilation control system.

3.2. Numerical Simulation of PID Variable Frequency Ventilation Based on Wind Speed Prediction Model

The ventilation in the tunnel is typically unidirectional, thus the controller’s output cannot be directly used as the ventilation speed for the fan. In practical applications, the ventilation rate of the fan is adjusted using a function.
V ( t ) = u ( t ) u ( t ) 0 0 u ( t ) < 0
In the formula, V(t) is the ventilation speed of the fan at time t, m/s; u(t) is the wind speed prediction result of the prediction model, m/s.
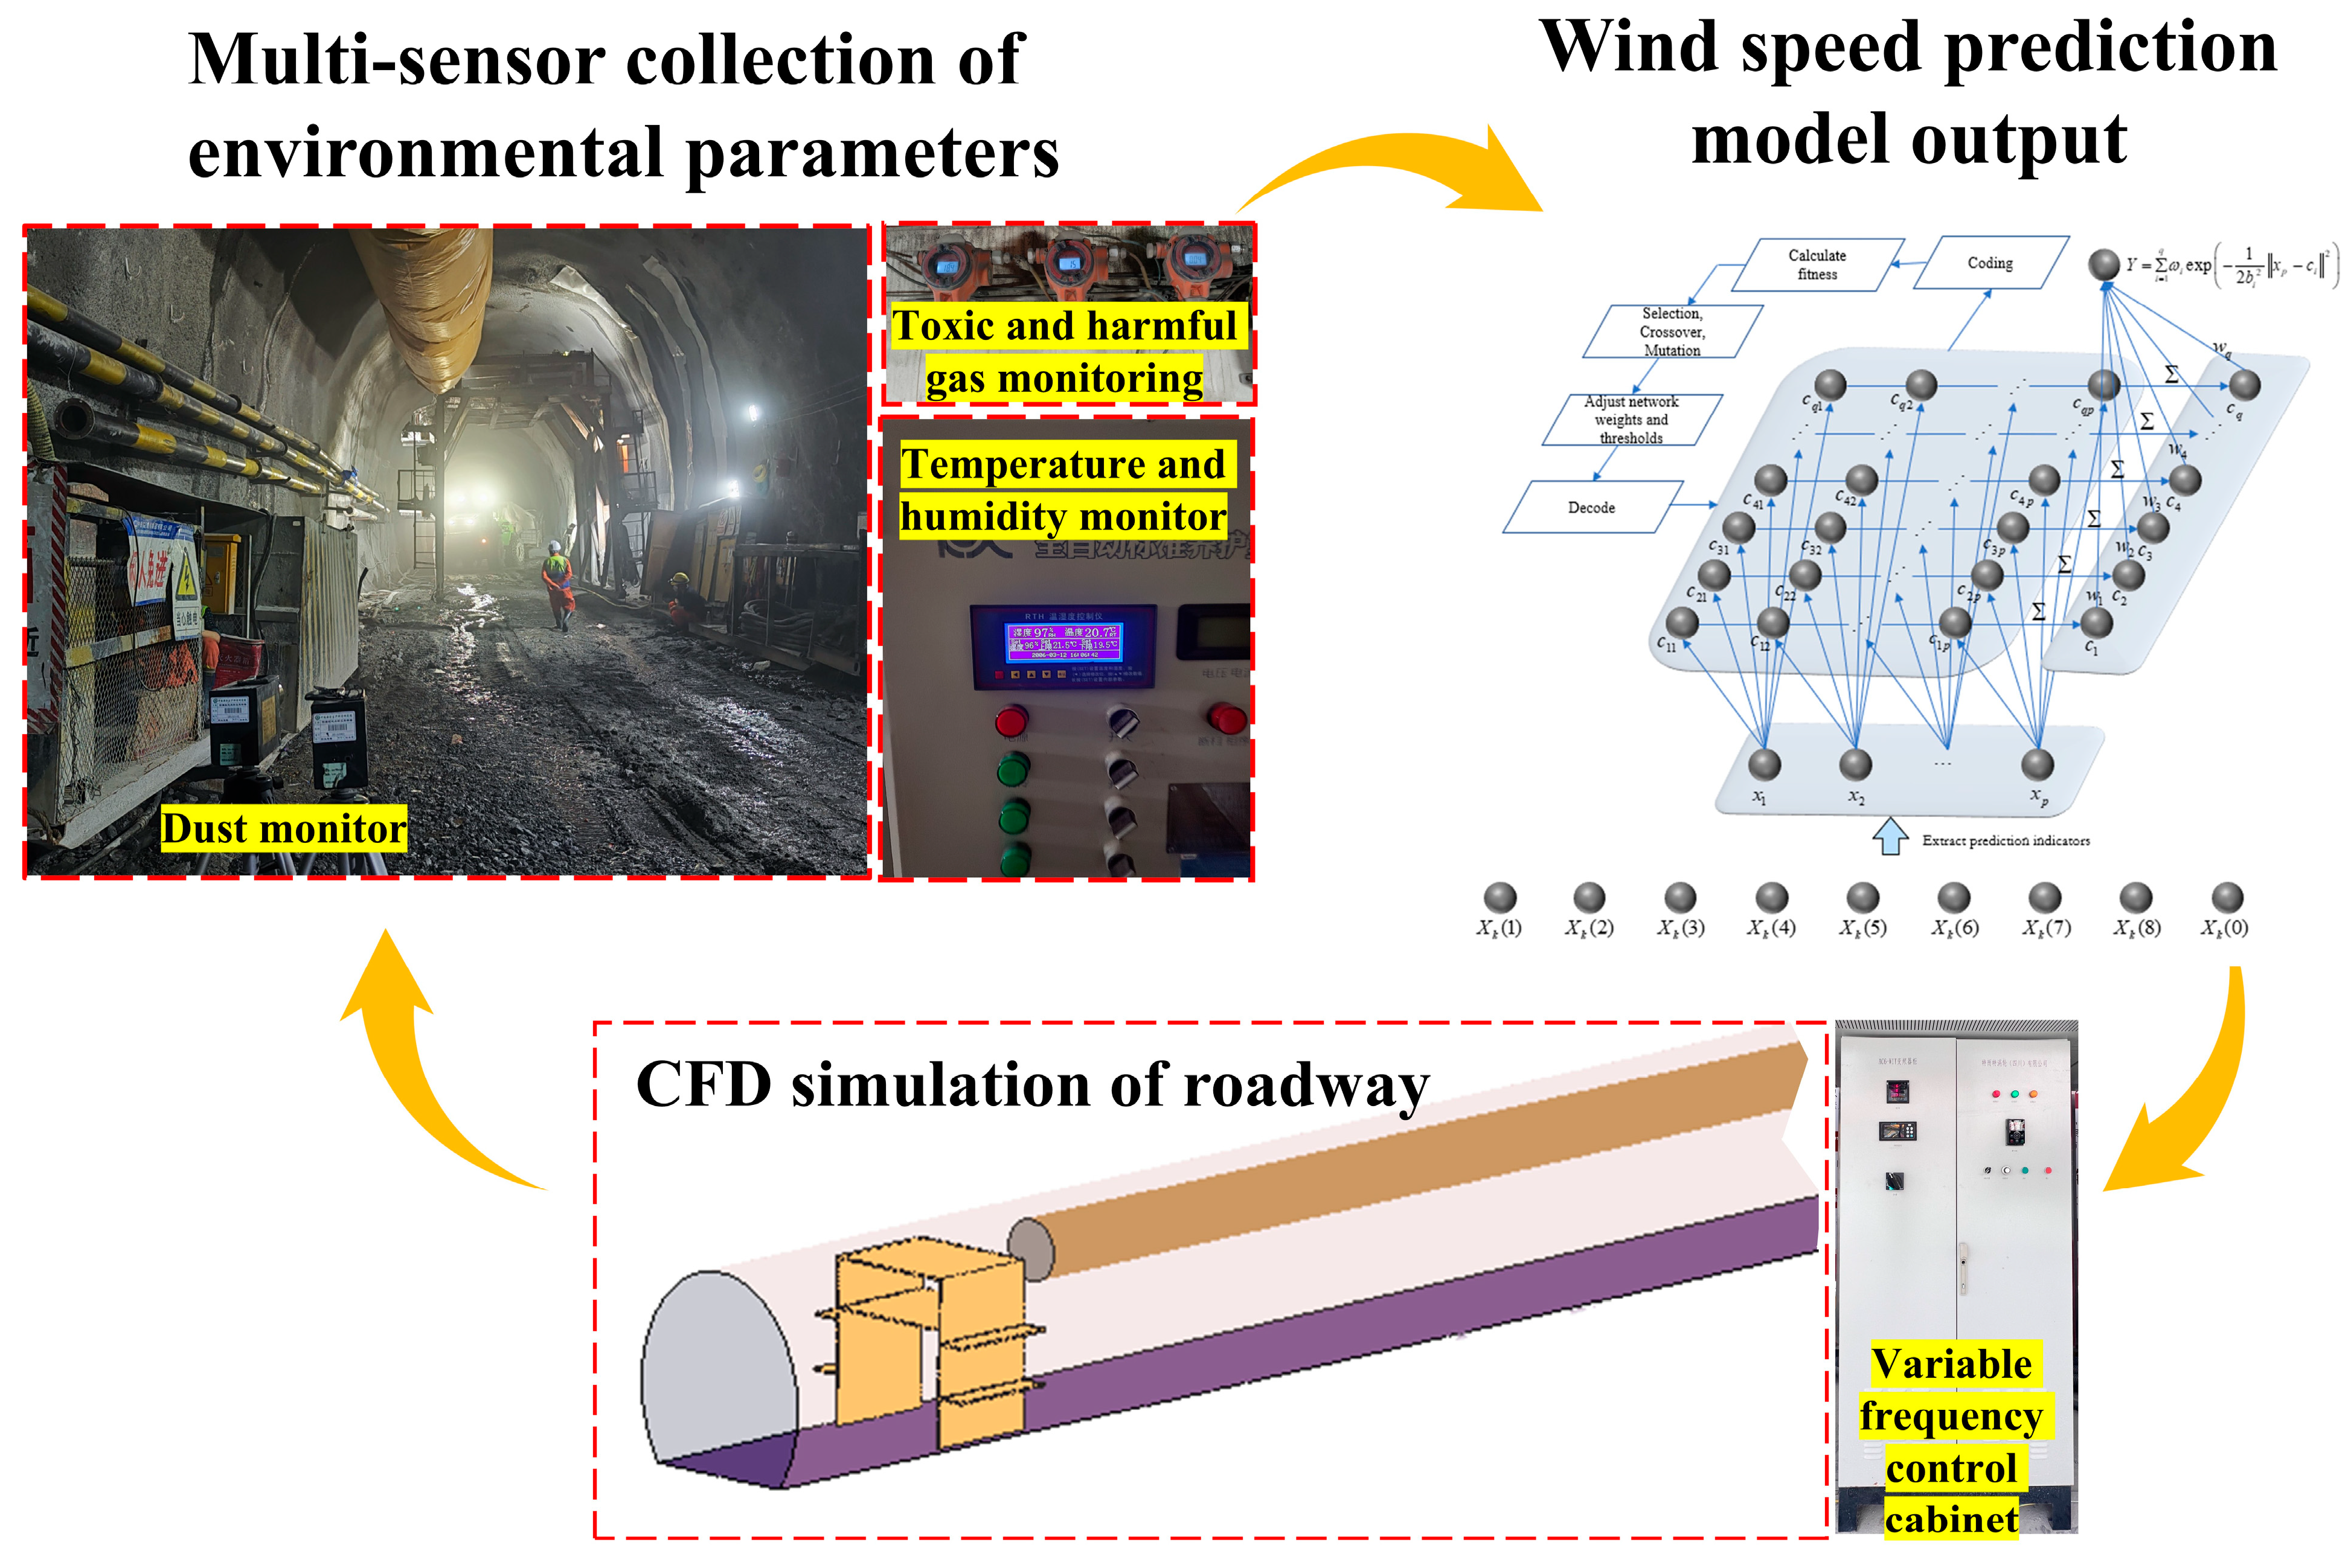
To further validate the collaborative prediction of wind speed based on environmental parameters and the impact of operating conditions on the fan using PID variable frequency control, a verification method coupling intelligent ventilation control system with CFD simulation was employed. Figure 9 illustrates the control loop used for fan ventilation control.
In order to prevent the accumulation of dust at the end of the inclined shaft, protect the working area of the workers, avoid excessive ventilation wind speed, and take into account the downstream of the inclined shaft as much as possible, the dust migration law under the condition of intelligent frequency conversion control ventilation system is explored. The CFD model was established according to the geometric parameters of the tested inclined shaft. The air inlet was defined as a velocity inlet controlled by the predicted wind-speed profile, and the outlet was defined as a pressure outlet. The dust source was arranged near the excavation face to represent dust release during drilling, blasting, and slag-cleaning operations. The monitoring device was located 10 m away from the excavation face on the roadway floor to record the temporal variation of wind speed and dust concentration. In the inclined shaft ventilation system, PID control is adopted, and a smart algorithm for predicting wind speed based on multiple environmental parameters is used to guide the operation of variable frequency fans, periodically changing the ventilation and environmental parameters of the inclined shaft.
To achieve this objective, a periodic concept is proposed to regulate environmental parameters within a single cycle. Each time step consists of two main sub-steps: (1) updating the intake wind speed velocity based on the output of the wind volume prediction system, and (2) solving the CFD control equations with imposed initial and boundary conditions.
Step 1 is completed using a Matlab script, while Step 2 is accomplished by importing the profile file into Fluent. Repeat substeps (1) and (2) for all time steps in the time loop until the simulation time, tmax, is reached. The solution process is illustrated in Figure 10 and each time step primarily involves the following procedures:

4. Inclined Shaft Intelligent Ventilation Control System

4.1. Overall Layout of Intelligent Ventilation Control System for Plateau Inclined Shaft

Based on the aforementioned parameters, a collaborative wind volume prediction technology is employed for the design of an intelligent variable frequency ventilation control system. The design principles include real-time monitoring, collaborative prediction, and variable frequency control. The hardware system is built using S7-200 SMART PLC, and the human-machine interface is designed using configuration software to enhance the system’s reliability.
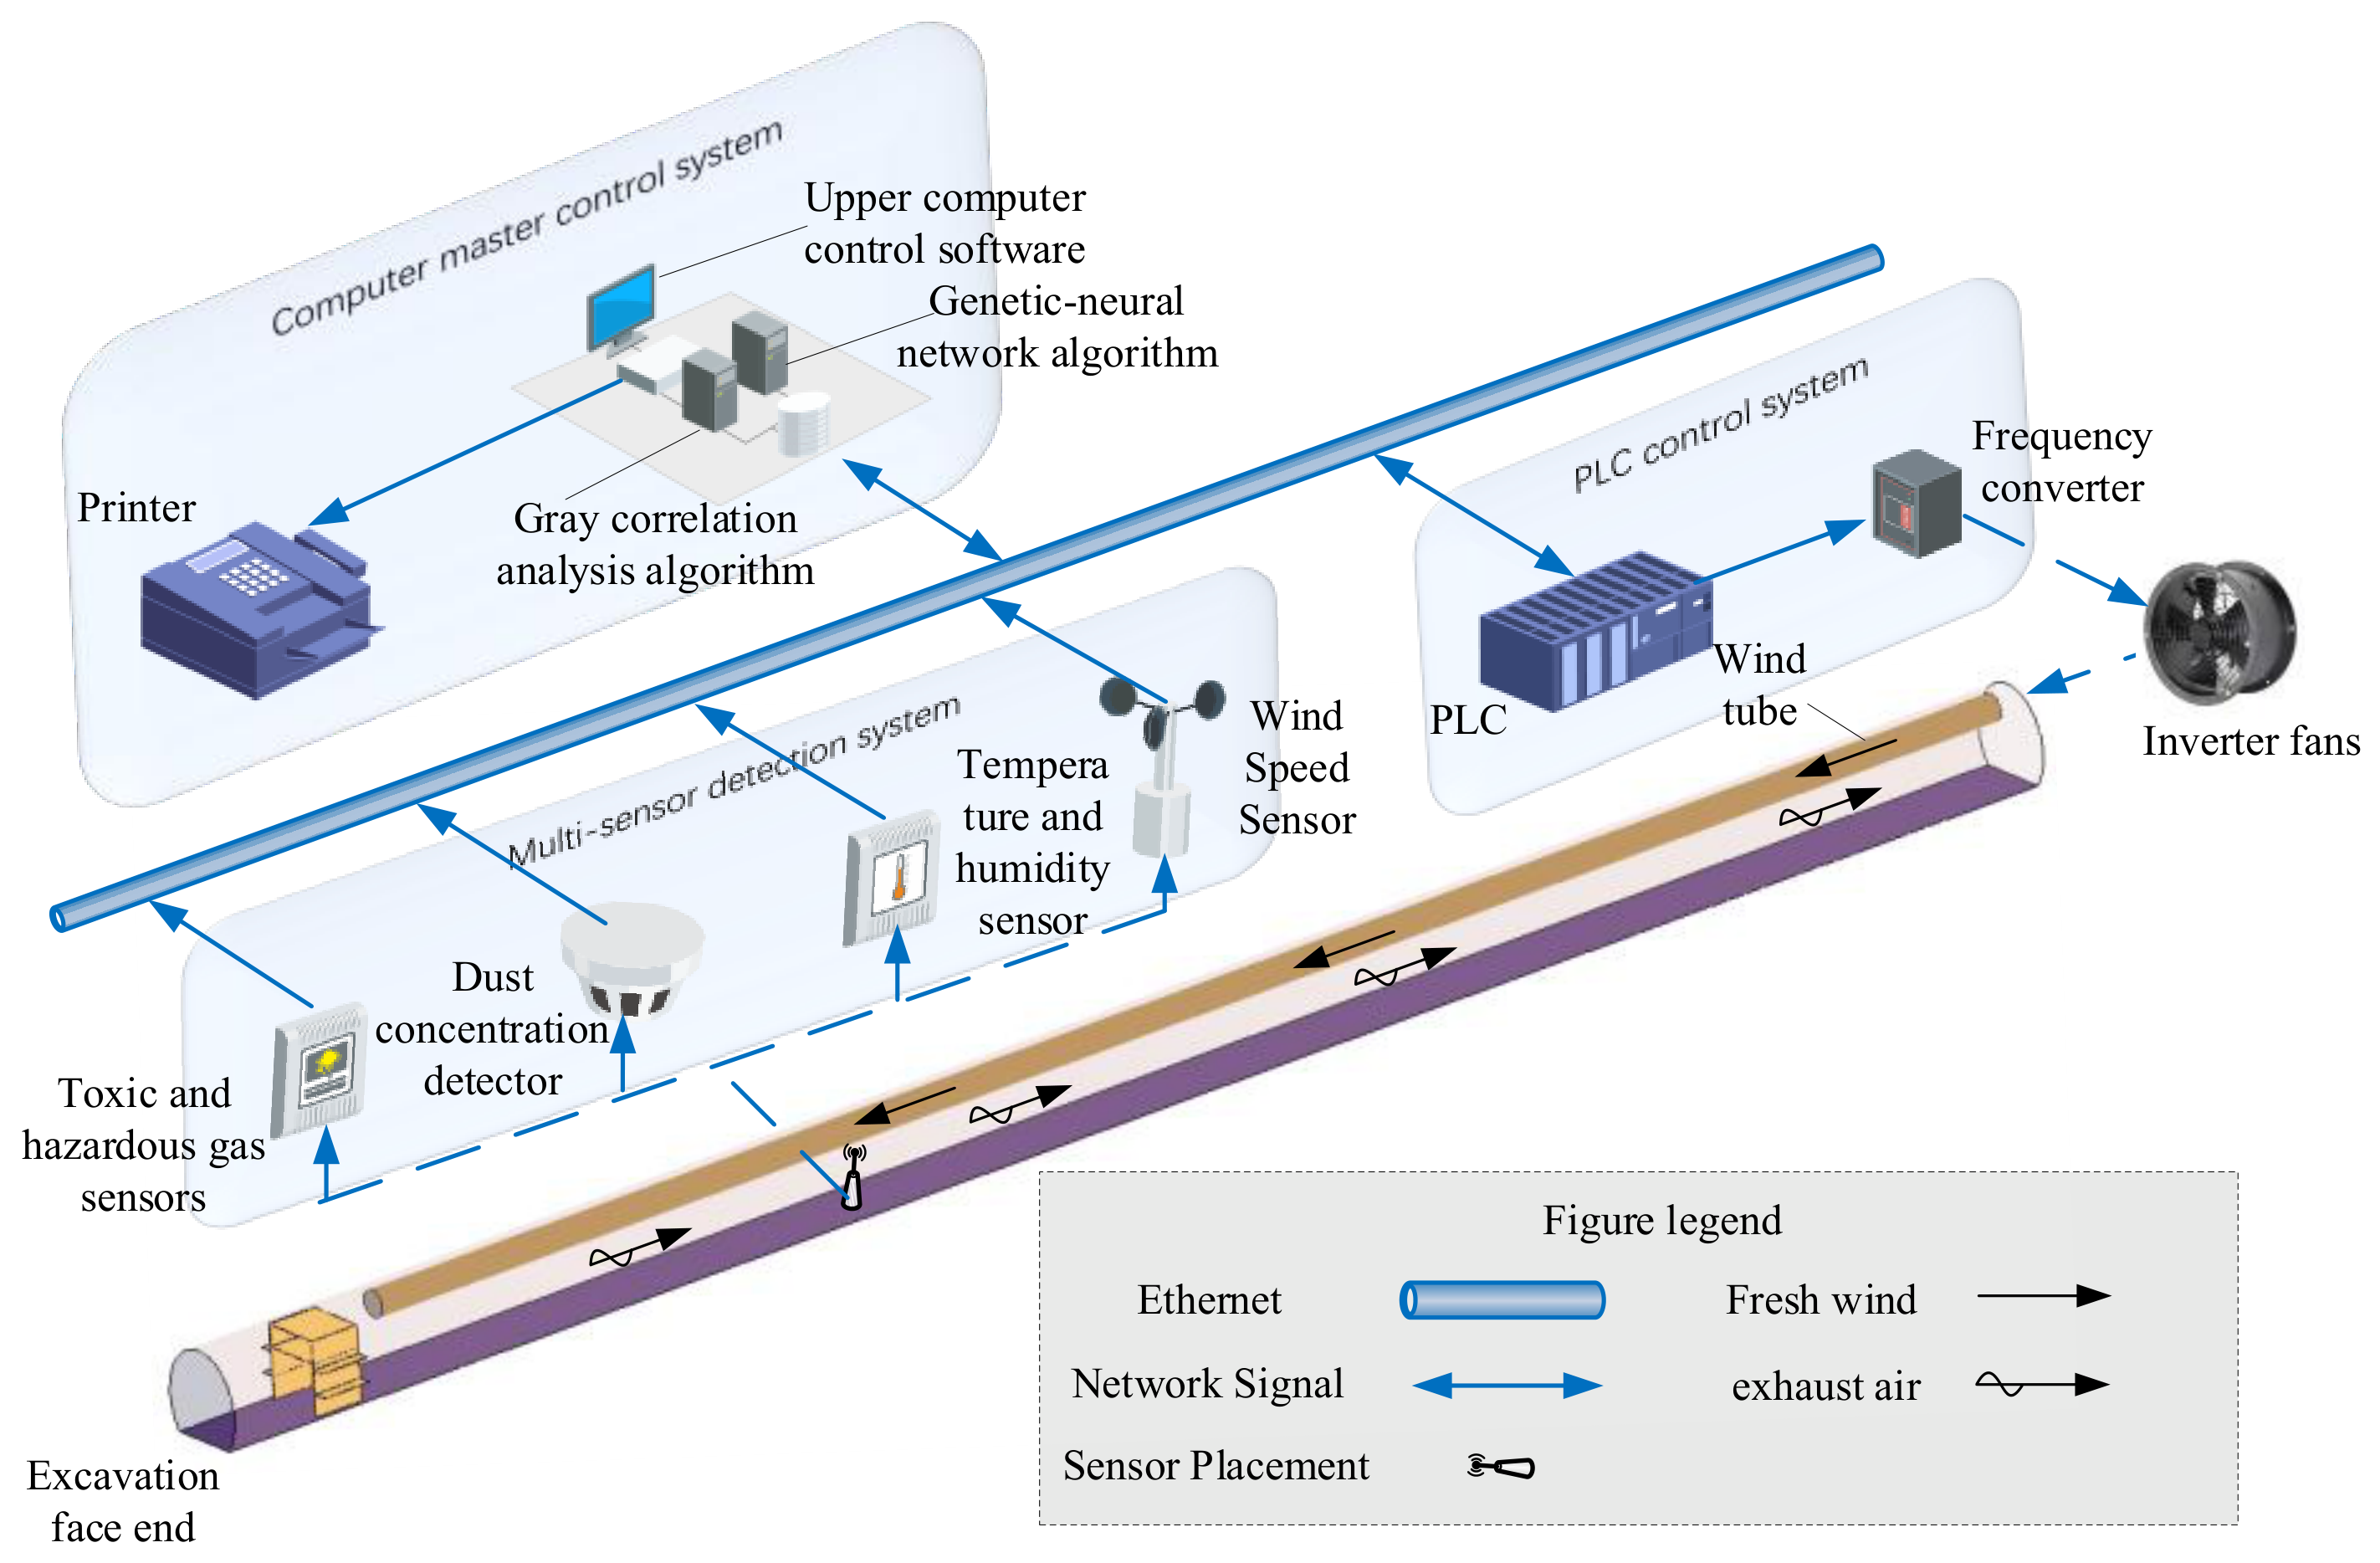
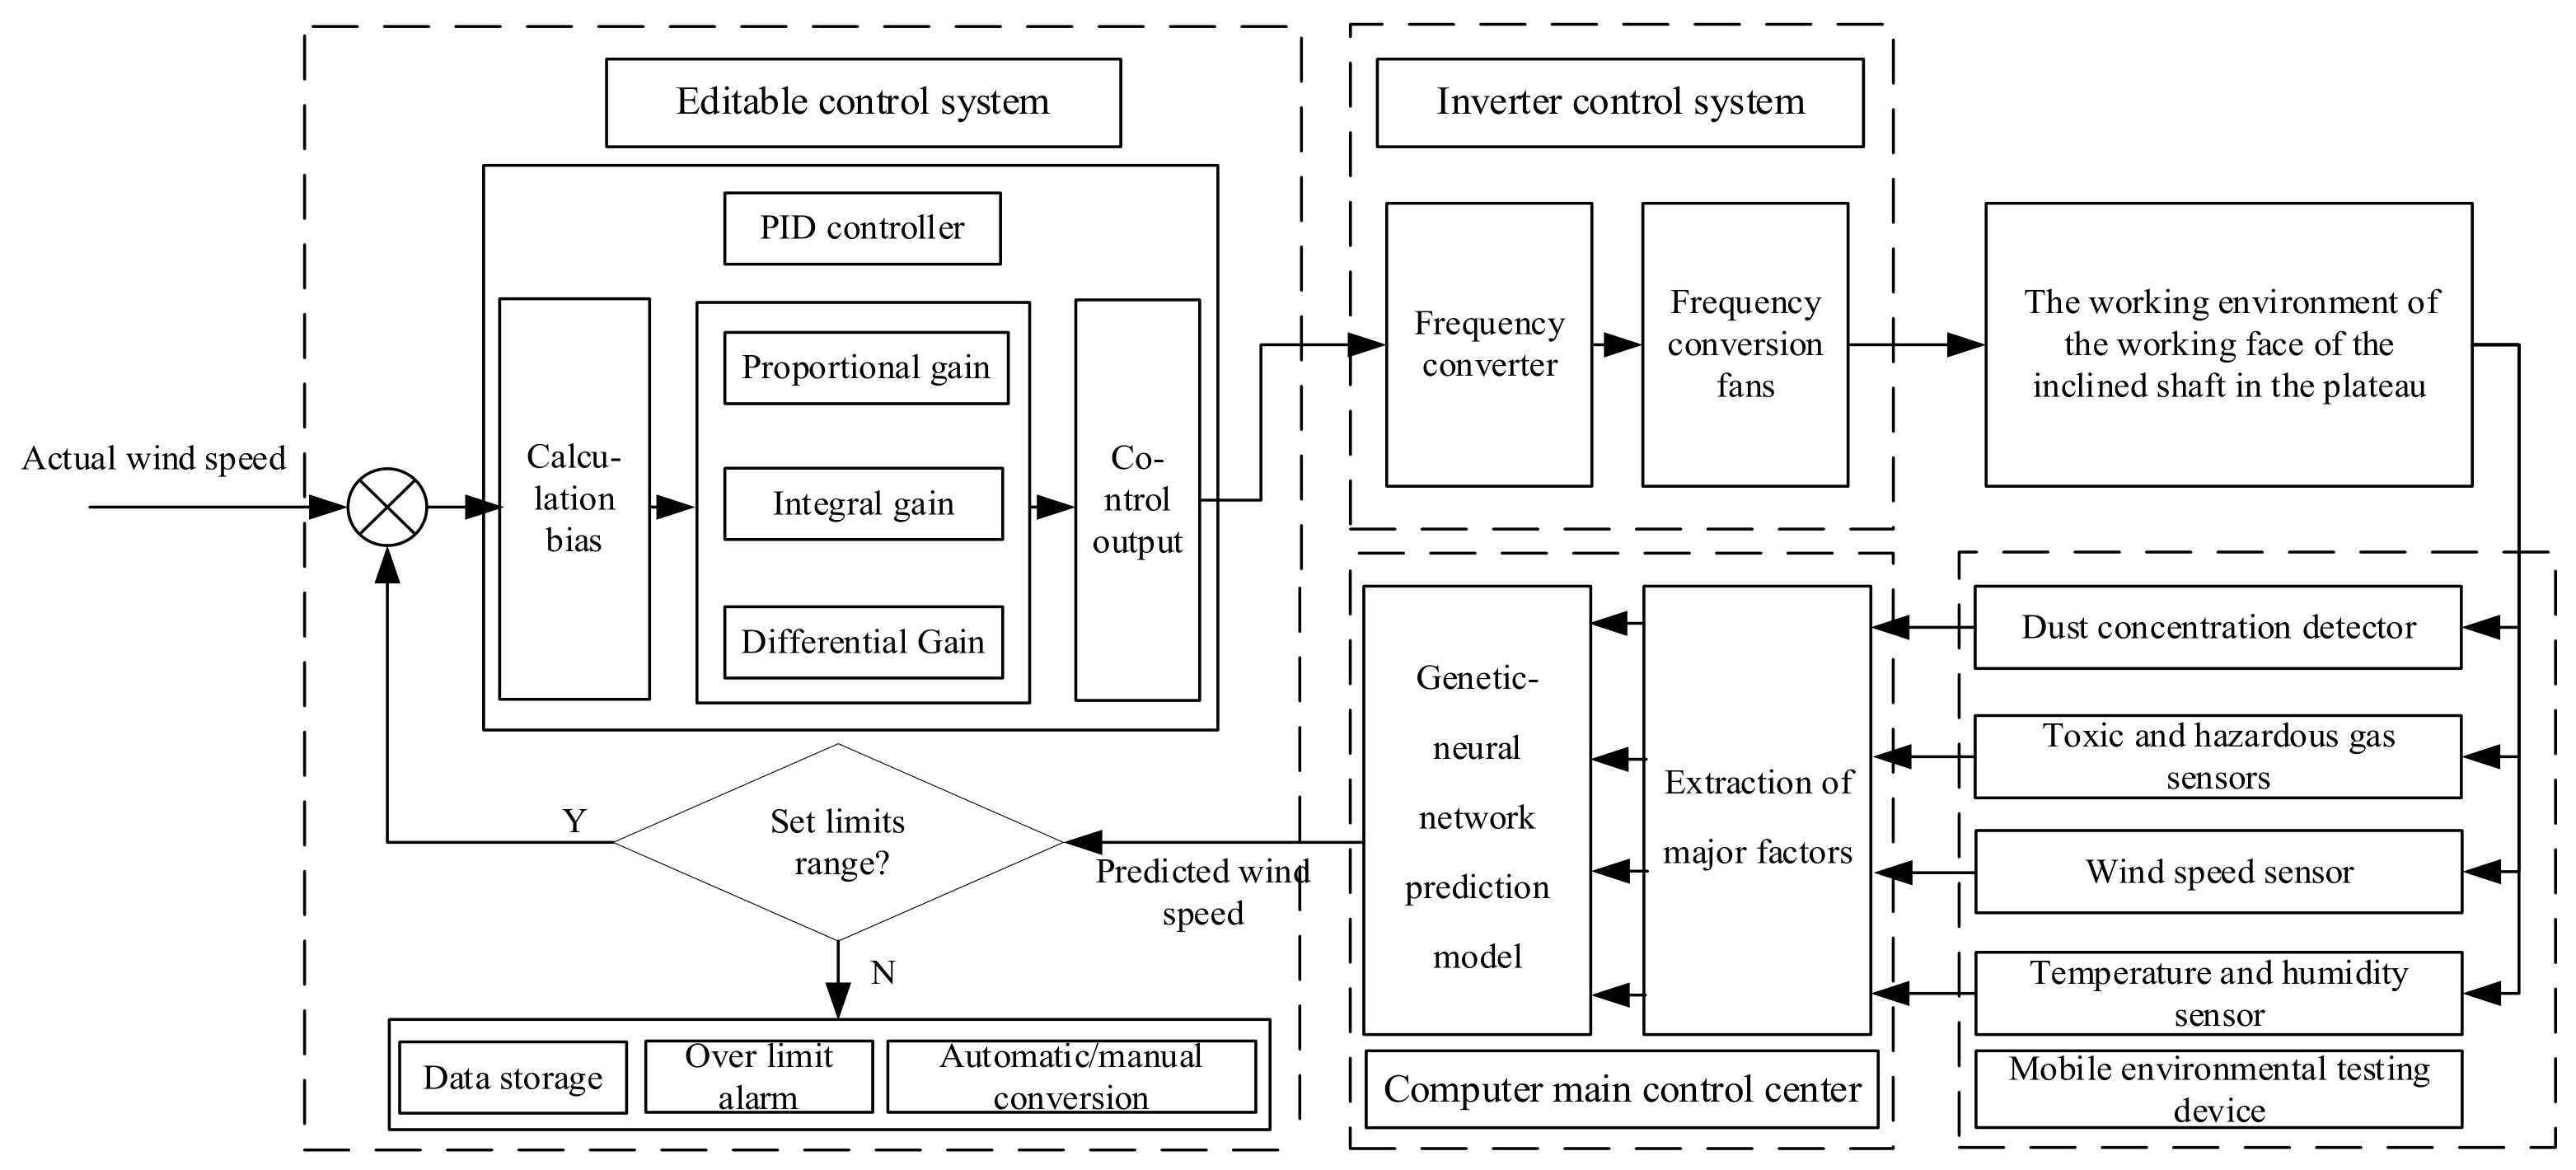
The variable frequency ventilation control system consists of mobile environmental detection device, computer control center, PLC control system, variable frequency fan, and inclined shaft. It serves as a unified whole with the capability to detect real-time environmental parameters under different operating conditions and predict the wind speed in the inclined shaft through intelligent algorithms. Additionally, it can adjust the wind speed of the ventilation fan using a programmable controller. The system framework model is illustrated in Figure 11.
(1) The mobile environmental monitoring device is placed inside the inclined shaft, and it transmits the detection results of each sensor to the computer control center. After being processed by algorithms and software in the computer control center, the feedback is sent to the programmable controller. The programmable controller then transmits control signals to the variable frequency control system, which controls the wind speed in the inclined shaft.
(2) The computer control center is equipped with grey correlation analysis algorithm, genetic-neural network wind speed prediction algorithm, upper-level control software, and a printer.
(3) The PLC control system consists of S7-200 SMART PLC and a frequency converter. The programmable controller acts as a hub, and it is connected to the computer control center via Ethernet. The programmable controller transmits control signals to the variable frequency control system.
(4) A flexible wind tube is arranged at the top of the inclined shaft. The flexible wind tube is connected to the variable frequency fan.

4.2. Electrical Connection of Intelligent Ventilation Control System for Plateau Inclined Shaft

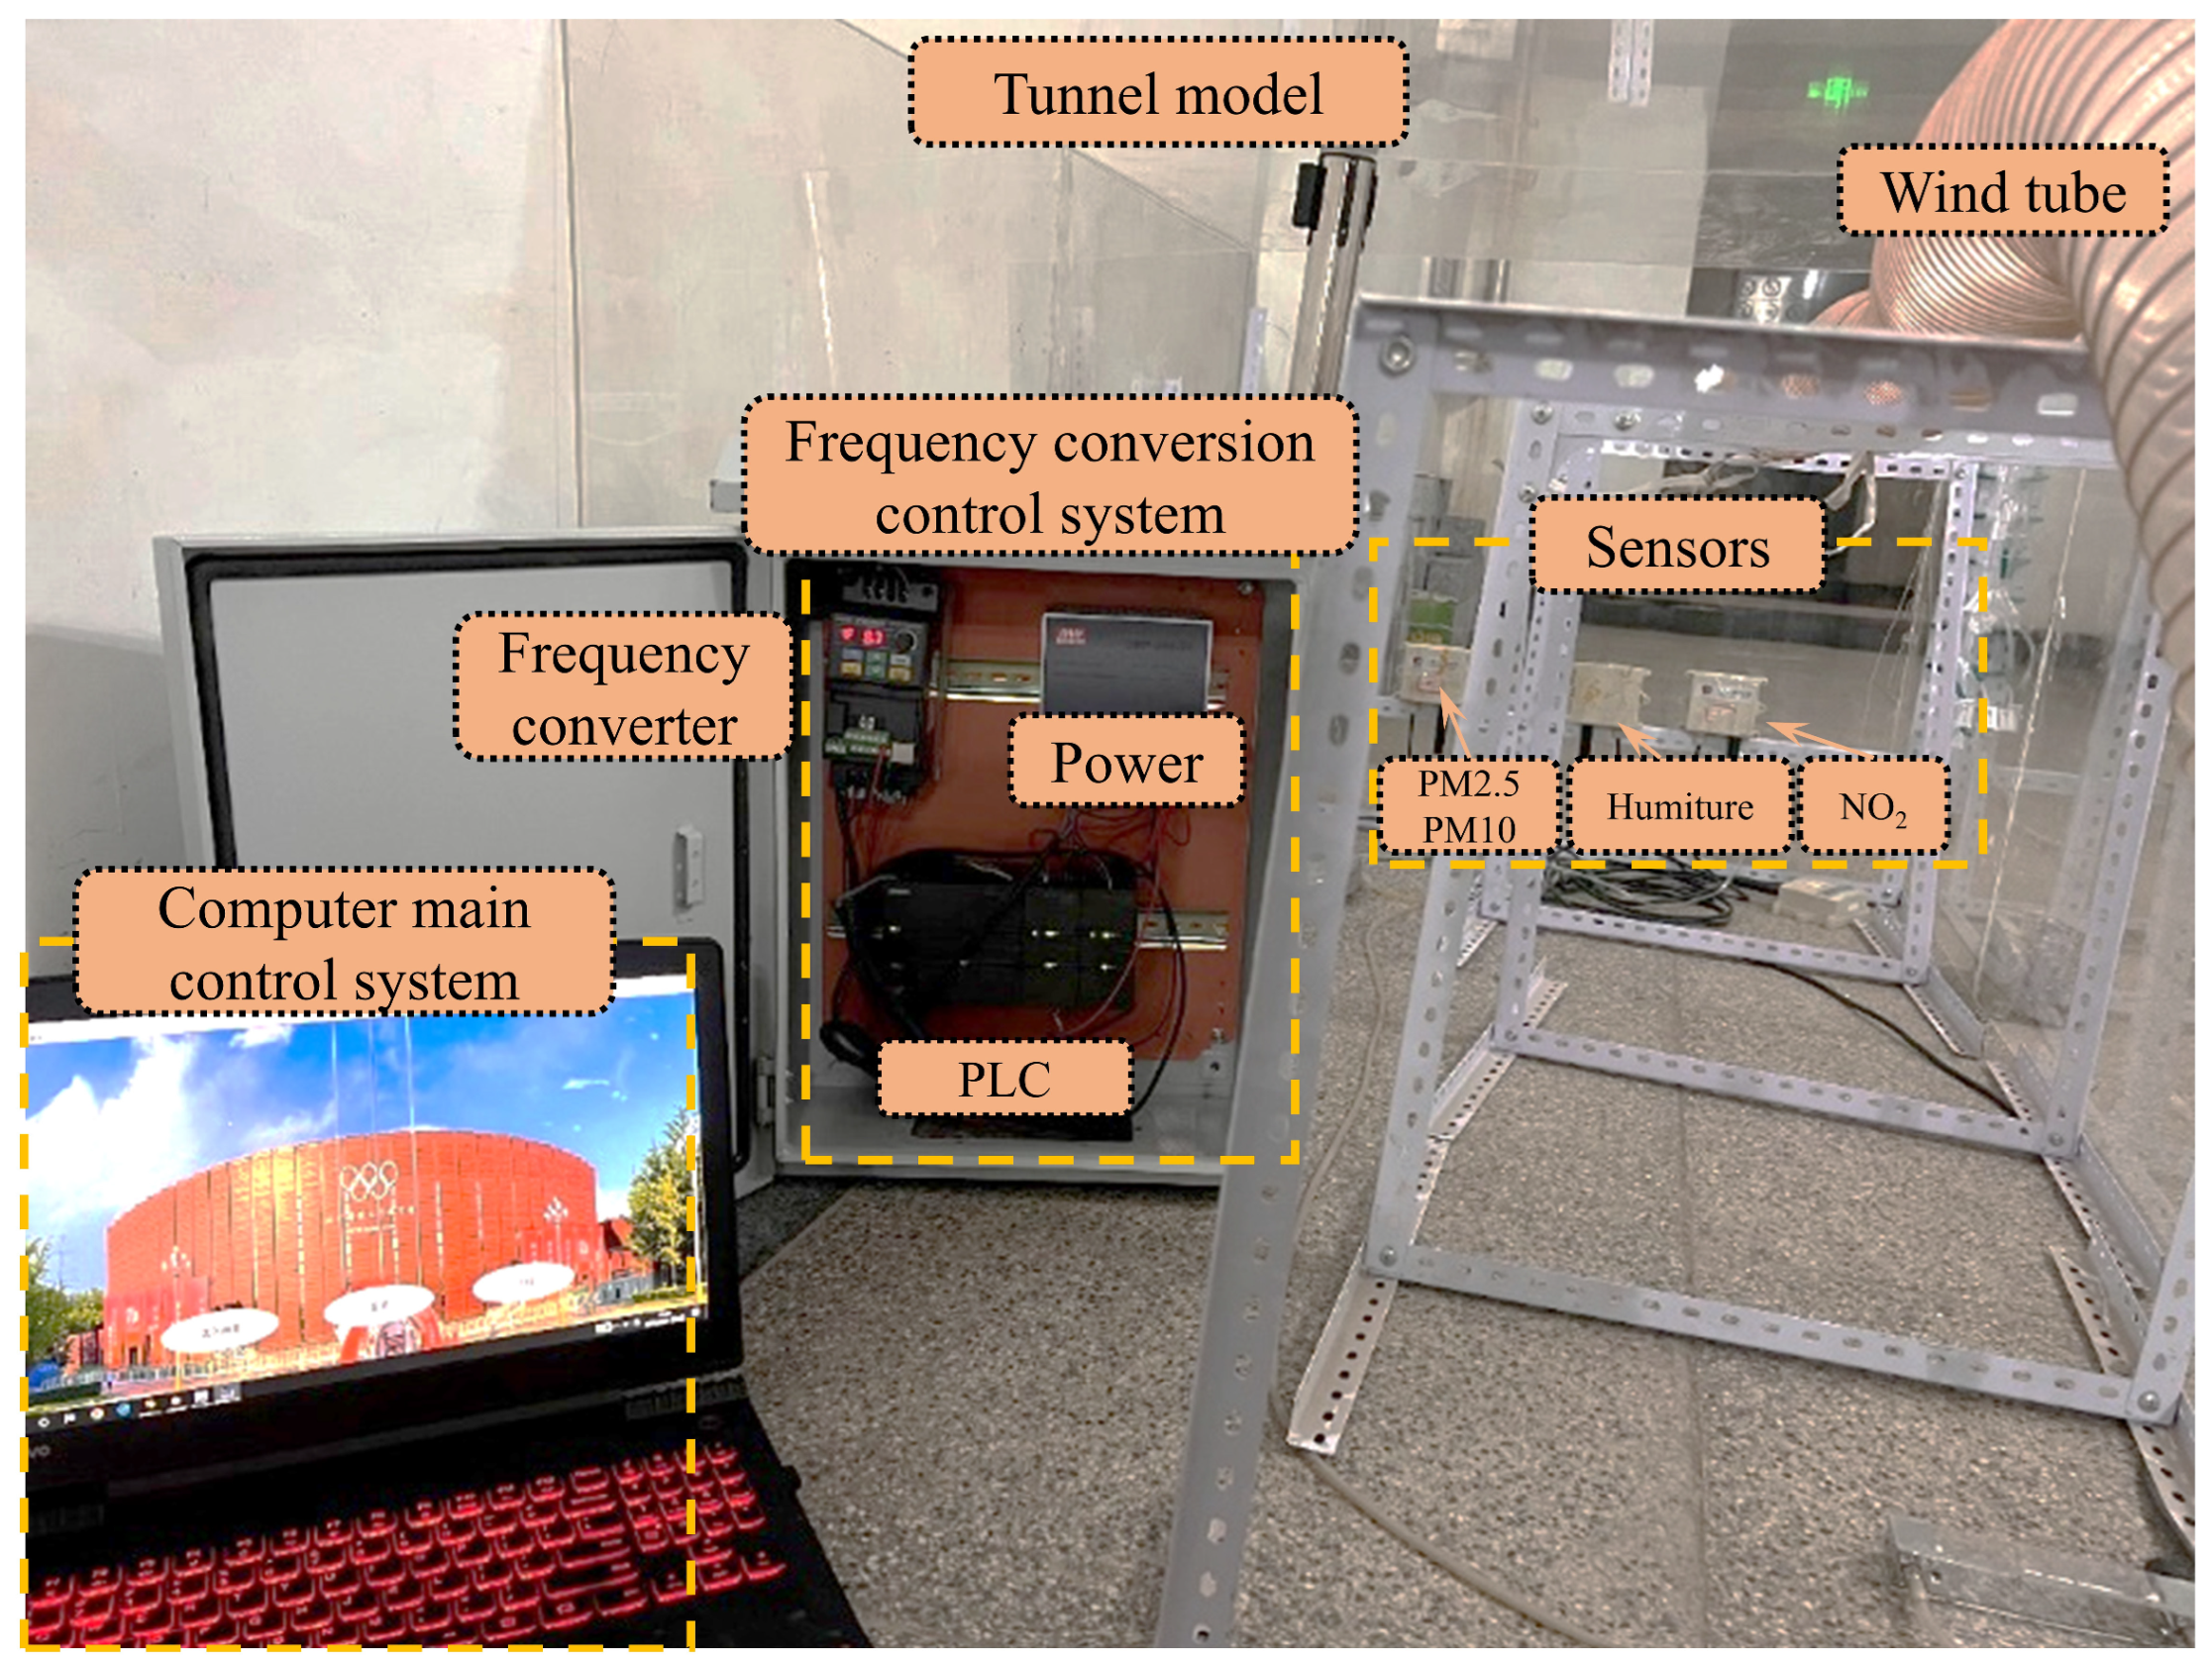
The electrical connections between the basic module I/O terminals of the PLC in the equipment control cabinet and various auxiliary devices such as sensors, frequency converters, and fans are shown in Figure 12. In order to verify the rationality and feasibility of the electrical circuit design of the inclined shaft intelligent ventilation control system, electrical circuit connection debugging was carried out in the established simulated tunnel experimental model. This debugging process achieved information transmission between the PLC and the actuators.
By collecting relevant data and utilizing intelligent control algorithms, signals are inputted into the actuator or drive mechanism to drive the variable speed operation of the fan, forming a variable frequency ventilation control system. The external power supply is converted to 24 V DC through a switch power supply, which is used for analog quantity expansion modules and sensors. Through system design, the system is capable of achieving real-time variable frequency regulation of wind speed.

4.3. Operation Process of Intelligent Ventilation Control System for Plateau Extra-Long Tunnel

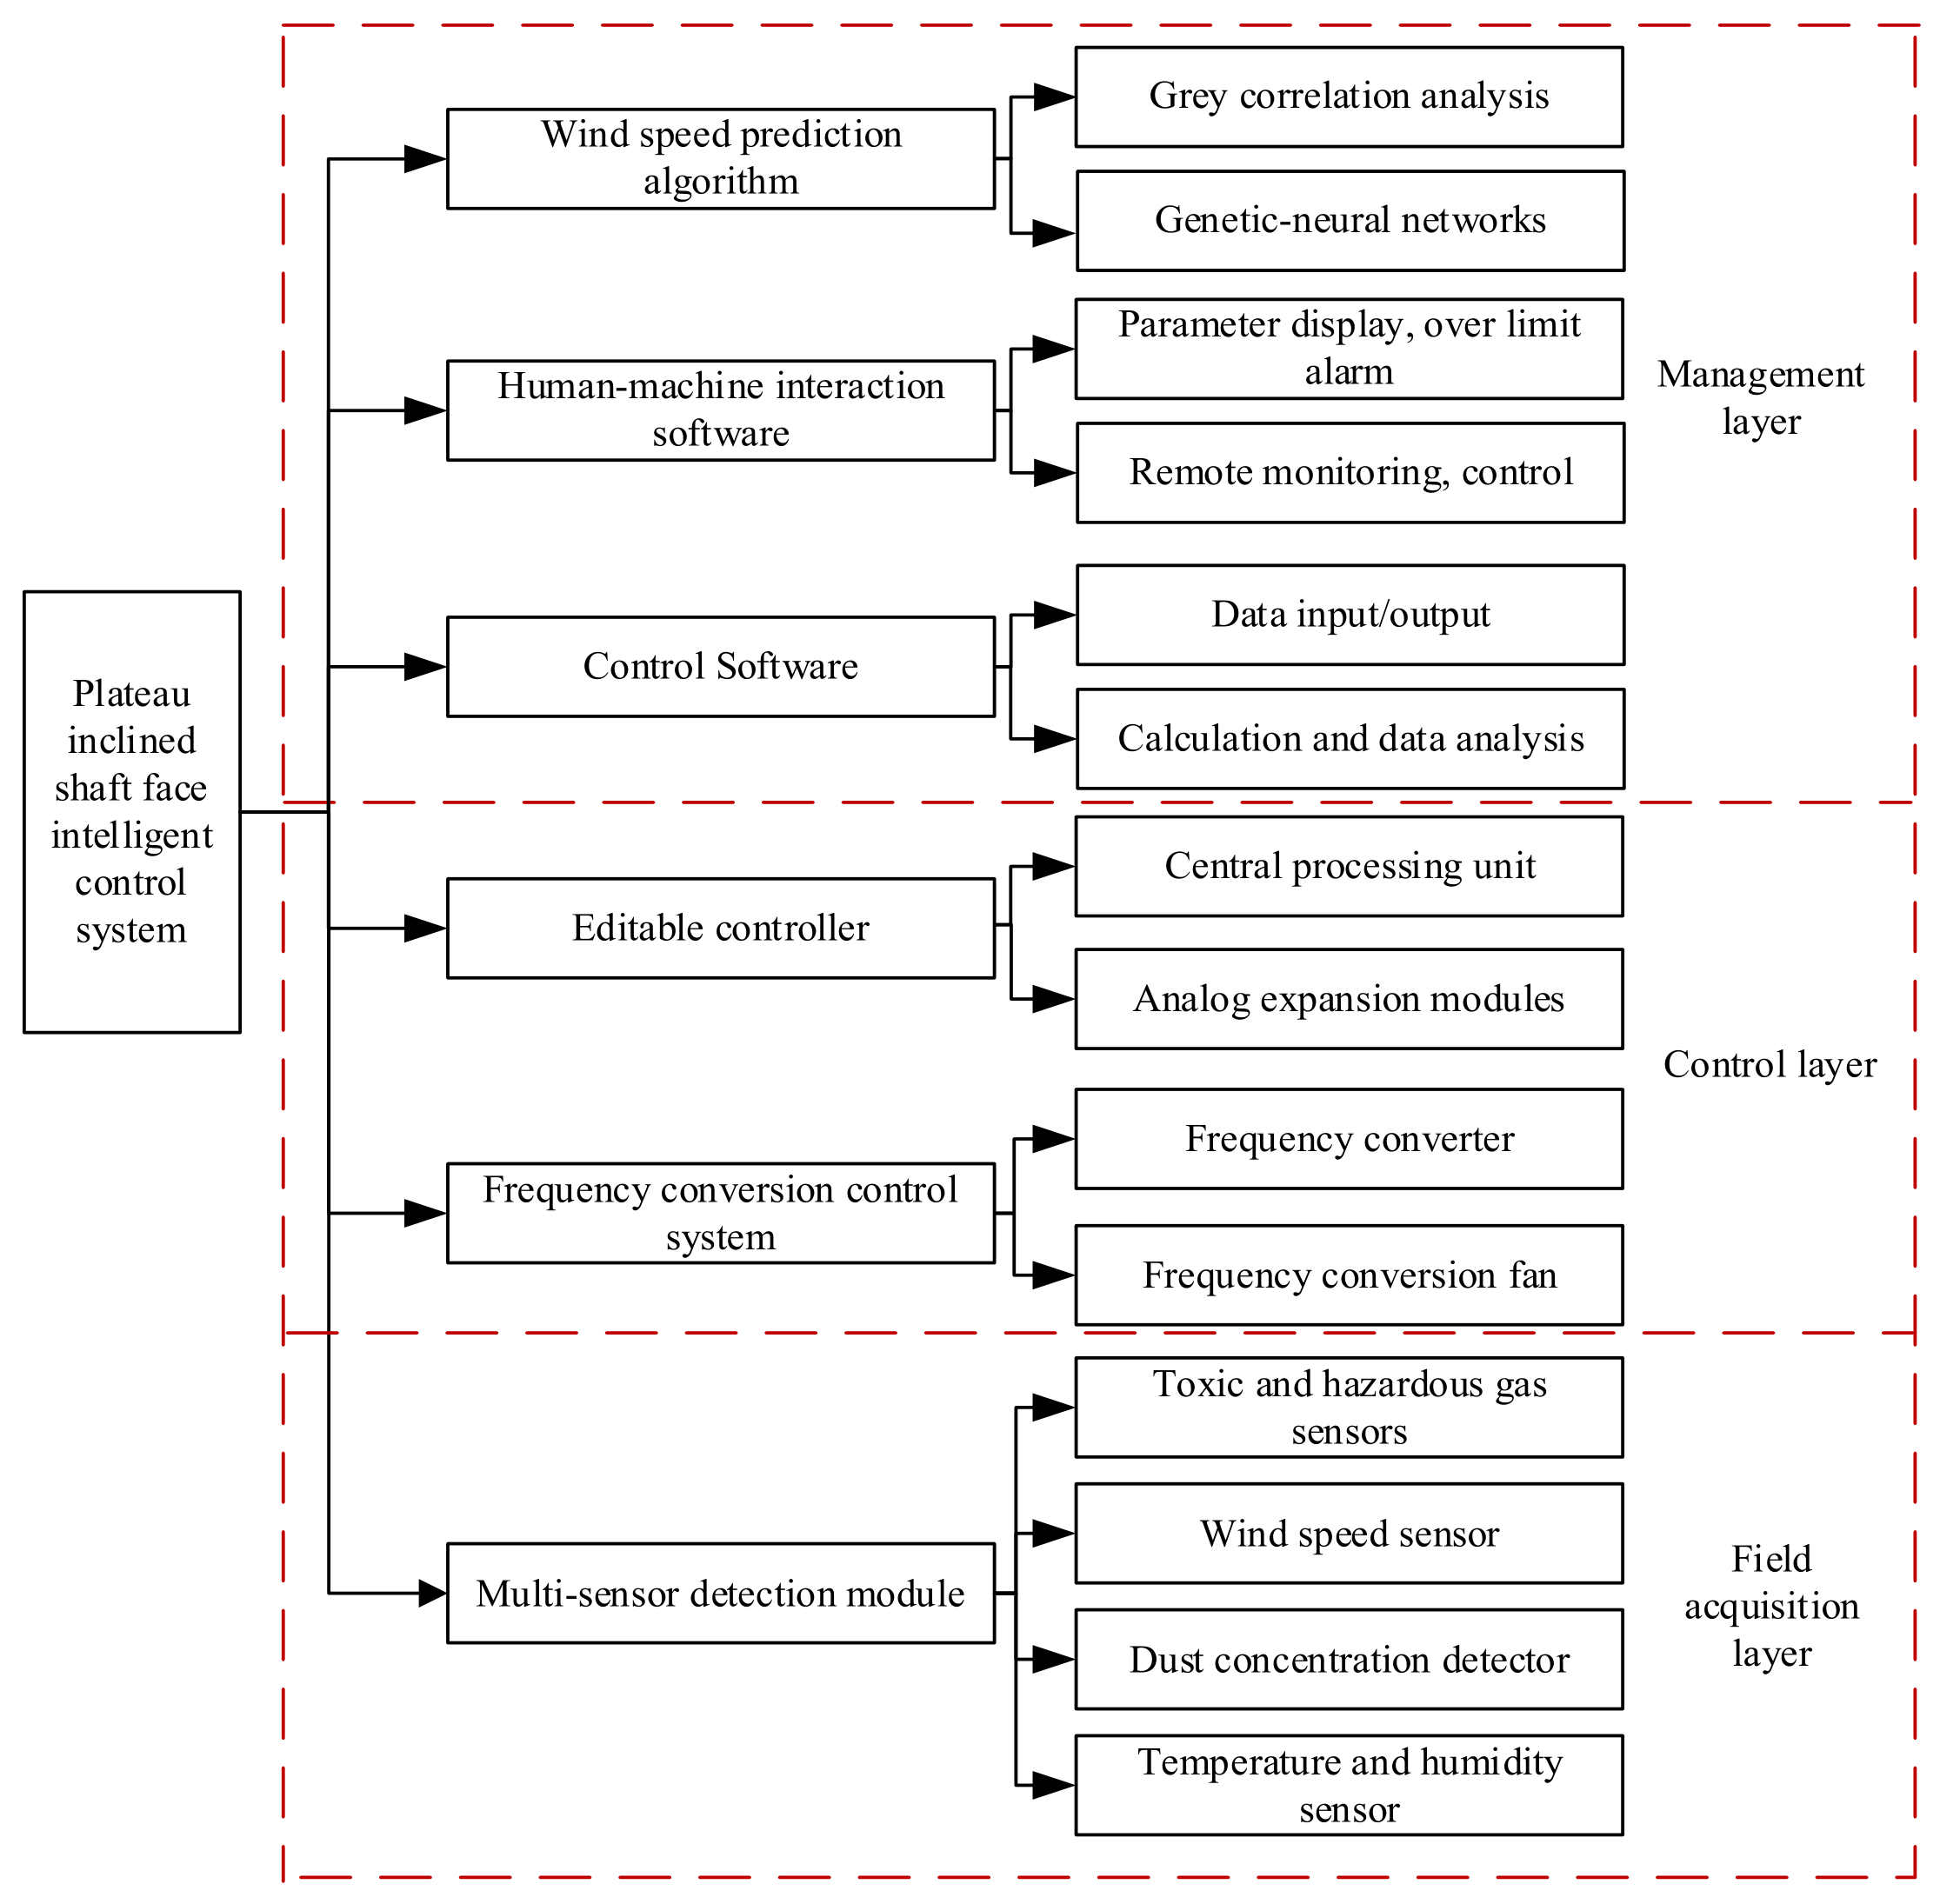
To demonstrate the functionality of the system, the inclined shaft variable frequency ventilation control system can be divided into the following three layers (Figure 13):
(1) Management layer: The management layer is primarily used to achieve functions such as predicting the wind speed in the inclined shaft, remote control, and local management. Human-computer interactive control software is utilized to monitor real-time environmental parameters on the working face, enabling the switch between manual and automatic control, remote adjustment of ventilation parameters, exceeding limit alarms, as well as information exchange and coordinated control between humans and equipment.
(2) Control layer: The control layer communicates with the management layer through Ethernet to receive commands from the management layer. It also receives feedback information (such as temperature and humidity) from the field acquisition layer and promptly transmits it to the management layer.
(3) Field acquisition layer: The main function of the field acquisition layer is to collect ventilation data from the working face. It utilizes various sensors to monitor environmental parameters of the advancing face in a coordinated manner and provides feedback to the control layer.
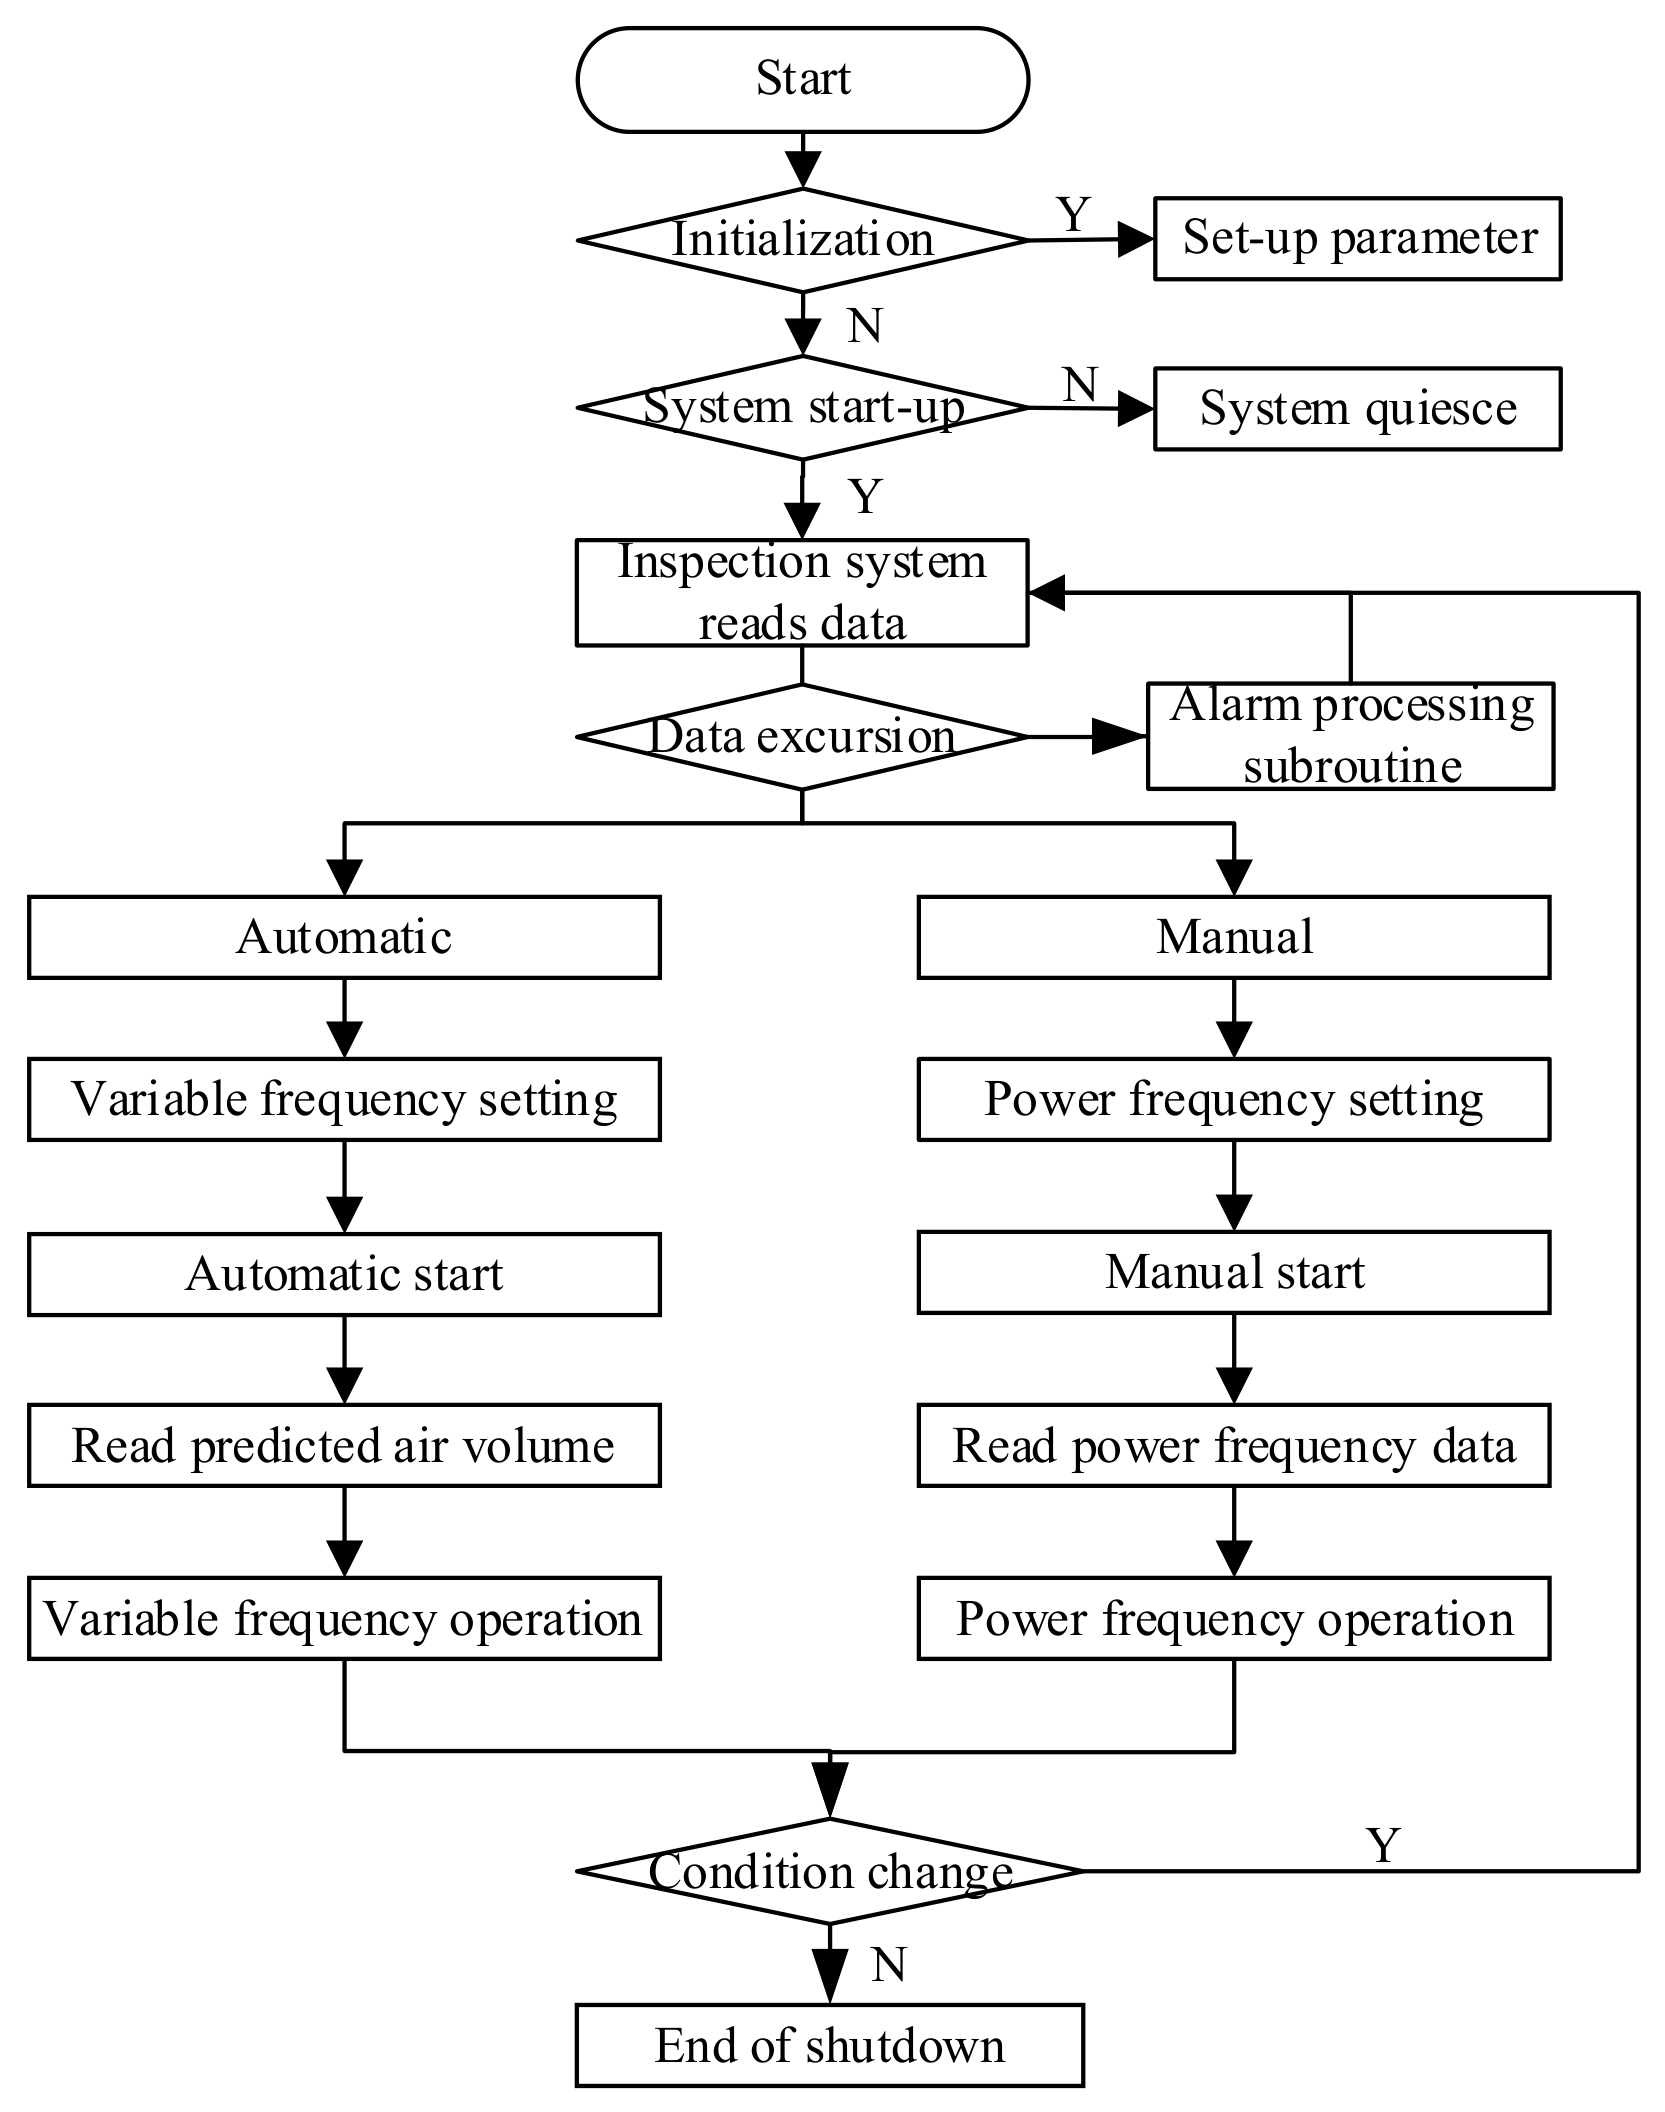
The working mode of the PLC controller’s cyclic scanning ensures continuous execution of the program, allowing for real-time updates of input variables in the variable frequency control system. The detailed variable frequency control process is shown in Figure 14. The specific steps are as follows:
(1) Power-on initialization: Set system parameters, PID control parameters, and analog input module parameters.
(2) System operation: Read analog signals and perform analog data conversion. Read and convert temperature, humidity, air quality, toxic and harmful gas concentrations, and wind speed data. Compare them with preset alarm thresholds.
(3) Press the “Start” button to start the system. The operation indicator lights up.
(4) System startup: Select the system control mode. During automatic operation, adjust the frequency based on the predicted results of the variable frequency algorithm. Update data every cycle to meet the ventilation requirements under different working conditions until shutdown.
(5) During manual operation, determine the ventilation frequency based on the corresponding relationship between frequency and wind speed, as decided by relevant experts. This achieves single-frequency control of the fan for ventilation until shutdown.
The operation process of the system includes environmental data acquisition, wind-speed prediction, control-mode selection, PID frequency regulation, and feedback correction. In automatic mode, the monitoring data are transmitted to the upper computer for wind-speed prediction, and the predicted value is used as the PID control target. The PLC then adjusts the fan frequency through the frequency converter until the measured wind speed approaches the predicted value. In manual mode, the operator directly sets the fan frequency according to the required ventilation condition. The detailed operation process is shown in Figure 15.

5. Ventilation Effect Verification

5.1. Stability Analysis

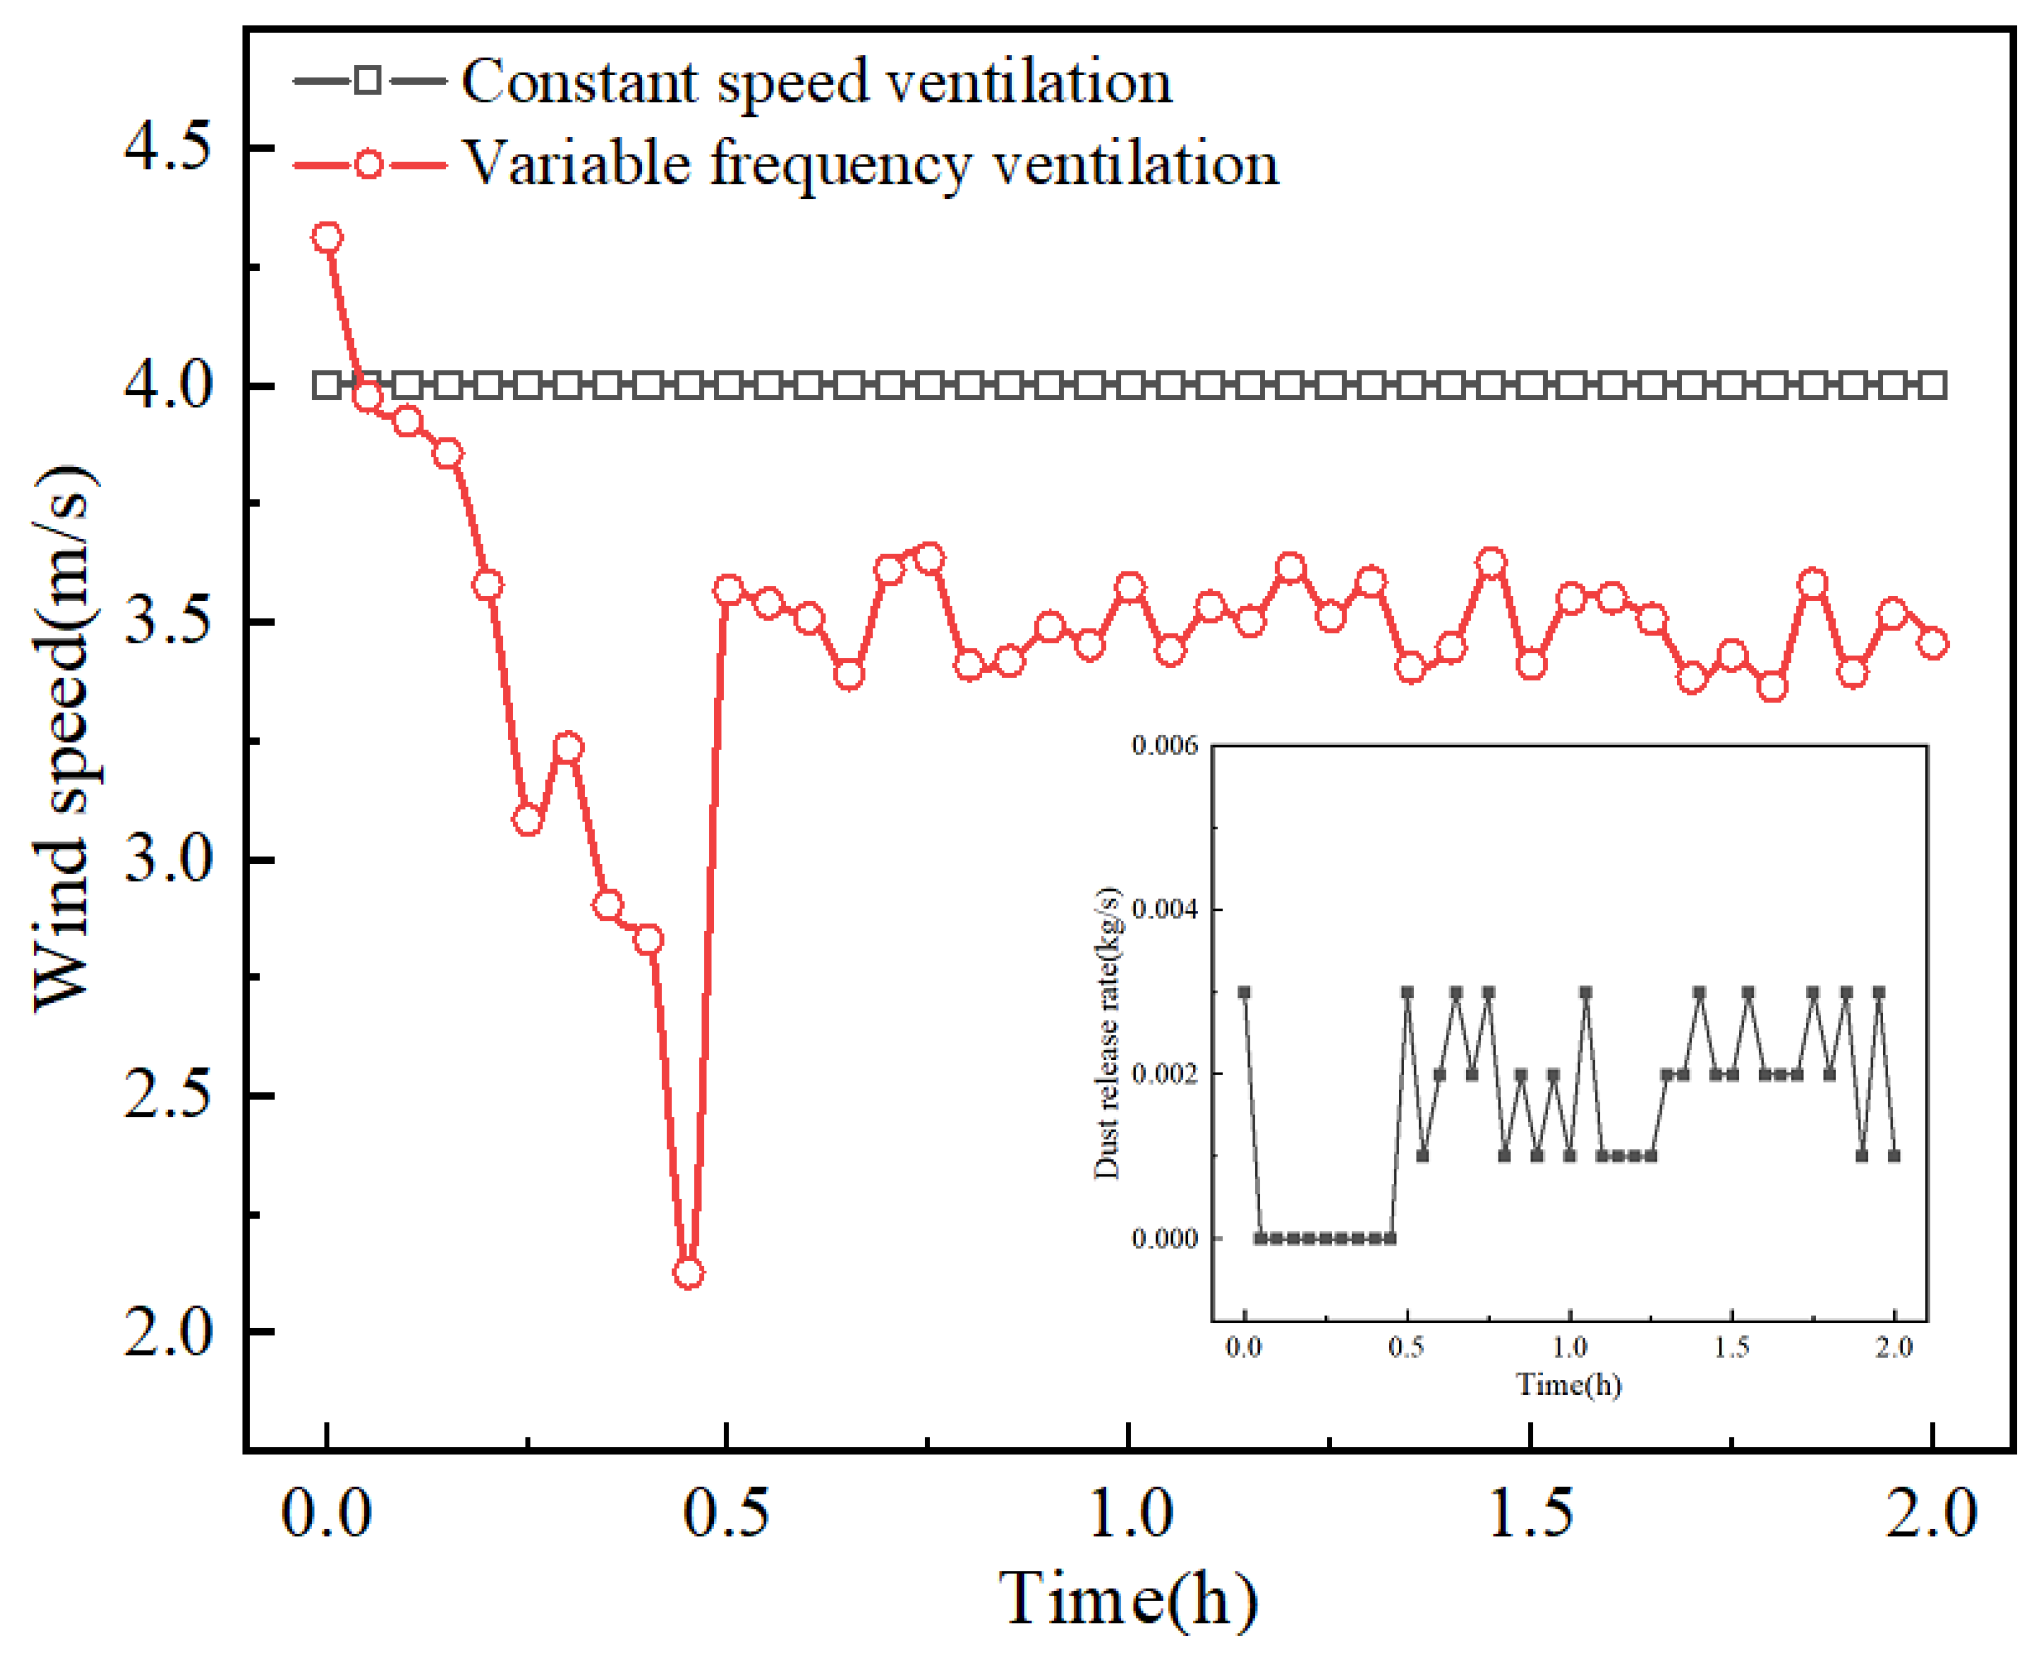
In an automatic control system, stability is one of the crucial factors that need to be considered. A stable system not only prolongs the lifespan of the system but also prevents system crashes caused by instability. For a PID controller, the coefficients Kp, Ki, and Kd have a significant impact on the performance of the control system. The dust mass flow rate at the drill and cleaning stages within a 2-h period was measured at the inclined shaft site. By utilizing the aforementioned multi-environment parameters collaborative prediction model for wind speed, the predicted wind speed results were obtained and compared with the actual wind speed statistics monitored in the laboratory over a 2-h period, as shown in Figure 16.
Figure 16 illustrates the evolution of the wind speed velocity in the inclined shaft under different operating conditions of the PID controller, as well as the traditional constant-speed ventilation. Through the validation experiment of the variable frequency ventilation control system mentioned above, when the mass flow rate of the flour dust increases, the variable frequency fan will predict the wind speed based on a multi-sensor collaborative prediction algorithm and control the wind speed in the inclined shaft accordingly. However, there will be some fluctuations in the velocity. Therefore, the PID controller needs to automatically adjust the ventilation speed to make the detected velocity closer to the set value, resulting in fluctuations in ventilation speed when reaching quasi-steady state. This demonstrates the rationality of the PLC variable frequency ventilation control system based on GA-BP neural network and PID control instruction coupling.
The sharp decrease in wind speed near 0.5 h was caused by the transition from a high dust-release stage to a lower ventilation-demand stage. During this period, the predicted wind-speed target decreased as the monitored environmental parameters changed, and the PID controller reduced the fan frequency accordingly. This drop does not indicate a failure of the ventilation system. The measured wind speed remained higher than the preset lower safety-control threshold of 0.25 m/s, and the system continued to maintain effective wind speed at the excavation face. Therefore, the transient decrease did not affect worker safety under the tested conditions.
If the rate of dust release undergoes drastic changes over time, it cannot be guaranteed that the ventilation system will achieve quasi-steady state. Under quasi-steady state conditions, the wind speed will exhibit stable fluctuations around the predicted wind speed: with an average velocity of 3.23 m/s. Conversely, under constant-speed ventilation conditions, the wind speed will consistently remain at 4 m/s. However, when environmental parameters change, constant-speed ventilation becomes inadequate to meet the operational requirements of the working environment.
To further assess the impact of the variable frequency ventilation control system on dust pollution, a simulation was conducted using a PID control and CFD coupling algorithm to calculate the weighted average dust concentration in the working area of the inclined shaft for a period of 2 h. The dust concentrations are presented in Table 3.
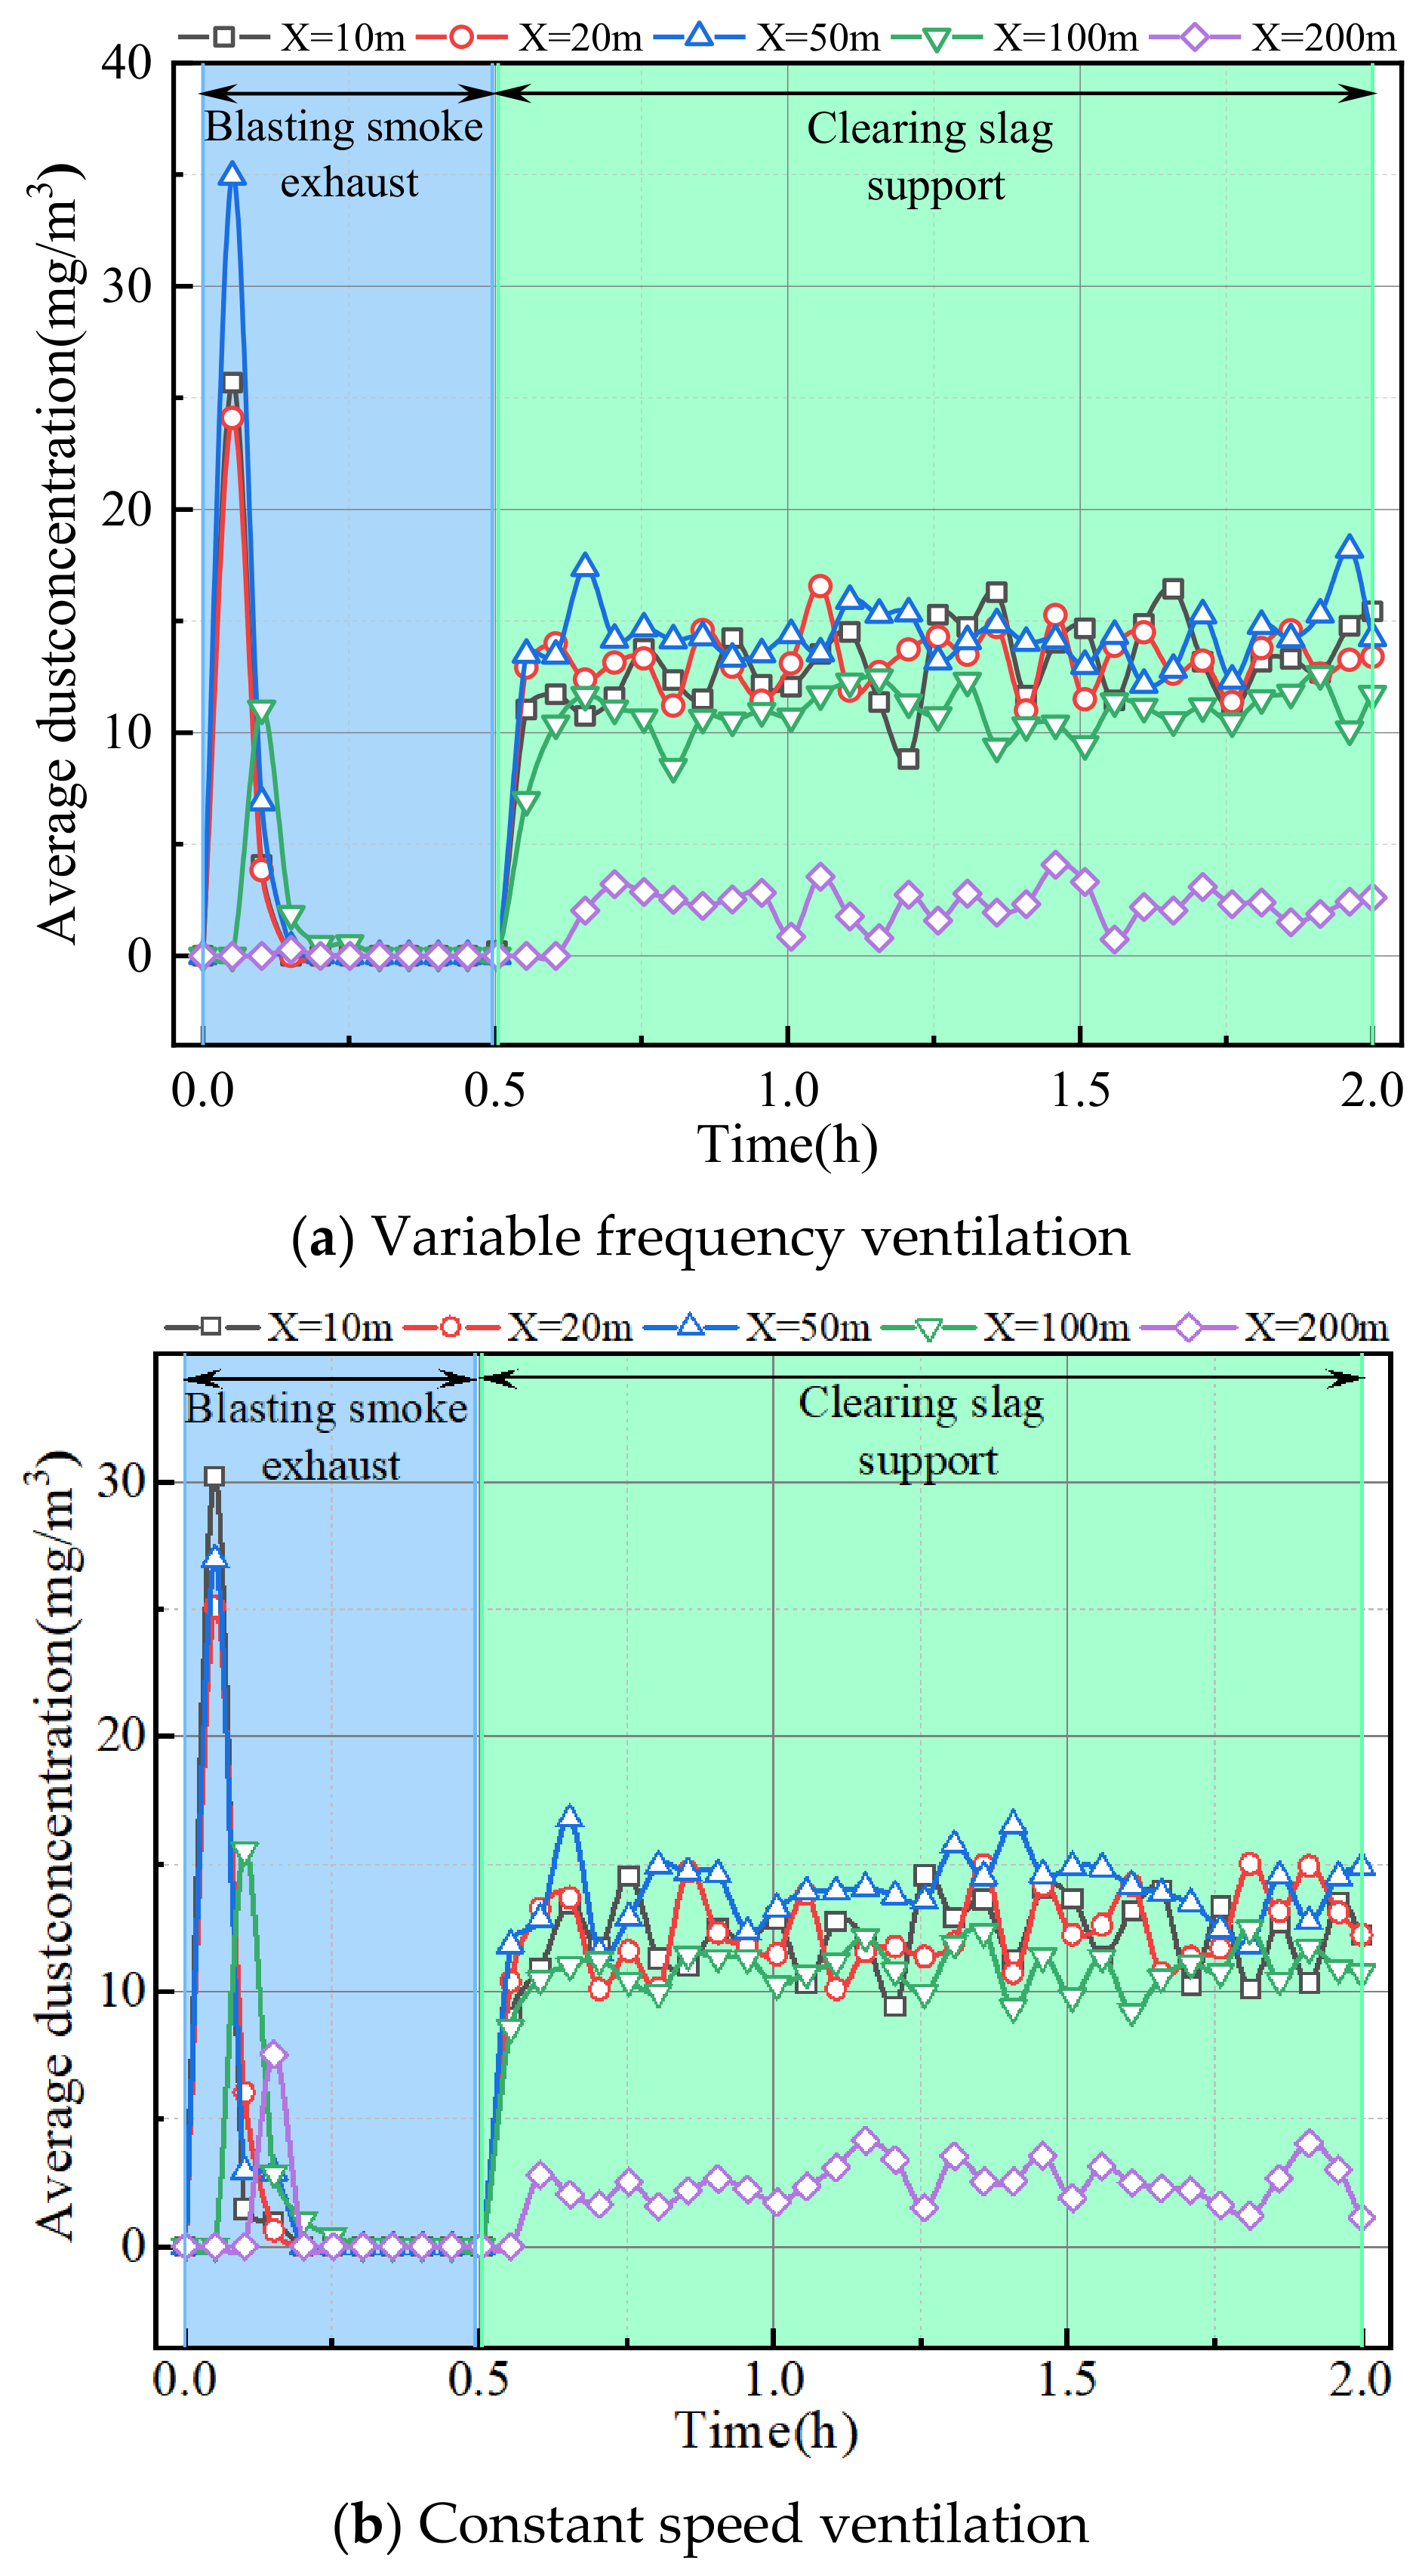
During the drilling and blasting period, the dust concentration is high only during the initial explosion. The mass flow rate of flour dust can reach up to 0.003 kg/s. Under the aforementioned conditions, the time-weighted average dust concentration in the working area of the flour workers is 81.49 mg/m3 with constant velocity ventilation (v = 4 m/s), and it can reach 78.81 mg/m3 with variable frequency ventilation. It can be observed that by implementing variable frequency ventilation using PID instructions, not only does it achieve variable frequency ventilation based on changes in environmental parameters, but it also serves to conserve energy and reduce dust concentration to ensure a safe working environment.
Within the next 1.5 h, the mass flow rate of flour dust during the cleaning period fluctuates around 0.002 kg/s. Under the aforementioned conditions, the time-weighted average dust concentration in the working area of the flour workers is 220.47 mg/m3 with constant ventilation (v = 4 m/s), and it can reach 225.01 mg/m3 with variable frequency ventilation. By analyzing the statistical data from Table 4, it is evident that the wind speed under PID variable frequency ventilation is lower than that under constant ventilation. However, when implementing variable frequency ventilation using PID instructions, the dust concentration is nearly identical to that under constant ventilation conditions.
To improve the reproducibility of the PID-based variable-frequency ventilation control algorithm, the PID parameters and tuning process were further specified. The predicted wind speed obtained from the GA-BP neural network was used as the set value of the controller, and the measured wind speed from the wind-speed sensor was used as the feedback value. The control objective was to minimize the deviation between the predicted wind speed and the measured wind speed by adjusting the fan operating frequency through the PLC and frequency converter.
In the PLC control program, the sampling interval was set to 1 s. The fan-frequency output was constrained within the allowable operating range of 20–50 Hz to avoid excessive acceleration, mechanical impact, and insufficient ventilation. The final PID parameters were obtained through a two-step tuning procedure. First, a step-response test was conducted to determine the preliminary dynamic relationship between fan frequency and roadway wind speed. Second, the parameters were fine-tuned under field dust-release conditions to reduce overshoot and steady-state fluctuation. The final parameters were Kp = 3.04, Ki = 21.12 s−1, and Kd = 84.47 s. The proportional term was used to improve the response speed, the integral term was used to eliminate the steady-state error, and the derivative term was used to suppress rapid fluctuation caused by sudden changes in environmental parameters.
To further evaluate the robustness of the PID controller, three disturbance conditions were designed according to the dust-release intensity and gas-concentration fluctuation observed during the field test. The low-disturbance condition represented stable ventilation with weak dust release. The medium-disturbance condition represented normal slag-cleaning operation. The high-disturbance condition represented rapid dust release and short-term gas-concentration fluctuation after drilling or blasting. The controller performance was evaluated using overshoot, settling time, steady-state error, and wind-speed fluctuation range. Based on the field-monitoring data and the PLC control-response records, the robustness of the PID controller was further evaluated under three representative operating conditions.
As shown in Table 3, the PID controller maintained stable wind-speed tracking under different disturbance intensities. Under the low-disturbance condition, the wind speed approached the target value within 18 s, and the steady-state error was only 0.03 m·s−1. Under medium and high disturbance conditions, the overshoot and settling time increased because of the rapid variation in dust concentration and gas disturbance. However, the maximum overshoot remained below 10%, and the steady-state error was controlled within 0.08 m·s−1. These results indicate that the selected PID parameters can provide acceptable control stability and robustness for the tested inclined-shaft ventilation conditions.

5.2. Energy-Saving Analysis

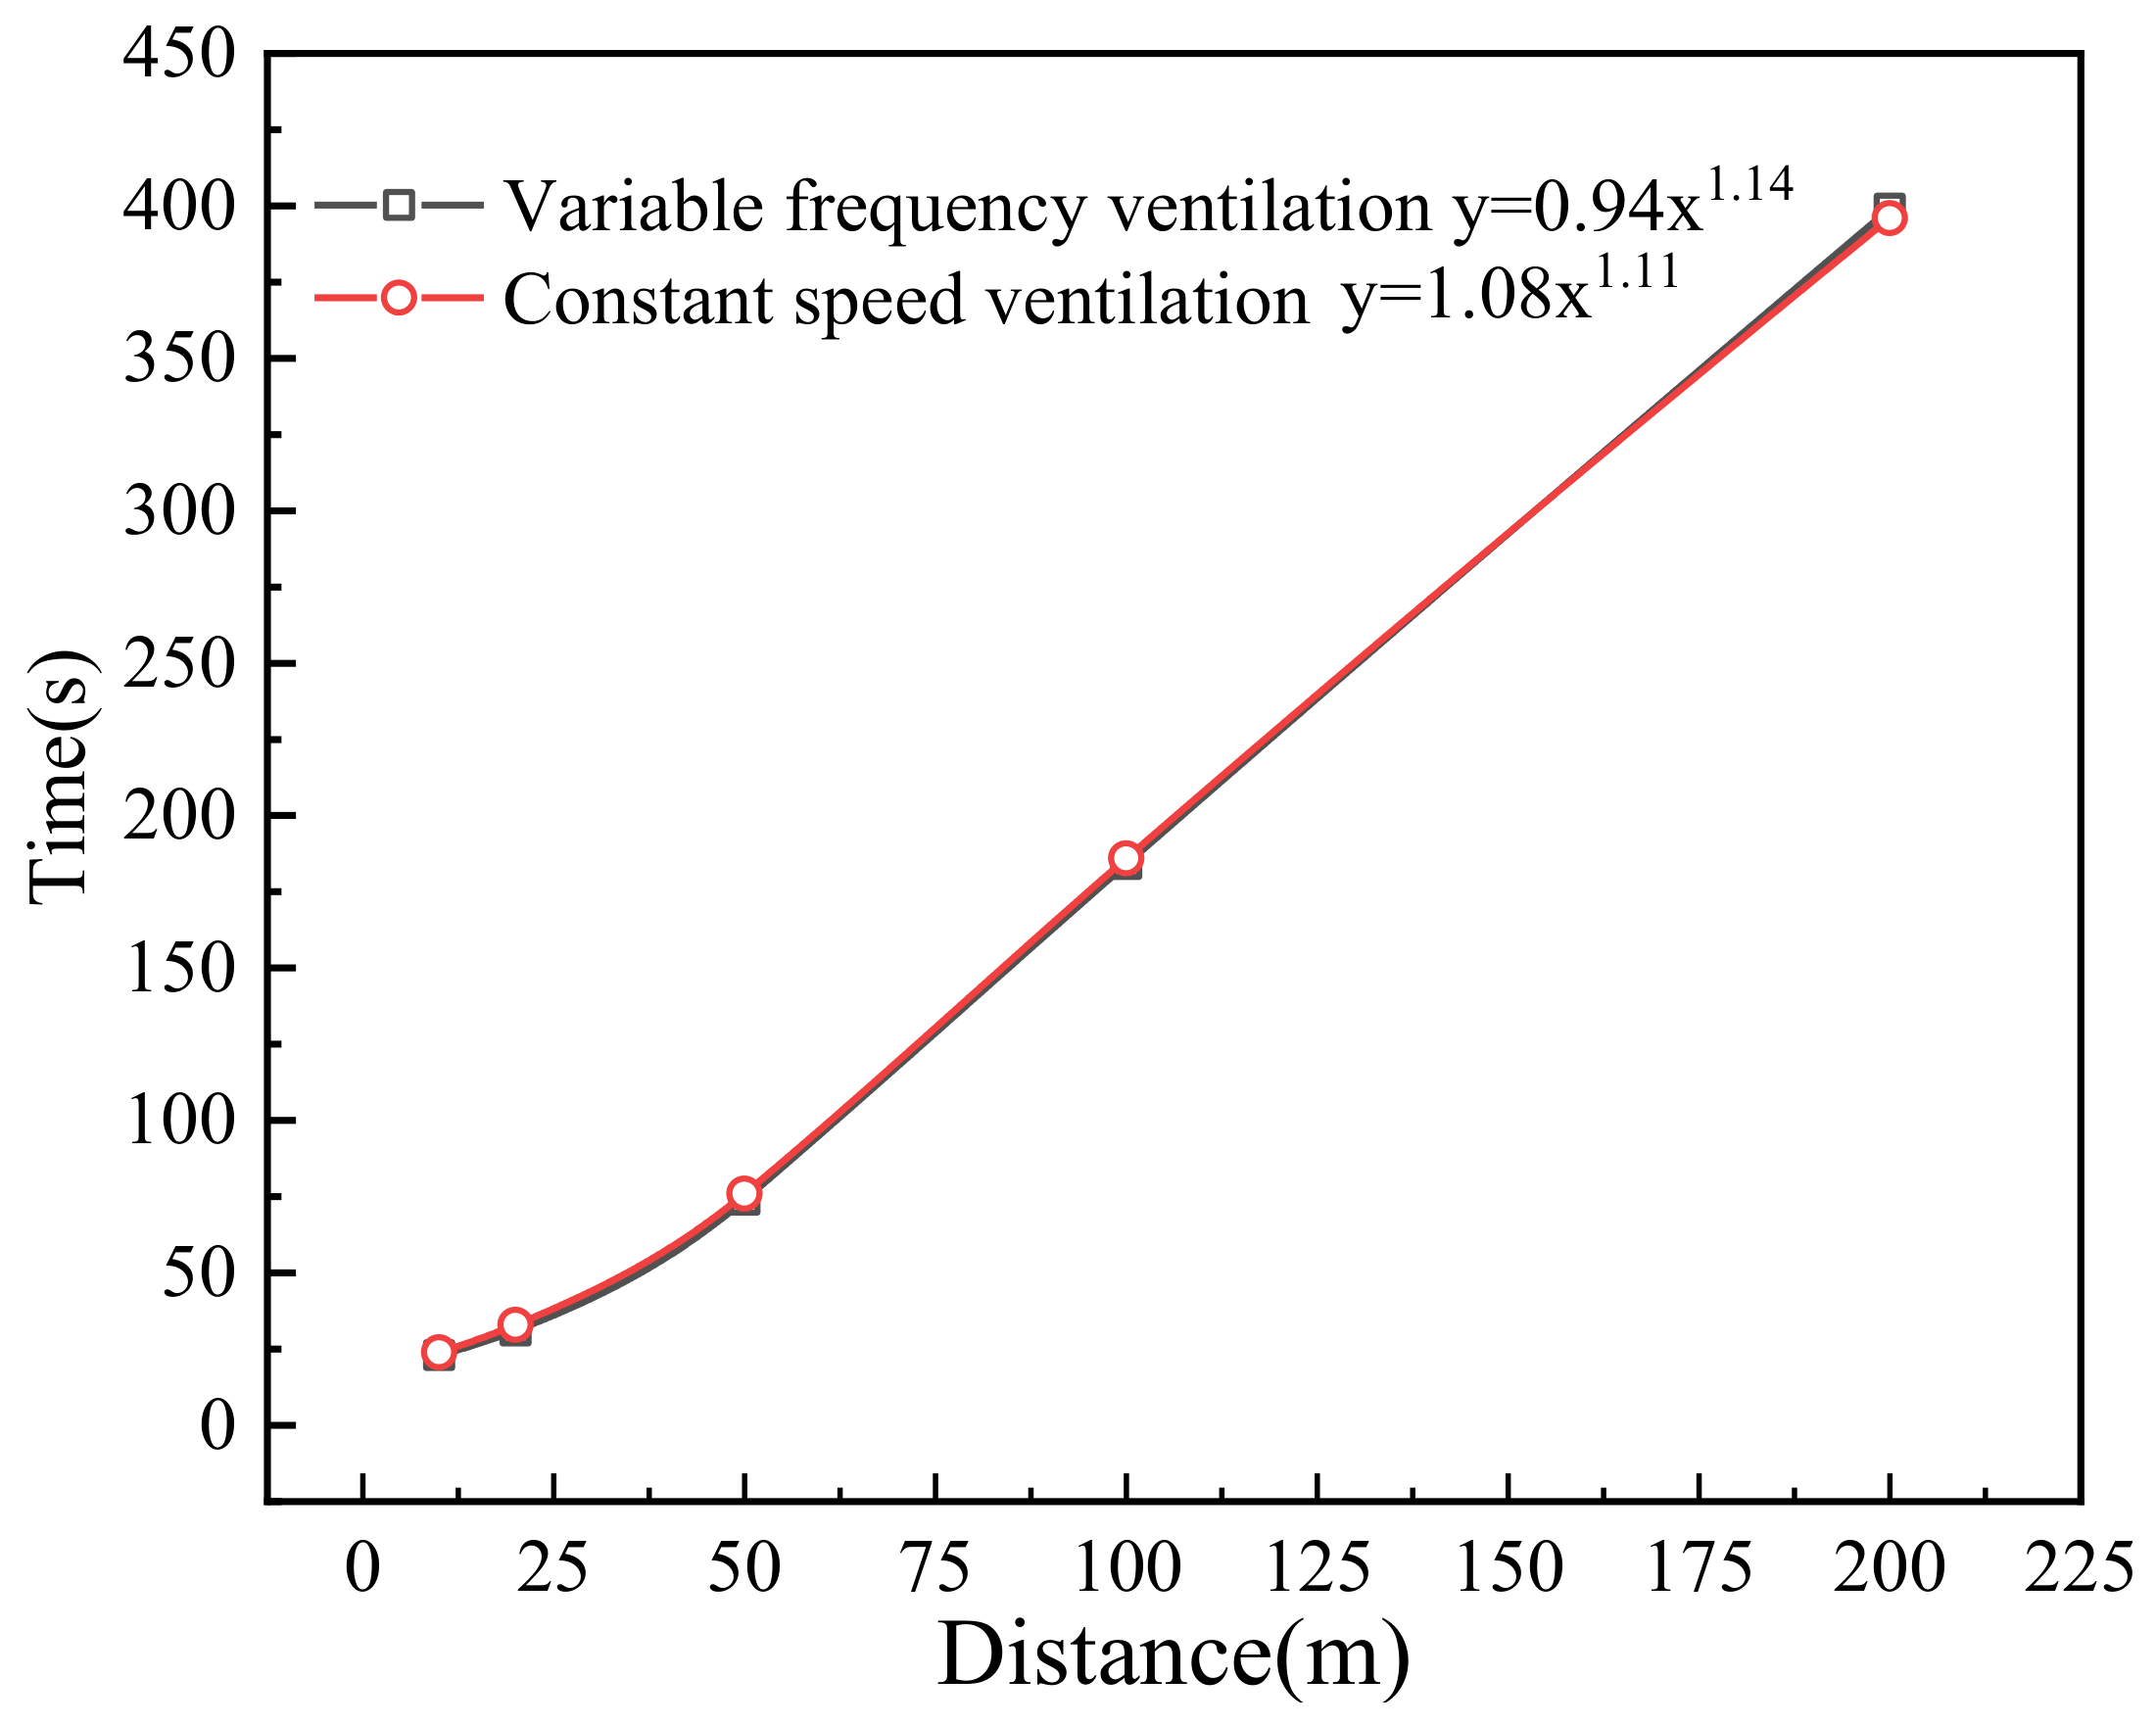
The release rate of dust on the inclined face of the slanting shaft varies during different stages of support. The changes in the weighted average dust concentration at the working face end under variable frequency ventilation and constant speed ventilation conditions during drilling and slag removal stages are shown in Figure 17. Additionally, the relationship between the dust diffusion distance and time under different ventilation conditions is fitted and illustrated in Figure 18.
From the monitoring point 200 m away, it can be observed that there are differences in the reflection time under different ventilation conditions. Under variable frequency ventilation conditions, the initial wind speed is higher, causing vortex flow at the end of the inclined shaft, resulting in a higher concentration of dust. However, the duration of dust at the end is shorter, indicating a stronger exhaust capacity. Under the tested dust-release conditions and within the 2 h monitoring period, the variable-frequency ventilation mode produced a dust-diffusion control effect comparable to that of constant-speed ventilation, while operating at a lower average wind speed. This result indicates that the proposed control system has potential for reducing unnecessary ventilation energy consumption under the tested operating conditions.

6. Conclusions

Through the optimization of parameters in the ventilation and dust removal system of the inclined shaft in the plateau, the following conclusions are mainly drawn:
(1)
A nonlinear relationship exists between the environmental parameters and the required wind speed at the inclined-shaft excavation face. By combining grey correlation analysis with the GA-BP neural network, the proposed method can extract key environmental indicators and predict the wind-speed demand under changing excavation conditions, providing a data-driven basis for adaptive variable-frequency ventilation control.
(2)
The genetic-neural network wind volume prediction model based on multiple environmental parameters has good predictive performance. By comparing the residuals and standard deviations of different wind volume prediction models, the standard deviation of multiple linear regression analysis is 0.0015, while the standard deviation of the genetic-neural network wind volume prediction model is 0.0007. The mathematical model for the required wind volume of the inclined shaft in the plateau based on the multiple linear regression algorithm is y = 0.45 x 1 + 0.69 x 2 + 0.31 x 3 0.19 x 4 0.11 x 5 .
(3)
Based on historical ventilation data, a variable frequency control system is used to compare the prediction of wind speed in the inclined shaft using the multiple linear regression analysis algorithm and the genetic-neural network algorithm. The PLC control system is used to remotely control the fan’s wind speed, thereby achieving online optimization of ventilation. A numerical simulation method for variable frequency ventilation based on wind volume prediction models is proposed, and the reliability of the variable frequency ventilation system is verified from the perspectives of system stability and energy-saving performance.
(4)
The linear relationship between the fan’s power supply frequency and the wind speed in the excavation tunnel is fitted. It is difficult to achieve stable control of the wind speed in the excavation tunnel using a single power frequency-controlled fan method. By using PID wind volume closed-loop control technology, the fan can output variable frequency and continuously and stably change the wind speed in the excavation tunnel to approach the predicted value. Compared to the method of controlling the fan’s wind speed with a single power frequency, better control effects can be achieved.

Author Contributions

Conceptualization, Z.J.; Validation, M.S.; Writing—original draft, Z.J.; Funding acquisition, Y.C. All authors have read and agreed to the published version of the manuscript.

Funding

This work was supported by the National Natural Science Foundation of China (No.62303042).

Data Availability Statement

The original contributions presented in this study are included in the article. Further inquiries can be directed to the corresponding author.

Conflicts of Interest

The authors declare no conflicts of interest.

References

  1. Chen, Z.; Du, C.; Wang, J.; Wang, Y. Influence of Recirculation Flow on the Dispersion Pattern of Blasting Dust in Deep Open-Pit Mines. ACS Omega 2023, 8, 31353–31364. [Google Scholar] [CrossRef] [PubMed]
  2. Liu, Z.; Zhang, R.; Ma, J.; Zhang, W.; Li, L. Analysis and Prediction of the Meteorological Characteristics of Dust Concentrations in Open-Pit Mines. Sustainability 2023, 15, 4837. [Google Scholar] [CrossRef]
  3. Wang, H. Numerical study of surrounding rock heat dissipation and wind temperature prediction in high geotemperature coal face. Energy Explor. Exploit. 2023, 42, 17–39. [Google Scholar] [CrossRef]
  4. Dong, W.; Jian, L.; Deng, L.; Wang, H. A supervised diagnostic experiment of resistance variable multifault locations in a mine ventilation system. Sci. Rep. 2023, 13, 5259. [Google Scholar] [CrossRef]
  5. Wang, G.; Xu, Y.; Ren, H. Intelligent and ecological coal mining as well as clean utilization technology in China: Review and prospects. Int. J. Min. Sci. Technol. 2019, 29, 161–169. [Google Scholar] [CrossRef]
  6. Feng, X.; Jiang, Z.; Zhang, G.; Luo, X.; Zeng, F. Study on CO diffusion law and concentration distribution function under ventilation after blasting in high-altitude tunnel. J. Wind Eng. Ind. Aerodyn. 2022, 220, 104871. [Google Scholar] [CrossRef]
  7. Wang, Y.; Jiang, Z. Research on mine cleaner production based on high wettability spray control dust pollution. Case Stud. Therm. Eng. 2021, 25, 100896. [Google Scholar] [CrossRef]
  8. Al-Bassam, E.; Elumalai, A.; Alkandari, S. Failure analysis of retrofitted cooling towers’ fans motors with variable frequency drives. Eng. Fail. Anal. 2019, 95, 164–170. [Google Scholar] [CrossRef]
  9. Liu, L.; Du, C.; Wang, Y.; Chen, J.; Yang, B.; Jin, W. Simulation Experiment Research of Mine Roadway Simulating Test Device with Adjustable Wind Velocity and Temperature and Humidity. Int. J. Environ. Res. Public Health 2023, 20, 4057. [Google Scholar] [CrossRef] [PubMed]
  10. Yang, S.; Ren, R.; Wang, Y.Q. Study on Air Cabin Ventilation System by Local Structural Optimization during Tunnel Construction. Buildings 2022, 12, 2235. [Google Scholar] [CrossRef]
  11. Ren, C.; Cao, S.J. Implementation and visualization of artificial intelligent ventilation control system using fast prediction models and limited monitoring data. Sust. Cities Soc. 2020, 52, 101860. [Google Scholar] [CrossRef]
  12. Barati-Harooni, A.; Najafi-Marghmaleki, A. An accurate RBF-NN model for estimation of viscosity of nanofluids. J. Mol. Liq. 2016, 224, 580–588. [Google Scholar] [CrossRef]
  13. Wu, X.J.; Zhu, X.J.; Cao, G.Y.; Tu, H.Y. Modeling a SOFC stack based on GA-RBF neural networks identification. J. Power Sources 2007, 167, 145–150. [Google Scholar] [CrossRef]
  14. Gupta, S.; Sarkar, P.; Singla, E. Understanding different stakeholders of sustainable product and service-based systems using genetic algorithm. Clean Technol. Environ. Policy 2015, 17, 1523–1533. [Google Scholar] [CrossRef]
  15. Wang, X.X.; Zhou, F.B.; Ling, Y.H.; Xiao, Y.N.; Ma, B.; Ma, X.Z.; Yu, S.B.; Liu, H.; Wei, K.W.; Kang, J.H. Overview and Outlook on Utilization Technologies of Low-Concentration Coal Mine Methane. Energy Fuels 2021, 35, 15398–15423. [Google Scholar] [CrossRef]
  16. Zhou, F.; Xin, H.; Wei, L.; Shi, G.; Xia, T. Research progress of mine intelligent ventilation theory and technology. Coal Sci. Technol. 2023, 51, 313–328. [Google Scholar]
  17. Al-Bassam, E.; Alasseri, R. Measurable energy savings of installing variable frequency drives for cooling towers’ fans, compared to dual speed motors. Energy Build. 2013, 67, 261–266. [Google Scholar] [CrossRef]
  18. Alsofyani, I.M.; Idris, N.R.N. A review on sensorless techniques for sustainable reliablity and efficient variable frequency drives of induction motors. Renew. Sustain. Energy Rev. 2013, 24, 111–121. [Google Scholar] [CrossRef]
  19. Miller, P.; Olateju, B.; Kumar, A. A techno-economic analysis of cost savings for retrofitting industrial aerial coolers with variable frequency drives. Energy Conv. Manag. 2012, 54, 81–89. [Google Scholar] [CrossRef]
  20. Teitel, M.; Zhao, Y.; Barak, M.; Bar-Lev, E.; Shmuel, D. Effect on energy use and greenhouse microclimate through fan motor control by variable frequency drives. Energy Conv. Manag. 2004, 45, 209–223. [Google Scholar] [CrossRef]
  21. Cui, X.; Hua, F.; Li, J.; Zhang, D. Expert System of Fuzzy Temperature Control for Continuous Annealing Simulator. J. Northeast. Univ. Nat. Sci. 2010, 31, 957–961. [Google Scholar]
  22. Joseph, S.B.; Dada, E.G.; Abidemi, A.; Oyewola, D.O.; Khammas, B.M. Metaheuristic algorithms for PID controller parameters tuning: Review, approaches and open problems. Heliyon 2022, 8, e09399. [Google Scholar] [CrossRef]
  23. Luo, W.; Khoo, Y.S.; Hacke, P.; Naumann, V.; Lausch, D.; Harvey, S.P.; Singh, J.P.; Chai, J.; Wang, Y.; Aberle, A.G.; et al. Potential-induced degradation in photovoltaic modules: A critical review. Energy Environ. Sci. 2017, 10, 43–68. [Google Scholar] [CrossRef]
  24. Lacasta, A.; Morales-Hernandez, M.; Brufau, P.; Garcia-Navarro, P. Simulation of PID control applied to irrigation channels. In 12th International Conference on Computing and Control for the Water Industry, CCWI 2013; Brunone, B., Giustolisi, O., Ferrante, M., Laucelli, D., Meniconi, S., Berardi, L., Campisano, A., Eds.; Elsevier: Amsterdam, The Netherlands, 2014; Volume 70, pp. 978–987. [Google Scholar]
  25. Liang, H.; Zou, J.; Zuo, K.; Khan, M.J. An improved genetic algorithm optimization fuzzy controller applied to the wellhead back pressure control system. Mech. Syst. Signal Proc. 2020, 142, 106708. [Google Scholar] [CrossRef]
  26. Qi, Y.; Meng, Q. The Application of Fuzzy PID Control in Pitch Wind Turbine. In 2012 International Conference on Future Energy, Environment, and Materials, Pt C; Yang, G., Ed.; Elsevier: Amsterdam, The Netherlands, 2012; Volume 16, pp. 1635–1641. [Google Scholar]
  27. Hong, Y.; Fu, C.; Merci, B. Numerical analysis of the performance of a PID control based real-time mechanical ventilation system to prevent smoke back-layering in. Tunn. Undergr. Space Technol. 2022, 128, 104639. [Google Scholar] [CrossRef]
  28. Hong, Y.; Kang, J.; Fu, C. Tunnel fire smoke control based on the PID method: A numerical study. Tunn. Undergr. Space Technol. 2022, 124, 104450. [Google Scholar] [CrossRef]
  29. Si, L.; Cao, W.; Chen, X. Active Disturbance Rejection Control of a Longitudinal Tunnel Ventilation System. Energies 2020, 13, 1871. [Google Scholar] [CrossRef]
  30. Shen, Z.; Yan, M.; Zhao, D. Machine learning model for windage alteration fault diagnosis of mine ventilation system under unbalanced samples. Min. Miner. Depos. 2025, 19, 72–80. [Google Scholar] [CrossRef]
  31. Nguyen, C.H.; Vu, T.T.; Le, D.T.; Do, S.A.; Dao, C.V.; Le, P.Q. Assessment of the ventilation system and solutions for improving the ventilation network at Khe Cham Coal Mine, Vietnam. Eng. J. Satbayev Univ. 2025, 147, 20–29. [Google Scholar] [CrossRef]
  32. Guo, C.; Wang, M.; Yang, L.; Sun, Z.; Zhang, Y.; Xu, J. A review of energy consumption and saving in extra-long tunnel operation ventilation in China. Renew. Sust. Energ. Rev. 2016, 53, 1558–1569. [Google Scholar] [CrossRef]
  33. Hargreaves, D.M.; Lowndes, I.S. The computational modeling of the ventilation flows within a rapid development drivage. Tunn. Undergr. Space Technol. 2007, 22, 150–160. [Google Scholar] [CrossRef]
  34. Lin, S.; Liu, Z.; Qian, J.; Li, X.; Zhang, Q. Flammability and Explosion Risk of Post-explosion CH4/air and CH4/coal dust/air Mixtures. Combust. Sci. Technol. 2021, 193, 1279–1292. [Google Scholar] [CrossRef]
  35. Wang, H.; Jiang, Z.; Zhang, G.; Zeng, F. Parameter analysis of jet tunnel ventilation for long distance construction tunnels at high altitude. J. Wind Eng. Ind. Aerodyn. 2022, 228, 105128. [Google Scholar] [CrossRef]
  36. Wang, H.; Jiang, Z.; Wang, H.; Zhang, G.; Xu, S. Experimental and simulation study of air curtain uniformity and analysis of air curtain’s dust barrier effect. J. Wind Eng. Ind. Aerodyn. 2023, 233, 105322. [Google Scholar] [CrossRef]
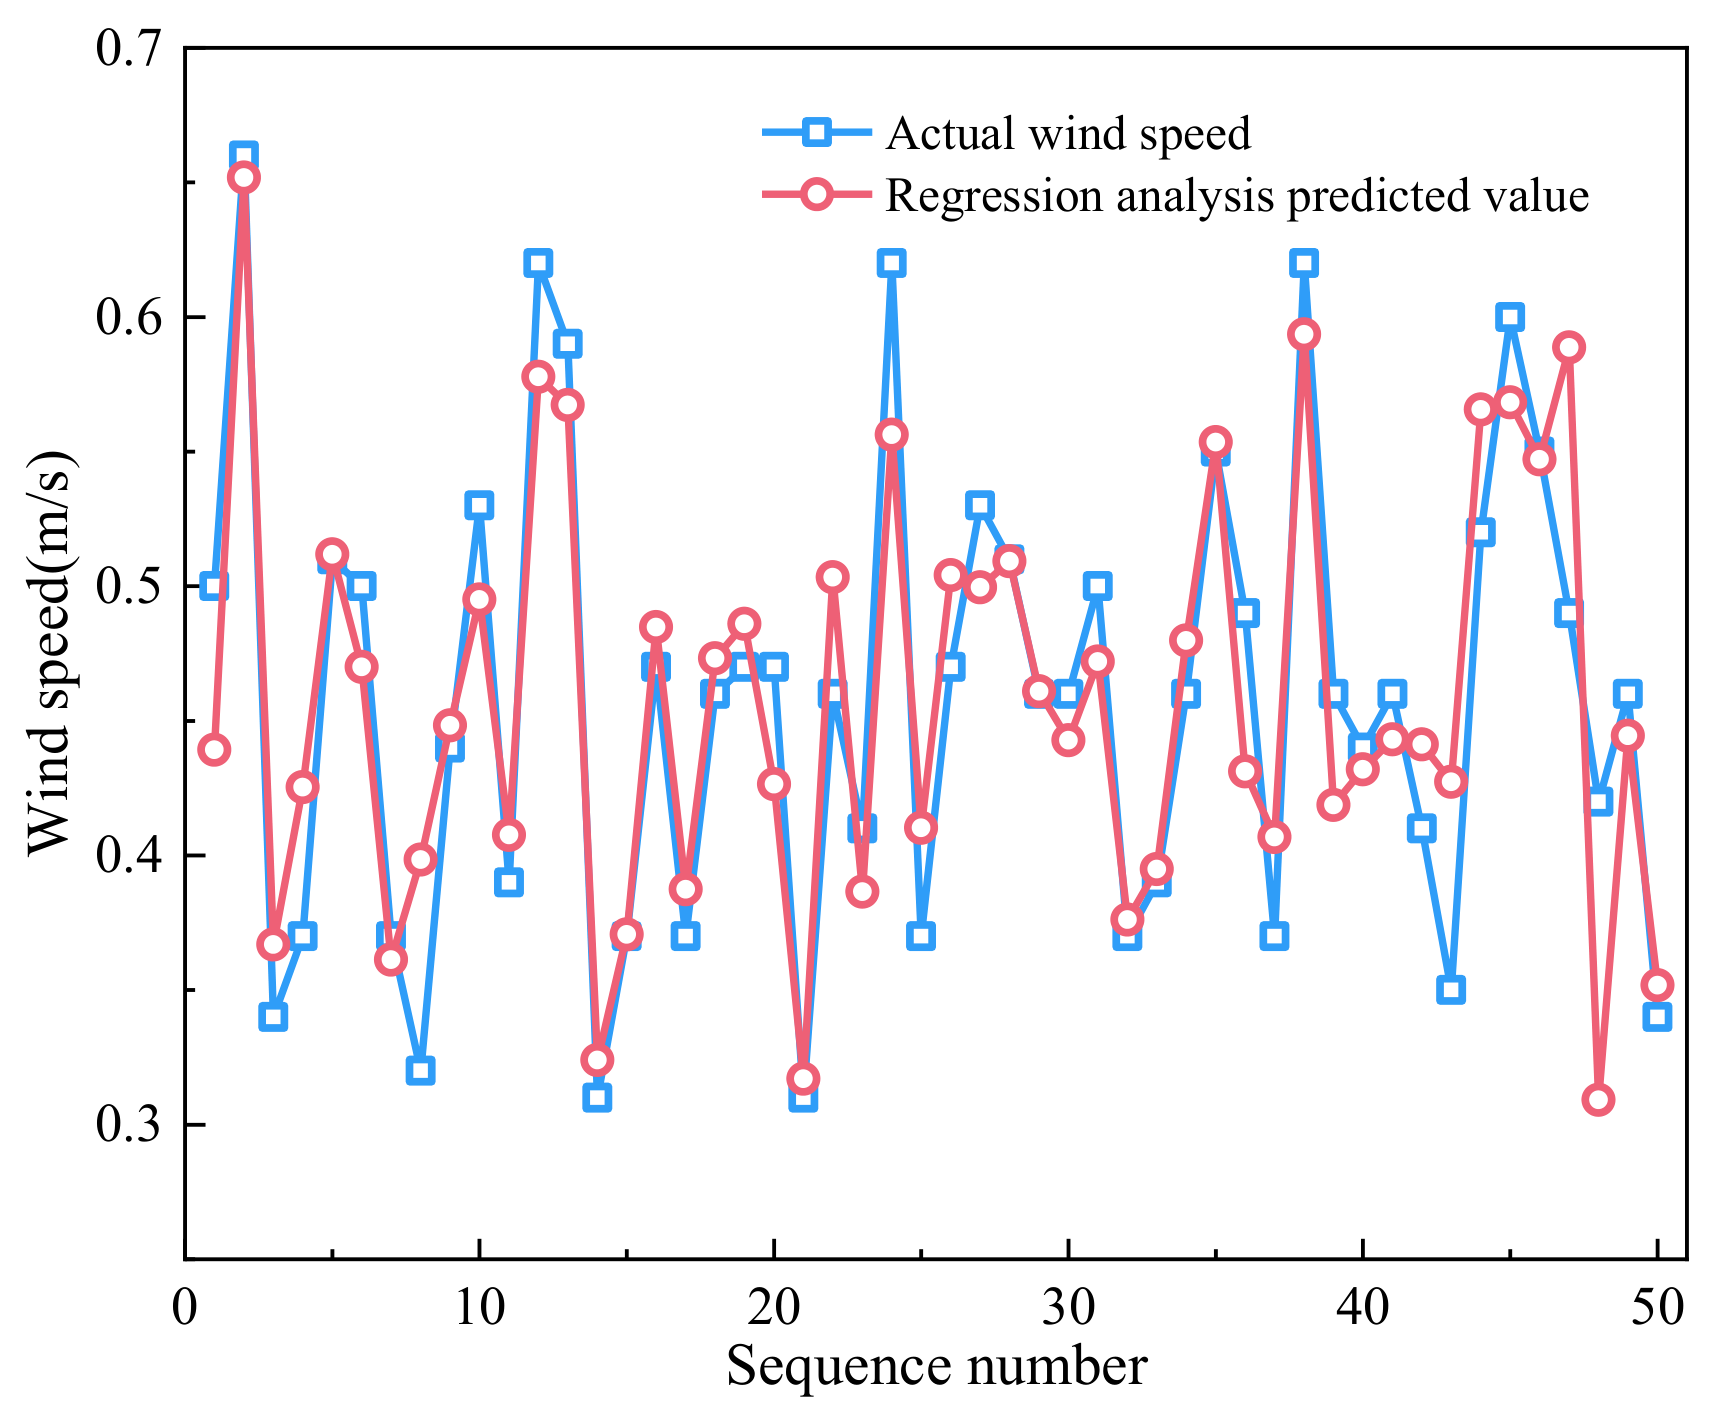
Figure 1. Comparison of prediction results of wind speed by multiple linear regression prediction model.
Processes 14 01660 g001
Figure 2. Flow chart of wind speed collaborative prediction of environmental parameter.
Processes 14 01660 g002
Figure 3. Fitness curve.
Processes 14 01660 g003
Figure 4. Error performance curve.
Processes 14 01660 g004
Figure 5. Wind speed prediction results of inclined shaft genetic neural network.
Processes 14 01660 g005
Figure 6. The fitting performance of GA-BP neural network.
Processes 14 01660 g006
Figure 7. Prediction performance of genetic-neural network.
Processes 14 01660 g007
Figure 8. Comparison of genetic neural network and regression prediction effect.
Processes 14 01660 g008
Figure 9. Ventilation control loop of variable frequency fan based on PID controller.
Processes 14 01660 g009
Figure 10. PID control algorithm and CFD coupling implementation process.
Processes 14 01660 g010
Figure 11. Frame model of intelligent variable frequency ventilation control system for inclined shaft face.
Processes 14 01660 g011
Figure 12. Electrical connection and physical diagram of intelligent variable frequency ventilation control system for tunnel face.
Processes 14 01660 g012
Figure 13. Structure stratification of variable frequency ventilation control system in inclined shaft.
Processes 14 01660 g013
Figure 14. PLC different control mode operation process.
Processes 14 01660 g014
Figure 15. Operation flow chart of variable frequency ventilation control system in inclined shaft.
Processes 14 01660 g015
Figure 16. Monitoring results of PID variable frequency ventilation wind speed in drilling and blasting period and slag cleaning period.
Processes 14 01660 g016
Figure 17. Comparison of average dust concentration at the working end under different ventilation conditions in different periods.
Processes 14 01660 g017
Figure 18. Variation of dust diffusion distance under different ventilation modes.
Processes 14 01660 g018
Table 1. Grey correlation degree and correlation order results.
Influencing FactorsTotal DustRespirable DustTemperatureHumidityNitrogen DioxideCarbon MonoxideHydrogen Sulfide
Comprehensive grey correlation degree0.83590.80630.82840.89920.70040.63860.6186
Comprehensive weight association order2431567
Sorting from large to smallHumidity > Total dust > Temperature > Respirable dust > Nitrogen dioxide > Carbon monoxide > Hydrogen sulfide
Table 2. Performance comparison of different wind-speed prediction models.
ModelMAE/(m·s−1)RMSE/(m·s−1)MAPE/%R2Training Time/sPrediction Time/sRemarks
Random forest0.0740.0962.630.8721.420.018Stable prediction, but the output fluctuates stepwise and is less smooth for closed-loop control
RBF neural network0.0860.1123.040.8460.860.009Fast convergence, but sensitive to hidden-layer center and spread parameters
LSTM0.0930.1213.310.83112.750.026Suitable for long time-series learning, but limited by the present sample size
GA-BP neural network0.0520.0711.860.9144.360.011Best comprehensive performance under the present dataset; selected for PLC-PID control
Table 3. Comparison of weighted average dust concentration in working area under different ventilation modes.
ItemsDrilling and Blasting Period (mg/m3)Clearing Slag Period (mg/m3)
Constant speed ventilation81.49220.47
Variable frequency ventilation78.81225.01
Table 4. Robustness verification of the PID-based variable-frequency ventilation control system.
Disturbance ConditionMain Disturbance SourceTarget Wind Speed/(m·s−1)Overshoot/%Settling Time/sSteady-State Error/(m·s−1)Wind-Speed Fluctuation/(m·s−1)
Low disturbanceWeak dust release and stable gas concentration2.803.2180.03±0.06
Medium disturbanceSlag-cleaning dust release3.205.8260.05±0.09
High disturbanceRapid dust release and short-term gas fluctuation3.608.6380.08±0.13
Disclaimer/Publisher’s Note: The statements, opinions and data contained in all publications are solely those of the individual author(s) and contributor(s) and not of MDPI and/or the editor(s). MDPI and/or the editor(s) disclaim responsibility for any injury to people or property resulting from any ideas, methods, instructions or products referred to in the content.