Article

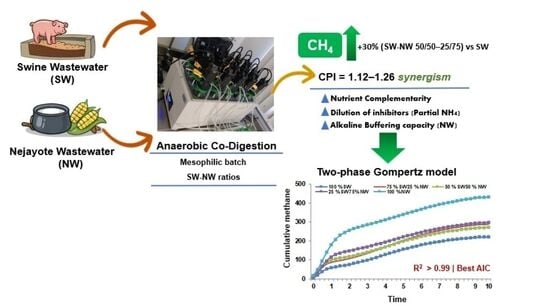
Methane Production Using Anaerobic Co-Digestion of Swine and Nejayote Wastewater: Synergic Effects and Kinetic Modeling Studies

by
Perla A. González-Tineo
1,
Juan F. Maldonado-Escalante
1,
Eduardo Castro-Payán
1,
Edna R. Meza-Escalante
1,
Luis H. Álvarez
2,
Rigoberto Plascencia-Jatomea
1,* and
Denisse Serrano-Palacios
1,*
1
Departamento de Ciencias del Agua y Medio Ambiente, Instituto Tecnológico de Sonora, Antonio Caso S/N y E. Kino, Colonia Villa ITSON, Ciudad Obregón C.P. 85130, Sonora, Mexico
2
Departamento de Biotecnología y Ciencias Alimentarias, Instituto Tecnológico de Sonora, 5 de 12 Febrero 818 Sur, Colonia Centro, Cuidad Obregón C.P. 85000, Sonora, Mexico
*
Authors to whom correspondence should be addressed.
Processes 2026, 14(10), 1649; https://doi.org/10.3390/pr14101649
Submission received: 24 March 2026 / Revised: 7 May 2026 / Accepted: 14 May 2026 / Published: 20 May 2026
(This article belongs to the Special Issue Waste Biorefinery Technologies for Sustainable Energy Processes)

Abstract

Anaerobic co-digestion of substrates offers synergistic benefits, enhancing methane production and improving the operational stability of wastewater treatment. The present study, for the first time, evaluated the biochemical methane potential and kinetics modeling performance of two regional wastewater streams—swine wastewater (SW) and nejayote wastewater (NW)—under mesophilic batch conditions. Five substrate ratios (SW/NW: 100/0 to 0/100) were tested, and interaction effects were measured using the co-digestion performance index (CPI). All mixtures demonstrated synergistic effects, with CPI values ranging from 1.12 to 1.26. NW exhibited the highest methane yield (438 ± 25 NL-CH4/kgCODT-removed), nearly twice that obtained for SW (227 ± 18 NL-CH4/kgCODT-removed). In addition, co-digestion improved the methane yield of SW as mono-digestion, with production increasing from 281.8 ± 12.4 to 304.7 ± 27.8 NL-CH4/kgCODT-removed in all mixtures. The methane production kinetics were analyzed using six mathematical models. The multi-phase Gompertz model provided the best fit (R2 > 0.99), while the two-phase model offered the best balance of accuracy and simplicity according to Akaike’s criterion. The present model effectively described the diauxic patterns of methane production resulting from substrate heterogeneity with an error of <8% for all experimental assays.

Graphical Abstract

1. Introduction

Anaerobic digestion (AD) offers a sustainable solution for treating different types of wastes, including wastewaters, which could help to mitigate the environmental impact of these residues [1]. The process involves the anaerobic action of microorganisms to break down complex organic matter without oxygen into biogas, a renewable energy source, and digestate, a nutrient-rich residue [2]. Although AD using single substrates is common, anaerobic co-digestion, which is the simultaneous treatment of two or more complementary feedstocks, provides several ecological, technological, and economic advantages [3]. Combining different feedstocks often balances nutrient ratios and provides a richer mix of organic matter, leading to increased biogas yields [4].
Several studies have examined anaerobic co-digestion using substrates such as wastewater, biosolids, food waste, agro-industrial waste, and animal manure [5]. The reports show that the physicochemical properties and mixing ratios can create synergistic or antagonistic effects [6]. A synergistic effect increases methane production compared with mono-digestion, whereas an antagonistic interaction occurs when inhibitory substances or nutritional imbalances limit co-digestion [7]. Understanding these effects is essential to improving process efficiency and maximizing methane production.
Agricultural and livestock waste management is a major environmental challenge. In Mexico, there is a growing interest in wastewater valorization methodologies, including swine wastewater (SW) and nejayote wastewater (NW) from corn nixtamalization. It is well established that pig farms contribute to environmental pressures due to their high concentrations of chemical oxygen demand (COD), typically ranging from 1000 to 30,000 mg/L, volatile solids (VS) commonly reported between 4.6 and 6.7 g/L, and nitrogenous compounds (e.g., ammonium and total nitrogen) generally in the range of 400 to 2400 mg/L [8,9]. For example, a medium-sized farm generates between 30 and 35 m3/day of wastewater [10]. Nejayote is defined as the primary liquid by-product of nixtamalization, originating from the cooking and steeping stages where the alkaline solution extracts structural components of the maize kernel [11]. It has been characterized as a high-strength wastewater with strongly alkaline pH values (typically >10), high organic load, and elevated concentrations of calcium and suspended solids [12]. Reported compositions include total suspended solids in the range of 3–5 g/L and chemical oxygen demand (COD) values above 15 g/L, along with the presence of starch residues, proteins, soluble sugars, arabinoxylans, and phenolic compounds, which contribute to its recalcitrant nature and environmental impact [13]. In Mexico, the production of tortillas, tortilla chips, and other corn-based foods generates approximately 14.4 million m3/year of nejayote [14]. These wastewaters could represent an attractive energy source due to their abundance and high organic content.
Most studies on nejayote focus on hydrogen production, with limited information on its role in anaerobic co-digestion systems and its kinetic behavior during methane production. In dark fermentation, nejayote has proven effective for hydrogen generation under controlled conditions, particularly when co-digested with brewery wastewater to stabilize pH and nutrient balance [15]. Similarly, co-digestion with protein-rich effluents, such as wastewater from slaughterhouses, highlights the importance of substrate complementarity and operational strategies [16]. Despite these advances in hydrogen research, studies exploring methane production from nejayote remain scarce. Research indicates that two-stage anaerobic digestion systems can effectively convert this effluent into biogas with high methane content, especially when coupled with microaeration [17]. Recent specialized research has further explored the efficiency of the incorporation of Fe-coated granular activated carbon, which has been reported to increase organic matter removal efficiencies by up to 88% COD reduction, although without a significant effect on methane production [18]. Moreover, nejayote also serves as an effective alkaline pretreatment medium. In co-digestion systems, its integration has been shown to increase methane yields by 55% when coupled with poultry manure and by up to 3.5 times when combined with cattle manure [19].
Other than choosing the right substrate, the use of kinetic models is essential for describing and predicting methane production. These models help estimate kinetic parameters, such as the maximum methane production rate, the production rate, and the lag phase. These factors indicate the efficiency of the process and the proper adaptation of the microorganisms to the substrate [20].
Various kinetic models have been proposed to predict the potential for biogas production during AD. These commonly include the first-order, monomolecular, logistic, and Gompertz models (both modified and multi-phase). It is widely observed that these models often yield different predictions of biogas production. This variance in the accuracy of biogas yield prediction depends on the inherent properties of the feedstock (e.g., solubility, biodegradability, and the presence of inhibitory compounds) that determine how closely its degradation kinetics match the assumptions of a specific mathematical model [21]. For instance, Budiyono et al. [22] compared the kinetic model of biogas production from vinasse, and the prediction of biogas yield using the modified Gompertz model was notably more accurate, with a fitting error ranging from 0.76 to 3.14%. In contrast, the first-order kinetic model showed less precision with a fitting error of 1.54–7.50%.
It should be noted that there is a significant lack of information on the use of NW as a substrate in anaerobic co-digestion systems, and even less on modeling its behavior in terms of methane production over time. To the best of our knowledge, this is the first comprehensive kinetic and synergy analysis of SW-NW co-digestion.
Thus, the objective of the present study is to evaluate the anaerobic co-digestion of SW and NW under mesophilic batch conditions. Moreover, six mathematical models were used to estimate the kinetic parameters of the tests, and the synergistic effects for methane production were investigated using the CPI.

2. Materials and Methods

2.1. Inoculum Characteristics

The microbial biomass used in the biodegradability assays was obtained from an Upflow Anaerobic Sludge Blanket (UASB) reactor of a brewery industry located in Ciudad Obregón, Mexico. The inoculum presented physical characteristics such as an initial concentration of TSS of 56.77 g/L and VSS of 40.99 g/L, which was constituted by 99.38% of granules with an approximate diameter of 0.6 cm, with a sedimentation rate of 16.26 m/h and a Sludge Volume Index (SVI) of 19.7 mL/g TSS.

2.2. Wastewater Characterization

For the purpose of evaluating biogas production, two different agro-industrial wastewater samples were collected: nejayote (corn industry wastewater) and swine wastewater. These samples were obtained from a local Tortillas factory or a pig farm within Ciudad Obregón, Sonora, Mexico. Wastewater characterization included the measurement of total and soluble Chemical Oxygen Demand (COD) and ammoniacal nitrogen (NH4+-N/L) content, following standard methods [23]. Alkalinity was determined by titrating 100 mL of the samples with a 0.1 N H2SO4 solution to endpoint pH values of 5.75 and 4.3. The volume of acid consumed at each pH was recorded and expressed in mg/L of CaCO3 [24].

2.3. Biochemical Methane Potential (BMP) Assays

The characteristics of the wastewater samples were adjusted in two parameters to ensure experimental consistency. The soluble COD of the sample with the highest concentration (NW) was aligned with that of the lowest concentration sample (SW). This was achieved by diluting the NW sample at a 1:3 ratio, resulting in a target soluble COD concentration of 3300 ± 100 mg/L. Concurrently, the initial pH of all samples was adjusted to 7 ± 0.1 by adding 1.0 M sodium hydroxide (NaOH) or 1.0 M hydrochloric acid (HCl). No subsequent pH adjustments were provided during the experimental period.
Based on their soluble COD, five distinct substrate ratios (NW/SW) were evaluated: 100/0, 75/25, 50/50, 25/75, and 0/100 (v/v). To prepare the experimental units in triplicate, 80 mL of biomass and 320 mL of the respective wastewater mixture were added to each bottle of 500 mL, resulting in an inoculum–substrate ratio (ISR) of 3.1 g VSS/g CODs. The overall experimental setup is illustrated in Figure 1. These were hermetically sealed to prevent gas leakage and the headspace was immediately flushed with nitrogen for 1 min to maintain anaerobic conditions. A set of blank controls without a carbon base was also included. Finally, the assays were performed using an Automatic Methane Potential Test System II (AMPTS II, Bioprocess Control AB, Lund, Sweden) at a mesophilic temperature of 35 ± 1 °C and 120 rpm with intermittent stirring (30 min on/10 min off). This test system consists of three units: unit A is the sample incubation unit; unit B is the CO2-absorbing unit with dioxide trap (3 M NaOH and Thymolphthalein pH indicator), and unit C is the gas measuring device using the principle of liquid displacement and buoyancy. In addition, an integrated embedded data acquisition in this system is used to automatically measure the normalized methane flow rate.
Samples from each experimental unit were taken after the digestion process and then analyzed for alkalinity, pH, COD, and NH4+-N.

2.4. Cumulative Methane Yield and Co-Digestion Performance Index

The cumulative methane yield and CPI were calculated according to Equations (1) and (2), respectively.
Accumulative   methane   yield   = L - CH 4 gCOD T - removed
CPI = BMP i , j ( x i · BMP i ) + ( x j · BMP j ) x i , j = ( COD total   removed   of   monodigestion   i , j ) ( fraction   of   wastewater   i , j ) COD T - removed   of   the   mixture
where BMPi,j is the experimental biochemical methane yield obtained from the co-digestion mixture, xi,j is the fraction of the CODT-removed in the mixture by each substrate, and BMPi and BMPj are the accumulated methane production determined from the mono-digestion of each substrate.
CPI was used to determine the type of interaction that occurs when different substrates are used in anaerobic co-digestion. CPI values > 1 denote a synergistic effect, values equal to 1 indicate an additive contribution, and values < 1 suggest antagonistic behavior. This parameter provides a comparative basis to evaluate the efficiency of co-digestion strategies [3,25].

2.5. Kinetics Modeling

Exponential and sigmoidal mathematical models have been used to describe the kinetics of methane production under different operational conditions and substrates. In the present study, six models, including first-order [26], monomolecular [27], logistic [28], modified Gompertz [29], and multi-phases Gompertz (two and three phases) [30] were used to fit experimental data. The Origin 2025 software was implemented for all computations. The models for describing the cumulative methane yields are shown in Table 1.
MPmodel is the accumulated methane yields (NL-CH4/kgCODT-removed), MPmax is the maximum methane potential (NL-CH4/kgCODT-removed), k is the apparent rate constant of methane production (d−1), ϒ is the lag phase duration (d), RMP is the maximum methane production rate (NL-CH4/kgCODT-removed·d), t is the time (d), and e is Euler’s constant.

2.6. Statistical Analysis

A statistical analysis was conducted to evaluate differences in methane yield across the assays. Specifically, Fisher’s Least Significant Difference (LSD) test was applied following analysis of variance (ANOVA) at α = 0.05 to determine statistically significant differences between treatment means. In addition, a Principal Component Analysis (PCA) was performed to explore patterns and relationships among the evaluated variables.
In order to evaluate the accuracy, reliability and overfitting of the modeling results, different statistical criteria were determined: the coefficient of determination (R2) assesses the proportion of variance predicted by the model from experimental data, where values near 1 (>0.9) indicate a reliable prediction of the model [31]; the root mean square error (RMSE) was used to evaluate the deviation between measured accumulated methane yield (MPexp) and the MPmodel [32], and Akaike’s information criterion (AIC) was determined for model selection by balancing the curve fit agreement to experimental data against the number of parameters, penalizing over-complex models to prevent overfitting [33]. These statistical criteria were determined according to Equations (9)–(11).
R 2   = 1 i Y i , exp Y i , model 2 i Y i , exp Y ¯ 2
RMSE = i n Y i , exp Y i , model 2 n
AIC = 2 K 2 ln RSS n
where Yi,exp is the experimental data, Yi,model is the predicted data by the models, Y ¯ is the mean of the experimental data, n is the number of experimental data, K is the number of parameters, and RSS is the residual sum of squares. All statistical analyses and model fitting procedures were carried out using the OriginPro 2025 (OriginLab Corporation, Northampton, MA, USA).

3. Results and Discussion

3.1. Biochemical Methane Potential Assays

3.1.1. Initial and Final Physicochemical Characteristics of Wastewater Treatments

The results of the initial and final conditions of the wastewater and their mixtures used for anaerobic co-digestion assays are shown in Table 2. A high reduction in COD total was achieved across all experimental runs, with removal efficiencies of 45–52%. This reduction demonstrated effective degradation of organic matter, indicating an active and efficient methanogenic process [34].
The initial pH remained stable at neutral values of 6.98–7.01 across all mixtures, reducing the risk of acidification during fermentation. At the end of the assays, pH increased slightly between 6.91 and 7.37, especially in mixtures with higher proportions of SW. Under these conditions, the carbonate–bicarbonate system serves as the primary buffering mechanism in the reactor liquor and contributes significantly to alkalinity and methanogenic stability [35].
At the end of the assay, the final alkalinity values were higher than the initial values in all mixtures. The greatest increment occurred in the 100% NW treatment, where alkalinity reached 19.6 times its initial value. While moderate increases were observed in the mixtures (2.08, 1.79, 1.44, and 1.31 times for 75% NW–25% SW, 50% NW–50% SW, 25% NW–75% SW, and 100% SW, respectively). This trend may be related to the natural alkalinity of NW and the metabolic activity of anaerobic microorganisms, which produce bicarbonate alkalinity during substrate conversion [36].
The increase in alkalinity provided buffering capacity, preventing a pH drop due to volatile fatty acid formation and, thus, contributing to process stability. At the same time, ammonium nitrogen concentrations increased significantly across all mixtures, in accordance with the SW proportions (Table 2). This trend is likely attributable to the degradation of organic nitrogenous compounds in pig excreta, such as urea, proteins, and amino acids, with ammonium as the final product [37]. Nevertheless, at neutral pH, most total ammonia nitrogen is present as ammonium (NH4+), which forms a conjugate acid–base pair with ammonia (NH3) and can partially neutralize added protons, albeit to a lesser extent than the bicarbonate system [38].
Alkalinity is expressed as mg CaCO3/L, while COD and ammonium nitrogen (NH4+-N) are reported in mg/L.

3.1.2. Cumulative Methane Yields

SW was co-digested with NW over a 9.5-day incubation period to determine the optimal composition of both substrates for enhancing methane production and CODT removal. Data from this investigation are illustrated in Figure 2.
The methane yield for each assay was determined by subtracting the production of the control (52.67 NL-CH4/kgCODT-removed) from the total cumulative methane yield. Fisher’s Least Significant Difference (LSD) test was performed at α = 0.05, where different letters indicate statistically significant differences among treatments. According to the agro-industrial wastes evaluated in this study, the highest methane production was observed in the 100% NWa treatment, reaching 438.2 ± 25.1 NL-CH4/kgCODT-removed, followed by 25% SW–75% NWb with 304.7 ± 27.8 NL-CH4/kgCODT-removed, 75% SW–25% NWb with 293.7 ± 8.3 NL-CH4/kgCODT-removed, 50% SW–50% NWb with 281.8 ± 12.4 NL-CH4/kgCODT-removed, and 100% SWc with 226.7 ± 19.7 NL-CH4/kgCODT-removed. Co-digestion treatments across all ratios increased methane production by 30% compared to SW mono-digestion, demonstrating a synergistic effect. It is important to note that while these results suggest specific methanogenic pathways, these were only inferred based on performance data, as no microbial community or metabolic pathway analyses were performed.
The mixture of SW with carbon-rich organic wastewater has shown advantages since the anaerobic digestion process has better stability and methane yields [39]. In this sense, the biogas production improvement on SW-NW could be explained by the specific composition of the added wastewater. As previously reported, NW have diverse physicochemical characteristics, depending on the type of corn and source, which confer a diverse fractional composition, such as 38–56% carbohydrates, 23–26% fiber, 5–7% protein, and 0.4–2% lipids [40]. Readily biodegradability has also been reported, given its BOD5/COD ratio of 0.4, which is commonly used as a biodegradability indicator in wastewater characterization [41,42]. On the other hand, SW exhibits a relatively low total solids (TS) content, rarely exceeding 12%. Of which, approximately 70–75% corresponds of volatile solids (VS) that are the organic components. Within the organic fraction, proteins constitute the dominant component, accounting for approximately 61.6% of VS, followed by carbohydrates (20.3%) and lipids (18.1%) [43].
Meza et al. [19] reported a methane yield of 75 NL-CH4/kgCODremoved when nejayote was used as an alkaline hydrolysis agent for cattle and poultry manure. In another related study, Burboa et al. [18] achieved 151.3 NL-CH4/kgCODremoved, where they incorporated Fe-impregnated activated carbon to improve electron transfer. On the other hand, Valero et al. [44] reported a production of 382.6 NL-CH4/kgCODremoved. Compared to these studies, which used nejayote water to produce CH4, the production of CH4 in the present study was 1.13 to 5.8 times higher. This may be an effect of raw water dilution, reducing the concentration of possible inhibitors of the microbial consortia responsible for methane production [45].
Compared with other similar co-digestion systems involving swine wastewater, the results obtained in this study are consistent with previously reported improvements in methane production. For instance, co-digestion of swine manure with corn straw has shown a maximum methane yield of 220 mL CH4/g VS and process stability due to improved C/N balance and buffering capacity [46]. Furthermore, co-digestion of organic residues with swine wastewater enhances methane yield, such as food waste (80%) and grass (40%), demonstrating synergistic effects compared to mono-digestion, mainly due to enhanced biodegradability and substrate complementarity [47]. In these systems, the incorporation of carbon-rich substrates contributes to balancing nutrient availability and stabilizing the anaerobic digestion process. These findings support the results of the present study, where the incorporation of nejayote provided a readily available carbon source that enhanced methane production and promoted a stable synergistic interaction.
The mechanism by which nejayote enhances methane production can be explained by complementary factors. NW is a carbon-rich substrate containing readily biodegradable carbohydrates such as soluble sugars and starch-derived compounds [40], which accelerate the hydrolysis and acidogenesis stages of anaerobic digestion. Furthermore, the alkaline nature of NW contributes to the buffering capacity, stabilizing pH and preventing acidification [36]. Despite these advantages, some drawbacks associated with the use of nejayote should be considered. The high alkalinity and pH of NW may require adjustment prior to digestion to avoid inhibition of acidogenic microorganisms during the initial stages. Additionally, the presence of recalcitrant compounds such as phenolic substances and lignocellulosic residues may limit complete biodegradation [13]. Furthermore, the variability in nejayote composition, depending on maize type and processing conditions, may affect process reproducibility and scalability [12].
Another important aspect is the methane production profile. This pattern exhibits diauxic behavior, which can occur when two carbon sources are used during anaerobic digestion, showing a higher consumption rate by the substrate that is easier to degrade [48,49]. In order to gain better insight into the diauxic production rate of methane, the daily methane yield was determined. As shown in Figure 3, the kinetic profile exhibits the presence of peaks within the first 24 h, which typically indicates an initial rapid phase followed by a subsequent slower phase. It is also important to note that the 100% NW assay displayed two separate peaks occurring at 3 h and ~24 h, respectively. Furthermore, the magnitude of the second peak (at ~24 h) exhibited a tendency to disappear as the proportion of NW in the wastewater mixture decreased. The maximum methane yield was reached within the first 3 h under all tested conditions. For NW, the maximum yield was approximately 2.8 times higher than that observed for SW.
Some studies have demonstrated a diauxic profile during the degradation of NW. For example, Meza et al. [19] reported methane production in batch kinetics with a diauxic behavior on day 4, as well as the co-digestion with cattle and poultry manure, where a five-fold increase in methane production was shown compared to NW alone. Burboa et al. [18] reported methane production in batch kinetics using NW, where a diauxic pattern is clearly visible on day one. The diauxic profile of methane production could be associated with the fractional composition of the substrates (NW and SW). These fractions degrade at different rates: carbohydrates are consumed first, followed by proteins, and finally lipids [50,51].

3.1.3. Principal Component Analysis (PCA)

PCA revealed clear relationships between physicochemical variables in the anaerobic digestion process (see Figure 4). The first principal component (PC1) accounted for most of the variables; for COD, NH4+-N, and alkalinity, these are the initial and final variables, whereas pH is only the final variable. This result indicates that these parameters are strongly correlated and associated with organic loading and nitrogen accumulation during digestion. The clustering and similar orientation of these vectors indicate that higher initial organic loads tend to be accompanied by increased ammonium production and higher alkalinity levels, likely resulting from the mineralization of organic nitrogen and buffering reactions that occur during anaerobic digestion.
On the other hand, methane production follows a different pattern, showing a strong loading on PC1 but a negative contribution to PC2, suggesting that methane generation is in part independent of variables related to nitrogen and alkalinity. This pattern suggests that methane production is primarily driven by the efficient conversion of organic matter rather than by the accumulation of ammonium or alkalinity. On the other hand, the initial pH (pHᵢ) has a strong positive association with PC2, which distinguishes it from the other variables and indicates that pH mainly influences a secondary dimension of the system’s variability. Overall, the PCA indicates that the digestion process is primarily controlled by the transformation of organic matter and the release of nitrogen.

3.2. Kinetic Study of SW-NW Co-Digestion

The cumulative methane yields were simulated using the first-order, monomolecular, logistic, modified Gompertz, and multi-phase Gompertz (two and three-phase) models (see Figure 5). All models demonstrate strong agreement with the experimental data throughout the study period, as indicated by coefficients determined (R2 > 0.9) for the cumulative methane curves (see Table 3). However, the most notable differences in the model fit occurred during the first 2 days (48 h), with the two- and three-phase Gompertz models exhibiting the closest alignment with the experimental results. These models account for the number of peaks or velocity changes observed in the daily methane production rate (see Figure 3). The velocity changes are used to model the methane production process because they may be associated with differences in the degradation rates of substrate fractions [30].
The coefficient of determination for the multi-phase Gompertz models exceeded 0.99. Both models exhibited similar maximum RMSE values (5.66–5.48) and minimum values near zero, indicating reliable average deviation between experimental data and model predictions. The two-phase model had a lower AIC range (20.98–22.33) than the three-phase model, with a percentage difference of 58.87–63.51%. These results indicate that the two-phase model provides satisfactory modeling performance with fewer independent variables, avoiding overfitting [52,53]. Another important aspect is the presence of two peaks in the daily methane production rate (see Figure 3): one is strongly marked from day 0 to day 2, while the other shows a lower profile from day 2 to the end of the experiment. Consequently, the two-phase model was selected for further analysis of the kinetics of SW-NW co-digestion.
As previously described, the cumulative methane yield from mono- and co-digestion showed changes in methane production rate, with a fast (RMP1) and a slow (RMP2) phase. The two-phase Gompertz model consistently shows a rapid phase in methane production rate in all experiments. During this phase, the maximum methane production rate (RMP1) of SW increased by ~67% when mixed with NW, demonstrating a synergistic effect.
In the case of the slow phase, the RMP2 showed an average value of 27.9 ± 3.03 NL-CH4/kgCODT-removed for all experimental assays. It is important to mention that the sum of the maximum methane potentials of the fast and slow phases (MPmax1 and MPmax2) is in acceptable agreement with the total methane production across all experimental tests, with an average error of 10.8 ± 3.4%.
Another kinetic parameter that showed interesting behavior was the lag phase duration (see Table 3). For the monodigestion treatment of SW and NW, the durations were 0.0024 and 0.0041 d, respectively, while the lag phase duration was zero in all co-digestion treatments. These profiles are consistent with the observation that the cumulative methane yield shows no lag phase across all experiments (see Figure 2). The lag-phase values close to zero may be associated with the high biodegradability of the substrates, since methane production begins immediately after inoculation and no lag phase is observed in the cumulative methane yield curves [54].
It is noteworthy that the cumulative methane yields (MPmax1 and MPmax2) determined by modeling are consistent with the experimental results obtained in both methane production phases, indicating the robustness of the multi-phase model (see Table 4). The rapid phase corresponds to methane accumulation during days 1 to 1.75, which coincides with the end of the peak observed in the daily methane production rate (see Figure 3). This phase showed an average error between the experimental and simulated data ranging from 1.6% to 6.1%, while the slow production phase showed an error range of 3.1% to 6.8%. Regarding the maximum methane production yield, the percentage error ranged from 1.1% to 3.5%, confirming a very acceptable level of model certainty.
On the other hand, the modified Gompertz and logistic models did not adequately fit the experimental data, with R2 and RMSE values ranging from 0.9 to 0.98 and 8 to 32, respectively. The monomolecular model was excluded because the lag phase was zero, making it indistinguishable from the first-order model. The first-order model provided a good fit to the experimental data for mono-digestion of SW, with R2 > 0.99 (see Table 4). The apparent rate constant for methane production (k) and the MPmax were 0.1399 d−1 and 311.44 NL-CH4/kgCODT-removed, respectively. The k value is consistent with those reported in the literature (0.1–0.3 d−1) for anaerobic degradation of swine wastewater at different pig growth stages [55]. However, the model did not achieve acceptable agreement for mono-digestion of NW or for SW-NW mixtures.

3.3. Co-Digestion Performance Index (CPI)

CPI is a practical diagnostic tool for evaluating co-digestion interactions. Higher CPI values are associated with improved nutrient complementarity and inhibitor dilution. However, excessive organic or nitrogen loading can reduce the observed synergistic effects [41].
CPI was determined for the analysis of the wastewater mixtures (SW-NW), as shown in Table 5. For all mixtures, the CPI value is greater than 1 (1.12–1.26), indicating a moderate synergistic effect. The present synergy indicates that the co-digestion process generated slightly more methane than the theoretical additive yield from the individual mono-digestion of each substrate.
Likewise, Tian et al. [48] examined the co-digestion of pig manure and rice straw, reporting CPI values ranging from 1.44 to 1.80 at optimal mixing ratios. The synergistic effect in the system proved to be stable and well-buffered, effectively preventing inhibition from ammonia nitrogen and acidification during co-digestion. Various synergistic effects in anaerobic co-digestion processes, including improved stability, mitigation of inhibitory compounds (such as ammonia), and enhanced methane production due to balanced nutrient supply, have been widely reported in the literature [42]. These findings are consistent with the mechanisms identified in the present work, where the alkalinity and pH contributed by NW provided buffering capacity against the high nitrogen concentration supplied by SW.
Similar synergistic performance has been reported in other AD systems. Some studies, such as that by Yu et al. [56], evaluated the co-digestion of chicken manure and corn stover and reported CPI values ranging from 1.08 to 1.39, which depend on the substrate ratio and organic loading rate conditions. Xue et al. [57] evaluated a ternary AD system under thermophilic conditions and reported CPI values ranging from 1.05 to 1.25 and additionally determined that the synergy degree depends on the operational conditions, such as temperature, substrate biodegradability, and reactor configuration. Furthermore, Cayenne et al. [58] evaluated the co-digestion of Salicornia ramosissima and swine manure and demonstrated a synergy effect (CPI ≈ 1.1), which suggests that supplementing a minimal carbon quantity can improve methane production under nutrient-rich conditions.
The CPImodel value was calculated using the MPmax-t (NL-CH4/kgCODT-removed) value determined by the two-phase Gompertz model. The experimental CPI (1.12–1.26) and CPImodeled (1.17–1.27) values showed an acceptable correlation, indicating that the CPI obtained from the model is reliable and consistent with the experimental synergy observed during co-digestion of SW-NW. This suggests that the kinetic model can adequately represent both methane production and system synergy at different mixing ratios. The present agreement is supported by the statistical performance of the model and is consistent with recent studies highlighting the usefulness of synergy indices such as CPI in combination with well-fitted kinetic models for interpreting BMP data in anaerobic co-digestion systems [59].
The small discrepancies observed between experimental CPI and CPImodel in mixtures with higher proportions of nejayote did not affect the overall interpretation. These minor deviations may be attributed to non-linear processes associated with the degradation of complex substrates, which are not always fully represented in global kinetic models, even when excellent statistical fits are obtained. Recent studies emphasize that experimental variability inherent to BMP assays should be considered when interpreting co-digestion synergy, and recommend combining experimental indices with kinetic modeling approaches to achieve a more robust evaluation of anaerobic co-digestion performance [59,60].

4. Conclusions

The present study demonstrated that co-digestion of SW-NW is an effective strategy for producing methane under mesophilic conditions. All mixtures achieved an increase in methane yield of approximately 30% compared to SW mono-digestion. All systems reached organic matter removal efficiencies of 45–52%, maintaining stable pH due to enhanced alkalinity and buffering capacity. These substrates showed a synergistic behavior, optimizing the use of local residues that are often overlooked. Nejayote had a high natural methane potential, and its addition improved the process across all mixing ratios by enhancing nutrient balance and mitigating ammonia-related inhibition. Methane production showed a multi-phase kinetic pattern with fast and slow conversion rates of the substrates. This process dynamic was described by the two-phase Gompertz model. To the best of our knowledge, this is the first study to model methane production with NW, providing new insights into its biodegradability and synergistic behavior when combined with SW. However, a key limitation remains the lack of data regarding the degradation rates of specific organic fractions, such as proteins, carbohydrates, and lipids. Understanding the degradation dynamics of these macronutrients would allow the development of more robust mathematical models in future studies to provide a comprehensive understanding of kinetic dynamics in complex agro-industrial wastewater treatment systems.

Author Contributions

P.A.G.-T.: Writing—review & editing, Writing—original draft. E.C.-P.: Methodology, Investigation. J.F.M.-E.: Formal analysis, Data curation. E.R.M.-E.: Writing—review & editing, Conceptualization. L.H.Á.: Writing—review & editing, Conceptualization. R.P.-J.: Writing—review & editing, Writing—original draft, Visualization, Supervision, Investigation, Formal analysis, Conceptualization. D.S.-P.: Writing—review & editing, Writing—original draft, Visualization, Supervision, Methodology, Funding acquisition, Formal analysis, Conceptualization. All authors have read and agreed to the published version of the manuscript.

Funding

This research was funded by the Programa de Fomento y Apoyo a Proyectos de Investigación (PROFAPI-ITSON_2026).

Data Availability Statement

The original contributions presented in this study are included in the article. Further inquiries can be directed to the corresponding authors.

Conflicts of Interest

The authors declare no conflict of interest.

Abbreviations

The following abbreviations are used in this manuscript:
ADAnaerobic Digestion
BMPBiochemical Methane Potential
CPICo-digestion Performance Index
SWSwine Wastewater
NWNejayote Wastewater
CODChemical Oxygen Demand
BOD5Biochemical Oxygen Demand (5 days)
TSTotal Solids
VSVolatile Solids
TSSTotal Suspended Solids
VSSVolatile Suspended Solids
SVISludge Volume Index
NH4+-NAmmonium Nitrogen
TANTotal Ammonia Nitrogen
CH4Methane
CO2Carbon Dioxide
PCAPrincipal Component Analysis
PC1/PC2Principal Components
RMSERoot Mean Square Error
AICAkaike Information Criterion
R2Coefficient of Determination
MPMethane Production
MPmaxMaximum Methane Potential
RMPMaximum Methane Production Rate
kKinetic Constant
γ (gamma)Lag Phase Time
tTime

References

  1. Yu, Q.; Liu, R.H.; Li, K.; Ma, R.J. A review of crop straw pretreatment methods for biogas production by anaerobic digestion in China. Renew. Sustain. Energy Rev. 2019, 107, 51–58. [Google Scholar] [CrossRef]
  2. Kesharwani, N.; Bajpai, S. Anaerobic Digestion of Wastewater and Resource Recovery. In Biological and Hybrid Wastewater Treatment Technology; Springer: Cham, Switzerland, 2024; pp. 257–266. [Google Scholar] [CrossRef]
  3. Karki, R.; Chuenchart, W.; Surendra, K.C.; Shrestha, S.; Raskin, L.; Sung, S.; Khanal, S.K. Anaerobic co-digestion: Current status and perspectives. Bioresour. Technol. 2021, 337, 125427. [Google Scholar] [CrossRef]
  4. Hernández, D.; Pinilla, F.; Rebolledo-Leiva, R.; Aburto-Hole, J.; Díaz, J.; Quijano, G.; Gonzalez Garcia, S.; Tenreiro, C. Anaerobic Co-Digestion of Agro-Industrial Waste Mixtures for Biogas Production: An Energetically Sustainable Solution. Sustainability 2024, 16, 2565. [Google Scholar] [CrossRef]
  5. Lohani, S.P.; Acharya, R.; Shrestha, P.; Shrestha, S.; Manisha, K.C.; Pradhan, P. Sustainable biogas production potential in Nepal using waste biomass: A spatial analysis. Sustain. Dev. 2024, 32, 4770–4781. [Google Scholar] [CrossRef]
  6. Wang, Y.; Li, G.; Chi, M.; Sun, Y.; Zhang, J.; Jiang, S.; Cui, Z. Effects of co-digestion of cucumber residues to corn stover and pig manure ratio on methane production in solid state anaerobic digestion. Bioresour. Technol. 2018, 250, 328–336. [Google Scholar] [CrossRef]
  7. Xie, T.; Xie, S.; Sivakumar, M.; Nghiem, L.D. Relationship between the synergistic/antagonistic effect of anaerobic co-digestion and organic loading. Int. Biodeterior. Biodegrad. 2017, 124, 155–161. [Google Scholar] [CrossRef]
  8. Zhou, L.; Wang, X.; Li, Y.; Zhang, Y.; Liu, H.; Chen, Z. Recent advances in swine wastewater treatment and resource recovery. Sci. Total Environ. 2024, 906, 171557. [Google Scholar] [CrossRef] [PubMed]
  9. Pena, L.; Oliveira, M.; Fragoso, R.; Duarte, E. Potential of duckweed for swine wastewater nutrient removal and biomass valorisation through anaerobic co-digestion. J. Sustain. Dev. Energy Water Environ. Syst. 2017, 5, 127–138. [Google Scholar] [CrossRef]
  10. Saucedo Terán, R.A.; De la Mora Orozco, C.; González Acuña, I.J.; Gómez Rosales, S.; Domínguez Araujo, G.; Rubio Arias, H.O. Removing Organic Matter and Nutrients from Swine Wastewater after Anaerobic–Aerobic Treatment. Water 2017, 9, 726. [Google Scholar] [CrossRef]
  11. Palacios-Pola, G.; Perales, H.; Estrada Lugo, E.I.; Figueroa-Cárdenas, J.D.D. Nixtamal techniques for different maize races prepared as tortillas and tostadas by women of Chiapas, Mexico. J. Ethn. Foods 2022, 9, 2. [Google Scholar] [CrossRef]
  12. Valenzuela, E.I.; Cervantes-Avilés, P.; Ortega-Lara, W.; Franco-Morgado, M.; Gutiérrez-Uribe, J.A. Comprehensive characterization of maize lime-cooking wastewater with a prospective approach for Ca-P minerals recovery: Implications for waste valorization. Sep. Purif. Technol. 2025, 353, 128450. [Google Scholar] [CrossRef]
  13. Contreras-Jácquez, V.; Virgo-Cruz, J.M.; García-Fajardo, J.; Obregón-Solís, E.; Mateos-Díaz, J.C.; Asaff-Torres, A. Pilot-scale nanofiltration vibratory shear enhanced processing (NF-VSEP) for the improvement of the separation and concentration of compounds of biotechnological interest from tortilla industry wastewater (nejayote). Sep. Purif. Technol. 2022, 300, 121921. [Google Scholar] [CrossRef]
  14. Roman-Escobedo, L.C.; Cristiani-Urbina, E.; Morales-Barrera, L. Bioremediation with an Alkali-Tolerant Yeast of Wastewater (Nejayote) Derived from the Nixtamalization of Maize. Fermentation 2024, 10, 219. [Google Scholar] [CrossRef]
  15. Del Angel-Acosta, Y.A.; Alvarez, L.H.; Garcia-Reyes, R.B.; Carrillo-Reyes, J.; Garcia-Gonzalez, A.; Meza-Escalante, E.R. Co-digestion of corn (nejayote) and brewery wastewater at different ratios and pH conditions for biohydrogen production. Int. J. Hydrogen Energy 2021, 46, 27422–27430. [Google Scholar] [CrossRef]
  16. Campos-Flores, R.C.; Reyna-Gómez, L.M.; Suárez-Vázquez, S.I.; Robledo-Olivo, A.; Cruz-López, A. Effect of inoculum pretreatment and operational mode of reactor on BioH2 production from nixtamalization (nejayote) and abattoir wastewater. Waste Biomass Valorization 2024, 15, 2145–2158. [Google Scholar] [CrossRef]
  17. España-Gamboa, E.; Domínguez-Maldonado, J.A.; Tapia-Tussell, R.; Chale-Canul, J.S.; Alzate-Gaviria, L. Corn industrial wastewater (nejayote): A promising substrate in Mexico for methane production in a coupled system (APCR-UASB). Environ. Sci. Pollut. Res. 2018, 25, 712–722. [Google Scholar] [CrossRef]
  18. Burboa-Charis, V.A.; Escalante-Torres, M.S.; Armenta-Gutiérrez, M.A.; Tenorio-Díaz, L.M.; Leyva-Soto, L.A.; Meza, A.R.; Álvarez-Valencia, L.H. Use of activated carbon impregnated with Fe to enhance methane production of wastewater from nixtamalization process. Enfoque UTE 2025, 16, 37–43. [Google Scholar] [CrossRef]
  19. Meza, A.R.; Armenta, M.A.; Charis, V.B.; Serrano-Palacios, D.; Rivas, P.; Alvarez, L.H. Alkaline hydrolysis of cattle and poultry manures with nejayote (corn-industry wastewater) for methane production by anaerobic co-digestion. Total Environ. Eng. 2025, 4, 100038. [Google Scholar] [CrossRef]
  20. Marczewski, P.; Sytek-Szmeichel, K.; Zubrowska-Sudol, M. Assessment of Potential of Organic Waste Methane for Implementation in Energy Self-Sufficient Wastewater Treatment Facilities. Energies 2025, 18, 5534. [Google Scholar] [CrossRef]
  21. Emebu, S.; Pecha, J.; Janáčová, D. Review on anaerobic digestion models: Model classification & elaboration of process phenomena. Renew. Sustain. Energy Rev. 2022, 160, 112288. [Google Scholar] [CrossRef]
  22. Budiyono, B.; Syaichurrozi, I.; Sumardiono, S. Biogas production kinetic from vinasse waste in batch mode anaerobic digestion. Malays. J. Sci. 2013, 32, 2–14. [Google Scholar] [CrossRef]
  23. American Public Health Association (APHA). Standard Methods for the Examination of Water and Wastewater; American Public Health Association: Washington, DC, USA, 2015. [Google Scholar]
  24. Anderson, G.K.; Yang, G. Determination of bicarbonate and total volatile acid concentration in anaerobic digesters using a simple titration. Water Environ. Res. 1992, 64, 53–59. [Google Scholar] [CrossRef]
  25. Almeida, P.V.; Rodrigues, R.P.; Teixeira, L.M.; Santos, A.F.; Martins, R.C.; Quina, M.J. Bioenergy production through mono and co-digestion of tomato residues. Energies 2021, 14, 5563. [Google Scholar] [CrossRef]
  26. Brulé, M.; Oechsner, H.; Jungbluth, T. Exponential model describing methane production kinetics in batch anaerobic digestion: A tool for evaluation of biochemical methane potential assays. Bioprocess Biosyst. Eng. 2014, 37, 1759–1770. [Google Scholar] [CrossRef] [PubMed]
  27. da Silva, N.F.; Schoeler, G.P.; Lourenco, V.A.; de Souza, P.L.; Caballero, C.B.; Salamoni, R.H.; Romani, R.F. First order models to estimate methane generation in landfill: A case study in south Brazil. J. Environ. Chem. Eng. 2020, 8, 104053. [Google Scholar] [CrossRef]
  28. Sun, C.; Cao, W.; Liu, R. Kinetics of Methane Production from Swine Manure and Buffalo Manure. Appl. Biochem. Biotechnol. 2015, 177, 985–995. [Google Scholar] [CrossRef]
  29. Yahya, M.; Herrmann, C.; Ismaili, S.; Jost, C.; Truppel, I.; Ghorbal, A. Kinetic studies for hydrogen and methane co-production from food wastes using multiple models. Biomass Bioenergy 2022, 161, 106449. [Google Scholar] [CrossRef]
  30. Niu, Y.; Jiang, Y.; Yang, L.; Hu, Y.; Cui, J.; Xu, F. Unraveling the impacts of high solids content on hydrolysis and methane production of complex substrates through experimental and modeling approaches. Chem. Eng. J. 2025, 508, 160908. [Google Scholar] [CrossRef]
  31. Mohammadianroshanfekr, M.; Pazoki, M.; Pejman, M.B.; Ghasemzadeh, R.; Pazoki, A. Kinetic modeling and optimization of biogas production from food waste and cow manure co-digestion. Results Eng. 2024, 24, 103477. [Google Scholar] [CrossRef]
  32. Lebon, E.; Caillet, H.; Akinlabi, E.; Madyira, D.; Adelard, L. Kinetic study of anaerobic co-digestion, analysis and modelling. Procedia Manuf. 2019, 35, 321–326. [Google Scholar] [CrossRef]
  33. Leite, V.D.; Ramos, R.O.; Lopes, W.S.; de Araújo, M.C.U.; de Almeida, V.E.; da Silva Oliveira, N.M.; Viriato, C.L. Kinetic Modeling of Anaerobic Co-Digestion of Plant Solid Waste with Sewage Sludge: Synergistic Influences of Total Solids and Substrate Particle Size in Biogas Generation. Bioenerg. Res. 2024, 17, 744–755. [Google Scholar] [CrossRef]
  34. Llanos-Lizcano, R.; Senila, L.; Modoi, O.C. Evaluation of Biochemical Methane Potential and Kinetics of Organic Waste Streams for Enhanced Biogas Production. Agronomy 2024, 14, 2546. [Google Scholar] [CrossRef]
  35. Zainal, A.; Harun, R.; Idrus, S. Performance Monitoring of Anaerobic Digestion at Various Organic Loading Rates of Commercial Malaysian Food Waste. Front. Bioeng. Biotechnol. 2022, 10, 775676. [Google Scholar] [CrossRef]
  36. Aworanti, O.A.; Ajani, A.O.; Agbede, O.O.; Agarry, S.E.; Ogunkunle, O.; Laseinde, O.T.; Fattah, I.M.R. Enhancing and upgrading biogas and biomethane production in anaerobic digestion: A comprehensive review. Front. Energy Res. 2023, 11, 1170133. [Google Scholar] [CrossRef]
  37. Gonzalez-Tineo, P.A.; Durán-Hinojosa, U.; Delgadillo-Mirquez, L.R.; Meza-Escalante, E.R.; Gortáres-Moroyoqui, P.; Ulloa-Mercado, R.G.; Serrano-Palacios, D. Performance improvement of an integrated anaerobic-aerobic hybrid reactor for the treatment of swine wastewater. J. Water Process Eng. 2020, 34, 101164. [Google Scholar] [CrossRef]
  38. Nayeri, D.; Mohammadi, P.; Bashardoust, P.; Eshtiaghi, N. A comprehensive review on the recent development of anaerobic sludge digestions: Performance, mechanism, operational factors, and future challenges. Results Eng. 2024, 22, 102292. [Google Scholar] [CrossRef]
  39. Lourinho, G.; Rodrigues, L.F.T.G.; Brito, P.S.D. Recent advances on anaerobic digestion of swine wastewater. Int. J. Environ. Sci. Technol. 2020, 17, 4917–4938. [Google Scholar] [CrossRef]
  40. Díaz-Montes, E.; Castro-Muñoz, R. Analyzing the phenolic enriched fractions from nixtamalization wastewater (nejayote) fractionated in a three-step membrane process. Curr. Res. Food Sci. 2022, 5, 1–10. [Google Scholar] [CrossRef]
  41. Rabii, A.; El Sayed, A.; Ismail, A.; Aldin, S.; Dahman, Y.; Elbeshbishy, E. Optimizing the mixing ratios of source-separated organic waste and thickened waste activated sludge in anaerobic co-digestion: A new approach. Processes 2024, 12, 794. [Google Scholar] [CrossRef]
  42. Mata-Alvarez, J.; Dosta, J.; Romero-Güiza, M.S.; Fonoll, X.; Peces, M.; Astals, S. A critical review on anaerobic co-digestion achievements between 2010 and 2013. Renew. Sustain. Energy Rev. 2014, 36, 412–427. [Google Scholar] [CrossRef]
  43. Kim, W.; Shin, S.G.; Cho, K.; Lee, C.; Hwang, S. Performance of methanogenic reactors in temperature phased two-stage anaerobic digestion of swine wastewater. J. Biosci. Bioeng. 2012, 114, 635–639. [Google Scholar] [CrossRef]
  44. Valero, D.; Rico, C.; Canto-Canché, B.; Domínguez-Maldonado, J.A.; Tapia-Tussell, R.; Cortes-Velazquez, A.; Alzate-Gaviria, L. Enhancing biochemical methane potential and enrichment of specific electroactive communities from nixtamalization wastewater using granular activated carbon as a conductive material. Energies 2018, 11, 2101. [Google Scholar] [CrossRef]
  45. Hallaji, S.M.; Kuroshkarim, M.; Moussavi, S.P. Enhancing methane production using anaerobic co-digestion of waste activated sludge with combined fruit waste and cheese whey. BMC Biotechnol. 2019, 19, 19. [Google Scholar] [CrossRef]
  46. Mao, C.; Zhang, T.; Wang, X.; Feng, Y.; Ren, G.; Yang, G. Process performance and methane production optimizing of anaerobic co-digestion of swine manure and corn straw. Sci. Rep. 2017, 7, 9379. [Google Scholar] [CrossRef] [PubMed]
  47. Sousa, I.P.; Rosa, A.P.; Almeida, G.K.; Rocha, D.N.; Neves, T.A.; Borges, A.C. Integrated assessment of methane production from the co-digestion of swine wastewater and other organic wastes. Sustainability 2024, 16, 5938. [Google Scholar] [CrossRef]
  48. Tian, P.; Gong, B.; Bi, K.; Liu, Y.; Ma, J.; Wang, X.; Ouyang, Z.; Cui, X. Anaerobic co-digestion of pig manure and rice straw: Optimization of process parameters for enhancing biogas production and system stability. Int. J. Environ. Res. Public Health 2023, 20, 804. [Google Scholar] [CrossRef]
  49. Kim, M.J.; Kim, S.H. Minimization of diauxic growth lag-phase for high-efficiency biogas production. J. Environ. Manag. 2017, 187, 456–463. [Google Scholar] [CrossRef]
  50. Duong, T.H.; van Eekert, M.; Grolle, K.; Tran, T.V.N.; Zeeman, G.; Temmink, H. Effect of carbohydrates on protein hydrolysis in anaerobic digestion. Water Sci. Technol. 2022, 86, 66–79. [Google Scholar] [CrossRef]
  51. Li, Y.; Jin, Y.; Borrion, A.; Li, H.; Li, J. Effects of organic composition on the anaerobic biodegradability of food waste. Bioresour. Technol. 2017, 243, 836–845. [Google Scholar] [CrossRef]
  52. Portet, S. A primer on model selection using the Akaike information criterion. Infect. Dis. Model. 2020, 5, 111–128. [Google Scholar] [CrossRef]
  53. Zhang, J.; Yang, Y.; Ding, J. Information criteria for model selection. Wiley Interdiscip. Rev. Comput. Stat. 2023, 15, e1607. [Google Scholar] [CrossRef]
  54. da Silva Pereira, E.; Marostica, R.; Gotardo, J.T.; de Lucas Junior, J.; de Mendonça Costa, M.S.S. Biochemical methane potential of pumpkin energy crops co-digested with swine wastewater. Waste Manag. Bull. 2025, 3, 100259. [Google Scholar] [CrossRef]
  55. Gomes, C.S.; Repke, J.U.; Meyer, M. Diauxie during biogas production from collagen-based substrates. Renew. Energy 2019, 141, 20–27. [Google Scholar] [CrossRef]
  56. Yu, X.; Wang, Y.; Yan, L.; Wang, Y.; Lu, J.; Huang, Y.; Bi, S.; Wang, W. Synergistic Effects of Anaerobic Co-Digestion of Chicken Manure and Corn Stover in Batch and Continuous Modes. Fermentation 2023, 9, 666. [Google Scholar] [CrossRef]
  57. Xue, X.; Zhang, Y.; Li, J.; Wang, L.; Chen, H.; Liu, Q. Synthesis evaluation on thermophilic anaerobic co-digestion of tomato plant residue with cattle manure and food waste. Resour. Environ. Sustain. 2023, 13, 100119. [Google Scholar] [CrossRef]
  58. Cayenne, A.; Uellendahl, H. Anaerobic Digestion of the Halophyte Salicornia ramosissima in Co-Digestion with Swine Manure in Lab-Scale Batch and Continuous Reactor Tests. Energies 2025, 18, 3085. [Google Scholar] [CrossRef]
  59. DelaVega-Quintero, J.C.; Nuñez-Pérez, J.; Lara-Fiallos, M.; Barba, P.; Burbano-García, J.L.; Espín-Valladares, R. Advances and challenges in anaerobic digestion for biogas production: Policy, technological, and microbial perspectives. Processes 2025, 13, 3648. [Google Scholar] [CrossRef]
  60. Baquerizo-Crespo, R.J.; Gómez-Salcedo, Y.; Saquete Ferrándiz, M.D.; Castro-Molano, L.; Martí-Herrero, J. Understanding error propagation in anaerobic co-digestion synergy assessment: A review and methodological framework. Renew. Sustain. Energy Rev. 2025, 226, 116433. [Google Scholar] [CrossRef]
Figure 1. Schematic representation of the experimental design for BMP assays SW/NW mixtures.
Processes 14 01649 g001
Figure 2. Cumulative methane yield in swine wastewater (SW), nejayote wastewater (NW), and wastewater mixtures (SW-NW).
Processes 14 01649 g002
Figure 3. Modeling of daily methane yield in mono- and co-digestion treatments.
Processes 14 01649 g003
Figure 4. Principal Component Analysis (PCA) biplot showing the relationships between the analyzed variables across PC1 (86.0%) and PC2 (7.7%).
Processes 14 01649 g004
Figure 5. Modeling of cumulative methane yield of mono and co-digestion wastewater.
Processes 14 01649 g005
Table 1. Mathematical models used to fit the cumulative methane yields.
Mathematical ModelEquation
First-order MP model = MP max 1 exp k · t (3)
Monomolecular MP model =   MP max 1 exp k t ϒ (4)
Logistic MP model = MP max 1 +   exp k t ϒ (5)
Modified Gompertz MP model =   MP max · exp exp R MP · e MP max ϒ t + 1 (6)
Multi-phases
Gompertz
Two
phases
MP model = MP max 1 · exp exp R MP 1 · e MP max 1 γ 1 t + 1 +
MP max 2 · exp exp R MP 2 · e MP max 2 γ 2 t + 1
(7)
Three
phases
MP model = MP max 1 · exp exp R MP 1 · e MP max 1 γ 1 t + 1 +
MP max 2 · exp exp R MP 2 · e MP max 2 γ 2 t + 1 +
MP max 3 · exp exp R MP 3 · e MP max 3 γ 3 t + 1
(8)
Table 2. Physicochemical properties of NW and SW and their mixtures (v/v) in the assays.
Parameter100% NW75% NW–25% SW25% NW–75% SW50% NW–50% SW100% SW
Alkalinityinitial42.78 ± 1.04538.66 ± 13.04929.80 ± 22.501383.46 ± 33.481855.58 ± 44.91
Alkalinityfinal837.94 ± 20.061122.23 ± 34.581662.72 ± 1.541992.86 ± 35.952430.51 ± 143.06
pHinitial6.98 ± 0.057.01 ± 0.027.00 ± 0.027.01 ± 0.037.01 ± 0.02
pHfinal6.91 ± 0.027.05 ± 0.047.24 ± 0.067.30 ± 0.027.37 ± 0.04
CODT-initial7860 ± 404.0014,746.67 ± 133.3320,488.89 ± 673.5725,453.33 ± 461.8830,620± 2404.16
CODT-final3860 ± 428.987102.22 ± 277.5510,759.11 ± 150.8513,804.4 ± 691.4016,088.89 ± 2990
NH4+-Ninitial1.45 ± 0.02306.44 ± 5.88668.70 ± 3.00939.07 ± 4.411115.78 ± 5.52
NH4+-Nfinal356.73 ± 2.57710.76 ± 65.60837.41 ± 20.591444.16 ± 47.79929.38 ± 18.32
Table 3. Summary of kinetics parameters of cumulative methane yield curves.
ModelParameters100% NW25% SW–75% NW50% SW–50% NW75% SW–25% NW100% SW
First-orderK0.42150.29050.21710.16290.1399
MPmax414.08306.33310.60370.45311.44
R20.959640.967760.97200.984760.99097
RMSE20.446515.831314.621311.80727.0417
AIC2.75753.20193.34013.71134.6092
MonomolecularK0.421560.290540.21710.162920.1399
MPmax414.0836306.33310.6098370.44311.45
ϒ00000
R20.95960.96770.97210.98470.9909
RMSE20.446615.831414.621311.80737.0418
AIC4.75755.20195.23665.71136.6092
LogisticK0.62600.44800.40470.44810.4816
MPmax411.19307.26300.2193311.29238.55
ϒ1.78382.67173.37253.62053.6996
R20.94140.95870.97300.98440.9887
RMSE27.357815.238511.77839.99516.8447
AIC4.25165.26825.71566.00086.6585
Modified GompertzMPmax390.6281.7140275.8812307.1369244.4717
RMP118.359.836346.600844.136233.0264
ϒ00000
R20.90860.93330.95460.97930.9879
RMSE32.055723.100419.603914.67538.5075
AIC5.97636.54556.83067.33368.2807
Two-phases GompertzMPmax1255.7752136.2598101.214385.725757.3876
MPmax2210.8757182.7654187.9875221.8753179.5345
RMP1186.0029130.3894134.9782122.068177.2227
RMP228.574627.056629.654735.056528.9266
ϒ10.00410000.0022
ϒ22.02881.85591.73261.65391.5559
R20.99470.99610.99440.99780.9985
RMSE5.66874.65415.48443.92762.6093
AIC20.986121.328721.043521.623522.3339
Three-phases GompertzMPmax1236.5519214.2248206.7101124.3277147.8857
MPmax2123.414340.882055.118777.400841.1781
MPmax313.968676.222061.888016.487825.1127
RMP1184.706124.616825.6278119.379826.7280
RMP213.9686914.2860248.129716.4878138.2827
RMP313.968676.222037.413116.487825.1127
ϒ10.03221.48532.03460.01772.6940
ϒ21.27150.02940.06061.26460.1017
ϒ31.27150.18810.18001.26460.4480
R20.99520.99960.99960.99910.9999
RMSE5.48691.50261.46702.47270.3278
AIC33.042635.292535.334334.427237.9372
Table 4. Experimental and predicted accumulated methane yield.
Substrate RatioTime (d)ExperimentalModelingError
FP/SP/ETMPmax1/MPmax2/MPmax-t(%)
(NL-CH4/kgCODT-removed)
100% SW1/1–9.5/9.555.7 ± 0.1/171 ± 19.6/226.7 ± 19.757.4/179.5/222.52.9/5/1.8
75% SW–25% NW1/1–9.5/9.583.2 ± 1.9/210.5 ± 6.4/293.7 ± 8.385.7/221.8/287.83.0/5.3/2.0
50% SW–50% NW1.25/1.25–9.5/9.599.6 ± 0.7/182.2 ± 11.7/281.8 ± 12.4101.2/187.9/271.81.6/3.1/3.5
25% SW–75% NW1.5/1.5–9.5/9.5131.7 ± 5.3/173 ± 22.5/304.7 ± 27.8136.2/182.7/297.53.5/5.6/2.3
100% NW1.75/1.75–9.5/9.5240.9 ± 5.3/197.3 ± 19.8/438.2 ± 25.1255.7/210.8/433.16.1/6.8/1.1
FP: end of the fast phase. SP: period of the slow phase. ET: total experiment time. MPmax-t: Maximum methane production at the end of experimental time.
Table 5. Co-digestion performance index of the wastewater mixtures.
Substrate RatiosCPICPImodelError (%)
25% SW–75% NW1.121.110.7
50% SW–50% NW1.151.131.9
75% SW–25% NW1.261.250.8
Disclaimer/Publisher’s Note: The statements, opinions and data contained in all publications are solely those of the individual author(s) and contributor(s) and not of MDPI and/or the editor(s). MDPI and/or the editor(s) disclaim responsibility for any injury to people or property resulting from any ideas, methods, instructions or products referred to in the content.

