Article

Predictive Modeling and Optimization of Date Juice Production Using Artificial Intelligence

by
Mahmoud G. Elamshity
and
Abdullah M. Alhamdan
*
Chair of Dates Industry and Technology, Department of Agricultural Engineering, College of Food and Agricultural Sciences, King Saud University, Riyadh 11451, Saudi Arabia
*
Author to whom correspondence should be addressed.
Processes 2026, 14(10), 1634; https://doi.org/10.3390/pr14101634
Submission received: 12 March 2026 / Revised: 25 April 2026 / Accepted: 6 May 2026 / Published: 18 May 2026
(This article belongs to the Special Issue Food Processing and Ingredient Analysis)

Abstract

This study presents a data-driven framework to predict and optimize the quality of date juice (DJ) produced from two commercially important Saudi cultivars (Sukkary and Khlass) using physicochemical and processing variables as model inputs. A total of 1600 experimental runs were performed by systematically varying initial fruit moisture content, extraction temperature (20, 40, 60, and 80 °C), mixing velocity (10, 20, 30, 40, and 50% of maximum speed), and date-to-water ratios (1:1, 1.5, 2, 2.5, and 3 w/w). The produced juices were characterized at 25 °C for water activity, moisture content, density, pH, total soluble solids (°Brix), turbidity, viscosity, hydroxymethylfurfural (HMF), browning index, extraction time, electrical energy consumption, and an integrated Quality Index (Qi). A feed-forward artificial neural network (ANN; 7–15–1) with a hyperbolic tangent transfer function was developed and validated using normalized datasets, and its performance was benchmarked against multiple linear regression (MLR). The ANN consistently outperformed MLR for Qi prediction, achieving higher coefficients of determination and lower error indices across training, testing, and validation, indicating strong generalization and minimal overfitting. Sensitivity analysis highlighted total soluble solids, moisture content, and HMF as the most influential predictors of Qi. Optimal juice quality (Qi ≥ 0.91) was repeatedly achieved under moderate thermal conditions (≈60 °C), with 40% mixing velocity and a 1:2.5 date-to-water ratio, providing a practical operating window for producing juice at the target °Brix while limiting thermal quality deterioration. Overall, the proposed ANN-based model provides an actionable decision-support tool for process optimization and quality standardization, supporting the transition of date-juice manufacturing toward Industry 4.0 through data-driven monitoring and adaptive control strategies.

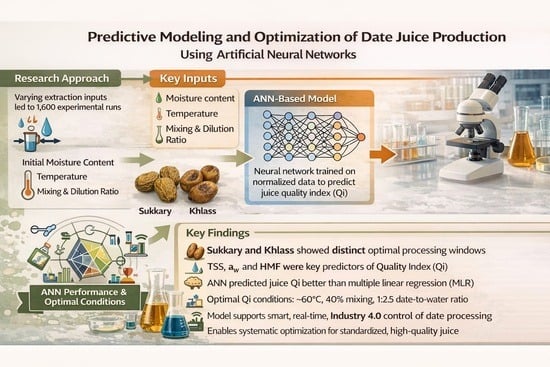
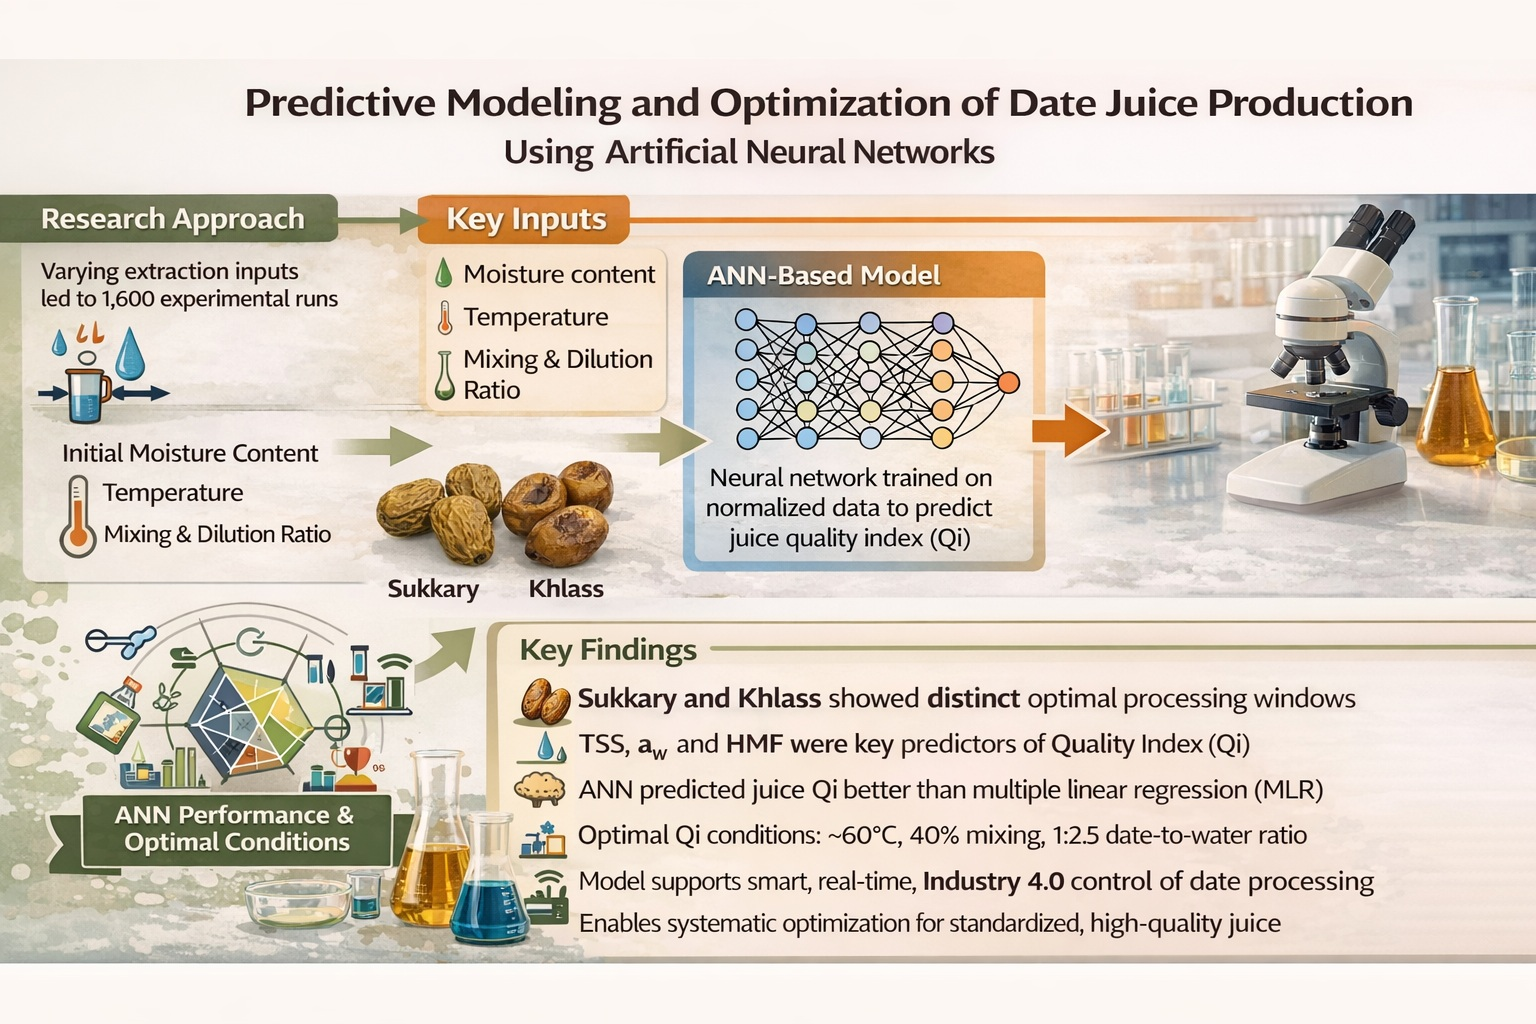
Graphical Abstract

1. Practical Applications

The findings of this study offer valuable insights and practical tools to enhance the efficiency and quality control of DJ production in both small-scale and semi-industrial continuous production settings. By leveraging artificial neural networks (ANNs), producers can accurately predict the impact of key input parameters, such as date cultivar, moisture content, extraction temperature, mixing velocity, and water-to-date ratios, on final juice quality. The developed ANN model serves as a smart decision-support system that can be used to:
  • Optimize processing conditions to consistently achieve desired °Brix levels and minimize undesirable compounds such as hydroxy methyl furfural (HMF).
  • Reduce trial-and-error in formulation and processing, thereby improving resource utilization (energy, water, and raw materials).
  • Enable adaptive process control in real time to maintain high product quality under variable input conditions.
  • Assist in designing processing lines tailored for different date cultivars or storage conditions.
  • Support the development of standard operating procedures (SOPs) for consistent juice quality across seasons and batches.
Ultimately, this modeling approach facilitates the transition toward data-driven, intelligent food processing systems that enhance product quality, reduce waste, and support sustainable production practices in the date industry.

2. Introduction

Dates (Phoenix dactylifera L.), the fruit of the date palm, are a vital agricultural commodity in many arid and semi-arid regions due to their high nutritional value, socio-economic significance, and cultural relevance. Global production of dates is heavily concentrated in the Middle East and North Africa, with leading producers including Egypt (2.15 million tons), Saudi Arabia (1.92 million tons), and Algeria (1.33 million tons) [1]. Despite this substantial production, value-added utilization of dates remains underexploited in many regions, especially within Saudi Arabia, where a large proportion of harvested dates are still processed into vacuum-packed whole fruits with limited diversification [2].
Beyond whole-fruit consumption, dates have significant potential for processing into derivatives such as juice, syrup, paste, powder, and fermented beverages. These products not only diversify market opportunities but also serve as functional food ingredients. For instance, date syrup is widely used as a natural sweetener and alternative to refined sugars in bakery and dairy products, while date paste finds applications in energy bars, confections, and baked goods due to its palatable texture and natural sweetness [2,3]. Similarly, date powder and fermented products like date vinegar contribute to functional food innovation [4,5].
Among these, date juice has gained attention in recent years for its appealing taste, natural sugar content, and potential health benefits. Juice derived from dates is rich in glucose, fructose, essential minerals, and antioxidant compounds, making it a valuable beverage both nutritionally and commercially [6,7]. In particular, cultivars such as Sukkary and Khlass are prized for juice extraction due to their distinct sensory and compositional profiles. Sukkary dates, characterized by high sugar and low fiber, offer enhanced sweetness and softness, while Khlass dates, with a firmer texture and balanced sugar-acid profile, contribute to better juice stability and flavor complexity [8,9].
The extraction of juice from dates is influenced by a range of processing variables, including initial fruit moisture content, water temperature, mixing velocity, and date-to-water weight ratios. These parameters collectively determine the physical and chemical characteristics of the final juice product. For example, higher water temperatures (40–80 °C) have been shown to improve sugar solubility and extraction yield, although excessively high temperatures can degrade heat-sensitive bioactive such as vitamins and polyphenols [10,11].
Mixing velocity directly influences the mechanical disintegration of date flesh and the release of soluble solids. Optimized mixing ensures uniform maceration without over-shearing, which could negatively affect texture and clarity [12,13]. Moreover, the date-to-water ratio affects juice viscosity and °Brix. A balanced ratio helps maximize extraction efficiency while maintaining desirable sweetness and consistency [14,15].
Key juice quality indicators include water activity, density, pH, turbidity, T.S.S. (°Brix), viscosity, HMF, and color indices such as a brown index. Among these, HMF is especially important as a marker of excessive thermal processing and potential product degradation [16].
The complexity and nonlinearity of juice extraction processes necessitate advanced modeling tools capable of handling multivariate interactions. Artificial Neural Networks (ANNs) have gained traction as a powerful computational approach in food engineering. ANNs can model complex, nonlinear relationships between multiple inputs and outputs without the need for explicit mathematical equations [17]. They excel in applications involving noisy, experimental data, outperforming traditional regression-based methods in both predictive accuracy and generalizability [18,19].
The structure of an Artificial Neural Network (ANN), an advanced mathematical framework, is notably analogous to that of the human brain. Its layered architecture and densely interconnected processing nodes reflect the organization of biological neurons [20]. ANNs learn from data through training, just as humans learn by example. Once trained for a specific task, such as pattern recognition or classification, the ANN can identify complex patterns and make predictions. These models are particularly robust in handling noisy, incomplete, or nonlinear data, which makes them well-suited for solving challenging problems in fields like agriculture [21,22].
Although the theoretical foundation of neural network analysis was introduced nearly 50 years ago, practical implementation through software applications has only become widespread over the past two decades [20]. Recently, ANNs have gained considerable attention in agricultural research as reliable tools for forecasting and modeling. Their applications include predicting the viscosity of clarified fruit juices such as orange, peach, and pear [23]; determining peroxide values and acidity levels in olive oil [24]. Evaluating the antioxidant activity of black and green teas [25]; analyzing fatty acid composition in edible oils [26]. Assessing fruit quality parameters in loquat [27] and peach [28].
Several studies have demonstrated the successful application of ANNs in modeling and optimizing food processing operations, including juice extraction, fermentation, drying, and enzymatic treatments [29,30,31]. These models enable the simulation of complex parameter interactions and optimization of processing conditions to achieve desired product quality.
The Multiple Linear Regression (MLR) model is a statistical technique for estimating a dependent variable from its relationship with multiple independent variables. It formulates a regression equation that enables both interpretation and prediction of the target outcome based on several predictors. While MLR provides a more robust approach than single-variable models, it is limited in its ability to capture nonlinear or highly complex relationships [32]. Despite this, MLR remains widely adopted for its simplicity and interpretability. In recent years, MLR has shown considerable utility in agricultural applications, particularly in modeling crop yield and evaluating fruit quality parameters [33,34]. Notable examples include its use in predicting peach firmness [35]. Determining avocado fruit maturity levels [36].
Despite the increasing attention on DJ as a functional and natural beverage, there remains a noticeable gap in the application of ANN-based modeling to predict and optimize juice quality under diverse processing conditions [29,37,38,39,40,41]. Most existing models rely on linear regression, which often fails to capture the nonlinear and interactive effects of variables such as fruit moisture content, extraction temperature, mixing velocity, and water-to-fruit ratio on juice yield and quality. Additionally, few studies have undertaken a direct performance comparison between ANN models and conventional multiple linear regression (MLR) techniques within this context [42,43,44,45]. This research seeks to bridge this gap by developing and validating an ANN model trained on experimental data obtained from two commercially important date cultivars, Sukkary and Khlass, processed under a range of controlled operating parameters. The goal is to provide an accurate, data-driven tool for predicting key physicochemical properties of DJ and for identifying optimal extraction conditions that ensure high-quality juice production.
Although artificial neural networks (ANNs) have been widely applied in food systems, the novelty of this work lies in (i) generating a large, fully controlled semi-industrial dataset spanning cultivar and operating-window variability, (ii) benchmarking the ANN against a conventional baseline (multiple linear regression, MLR) under identical inputs and objective performance criteria, and (iii) translating the optimal network into an explicit, deployable analytical form (weights/biases and a de-normalization equation) that can be implemented in spreadsheet or programming environments.
Accordingly, the specific objectives of this study were to: (i) develop an artificial neural network (ANN) model capable of accurately predicting the physicochemical and overall quality attributes of date juice (DJ) as a function of key processing parameters; (ii) benchmark the predictive performance of the ANN against conventional multiple linear regression (MLR) models; and (iii) optimize the juice-extraction conditions for the Sukkary and Khlass cultivars to achieve a target soluble-solids content of 23 °Brix while maintaining favorable quality characteristics. Collectively, these objectives support an industry-oriented framework for process standardization, real-time quality prediction, and operational decision-making, thereby enabling scalable implementation in commercial plants and advancing date-juice processing toward Industry 4.0 (smart manufacturing) through data-driven and adaptive production control.

3. Materials and Methods

3.1. Materials

3.1.1. Dates

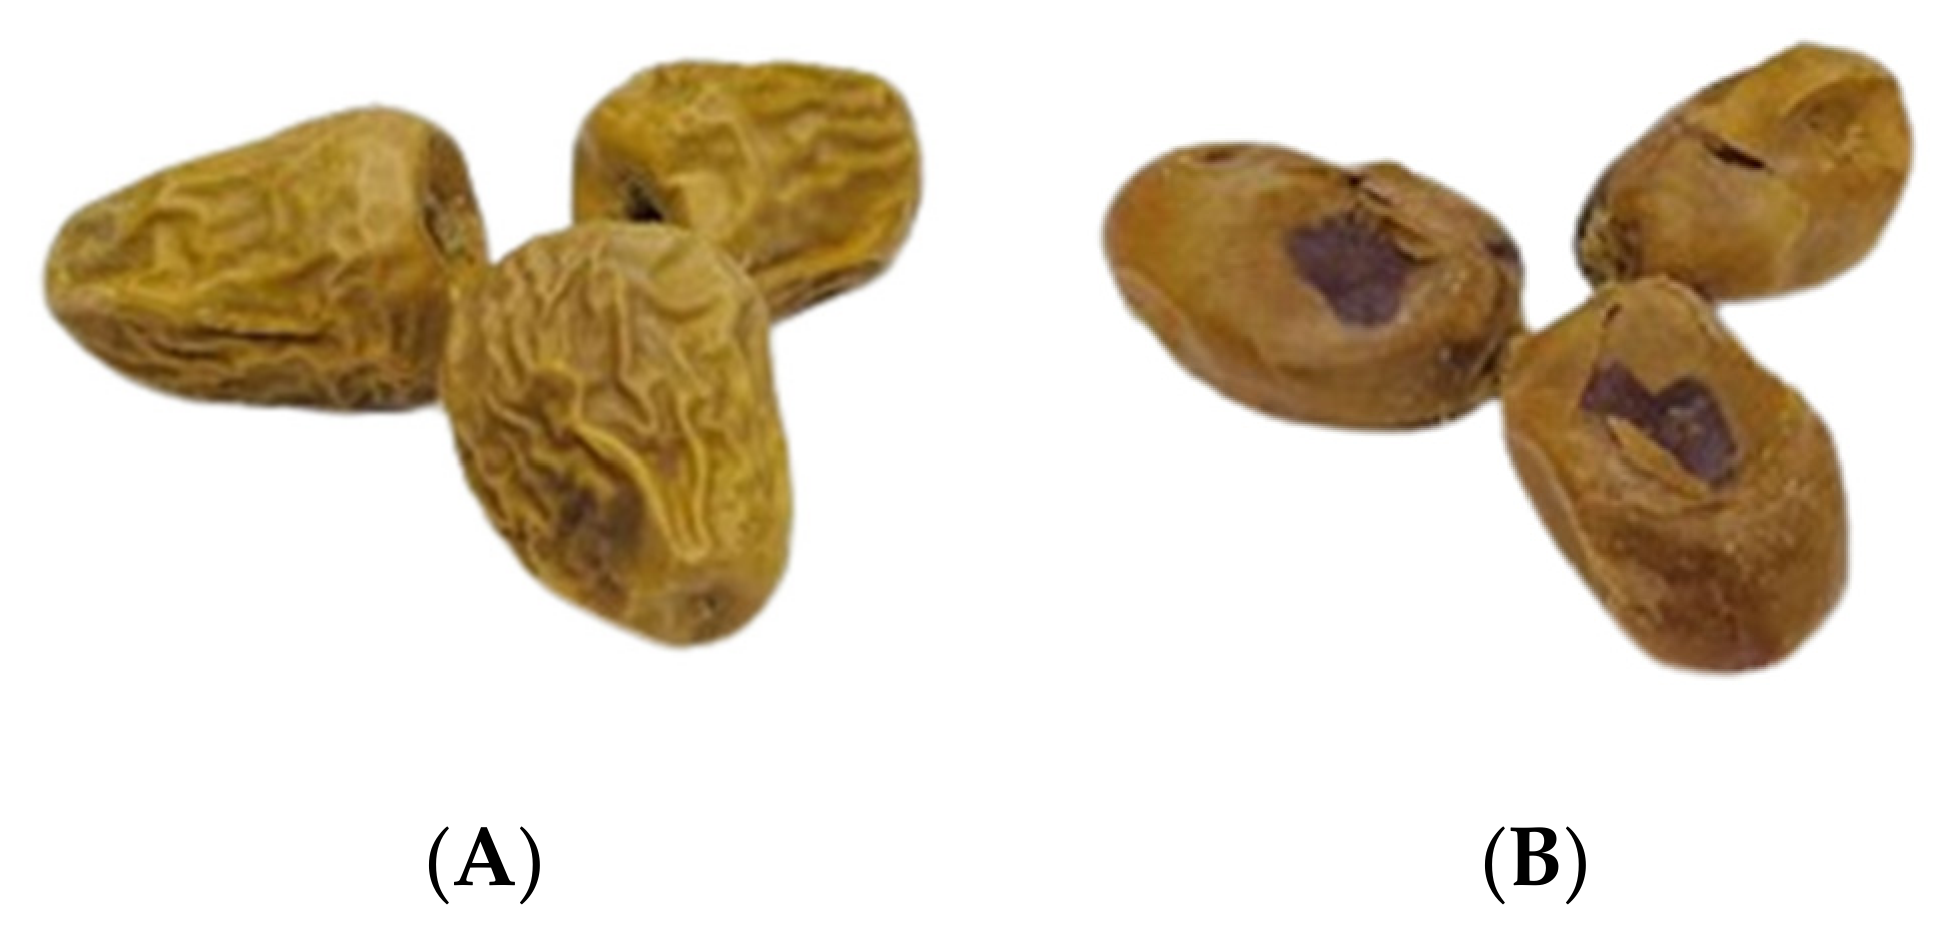
At the Tamer stage of maturation, characterized by a brown color, dates from two widely produced varieties in Saudi Arabia, Sukkary and Khlass, were selected for experiments due to their significant production volumes, as illustrated in Figure 1 [46,47,48,49]. The Tamar stage is the final phase of date fruit development, following Hababouk, Kimri, Khalal, Bisir, Munassif, and Rutab. Dates are typically marketed during the last three stages (Rutab–Tamar), enabling consumption as soft, semi-dry, or dry fruits depending on cultivar, climate, and market demand [50]. Sukkary and Khlass date fruits were sourced from the King Saud University Farm Station located in the Derab region, approximately 80 km southwest of Riyadh, Saudi Arabia. Rigorous selection criteria were applied to ensure high-quality fruits based on size, color, and the absence of pests, physicochemical damage, and impurities.
Six moisture groups were chosen to simulate the moisture content levels of commercial date fruits at the Tamar stage, as detailed in Table 1 [47]. After acquisition, the samples were transported under refrigerated conditions to the Food Engineering Process Laboratory (FEPL) in the Department of Agricultural Engineering at King Saud University. They were sorted and stored at 5 °C in cardboard boxes inside sealed plastic bags until used in the experiments.
The moisture content of both date cultivars increased progressively from the control samples to Group E, confirming the successful establishment of distinct moisture-level classes. Sukkary samples ranged from 4.357% to 27.343% d.b., whereas Khlass samples showed a wider moisture range from 6.235% to 38.697% d.b. The presence of different superscript letters among the groups indicates statistically significant differences between moisture classes, demonstrating that the simulated treatments effectively represented broad harvest-related moisture variability. This controlled variation is important for evaluating the response of date fruits to moisture-dependent quality changes and for developing robust predictive models in AI-based date processing and quality assessment.
To preserve the assigned moisture groups and minimize moisture exchange during handling, date samples were stored at 5 °C in sealed plastic bags and transferred to the processing line only immediately prior to extraction. Exposure time at ambient conditions was minimized, and moisture content was verified at defined checkpoints (before processing and after sample preparation) to confirm stability of the moisture-group classification.

3.1.2. Equipment

Processing Line at a Semi-Industrial Level
In the Food Processing Hall, a semi-industrial production line (Bigtem Machine Industries, Istanbul, Turkey) will be run to produce Juice. This semi-industrial continuous production system is specifically designed for research and small-scale production and comprises several units, including feed, extraction, date pitting, filtration, balance tanks with a mono-pump, an evaporation unit, and a volumetric filler.
Major Units of Juice Production
(a)
Extraction Unit: The extraction unit (Model No: SSB.44, Serial No: 13721) includes a screw blancher for the extraction of sugar from dates. The blancher system has a capacity of 0.518 m3 and features a screw shaft with dimensions of D = 406 mm and L = 4000 mm. The system is powered by an electric motor rated at 0.75 kW, operating at 1400 revolutions per minute (r.p.m.).
(b)
Dates Pitting: The seed separation unit (Machine No: DP.04, Serial No: 13745) is used for pulping very soft dates received from the blancher. It utilizes a high-speed centrifugal impeller with adjustable angle and distance (minimum 600 mm/2 feet) to facilitate seed separation. This unit is driven by a 17.20 kW electric motor, running at 1450 r.p.m. A stainless-steel perforated separation screen with 3.0 mm round holes was installed in the centrifugal pitting/pulping unit to retain date pits while allowing the softened fruit tissue to pass through for downstream juice extraction.
(c)
Filtration Unit: The filtration system comprises two pressurized filter units with metal frames and perforated plastic filter plates. Each filter unit contains 16 filter plates, each with a 100-micron perforation size and a surface area of 0.25 m2. The unit includes an electric motor pump rated at 4 kW, operating at 337 r.p.m., to pump the suspension into the filter unit. It also features several valves: a feed valve (V3), an air valve (V4) for cleaning, and a diverting valve (V5) that directs the flow to a second device when the first is full, as indicated by a safety pressure sensor. The control unit manages the pressure and operation of the filter plates. The line’s approximate filtration throughput is 1200–3200 L/h, assuming both filter units are used effectively and the process is run at a stable pressure with typical solids loading.
(d)
Volumetric Filler: The volumetric filler (Model No: VF.01/N, Serial No: 13746) is used for the semi-automatic filling of Juice into cans, jars, or plastic buckets. This filler features a 60 L overhead tank with level switches to control the pump. When a bucket is positioned under the pneumatically driven three-way filling valve, the operator activates the filling cycle by pressing a foot button. The standard filling volume is 1000 cc, but it can be adjusted to smaller volumes with a nozzle change kit. The electric motor is rated at 4 kW and operates at 337 r.p.m.
(e)
Balance Tanks: There are three balance tanks positioned before and after the filtration units and after concentration. Each feeding tank is equipped with a mono-pump (Model No: BT.500 + MPUMP, Serial Nos: 13731, 13732, 13733) powered by a 4 kW electric motor, operating at 337 r.p.m.
This sophisticated semi-industrial production line ensures precise, efficient processing of dates into high-quality Juice, facilitating research and small-scale production with meticulous control at each stage.
Glass bottles for juice production and packaging were sourced from a local market in Riyadh and selected for their suitability for food contact. Packages of identical size, each weighing 1000 g with juice, were used. Each packaging experiment was replicated ten times.

3.2. Methods

3.2.1. Conducting Laboratory Experiments

This section outlines the methods for measuring the properties of the raw date fruits, running different operating conditions, analyzing data, examining the quality of Juice, and estimating production costs through the following steps:
(a)
Preparation of Date Fruits:
The preparation process includes receiving, cleaning, sorting, and washing the dates. The physicochemical properties of the date/juices will be measured [14].
(b)
Production Process
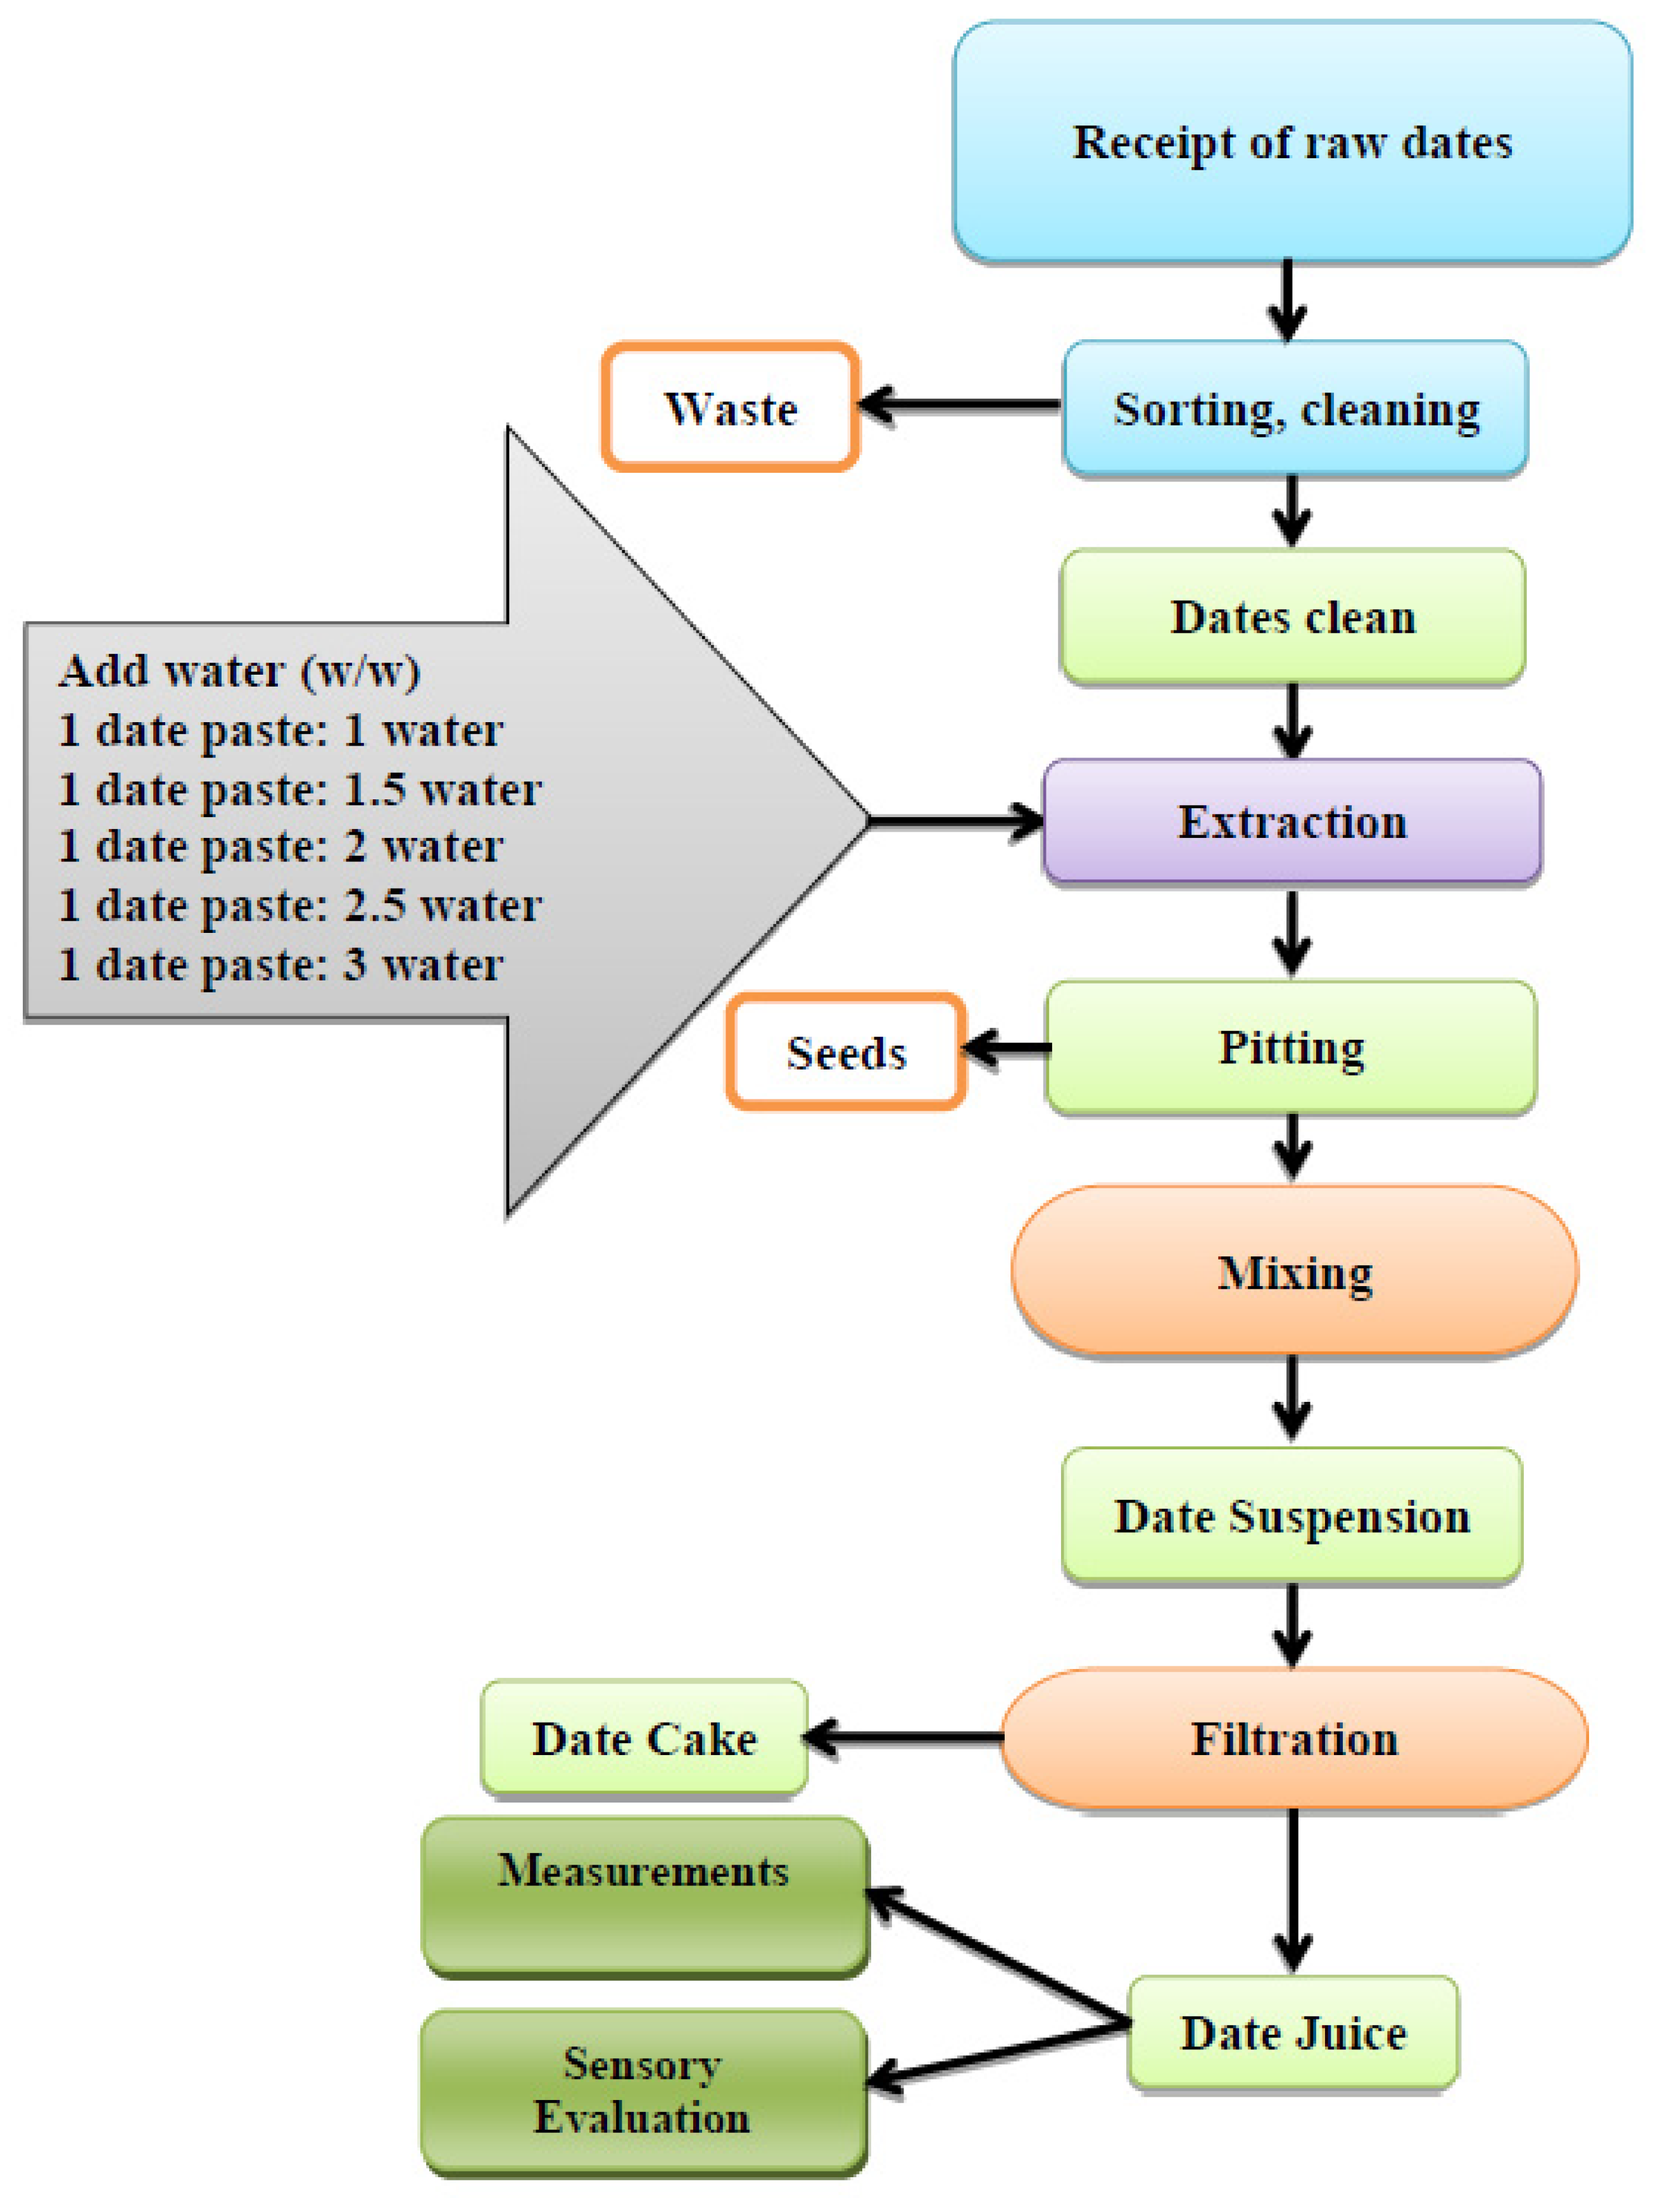
Extraction process: Dates were blended with hot water in a screw blancher, where a conveyor continuously dosed dates and water at controlled date-to-water ratios (1:1, 1:1.5, 1:2, 1:2.5, and 1:3, w/w) to produce a homogenized date suspension [51]. Blanching temperature was set using a thermostatically controlled steam/water heating system (20, 40, 60, or 80 °C), while residence time and mixing intensity were regulated by the screw rotation. The screw speed was recorded in rpm; the unit operated up to 1500 rpm, and experimental mixing levels corresponded to 10–50% of the maximum speed. Following blanching, a centrifugal seed-separation unit removed pits from the suspension to obtain a seed-free slurry.
Filtration process and measurements: The seed-free slurry was clarified using a press filtration unit to obtain date juice with a total soluble solids content of approximately 10–30% (°Brix). All juices were characterized at 25 °C for water activity, density, moisture content, pH, °Brix, viscosity, turbidity, HMF, browning index, processing time, electrical energy consumption, and the integrated Quality Index (Qi).
Figure 2 illustrates the sequential steps involved in the preparation, extraction, and evaluation of DJ from Sukkary and Khlass cultivars. The process includes selection and categorization of date samples based on moisture content, thermal and mechanical extraction under controlled conditions (varying temperature, mixing speed, and date-to-water ratio), mechanical filtration, and physicochemical analysis of the juice. The final stage involves sensory evaluation by a trained panel to assess attributes such as taste, flavor, texture, color, clarity, and overall acceptability. This schematic provides an overview of the methodological workflow designed to produce high-quality DJ, optimize processing parameters, and ensure consistency across experimental batches.
(c)
Measurements of the Physicochemical Properties of the date juice (DJ):
The properties of the date, fresh fruits, and date juice production that will be measured include:
(1)
Physical Properties
The following methods and equipment were used to measure the physical properties of the date/juice:
Water Activity: measured using a METER Aqualab [52] 4TE Benchtop Water Activity Meter (For Series 4TE, 4TEV, DUO Version 4, Decagon Devices, Inc., Pullman, WA, USA) at room temperature (25 °C), with specifications including a chilled-mirror dewpoint sensor and compliance with ISO 9001:2015 and EM ISO/IEC 17050:2010 (CE Mark).
Moisture Content: The moisture content was measured using a vacuum oven (Vacutherm model VT 6025, Heraeus Instrument, D-63450, Hannover, Germany). Samples were dried at 70 °C under a vacuum of 200 mmHg for 48 h [53]. The mass was measured using a balance (Model MA3002, Material No.: 30697449, Mettler, Greifensee, Switzerland) with a capacity of 3200 ± 0.01 g.
Density: The density was determined using a precision balance with a kit (PG-203-S Mettler Toledo, Greifensee, Switzerland).
Color: The basic color coefficients (L*, a*, and b*) were measured using a color instrument (Color 45/0, Hunter Associates Laboratory, Inc., Reston, VA, USA). L* represents lightness/darkness, a* indicates redness/greenness, and b* represents yellowness/blueness. Color derivatives, such as Browning Index (BI), were calculated from these basic color coefficients [14,48,54,55,56]:
B I = 100 x 0.31 0.17
where
x = a * + 1.75 × l * 5.645 × l * + a * 3.012 × b *
Potential of hydrogen: measured using a pH meter (Model Five Go™ Portable Instruments F2 pH/mV Meter, Material No.: 30266946, Order No.: 30259840, Bibby Scientific Ltd., Schlieren, Switzerland) with an accuracy of ± 0.01. The electrode was standardized with a pH 7.0 buffer before each measurement.
Total Soluble Solids (TSS) Measurement: The TSS was measured using a refractometer (HI 96801 Refractometer for Sucrose, Hanna Instruments Inc., Woonsocket, RI, USA), which measures the percentage of sugar, expressed as °Brix at a lab temperature of 25 °C.
Rheological Properties: A viscometer (Anton Paar, Rheolab QC, C-PTD 180/Air/QC, DC 48 V, Graz, Austria) was used to measure the viscosity of the DJ at temperatures (20°, 40°, 60°, 80° C) and apply the power-law model to obtain the coefficient of coherence and the flow behavior index as follows:
τ = k y n
where:
    • τ Is shear stress (Pa), y is shear rate (s−1).
    • n is the index to flow behavior; k is the coefficient of cohesion (Pa·s−1)
Turbidity: Portable turbidity meter Turb® 430 IR/T Turbidimeter, WTW, Method: Nephelometrisch (90° Straylight), Light Source: IR LED 830–890 mm, acc. to Standard Method: DIN EN ISO 7027-1, SKU: 600321, Measuring Range: 0–1100 FNU/NTU, Resolution: 0, 01 for 0, 02 −9, 99, 0, 1 for 10–99, 90, 1 for 100–1100, Accuracy: 0.01 NTU or ±2% of measured value, Operation Temp.: 0… +50 °C, Firmware software: V2.82, Xylem Analytics Germany Sales GmbH & Co. KG, Weilheim, Germany [53,57].
(2)
Chemical Analysis
Chemical analysis was performed on the DJ following the standards established by the Association of Official Analytical Chemists [53]. The presence of Hydroxy Methyl Furfural (HMF) in the processed D.J. will also be assessed, using High Performance Liquid Chromatography (HPLC) as a quality control measure.
(3)
Electrical Power Consumption; for each unit:
A Fluke 1630 Earth Ground Clamp Meter is an electrical testing tool that integrates a basic digital multimeter with a current sensor. Clamps measure current. Probes measure voltage [58]. Power represents the instantaneous rate of energy use, whereas energy represents cumulative consumption over a defined processing period (kWh). In this study, equipment loads were reported as power (kW), while process consumption was reported as energy (kWh) computed from the time integral of power. For cross-condition comparison, energy use was normalized to specific energy consumption (SEC), expressed in kW/h per 100 g of processed dates.
(4)
Production rate:
Measuring the production rate for DJ involves tracking the time required at each stage of the production process for 100 kg of raw dates. The time of production for each stage of the date juice production process was measured in:
  • Receiving and sorting time for date fruits.
  • Preparation: Washing, pitting, and cutting the dates.
  • Extraction: Time required to extract juice from dates.
  • Filtration: Duration needed to filter the juice.
  • Packaging: Time to fill and seal the juice into containers.
  • Record time for each stage using an automated tracking system.
(5)
Sensory Evaluation:
To assess the quality attributes of DJ samples derived from Sukkary and Khlass cultivars processed under semi-industrial continuous production methods. A total of 66 trained and semi-trained panelists from the College of Food and Agricultural Sciences at King Saud University participated in the evaluation. All assessments were conducted in accordance with institutional food safety and ethical standards.
Before testing, panelists received structured training sessions to ensure consistent understanding and application of sensory descriptors. Training included calibration exercises on attributes such as taste, flavor, texture, color, and clarity, and Overall Acceptability, along with standardized use of the 9-point hedonic scale, where 1 indicated “extremely dislike” and 9 indicated “extremely like” [14,48,59,60,61,62,63,64,65].
Date juice samples were evaluated immediately after production and cooling to 4 °C, served in coded, odor-free, 50 mL plastic cups. Sensory tests were performed in individual sensory booths equipped with neutral lighting (D65), controlled temperature (22 ± 1 °C), and adequate ventilation, following ISO 8589 guidelines for sensory analysis environments [66].
(6)
Evaluation of the Quality Index (Qi)
The Quality Index (Qi), ranging from 0 to 1, is designed to standardize and represent the variables under investigation in relation to the minimum value of the controlled variable. Normalization is used to ensure compatibility of the quality index data [67,68,69]. The parameters are standardized using the following formula:
X i ^ = X i X m i n X m a x X m i n
where ( X i ^ ) denotes the normalized value of the quality parameter (x), (xi) is the measured value, and (xmax) and (xmin) represent the maximum and minimum values of the quality parameter (x), respectively.
The overall Quality Index (Qi) is calculated as:
Q i = i = 1 N X i ^ N
where ‘N’ is the number of samples. This index integrates both normalized sample properties and overall sensory acceptance data.
Date juice quality is inherently multi-attribute, governed by coupled physicochemical and processing-related responses (e.g., °Brix, browning, pH, and thermal load indicators). Therefore, a composite Quality Index (Qi) was adopted to condense the multivariate quality space into a single, operationally interpretable target that can be used for process optimization and decision-making. In this framework, higher Qi values indicate better overall quality, reflecting favorable extraction performance while limiting undesirable quality deterioration (particularly browning and HMF formation). Using Qi as the ANN target enables systematic identification of operating windows that simultaneously improve product consistency and manufacturing robustness, which is difficult to achieve using individual variables in isolation.

3.2.2. Artificial Intelligence (AI) Modeling

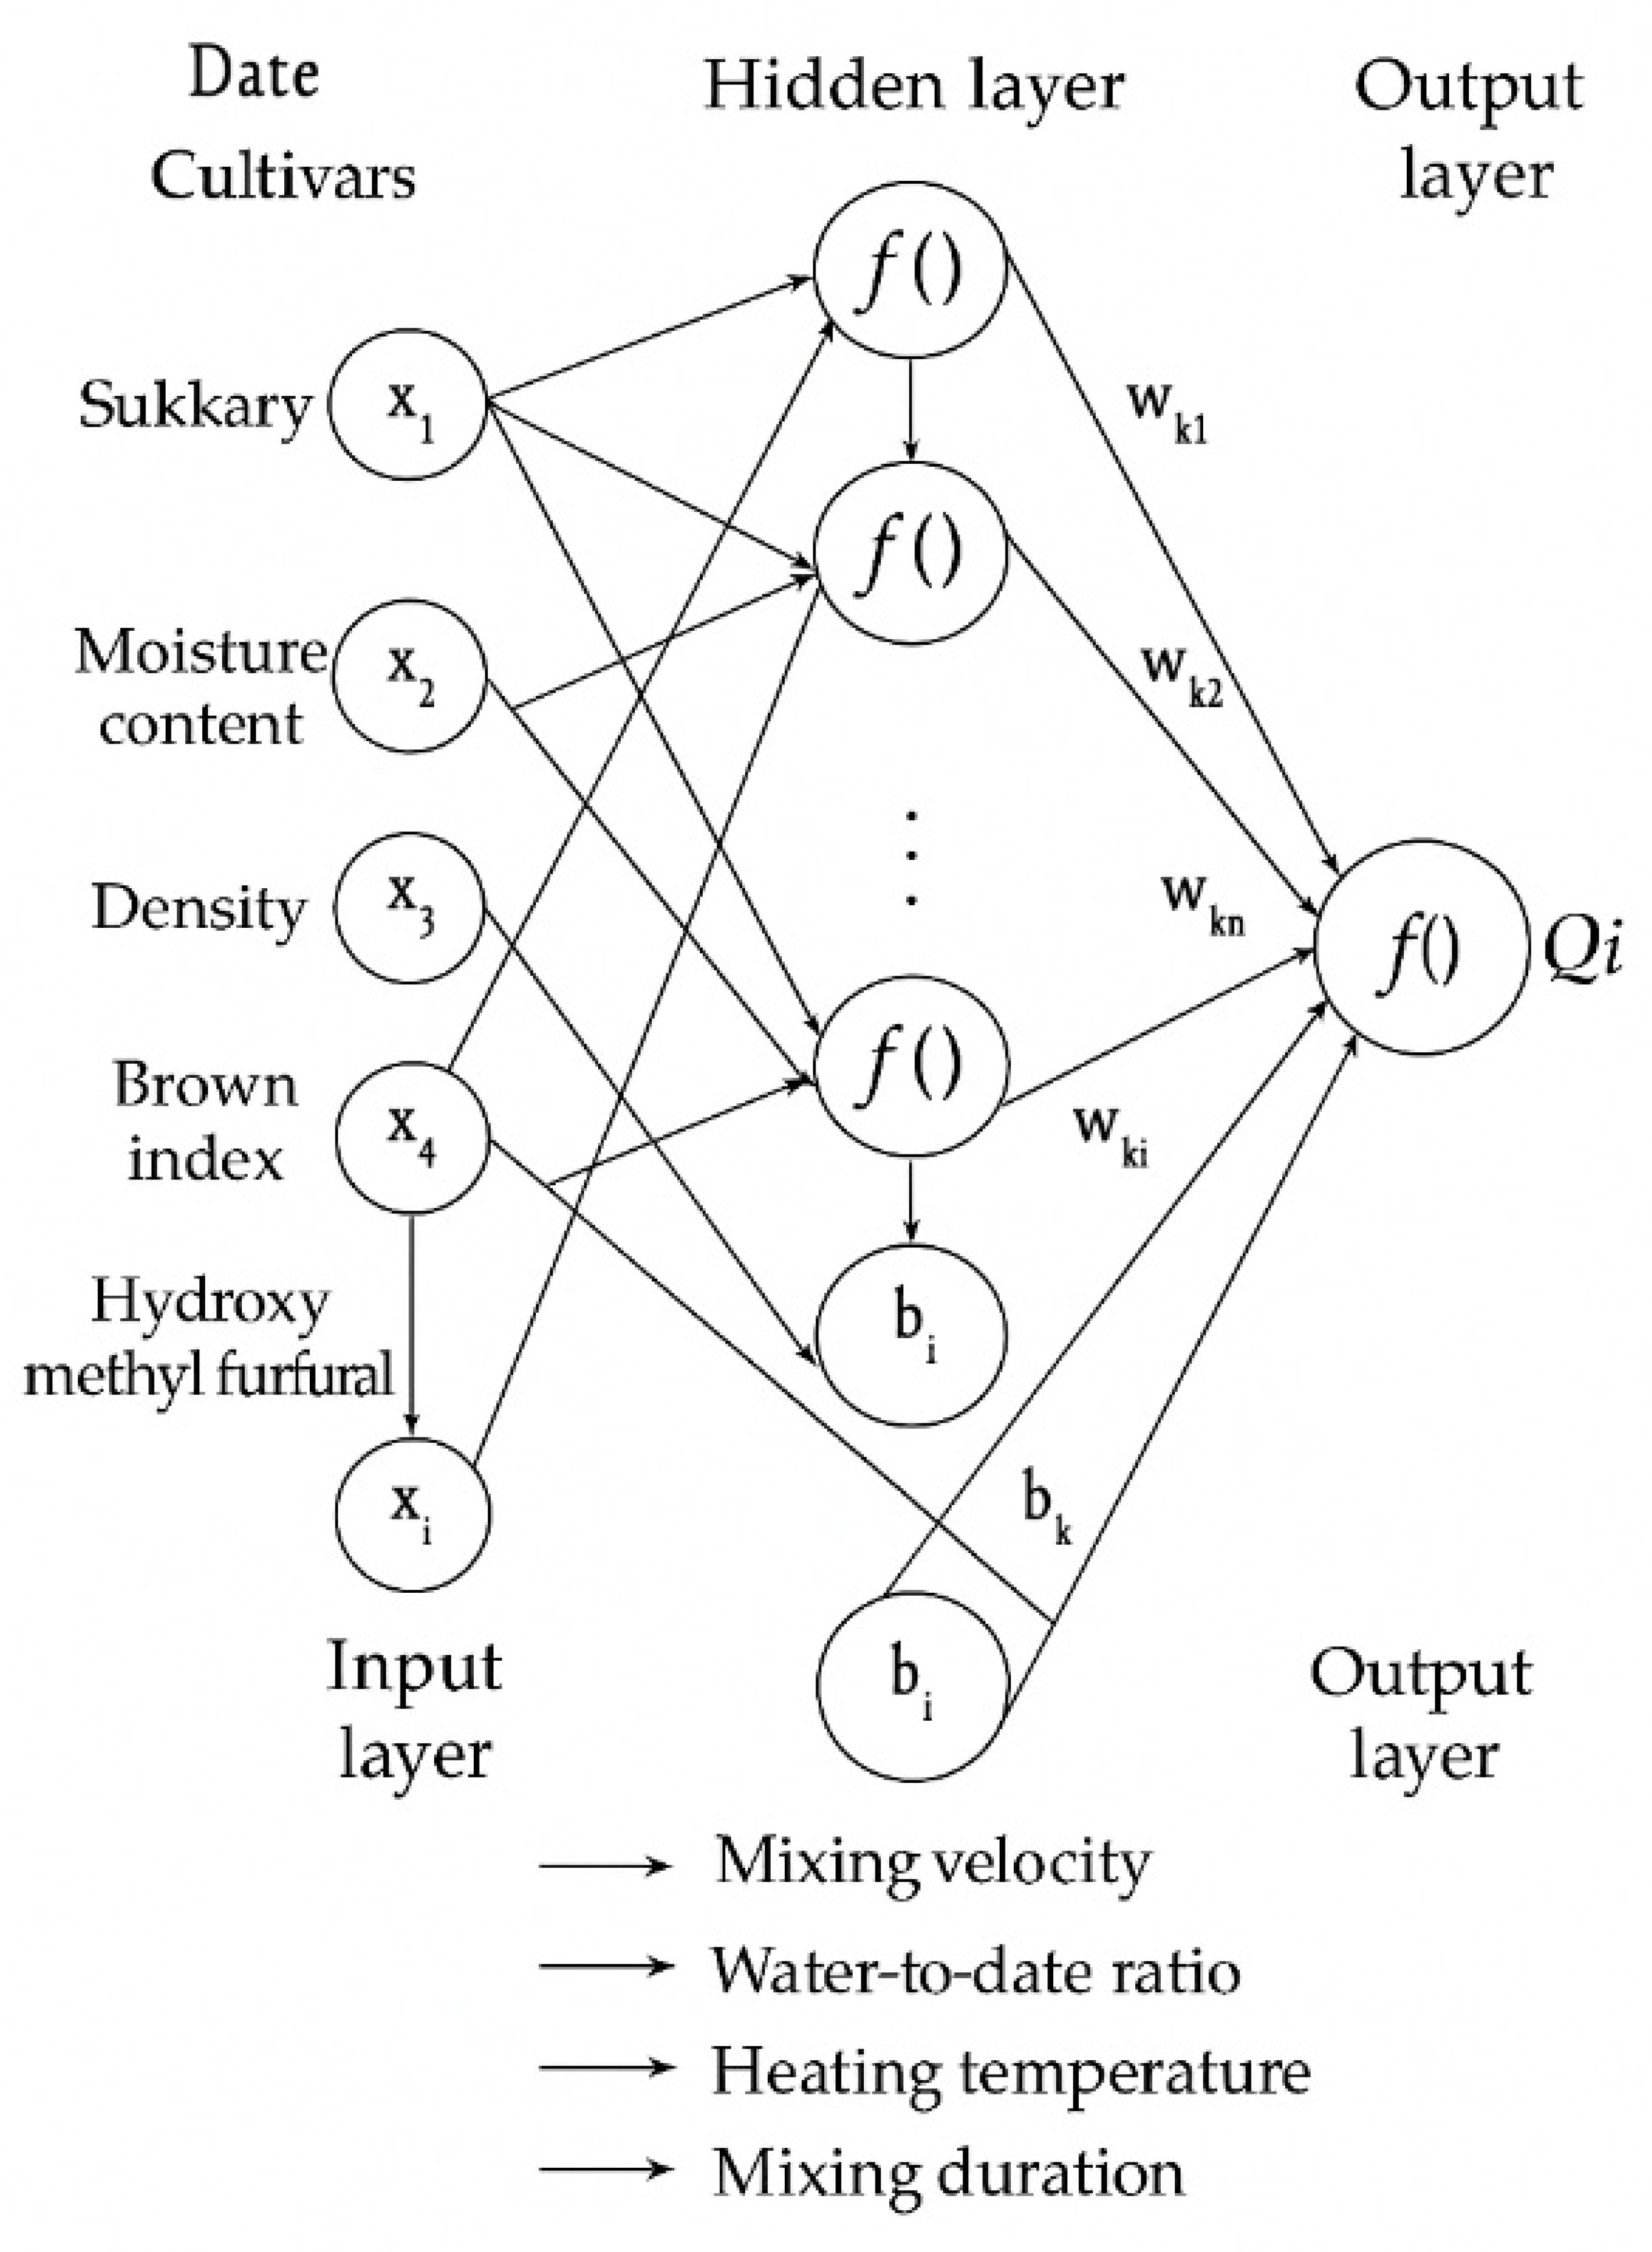
A feed-forward multilayer perceptron (MLP) was implemented to model the nonlinear relationship between the selected inputs and the target response. The optimized ANN used in this study consisted of three layers: an input layer (2 cultivars + 7 properties), one hidden layer (15 nodes), and a single output layer (1 Qi), and was trained using the back-propagation algorithm [70,71,72,73]. As shown in Figure 3, neurons in adjacent layers are fully connected through trainable weights and biases, which were iteratively updated during supervised training to minimize prediction error. Model training followed the standard back-propagation workflow of forward propagation to compute network outputs, error calculation against the measured targets, and backward weight updates, repeated until convergence criteria and best generalization performance were achieved [74].
Mathematically, the output of a neuron in the output layer, denoted as Y k , can be expressed with [75]:
Y k = f j = 1 n w k j · f i = 1 m w j i · x i + b j + b k
where:
  • x i are the input features.
  • w j i and w k j are the connection weights from the input to the hidden and the hidden to the output layers, respectively.
  • b j and b k are the bias terms for the hidden and output layers.
  • f · Is the activation function (sigmoid, ReLU).
  • Y k is the final output of a neuron k in the output layer.
This formulation captures the nested structure of feed-forward neural computation, in which each neuron’s output is a function of weighted inputs, passed through a nonlinear activation function.
The sigmoid and hyperbolic tangent (tanh) activation functions are among the most widely used in neural network models for agricultural and food processing applications. Of these, the tanh function is particularly favored due to its computational efficiency and ability to capture diverse learning behavior [76,77,78]. In the present study, the ANN model was trained using the tanh activation function, which offers improved convergence over sigmoid functions by producing zero-centered outputs. The mathematical form of the tanh function is defined as:
f x = 1 e x p 2 x 1 + e x p 2 x
This non-linear activation function enhances the model’s ability to approximate complex relationships between input and output variables.
To further interpret the trained ANN model and assess the contribution of each input variable, Garson’s algorithm was employed. This technique calculates the relative importance of input features by analyzing the connection weights within the network, offering insights into which parameters most strongly influence the output predictions [79,80,81]. Importantly, Garson’s method is based on the absolute values of the weights and does not consider the direction (positive or negative) of their influence. This analysis is particularly useful for identifying the most influential processing and physicochemical variables in predicting and optimizing juice quality.
ANN Development for Building a Mathematical Model
In this study, artificial intelligence techniques were applied to develop a predictive mathematical model using experimental data from semi-industrial continuous production trials. Artificial Neural Network (ANN) modeling was performed in MATLAB (R2025a) using machine learning algorithms (a feed-forward back-propagation network with a 7–15–1 architecture) to optimize key processing parameters and enhance juice quality. The model was constructed using a comprehensive set of 7 variables, which served as input parameters for the input layer’s neurons. The input encompasses both raw material characteristics and operational conditions. Input parameters included two date cultivars (Sukkary and Khlass), water activity, moisture content, density, brown index, pH, TSS (°Brix), and HMF. Processing conditions such as mixing velocity, water-to-date ratio, heating temperature, and mixing duration during extraction were also incorporated. The output layer consisted of a single hidden layer (15 neurons) with a tanh transfer function was used related to variables used to evaluate the juice’s overall quality index (Qi), including 10 variables: viscosity, turbidity, electrical energy consumption during extraction, and the same core parameters: water activity, moisture content, density, brown index, pH, TSS (°Brix), and HMF. All measurements were carried out under controlled laboratory conditions using standardized protocols to ensure consistency and reproducibility.
A structured experimental matrix was implemented to generate the dataset used for modeling and optimization. The full dataset comprised 1600 experimental runs, obtained by combining two cultivars (Sukkary and Khlass) with the defined processing factor levels (extraction temperature, mixing intensity, and date-to-water ratio) across the designated moisture groups. (The complete dataset, consisting of 1600 data points (two date cultivars × 4 Temperatures extraction × 5 mixing extraction × 5 water added × 8 parameter measuring). All runs were conducted using the same semi-industrial line and sampling protocol to ensure comparability across conditions. Each operating condition was performed in independent replicates (n = 800), and the reported values represent the mean of replicates (and standard deviation where applicable). Prior to model development, the complete dataset was randomized and subsequently partitioned into training, testing, and validation subsets (70%, 20%, and 10%, respectively) to support unbiased model selection and evaluation. The validation subset was further divided into 80 samples corresponding to juice production from the Sukkary and Khlass cultivars, enabling a comprehensive performance assessment across different water sources.
The ANN model was constructed through multiple cycles of trial-and-error optimization, during which various network configurations were evaluated. The training process was halted once the prediction error reached an acceptable threshold, and the architecture with the optimal number of hidden neurons was selected [82].
Before model training, the experimental data were pre-processed and normalized within the range [0, 1]. All input and output variables were scaled to the range of 0.15 to 0.85, following established protocols to enhance training stability and accelerate convergence [75,78]. This normalization procedure not only accelerates learning but also enhances the network’s ability to generalize to unseen data. The normalization was carried out using the following transformation equation:
X n = 0.85 0.15 X 0 X m i n X m a x X m i n + 0.15
where:
  • X n is the normalized value,
  • X 0 is the original input value,
  • X m i n and X m a x represent the dataset’s minimum and maximum values, respectively.
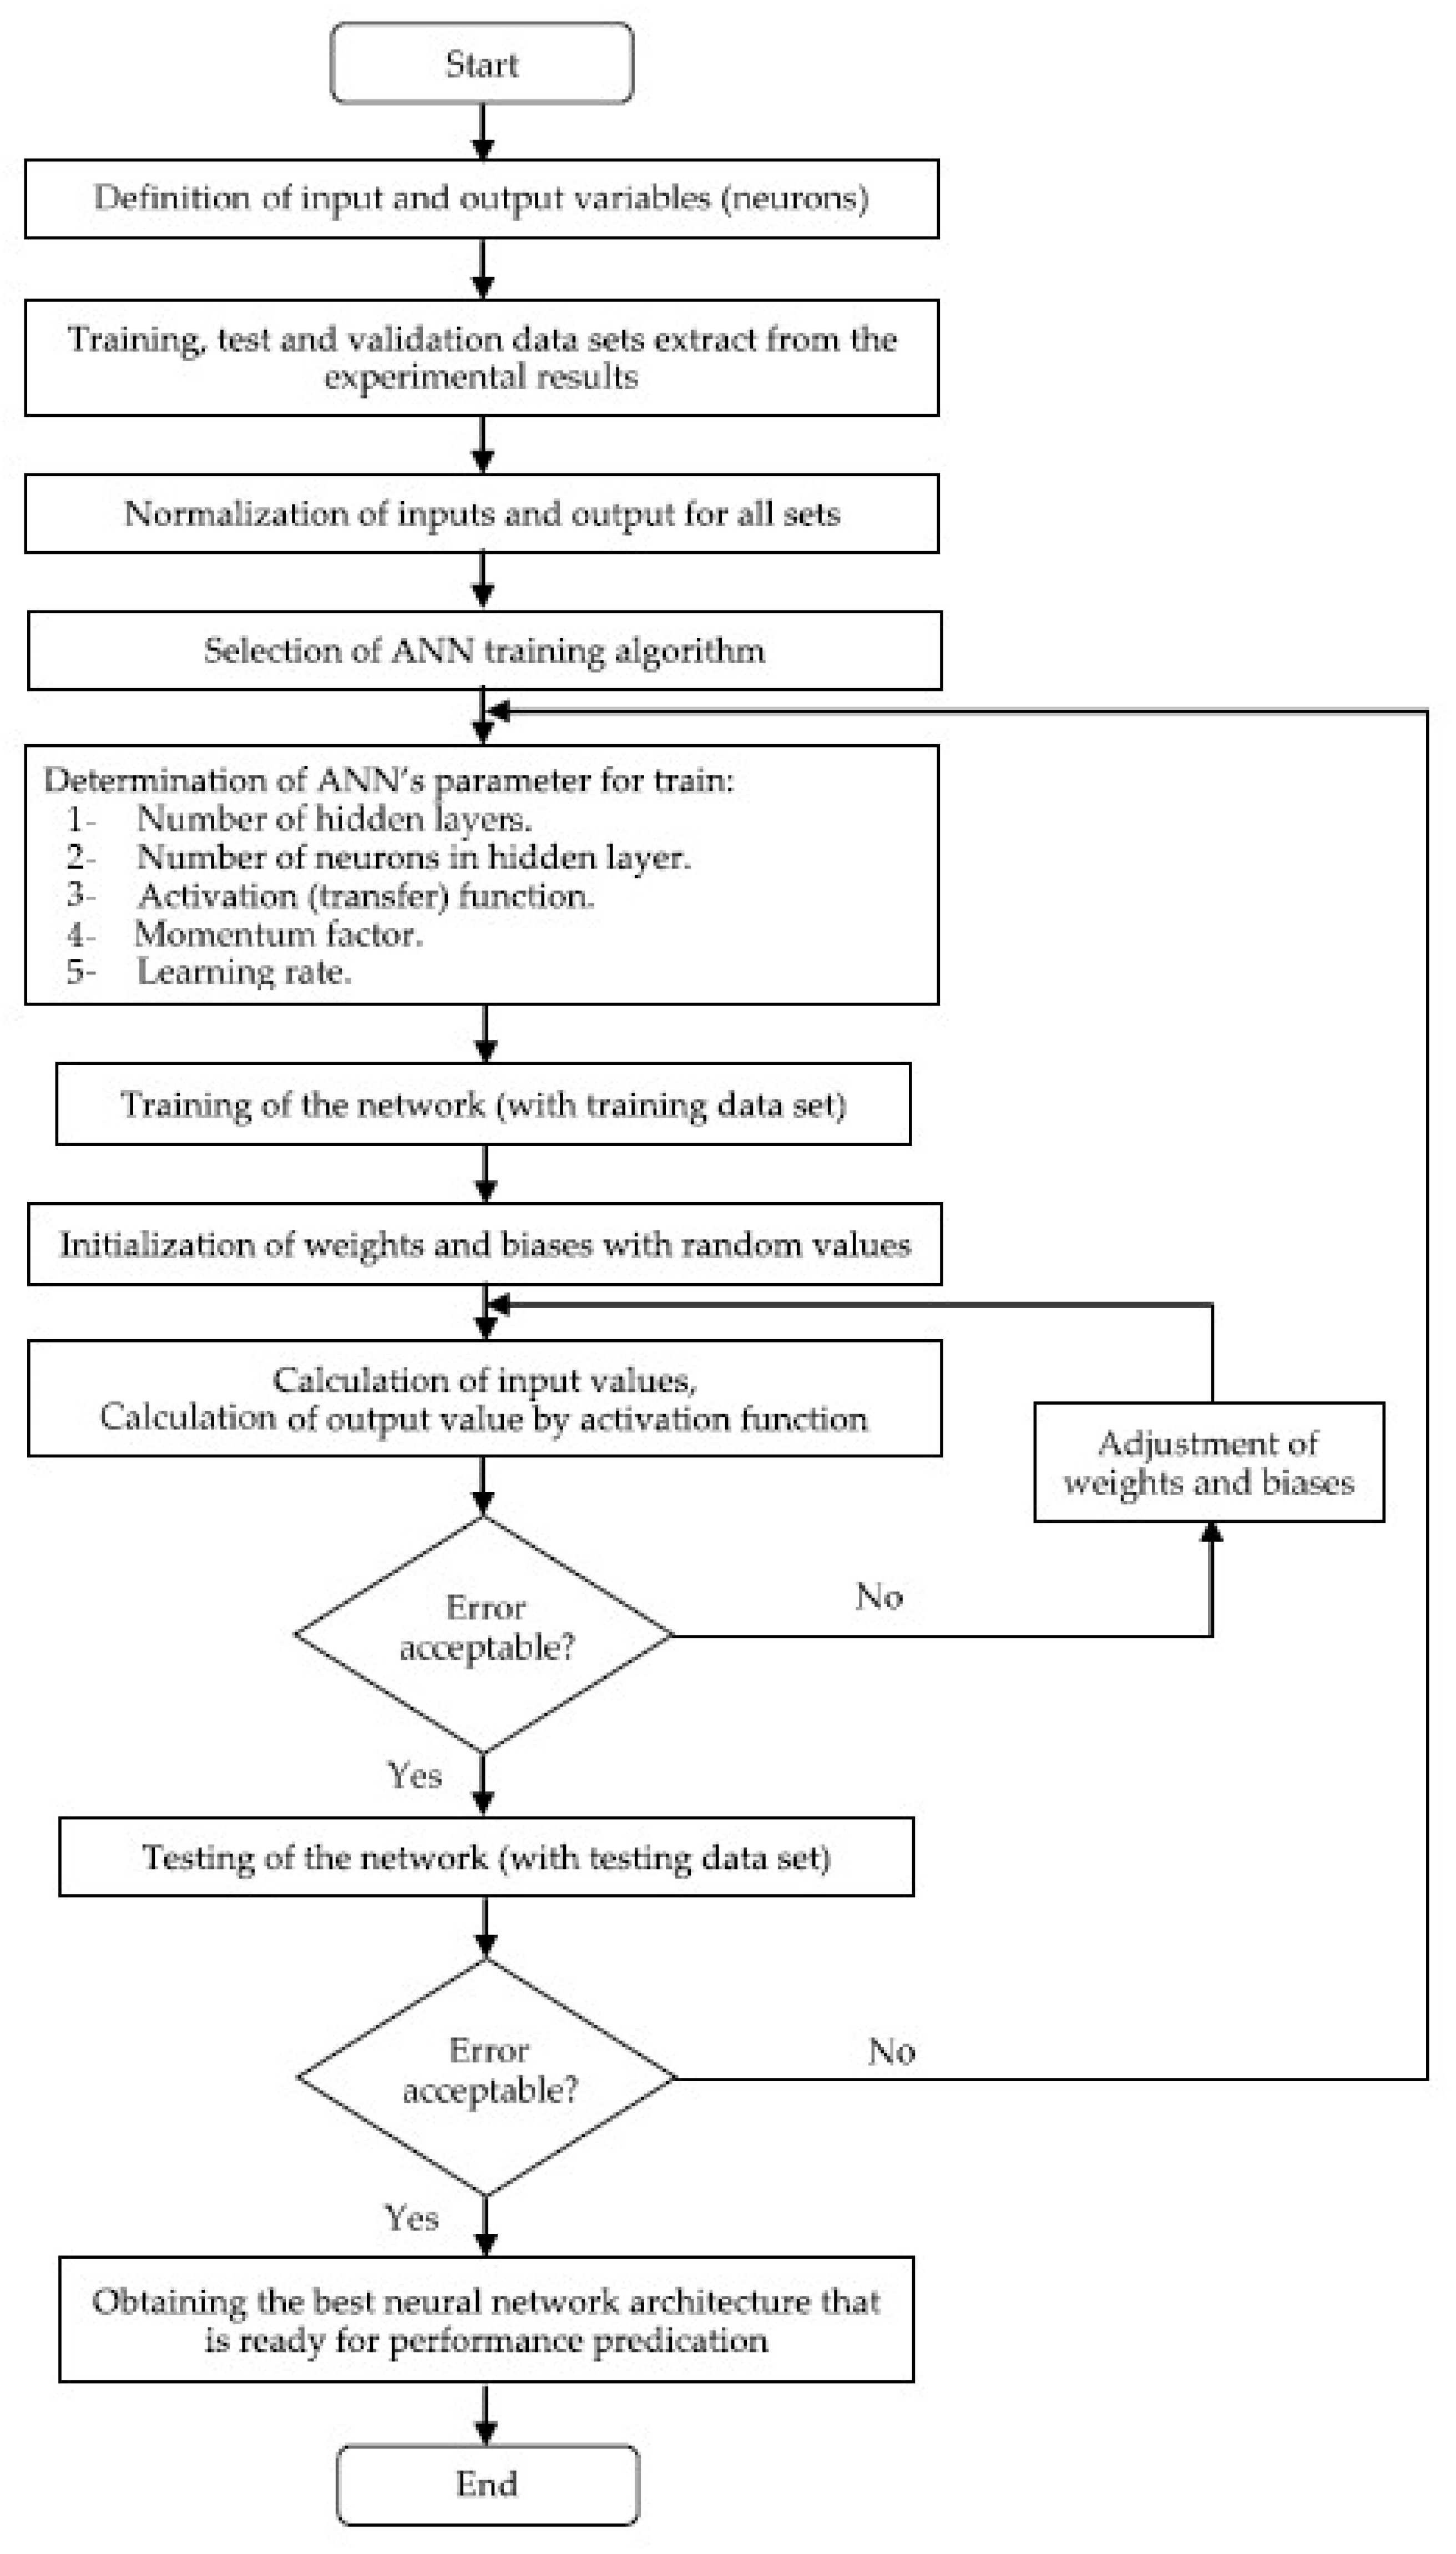
Prior to ANN training, all input and output variables were normalized to the range 0.15–0.85 to improve numerical stability and accelerate convergence. This bounded scaling helps reduce saturation effects when nonlinear transfer functions (e.g., hyperbolic tangent, tanh) are used, thereby improving gradient propagation and generalization. The adopted transformation also enables fair learning across variables with different units and magnitudes. Following the prediction, the normalized ANN output was converted back to the original Qi scale using the corresponding de-normalization equation reported in Section 3.2.1. Sub-point 3, Point 6.The chart in Figure 4 shows a schematic representation of the ANN modeling approach, illustrating the two-stage development process. In the first stage, relevant input variables, such as physicochemical and processing parameters, were selected based on their estimated contribution to output predictions using connection weight analysis. The second stage involved training the feed-forward ANN on normalized input-output data using the back-propagation learning algorithm. The network consists of an input layer, one hidden layer, and an output layer. Each layer includes bias terms and is fully connected using weighted links. The model was optimized by adjusting the number of hidden neurons and minimizing prediction error, with performance evaluated through statistical indicators. This schematic highlights the overall ANN framework applied to simulate and optimize DJ quality attributes under varying processing conditions. Each run was repeated several times using random sampling to ensure reproducibility and minimize the influence of variability in data partitioning.
Multiple Linear Regression (MLR) Modeling
To evaluate the predictive performance and effectiveness of the developed Artificial Neural Network (ANN) model, a Multiple Linear Regression (MLR) model was also constructed for comparative analysis. MLR is a conventional statistical approach that models the linear relationship between a dependent variable and multiple independent variables. In this study, the same input variables used for ANN training were employed in the MLR model to predict the corresponding output quality attributes of DJ. The regression model was developed using least-squares estimation to minimize the sum of squared residuals between the observed and predicted values. By comparing the predictive accuracy of the MLR with that of the ANN using statistical metrics, the relative modeling capability of each method was assessed. This comparison provided a quantitative basis for demonstrating the advantages of nonlinear modeling with ANNs over traditional linear techniques in capturing the complex relationships inherent in the juice production process.
The mathematical formulation of the Multiple Linear Regression (MLR) model used in this study is expressed as [83]:
Y ^ = b 0 + b 1 X 1 + b 2 X 2 + b 3 X 3 + + b m X m
where:
  • Y ^ is the predicted or estimated value of the dependent variable,
  • X 1 through X m represent the set of independent or predictor variables,
  • b 0 is the intercept term, indicating the value of Y ^ when all predictors are zero,
  • b 1 through b m Regression coefficients represent the effect of each predictor variable on the response.
Model Evaluation by Statistical Criteria
The evaluation of the network architecture’s performance involved minimizing statistical error metrics between the observed and predicted values. The level of agreement was assessed using eleven standard statistical evaluation criteria. Methodological methods widely described in the literature were used to evaluate the model [32,84,85,86,87,88,89,90], These criteria included average squared error (ASE) (Equation (9)), the coefficient of determination (R2) (Equation (10)), root mean square error (RMSE) (Equation (11)), mean absolute error (MAE) (Equation (12)), mean absolute relative error (MARE) (Equation (13)), relative error (RE) (Equation (14)), efficiency coefficient (E) (Equation (15)), coefficient of residual mass (CRM) (Equation (16)), the overall index of model performance (OI) (Equation (17)), Absolute average deviation (AAD) describes (Equation (18)), Finally, mean absolute percentage error (MAPE) (Equation (19)).
These metrics were used to compare the experimental values (Ei) with the corresponding predicted values (Pi) across the entire dataset (N) and are described in detail as follows:
The Average Squared Error (ASE) quantifies the discrepancy between observed and predicted values, where an ideal model yields an ASE value of zero:
A S E = i = 1 N E t i P i t 2 i = 1 N E t i E t ¯ i 2
Here, E t I and P i t Represent the actual and predicted values of the Qi, respectively, normalized between 0 and 1, and E t ¯ I Denotes the mean of the actual values.
The coefficient of determination (R2) reflects the strength of correlation between experimental and predicted outcomes; values approaching 1 indicate a highly reliable model:
R 2 = i = 1 N E i E ¯ P i P ¯ 2 i = 1 N E i E ¯ 2 · i = 1 N P i P ¯ 2
The Root Mean Square Error (RMSE) quantifies prediction error in the same units as the output variable, providing intuitive insight into model accuracy. Lower RMSE values signify higher precision:
R M S E = i = 1 N P i E i 2 N
Mean Absolute Error (MAE) measures the average absolute deviation between predicted and actual values, irrespective of direction:
M A E = i = 1 N P i E i N
The Mean Absolute Relative Error (MARE) presents this error as a percentage, where values nearer to zero indicate greater model reliability:
M A R E = 1 N i = 1 N P i E i E i × 100
Relative Error (RE) evaluates prediction bias in percentage terms:
R E = P i E i E i × 100
The Efficiency Coefficient (E) also assesses model fit, where a value of 1 reflects a perfect prediction and negative values suggest poor model behavior:
E = 1 i = 1 N E 0 , i P c , i 2 i = 1 N E 0 , i E ¯ 0 2
The Coefficient of Residual Mass (CRM) ranges from −1 to +1, with values closer to zero implying minimal bias and higher model fidelity:
C R M = i = 1 N P p , i i = 1 N E 0 , i i = 1 N E 0 , i
Additional performance metrics include the Overall Index of model performance (OI), which ranges from −1 to +1, with 1 indicating perfect agreement between experimental and predicted values:
O I = 1 2 2 R M S E E x E n + i 1 n E i P i 2 i = 1 n E i E ¯ 2
Absolute average deviation (AAD) describes the level of accuracy of a model prediction. The model with the lowest AAD is considered best:
A A D = j = 1 N E j , e x p e r i m e n t P j , p r e d i c t E j , e x p e r i m e n t N × 100
where E j , e x p e r i m e n t and P j , p r e d i c t are the experimental and predicted values, respectively, at the jth experiment. N and E mean the total number and mean of all experiments, respectively.
Finally, the mean absolute percentage error (MAPE), which measures the discrepancy between expected and actual values, is also the most commonly used metric for evaluating the effectiveness of the developed ANN model. The following is the formula for MAPE calculation:
M A P E = 100 × 1 N t t × q = 1 N t t P q P ^ q P q
where P ^ q is the predicted value, E q is the experimental value, and Ntt is the total number of data points in the test and training datasets.
Incorrect data is indicated by an MAPE value higher than 50%. A MAPE score between 20% and 50%, however, suggests that good data has been made, according to Lewis [91]. Good data is achieved when the MAPE is between 10% and 20%, but the best data is achieved when the MAPE is less than 10%.
Model Output and Implementation
The final trained ANN was used to simulate juice quality outputs under varying processing conditions. These simulations guided the optimization of operational parameters to produce DJ with desirable characteristics, such as 23 °Brix, low turbidity, minimal HMF, and acceptable sensory quality. The ANN framework can be adapted for real-time control and future integration with intelligent food processing systems.

3.3. Statistical Analysis

All experimental data were subjected to rigorous statistical analysis using multiple software platforms. Primary analyses were performed using SAS software (Version 9.4, Rev. 940_23w05; SAS Institute Inc., Cary, NC, USA) [69,92]. Descriptive statistics, including means and standard deviations (SD), were calculated for all measured parameters.
For the sensory evaluation data, statistical analysis was conducted using SPSS Statistics for Windows, Version 27.0 (IBM Corp., Armonk, NY, USA) [93]. A one-way analysis of variance (ANOVA) was performed to test for statistically significant differences among treatment groups at the p < 0.05 level. Where significant effects were observed, Tukey’s Honest Significant Difference (HSD) post hoc test was used to perform pairwise comparisons between means. Sensory results are presented as mean ± SD.
In addition to sensory analysis, ANOVA was used to evaluate the effects of moisture content, extraction temperature, mixing ratio, and cultivar on the chemical and physical characteristics of DJ. Tukey’s HSD test was employed to differentiate treatment means when ANOVA indicated significance.
To further explore relationships among physicochemical variables, correlation and linear regression analyses were performed, particularly between °Brix values and concentrations of sugars, minerals, and other quality-related parameters. These analyses facilitated the identification of trends and interdependencies in juice composition.
All data visualizations, including graphs, bar plots, and regression charts, were developed in Python (version 3.12.4) using libraries such as SciPy and Matplotlib. This version corresponds to the bugfix maintenance release under PEP 693 by the Python Software Foundation (2001–2022) [94,95,96,97,98].
Initial data tabulation and management tasks were carried out using Microsoft Excel (Microsoft Office 365; Microsoft Corp., Redmond, WA, USA) [48,99].
For artificial intelligence modeling, the MATLAB (R2025a) software package was used to apply Artificial Neural Network (ANN) techniques [100]. This involved analyzing input and output matrices, where the input vector comprises input energies and the output vector includes eleven parameters: yield and ten impact categories. Input and output data were normalized to the 0–1 range and then reverted to their original values after simulation. The data were used to train, cross-validate, and test the AI models based on laboratory experimental results.

4. Results and Discussion

The results of this study involved sensory evaluation and measurement of input variables used for modeling, including raw material characteristics and processing conditions. Raw input features comprised the date cultivar (Sukkary or Khlass) at different moisture content levels, along with key physicochemical attributes such as water activity, moisture content, density, brown index, pH, TSS (°Brix), HMF, and a composite quality index (Qi). Processing-related inputs included mixing velocity, water-to-date ratio, heating temperature, and extraction mixing time. The output variables selected to evaluate DJ quality were viscosity, turbidity, electrical energy consumption during processing, and the same set of core quality parameters. These variables were modeled and analyzed using Artificial Neural Networks (ANNs), specifically the Multilayer Perceptron (MLP) architecture. The models’ performance was rigorously assessed through a series of statistical evaluation criteria. Detailed data regarding the sensory evaluation and physicochemical properties of the DJ are provided in subsequent sections on how operational conditions factors interact to influence the quality of the DJ:

4.1. Sensory Evaluation and Optimization

Sensory quality is a decisive endpoint for industrial adoption of date juice, because it integrates multiple physicochemical drivers (sweetness intensity, mouthfeel, color/clarity perception, and heat-derived off-notes) into a single acceptability judgment. In the present work, sensory evaluation was performed using a structured hedonic framework covering taste, flavor, texture, color, clarity, and overall acceptability, enabling direct comparison of Sukkary and Khlass juices across moisture-content groups under semi-industrial continuous production (SIP) conditions.
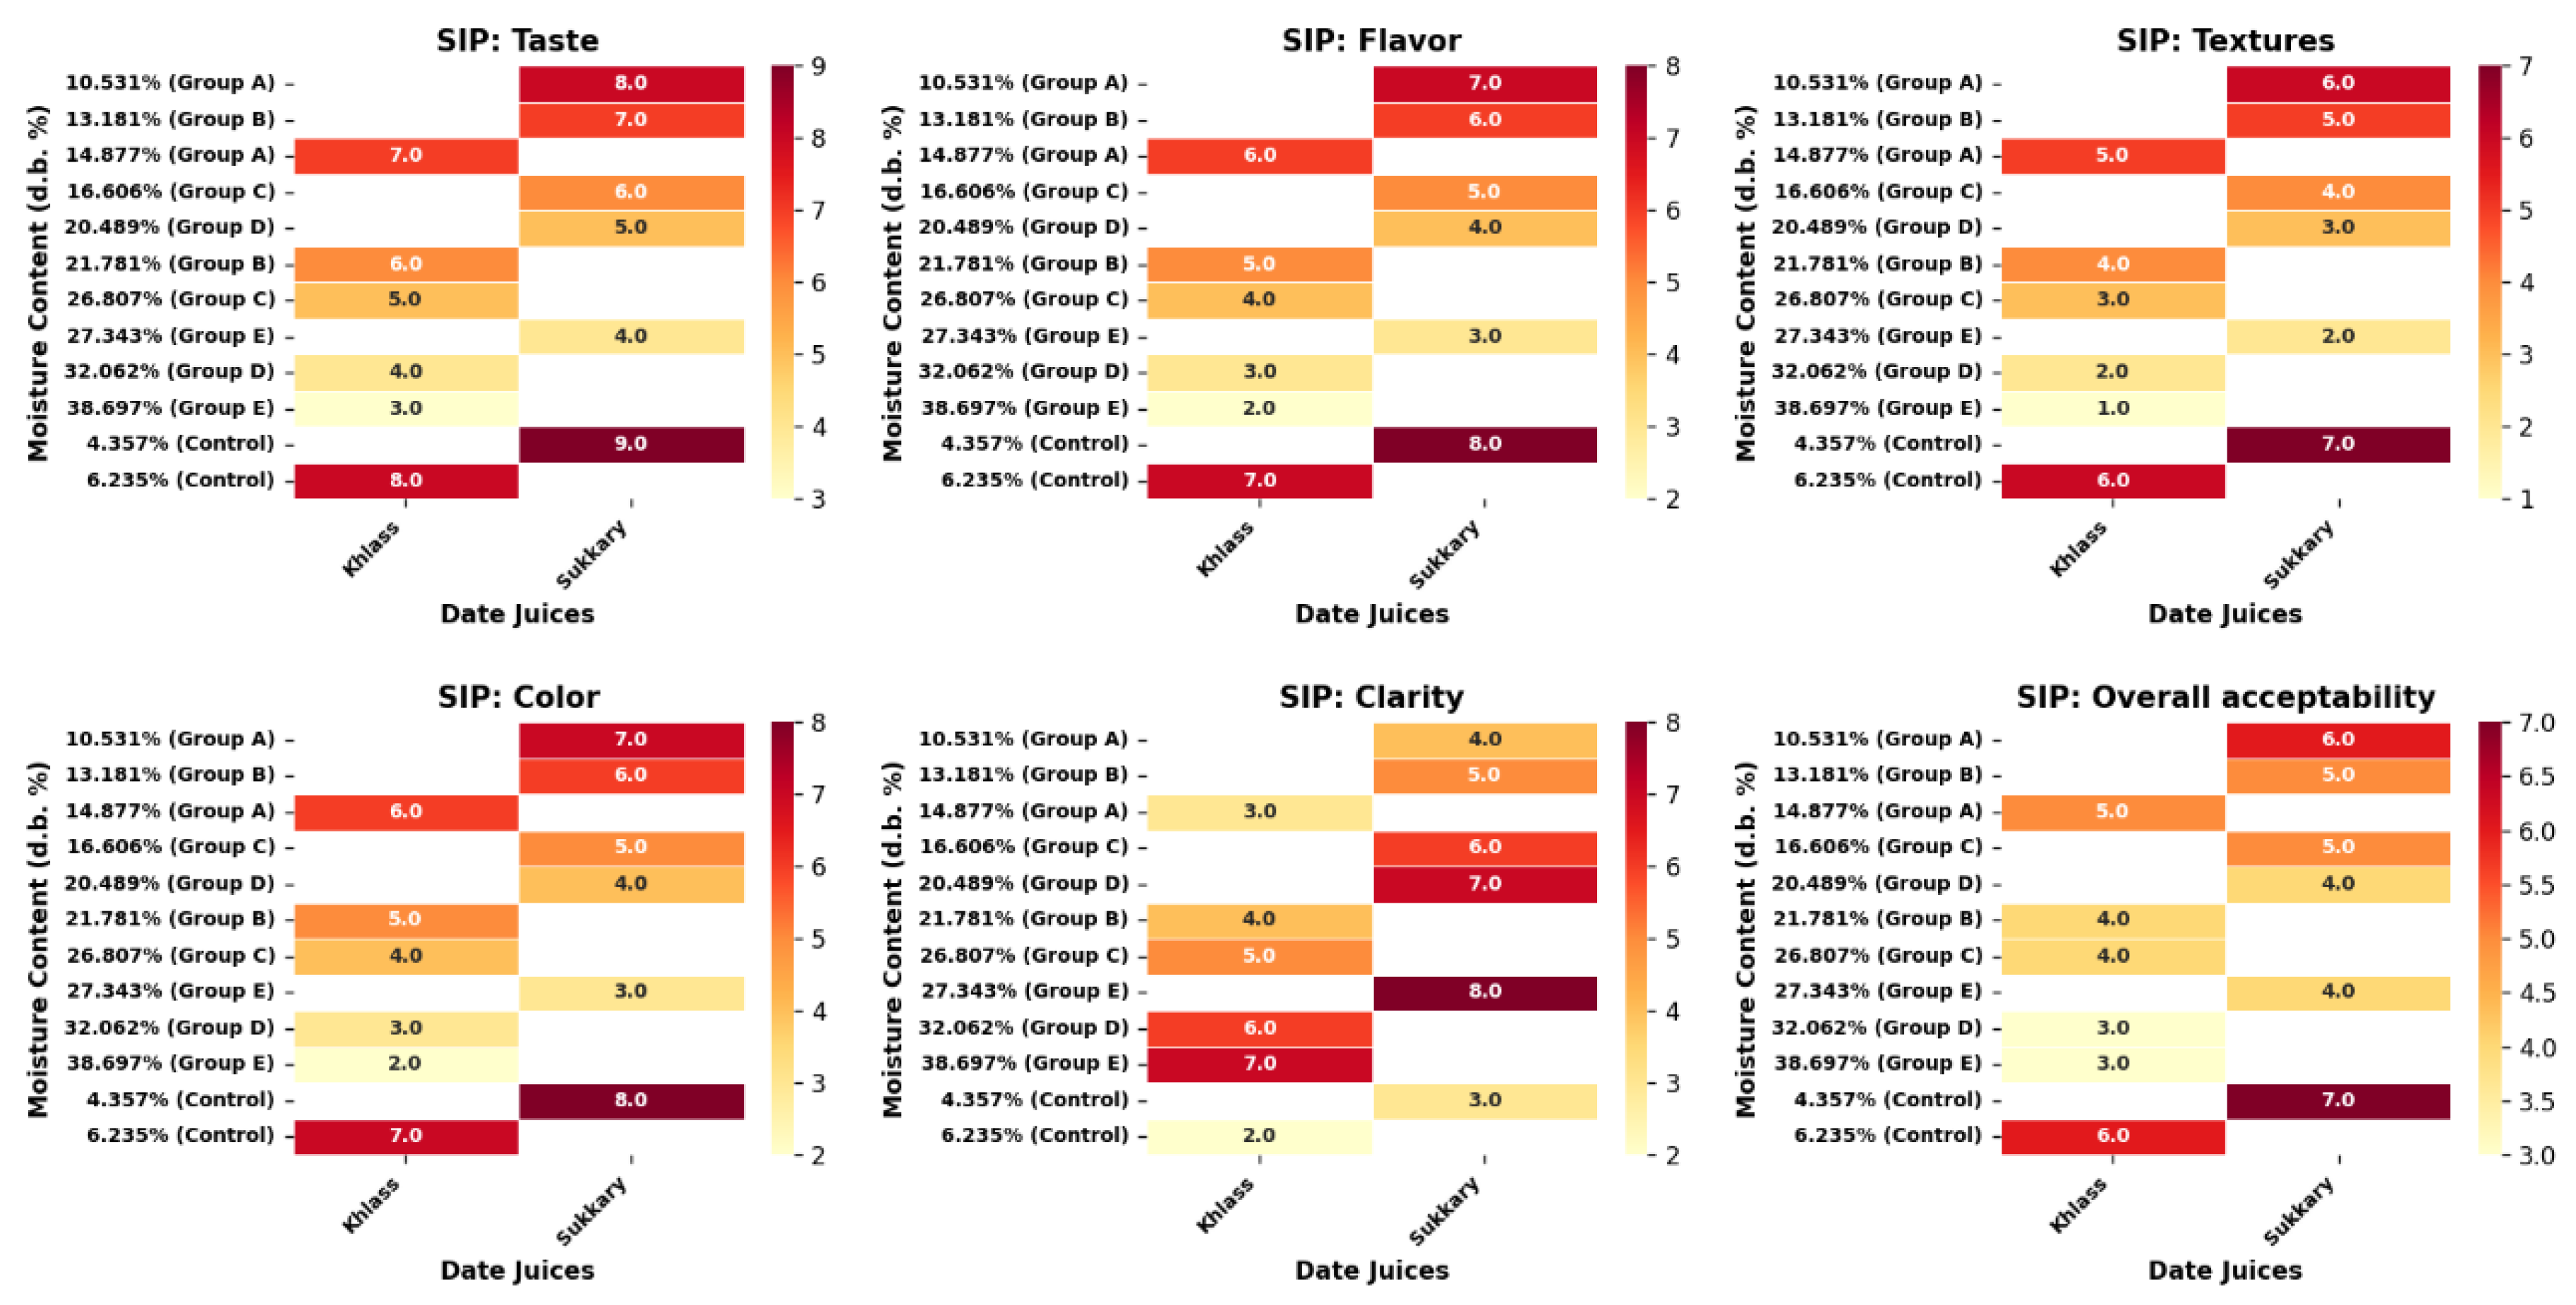
The newly added sensory heatmaps (Figure 5) provide a compact visualization of attribute-wise consumer perception across the evaluated groups. Because the experiments obtained a large data matrix spanning hundreds of observations across cultivars, moisture levels, and operating settings, only representative operating combinations were selected for visualization to ensure a clear, interpretable comparison while preserving the most informative contrasts. Accordingly, the heatmaps present an analytical snapshot across a practical range of initial moisture contents and extraction-water temperatures, and they indicate distinct preference patterns between cultivars and processing modes, with the most favorable sensory responses consistently emerging in selected mid-range moisture groups (notably Group C for Sukkary and Group B for Khlass) under SIP conditions.
Overall, the figure indicates cultivar-dependent preference patterns, with Sukkary generally showing higher sensory scores than Khlass across several attributes, consistent with the known contribution of cultivar sugar composition and sensory-active constituents to sweetness and flavor intensity. This cultivar effect agrees with compositional/sensory evidence reported for date varieties in the literature, where sugar profile and matrix composition are primary determinants of consumer preference [101].
Across moisture groups, the heatmaps suggest that mid-range moisture levels tended to support more favorable sensory outcomes (notably improved flavor/mouthfeel balance), whereas high-moisture groups were more frequently associated with lower taste/texture intensity, consistent with dilution-driven reductions in perceived sweetness and body. From a process perspective, this is expected because greater tissue water availability and/or higher effective dilution can reduce soluble-solid concentration and weaken viscosity-related mouthfeel, even when extraction efficiency is improved. Conversely, excessive thermal severity is not necessarily beneficial for sensory quality, as it can intensify non-enzymatic browning, potentially shifting color and flavor away from consumer preferences. This aligns with broader evidence linking processing conditions and sugar/browning behavior to quality perception in date-based products [102].
Importantly, the figure supports the study’s practical conclusion that sensory preference is not explained by a single variable (e.g., TSS) but rather emerges from multivariate trade-offs between extraction strength (sweetness/body), clarity/visual quality, and suppression of degradation markers. Therefore, presenting sensory scores as heatmaps is not only descriptive but also functionally complements the ANN-based optimization concept: the same multidimensional structure that motivates the ANN model is evident in the sensory response surface.
From Figure 5, overall, the Sukkary consistently outperformed Khlass, confirming a clear cultivar effect on consumer preference. Under semi-industrial processing (SIP), the Sukkary control achieved the highest overall acceptability (7.0) versus 6.0 for the Khlass control, and increasing moisture content produced a consistent decline in liking for both cultivars. For Sukkary, overall acceptability decreased from 7.0 (control) and 6.0 (Group A) to 4.0 (Groups D–E), with parallel reductions in taste (9.0→4.0) and texture (7.0→2.0); Khlass followed the same trend, falling from 6.0 (control) and 5.0 (Group A) to 3.0 (Groups D–E). In contrast, clarity increased with moisture (Sukkary 3.0→8.0), indicating a trade-off between visual clarification and sensory richness. The best combined sensory and process performance was obtained under a moderate extraction regime (≈60 °C, 40% mixing, 1:2.5 w/w date-to-water ratio), which supported effective homogenization, seed separation, and filtration while limiting thermal quality deterioration (browning/HMF) and maintaining favorable overall acceptability.

4.2. Evaluation of Operational Conditions for Date Juice Production

Process optimization was performed to maximize Qi while meeting practical processing constraints, including achieving the target °Brix level and maintaining acceptable limits for thermal quality deterioration indicators (notably HMF and excessive browning), with energy demand and processing time considered as operational decision criteria.
The optimal performance was achieved at an extraction temperature of 60 °C, with a mixing speed controlled and recorded in rpm at predefined levels (1500), corresponding to 40% of the equipment’s rated maximum speed (reported in parentheses only as an operational reference) and a date-to-water ratio of 1:2.5 (w/w). These conditions corresponded to moisture-content groups C and B for the Sukkary and Khlass cultivars, respectively. Under this optimized setup, the semi-industrial continuous production system demonstrated superior performance in terms of homogenization, seed separation, and filtration efficiency. Consequently, the process yielded clarified juices with elevated °Brix values of 27.3 for Sukkary and 26.6 for Khlass, along with enhanced color attributes and improved sensory acceptability.

4.3. The Optimum Date Fruits and Juices’ Product Physicochemical Properties

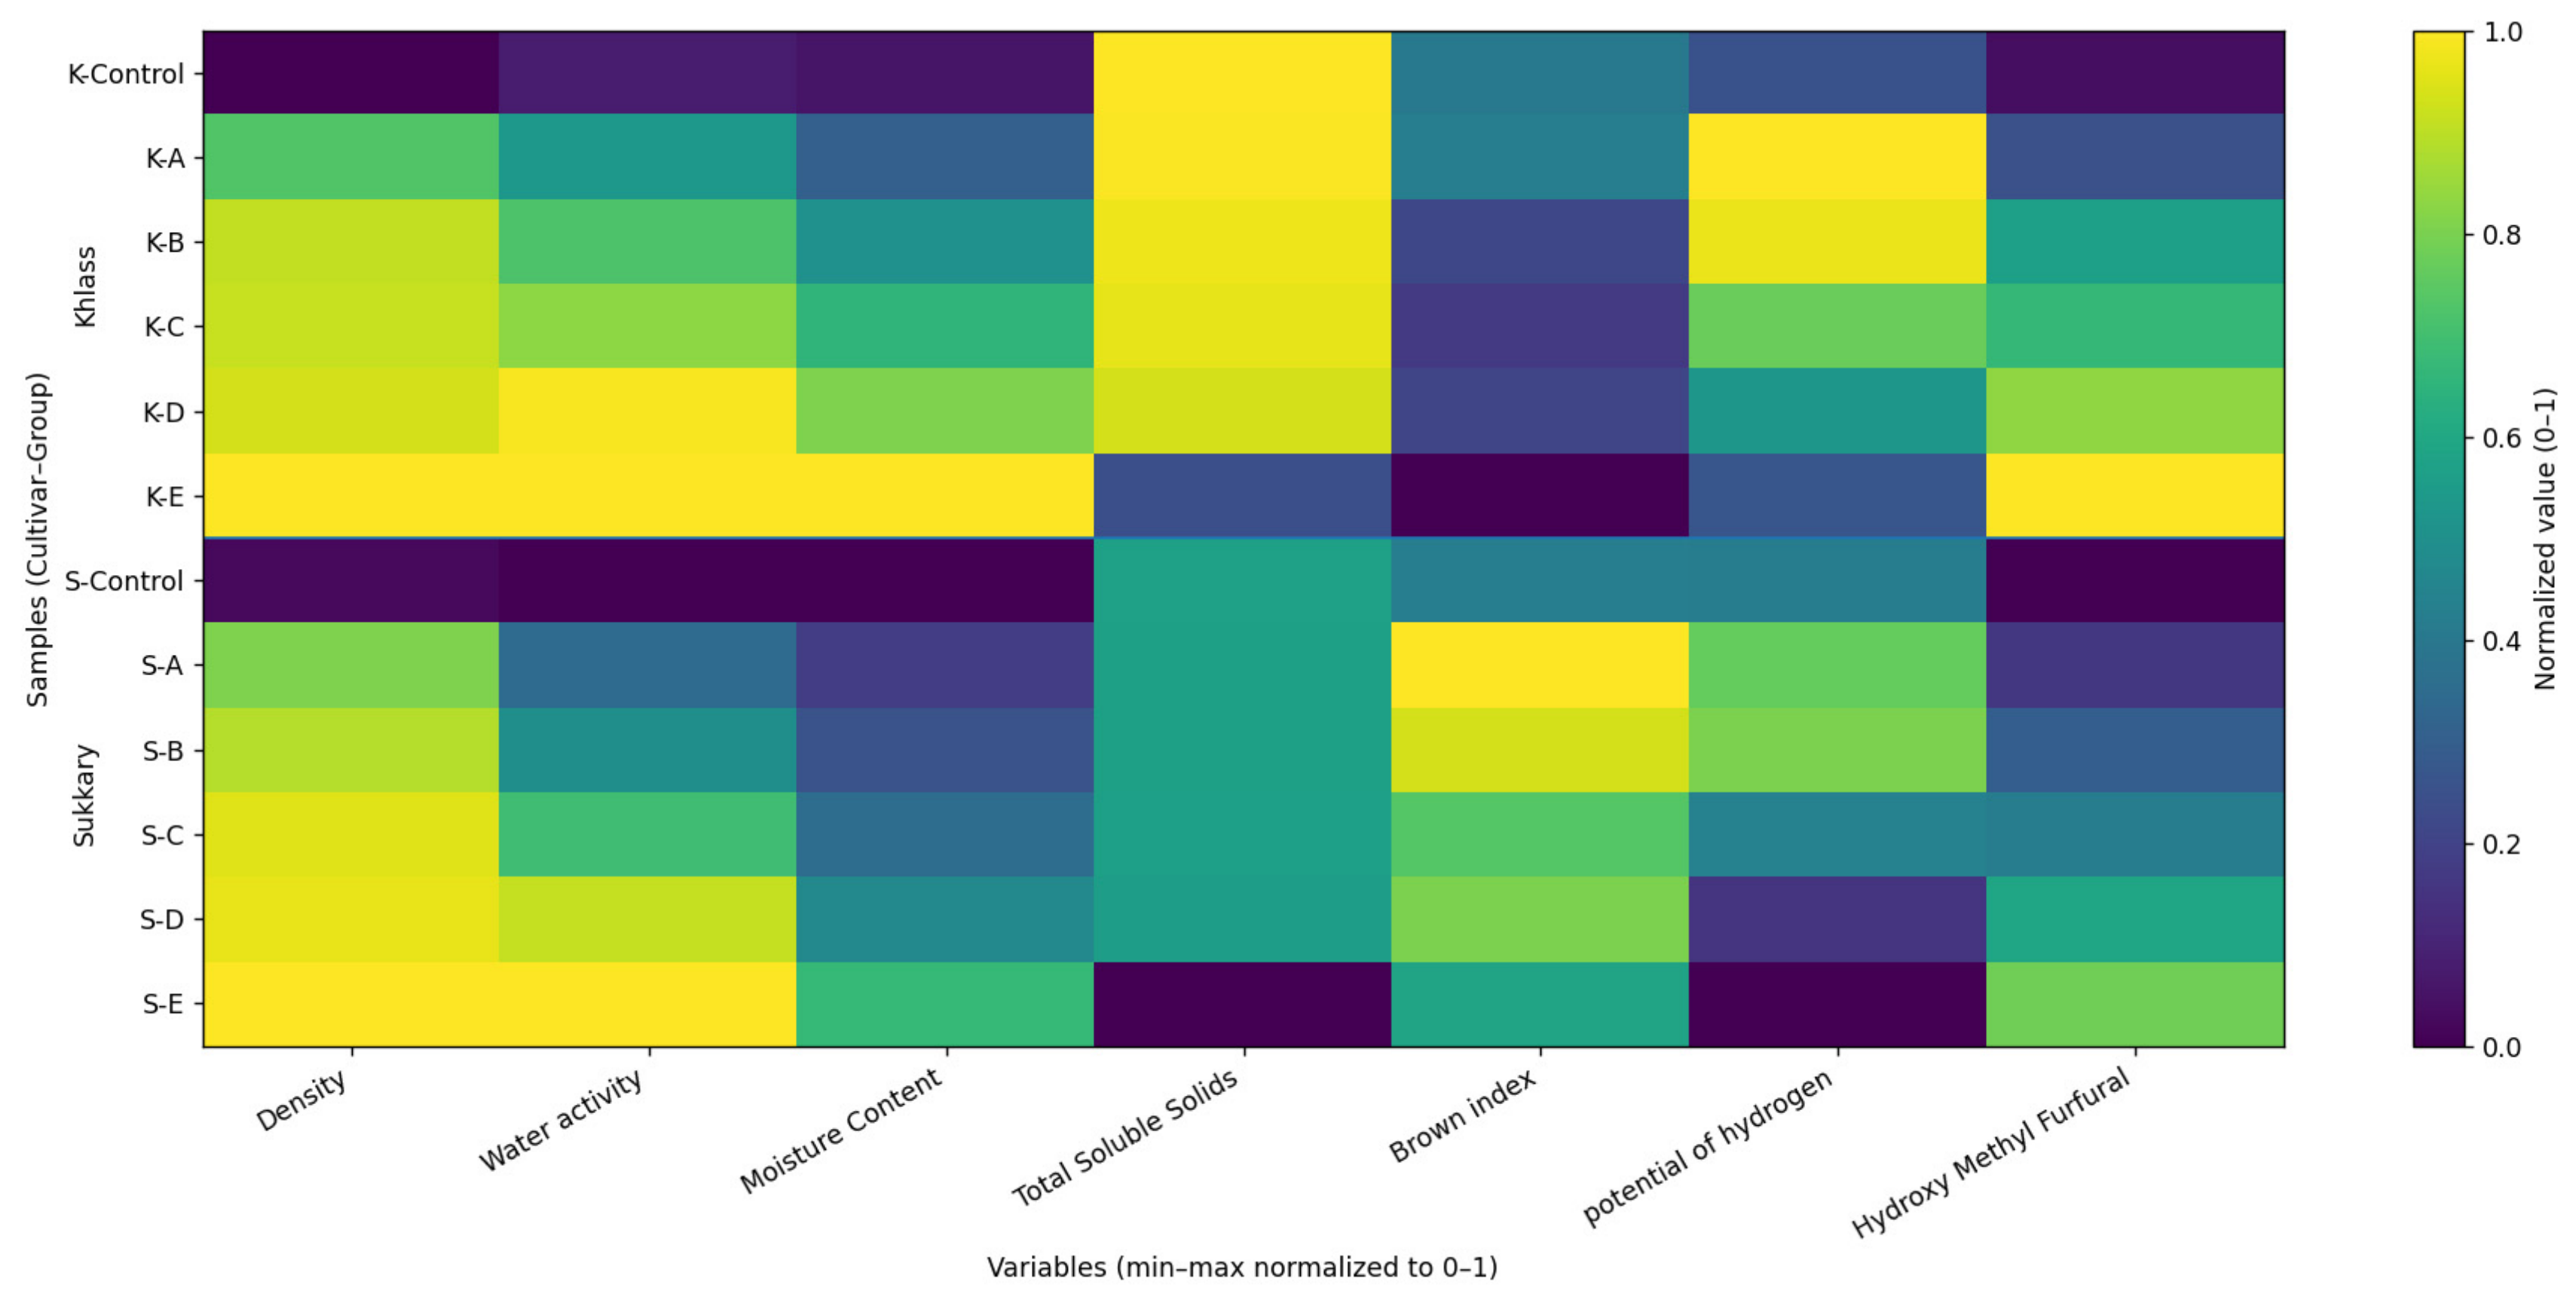
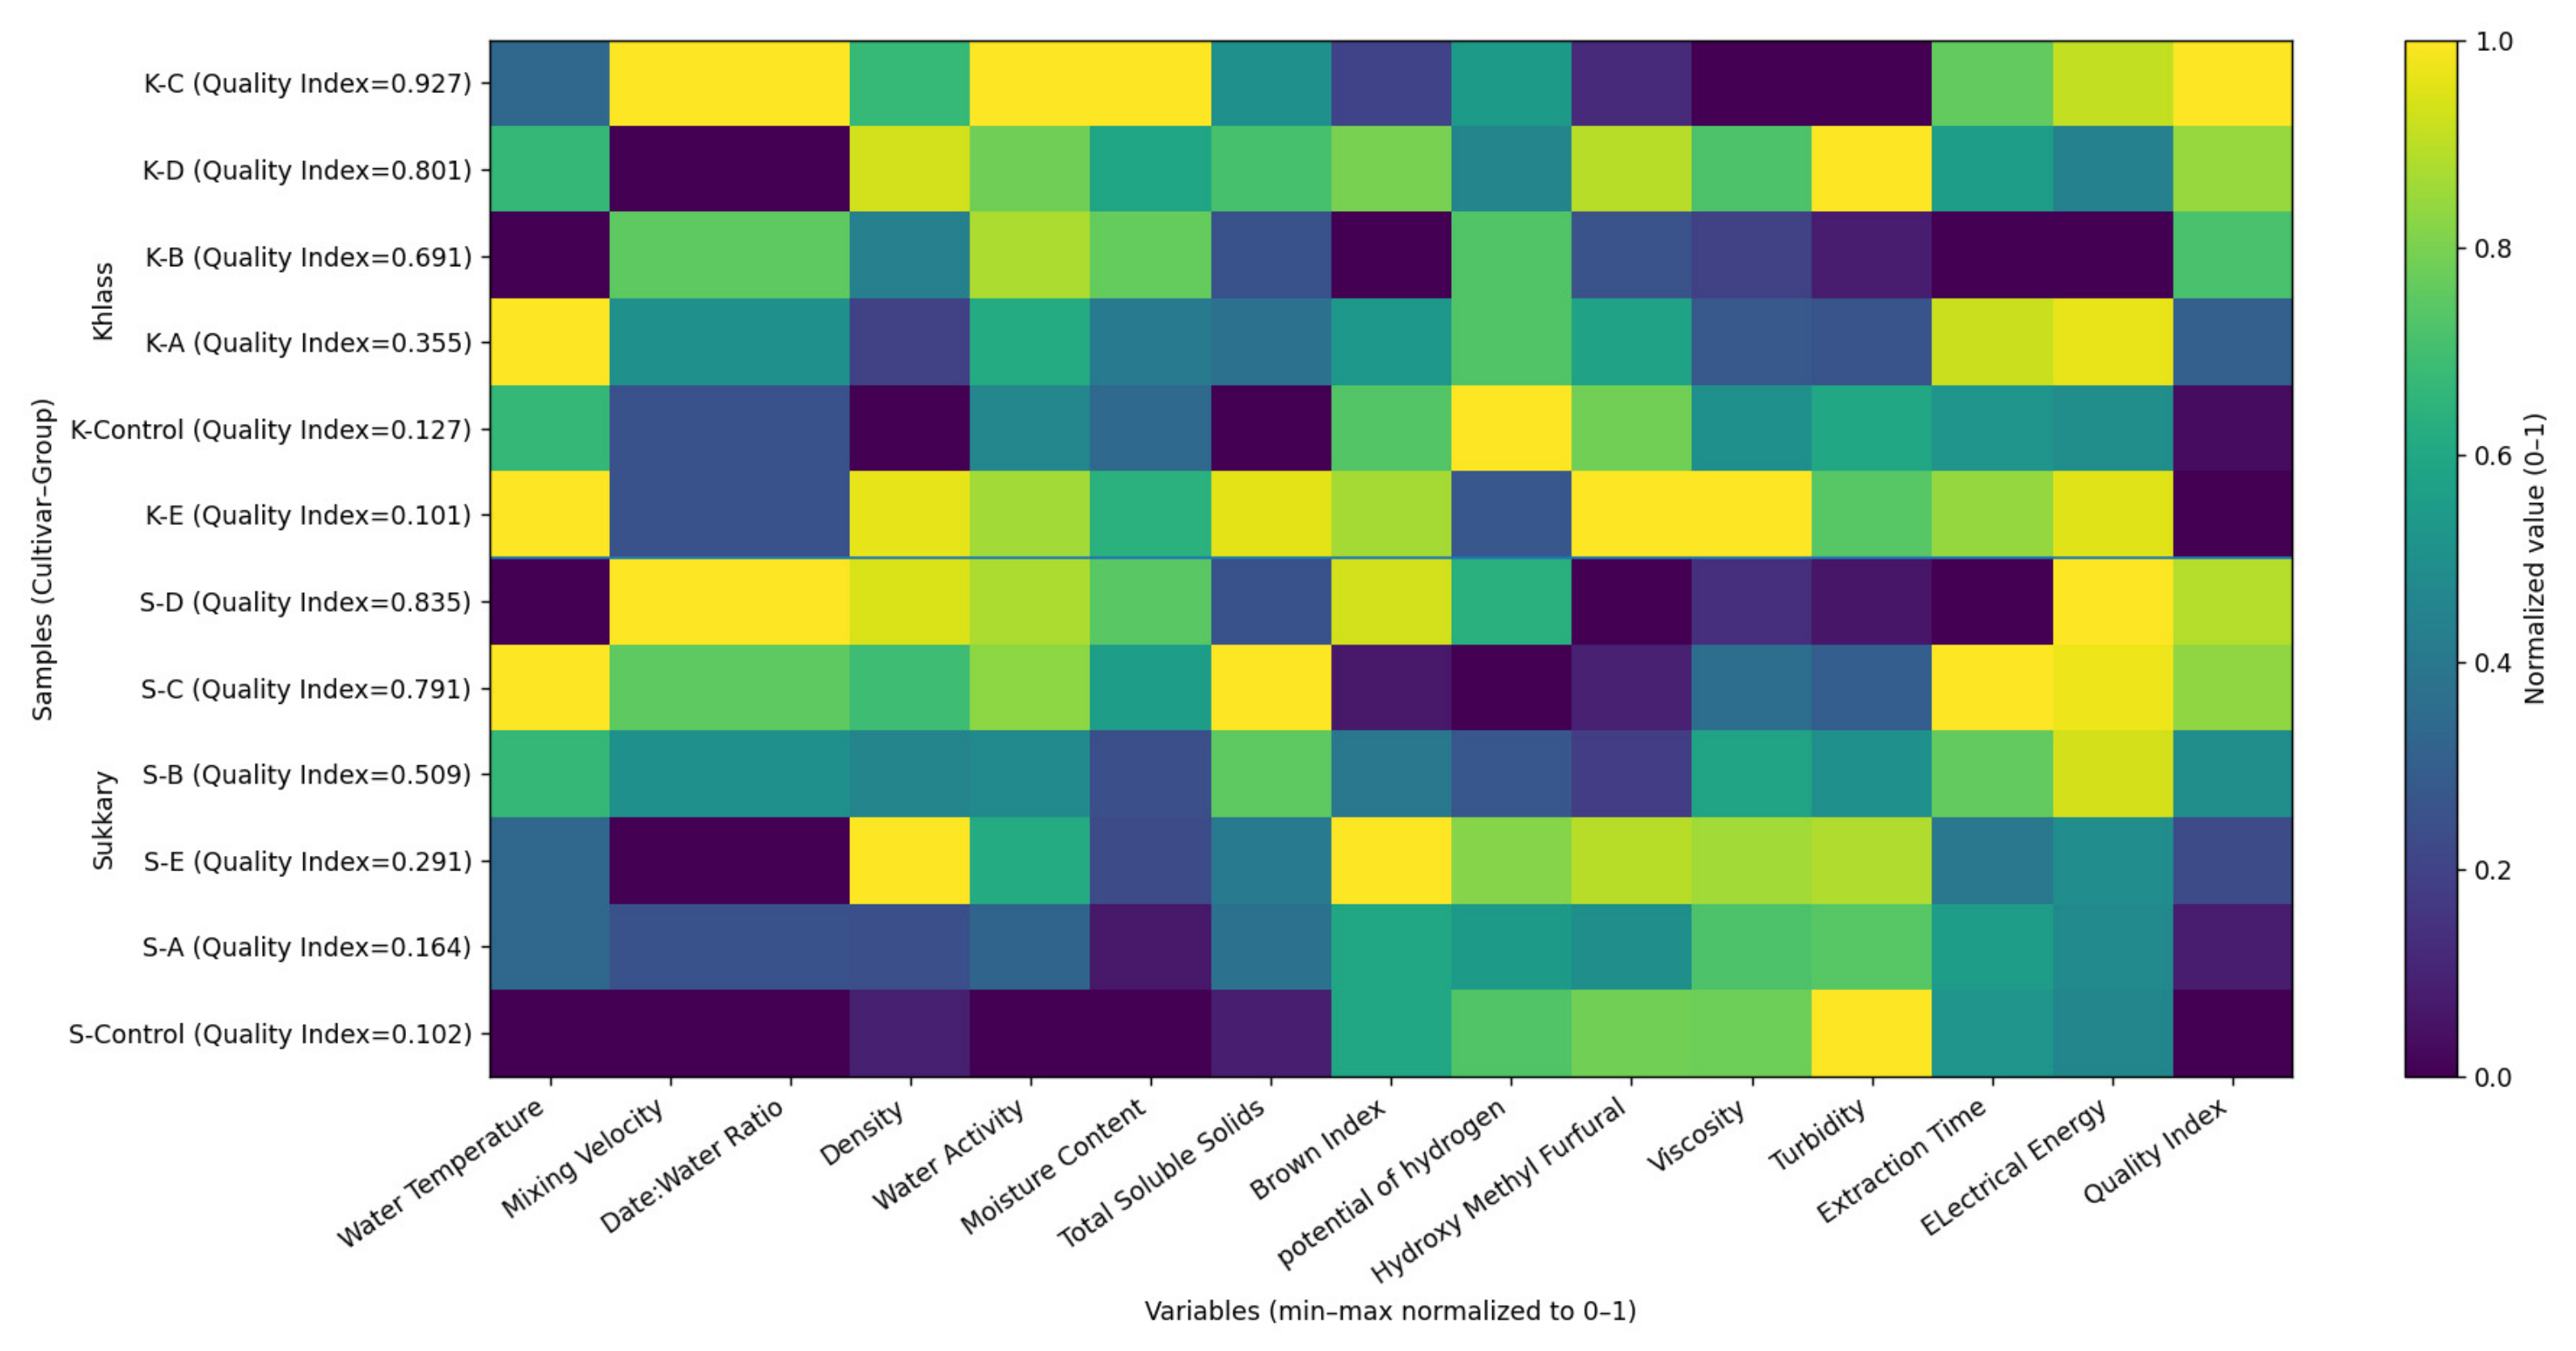
Table 2 summarizes the physicochemical properties of fresh Sukkary and Khlass date fruits, while Table 3 presents representative datasets for the corresponding DJs produced under selected operational conditions, also the same Figure 6 presents a heatmap of normalized physicochemical properties of fresh Sukkary and Khlass date fruits across moisture-content groups, and Figure 7 presents a heatmap of min–max normalized processing conditions and physicochemical properties for Sukkary and Khlass date juices.
These tables and figures provide an analytical representation of a much larger experimental database generated throughout the project. For the fruits, the reported variables (mass, density, moisture content on a dry basis, aw, TSS, BI, ΔE, pH, and hardness) capture the key attributes that define technological behavior during processing and that were later used as inputs to the quality-index (Qi) models. For the juices, the selected datasets include core physicochemical indicators such as °Brix, pH, density, viscosity, turbidity, color coordinates, HMF, and, where relevant, energy consumption and extraction time under defined combinations of extraction temperature, mixing velocity, and date-to-water ratio. Only a small, representative portion of the full “big data” dataset is presented in these tables. The selected rows were chosen to (i) capture the main range and contrasts in the experiments and (ii) emphasize the key variables that sensitivity analysis and ANN connection-weight results identified as having the strongest influence on the Quality Index (Qi). Moisture content and water activity of the raw fruits, as well as °Brix, viscosity, turbidity, and HMF in the juices, emerged as dominant drivers of the composite quality index, reflecting their combined impact on sweetness perception, mouthfeel, color development, and shelf-life stability. The complete dataset, spanning hundreds of fruit and juice measurements across cultivars and processing settings, was used to train, test, and validate the ANN models; the condensed examples in Table 2 and Table 3 therefore serve as an interpretable bridge between the raw experimental measurements and the data-driven modeling framework, demonstrating how systematic variation in physicochemical properties translates into quantifiable changes in Qi.
The observed effects of extraction temperature, mixing intensity, and date-to-water ratio on Qi can be interpreted in terms of coupled heat and mass transfer mechanisms and thermal degradation kinetics. Increasing temperature and agitation enhance solute diffusion and tissue softening, promoting the release of soluble solids and improving °Brix; however, excessive thermal input accelerates non-enzymatic browning pathways and the formation of HMF, which can adversely affect color, flavor, and overall quality. Likewise, the date-to-water ratio governs viscosity and suspended solids loading, influencing hydrodynamics, filtration behavior, and energy demand. The identified intermediate operating window, therefore, reflects a practical balance between extraction efficiency (mass transfer) and controlled thermal load, yielding improved quality while limiting markers of chemical deterioration, such as HMF and excessive browning.
Table 2 indicates that the physicochemical profiles of fresh Sukkary and Khlass dates vary systematically across moisture groups. Moisture content increased across groups, reaching 27.343% for Sukkary (Group E) and 38.697% for Khlass (Group E), accompanied by a strong rise in water activity (aw) from 0.196 (Sukkary control) to 0.992 (Khlass Group E), consistent with moisture aw coupling reported during maturation and postharvest handling [103,104]. Density increased overall with moisture (0.479–1.387 g/cm3), consistent with moisture-related tissue softening and swelling effects [105]. In contrast, TSS varied only narrowly (≈70.587–72.882 °Brix), suggesting that group separation is driven more strongly by water status (MC and aw) than by large shifts in soluble solids [7,106]. Browning Index (BI) showed cultivar-dependent behavior, with Sukkary peaking at 103.961 (Group A) while Khlass declined to 48.040 (Group E), reflecting varietal differences in browning susceptibility [51,107]. pH remained near-neutral (6.999–7.608), within a range influenced by cultivar and growing conditions [108]. HMF increased with higher moisture groups, reaching 2.93 mg/100 g in Khlass Group E, consistent with non-enzymatic browning and postharvest quality deterioration pathways [109,110]. Figure 6 (min–max heatmap) summarizes these trends, highlighting MC/aw as the dominant discriminators, with BI and HMF serving as complementary deterioration markers that justify their inclusion as key modeling inputs.
Table 3 shows that date-juice composition was strongly governed by operational settings (temperature, mixing, and date-to-water ratio), with water addition driving a clear dilution effect: higher moisture content and aw coincided with lower °Brix. For Sukkary, juice moisture increased from 64.65% (16 °Brix; control, 20 °C, 1:1) to 84.281% (18 °Brix; Group D, 20 °C, 1:3), while Khlass reached 90.969% (21 °Brix; Group C, 40 °C, 1:3) with high aw (0.997) and comparatively lower density (1.094 g/cm3), consistent with published dilution and thermomechanical extraction behavior [111,112,113]. Juice pH shifted to mildly acidic values (5.5–6.3), likely due to aqueous extraction of organic acids/phenolics and heat-assisted solubilization relative to the near-neutral fruit matrix [108]. Qi was highly responsive to operating conditions (0.101–1.000), enabling ranking of process “recipes”: Sukkary achieved high Qi under lower thermal exposure coupled with stronger agitation (e.g., Group D: 20 °C, 50% mixing, 1:3; Qi = 0.835), whereas Khlass achieved its maximum under moderate heating and dilution (Group C: 40 °C, 50% mixing, 1:3; Qi = 0.927), supporting cultivar-specific optimization rather than a single universal optimum. The heatmap in Figure 7 confirms that high-Qi runs reflect a balance between extraction efficiency (TSS) and containment of deterioration markers (BI/HMF), reinforcing the need for nonlinear modeling to capture these coupled interactions and to identify robust operating windows [105,108,114,115,116,117,118,119].

4.4. Descriptive Statistics of the ANN Model Dataset of the Date Juice

Table 4 summarizes the descriptive statistics of the input variables and the output response used to build the ANN models across the training, testing, and validation phases. For each variable, the table reports the mean (central tendency), minimum–maximum range (operating envelope), standard deviation (dispersion), skewness (distributional asymmetry), and kurtosis (peakedness/tailedness). Collectively, these descriptors confirm that the dataset spans a broad, process-relevant space and is therefore suitable for data-driven learning under heterogeneous operating conditions (temperature, mixing speed, and date-to-water ratio).
Across the experimental database, density (ρ), water activity (aw), initial fruit moisture content (MC fruit, d.b.), juice moisture content (MC juice), TSS (°Brix), pH, and HMF exhibited distinct degrees of variability and non-normality, reflecting both the diversity of processing settings and cultivar-specific responses (Sukkary vs. Khlass). For example, MC juice ranged from 64.65% to 90.97% (mean 77.11%), indicating substantial differences in concentration driven by thermal extraction severity and dilution ratios, consistent with prior reports showing that higher extraction temperatures and water ratios increase moisture retention in juices [111,113]. In contrast, TSS showed a comparatively narrower central tendency (mean ≈ 20.31 °Brix), consistent with the balance between solute release and dilution during processing and in agreement with the typical “controlled extraction” window of ~18–27 °Brix reported for date-derived juices [112]. HMF spanned ~0.25–2.49 mg/100 g with a positively skewed distribution, suggesting that a limited subset of samples experienced amplified thermal degradation, particularly under more severe thermal exposure (≥80 °C), which aligns with the established role of HMF as a heat-load marker in fruit-based matrices [120,121,122,123].
Importantly, Table 4 also shows that Qi is not uniformly “low”: it remains moderate in training/testing (means ≈ 0.55) but decreases in the validation subset (mean ≈ 0.305; range 0.101–0.509). The validation subset was selected to ensure a balanced representation of both cultivars (Sukkary and Khlass) and the full range of operating conditions, thereby providing an unbiased assessment of the model’s generalization to unseen data.
This pattern is technically expected when Qi is formulated as a normalized composite index that aggregates multiple attributes (e.g., pH, TSS, BI, HMF) and penalizes deterioration markers such as BI and HMF; under such formulations, modest increases in one or two “risk” variables can drive a disproportionate decline in the integrated score. The lower validation Qi is also consistent with a shift toward more concentrated and potentially more thermally loaded samples (e.g., higher mean TSS in validation), which would promote BI/HMF formation and compress normalized Qi under strict target-based scaling. Therefore, interpretation should explicitly confirm the directionality (higher Qi = higher quality) and verify that the normalization targets and weights reflect realistic product specifications rather than overly narrow “ideal” setpoints.
Finally, the apparent mass-balance asymmetry, with higher removal of insoluble material (~5%) than sugar losses (~1.5%), is consistent with the separation physics of date juice processing. Insoluble fractions (fiber, peel particles, cell wall polysaccharides, colloids, and suspended browning polymers) are preferentially retained by screening/pulp separation and pressurized filtration, whereas sugars remain dissolved and pass through filter media; hence, sugar “losses” are typically limited to liquid holdup in the filter cake, minor adsorption, and basis/normalization effects. Moreover, stronger heating and agitation can increase insoluble loading by intensifying tissue disruption and pectin/colloid release, thereby increasing the amount of solids captured, while soluble sugars remain predominantly in the serum phase.
Overall, the descriptive statistics confirm the suitability of the selected input features for ANN modeling, as they encompass both high- and low-quality juice scenarios under varied processing conditions. The data exhibit distributions and relationships consistent with trends in the literature, affirming their validity for predictive modeling.

4.5. Artificial Neural Network (ANN) Performance

4.5.1. ANN Evaluation

Table 5 illustrates the statistical performance of various ANN models developed to predict the Quality Index (Qi) of DJ samples using physicochemical input parameters. The network architectures were evaluated using a hyperbolic tangent (Tanh) activation function, and the number of hidden nodes varied from 2 to 25. The evaluation metrics included average squared error (ASE), coefficient of determination (R2), root mean square error (RMSE), mean absolute error (MAE), mean absolute relative error (MARE), relative error (RE), efficiency coefficient (E), coefficient of residual mass (CRM), overall index (OI), absolute average deviation (AAD), and mean absolute percentage error (MAPE).
The results demonstrate that the ANN architecture with 15 hidden nodes outperformed all other configurations and was therefore selected as the optimal model. This architecture achieved the lowest error metrics, including ASE (0.009), RMSE (0.090), MAE (0.070), MARE (4.400), RE (2.700), AAD (3.100%), and MAPE (3.500%). Simultaneously, it achieved the highest performance indices: R2 = 0.990, E = 0.980, OI = 0.960, and CRM = 0.010, indicating minimal prediction bias and superior model efficiency.
In comparison, ANN architectures with fewer than 10 hidden nodes showed relatively lower predictive accuracy (R2 ≤ 0.971, RMSE ≥ 0.116, MAPE ≥ 4.4%), while increasing the number of hidden nodes beyond 15 did not yield further improvements and, in some cases, slightly degraded performance. These findings suggest that the 15-node configuration offers the best trade-off between model complexity and generalization, avoiding overfitting while achieving robust predictive performance.
These results align with prior applications of ANN modeling in food processing, in selecting the optimal hidden node that plays a crucial role in minimizing prediction error and maximizing reliability in quality prediction models [39]. Moreover, the high R2 value and low MAPE achieved in this study reinforce the potential of ANN-based approaches for accurate, non-destructive quality evaluation of juice production and processing in the food industry.

4.5.2. Neural Network Weights, Prediction Function, and Interpretation

The trained values of connection weights and biases for the optimal artificial neural network (ANN) architecture (7–15–1) are presented in Table 6. This configuration, comprising seven input neurons, fifteen hidden neurons, and a single output neuron, yielded the best predictive performance for the DJ quality index (Qi). As previously illustrated in Table 5, this structure achieved superior accuracy metrics, with the highest coefficient of determination (R2 = 0.990) and the lowest error indicators (ASE = 0.009, RMSE = 0.090, MAE = 0.070, MAPE = 3.500).
Each hidden neuron receives weighted contributions from the seven physicochemical inputs: Density, aw, MC, TSS, BI, pH, and HMF through the trained connection weights. The hidden neurons are then activated via the hyperbolic tangent (tanh) transfer function. Subsequently, the output layer aggregates the activations from the Hidden layer using corresponding output weights and a final bias term to produce the normalized Qi prediction.
The trained ANN formulation can be implemented in common computational platforms (Microsoft Excel, Python, or Visual Basic-based interfaces), enabling real-time, non-destructive estimation of date-juice quality (Qi) directly from the routinely measured input variables.

4.5.3. Quality Index (Qi) Prediction Function

Final Prediction Matrix Equation of Qi (for ANN: 7–15–1): The complete matrix-based formulation of the neural network model with 15 hidden neurons can be expressed as follows:
The input vector can be:
X = [Density; Water Activity; Moisture Content; TSS; BI; pH; HMF]
The input-to-hidden weight matrix w i n 7 × 15 can be:
Win = [0.884, −0.688, −0.688, 0.197, 0.464, 0.901, 0.251; 0.575, −0.665, 0.940, 0.959, −0.416,
0.202, 0.732; 0.511, 0.224, 0.418, −0.136, 0.050, 0.392, −0.063; 0.028, 0.601, −0.570, 0.088,
−0.267, 0.416, −0.721; 0.931, 0.898, 0.870, −0.659, 0.215, 0.907, −0.185; 0.010, −0.756,
−0.120, 0.368, 0.805, 0.391, −0.617; 0.093, 0.040, 0.377, −0.325, 0.482, −0.819, −0.931;
0.859, 0.844, 0.196, 0.790, 0.550, 0.939, 0.630; 0.616, 0.657, 0.457, −0.223, 0.369, 0.308,
−0.823; 0.221, 0.974, 0.851, −0.246, −0.191, 0.536, −0.486; 0.543, 0.458, 0.414, 0.631, 0.898,
−0.603, −0.286; 0.873, −0.338, −0.247, 0.726, 0.768, −0.283, −0.852; 0.627, −0.761, −0.056,
0.174, 0.459, 0.345, −0.378; 0.785, 0.145, −0.045, 0.524, 0.193, 0.522, 0.426; 0.815, 0.017,
0.371, −0.273, 0.937, −0.784, −0.949]
The hidden biases vector b h 1 × 15 can be:
bh = [−0.354; 0.792; −0.364; −0.780; −0.544; −0.146; −0.636; 0.721; −0.986; 0.201; −0.165;
−0.556; −0.670; −0.325; 0.866]
The output weight vector w o u t 15 × 1 , and output bias b 0 can be:
b o =   0.0 ,   [ 0.721 ,   0.636 ,   0.146 ,   0.544 ,   0.780 ,   0.364 ,   0.792 ,   0.615 ;   0.866 ,   0.325 ,   0.670 ,   0.556 ,   0.165 ,   0.201 ,   0.986 ] =   _ { o u t } \ m a t h b f { W }
Finally, the prediction function of the quality index is expressed by the following analytical formulation, based on the trained (7–15–1) neural network model:
Qi prediction before de-normalization:
Q i ^ = b   +   j = 1 15 W j   ×   t a n h i = 1 7 W j i   ×   x i   +   b j
where:
x i : Input Variables.
W j i : weight from input node i to hidden neuron j.
b j : bias of a hidden neuron j.
W j : weight from hidden neuron j to output b.
b j : bias of a hidden neuron j.
b : output layer bias.
Q i ^ : normalized predicted Qi.
Since the model was trained on normalized outputs within the range [0.15, 0.85], the real value of the predicted quality index (Qi) can be retrieved by applying the following de-normalization equation:
Q i = Q i m i n   +   Q i m a x       Q i m i n     ×   Q i ^
where:
Q i m i n = 0.101.
Q i m a x = 0.927.
Q i ^ = Normalized predicted output.
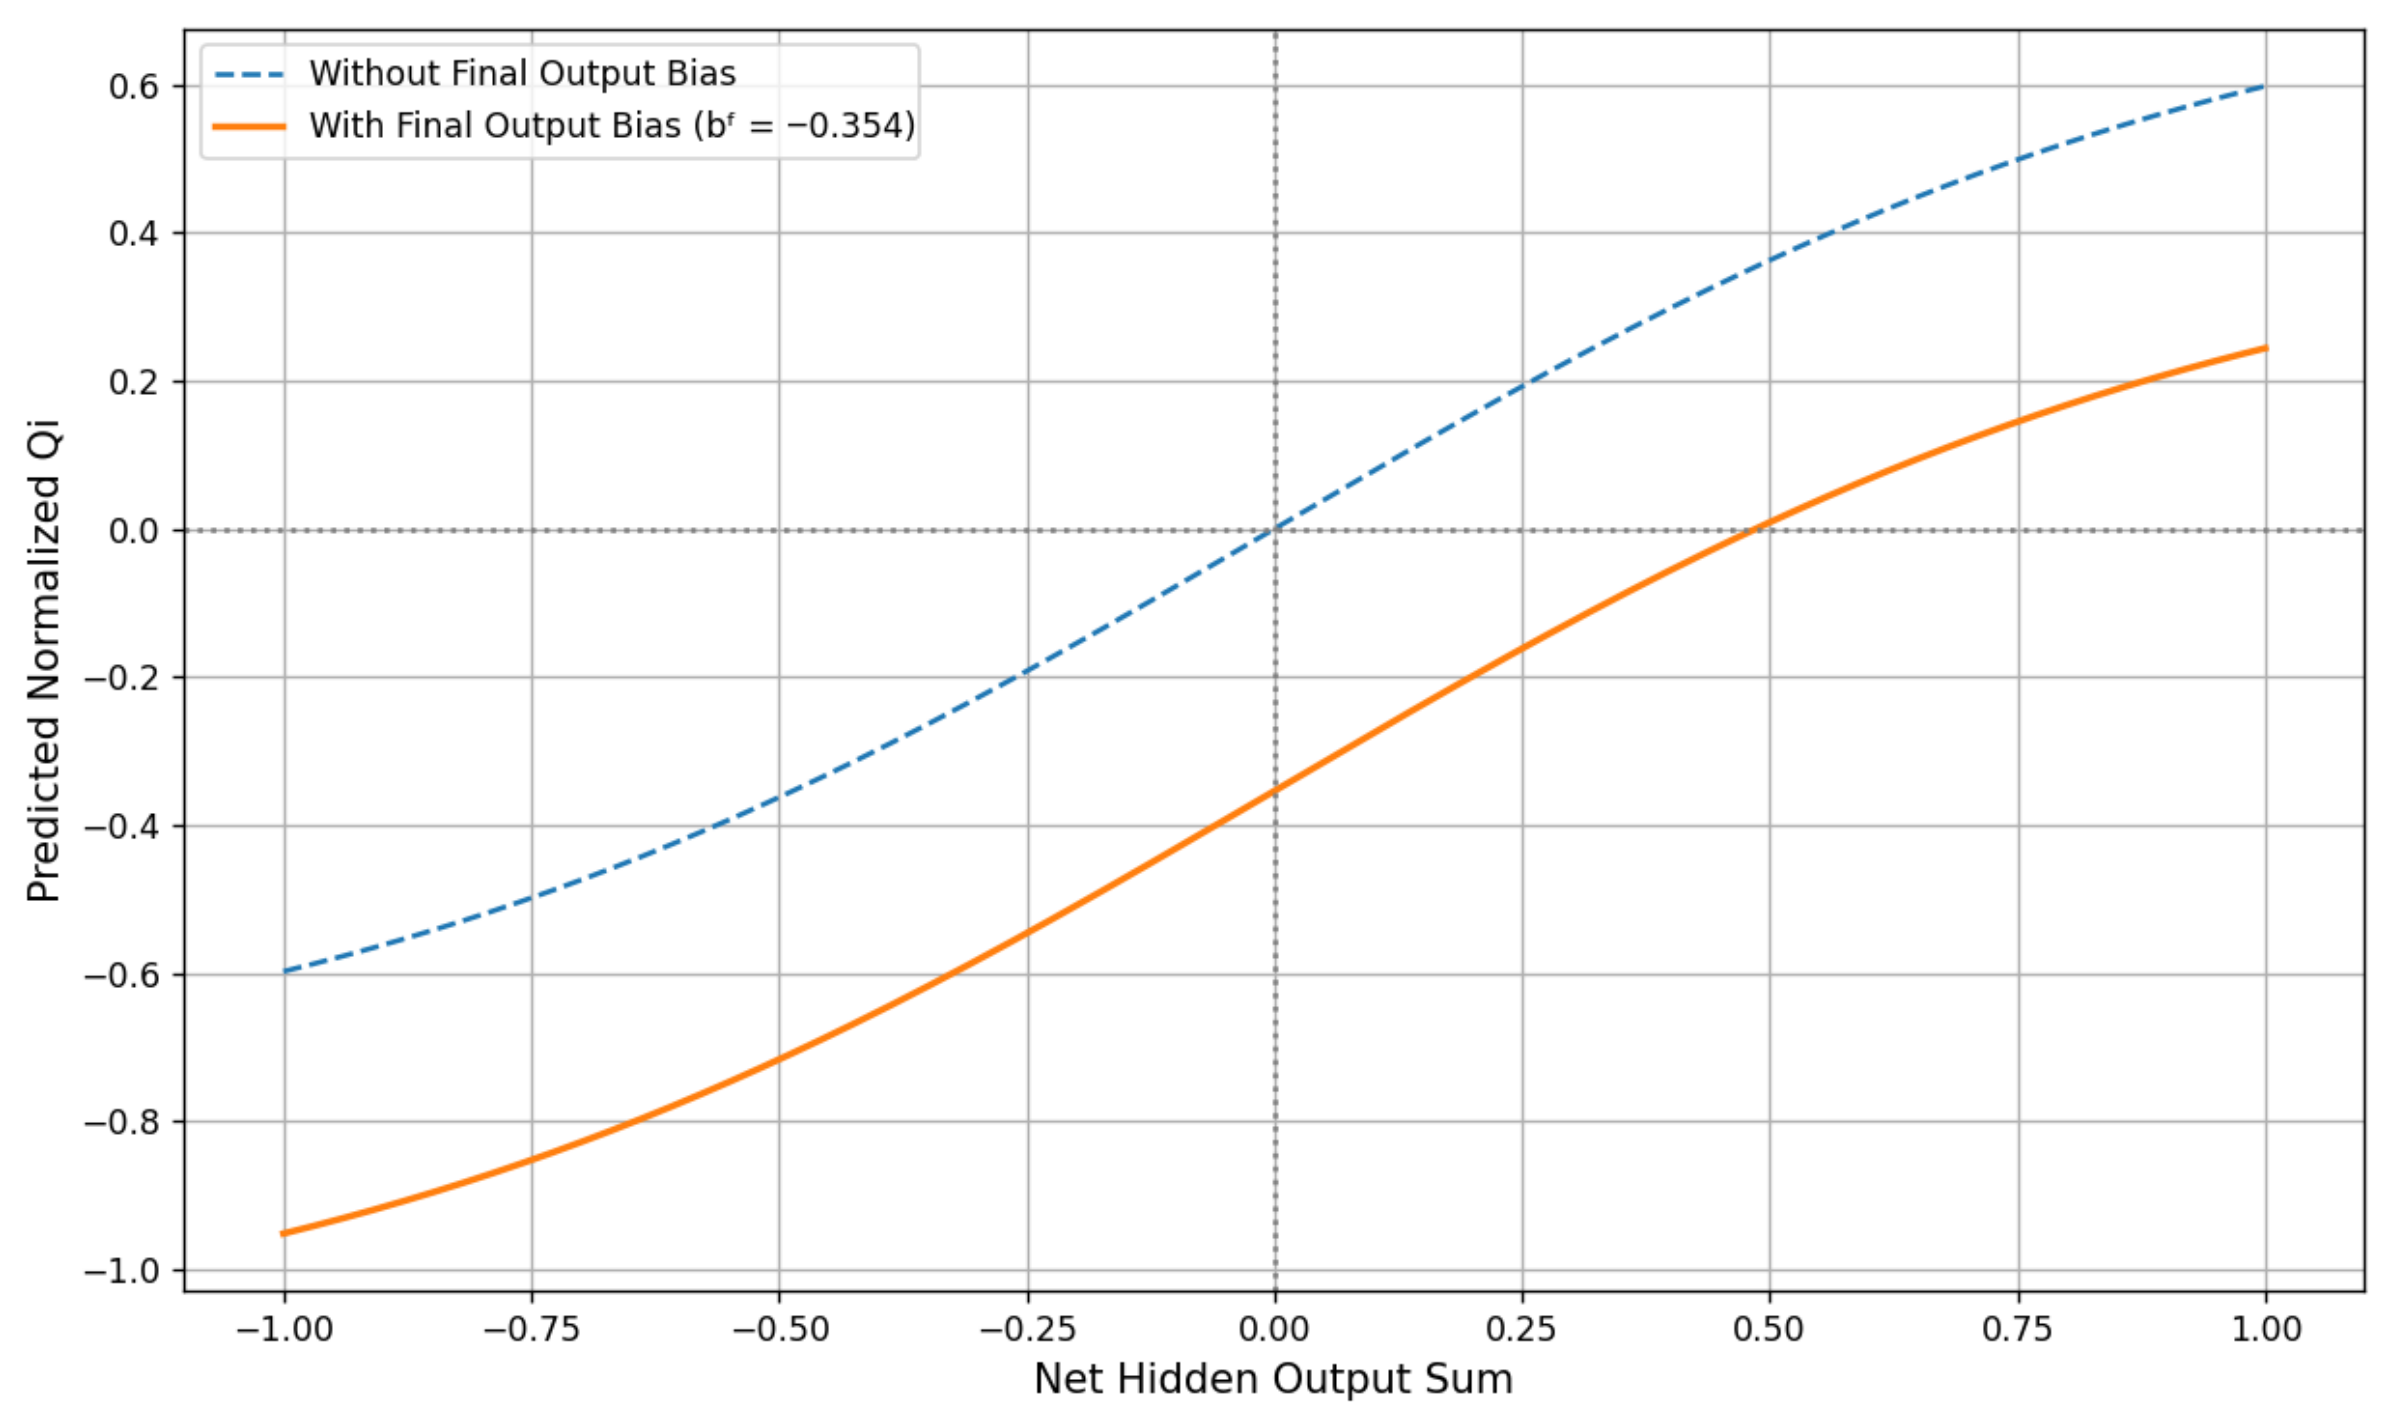
Figure 8 demonstrates the effect of introducing a final output bias of −0.354 into the ANN model’s output layer. This bias shifts the prediction curve downward, effectively centering the normalized output range closer to the empirical distribution of Quality Index (Qi) values observed during training. Without the bias adjustment (dashed curve), the output tends to overestimate Qi, especially for samples with lower actual values. With the bias applied (solid curve), the model compensates for this overestimation, yielding improved alignment with the target data range. This adjustment is essential in models that utilize the hyperbolic tangent (tanh) activation function, which produces symmetric outputs centered around zero. The inclusion of bias enhances prediction reliability, minimizes systematic error, and ensures better generalization in practical applications such as juice quality assessment and grading.

4.5.4. Training Process

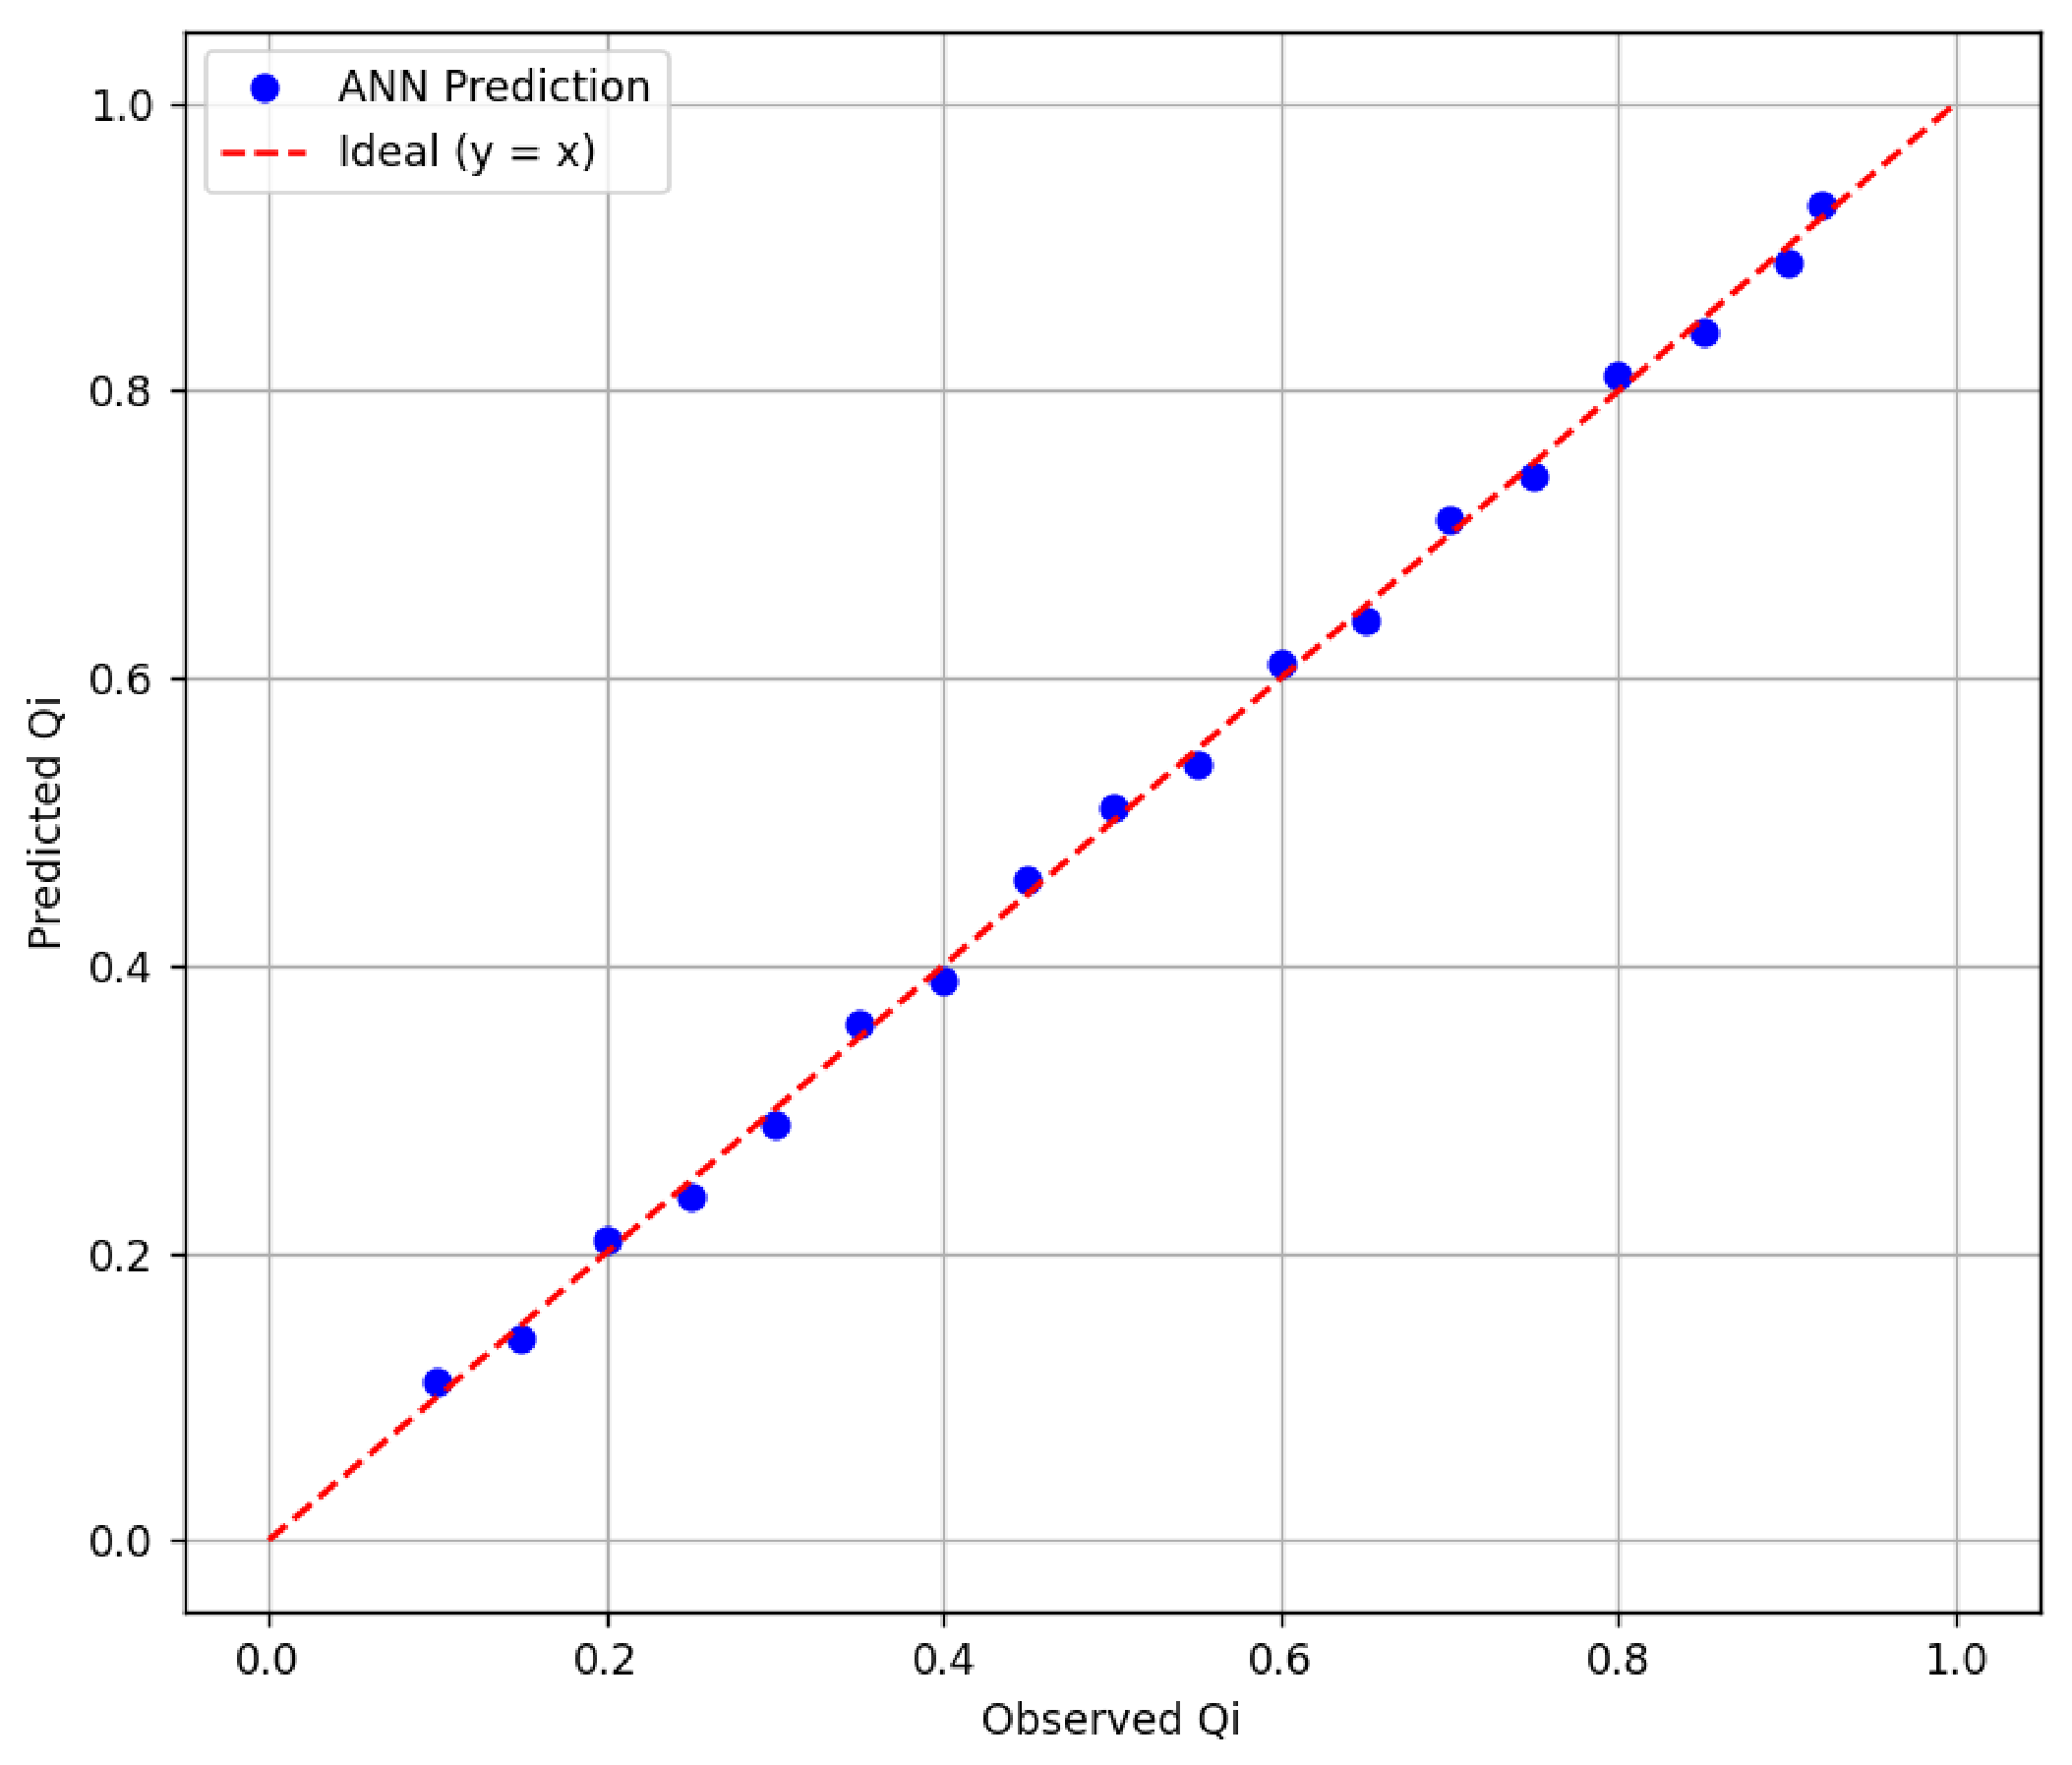
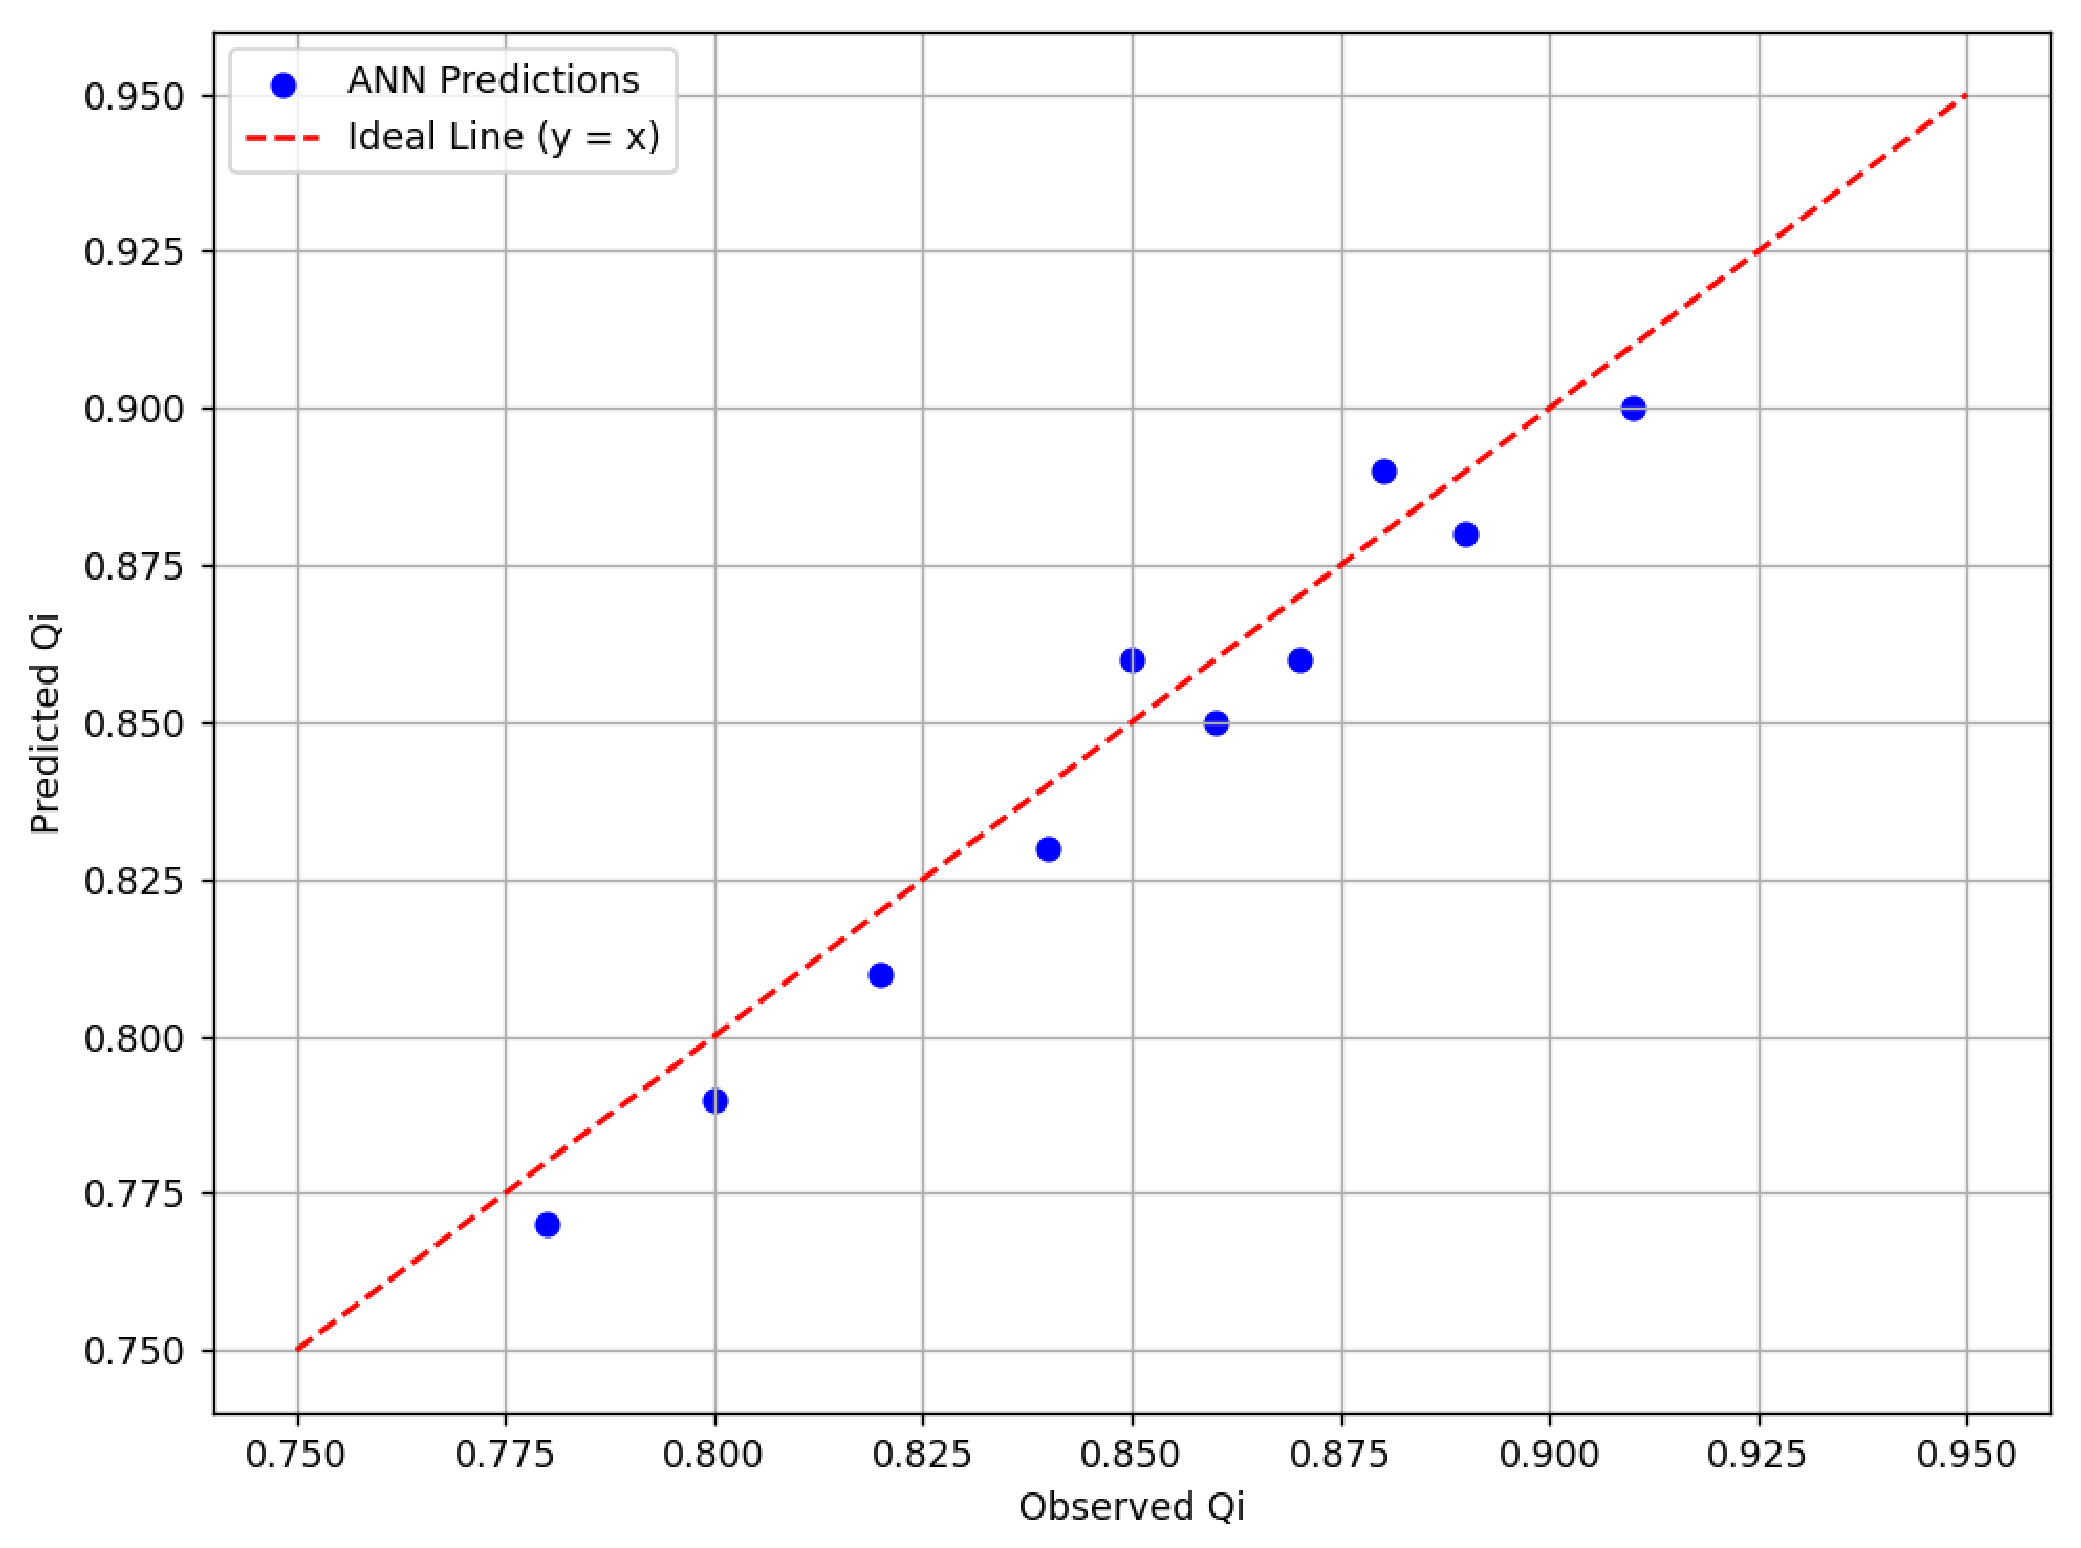
Figure 9 illustrates the regression fit between the observed and predicted Quality Index (Qi) values using the optimal ANN model (7–15–1 architecture). The blue dots represent the ANN-predicted Qi values, while the dashed red line (y = x) indicates the ideal perfect agreement line. The close alignment of data points along the ideal line demonstrates the high predictive capability and reliability of the developed model, confirming its robustness in capturing the nonlinear relationships among the input physicochemical parameters of DJ.

4.5.5. Testing Process

Figure 10 illustrates the correlation between the observed and predicted Quality Index (Qi) values for DJs during the ANN model’s testing phase. The scatter points closely follow the reference line (y = x), indicating a strong agreement and high prediction accuracy. The minimal deviation from the ideal line suggests that the model generalizes well to unseen data, confirming its robustness and reliability. This performance further validates the selection of the ANN (7–15–1) architecture and the appropriateness of the input parameters. Such outcomes are consistent with findings reported by [114] where similar architectures demonstrated high predictive power in food-quality assessment applications.

4.5.6. Validation Process

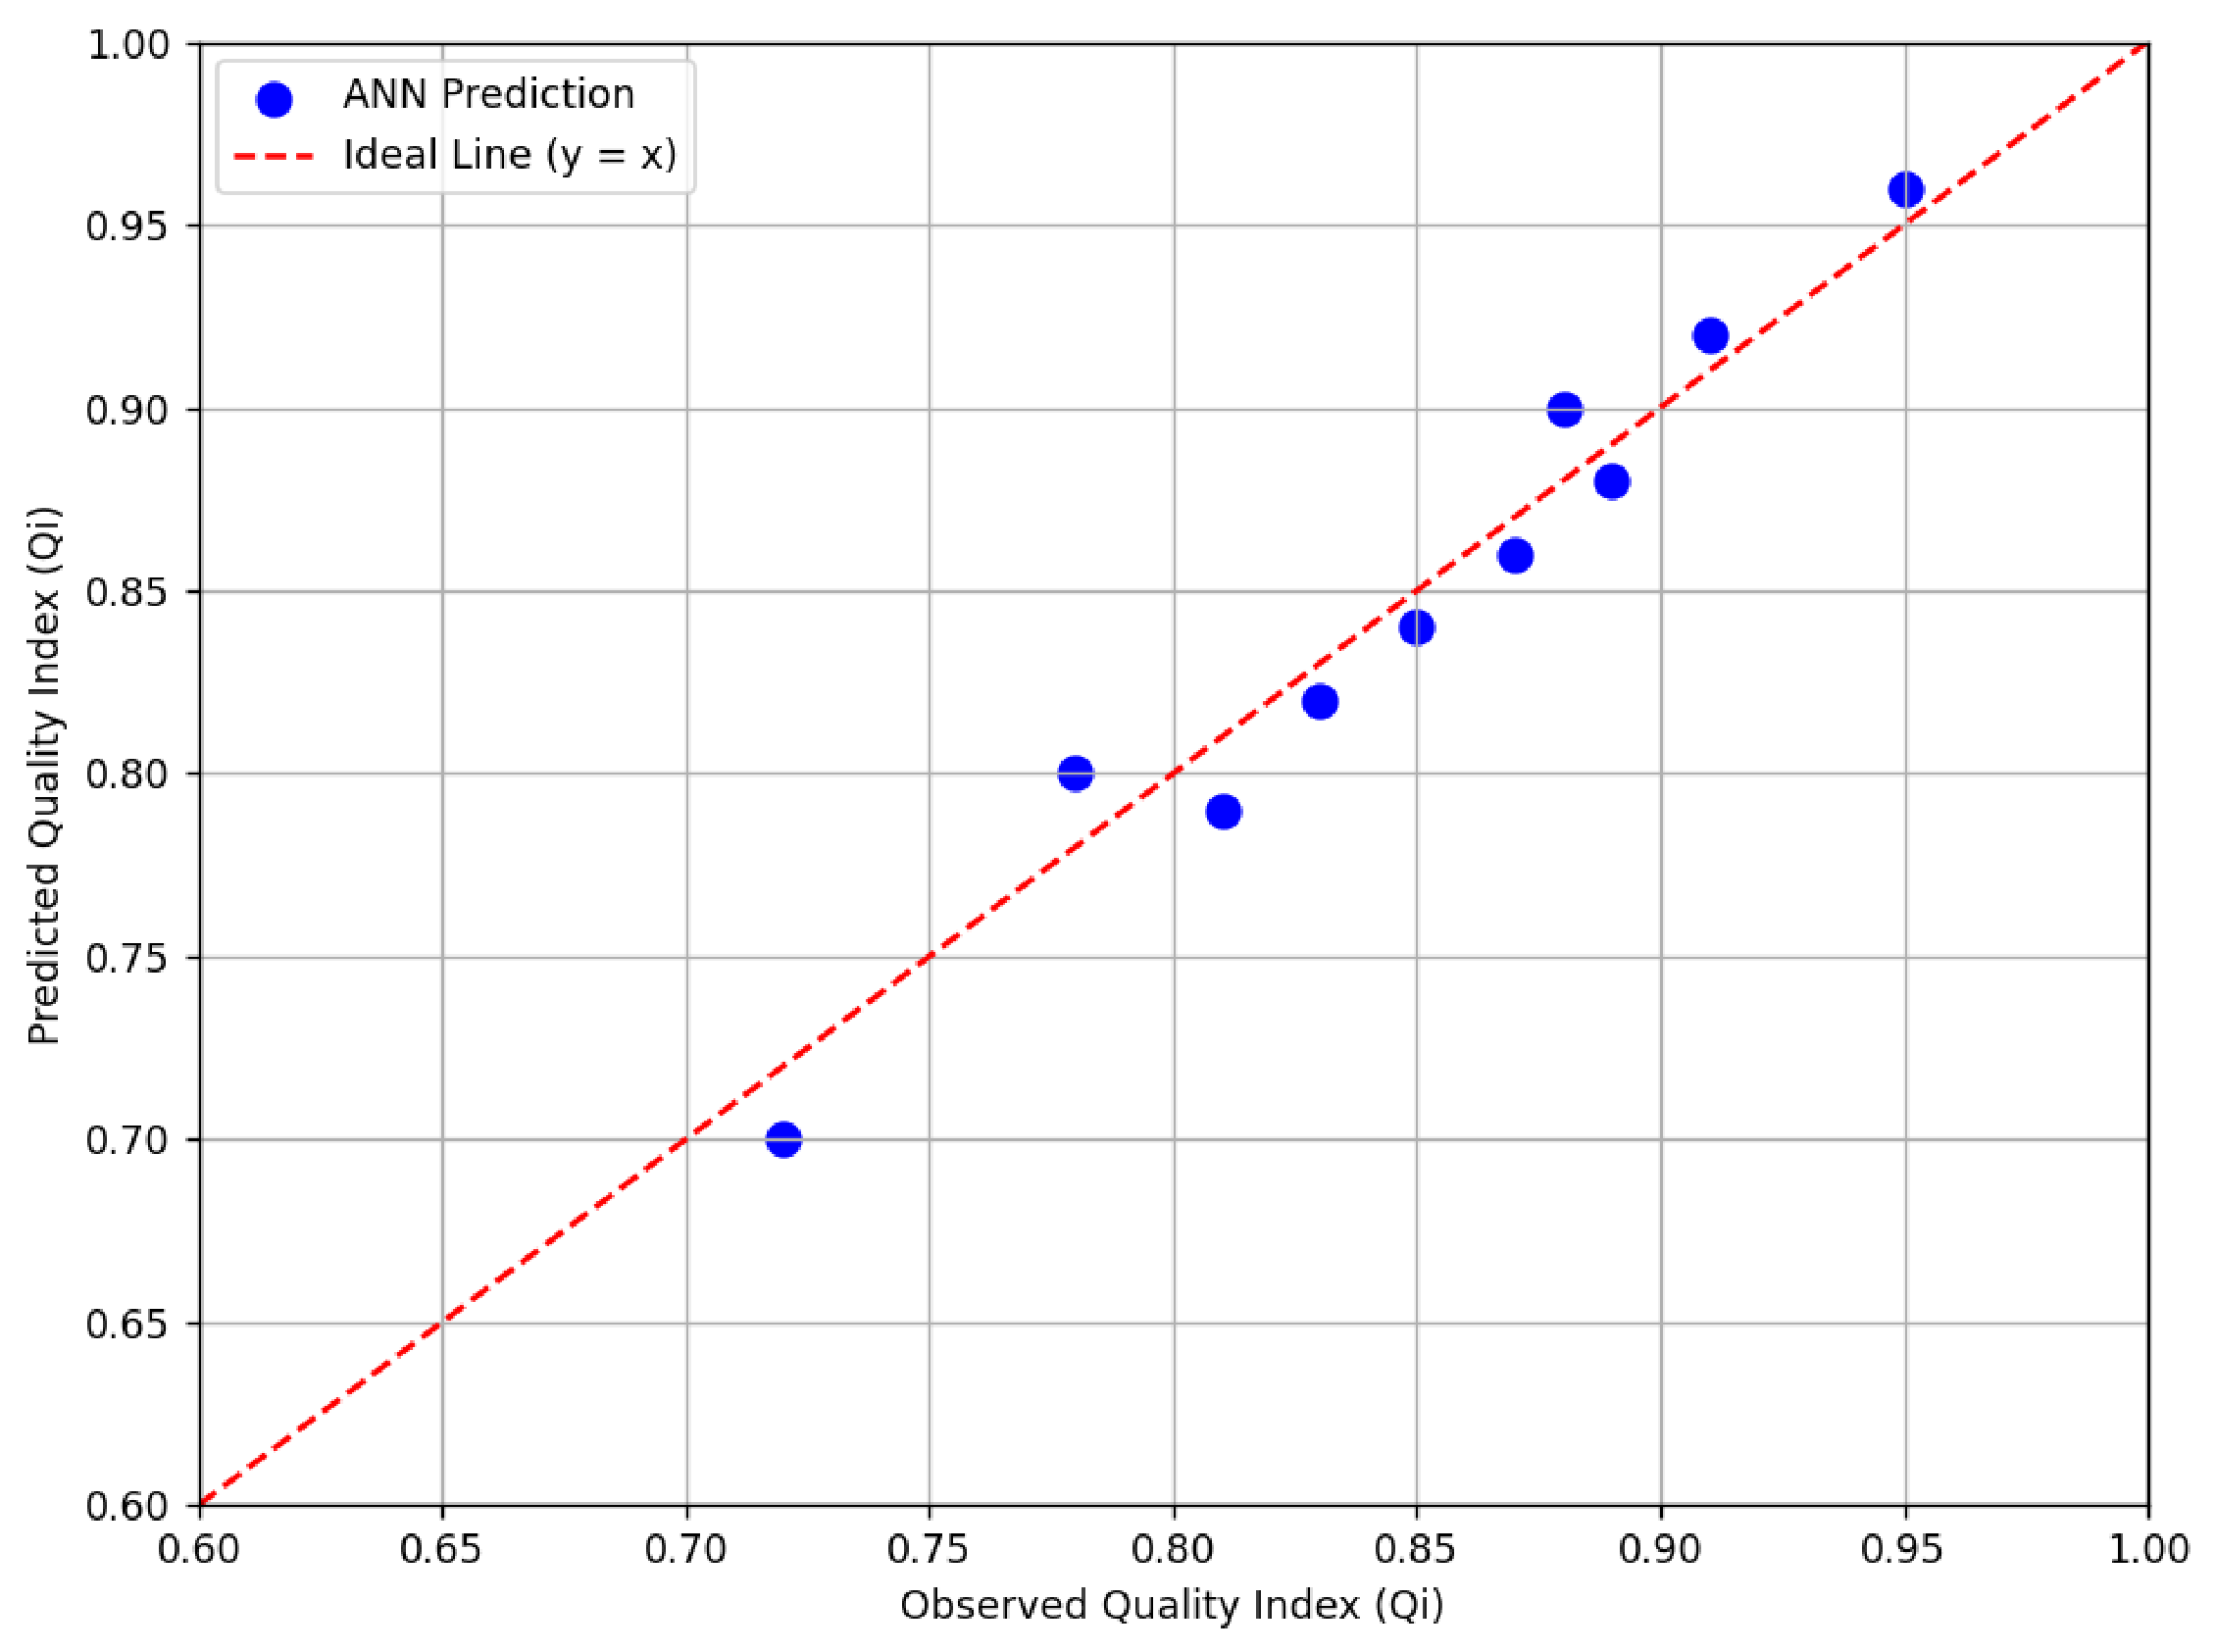
Figure 11 illustrates the predictive capability of the developed ANN model during the validation stage by comparing observed Qi values with the corresponding predicted outputs. The data points cluster closely around the ideal line (y = x), indicating strong agreement between experimental and model-predicted values. This alignment suggests that the trained ANN model generalizes well to unseen data, confirming its robustness and reliability. The consistency of prediction accuracy during validation reinforces the model’s suitability for real-time juice quality assessment and optimization in industrial applications.
Table 7 presents the statistical evaluation metrics of the developed artificial neural network (ANN) model for predicting the Quality Index (Qi) of date juice samples during the training, testing, and validation phases. The model architecture (7–15–1) consistently achieved high predictive performance across all stages, reflecting its robustness and generalization capability.
During the training phase, the ANN model demonstrated excellent accuracy, with a very low Average Squared Error (ASE = 0.009), a high coefficient of determination (R2 = 0.990), and a minimal root mean square error (RMSE = 0.090). These results confirm that the network was effectively trained to capture the complex nonlinear relationships between the input variables (physicochemical properties) and the target output (Qi).
In the testing phase, the model maintained strong predictive performance, with R2 = 0.976 and RMSE = 0.113, indicating that overfitting was avoided. Similarly, the validation phase yielded an R2 of 0.971 and RMSE of 0.116, confirming the model’s reliability in estimating unseen data.
Other metrics, such as the mean absolute error (MAE), mean absolute relative error (MARE), and mean absolute percentage error (MAPE), were also within acceptable ranges in all stages. The efficiency index (E) exceeded 0.940 for all stages, while the correlation of residual mean (CRM) values remained close to zero, suggesting minimal bias in predictions. Moreover, the overall index (OI) of model performance remained above 0.930, further supporting the robustness of the ANN model.
These results confirm the ANN model’s suitability as a non-destructive, highly reliable tool for predicting the juice quality index from physicochemical parameters, aligning well with previous findings in AI-based food quality modeling.
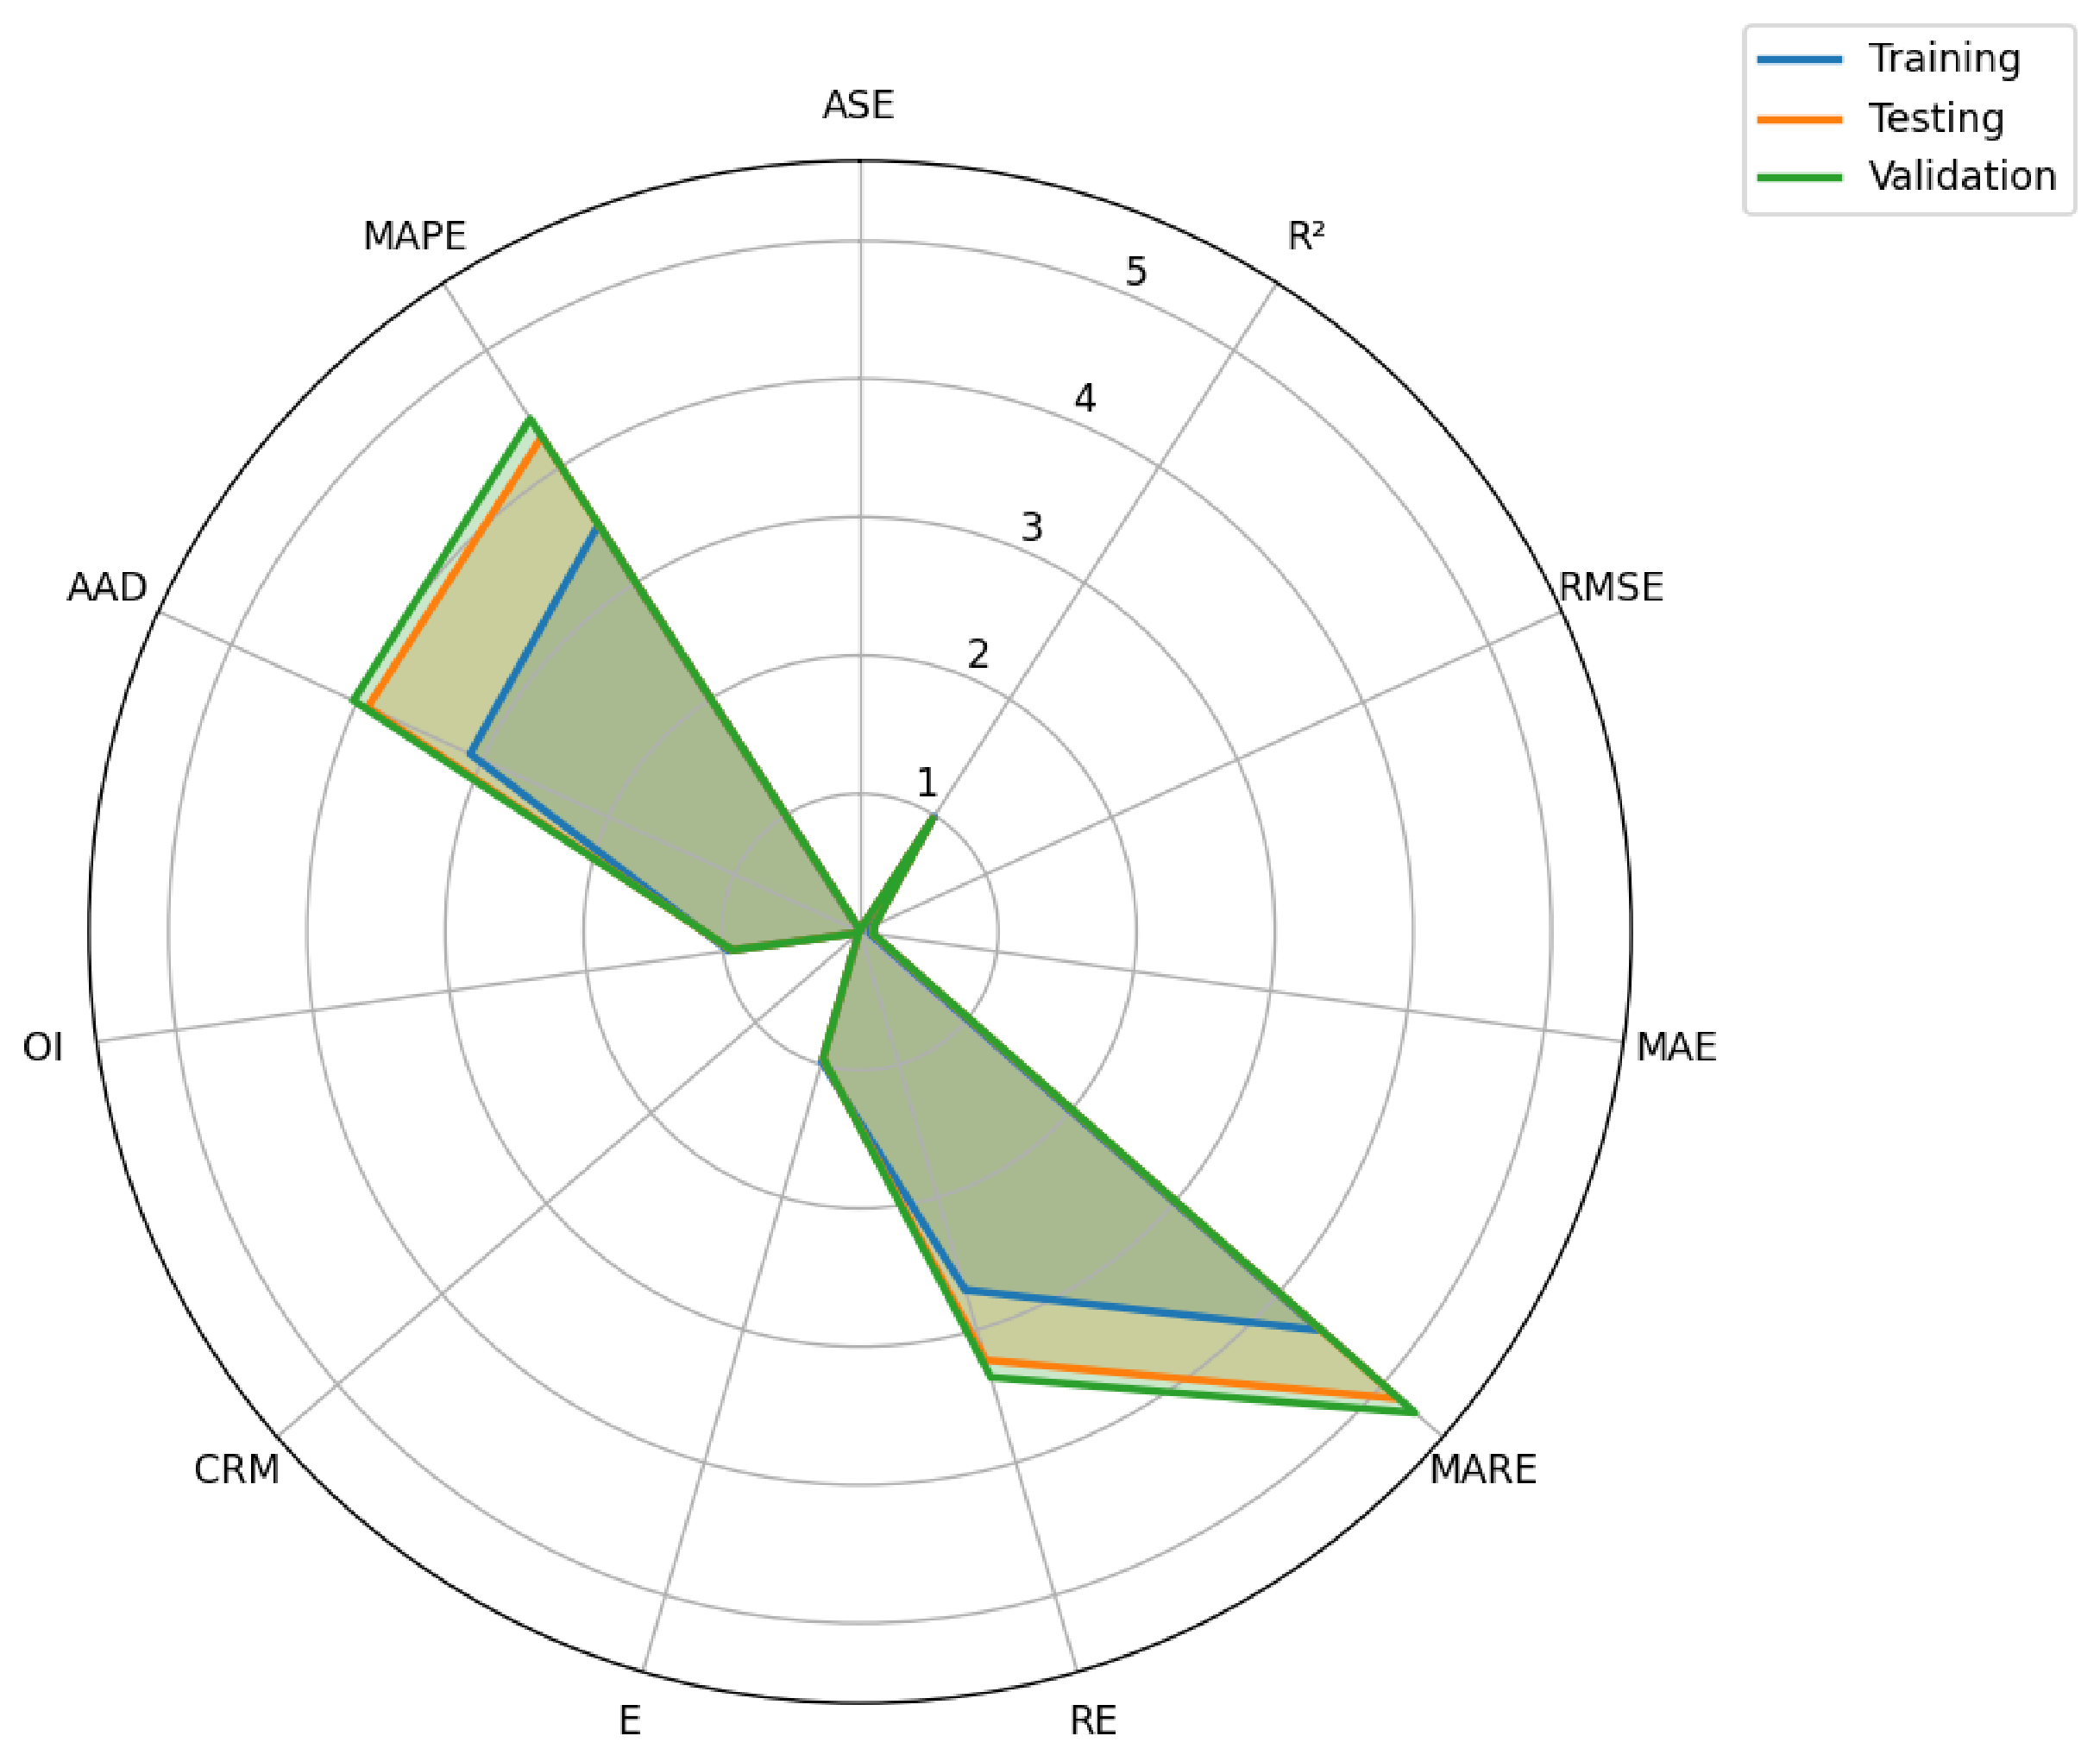
Figure 12 illustrates a radar chart comparing the statistical performance of the developed ANN model for the training, testing, and validation stages for predicting the Quality Index (Qi) of DJ. The model demonstrates consistent and high performance across all phases, with near-uniform coverage across key parameters such as ASE, RMSE, MAE, R2, and MAPE.
Notably, the training phase yields the best results, with the lowest error rates and the highest R2 (0.990), indicating excellent model fitting. The testing and validation performances, while slightly lower, remain close, with R2 values of 0.976 and 0.971, respectively, confirming the model’s robust generalization. The overlap between the plotted regions indicates high consistency and minimal overfitting, affirming the suitability of the ANN model for reliable Qi prediction in practical juice quality evaluation systems.

4.6. Contribution Ratio for Different Input Variables

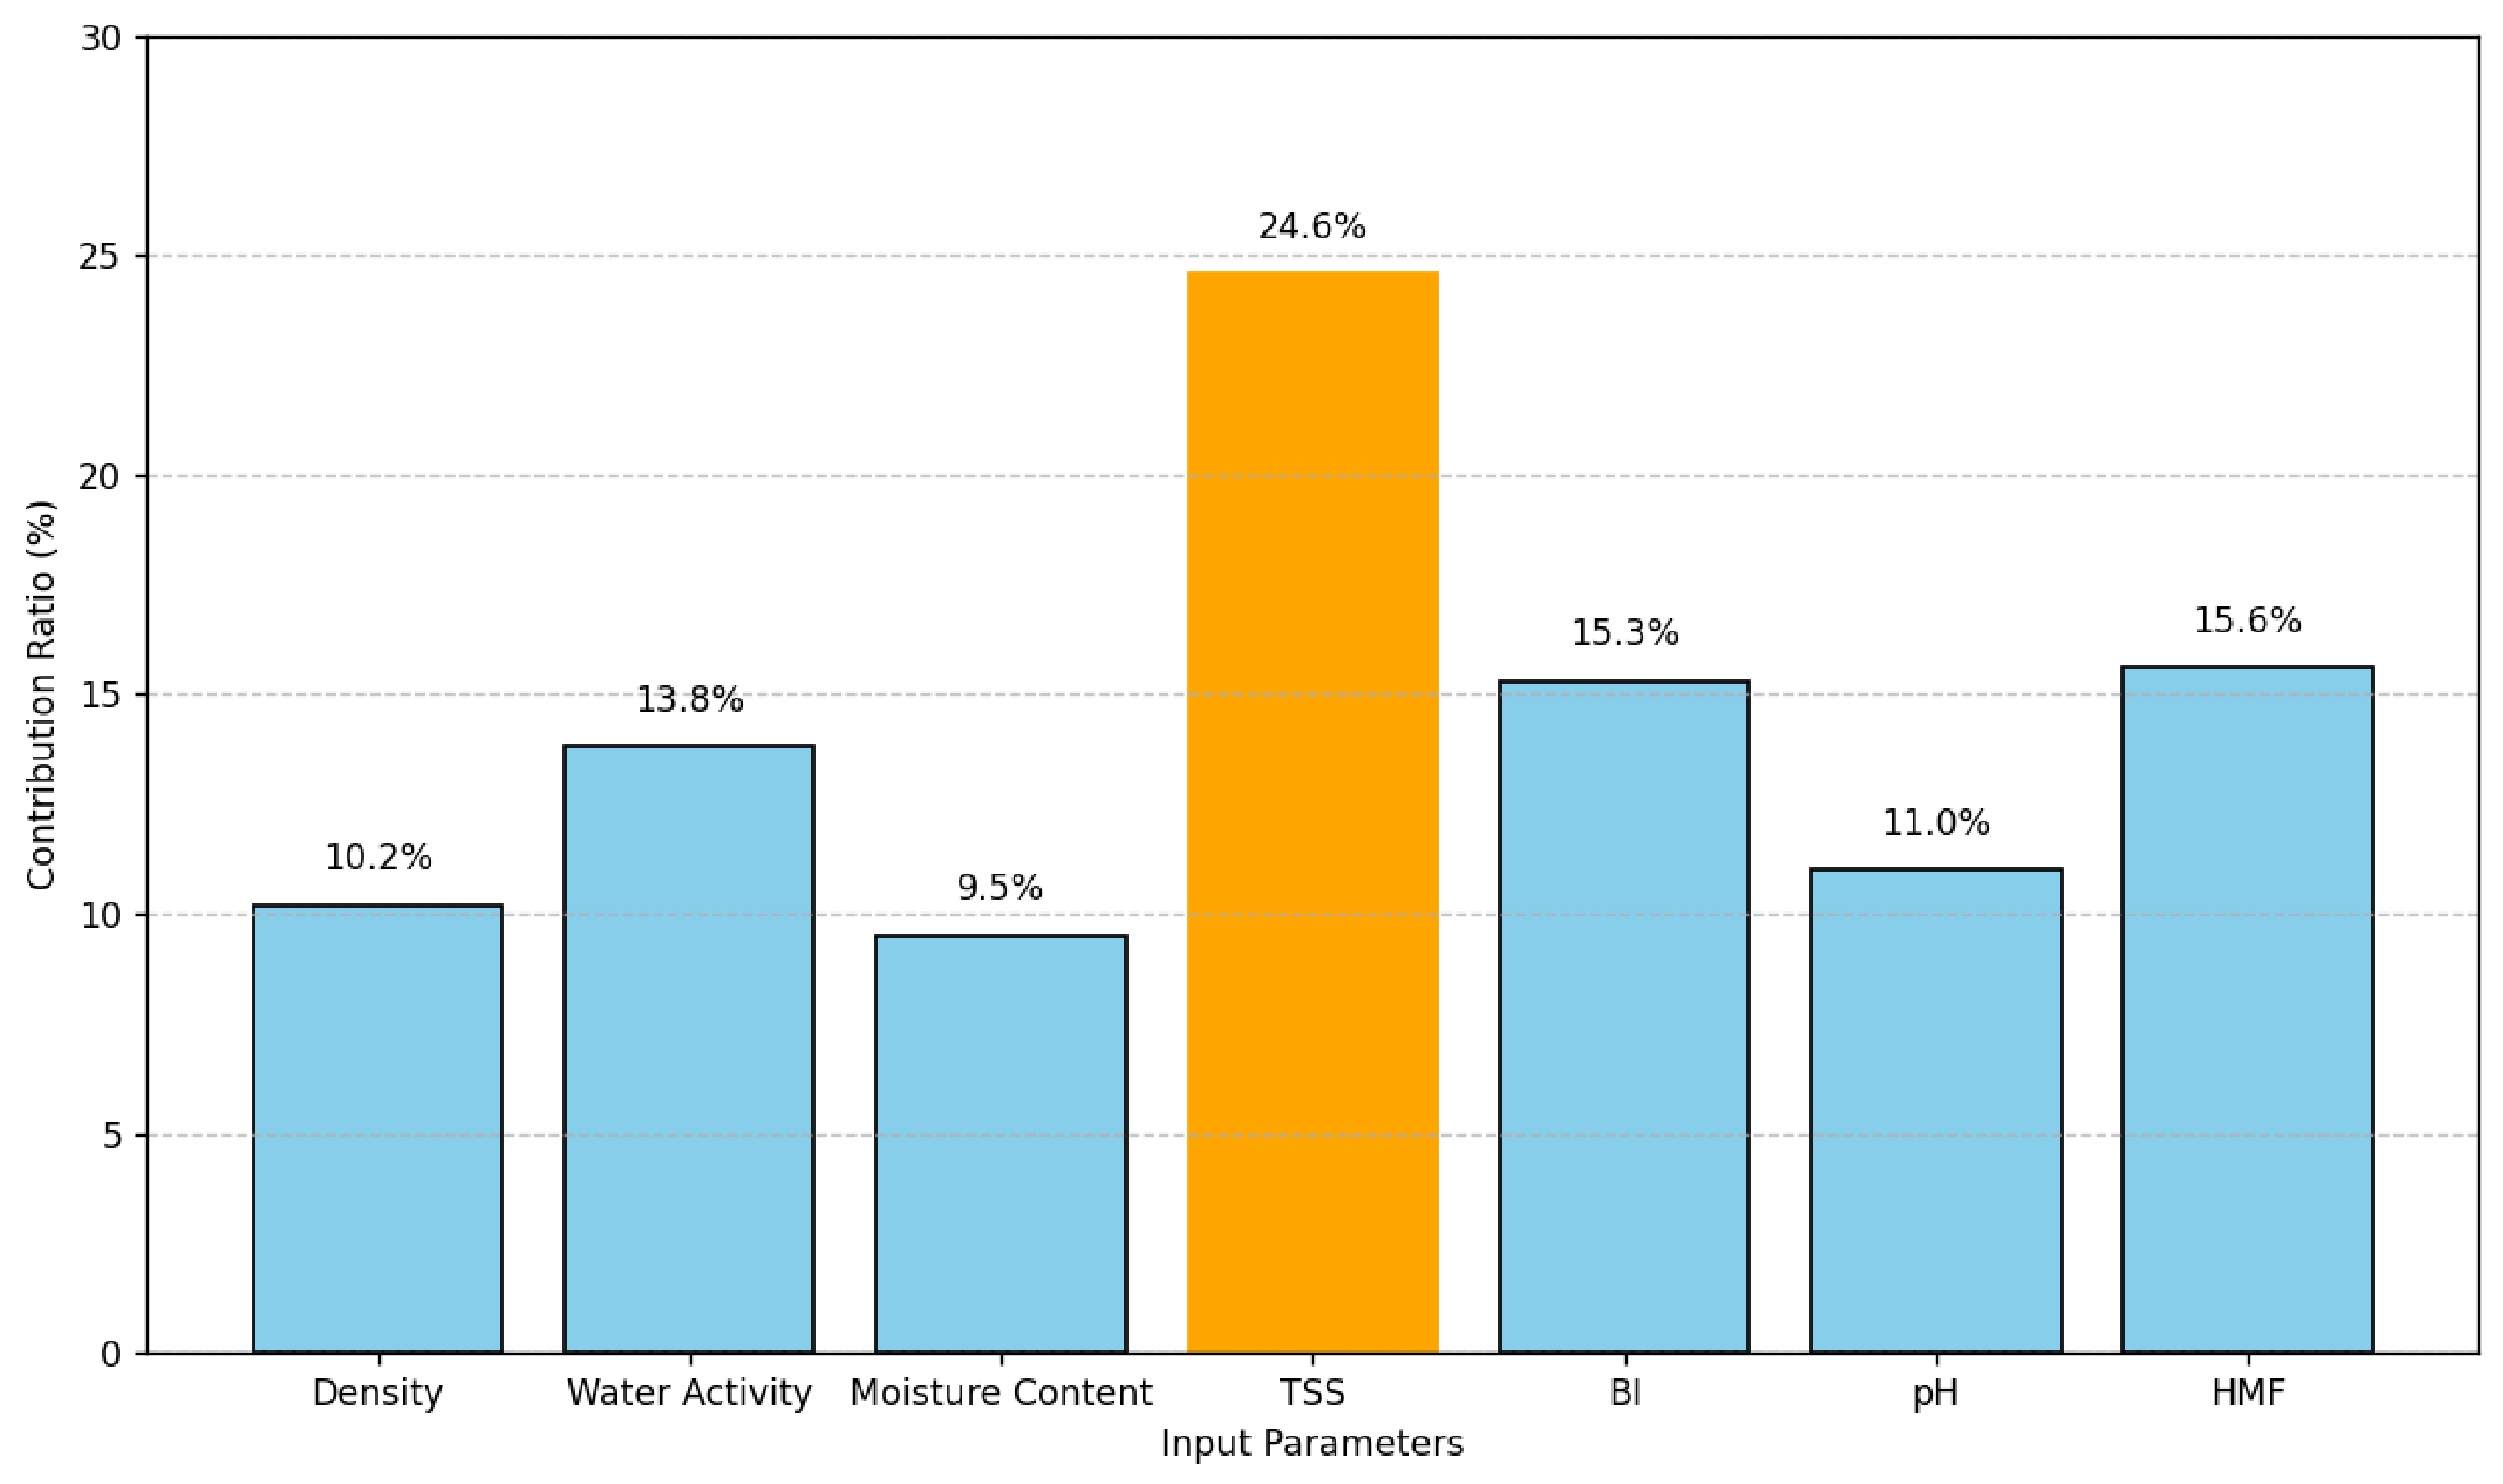
Figure 13 presents the contribution ratios of the seven input variables used in the developed ANN model to predict the Quality Index (Qi) of DJ. Among the parameters, Total Soluble Solids (TSS) exhibited the highest contribution at 24.6%, indicating its dominant influence in the modeling process. This suggests that variations in TSS significantly affect the predicted Qi values and should be carefully monitored and controlled during juice production. Other notable contributors included HMF (15.6%) and Browning Index (BI) (15.3%), reflecting their substantial roles in juice quality. Conversely, Moisture Content had the lowest contribution (9.5%), implying a lower impact on Qi prediction than the other variables. The calculated contribution ratios are valuable for understanding input sensitivity, optimizing model performance, and guiding future experimental designs or feature selection strategies.
These contribution ratios have direct practical value for the food industry because they translate the ANN from a “black-box” predictor into a process-oriented decision tool. The dominance of TSS indicates that controlling the development of soluble solids through raw material selection, date-to-water ratio, extraction temperature, and residence time is the most effective lever for stabilizing overall quality and achieving a consistent product specification. The substantial influence of HMF and BI further shows that the model is highly sensitive to thermal load and browning chemistry, making these variables critical for safeguarding nutritional value, color/flavor integrity, and regulatory compliance. For date-juice and date-syrup operations, these findings support prioritizing tight heat-management and rapid cooling, alongside online or at-line monitoring of °Brix, browning, and HMF as key control points. Industrially, this enables more efficient optimization (fewer trial runs), more robust HACCP/QA strategies, and a clear pathway toward Industry 4.0 deployment where soft sensors and advisory control focus first on the variables that matter most to quality outcomes.
From an industrial perspective, the resulting ANN formulation can be embedded as a soft sensor within routine plant measurements to support real-time quality prediction and operating-setpoint selection, enabling standardized production and reducing variability across batches.

5. Conclusions

In this study, an artificial neural network (ANN) model with a (7–15–1) architecture was successfully developed to predict the non-destructive Quality Index (Qi) of DJ using seven key physicochemical variables: density, aw, MC, TSS, BI, pH, and HMF. The optimal model, trained using the tanh transfer function, demonstrated excellent predictive performance across the training, testing, and validation phases, with high R2 values (0.990, 0.980, and 0.979, respectively) and low error metrics, including RMSE, MAE, and ASE. The model also exhibited strong generalization capability and low prediction bias, as evidenced by CRM values approaching zero and high OI scores.
Additionally, the contribution analysis highlighted TSS as the most influential input variable, followed by HMF and BI, reinforcing the importance of sugar content and thermal degradation markers in assessing juice quality. The ANN model, coupled with the corresponding de-normalization equations, offers a practical framework for real-time prediction of date-juice quality in industrial settings, enabling tighter control of operating parameters, strengthened quality assurance, and actionable decision points for optimizing date juice/syrup processing within an Industry 4.0, data-driven production strategy.

Author Contributions

Conceptualization, M.G.E.; Methodology, M.G.E.; Software, M.G.E.; Formal analysis, M.G.E.; Investigation, M.G.E.; Data curation, M.G.E.; Writing original draft, editing M.G.E.; Final review, A.M.A. All authors have read and agreed to the published version of the manuscript.

Funding

This work was supported and funded by the Ongoing Research Funding Program—Research Chairs (ORF-RC-2026-4006), King Saud University, Riyadh, Saudi Arabia.

Data Availability Statement

The original contributions presented in this study are included in the article. Further inquiries can be directed to the corresponding author.

Acknowledgments

The authors extend their appreciation to the Ongoing Research Funding Program—Research Chairs (ORF-RC-2026-4006), King Saud University, Riyadh, Saudi Arabia.

Conflicts of Interest

The authors declare no conflicts of interest. There are no competing interests.

References

  1. FAO. Plant Production and Protection Division; Food and Agriculture Organization of the United Nations: Rome, Italy, 2025; ISBN 978-92-5-137003-2. [Google Scholar]
  2. Al-Farsi, M.A.; Lee, C.Y. Nutritional and Functional Properties of Dates: A Review. Crit. Rev. Food Sci. Nutr. 2008, 48, 877–887. [Google Scholar] [CrossRef] [Scilit]
  3. Al-Rawahi, A.; Kasapis, S.; Al-Bulushi, I. Development of a Date Confectionery: Part 1. Relating Formulation to Instrumental Texture. Int. J. Food Prop. 2005, 8, 457–468. [Google Scholar] [CrossRef] [Scilit]
  4. Bouaziz, F.; Ben Abdeddayem, A.; Koubaa, M.; Ellouz Ghorbel, R.; Ellouz Chaabouni, S. Date Seeds as a Natural Source of Dietary Fibers to Improve Texture and Sensory Properties of Wheat Bread. Foods 2020, 9, 737. [Google Scholar] [CrossRef] [Scilit]
  5. Nosratabadi, L.; Kavousi, H.-R.; Hajimohammadi-Farimani, R.; Balvardi, M.; Yousefian, S. Estamaran Date Vinegar: Chemical and Microbial Dynamics during Fermentation. Braz. J. Microbiol. 2024, 55, 1265–1277. [Google Scholar] [CrossRef] [Scilit]
  6. Bouhlali, E.D.T.; Derouich, M.; Meziani, R.; Bourkhis, B.; Filali-Zegzouti, Y.; Alem, C. Nutritional, Mineral and Organic Acid Composition of Syrups Produced from Six Moroccan Date Fruit (Phoenix dactylifera L.) Varieties. J. Food Compos. Anal. 2020, 93, 103591. [Google Scholar] [CrossRef] [Scilit]
  7. Bulut, L.; Kilic, M. Kinetics of Hydroxymethylfurfural Accumulation and Color Change in Honey During Storage in Relation to Moisture Content. J. Food Process. Preserv. 2009, 33, 22–32. [Google Scholar] [CrossRef] [Scilit]
  8. Al-Farsi, M.A.; Alasalvar, C.; Morris, A.; Baron, M.; Shahidi, F. Compositional and Sensory Characteristics of Three Native Sun-Dried Date (Phoenix dactylifera L.) Varieties Grown in Oman. J. Agric. Food Chem. 2007, 55, 7586–7591. [Google Scholar] [CrossRef] [Scilit] [PubMed]
  9. Fallico, B.; Arena, E.; Zappala, M. Degradation of 5-Hydroxymethylfurfural in Honey. J. Food Sci. 2008, 73, C625–C631. [Google Scholar] [CrossRef] [Scilit]
  10. Kulkarni, S.G.; Vijayanand, P.; Shubha, L. Effect of Processing of Dates into Date Juice Concentrate and Appraisal of Its Quality Characteristics. J. Food Sci. Technol. 2010, 47, 157–161. [Google Scholar] [CrossRef] [Scilit]
  11. Chniti, S.; Jemni, M.; Bentahar, I.; Ali Shariati, M.; Djelal, H.; Amrane, A.; Hassouna, M. By-Products of Dates: Optimization of the Extraction of Juice Using Response Surface Methodology and Ethanol Production. J. Microb. Biotechnol. Food Sci. 2017, 7, 204–208. [Google Scholar] [CrossRef] [Scilit]
  12. Majaliwa, N.; Kibazohi, O.; Alminger, M. Optimization of Process Parameters for Mechanical Extraction of Banana Juice Using Response Surface Methodology. J. Food Sci. Technol. 2019, 56, 4068–4075. [Google Scholar] [CrossRef] [Scilit]
  13. Elamshity, M.G. Development of a Nutritional Drink from Cow’s and Camel’s Milk with Date Syrup. Master’s Thesis, King Saud University, Riyadh, Saudi Arabia, 2014. [Google Scholar]
  14. Soori, M.; Arezoo, B.; Dastres, R. Artificial Neural Networks in Supply Chain Management, a Review. J. Econ. Technol. 2023, 1, 179–196. [Google Scholar] [CrossRef] [Scilit]
  15. Caudill, M.; Butler, C. Basic Networks; Understanding Neural Networks: Computer Explorations; A Workbook in 2 Volumes with Software for the Macintosh and PC Compatibles; MIT Press: Cambridge, MA, USA, 1992; ISBN 978-0-262-53099-6. [Google Scholar]
  16. Huang, Y.; Kangas, L.J.; Rasco, B.A. Applications of Artificial Neural Networks (ANNs) in Food Science. Crit. Rev. Food Sci. Nutr. 2007, 47, 113–126. [Google Scholar] [CrossRef] [Scilit]
  17. Mohammed, M.; Munir, M.; Aljabr, A. Prediction of Date Fruit Quality Attributes during Cold Storage Based on Their Electrical Properties Using Artificial Neural Networks Models. Foods 2022, 11, 1666. [Google Scholar] [CrossRef] [Scilit] [PubMed]
  18. Kumar, M.; Raghuwanshi, N.S.; Singh, R.; Wallender, W.W.; Pruitt, W.O. Estimating Evapotranspiration Using Artificial Neural Network. J. Irrig. Drain. Eng. 2002, 128, 224–233. [Google Scholar] [CrossRef] [Scilit]
  19. Abdipour, M.; Younessi-Hmazekhanlu, M.; Ramazani, S.H.R.; Omidi, A.H. Artificial Neural Networks and Multiple Linear Regression as Potential Methods for Modeling Seed Yield of Safflower (Carthamus tinctorius L.). Ind. Crops Prod. 2019, 127, 185–194. [Google Scholar] [CrossRef] [Scilit]
  20. Shahabi, M.; Jafarzadeh, A.A.; Neyshabouri, M.R.; Ghorbani, M.A.; Valizadeh Kamran, K. Spatial Modeling of Soil Salinity Using Multiple Linear Regression, Ordinary Kriging and Artificial Neural Network Methods. Arch. Agron. Soil Sci. 2017, 63, 151–160. [Google Scholar] [CrossRef] [Scilit]
  21. Rai, P.; Majumdar, G.C.; DasGupta, S.; De, S. Prediction of the Viscosity of Clarified Fruit Juice Using Artificial Neural Network: A Combined Effect of Concentration and Temperature. J. Food Eng. 2005, 68, 527–533. [Google Scholar] [CrossRef] [Scilit]
  22. Furferi, R.; Carfagni, M.; Daou, M. Artificial Neural Network Software for Real-Time Estimation of Olive Oil Qualitative Parameters during Continuous Extraction. Comput. Electron. Agric. 2007, 55, 115–131. [Google Scholar] [CrossRef] [Scilit]
  23. Cimpoiu, C.; Cristea, V.-M.; Hosu, A.; Sandru, M.; Seserman, L. Antioxidant Activity Prediction and Classification of Some Teas Using Artificial Neural Networks. Food Chem. 2011, 127, 1323–1328. [Google Scholar] [CrossRef] [Scilit] [PubMed]
  24. Yalcin, H.; Toker, O.S.; Ozturk, I.; Dogan, M.; Kisi, O. Prediction of Fatty Acid Composition of Vegetable Oils Based on Rheological Measurements Using Nonlinear Models. Eur. J. Lipid Sci. Techol. 2012, 114, 1217–1224. [Google Scholar] [CrossRef] [Scilit]
  25. Huang, X.; Wang, H.; Luo, W.; Xue, S.; Hayat, F.; Gao, Z. Prediction of Loquat Soluble Solids and Titratable Acid Content Using Fruit Mineral Elements by Artificial Neural Network and Multiple Linear Regression. Sci. Hortic. 2021, 278, 109873. [Google Scholar] [CrossRef] [Scilit]
  26. Huang, X.; Chen, T.; Zhou, P.; Huang, X.; Liu, D.; Jin, W.; Zhang, H.; Zhou, J.; Wang, Z.; Gao, Z. Prediction and Optimization of Fruit Quality of Peach Based on Artificial Neural Network. J. Food Compos. Anal. 2022, 111, 104604. [Google Scholar] [CrossRef] [Scilit]
  27. Abdolrasol, M.G.M.; Hussain, S.M.S.; Ustun, T.S.; Sarker, M.R.; Hannan, M.A.; Mohamed, R.; Ali, J.A.; Mekhilef, S.; Milad, A. Artificial Neural Networks Based Optimization Techniques: A Review. Electronics 2021, 10, 2689. [Google Scholar] [CrossRef] [Scilit]
  28. Correa, D.A.; Montero Castillo, P.M.; Martelo, R.J. Neural Networks in Food Industry. Contemp. Eng. Sci. 2018, 11, 1807–1826. [Google Scholar] [CrossRef] [Scilit]
  29. Torrecilla, J.S.; Otero, L.; Sanz, P.D. Artificial Neural Networks: A Promising Tool to Design and Optimize High-Pressure Food Processes. J. Food Eng. 2005, 69, 299–306. [Google Scholar] [CrossRef] [Scilit]
  30. Emamgholizadeh, S.; Parsaeian, M.; Baradaran, M. Seed Yield Prediction of Sesame Using Artificial Neural Network. Eur. J. Agron. 2015, 68, 89–96. [Google Scholar] [CrossRef] [Scilit]
  31. Niazian, M.; Sadat-Noori, S.A.; Abdipour, M. Artificial Neural Network and Multiple Regression Analysis Models to Predict Essential Oil Content of Ajowan (Carum copticum L.). J. Appl. Res. Med. Aromat. Plants 2018, 9, 124–131. [Google Scholar] [CrossRef] [Scilit]
  32. Torkashvand, A.M.; Ahmadi, A.; Nikravesh, N.L. Prediction of Kiwifruit Firmness Using Fruit Mineral Nutrient Concentration by Artificial Neural Network (ANN) and Multiple Linear Regressions (MLR). J. Integr. Agric. 2017, 16, 1634–1644. [Google Scholar] [CrossRef] [Scilit]
  33. Ivanovski, T.; Zhang, G.; Jemric, T.; Gulic, M.; Matetic, M. Fruit Firmness Prediction Using Multiple Linear Regression. In Proceedings of the 2020 43rd International Convention on Information, Communication and Electronic Technology (MIPRO), Opatija, Croatia, 28 September–2 October 2020. [Google Scholar]
  34. Shezi, S.; Magwaza, L.S.; Tesfay, S.Z.; Mditshwa, A. Simple and Multiple Linear Regression Models for Predicting Maturity of ‘Mendez#1’ and ‘Hass’ Avocado Fruit Harvested from inside and Outside Tree Canopy Positions. Int. J. Fruit Sci. 2020, 20, S1969–S1983. [Google Scholar] [CrossRef] [Scilit]
  35. Aklilu, E.G. Artificial Neural Networks (ANNs) and Response Surface Methodology (RSM) Approach for Modeling and Optimization of Pectin Extraction from Banana Peel 2020. Agric. Food Sci. Chem. 2020, 234651342. [Google Scholar] [CrossRef] [Scilit]
  36. Cevher, E.Y.; Yıldırım, D. Using Artificial Neural Network Application in Modeling the Mechanical Properties of Loading Position and Storage Duration of Pear Fruit. Processes 2022, 10, 2245. [Google Scholar] [CrossRef] [Scilit]
  37. Inyang, U.E. Artificial Neural Network and Their Applications in Food Materials: A Review. Eng. Technol. J. 2022, 7, 1235–1248. [Google Scholar] [CrossRef] [Scilit]
  38. Kerdpiboon, S.; Kerr, W.L.; Devahastin, S. Neural Network Prediction of Physical Property Changes of Dried Carrot as a Function of Fractal Dimension and Moisture Content. Food Res. Int. 2006, 39, 1110–1118. [Google Scholar] [CrossRef] [Scilit]
  39. Youssefi, S.; Emam-Djomeh, Z.; Mousavi, S.M. Comparison of Artificial Neural Network (ANN) and Response Surface Methodology (RSM) in the Prediction of Quality Parameters of Spray-Dried Pomegranate Juice. Dry. Technol. 2009, 27, 910–917. [Google Scholar] [CrossRef] [Scilit]
  40. Castillo-Girones, S.; Munera, S.; Martínez-Sober, M.; Blasco, J.; Cubero, S.; Gómez-Sanchis, J. Artificial Neural Networks in Agriculture, the Core of Artificial Intelligence: What, When, and Why. Comput. Electron. Agric. 2025, 230, 109938. [Google Scholar] [CrossRef] [Scilit]
  41. Funes, E.; Allouche, Y.; Beltrán, G.; Jiménez, A. A Review: Artificial Neural Networks as Tool for Control Food Industry Process. J. Sens. Technol. 2015, 5, 28–43. [Google Scholar] [CrossRef]
  42. Gorbachev, V.; Nikitina, M.; Velina, D.; Mutallibzoda, S.; Nosov, V.; Korneva, G.; Terekhova, A.; Artemova, E.; Khashir, B.; Sokolov, I.; et al. Artificial Neural Networks for Predicting Food Antiradical Potential. Appl. Sci. 2022, 12, 6290. [Google Scholar] [CrossRef] [Scilit]
  43. Unigarro, C.; Hernandez, J.; Florez, H. Artificial Neural Networks for Image Processing in Precision Agriculture: A Systematic Literature Review on Mango, Apple, Lemon, and Coffee Crops. Informatics 2025, 12, 46. [Google Scholar] [CrossRef] [Scilit]
  44. Ahmed, Z.F.R.; Al Shaibani, F.Y.Y.; Kaur, N.; Maqsood, S.; Schmeda-Hirschmann, G. Improving Fruit Quality, Bioactive Compounds, and Storage Life of Date Palm (Phoenix dactylifera L., Cv. Barhi) Using Natural Elicitors. Horticulturae 2021, 7, 293. [Google Scholar] [CrossRef] [Scilit]
  45. Elamshity, M.; Alhamdan, A. Development and Prediction of a Non-Destructive Quality Index (Qi) for Stored Date Fruits Using VIS–NIR Spectroscopy and Artificial Neural Networks. Foods 2025, 14, 3060. [Google Scholar] [CrossRef] [Scilit] [PubMed]
  46. Elamshity, M.G.; Alhamdan, A.M. Non-Destructive Evaluation of the Physiochemical Properties of Milk Drink Flavored with Date Syrup Utilizing VIS-NIR Spectroscopy and ANN Analysis. Foods 2024, 13, 524. [Google Scholar] [CrossRef] [Scilit] [PubMed]
  47. Hussain, M.I.; Farooq, M.; Syed, Q.A. Nutritional and Biological Characteristics of the Date Palm Fruit (Phoenix dactylifera L.)—A Review. Food Biosci. 2020, 34, 100509. [Google Scholar] [CrossRef] [Scilit]
  48. Al-Qurashi, A.D.; Awad, M.A. Quality Characteristics of Bisir ‘Barhee’ Dates during Cold Storage as Affected by Postharvest Dipping in Gibberellic Acid, Naphthaleneacetic Acid and Benzyladenine. Fruits 2011, 66, 343–352. [Google Scholar] [CrossRef] [Scilit]
  49. Barreveld, W.H. Date Palm Products; FAO Agricultural Services Bulletin; Food and Agriculture Organization of the United Nations: Rome, Italy, 1993; ISBN 978-92-5-103251-0. [Google Scholar]
  50. Labuza, T.P.; Acott, K.; TATiNl, S.R.; Lee, R.Y.; Flink, J.; McCall, W. Water Activity Determination: A Collaborative Study of Different Methods. J. Food Sci. 1976, 41, 910–917. [Google Scholar] [CrossRef] [Scilit]
  51. Latimer, G.W. (Ed.) Official Methods of Analysis: 22nd Edition (2023). In Official Methods of Analysis of AOAC International; Oxford University Press: New York, NY, USA, 2023; ISBN 978-0-19-761013-8. [Google Scholar]
  52. Fairchild, M.D. Color Appearance Models, 3rd ed.; Wiley-IS&T Series in Imaging Science and Technology; Wiley: Chichester, UK, 2013; ISBN 978-1-119-96703-3. [Google Scholar]
  53. Kolb, H.; Fernandez, E.; Nelson, R. (Eds.) Webvision: The Organization of the Retina and Visual System; University of Utah Health Sciences Center: Salt Lake City, UT, USA, 1995. [Google Scholar]
  54. Maskan, M. Kinetics of Colour Change of Kiwifruits during Hot Air and Microwave Drying. J. Food Eng. 2001, 48, 169–175. [Google Scholar] [CrossRef] [Scilit]
  55. Daroub, H.; Olabi, A.; Toufeili, I. Designing and Testing of an Arabic Version of the Hedonic Scale for Use in Acceptability Tests. Food Qual. Prefer. 2010, 21, 33–43. [Google Scholar] [CrossRef] [Scilit]
  56. Larmond, E. Laboratory Methods for Sensory Evaluation of Food; Agriculture Canada, Research Branch: Ottawa, ON, Canada, 1977; ISBN 978-0-662-01271-9.
  57. Lawless, H.T.; Heymann, H. Sensory Evaluation of Food: Principles and Practices; Food Science Text Series; Springer: New York, NY, USA, 2010; ISBN 978-1-4419-6487-8. [Google Scholar]
  58. Lim, J. Hedonic Scaling: A Review of Methods and Theory. Food Qual. Prefer. 2011, 22, 733–747. [Google Scholar] [CrossRef] [Scilit]
  59. Meilgaard, M.C.; Carr, B.T.; Civille, G.V. Sensory Evaluation Techniques; CRC Press: Boca Raton, FL, USA, 1999; ISBN 978-1-003-04072-9. [Google Scholar]
  60. Nicolas, L.; Marquilly, C.; O’Mahony, M. The 9-Point Hedonic Scale: Are Words and Numbers Compatible? Food Qual. Prefer. 2010, 21, 1008–1015. [Google Scholar] [CrossRef] [Scilit]
  61. Silva, A.N.D.; Silva, R.D.C.D.S.N.D.; Ferreira, M.A.M.; Minim, V.P.R.; Costa, T.D.M.T.D.; Perez, R. Performance of Hedonic Scales in Sensory Acceptability of Strawberry Yogurt. Food Qual. Prefer. 2013, 30, 9–21. [Google Scholar] [CrossRef] [Scilit]
  62. ISO 8589; Sensory Analysis. International Organization for Standardization: Geneva, Switzerland, 2007.
  63. Al-Qarawi, A.A.; Ali, B.H.; Al-Mougy, S.A.; Mousa, H.M. Gastrointestinal Transit in Mice Treated with Various Extracts of Date (Phoenix dactylifera L.). Food Chem. Toxicol. 2003, 41, 37–39. [Google Scholar] [CrossRef] [Scilit]
  64. Camarinha-Matos, L.M. Collaborative Smart Grids—A Survey on Trends. Renew. Sustain. Energy Rev. 2016, 65, 283–294. [Google Scholar] [CrossRef] [Scilit]
  65. Jayalakshmi, T.; Santhakumaran, A. Statistical Normalization and Back Propagationfor Classification. Int. J. Comput. Theory Eng. 2011, 3, 1793–8201. [Google Scholar] [CrossRef] [Scilit]
  66. Cigizoglu, H.K. Estimation, forecasting and extrapolation of river flows by artificial neural networks. Hydrol. Sci. J. 2003, 48, 349–361. [Google Scholar] [CrossRef] [Scilit]
  67. Fernando, D.A.; Shamseldin, A.Y. Investigation of Internal Functioning of the Radial-Basis-Function Neural Network River Flow Forecasting Models. J. Hydrol. Eng. 2009, 14, 286–292. [Google Scholar] [CrossRef] [Scilit]
  68. Jain, A.; Srinivasulu, S. Development of Effective and Efficient Rainfall-runoff Models Using Integration of Deterministic, Real-coded Genetic Algorithms and Artificial Neural Network Techniques. Water Resour. Res. 2004, 40, W04302. [Google Scholar] [CrossRef] [Scilit]
  69. Thirumalaiah, K.; Deo, M.C. River Stage Forecasting Using Artificial Neural Networks. J. Hydrol. Eng. 1998, 3, 26–32. [Google Scholar] [CrossRef] [Scilit]
  70. Maier, H.R.; Dandy, G.C. Neural Networks for the Prediction and Forecasting of Water Resources Variables: A Review of Modelling Issues and Applications. Environ. Model. Softw. 2000, 15, 101–124. [Google Scholar] [CrossRef] [Scilit]
  71. Haykin, S. Neural Networks: A Comprehensive Foundation, 2nd ed.; Pearson Education: Delhi, India, 1999; ISBN 978-81-7808-300-1. [Google Scholar]
  72. Basheer, I.A.; Hajmeer, M. Artificial Neural Networks: Fundamentals, Computing, Design, and Application. J. Microbiol. Methods 2000, 43, 3–31. [Google Scholar] [CrossRef] [Scilit]
  73. Kavzoglu, T.; Mather, P.M. The Use of Backpropagating Artificial Neural Networks in Land Cover Classification. Int. J. Remote Sens. 2003, 24, 4907–4938. [Google Scholar] [CrossRef] [Scilit]
  74. Swingler, K. Applying Neural Networks: A Practical Guide; 3rd Printing; Kaufman: San Francisco, CA, USA, 2001; ISBN 978-0-12-679170-9. [Google Scholar]
  75. Garson, G.D. Interpreting Neural Network Connection Weights. Artif. Intell. Expert 1991, 6, 47–51. [Google Scholar]
  76. Ghanizadeh, A.R.; Heidarabadizadeh, N.; Jalali, F. Artificial Neural Network Back-Calculation of Flexible Pavements with Sensitivity Analysis Using Garson’s and Connection Weights Algorithms. Innov. Infrastruct. Solut. 2020, 5, 63. [Google Scholar] [CrossRef] [Scilit]
  77. Goh, A.T.C. Back-Propagation Neural Networks for Modeling Complex Systems. Artif. Intell. Eng. 1995, 9, 143–151. [Google Scholar] [CrossRef] [Scilit]
  78. Jain, S.K.; Nayak, P.C.; Sudheer, K.P. Models for Estimating Evapotranspiration Using Artificial Neural Networks, and Their Physical Interpretation. Hydrol. Process. 2008, 22, 2225–2234. [Google Scholar] [CrossRef] [Scilit]
  79. Montgomery, D.C.; Peck, E.A.; Vining, G.G. Introduction to Linear Regression Analysis, 6th ed.; Wiley Series in Probability and Statistics; Wiley: Hoboken, NJ, USA, 2020; ISBN 978-1-119-57872-7. [Google Scholar]
  80. Logan, T.M.; McLeod, S.; Guikema, S. Predictive Models in Horticulture: A Case Study with Royal Gala Apples. Sci. Hortic. 2016, 209, 201–213. [Google Scholar] [CrossRef] [Scilit]
  81. Li, F.; Qiao, J.; Han, H.; Yang, C. A Self-Organizing Cascade Neural Network with Random Weights for Nonlinear System Modeling. Appl. Soft Comput. 2016, 42, 184–193. [Google Scholar] [CrossRef] [Scilit]
  82. Kantanantha, N.; Serban, N.; Griffin, P. Yield and Price Forecasting for Stochastic Crop Decision Planning. J. Agric. Biol. Environ. Stat. 2010, 15, 362–380. [Google Scholar] [CrossRef] [Scilit]
  83. Riad, S.; Mania, J.; Bouchaou, L.; Najjar, Y. Rainfall-Runoff Model Usingan Artificial Neural Network Approach. Math. Comput. Model. 2004, 40, 839–846. [Google Scholar] [CrossRef] [Scilit]
  84. Legates, D.R.; McCabe, G.J. Evaluating the Use of “Goodness-of-fit” Measures in Hydrologic and Hydroclimatic Model Validation. Water Resour. Res. 1999, 35, 233–241. [Google Scholar] [CrossRef] [Scilit]
  85. Betiku, E.; Taiwo, A.E. Modeling and Optimization of Bioethanol Production from Breadfruit Starch Hydrolyzate Vis-à-Vis Response Surface Methodology and Artificial Neural Network. Renew. Energy 2015, 74, 87–94. [Google Scholar] [CrossRef] [Scilit]
  86. Lewis, C.D. Industrial and Business Forecasting Methods: A Practical Guide to Exponential Smoothing and Curve Fitting; Butterworth Scientific: London, UK; Boston, MA, USA, 1982; ISBN 978-0-408-00559-3. [Google Scholar]
  87. SAS Institute Inc SAS/STAT® 9.4, Version 9.4; Computer Software; SAS Institute Inc.: Cary, NC, USA, 2023.
  88. IBM Corp IBM SPSS Statistics for Windows, Version 27.0; Computer Software; IBM Corp.: Armonk, NY, USA, 2020.
  89. Python Software Foundation Python Language Reference, Python Version 3.12.4; Python Software Foundation: Beaverton, OR, USA, 2025. Available online: https://www.python.org/downloads/release/python-3124/ (accessed on 5 May 2026).
  90. Virtanen, P.; Gommers, R.; Oliphant, T.E.; Haberland, M.; Reddy, T.; Cournapeau, D.; Burovski, E.; Peterson, P.; Weckesser, W.; Bright, J.; et al. SciPy 1.0: Fundamental Algorithms for Scientific Computing in Python. Nat. Methods 2020, 17, 261–272. [Google Scholar] [CrossRef] [Scilit] [PubMed]
  91. Reback, J.; McKinney, W.; Jbrockmendel; Bossche, J.V.D.; Augspurger, T.; Cloud, P.; Gfyoung; Sinhrks; Klein, A.; Hawkins, S.; et al. Pandas-Dev Pandas, Version 1.0.5; PyData Development Team: Austin, TX, USA, 2020. Available online: https://explore.openaire.eu/search/result?pid=10.5281%2Fzenodo.18675244 (accessed on 5 May 2026).
  92. Waskom, M. Seaborn: Statistical Data Visualization. J. Open Source Softw. 2021, 6, 3021. [Google Scholar] [CrossRef] [Scilit]
  93. Harris, C.R.; Millman, K.J.; Van Der Walt, S.J.; Gommers, R.; Virtanen, P.; Cournapeau, D.; Wieser, E.; Taylor, J.; Berg, S.; Smith, N.J.; et al. Array Programming with NumPy. Nature 2020, 585, 357–362. [Google Scholar] [CrossRef] [Scilit]
  94. Microsoft Corporation Microsoft Office 365; Computer Software; Microsoft: Redmond, WA, USA, 2023.
  95. MathWorks MATLAB, Version R2025a; MATLAB: Natick, MA, USA, 2025.
  96. Besbes, S.; Blecker, C.; Deroanne, C.; Drira, N.-E.; Attia, H. Date Seeds: Chemical Composition and Characteristic Profiles of the Lipid Fraction. Food Chem. 2004, 84, 577–584. [Google Scholar] [CrossRef] [Scilit]
  97. Alasalvar, C.; Morris, A.; Baron, M.; Shahidi, F. Comparison of Antioxidant Activity, Anthocyanins, Carotenoids, and Phenolics of Three Native Fresh and Sun-Dried Date (Phoenix dactylifera L.) Varieties Grown in Oman. J. Agric. Food Chem. 2005, 53, 7592–7599. [Google Scholar] [CrossRef] [Scilit]
  98. Biglari, F.; AlKarkhi, A.F.M.; Easa, A.M. Antioxidant Activity and Phenolic Content of Various Date Palm (Phoenix dactylifera) Fruits from Iran. Food Chem. 2008, 107, 1636–1641. [Google Scholar] [CrossRef] [Scilit]
  99. Al-Hooti, S.; Sidhu, J.S.; Qabazard, H. Physicochemical Characteristics of Five Date Fruit Cultivars Grown in the United Arab Emirates. Plant Food Hum. Nutr. 1997, 50, 101–113. [Google Scholar] [CrossRef] [Scilit]
  100. Al-Askari, G.A.; Al-Afour, M.F.; AL-Monsef, I.M.; AAl-Sanabani, A.S.; Sinnan, A.M. Chemical Composition Study of Three Varieties of Date Seeds (Iraqi, Saudi and Yemeni) and Their Utilization as Caffeine-Free Coffee Alternative. J. Chem. Nutr. Biochem. 2024, 5, 1–11. [Google Scholar] [CrossRef] [Scilit]
  101. Chaira, N.; Ferchichi, A.; Mrabet, A.; Sghairoun, M. Chemical Composition of the Flesh and the Pit of Date Palm Fruit and Radical Scavenging Activity of Their Extracts. Pak. J. Biol. Sci. 2007, 10, 2202–2207. [Google Scholar] [CrossRef] [Scilit]
  102. Al-Harrasi, A.; Rehman, N.U.; Hussain, J.; Khan, A.L.; Al-Rawahi, A.; Al-Broumi, M.; Ali, L. Nutritional Assessment and Antioxidant Analysis of 22 Date (Phoenix dactylifera) Varieties of Sultanate of Oman. Asian Pac. J. Trop. Med. 2014, 7, S591–S598. [Google Scholar]
  103. Murkovic, M.; Pichler, N. Analysis of 5-hydroxymethylfurfual in Coffee, Dried Fruits and Urine. Mol. Nutr. Food Res. 2006, 50, 842–846. [Google Scholar] [CrossRef] [Scilit]
  104. Guizani, N.; Al-Shaqsi, S.; Al-Alawi, A. Physicochemical Characteristics of Five Date Varieties Grown in the Sultanate of Oman. Int. J. Food Sci. Technol. 2008, 43, 1033–1037. [Google Scholar]
  105. Al-Hooti, S.N.; Sidhu, J.S.; Al-Saqer, J.M.; Al-Othman, A. Chemical Composition and Quality of Date Syrup as Affected by Pectinase/Cellulase Enzyme Treatment. Food Chem. 2002, 79, 215–220. [Google Scholar] [CrossRef] [Scilit]
  106. Qazi, A.; Hussain, F.; Rahim, N.A.B.D.; Hardaker, G.; Alghazzawi, D.; Shaban, K.; Haruna, K. Towards Sustainable Energy: A Systematic Review of Renewable Energy Sources, Technologies, and Public Opinions. IEEE Access 2019, 7, 63837–63851. [Google Scholar] [CrossRef] [Scilit]
  107. Bano, Y.; Rakha, A.; Khan, M.I.; Asgher, M. Chemical Composition and Antioxidant Activity of Date (Phoenix dactylifera L.) Varieties at Various Maturity Stages. Food Sci. Technol. 2022, 42, e29022. [Google Scholar] [CrossRef] [Scilit]
  108. Amorós, A.; Pretel, M.T.; Almansa, M.S.; Botella, M.A.; Zapata, P.J.; Serrano, M. Antioxidant and Nutritional Properties of Date Fruit from Elche Grove as Affected by Maturation and Phenotypic Variability of Date Palm. Food Sci. Technol. Int. 2009, 15, 65–72. [Google Scholar] [CrossRef] [Scilit]
  109. Saleh, E.A.; Tawfik, M.S.; Abu-Tarboush, H.M. Phenolic Contents and Antioxidant Activity of Various Date Palm (Phoenix dactylifera L.) Fruits from Saudi Arabia. Food Nutr. Sci. 2011, 2, 1134–1141. [Google Scholar] [CrossRef]
  110. Al-Farsi, M.; Morris, A.; Baron, M. Functional Properties of Omani Dates (Phoenix dactylifera L.). Acta Hortic. 2007, 736, 479–487. [Google Scholar] [CrossRef] [Scilit]
  111. Al-Shwyeh, H. Date Palm (Phoenix dactylifera L.) Fruit as Potential Antioxidant and Antimicrobial Agents. J. Pharm. Bioall Sci. 2019, 11, 1–11. [Google Scholar] [CrossRef] [Scilit]
  112. Katsch, L.; Methner, F.-J.; Schneider, J. Kinetic Studies of 5-(Hydroxymethyl)-Furfural Formation and Change of the Absorption at 420 Nm in Fruit Juices for the Improvement of Pasteurization Plants. Int. J. Food Eng. 2021, 17, 703–713. [Google Scholar] [CrossRef] [Scilit]
  113. Martins, F.C.O.L.; Alcantara, G.M.R.N.; Silva, A.F.S.; Melchert, W.R.; Rocha, F.R.P. The Role of 5-Hydroxymethylfurfural in Food and Recent Advances in Analytical Methods. Food Chem. 2022, 395, 133539. [Google Scholar] [CrossRef] [Scilit]
  114. Shehzad, K.; Ali, U.; Munir, A. Computer Vision for Food Quality Assessment: Advances and Challenges. Glob. J. Mach. Learn. Comput. 2025, 1, 76–92. [Google Scholar] [CrossRef] [Scilit]
  115. Gallo, V.; Musio, B. Special Issue: Novel Approaches for the Analytical Evaluation of Food Quality and Authenticity. Foods 2023, 12, 3651. [Google Scholar] [CrossRef] [Scilit]
  116. Sun, D.W. Computer Vision Technology for Food Quality Evaluation; Elsevier: Amsterdam, The Netherlands, 2008; ISBN 978-0-12-373642-0. [Google Scholar]
  117. Bhargava, A.; Bansal, A. Fruits and Vegetables Quality Evaluation Using Computer Vision: A Review. J. King Saud. Univ.—Comput. Inf. Sci. 2021, 33, 243–257. [Google Scholar] [CrossRef] [Scilit]
  118. Guiné, R.P.F. The Use of Artificial Neural Networks (ANN) in Food Process Engineering. ETP Int. J. Food Eng. 2019, 5, 15–21. [Google Scholar] [CrossRef] [Scilit]
  119. Alsaedi, A.W.M.; Al-Hilphy, A.R.; Al-Mousawi, A.J.; Gavahian, M. Artificial Neural Network Modeling to Predict Electrical Conductivity and Moisture Content of Milk During Non-Thermal Pasteurization: New Application of Artificial Intelligence (AI) in Food Processing. Processes 2024, 12, 2507. [Google Scholar] [CrossRef] [Scilit]
  120. Bhagya Raj, G.V.S.; Dash, K.K. Comprehensive Study on Applications of Artificial Neural Network in Food Process Modeling. Crit. Rev. Food Sci. Nutr. 2022, 62, 2756–2783. [Google Scholar] [CrossRef] [Scilit]
  121. Wang, Y. Application of Artificial Intelligence in Food Industry: A Review. Agric. Sci. Food Process. 2025, 2, 68–88. [Google Scholar] [CrossRef] [Scilit]
  122. Kujawa, S.; Niedbała, G. Artificial Neural Networks in Agriculture. Agriculture 2021, 11, 497. [Google Scholar] [CrossRef] [Scilit]
  123. Sharma, R. Artificial Intelligence in Agriculture: A Review. In Proceedings of the 2021 5th International Conference on Intelligent Computing and Control Systems (ICICCS), Madurai, India, 6–8 May 2021; pp. 937–942. [Google Scholar] [CrossRef] [Scilit]
Figure 1. The date samples (A) Sukkary and (B) Khlass fruits at the Tamr stage.
Processes 14 01634 g001
Figure 2. A schematic representation of the steps for preparing samples for date juice production and conducting physicochemical properties and sensory evaluation.
Processes 14 01634 g002
Figure 3. Basic structure of feed-forward neural networks.
Processes 14 01634 g003
Figure 4. Flowchart of the artificial neural network (ANN) modeling approach used for juice quality prediction.
Processes 14 01634 g004
Figure 5. Sensory Evaluation Heatmaps Profile of Date juices preferred Across Varying operational conditions of processing in semi-industrial continuous productions (SIP).
Processes 14 01634 g005
Figure 6. Heatmap of normalized physicochemical properties of fresh Sukkary and Khlass date fruits across moisture-content groups.
Processes 14 01634 g006
Figure 7. Heatmap of min–max normalized processing conditions and physicochemical properties for Sukkary and Khlass date juices. Rows are sorted by cultivar and decreasing Quality Index (Qi) to emphasize the multivariate signatures associated with high-quality juice.
Processes 14 01634 g007
Figure 8. Influence of final output bias (−0.354) on the normalized prediction output of the developed ANN model (7–15–1) for Qi estimation of the date juice quality.
Processes 14 01634 g008
Figure 9. Comparison of observed Quality index (Qi) values for the date juice with corresponding optimal ANN values during the training process.
Processes 14 01634 g009
Figure 10. Comparison of Observed Quality Index (Qi) Values for the date juice with Corresponding Optimal ANN Predictions during the Testing Phase.
Processes 14 01634 g010
Figure 11. Comparison of Observed and Predicted Quality Index (Qi) Values for the date juice during the Validation Process Using the Optimal ANN Model (7–15–1).
Processes 14 01634 g011
Figure 12. Radar Chart of ANN Model Performance for Quality Index (Qi) Prediction.
Processes 14 01634 g012
Figure 13. Contribution Ratio for Different Input Parameters of the Developed ANN Model for Quality Index (Qi).
Processes 14 01634 g013
Table 1. The moisture content of the date samples was simulated to simulate variations at harvest.
ClassMoisture Content (db.) (%)
SukkaryKhlass
Control4.357 f ± 0.0156.235 f ± 0.021
Group A10.531 e ± 0.03514.877 e ± 0.023
Group B13.181 d ± 0.01121.781 d ± 0.017
Group C16.606 c ± 0.01426.807 c ± 0.036
Group D20.489 b ± 0.05432.062 b ± 0.046
Group E27.343 a ± 0.01638.697 a ± 0.025
Means within the same column followed by different superscript letters are significantly different (p < 0.05).
Table 2. Analysis of selected datasets describing the physicochemical properties of the date fruits.
Date CultivarGroupsDensityWater ActivityMoisture ContentTotal Soluble SolidsBrown IndexpHHydroxy Methyl Furfural
(g/cm3) (d.b.%)TSSBI HMF
SukkaryControl0.501 f ± 0.0210.196 f ± 0.0124.357 f ± 0.01171.896 a ± 0.014N/A7.254 d ± 0.0110.25 f ± 0.025
Group A1.210 e ± 0.0310.474 e ± 0.01310.531 e ± 0.02171.891 a ± 0.022103.961 a ± 0.0547.464 b ± 0.0540.68 e ± 0.088
Group B1.286 d ± 0.0410.593 d ± 0.02213.181 d ± 0.03371.889 a ± 0.065100.323 b ± 0.0557.489 a ± 0.0481.05 d ± 0.014
Group C1.341 c ± 0.0260.747 c ± 0.01416.606 c ± 0.01471.882 a ± 0.04589.312 d ± 0.0257.268 c ± 0.0691.39 c ± 0.026
Group D1.356 b ± 0.0110.921 b ± 0.02120.489 b ± 0.02171.875 a ± 0.06892.892 c ± 0.0547.094 e ± 0.0871.83 b ± 0.036
Group E1.384 a ± 0.0310.989 a ± 0.06127.343 a ± 0.05470.587 b ± 0.03380.794 e ± 0.0336.999 f ± 0.0252.35 a ± 0.085
KhlassControl0.479 f ± 0.0140.260 f ± 0.0416.235 f ± 0.02172.882 a ± 0.05470.563 b ± 0.0447.153 f ± 0.0420.35 f ± 0.068
Group A1.142 e ± 0.0410.620 e ± 0.02214.877 e ± 0.02172.865 a ± 0.03371.870 a ± 0.0587.608 a ± 0.0250.91 e ± 0.036
Group B1.305 d ± 0.0540.771 d ± 0.03121.781 d ± 0.02372.825 a ± 0.03260.114 c ± 0.367.589 b ± 0.0691.76 d ± 0.054
Group C1.312 c ± 0.0220.856 c ± 0.05226.807 c ± 0.05172.795 a ± 0.02157.545 e ± 0.0257.468 c ± 0.0882.04 c ± 0.066
Group D1.329 b ± 0.0320.985 b ± 0.01432.062 b ± 0.08572.738 a ± 0.02159.773 d ± 0.0367.321 d ± 0.0152.49 b ± 0.022
Group E1.387 a ± 0.0110.992 a ± 0.02138.697 a ± 0.03371.148 b ± 0.03648.040 f ± 0.0217.162 e ± 0.0332.93 a ± 0.069
The same letter in a column within a group indicates that the average values are not significantly different according to the least squares difference (LSD) test at a significance level of p < 0.05. N/A: Not Applicable.
Table 3. Analysis of selected datasets describing the physicochemical properties of date juices under defined processing conditions.
Date CultivarGroupsWater TemperatureMixing VelocityDate-to-Water RatioDensityWater ActivityMoisture ContentTotal Soluble SolidsBrown IndexpHHydroxy Methyl FurfuralViscosityTurbidityExtraction TimeElectrical EnergyQuality IndexClass
(°C)(% of Max Speed)(w/w)(g/cm3) (d.b.%)TSSBI HMFPa·sNTUh/100 gkw/h/100 gQiQi
SukkaryControl20 °C10%1:11.034 f ± 0.0630.932 f ± 0.04164.65 f ± 0.03216 f ± 0.068N/A6 ab ± 0.0577.5 b ± 0.0141.12 b ± 0.012145 a ± 0.0520.180 d ± 0.0590.125 f ± 0.0850.102 f ± 0.0211
Group A40 °C20%1:1.51.05 e ± 0.0360.953 e ± 0.01166.421 e ± 0.02119.5 ad ± 0.0782.6 ad ± 0.0675.8 bd ± 0.0665.6 c ± 0.0211.1 c ± 0.032132 c ± 0.0140.181 c ± 0.0470.128 e ± 0.0330.164 e ± 0.0361
Group B60 °C30%1:21.072 d ± 0.0540.963 d ± 0.02171.042 c ± 0.05124 b ± 0.0802.3 b ± 0.0275.5 ce ± 0.0263.5 d ± 0.0541.05 d ± 0.041120 d ± 0.0210.186 b ± 0.0140.222 c ± 0.0740.509 c ± 0.0523
Group C80 °C40%1:2.51.096 c ± 0.0140.986 b ± 0.02579.325 b ± 0.01427 a ± 0.0381.8 a ± 0.0385.2 f ± 0.0972.9 e ± 0.0110.97 e ± 0.024110 e ± 0.0140.192 a ± 0.0470.230 b ± 0.0330.791 b ± 0.0364
Group D20 °C50%1:31.122 b ± 0.0230.989 a ± 0.01184.281 a ± 0.03318 be ± 0.0763.1 e ± 0.0045.9 c ± 0.0322.3 f ± 0.0440.89 f ± 0.08798 f ± 0.0640.167 f ± 0.0580.235 a ± 0.0960.835 a ± 0.0145
Group E40 °C10%1:11.128 a ± 0.0410.972 c ± 0.01270.798 d ± 0.03620 c ± 0.0693.2 c ± 0.0486.1 a ± 0.0878.2 a ± 0.0361.15 a ± 0.084139 b ± 0.0140.177 e ± 0.0740.131 d ± 0.0140.291 d ± 0.0252
KhlassControl60 °C20%1:1.51.025 f ± 0.0440.962 f ± 0.03673.695 f ± 0.03415 f ± 0.0852.8 e ± 0.0376.3 a ± 0.0467.5 c ± 0.0581.02 c ± 0.085125 c ± 0.0360.180 e ± 0.0870.132 e ± 0.0330.127 e ± 0.0211
Group A80 °C30%1:21.045 e ± 0.0120.972 e ± 0.02175.595 e ± 0.08519.5 ad ± 0.0442.5 c ± 0.0256 ab ± 0.0016.1 d ± 0.0330.94 d ± 0.036108 d ± 0.0140.190 a ± 0.0960.228 a ± 0.0120.355 d ± 0.0322
Group B20 °C40%1:2.51.07 d ± 0.0250.989 b ± 0.02284.740 b ± 0.04418 bc ± 0.0781.7 af ± 0.0156 ab ± 0.0834 e ± 0.0120.91 e ± 0.02199 e ± 0.0260.167 f ± 0.0960.031 f ± 0.0870.691 c ± 0.0854
Group C40 °C50%1:31.094 c ± 0.0110.997 a ± 0.01490.969 a ± 0.05421 c ± 0.0122 d ± 0.0525.8 bc ± 0.0673.1 f ± 0.0320.84 f ± 0.02195 f ± 0.0360.186 c ± 0.0850.216 c ± 0.0330.927 a ± 0.0695
Group D60 °C10%1:11.121 b ± 0.0820.983 d ± 0.03680.173 d ± 0.02123.5 b ± 0.0482.9 b ± 0.0875.7 d ± 0.0248.2 b ± 0.0121.1 b ± 0.021145 a ± 0.0140.181 d ± 0.0470.121 d ± 0.0360.800 b ± 0.0545
Group E80 °C20%1:1.51.124 a ± 0.0210.988 c ± 0.01481.414 c ± 0.01126.5 a ± 0.1063 a ± 0.1045.5 ce ± 0.1678.9 a ± 0.0151.2 a ± 0.015132 b ± 0.0850.188 b ± 0.0630.225 b ± 0.0140.101 f ± 0.0361
The same letter in a column within a group indicates that the average values are not significantly different according to the least squares difference (LSD) test at a significance level of p < 0.05. N/A: Not Applicable.
Table 4. Descriptive statistics for the inputs and outputs used in training, testing, and validation of the developed ANN model for the date juice.
StatisticsInputOutput
DensityWater ActivityMoisture ContentTotal Soluble SolidsBrown IndexpHHydroxy Methyl FurfuralQuality Index
(g/cm3) (d.b.%)TSSBI HMFQi
Training
  Mean1.0720.97678.25920.2502.3755.8131.2510.550
  Minimum1.0250.95366.42115.0001.7005.2000.3500.127
  Maximum1.1220.99790.96927.0003.1006.3002.0400.927
  Standard Deviation0.0320.0168.1163.7610.4770.3360.6010.309
  Skewness Coefficient0.100−0.1690.1130.552−0.045−0.527−0.104−0.242
  Kurtosis Coefficient−0.954−1.463−1.043−0.481−1.020−0.309−1.316−1.459
Testing
  Mean1.1240.97875.48621.7503.0505.9002.4200.546
  Minimum1.1210.97270.79820.0002.9005.7002.3500.291
  Maximum1.1280.98380.17323.5003.2006.1002.4900.800
  Standard Deviation0.0050.0086.6292.4750.2120.2830.0990.360
  Skewness Coefficient0.050−0.0850.0570.276−0.023−0.264−0.052−0.121
  Kurtosis Coefficient−0.477−0.732−0.521−0.241−0.510−0.154−0.658−0.729
Validation
  Mean1.0980.97676.22825.2502.6505.5001.9900.305
  Minimum1.0720.96371.04224.0002.3005.5001.0500.101
  Maximum1.1240.98881.41426.5003.0005.5002.9300.509
  Standard Deviation0.0370.0187.3341.7680.4950.0001.3290.288
  Skewness Coefficient0.025−0.0420.0280.138−0.011−0.132−0.026−0.061
  Kurtosis Coefficient−0.239−0.366−0.261−0.120−0.255−0.077−0.329−0.365
Table 5. Statistical performance of the ANN model for Quality Index (Qi) of the date juice with various hidden node numbers and transfer functions for the training process.
Tan h
No of Hidden NodesASER2RMSEMAEMAREREECRMOIAADMAPE
Quality Index (Qi)
20.0320.9100.1800.1408.5006.1000.8800.0400.8506.2007.100
30.0250.9300.1600.1307.3005.0000.9000.0300.8805.5006.000
40.0180.9500.1300.1106.1004.0000.9200.0200.9104.6005.200
50.0170.9540.1270.1075.9433.8710.9260.0190.9144.4865.043
60.0160.9590.1240.1045.7863.7430.9310.0170.9194.3714.886
70.0150.9630.1210.1015.6293.6140.9370.0160.9234.2574.729
80.0150.9670.1190.0995.4713.4860.9430.0140.9274.1434.571
90.0140.9710.1160.0965.3143.3570.9490.0130.9314.0294.414
100.0130.9760.1130.0935.1573.2290.9540.0110.9363.9144.257
110.0120.9800.1100.0905.0003.1000.9600.0100.9403.8004.100
120.0110.9820.1050.0854.8503.0000.9650.0100.9453.6253.950
130.0100.9850.1000.0804.7002.9000.9700.0100.9503.4503.800
140.0100.9880.0950.0754.5502.8000.9750.0100.9553.2753.650
15 **0.0090.9900.0900.0704.4002.7000.9800.0100.9603.1003.500
160.0090.9860.0920.0724.5602.8000.9740.0110.9583.1803.600
170.0100.9820.0940.0744.7202.9000.9680.0120.9563.2603.700
180.0100.9780.0960.0764.8803.0000.9620.0130.9543.3403.800
190.0110.9740.0980.0785.0403.1000.9560.0140.9523.4203.900
200.0110.9700.1000.0805.2003.2000.9500.0150.9503.5004.000
210.0110.9700.1000.0805.2003.2000.9500.0150.9503.5004.000
220.0110.9700.1000.0805.2003.2000.9500.0150.9503.5004.000
230.0110.9700.1000.0805.2003.2000.9500.0150.9503.5004.000
240.0110.9700.1000.0805.2003.2000.9500.0150.9503.5004.000
250.0110.9700.1000.0805.2003.2000.9500.0150.9503.5004.000
** Line 15 refers to the best ANN architecture.
Table 6. Connection weights and biases for the developed neural network model of the date juice.
Hidden Nodes aInputOutput
Wj,i bbj cW dBias e
DensityWater ActivityMoisture ContentTotal Soluble SolidsBrown IndexpHHydroxy Methyl FurfuralQuality Index
(g/cm3) (d.b.%)TSSBI HMFQi
2−0.2510.9010.4640.197−0.688−0.688−0.884−0.5010.615SSB
30.7320.2020.416−0.9590.9400.665−0.575−0.1790.792SSB
4−0.636−0.633−0.3920.050−0.136−0.4180.2240.511−0.364SSB
5−0.721−0.416−0.267−0.0880.570−0.6010.028−0.542−0.780SSB
60.185−0.9070.215−0.659−0.8700.8980.931−0.846−0.544SSB
70.617−0.391−0.8050.368−0.120−0.756−0.010−0.420−0.146SSB
8−0.9310.819−0.4820.325−0.3770.0400.093−0.6780.636SSB
9−0.6300.9390.5500.8790.7900.1960.8440.8590.721SSB
10−0.823−0.608−0.910−0.349−0.223−0.4570.6570.616−0.986SSB
11−0.286−0.4380.085−0.7180.604−0.8510.9740.2670.021SSB
120.544−0.603−0.9890.6310.4140.4580.5430.743−0.165SSB
13−0.852−0.283−0.7680.7260.247−0.338−0.8730.607−0.556SSB
14−0.378−0.3500.4590.2750.774−0.056−0.761−0.627−0.760SSB
150.4260.5220.1230.542−0.0120.045−0.1450.785−0.325−0.354
16−0.949−0.784−0.9370.273−0.3710.0170.8150.0790.886SSB
a: # Of Hidden Neurons. b: the Connection weights between the input and the hidden layer. c: the Hidden Biases. d: the weights of the hidden cells by the Qi output. e: the bias of the final output. SSB: the single shared bias for the output neuron.
Table 7. Statistical performance of the developed ANN model for Quality Index (Qi) of the date juice during the training, testing, and validation process.
Statistical ParameterQuality Index (Qi)
TrainingTestingValidation
ASE0.0090.0130.014
R20.9900.9760.971
RMSE0.0900.1130.116
MAE0.0700.0930.096
MARE4.4005.1605.310
RE2.7003.2203.360
E0.9800.9540.949
CRM0.0100.0110.013
OI0.9600.9360.931
AAD3.1003.9144.029
MAPE3.5004.2574.414
Disclaimer/Publisher’s Note: The statements, opinions and data contained in all publications are solely those of the individual author(s) and contributor(s) and not of MDPI and/or the editor(s). MDPI and/or the editor(s) disclaim responsibility for any injury to people or property resulting from any ideas, methods, instructions or products referred to in the content.