


Abstract
Ball milling can improve protein recovery from defatted rice bran, but the links among milling conditions, particle attributes, and extraction transport remain insufficiently defined. This study evaluated the effects of milling time (30–90 min) and rotational speed (30–120 rpm) on powder properties and alkaline protein extraction at pH 11 for 30–180 min at 24, 37, and 50 °C. Powders were characterized by laser diffraction, SEM image analysis, X-ray diffraction, and extraction-relevant indices describing the interfacial area and diffusion time scale. Extraction curves were fitted to first-order, pseudo-second-order, Peleg, and apparent Fick diffusion models. Milling reduced median particle size from 145 to 61 µm, increased fines (<45 µm) from 1.86% to 32.09%, and raised surface area proxies by about 30- to 40-fold. Compared with the control sample, milled samples generally showed faster extraction and higher protein recovery, with maximum endpoint recoveries of 89.91 mg g−1 at 24 °C, 90.06 mg g−1 at 37 °C, and 86.10 mg g−1 at 50 °C. Late-stage extraction data collapsed onto a Fickian master curve, indicating diffusion-limited behavior, and apparent effective diffusivity increased with temperature. At 37 °C, the radius–shape–circularity model explained nearly all the between-powder variation in , and the shape factor remained significant after accounting for particle radius . Overall, ball milling improved extraction primarily by reducing diffusion length and altering particle morphology, providing practical guidance for optimizing rice bran protein recovery.
1. Introduction
The valorization of food byproducts and residues is an important trend worldwide [1]. Rice bran (RB), the outer fraction removed during rice polishing, is increasingly regarded as a strategic agro-industrial side stream because it contains proteins, dietary fiber, minerals, vitamins, lipids, and phenolic compounds. From a protein recovery perspective, RB is attractive because its protein fraction has good nutritional value and a favorable amino-acid balance compared with many cereal by-products [2,3]. However, the valorization of RB as a human food protein source remains technically constrained. The bran matrix is highly heterogeneous: proteins are distributed within the aleurone layer and are physically embedded in a cell wall network rich in arabinoxylans, cellulose, lignin-like phenolic structures, phytate, and residual lipids. This matrix limits solvent access, slows hydration, and reduces the fraction of protein that can be solubilized during conventional extraction. In addition, stabilization or high-temperature handling can reduce protein solubility, making processing history a decisive factor in the recovery of functional rice bran protein ingredients.
Alkaline extraction followed by isoelectric precipitation is the most widely used route for obtaining rice bran protein concentrates or isolates because protein solubility generally increases at alkaline pH as proteins acquire net charge and dissociate from part of the surrounding matrix. Abd Rahim et al. [4] showed that rice bran protein concentrates extracted under mild alkaline conditions differed in physicochemical, structural, thermal, and functional properties depending on extraction pH and the drying method; their study specifically emphasized that extraction pH and freeze- or spray-drying changed solubility, foaming, and emulsion-related functionality. Cho et al. [5] further demonstrated that the thermal history of the bran is critical: for low-heat-treated defatted rice bran, protein solubility increased from 25.4% to 56% with increasing pH and was more than twice that of heat-stabilized defatted rice bran; the resulting protein also showed strong water-binding, oil-absorption, emulsifying, and foaming properties. These results show that alkaline extraction is effective, but they also indicate that yield and functionality are controlled not only by pH and temperature, but also by how readily the extraction medium can penetrate the bran structure.
Mechanical size reduction has therefore been explored as a pretreatment to improve the accessibility of RB components. Cao et al. [6] reported that hammer milling and ball milling reduced rice bran particle size across a wide range, down to a superfine fraction with D50 around 18.90 µm; this finer bran exhibited a higher water solubility index, antioxidant activity, γ-oryzanol and γ-aminobutyric acid contents, and a swelling capacity 1.37 times that of the coarser fraction. Their results also indicated a conversion of part of the insoluble dietary fiber fraction into soluble dietary fiber after ball milling. Similarly, Yin et al. [7] found that the micronization of stabilized rice bran reduced particle size and increased the whiteness, water solubility index, and nutrient releasability, including phenolics, flavonoids, γ-oryzanol, and minerals, although water-binding and swelling capacity decreased under some conditions. Zhao et al. [8] showed that superfine rice bran insoluble dietary fiber had higher water-holding capacity, swelling capacity, phenolic extractability, phenolic bioaccessibility, and antioxidant properties, but a lower oil-holding capacity than coarser powders. Taken together, these studies establish that reducing particle size changes hydration, solubility, and bioactive release, but they also show that particle size alone is not sufficient to predict functional behavior because pore collapse, particle agglomeration, surface chemistry, and matrix disruption can shift responses in different directions.
Evidence from cereal brans more broadly confirms that milling changes more than the median particle size. De Bondt et al. [9] compared wet and cryogenic milling of wheat bran and showed that cryogenic milling on a laboratory scale achieved a D50 of 6 µm, while large-scale cryogenic milling and wet milling produced D50 values of 28–38 µm. Importantly, microscopy showed that almost all bran cells were opened after milling; wet milling produced a more porous structure, larger surface area, and higher water-binding capacity than large-scale cryogenic milling. The same work reported that aqueous extractability increased from 11.9% in coarse bran to 20.0–28.4% after milling, and water-extractable protein increased from 2.91% to 4.25–6.50%, supporting the idea that bran comminution improves release by opening the aleurone and cell wall architecture rather than by only generating smaller particles. At the molecular level, cereal cell walls contain ferulate-mediated cross-links between polysaccharides and lignin precursors; Bunzel et al. [10] identified ferulate–coniferyl alcohol cross-coupled structures in cereal grain dietary fiber, indicating the radical cross-coupling of polysaccharides to lignin precursors through ferulate. This architecture helps explain why rice bran proteins can remain entrapped or associated with the cell wall/phytate/phenolic matrix and why alkaline extraction combined with mechanical disruption may increase accessibility.
However, the literature also indicates that harsher extraction is not always beneficial. Recent reviews of plant protein extraction emphasize that alkaline extraction, thermal exposure, drying, and fractionation can induce protein unfolding, aggregation, and reduced solubility. Yang et al. [11] specifically highlighted that extensive extraction can cause aggregation and decrease protein solubility, whereas milder extraction better preserves native, non-aggregated proteins. Tang et al. [12] likewise reviewed recent plant protein extraction and modification methods and emphasized that extraction conditions and assisted technologies influence yield, solubility, water/oil retention, emulsification, digestibility, gelation, and foaming. For rice bran, this means that temperature and pH may accelerate solubilization and diffusion, but they may also promote protein–protein or protein–phenolic association during alkaline extraction and acid precipitation. Therefore, extraction efficiency should be interpreted as the combined outcome of transport enhancement, matrix disruption, solubilization chemistry, and possible aggregation.
Solid–liquid extraction theory provides the framework for interpreting these effects. In particulate matrices, reducing particle size increases the interfacial area and shortens the diffusion path length, which should increase the early extraction rate and reduce the time required to approach equilibrium. Cacace and Mazza [13] measured effective diffusivity and mass-transfer coefficients during extraction from milled berry matrices and showed that solid–liquid extraction can be described through coupled effects of solvent composition, temperature, solvent-to-solid ratio, and particle-scale transport. In cereal brans, kinetic modeling has also been used to describe assisted extraction; for example, Milićević et al. [14] modeled ultrasound-assisted extraction of phenolics from oat and wheat bran, illustrating the usefulness of kinetic models for separating rapid early release from slower matrix-controlled extraction. Nevertheless, most rice bran and cereal-bran studies still report particle size using only a single descriptor, such as D50, or classify powders simply as coarse, fine, or superfine. Few studies derive particle descriptors relevant to extraction from the full particle size distribution, and fewer still relate these descriptors to kinetic parameters or effective intraparticle diffusivity.
This limitation is especially important for ball milling. Ball milling is not a simple linear size reduction operation: milling time, rotational speed, ball loading, and the fraction of critical speed determine whether the media cascade, cataract, or partially centrifuge. As a result, nominally higher speed or longer milling does not necessarily produce the most extraction-efficient powder. In rice bran, ball milling has been shown to improve hydration and solubility-related properties [6], and comminution models have been used to describe rice bran breakage and milling efficiency [15]. However, previous work has not quantitatively linked controlled ball-milling conditions to the particle descriptors that govern extraction transport, such as fines fraction, Sauter-type surface area proxies, morphology, diffusion length, and shape-related microstructural openness. This leaves an unresolved question: does milling improve protein recovery only by reducing the characteristic particle radius, or does it also alter the effective diffusivity through changes in porosity, tortuosity, fissuring, and matrix connectivity?
Accordingly, this study investigates the relationship among ball-milling conditions, particle descriptors, and alkaline protein extraction from defatted rice bran. Milling time and rotational speed were varied to generate powders with different particle size distributions and morphologies. The powders were characterized using laser diffraction, microscopy, X-ray diffraction, and extraction-relevant indices that describe fines generation, interfacial area, and relative diffusion timescale. Protein extraction was then performed under alkaline conditions at different temperatures and times, and the extraction curves were analyzed using first-order, pseudo-second-order, Peleg, and Fick diffusion models. By connecting milling parameters, particle structure, kinetic descriptors, and effective diffusivity, the study addresses the central gap left by previous work: the lack of a quantitative transport-based explanation for why and under which milling regimes ball milling improves rice bran protein recovery.
2. Materials and Methods
2.1. Raw Materials
Rice bran from the upland rice cultivar BRS Primavera (Oryza sativa L.) was supplied by Camil Alimentos S/A (Campinas, São Paulo, Brazil). The bran was passed through a 1 mm sieve to remove coarse impurities, then equilibrated to 5% moisture (dry basis) at 40 °C for 24 h in a convection oven. Rice bran was defatted using ethanol 96% at 50 °C for 6 h. Laboratory reagents of analytical grade were used throughout: sodium hydroxide (NaOH, 1 mol L−1) for alkaline protein extraction and citric acid (1 mol L−1) for pH adjustment during isoelectric precipitation and neutralization.
2.2. Sample Preparation and Ball Milling
Defatted rice bran samples (105 g per run) were milled in a laboratory ball mill (model TRS-3012, TARUN, Mumbai, India). The equipment consisted of a horizontal rotating cylindrical jar fitted to a variable-speed drive. The jar was operated as a dry tumbling mill, without added solvent, using stainless-steel grinding media. Before each run, the jar and balls were cleaned, dried, and inspected to avoid cross-contamination among milling treatments. Milling time (30, 60, or 90 min) and rotational speed (30, 75, or 120 rpm) were selected according to a design-of-experiments (DoE) matrix. The critical speed, Nc, of the mill jar was first estimated (Equation (1)) to express operating speeds as a percentage of Nc.
where Di is the internal jar diameter (m), and db is the ball diameter (m). The theoretical ball charge, Mb, was obtained from Equation (2), which corrects for packing voids (empirical factor = 0.6):
with ρb as the density of the stainless-steel balls (7.8 kg L−1), Vf is the chosen fractional filling (0.525), and Vj is the jar volume (L). Stainless-steel spheres, 20 mm in diameter, occupied 52.5% of the jar volume, corresponding to ≈1.9 kg of media. The set points 30, 75, and 120 rpm represent ≈21%, 53%, and 85% of Nc covering sub-critical, near-critical, and super-critical milling regimes, respectively [15].
2.3. Protein Extraction
Defatted rice bran (25 g) was suspended in distilled water, 500 mL; solid/liquid = 1:20, w/v, and the pH was adjusted to 11.0 with 1 mol L−1 NaOH. The slurry was agitated for 30, 60, 90, 120, and 180 min at 24, 37, or 50 °C using an orbital shaker at 200 rpm. After extraction, the mixture was centrifuged (3000 g, 20 min). The supernatant was filtered, and its pH was lowered to 4.5 with 1 mol L−1 citric acid to precipitate the protein (20 min, gentle stirring). The precipitate was recovered by centrifugation (3000 g, 20 min) and oven-dried at 50 °C for 24 h. Extract-yield (%) and protein content (%) were the response variables. A completely randomized design with a 3 × 5 factorial arrangement (temperature × time) was applied in duplicate.
2.4. Characterization of Defatted Rice Bran
2.4.1. Particle Size Distribution
The volume-based particle size distribution (PSD) of untreated and ball-milled bran powders was measured by laser diffraction (Mastersizer 3000 S, Malvern Instruments, Worcestershire, UK; measurement range 0.02–2000 µm). The dried sample (0.50 ± 0.01 g) was dispersed in 100 mL of isopropanol under continuous stirring; the suspension was ultrasonicated for 3 min to break weak agglomerates before being circulated through the optical cell. Each sample was analyzed in triplicate at an obscuration of 10 ± 2%, and the instrument’s multiple-scattering model was applied using a refractive index of 1.53 (bran) and 1.39 (isopropanol). From the cumulative volume curve, the characteristic diameters D10, D50, and D90 were extracted, where D50 denotes the median size below which 50% of the particle volume is found [15].
2.4.2. Derived Extraction-Relevant Particle Size Indices (LSI, RDHT, LPS)
To mechanistically relate comminution to early-time leaching, three indices were computed from the laser-diffraction PSD (volume basis). A fines-weighted interfacial area (LSI), a relative diffusion half-time index (RDHT), and a combined leaching potential score (LPS). The volume percentiles D10, D50, and D90 the cumulative volume undersized at the chosen “fines” cutoff (<45 µm) were taken directly from the instrument output. A surface area proxy (SSA) was calculated using Equation (3)
where Fines% is the cumulative volume fraction < 45 µm. Because milled powders commonly exhibit lognormal PSDs, we parameterized using the reported percentiles: and with . The Sauter mean diameter was then obtained from the moment ratio for the diameter distribution.
The fines-weighted interfacial area (leaching surface index, LSI) can be determined for approximately spherical particles, and the specific interfacial area per unit solid volume is as presented by Equation (4).
The use of to represent surface-controlled transport is standard for spherical particles. To obtain a compact, dimensionless measure of how milling alters the characteristic time scale of diffusion-limited extraction, we defined a relative diffusion half-time index (RDHT) based on the classical Fick scaling . In a strictly intraparticle Fickian regime, the characteristic length is the diffusion distance inside the particle; here, we approximate by the volume-based median particle diameter D50 obtained from laser diffraction and treat the effective diffusivity as approximately similar among powders at a fixed temperature. Under this simplifying assumption, the ratio of diffusion half-times between a milled powder and the unmilled control is proportional to the squared ratio of their characteristic diameters. We therefore estimated relative half-times among conditions from the median diameter using Equation (5).
where D50,i is the median diameter of sample and D50, control is the median diameter of the untreated defatted rice bran (control) measured in the same way (Table 1). By construction, in a purely geometric Fick model; values less than 1 indicate shorter expected diffusion half-times relative to the control. We stress that the RDHT is used here as a particle-scale geometric proxy for relative time scales, not as a replacement for the effective diffusivities obtained from explicit Fick fitting (Section 3.6). The latter incorporate sub-particle features such as porosity and tortuosity in an effective manner and are subsequently related to morphological descriptors. A combined leaching potential score (LPS) can be determined by coupling the area effect (LSI) with the path-length effect (RDHT) as presented by Equation (6).
All PSD statistics used the volume distribution; the Sauter mean diameter was computed from the lognormal fit as above. Where needed, we cross-checked consistency with the moment notation .
Table 1.
The particle size, surface area, structural, and 2D morphology descriptors of defatted rice bran powders obtained under different ball-milling conditions. Sample codes indicate the milling treatment: S0 = unmilled control; S1 = 30 min and 30 rpm; S2 = 30 min and 120 rpm; S3 = 90 min, 30 rpm; S4 = 90 min and 120 rpm; S5–S7 = replicated center-point treatments at 60 min and 75 rpm.
2.4.3. Particle Length Measurement
The particle lengths of the rice bran samples were measured using scanning electron microscopy (SEM) images. Particle morphology was evaluated by scanning electron microscopy (SEM) with a TESCAN VEGA 3, Brno, Czech Republic, operated at 5 kV and with magnifications ranging from 250× to 500×. No coating was required. The particles were mainly irregular but predominantly rectangular. The lengths were measured directly from the SEM images using ImageJ, version 1.50 [16]. Each particle was measured twice: once for its length, the larger dimension, and once for its width, the shorter dimension. For each powder, the projected length and width of 1000 particles were measured. With these measurements, two calculations were made for the aspect ratio and circularity, using both Equations (7) and (8), respectively.
where is the aspect ratio (dimensionless), (dimensionless) is the circularity or isoperimetric quotient, A is the particle area (m2), and P is the particle perimeter (m).
2.4.4. X-Ray Diffraction
Native and milled samples of rice bran were characterized using a Shimadzu XRD-7000, Kyoto, Japan diffractometer (40 kV, 40 mA). Samples were scanned from 5° to 45° 2θ at 0.02° min−1. Diffractograms were smoothed using the Savitzky–Golay algorithm, and the powder crystallinity was quantified using the Segal method (Equation (9)), defining I200 as the maximum intensity within 22.0–23.5° 2θ and Iam as the minimum within 18.0–19.0° 2θ [17].
2.4.5. Water Holding Capacity (WHC)
One gram of dry ground rice bran was weighed and transferred into a test tube, and 10 mL of distilled water was added. The mixture was then vigorously vortex-mixed for 1 min to ensure complete dispersion and hydration of the sample. After shaking, the test tube was left to stand at room temperature for 30 min to allow for further hydration. Following this resting period, the hydrated mixture was centrifuged at 3000 rpm for 20 min. After centrifugation, the supernatant was carefully discarded, and the weight of the hydrated residue, corresponding to the rice bran with the retained water, was measured. The WHC was calculated using Equation (10)
where is the weight of hydrated bran and is the weight of dry bran. The result was expressed in grams of water retained per gram of dry rice bran.
2.4.6. Water Solubility Index (WSI)
Here, 2.5 g of dry rice bran was added to a test tube, followed by the addition of 30 mL of distilled water. The sample was placed in a water bath at 60 °C for 30 min with occasional stirring to ensure uniform mixing. After heating, the mixture was centrifuged at 3000 rpm for 20 min to separate the solid and liquid phases. The supernatant was then filtered using filter paper, and the residue collected on the filter paper was dried in an oven at 105 °C until a constant weight was achieved. The WSI was calculated using Equation (11).
where is the weight of dried residue, is the initial weight of the rice bran, and the result was expressed as a percentage of solubility.
2.4.7. Swelling Index
One gram of dry ground rice bran was weighed and placed into a graduated cylinder. Ten milliliters of distilled water was then added to the cylinder, and the mixture was left to stand at room temperature for 30 min to allow for complete swelling of the sample. After the resting period, the final volume of the hydrated rice bran in the graduated cylinder was recorded. The SI was calculated as the final volume of hydrated bran divided by the initial weight of dry bran. The result was expressed in milliliters of water retained per gram of dry rice bran.
2.5. Protein Extraction Characterization
Protein Content
Total protein was determined by Kjeldahl and was adapted for defatted rice bran as follows: the ground sample (0.5000 g) was weighed into a Kjeldahl tube with a 1.80 g catalyst (K2SO4/CuSO4, 10:1 w/w) and 12.0 mL concentrated H2SO4, then digested on a block at 420 °C until water-clear. After cooling, 30 mL of deionized water was added; the digest was made strongly alkaline with 50 mL of 40% (w/v) NaOH and immediately steam-distilled into 50 mL of 4% (w/v) boric acid containing a mixed indicator, collecting 200 mL of distillate. Ammonia was titrated with standardized 0.1 N HCl to a faint purple endpoint; a reagent blank was processed identically. Nitrogen was calculated as in Equation (12) (with and in mL, in N, and in g), and the protein was reported as (rice-specific conversion factor) [18].
2.6. Kinetic Modeling of Protein Extraction
Three widely used empirical/semi-mechanistic models were fitted to M(t) [19]. The first-order (washing-type) is expressed by Equation (13).
where M(t) is the cumulative mass of protein in the liquid at time t (mg g−1 dry bran), M∞ is the asymptotic mass at the given pH and temperature (mg g−1), k is the apparent first-order rate constant (min−1), t is time (min), v0 is the initial extraction rate at t = 0 (mg · g−1 min−1) and t1/2 is the half-time to reach 50% of variation. Pseudo-second order (PSO) can be applied using a convenient plotting form given by Equation (14).
where h is the initial rate (mg g−1 min−1), k2 is the PSO constant (g mg−1 min−1). Finally, the Peleg model was applied in the linearized form given by Equation (15).
where k1 is the Peleg rate constant (min·g mg−1) and given by , k2 is the Peleg capacity constant (mg−1) and given by .
2.7. Fick Diffusion
For a porous particle of “radius” , Fick’s second law in spherical coordinates with a well-mixed bulk gives the standard fractional release curve (Crank solution) as presented by Equation (16) [20,21]
where is the effective intraparticle diffusivity (includes porosity/tortuosity effects) and the asymptotic extractable mass at the test pH. In practice, the first term () is usually sufficient beyond the very first minutes, thus Equation (17) [22].
Because SEM provides 2D projections of irregular particles, the radius used in the Fick model was defined as a projected-equivalent radius, , calculated from the equivalent-area circle of the projected particle. This radius was used as a comparative geometric descriptor among milling treatments, not as a direct measurement of the true 3D diffusion length. Thus, R is given by Equation (18).
Finally, we needed to determine whether milling only changes effective diffusivity (De) via R or whether it also changes via tortuosity/porosity. To do so, we regress the diffusion coefficient with the radius, the shape factor, and circularity, as presented by Equation (19).
where is the aspect ratio (dimensionless) and (dimensionless) is the circularity or isoperimetric quotient. Nonzero coefficients for circularity or shape factor indicate that 2D projected morphology covaries with the apparent diffusivity after accounting for the projected radius. These coefficients should be interpreted as evidence of morphology-dependent apparent transport behavior, not as direct quantification of 3D tortuosity, pore connectivity, or internal surface area. Recent work on confined particle systems further illustrates that particle organization and transport-relevant geometry can depend strongly on three-dimensional confinement, reinforcing the need for caution when inferring 3D structure from 2D projections alone [23].
2.8. Statistical Analysis
Data are reported as mean ± standard deviation. One-way ANOVA assessed the effects of milling or extraction conditions. When significant (p < 0.05), pairwise comparisons were made with the Student t-test (control vs. milled) or Tukey’s HSD (multiple temperatures and times). All analyses were performed with Statistica 12.0 (StatSoft, Tulsa, OK, USA) at α = 0.05.
3. Results and Discussion
3.1. Impact of Milling Conditions on the Powder Properties
Table 1 presents the effects of ball-milling parameters on the properties of defatted rice bran. Laser diffraction results indicate that ball milling significantly alters the particle size distribution (PSD) of the defatted rice bran, with notable implications for fines formation and, consequently, surface area. Relative to the unmilled control (D50 = 145 µm; fines < 45 µm = 1.86%), all milling treatments reduced the median size and enriched the fines fraction; the most intensive condition in this set (90 min, 30 rpm) reached d50 = 61 µm with 32.1% fines, while the matched 90 min, 120 rpm case reached D50 = 66 µm with 26.8% fines. These shifts were accompanied by a broadening of the volume PSD (Span from 1.31 to 2.49), consistent with the simultaneous generation of fine fragments and the persistence of a coarse tail. The volume-based Sauter mean diameter (d32) decreased from 319 µm (control) to ≈166–178 µm for most milled samples, evidencing a significant increase in the area-to-volume ratio; the sole exception (30 min, 120 rpm; d32 ≈ 446 µm) coincided with a broad coarse tail (d90 = 255 µm), suggesting transient agglomeration or incomplete deagglomeration at a short residence time [15]. The proxy-specific surface area and related interfacial indices (LSI, LPS) rose sharply, SSA_proxy from 0.128 mm−1 (control) to 5.261 mm−1 (90 min, 30 rpm), i.e., ~40×, mirroring the fines enrichment and d50 reduction.
Comparing milling time and speed at fixed durations highlights that, within the explored window, time was the dominant lever. At 30 min, 30 rpm produced a substantially finer powder than 120 rpm (D50 = 86 vs. 108 µm; SSA_proxy = 1.380 vs. 1.134 mm−1) with similar fines (~12%). Extending the time to 90 min intensified fragmentation at both speeds, but the 30 rpm treatment again delivered the highest fines (32%) and the largest surface area proxy (5.261 mm−1). The three 60 min/75 rpm replicates clustered tightly (D50 ≈ 84–85 µm; fines ≈ 11.6–12.3%; SSA_proxy ≈ 1.38–1.47 mm−1), indicating stable performance near the mid-range speed. This non-monotonic speed response is consistent with ball-mill charge dynamics: grinding efficiency typically peaks around 65–80% of the critical speed (here, ~53% at 75 rpm) and can decline near supercritical regimes (~85% at 120 rpm) due to the partial centrifuging of the media that reduces impactful collisions [24]. At very low speeds, extended time can partially compensate for the shorter cumulative contact [25]. Nitrogen adsorption–desorption isotherms (Brunauer–Emmett–Teller, BET) are presented in Figure 1A. The anomalously high Sauter mean diameter (d32 ≈ 446 µm) for sample 2 (30 min, 120 rpm) can be rationalized by a transient agglomeration and incomplete deagglomeration of fines at short residence times under near-supercritical motion. At ≈85% of the critical speed, a portion of the charge tends to adhere to the jar wall and move in a cataracting/centrifuging regime, which reduces high-energy impact events while favoring the coating of larger fragments by fines. This “snowballing” behavior broadens the coarse tail (higher D90) and artificially inflates d32 even though the D50 and fines content suggest a generally milled powder. With longer residence (90 min) at the same speed, repeated collisions and friction, are sufficient to break these agglomerates, and d32 falls into the 170–180 µm range, consistent with the other milled conditions.
Figure 1.
(A) The nitrogen adsorption–desorption isotherms (Brunauer–Emmett–Teller, BET) for the control powder (S0) and milled powders (S1–S7) at 77 K. The adsorbed N2 volume (cm3 STP g−1) is plotted as a function of relative pressure (p/p0). (B) The X-ray diffraction spectrograms of the six rice bran samples before (Sample 0) and after ball milling (Sample 1–7).
The morphological descriptors from microscopy confirm a substantive size reduction, accompanied by only modest changes in 2D shape. The equivalent minor and major Feret diameters fell from 119 × 227 µm (control) to 44–68 × 98–133 µm across milled powders, while circularity remained narrowly distributed (~0.68–0.70). The shape factor varied more (≈0.53–0.67) and tended to be lower under the highest speed cases at the same time, for example, at 30 min, the results were 0.55 at 120 rpm vs. 0.64 at 30 rpm, implying slightly more elongated/irregular fragments when high rotational speed is applied briefly, which is consistent with the PSD broadening and coarse-tail persistence noted above. The literature on cereal brans suggests that mechanical pretreatments, which open cell walls and fragment aleurone layers, increase the surface area and create more water-accessible porosity. The balance between true comminution and secondary agglomeration, however, depends on the milling route and energy input [9].
X-ray diffraction spectrograms are presented in Figure 1B. X-ray diffraction revealed modest, non-monotonic changes in the Segal crystallinity index (≈18–26%), with the maximum values registered for 30 min/120 rpm (25.7%) and the intermediate values for 60 min/75 rpm (21–24%). All samples displayed the characteristic cellulose I diffraction pattern with main reflections near 2θ ≈ 16° and 22°. Milling did not change the polymorphic form, but the milled powders exhibited slightly broader peaks and a modest change in Segal crystallinity index compared with the control, consistent with the increased disorder and partial disruption of the wall polysaccharide microstructure. However, because ball milling is known to reduce cellulose crystallinity via lattice disordering and crystallite downsizing, the absence of a uniform decrease here likely reflects two factors: (i) preferential fragmentation and selection within a heterogeneous bran matrix, cellulose-rich fragments vs. amorphous constituents [26], and (ii) known limitations of the Segal index—its sensitivity to crystallite size, preferred orientation and background subtraction, which can shift “apparent” crystallinity without a proportional change in ordered mass [27]. Both effects are frequently reported for milled lignocellulosics, advising caution in interpreting minor CrI differences [28]. All samples displayed the characteristic cellulose I diffraction pattern with main reflections near 2θ ≈ 16° and 22°. Milling did not alter the polymorphic form, but the milled powders exhibited slightly broader peaks and a modest increase in the Segal crystallinity index compared with the control, consistent with increased disorder and partial disruption of the wall’s polysaccharide microstructure.
Representative SEM micrographs of the defatted rice bran particles are shown in Figure 2. The images reveal that the samples consisted of irregular, non-spherical particles with rough and heterogeneous surfaces, consistent with the fibrous and multilayered structure of bran tissues. Depending on the milling condition, the particles showed different degrees of fragmentation, edge breakage, and agglomeration. In several micrographs, disrupted surface layers and pore-like features can be observed, suggesting the partial breakdown of the original cell wall architecture. These morphological changes are relevant because they may increase the exposed surface area and facilitate solvent penetration during alkaline extraction.
Figure 2.
Representative scanning electron microscopy (SEM) images of the defatted rice bran particles obtained under the different ball-milling treatments used in this study. Magnification: 500×; scale bar = 100 µm.
Importantly, the diffusion-relevant time scale implied by these structural changes shortened markedly. As defined in Equation (5), estimates the ratio of diffusion half-times between each powder and the control, assuming similar ; hence, values below 1 indicate that milling has shortened the late-time diffusion scale relative to the unmilled bran. The relative diffusive half-time (RDHT; normalized index) decreased from 1.000 (control) to 0.177–0.352 for the most fragmented powders, in line with Fickian scaling (t ~ R2/De).
Overall, the PSD and morphology results present a coherent picture, since prolonged milling (90 min) yields the most significant gains in surface area and enrichment of fines. At the same time, very high rotational speed (≈85% of critical) at short times is less effective and can even broaden the coarse tail—a pattern consistent with classical tumbling-mill physics.
3.2. Water and Oil Holding Capacities
Figure 3 presents the results for water and oil holding capacities. Relative to the control, milled samples show (i) modest to condition-dependent changes in water retention/holding and swelling, and (ii) a more apparent rise in solubility—especially in water—at higher milling intensities. In the oil system, oil retention tends to be lower and more sensitive to severe comminution than the corresponding water metrics. In contrast, oil-phase “swelling”/dispersibility and “solubility” remain comparatively small. These patterns mirror how milling simultaneously increases specific surface area and fines, thus benefiting solubilization. Still, they can also collapse capillaries and disrupt hydrophobic binding sites that support liquid retention, particularly for oils. This balance—surface creation versus pore/cell wall collapse—is a recurring theme in bran micronization, since excessive mechanical stress or over-processing can collapse pores or cell walls, reducing the overall porosity and potentially forming denser regions [29].
Figure 3.
Comparison of water (left) and oil (right) retention, swelling, and solubility indices for all samples, including the control. The bars represent the mean values, with error bars showing standard deviation. The results highlight the impact of milling on the functional properties of the samples, with notable variations in holding capacity, swelling, and solubility indices between water and oil systems. Different lowercase letters above bars indicate statistically significant differences among samples within the same response variable according to Tukey’s HSD test . Letters should be interpreted separately for each property and should not be compared across different properties.
Milling-induced fragmentation of cell walls and hemicellulose/cellulose matrices increases the accessible surface area. It exposes hydrophilic groups, an effect that typically enhances hydration kinetics, water uptake, and solubility—with the precise outcome depending on the amount of porosity retained. For defatted rice bran, airflow-impact milling (AFIM) increased the water solubility index (WSI) and swelling capacity. Still, it decreased the water-holding capacity (WHC) as milling intensified—consistent with the rapid hydration of smaller fragments, yet fewer intact capillaries to hold bulk water [30]. Likewise, ball-milled rice bran with a finer D50 showed significantly higher WSI and higher swelling than the coarse one. These data support the upward trend in water solubility observed in Figure 3 under harsher milling conditions, while explaining why swelling/WHC can plateau or even decline at the most severe settings [6]. At the same time, reports across cereal brans show that the direction and magnitude of WHC and swelling depend on how the structure is broken. Wet or cryogenic milling of wheat bran, for example, can increase porosity and water binding capacity relative to dry milling, underscoring that pore architecture, not just particle size, governs water retention. This helps rationalize why our water-holding/swell responses change only modestly under some conditions but diverge under others [9].
Oil uptake is driven by nonpolar surfaces, internal porosity, and protein–lipid interactions. As milling shifts insoluble DF toward finer fragments and toward SDF, studies on rice bran IDF report lower oil-holding capacity (OHC) for superfine fractions despite higher WHC/WSI—exactly the trade-off suggested by Figure 1. AFIM of defatted rice bran similarly decreased OHC as milling severity rose, even while WSI increased. Mechanistically, severe comminution reduces the prevalence of large, hydrophobic voids and alters surface chemistry, diminishing capillary entrapment and hydrophobic binding that favor oil retention. Enzymatic/physical modifications of rice bran DF further show that OHC and WHC often respond in opposite directions when DF composition and microstructure are rebalanced [8].
The PSD shifts measured more fines and significant SSA gains, providing a straightforward basis for the monotonic or near-monotonic increase in WSI, as it created shorter diffusion paths and increased the interfacial area. However, retention of water or oil and swelling are microstructure-limited properties, which means that beyond a threshold, further size reduction can reduce network continuity and capillary volume, causing WHC/OHC plateaus or declines despite rising WSI. This “crossover” behavior is reported for rice bran micronization. This observation is consistent with the current understanding that the most aggressive milling does not always yield higher water/oil retention, even though solubility continues to increase [7].
Beyond the geometrical increase in surface area, milling can shift matrix composition and intermolecular binding in ways that directly affect hydration and oil uptake. Rice bran is rich in insoluble arabinoxylan-type cell wall polysaccharides bearing ferulic acid, phenolic acids, flavonoids, and phytate, in addition to proteins and residual lipids; these constituents govern the capillarity, charge balance, and interfacial chemistry of the fragments that hydrate or bind oil. Superfine/micronizing treatments of rice bran insoluble dietary fiber consistently report higher water-holding and swelling capacities with decreasing particle size when wall porosity is preserved, but lower oil-holding capacity as hydrophobic voids are diminished patterns that match the divergences we observe between WHC/WSI and OHC under the harsher conditions. The underlying causes include (i) the redistribution and partial solubilization of wall polysaccharides, which increases water-accessible domains; (ii) the release of ferulate-decorated arabinoxylans that form hydrated networks; and (iii) a greater liberation of phenolics, which can adsorb at particle surfaces and alter wettability, sometimes depressing oil uptake despite enhanced water affinity. These composition-level shifts are well supported for rice bran and related cereal brans, and they rationalize why WHC/WSI and OHC do not always move in parallel as the PSD tightens [31].
Comprehensive studies on defatted rice bran confirm that functional properties stem from the SDF/IDF balance and the integrity of the wall matrix. Enzyme-assisted or enzyme-micronization treatments that raise SDF tend to increase WSI and may lower OHC, whereas processes that preserve porous networks can sustain or increase WHC. Particle size-focused work on rice bran IDF shows higher WHC and swelling but lower OHC for superfine fractions, aligning tightly with the oil/water asymmetries in Figure 3 [32].
3.3. Influence of Ball Milling and Temperature on Protein Extraction
Figure 4 presents the time course of protein extraction for each of the milled samples at different temperatures. Protein recovery increased monotonically with the extraction time for all powders and temperatures, and replicate precision was high at the 180 min endpoint (median CV ≈ 1.14%, range 0.19–1.71%, n = 3). At 24 °C, the milled powders all finished above the control (S0 = 67.18 ± 0.13 mg g−1), with S3 yielding the highest value (89.91 ± 0.44 mg g−1), followed by S4 (82.50 ± 0.93 mg g−1), S2 (81.85 ± 0.28 mg g−1), and S1 (78.83 ± 0.51 mg g−1). At 37 °C, recoveries rose for the top performers and the ranking shifted: S2 and S4 reached 90.06 ± 1.01 and 87.95 ± 1.47 mg g−1, respectively, ahead of S3 (83.12 ± 1.18 mg g−1). At 50 °C, the best endpoint was obtained with S1 (86.10 ± 0.49 mg g−1), closely followed by S3 (83.25 ± 1.09 mg g−1), S4 (82.81 ± 1.06 mg g−1), and S2 (80.99 ± 0.76 mg g−1). Across temperatures, the most robust high-yield powders were S3, S4, and S2, whose 180 min means averaged 85.43, 84.42, and 84.30 mg g−1, respectively.
Figure 4.
The extraction protein time course for each temperature and sample. The values are presented as mean ± standard deviation. To avoid overcrowding the figure, statistical groupings are presented in Table S1. Within each temperature and extraction time, different lowercase letters indicate significant differences among samples according to Tukey’s HSD test .
The comparison between S1 and S3 is particularly informative because both powders were produced at the same rotational speed, 30 rpm, but with different milling times. Extending the milling time from 30 min in S1 to 90 min in S3 reduced D50 from 86 to 61 µm and increased the fines fraction from 11.87% to 32.09%, but it also broadened the particle size distribution, with span increasing from 1.43 to 2.49. This produced a clear trade-off between rapid early extraction and the size of the slowly accessible protein pool. At 24 °C, S1 showed higher extraction during the early and intermediate stages, but S3 overtook it at 180 min, reaching mg g−1 compared with mg g−1 for S1. At 37 °C, S3 also achieved a higher endpoint than S1, versus mg g−1. In contrast, at 50 °C, S1 remained superior over the practical extraction window and reached mg g−1 at 180 min, compared with mg g−1 for S3. Therefore, longer low-speed milling increased the accessible protein pool at low-to-moderate temperature, whereas shorter low-speed milling favored faster and more robust extraction under the highest temperature condition.
One-way ANOVA (factor: milling condition S0–S7) performed at every post-zero time point showed significant differences among powders at all temperatures. At 24 °C, F ranged from 124 at 30 min to 575 at 180 min (p = 9.6 × 10⁻¹³ to 5.3 × 10⁻¹⁸). At 37 °C, F = 43–219 (p = 3.2 × 10⁻⁹ to 1.1 × 10⁻¹⁴), and at 50 °C, F = 269–609 (p = 2.3 × 10⁻¹⁵ to 3.4 × 10⁻¹⁸). Tukey’s HSD (α = 0.05) applied to the 180 min data within each temperature separated the powders into distinct groups. At 24 °C, S3 formed the top group; S4/S2 were statistically indistinguishable from one another but lower than S3; S1 stood below that pair, and all milled powders exceeded the control. At 37 °C, S2/S4 were the best and significantly higher than the next group (S3/S5), while S7/S6 formed a third tier; again, all milled powders were above the control. At 50 °C, S1 was significantly higher than the (S3/S4/S2) tier, which in turn was higher than (S5/S7/S6); the control remained the lowest. A two-way ANOVA on the 180 min data for sample and temperature factors corroborated strong main effects and a large interaction: Sample F (7,48) = 686.3, p = 7.6 × 10−46; Temperature F (2,48) = 59.2, p = 1.1 × 10⁻¹³; and Sample × Temperature F (14,48) = 75.7, p = 8.9 × 10⁻²⁸. Partial η2 computed from the sums of squares underscored the magnitude of these effects at the endpoint: η2_partial = 0.990 for Sample, 0.711 for Temperature, and 0.957 for the interaction, indicating that the milling route and temperature both shape the achievable recovery and that the best milling condition depends on the operating temperature used.
The patterns are consistent with a mechanistic picture in which milling promotes extractability by increasing the accessible surface area and opening the cell wall matrix, thereby improving solvent access to protein bodies. In parallel, well-established extraction theory and experimental work in natural product processing confirm that reducing particle size enhances extraction efficiency by shortening diffusion path lengths and increasing interfacial area, up to the point where over-fine powders begin to complicate handling and separation [17].
Milling also alters the binding of proteins within the bran matrix, so temperature-dependent extraction reflects not only diffusion but also the chemistry of release and reassociation [33]. In addition to transport effects, composition-mediated interactions may contribute to the temperature- and milling-dependent extraction behavior, although these chemical pathways were not directly quantified in the present study. Rice bran contains phenolic acids, phytate, proteins, and cell wall polysaccharides, and previous studies have shown that protein–phenolic and protein–phytate interactions can influence protein solubility, aggregation, and recovery during plant protein extraction. Under alkaline conditions, the deprotonation of proteins and matrix components may modify electrostatic interactions and increase protein solubilization, whereas alkaline extraction and isoelectric precipitation can also promote protein aggregation and reduce solubility. Therefore, differences in plateau recovery among powders with similar median particle size may partly reflect chemical interactions between proteins and non-protein matrix constituents. However, because free phenolics, phytate content, bound ferulates, and protein–phenol adducts were not measured here, this explanation should be regarded as a plausible interpretation rather than direct evidence. The experimentally supported conclusion of the present work is that ball milling altered particle size, morphology, hydration behavior, and apparent extraction kinetics [34].
For rice bran specifically, alkaline extraction followed by isoelectric precipitation remains the conventional route. It was previously reported that low-heat histories preserve protein solubility and improve recovery compared with the high-temperature stabilization or desolventization of the meal. In low-heat defatted rice bran, the solubility of the extracted proteins is roughly doubled compared to the heat-stabilized raw material, and low-temperature desolventization improves the extraction yield and product quality, as opposed to the 110–120 °C profiles used in oil mills [5]. The temperature trends in our dataset fit this framework: moving from 24 to 37 °C generally lifted the endpoint recovery of the best powders (notably S2 and S4), which is consistent with enhanced solubilization and diffusivity under alkaline pH, whereas performance at 50 °C depended on the powder, with S1 excelling but several other milled powders not gaining further. This variability is plausible because, beyond a threshold, alkaline extraction and the subsequent precipitation step can promote protein–protein (and protein–phenolic) aggregation, which reduces the amount ultimately recovered in the target fraction; the balance between faster solubilization and aggregation is known to be sensitive to both the thermal and the mechanical history of the bran [11]. Finally, historical and recent rice bran studies converge on similar operating windows—pH ≳ 11 and 30–60 °C—for maximizing recovery while limiting damage to solubility, which aligns with the observation that the most reliable high-yield powders here were those optimized for moderate extraction temperatures [35].
3.4. Kinetic Modeling
Table 2 condenses the kinetic descriptors obtained from the best-fitting model at each temperature, reported uniformly as the initial rate , half-time t1/2, and asymptote M∞ within the M-domain. At 24 °C, milling consistently accelerated extraction relative to the control (S0). For instance, rose from 1.21 ± 0.03 to 1.58 ± 0.03 mg g−1 min−1 (S6) and 1.78 ± 0.02 mg g−1 min−1 (S1), and t1/2 shortened from 40.2 ± 1.4 to 33.6 ± 0.9–31.3 ± 0.4 min. Gains in M∞ were sample-dependent, S2/S4 rose to 85.01 ± 0.21/87.65 ± 1.32 mg g−1, whereas S3 combined a very high M∞ (121.52 ± 1.50 mg g−1) with the slowest approach t1/2 = 92.7 ± 2.1 min, indicating a sizable slowly accessible fraction that requires longer residence to realize. The pattern M∞, with higher v0 and shorter t1/2 after milling, governed by how much of the protein pool becomes accessible, is consistent with classical mass-transfer expectations and protein release from the bran matrix since reducing particle size and opening the bran microstructure increases the interfacial area, shortens diffusion paths, and promotes hydration/solvent ingress.
Table 2.
The harmonized kinetic descriptors from best-fitting kinetic modeling. The values at 24 °C are derived from the first-order model with and . The values at 37 °C and 50 °C are derived from the PSO/Peleg hyperbolic form using the common linearization : . All fits used weighted least squares (first-order: weights ; PSO/Peleg: weights from the delta-method on ); the 95% confidence interval half-widths are from the fit covariance (delta-method for derived quantities). R2 is computed in the M-domain and shown without confidence intervals.
Raising the temperature to 37 °C changed both the pace and the extent of extraction. Initial rates generally increased, and several milled powders exhibited substantially larger M∞. S2 reached 151.20 ± 2.71 mg g−1 and S4 134.86 ± 8.63 mg g−1, even though their t1/2 values were long (122.6 ± 4.0 and 102.8 ± 14.3 min, respectively). By contrast, S6 showed a fast-and-shallower profile v0 = 2.93 ± 0.19, t1/2 = 31.1 ± 2.5 min and M∞ = 90.92 ± 1.74. This diversity illustrates the typical trade-off between early accessibility and the total accessible pool, which is strongly shaped by the milling route; in this case, it is shaped by surface creation vs. pore-network opening and by the thermal enhancement of solubilization at alkaline pH. The preference of a hyperbolic form (PSO/Peleg) at 37 °C reflects the pronounced front-loaded curvature that a single exponential underfits, a well-documented behavior in plant-matrix extractions [14].
At 50 °C, the front-end acceleration was even more marked since S1 exhibited an exceptional 9.74 ± 0.19 mg g−1 min−1 with 9.30 ± 0.19 min, finishing at M∞ = 90.57 ± 0.19 mg g−1 by 180 min; S4 was similarly fast while S2 combined a much larger M∞ (103.40 ± 0.20 mg g−1) with a long (49.85 ± 0.29 min), i.e., slow but deep. These outcomes align with the dual role of temperature in alkaline extraction, where higher temperatures speed up external film transfer and near-surface solubilization, steepening the initial rise (captured by PSO/Peleg). However, the eventual plateau can depend on the powder-specific microstructure and whether extraction/precipitation steps induce aggregation that caps the recoverable protein. Recent reviews show that milder extraction histories preserve solubility, whereas aggressive alkaline-thermal histories foster protein–protein and protein–phenolic association, reducing the practically recoverable fraction—consistent with high-rate/ moderate M∞ profiles in some milled powders at 50 °C [12].
The S1–S3 contrast further clarifies this kinetic trade-off. At 24 °C, S1 behaved as a fast-extracting but lower-capacity powder, with mg g−1 min−1, , and mg g−1. In contrast, S3 showed a slower approach to equilibrium, with mg g−1 min−1 and , but a much larger fitted asymptote, mg g−1. This indicates that the longer low-speed milling condition generated a deeper but slower-releasing protein fraction. At 50 °C, however, S1 became the more process-efficient powder, combining a very high initial extraction rate mg g−1 min−1) with a short half-time min). Thus, S1 is preferable when short residence time and high-temperature extraction are prioritized, whereas S3 is advantageous when the objective is maximum recovery under longer extraction at a low or moderate temperature.
Taken together, the table reveals three recurring archetypes across powders and temperatures. Fast and shallow (e.g., S1 at 50 °C) prioritizes throughput with very high , very short , but only moderate M∞. Slow but deep (e.g., S3 at 24 °C; S2 at 37–50 °C) accumulates in larger amounts over time. Balanced cases (e.g., S3/S4 at 50 °C) show intermediate and with solid plateaus. From a process standpoint, the “best” powder, therefore, depends on whether the objective is short residence or maximum yield at alkaline pH. The fact that all milled powders outperformed the control in either speed, extent, or both is consistent with the literature, which states that the micronization of cereal brans increases the porosity and surface area. At the same time, general extraction theory predicts higher rates and equilibrium yields as particle size decreases and internal pathways are unblocked [9].
Finally, the near-unity values (0.996–1.000 for most entries) indicate that the chosen models capture the salient kinetics without overfitting, and they are standard in the extraction literature for plant matrices. In particular, PSO/Peleg provides a compact, statistically robust description of two-stage release (rapid initial change followed by a slower approach). At the same time, a first-order law suffices when a single characteristic time dominates—as observed here at 24 °C. These modeling choices, together with the milling- and temperature-driven shifts in v0, t1/2, and M∞, offer a coherent mechanistic narrative that dovetails with prior reports on particle size/temperature effects and on the modeling of solid–liquid extraction in food systems [14].
3.5. Fick Diffusion
Table 3 reports the geometry-constrained Fick fits obtained by solving the spherical Crank model with the particle radius fixed from microscopy and estimating the effective intraparticle diffusivity De (m2 s−1) and the asymptotic extractable mass (mg g−1). For interpretation, we also list the characteristic time to 50% release t1/2 computed from the whole series solution and the -domain goodness-of-fit . This framework makes explicit the classical scaling for diffusion-controlled release. Additionally, Figure 5 shows contours as a function of equivalent radius R and effective diffusivity De. The samples at 24, 37, and 50 °C are plotted on top.
Table 3.
Fick’s diffusion parameters and extraction outcomes for defatted rice bran powders at different temperatures.
Figure 5.
Iso-half-time map from Fick’s model.
At 24 °C, milling reduced the diffusion length from 82.2 µm in the control to 32.8–44.7 µm in the pretreated powders, but the fitted De values for the milled set clustered around 0.01–0.02 × 10⁻¹² m2 s−1, whereas the control showed 0.09 × 10⁻¹² m2 s−1. The net result is that several milled powders (S1, S2, S6, S7) reached t1/2 = 39–43 min, essentially comparable to the control (39.8 min) despite their much smaller ; others (S3, S4, S5) exhibited longer tails with min. Two points reconcile these outcomes with milling physics. First, De in Table 3 is an effective parameter that embodies porosity and tortuosity (). When a single-radius Fick model is forced to represent a polydisperse compact made of fragments and fines, the long-time tail is dominated by the coarser/less-connected sub-population, and the fitted De can decrease even as the mean R falls [36]. This is precisely where the model fit is least ideal—note the lower R2 for S3 (0.821) and S5 (0.772)—flagging that a one-radius approximation leaves systematic late-time residuals in those powders. Second, ball milling can alter both the microstructure and size since, depending on the route, it may open cell walls and pores, thus raising or inducing local compaction/agglomeration of fines, porosity. The SEM images (Figure 2) provide visual evidence of the structural disruption caused by ball milling. In particular, several particles exhibited fractured surfaces, disrupted wall-like structures, and pore-like openings, indicating that the milling treatment altered the compact bran matrix. Such disruption may reduce internal mass-transfer resistance by increasing accessibility of the extraction medium to protein-containing regions. Both behaviors have been documented in cereal brans and explain why some milled powders (e.g., S6) keep t1/2 short while others (e.g., S3/S4) develop extended tails at 24 °C [9].
Raising the temperature to 37 °C increased De in most cases and shortened t1/2. The control moved from 0.09 → 0.17 × 10⁻¹² m2 s−1 with dropping to 20.2 min, and the milled powders with modest De at 24 °C began to accelerate (e.g., S6 0.04 × 10⁻¹² m2 s−1, min). Nevertheless, powders S2–S5 retained long-tail behavior ( m2 s−1; min) together with very high M∞ (e.g., S2 137.1 ± 37.6 mg g−1, S4 127.9 ± 45.6 mg g−1). This combination—larger asymptote but slow approach—is characteristic of matrices in which milling exposes a deeper, slowly accessible pool that controls the late-time regime, while modest heating enhances solubilization without eliminating diffusive limitations [13].
At 50 °C, both diffusivity and pace rise sharply for several milled powders: S1 reaches m2 s−1 with an 8.5 min half-time; S4 and S5 approach 0.05–0.06 × 10⁻¹² with min. Others show more moderate increases (e.g., S2 0.02 × 10⁻¹² and min). The temperature trend is fully consistent with diffusion theory and with alkaline solubilization kinetics: higher lowers solvent viscosity and raises molecular mobility, while also increasing protein solubility far from the isoelectric point [12]. Differences among powders at 50 °C reflect their mechanical histories: when milling increases connectivity and water accessibility, De rises sufficiently so that the shorter translates into very short ; where the pore network remains tortuous or the polydispersity is broad, the tail persists even at elevated [9]. The accompanying changes in M∞ with temperature are powder-specific: some materials maintain or improve the plateau (e.g., S2 still >100 mg g−1), whereas others show a reduction in M∞ at 50 °C compared with 24–37 °C (e.g., S3/S4 ≈ 81–92 mg g−1). That decline is compatible with aggregation during alkaline extraction and isoelectric precipitation at higher thermal loads, which reduces the practically recoverable fraction despite faster transport [37].
Across all temperatures, the high-capacity values in Table 3 indicate that a size-anchored Fick model captures the main physics of the late-time regime. At the same time, the few lower R2 cases at 24–37 °C (S3, S5) likely signal PSD broadening and/or the need to include an external film resistance (finite Biot number) for the earliest minutes—precisely the curvature that PSO/Peleg better described in the kinetic section. Two practical implications follow. First, for scale-up, it can be estimated from the table, which shows that reducing the size to the 30–45 µm range and operating at ≥37 °C can decrease the diffusive half-time from ~40 min to 10–25 min. Second, the accessible pool M∞ is not determined by diffusion alone; it depends on how milling and thermal/alkaline history reshape protein–matrix interfaces. Thus, process optimization should pair milling conditions that increase connectivity without over-compacting fines with thermal profiles that speed up transport yet avoid aggregation penalties, a balance repeatedly emphasized for plant protein extractions [11,12,13].
Figure 6 presents the collapse of the universal Fick master curve with all data points in this work. We compute the dimensionless time θ for each powder/timepoint and plot the experimental fraction extracted M/M∞ versus θ. The Crank solution for a sphere with constant surface concentration is drawn as the reference curve. Your points from all three temperatures converge onto this master curve for θ ≳ 0.5, demonstrating that the late-time tail is truly Fickian once you scale by R and De. Deviations at minor θ reflect early-time film/heterogeneity effects—precisely the curvature that PSO/Peleg captured in the kinetic section.
Figure 6.
The collapse of experimental data into the Fick master curve.
Although we fit a single-radius spherical model to extract an effective intraparticle diffusivity, is a surrogate parameter that bundles liquid diffusivity and pore geometry and also compensates for polydispersity and connectivity in the compacted powder bed. In such a radius surrogate, the late-time slope of the release curve is dominated by the coarser, better-connected subpopulation. Suppose those larger fragments carry more internal fissures and intergranular pathways (lower tortuosity, higher connectivity) than the finer, denser agglomerates. In that case, the fit can assign a larger to a condition with a larger even though the geometric path length increased. Conversely, severe comminution may yield fine agglomerates with reduced porosity and higher tortuosity, depressing the fitted despite a smaller . This behavior—well-known in solid–liquid extraction when a one-compartment Fick model is used on polydisperse beds—has been discussed in the modeling literature and in porous-media transport [13]. The image analysis results for shape and circularity are also consistent with the SEM observations (Figure 2), which show predominantly irregular and angular particles rather than smooth spherical bodies. The fractured and elongated morphology observed in the SEM micrographs supports the interpretation that the reported circularity values were associated with mechanically broken 2D projections of a complex bran matrix. Although these descriptors were derived from 2D images, they remain useful comparative indicators of the morphological effects of milling. Framed this way, the weak – countertrend occasionally observed in our data is not contradictory; it simply signals structure/PSD effects that the one-radius fit absorbs into .
Although the Fick model is also a kinetic description, it is treated separately from the empirical models in Section 3.4 because its purpose here is mechanistic rather than only descriptive. The first-order, pseudo-second-order, and Peleg models were used to compare extraction curves through common empirical descriptors such as , , and . In contrast, the Fick/Crank model was used to interpret the late-stage extraction regime in terms of diffusion length, apparent effective diffusivity, and the particle-scale transport limitation imposed by milling-derived geometry. Therefore, this section focuses on the transport meaning of the fitted parameters and provides the basis for the morphology–diffusivity analysis discussed in Section 3.6.
3.6. Morphology–Diffusivity Coupling Under Milling and Temperature (Fick Analysis)
In this work, we use the term microstructural opening to describe a set of coupled changes induced by ball milling and alkaline treatment in the bran particles: (i) partial fragmentation of cell walls and aleurone layers and the appearance of fissures and exposed protein bodies in SEM micrographs; (ii) subtle increases in disorder in the wall polysaccharide matrix, as suggested by slight changes in peak width and Segal crystallinity index in the XRD patterns while the cellulose I structure is preserved; and (iii) functional evidence of higher water-accessible porosity, including an increased water solubility index, altered water and oil holding capacities, and higher fines content/SSA-derived indices. Taken together, these observations indicate that milling does more than simply reduce particle size: it opens internal pathways and hydrated domains within the bran matrix, which in turn facilitates solvent penetration and intraparticle diffusion.
From a chemical perspective, rice bran protein extraction may also be influenced by interactions with phenolic compounds, phytate, and cell wall polysaccharides. These interactions are relevant because they can affect protein solubility, aggregation, and precipitation behavior during alkaline extraction and isoelectric recovery. Nevertheless, the present study did not directly measure free phenolics, bound ferulates, phytate content, phytate speciation, or protein–phenol cross-linking products. Therefore, the role of these chemical interactions cannot be separated quantitatively from the physical effects of milling. The protein–matrix interactions in defatted rice bran are also strongly modified by ball milling and alkaline extraction. In the native powder, a substantial fraction of the protein is immobilized within the aleurone–cell wall complex through a combination of noncovalent interactions with arabinoxylan-rich polysaccharides (hydrogen bonding and electrostatic interactions), ionic and hydrogen-bonded associations with phytic acid, and covalent or noncovalent complexes with phenolic acids such as ferulic acid [5]. Ball milling primarily acts mechanically, rupturing cell walls and exposing these complexes to the solvent, but the alkaline liquor contributes a second, chemical level of matrix disruption: ferulate esters on arabinoxylans are saponified, hemicelluloses and some protein–phytate complexes are partially solubilized, and increased deprotonation screens electrostatic attractions between proteins and the wall [4]. Together, these reactions convert “bound” proteins into a more mobile, diffusible form and create additional hydrated pathways inside the particles. At the same time, the larger pool of unfolded proteins and released phenolics at a high pH can, especially at 50 °C, recombine via hydrophobic associations or oxidative coupling, forming aggregates that limit the plateau extractability M [38]. Thus, the overall effect of ball milling and alkaline treatment on protein recovery reflects a balance between chemical matrix disruption, which enhances accessibility, and secondary aggregation, which can cap the amount of protein that remains recoverable.
To test whether milling alters the effective intraparticle diffusivity (De) purely through particle size reduction or also via microstructure, we regressed, at each temperature, ln De on ln R, circularity, and shape factor. The models fit extremely well at all temperatures (24 °C: R2 = 0.898, adj.R2 = 0.821, F = 11.7, p = 0.0189; 37 °C: R2 = 0.998, adj.R2 = 0.996, F = 559.3, p = 1.1 × 10⁻⁵; 50 °C: R2 = 0.988, adj.R2 = 0.979, F = 107.7, p = 2.8 × 10⁻⁴), indicating that the three geometric predictors capture nearly all of the between-powder differences in De at a fixed temperature. The coefficient on ln R is large and highly significant at all temperatures (24 °C: β1 = 1.864 ± 0.880, p = 0.0042; 37 °C: 2.544 ± 0.174, p = 2.0 × 10⁻⁶; 50 °C: 2.354 ± 0.370, p = 6.0 × 10⁻⁵), which is the expected near-quadratic scaling for a diffusion-controlled approach to equilibrium (residual mass ∝ exp[−const·D_e/R2]) and explains most of the acceleration seen after milling [20].
The effect of this microstructural opening on mass transfer is evident when the structural descriptors are compared with the fitted diffusion coefficients. Powders that show more extensive wall fragmentation and surface roughening in SEM, together with slightly lower apparent crystallinity and broader cellulose peaks in XRD, are also those with higher shape factor, larger PSD-based specific surface area, and, consequently, higher effective diffusivity De. In particular, at 37 °C, the shape factor becomes a significant positive predictor of ln De at fixed particle radius, indicating that the more “open” and irregular particles formed by milling provide shorter and more numerous diffusion pathways for the alkaline liquor. Thus, the structural changes captured by SEM and XRD, and reflected in the functional indices, offer a mechanistic explanation for the faster diffusion-controlled extraction observed in the milled powders.
After controlling for size, shape factor was positive and significant at 37 °C (β3 = 1.774 ± 1.270, p = 0.0179), while circularity remained non-significant. A practical interpretation is elastic: at 37 °C, increasing the shape factor by 0.05 (typical spread) raises De by ~9% at fixed R and circularity. At 24 °C and 50 °C, the shape factor and circularity were not significant (both p > 0.18), implying that the long-time tail is essentially size-controlled in colder extractions and that, at 50 °C, early-time phenomena, where partial film effects and fast near-surface dissolution, shift curvature that our late-time De deliberately abstracts. Within each powder, De increased with temperature as expected from lower viscosity and faster molecular motion in alkaline media; because regressions were run per temperature, this thermal factor does not confound geometric terms. Overall, milling shortens t1/2 mainly via R2 reduction; in some milled powders—particularly at 37 °C—microstructural opening and matrix degradation further boost De and increase the accessible pool; and at 50 °C, the kinetics show strong front-loading while the late diffusive tail remains well described by Fick. Taken together, these results support pairing time-intensive milling to reliably shrink R and open the wall network with moderate heating, when the objective is to minimize residence time without compromising ultimate recovery.
The regressions use n = 8 powders per temperature and a single-radius Fick surrogate; the few lower R2 fits (e.g., S3 at 24 °C) and large CIs on M∞ likely reflect the PSD broadening, agglomeration, and multi-domain release that a one-radius model compresses into De—limitations that are standard in solid–liquid extraction modeling and do not affect the main conclusion that size dominates. At the same time, matrix degradation and microstructure can add measurable gains. This study intentionally used a single-radius Fick surrogate to align powder-level descriptors with extraction performance; while the fits were excellent, this assumption compresses PSD breadth, micro-connectivity, and internal heterogeneity into . A two-resistance description was evaluated indirectly via Biot analysis and indicates that film transfer is non-limiting under our conditions; nonetheless, a dynamic film term could be included in future work to explicitly capture very early-time curvature. The shape and circularity metrics were derived from 2D SEM projections; fully 3D descriptors (micro-CT, FIB-SEM) would better resolve tortuosity and pore connectivity. Finally, direct chemical markers of matrix loosening (e.g., released bound ferulates, free phenolics, phytate balance) were not quantified here; coupling our kinetic/PSD framework with time-resolved ferulate release, phenolic–protein adduct assays, and phytate speciation would help decouple geometry from chemistry and further validate the proposed degradation-and-release mechanism.
A limitation of the present analysis is that the Fick’s radius and morphology descriptors were obtained from 2D SEM projections. Although this approach is appropriate for comparative evaluation among milling treatments, it cannot fully represent the 3D structure of irregular bran particles. In particular, the projected area, circularity, and shape factor do not directly measure internal pore connectivity, tortuosity, or true interfacial area. Therefore, the reported values should be interpreted as apparent diffusivities under a 2D-equivalent geometric assumption. Future work should combine the present kinetic framework with 3D imaging methods, such as micro-CT or FIB-SEM, to quantify pore connectivity, tortuosity, and internal surface area directly.
3.7. Mechanistic Insights from Milling–Microstructure–Diffusion Coupling
Taken together, the particle descriptors, extraction kinetics, and Fick analysis reveal several mechanistic insights that extend beyond simple “finer particles extract better” narratives. First, the non-monotonic response of PSD and fines generation to mill speed confirms that comminution efficiency in defatted rice bran follows the same charge-dynamic physics reported for mineral systems: at ≈53% of critical speed (75 rpm), the charge cascades efficiently, whereas near-supercritical rotation (120 rpm, ≈85% of Nc) promotes partial centrifuging, a broadened coarse tail, and even transient agglomeration. This explains why the 30 min/120 rpm condition exhibits a much larger d32 than that of other milled powders, despite a similar nominal energy input.
Second, linking particle geometry to extraction via the RDHT and the geometry-constrained Fick fits shows that milling shortens diffusion-limited time scales in a manner quantitatively consistent with classical scaling (t½ ∝ R2/De), but that microstructure also matters. At 37 °C, shape factor becomes a statistically significant positive predictor of ln De at fixed radius, demonstrating that “microstructural opening” is not only a qualitative concept but an observable improvement in effective diffusivity associated with more open wall networks and higher connectivity.
Third, collapsing all late-time extraction data onto a single Fick master curve confirms that, once scaled by R and De, the tail regime is transport-limited across all powders and temperatures. The deviations at low θ highlight a distinct, film- and chemistry-controlled early stage. This two-regime behavior—front-loaded, chemically assisted release followed by size-controlled diffusion—provides a compact mechanistic framework for optimizing residence time and energy input in ball-milled bran systems.
Finally, the non-linear temperature dependence of the plateau M∞, especially the partial loss of advantage at 50 °C for some aggressively milled powders, indicates that alkaline extraction is governed by a balance between enhanced transport and temperature-driven aggregation or protein–phenolic coupling. Thus, the combined analysis of milling regime, PSD, microstructural descriptors, and Fick parameters yields process-scale levers (time, speed, target R and shape factor, extraction temperature) that are directly useful for designing solid–liquid separations in cereal brans.
Future work should convert the present framework into a predictive scale-up model by integrating Fick’s release over the full particle size distribution, adding finite-Biot external-film resistance, and parameterizing with temperature and morphology descriptors. Scale-up should also report specific milling energy and energy-normalized gains in endpoint recovery, initial extraction rate, and apparent diffusivity, allowing optimization by both protein recovery and energy cost.
4. Conclusions
The ball milling of defatted rice bran improved alkaline protein extraction by reducing the characteristic diffusion length and altering particle morphology. Across the tested regimes, median particle size decreased from 145 to 61 µm, the fines fraction increased from 1.86% to 32.09%, and surface area proxies increased by approximately 30–40 fold. Milling time was the dominant factor controlling fines generation, whereas rotational speed showed a non-monotonic response, indicating that a more severe nominal speed did not always produce the most extraction-efficient powder.
The extraction results show that the optimal operating condition depends on the process objective. When maximum endpoint recovery is the priority, the best measured condition was S2, corresponding to 30 min milling at 120 rpm followed by extraction at 37 °C for 180 min, which yielded . A lower-temperature alternative is S3, corresponding to 90 min milling at 30 rpm followed by extraction at 24 °C for 180 min, which yielded and showed the highest average endpoint recovery across the three extraction temperatures. When extraction rate or short residence time is the priority, S1, corresponding to 30 min milling at 30 rpm followed by extraction at 50 °C, is preferred because it showed the highest initial extraction rate and the shortest half-time , with an endpoint recovery of .
Kinetic modeling confirmed that milling changed both the rate and extent of extraction. At 24 °C, a first-order model adequately described the extraction curves, whereas PSO/Peleg-type models better captured the pronounced early-stage curvature at 37 and 50 °C. The geometry-anchored Fick analysis further showed that the late extraction stage was diffusion-controlled, as the data collapsed into a common Fickian master curve after scaling by radius and apparent effective diffusivity. At 37 °C, the radius–shape–circularity model explained nearly all between-powder variation in apparent effective diffusivity . The shape factor remained significant after accounting for particle radius , and a 0.05 increase in shape factor corresponded to an approximately 9% increase in apparent effective diffusivity at the fixed radius and circularity. This result indicates that projected particle morphology contributes to extraction transport beyond particle size alone.
Overall, the results support three practical process windows: S2 at 37 °C for maximum measured recovery, S1 at 50 °C for fastest extraction, and S3 under low-to-moderate temperature conditions when robust recovery is preferred. Possible chemical contributions from phenolic, phytate, and protein–matrix interactions remain to be verified by targeted compositional analyses. Future work should quantify true 3D porosity, pore connectivity, and internal surface area using methods such as micro-CT or FIB-SEM and should connect milling energy input to gains in extraction rate, endpoint recovery, and apparent diffusivity for scale-up.
Supplementary Materials
The following supporting information can be downloaded at: https://www.mdpi.com/article/10.3390/pr14101633/s1, Table S1: Extraction protein yield of defatted rice-bran samples at different temperatures and extraction times. Values are mean ± SD, n = 3. Different lowercase superscript letters within the same row indicate significant differences among samples according to Tukey’s HSD test at p < 0.05.
Author Contributions
R.E.A.: Investigation, writing—original draft; E.M.C.: investigation; L.B.: investigation; J.M.L.: methodology, formal analysis; A.M.S.: methodology, data curation; M.E.C.: data curation, visualization; R.D.A.: methodology, formal analysis, supervision, writing—review and editing; M.A.d.B.P.: writing—original draft, writing—review and editing; H.M.L.: conceptualization, supervision, writing—original draft, writing—review and editing. All authors have read and agreed to the published version of the manuscript.
Funding
This research received no external funding.
Data Availability Statement
The original contributions presented in this study are included in the article/Supplementary Material. Further inquiries can be directed to the corresponding author.
Acknowledgments
Rogerio Andrade acknowledges CAPES for grant 88887.948819/2024-00.
Conflicts of Interest
The authors declare no conflicts of interest.
Abbreviations
The following abbreviations are used in this manuscript:
| AFIM | Airflow-impact milling |
| ANOVA | Analysis of variance |
| BET | Brunauer–Emmett–Teller |
| CrI | Crystallinity index |
| CV | Coefficient of variation |
| De | Effective intraparticle diffusivity |
| DF | Dietary fiber |
| DoE | Design of experiments |
| DRB | Defatted rice bran |
| HSD | Honestly significant difference |
| IDF | Insoluble dietary fiber |
| LSI | Leaching surface index |
| LPS | Leaching potential score |
| OHC | Oil-holding capacity |
| PSD | Particle size distribution |
| PSO | Pseudo-second order |
| RB | Rice bran |
| RDHT | Relative diffusion half-time |
| SDF | Soluble dietary fiber |
| SEM | Scanning electron microscopy |
| SI | Swelling index |
| SSA | Specific surface area |
| WHC | Water-holding capacity |
| WSI | Water solubility index |
| XRD | X-ray diffraction |
References
- Sarinho, A.; Costa, M.E.; Lima, J.; Batista, L.; Andrade, R.; Gonçalves, J.; Silva, C.; Lisboa, H.M. Valorization of Pumpkin-Seed Press-Cake and Hulls from Agri-Food Waste Streams. Food Chem. Adv. 2025, 9, 101147. [Google Scholar] [CrossRef] [Scilit]
- Alexandri, M.; López-Gómez, J.P.; Olszewska-Widdrat, A.; Venus, J. Valorising agro-industrial wastes within the circular bioeconomy concept: The case of defatted rice bran with emphasis on bioconversion strategies. Fermentation 2020, 6, 42. [Google Scholar] [CrossRef] [Scilit]
- Das, P.P.; Gul, M.Z.; Weber, A.M.; Srivastava, R.K.; Marathi, B.; Ryan, E.P.; Ghazi, I.A. Rice bran extraction and stabilization methods for nutrient and phytochemical biofortification, nutraceutical development, and dietary supplementation. Nutr. Rev. 2025, 83, 692–712. [Google Scholar] [CrossRef] [Scilit]
- Abd Rahim, F.N.; Wan Ibadullah, W.Z.; Saari, N.; Brishti, F.H.; Mustapha, N.A.; Ahmad, N.; Arulrajah, B. The effect of alkaline extraction and drying techniques on the physicochemical, structural properties and functionality of rice bran protein concentrates. Int. J. Biol. Macromol. 2023, 242, 124908. [Google Scholar] [CrossRef] [Scilit]
- Cho, S.J.; Lee, S.D.; Han, S.W. Functional Properties of Rice Bran Proteins Extracted from Low-Heat-Treated Defatted Rice Bran. Molecules 2022, 27, 7212. [Google Scholar] [CrossRef] [Scilit]
- Cao, Y.; Zhao, J.; Tian, Y.; Jin, Z.; Xu, X.; Zhou, X.; Wang, J. Physicochemical properties of rice bran after ball milling. J. Food Process. Preserv. 2021, 45, e15785. [Google Scholar] [CrossRef] [Scilit]
- Yin, S.; Liang, T.; Jiao, S.; Jing, P. Improvement effects of micronization on morphology, functional and nutritional attributes of stabilized rice bran. Food Res. Int. 2022, 157, 111328. [Google Scholar] [CrossRef] [Scilit]
- Zhao, G.; Zhang, R.; Dong, L.; Huang, F.; Tang, X.; Wei, Z.; Zhang, M. Particle size of insoluble dietary fiber from rice bran affects its phenolic profile, bioaccessibility and functional properties. LWT 2018, 87, 450–456. [Google Scholar] [CrossRef] [Scilit]
- De Bondt, Y.; Liberloo, I.; Roye, C.; Windhab, E.J.; Lamothe, L.; King, R.; Courtin, C.M. The effect of wet milling and cryogenic milling on the structure and physicochemical properties of wheat bran. Foods 2020, 9, 1755. [Google Scholar] [CrossRef] [Scilit] [PubMed]
- Bunzel, M.; Ralph, J.; Lu, F.; Hatfield, R.D.; Steinhart, H. Lignins and ferulate− coniferyl alcohol cross-coupling products in cereal grains. J. Agric. Food Chem. 2004, 52, 6496–6502. [Google Scholar] [CrossRef] [Scilit]
- Yang, J.; Kornet, R.; Ntone, E.; Meijers, M.G.J.; van den Hoek, I.A.F.; Sagis, L.M.C.; Venema, P.; Meinders, M.B.J.; Berton-Carabin, C.C.; Nikiforidis, C.V.; et al. Plant protein aggregates induced by extraction and fractionation processes: Impact on techno-functional properties. Food Hydrocoll. 2024, 155, 110223. [Google Scholar] [CrossRef] [Scilit]
- Tang, J.; Yao, D.; Xia, S.; Cheong, L.; Tu, M. Recent progress in plant-based proteins: From extraction and modification methods to applications in the food industry. Food Chem. X 2024, 23, 101540. [Google Scholar] [CrossRef] [Scilit]
- Cacace, J.E.; Mazza, G. Mass transfer process during extraction of phenolic compounds from milled berries. J. Food Eng. 2003, 59, 379–389. [Google Scholar] [CrossRef] [Scilit]
- Milićević, N.; Kojić, P.; Sakač, M.; Mišan, A.; Kojić, J.; Perussello, C.; Banjac, V.; Pojić, M.; Tiwari, B. Kinetic modelling of ultrasound-assisted extraction of phenolics from cereal brans. Ultrason. Sonochem. 2021, 79, 105761. [Google Scholar] [CrossRef] [Scilit]
- Andrade, R.; Barros, A.; Batista, L.; Lima, J.; Sarinho, A.; Almeida, R.; Lisboa, H.M. Optimizing rice bran ball milling via a friction-coupled population balance model: Integrating comminution theory and energy efficiency. Particuology 2025, 105, 36–50. [Google Scholar] [CrossRef] [Scilit]
- Dantas, D.; Pasquali, M.A.; Cavalcanti-Mata, M.; Duarte, M.E.; Lisboa, H.M. Influence of spray drying conditions on the properties of avocado powder drink. Food Chem. 2018, 266, 284–291. [Google Scholar] [CrossRef] [Scilit]
- Ferreira, S.; Araujo, T.; Souza, N.; Rodrigues, L.; Lisboa, H.M.; Pasquali, M.; Trindade, G.; Rocha, A.P. Physicochemical, morphological and antioxidant properties of spray-dried mango kernel starch. J. Agric. Food Res. 2019, 1, 100012. [Google Scholar] [CrossRef] [Scilit]
- Fujihara, S.; Sasaki, H.; Aoyagi, Y.; Sugahara, T. Nitrogen-to-protein conversion factors for some cereal products in Japan. J. Food Sci. 2008, 73, C204–C209. [Google Scholar] [CrossRef] [Scilit] [PubMed]
- Martins, G.M.V.; de Sousa, S.; Duarte, M.E.M.; Cavalcanti-Mata, M.E.R.M.; Oliveira, H.M.L. Modeling the combinatory effects of parboiling and cooking on red paddy rice (Oryza sativa L.) properties. LWT 2021, 147, 111607. [Google Scholar] [CrossRef] [Scilit]
- Crank, J. The Mathematics of Diffusion; Oxford University Press: Oxford, UK, 1979. [Google Scholar]
- Monteiro, S.S.; dos Anjos, A.I.M.; da Silva, M.B.; de Lima Silva, S.M.; Fook, M.V.L.; Lisboa, H.M.; de Bittencourt Pasquali, M.A. Mechanistic Insights into Ultrasound-Enhanced Encapsulation of Turnera subulata Extracts in Yeast: Diffusion Modeling and Functional Potential. Food Bioprocess Technol. 2025, 19, 12. [Google Scholar] [CrossRef] [Scilit]
- Cavalcanti-Mata, M.E.; Duarte, M.E.; Tolentino, M.; Mendes, F.A.; Batista, L.; de Lima, J.M.; Lúcio, A.; Nascimento, A.P.; Almeida, R.D.; Lisboa, H.M. Drying Kinetics of Industrial Pineapple Waste: Effective Diffusivity and Thermodynamic Properties Resulting from New Mathematical Models Derived from the Fick Equation. Processes 2024, 12, 1198. [Google Scholar] [CrossRef] [Scilit]
- Wu, Q.; Zhang, Y.; Wang, X.; Sun, Y.; Li, Y.; Zhu, G. Crystallization of hard spheres within ellipsoidal confinement. Phys. Rev. E 2026, 113, 025422. [Google Scholar] [CrossRef] [Scilit]
- Yin, Z.; Peng, Y.; Zhu, Z.; Ma, C.; Yu, Z.; Wu, G. Effect of mill speed and slurry filling on the charge dynamics by an instrumented ball. Adv. Powder Technol. 2019, 30, 1611–1616. [Google Scholar] [CrossRef] [Scilit]
- Kaya, Y.; Kobya, V.; Mardani, A.; Mardani, N.; Beytekin, H.E. Effect of Grinding Conditions on Clinker Grinding Efficiency: Ball Size, Mill Rotation Speed, and Feed Rate. Buildings 2024, 14, 2356. [Google Scholar] [CrossRef] [Scilit]
- Hernández-Varela, J.D.; Chanona-Pérez, J.J.; Villaseñor-Altamirano, S.L.; Mendoza-Martínez, C.; Sodi, F.C. Changes of crystallinity index and crystallite size in cotton cellulose nanopar by ball milling. In 2020 17th International Conference on Electrical Engineering, Computing Science and Automatic Control (CCE); IEEE: Piscataway, NJ, USA, 2020; pp. 1–6. [Google Scholar]
- Yao, W.; Weng, Y.; Catchmark, J.M. Improved cellulose X-ray diffraction analysis using Fourier series modeling. Cellulose 2020, 27, 5563–5579. [Google Scholar] [CrossRef] [Scilit]
- Ling, Z.; Wang, T.; Makarem, M.; Santiago Cintrón, M.; Cheng, H.N.; Kang, X.; Bacher, M.; Potthast, A.; Rosenau, T.; King, H.; et al. Effects of ball milling on the structure of cotton cellulose. Cellulose 2019, 26, 305–328. [Google Scholar] [CrossRef] [Scilit]
- Fahmy, A.R.; Becker, T.; Jekle, M. 3D printing and additive manufacturing of cereal-based materials: Quality analysis of starch-based systems using a camera-based morphological approach. Innov. Food Sci. Emerg. Technol. 2020, 63, 102384. [Google Scholar] [CrossRef] [Scilit]
- Zhang, Y.; Mao, Y.; Yang, G.; Wang, Z.; Guo, C.; Jin, W.; Shen, W.; Li, J. Effect of airflow impact milling on the physicochemical properties, microstructure, and flavor of defatted rice bran. J. Cereal Sci. 2024, 118, 103975. [Google Scholar] [CrossRef] [Scilit]
- Sapwarobol, S.; Saphyakhajorn, W.; Astina, J. Biological Functions and Activities of Rice Bran as a Functional Ingredient: A Review. Nutr. Metab. Insights 2021, 14, 11786388211058559. [Google Scholar] [CrossRef] [Scilit] [PubMed]
- Wen, Y.; Niu, M.; Zhang, B.; Zhao, S.; Xiong, S. Structural characteristics and functional properties of rice bran dietary fiber modified by enzymatic and enzyme-micronization treatments. LWT 2017, 75, 344–351. [Google Scholar] [CrossRef] [Scilit]
- Li, Y.; Wang, H.; Wang, L.; Qiu, J.; Li, Z.; Wang, L. Milling of wheat bran: Influence on digestibility, hydrolysis and nutritional properties of bran protein during in vitro digestion. Food Chem. 2023, 404, 134559. [Google Scholar] [CrossRef] [Scilit] [PubMed]
- Pyrzynska, K. Ferulic Acid—A Brief Review of Its Extraction, Bioavailability and Biological Activity. Separations 2024, 11, 204. [Google Scholar] [CrossRef] [Scilit]
- Lasrichan, S.; Janssen, A.E.M.; Boom, R. Contribution of sequential pretreatments and enzyme-assisted extraction to rice bran protein yield improvement. J. Cereal Sci. 2024, 118, 103970. [Google Scholar] [CrossRef] [Scilit]
- Fox, R.O.; Posey, J.W.; Houim, R.W.; Laurent, F. A kinetic-based model for polydisperse, high-speed, fluid–particle flows. Int. J. Multiph. Flow 2024, 171, 104698. [Google Scholar] [CrossRef] [Scilit]
- Gao, Z.; Shen, P.; Lan, Y.; Cui, L.; Ohm, J.-B.; Chen, B.; Rao, J. Effect of alkaline extraction pH on structure properties, solubility, and beany flavor of yellow pea protein isolate. Food Res. Int. 2020, 131, 109045. [Google Scholar] [CrossRef] [Scilit]
- Modupalli, N.; Galib, R.M.; Sen, R.; Lafontaine, S.; Rahman, M.M. Improving yield, functional properties, and aroma profile of rice bran protein through innovative extraction and precipitation methods. J. Cereal Sci. 2024, 120, 104033. [Google Scholar] [CrossRef] [Scilit]
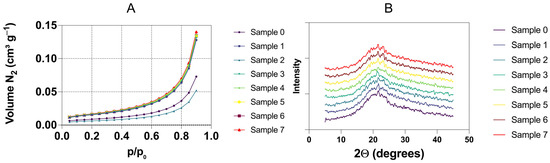
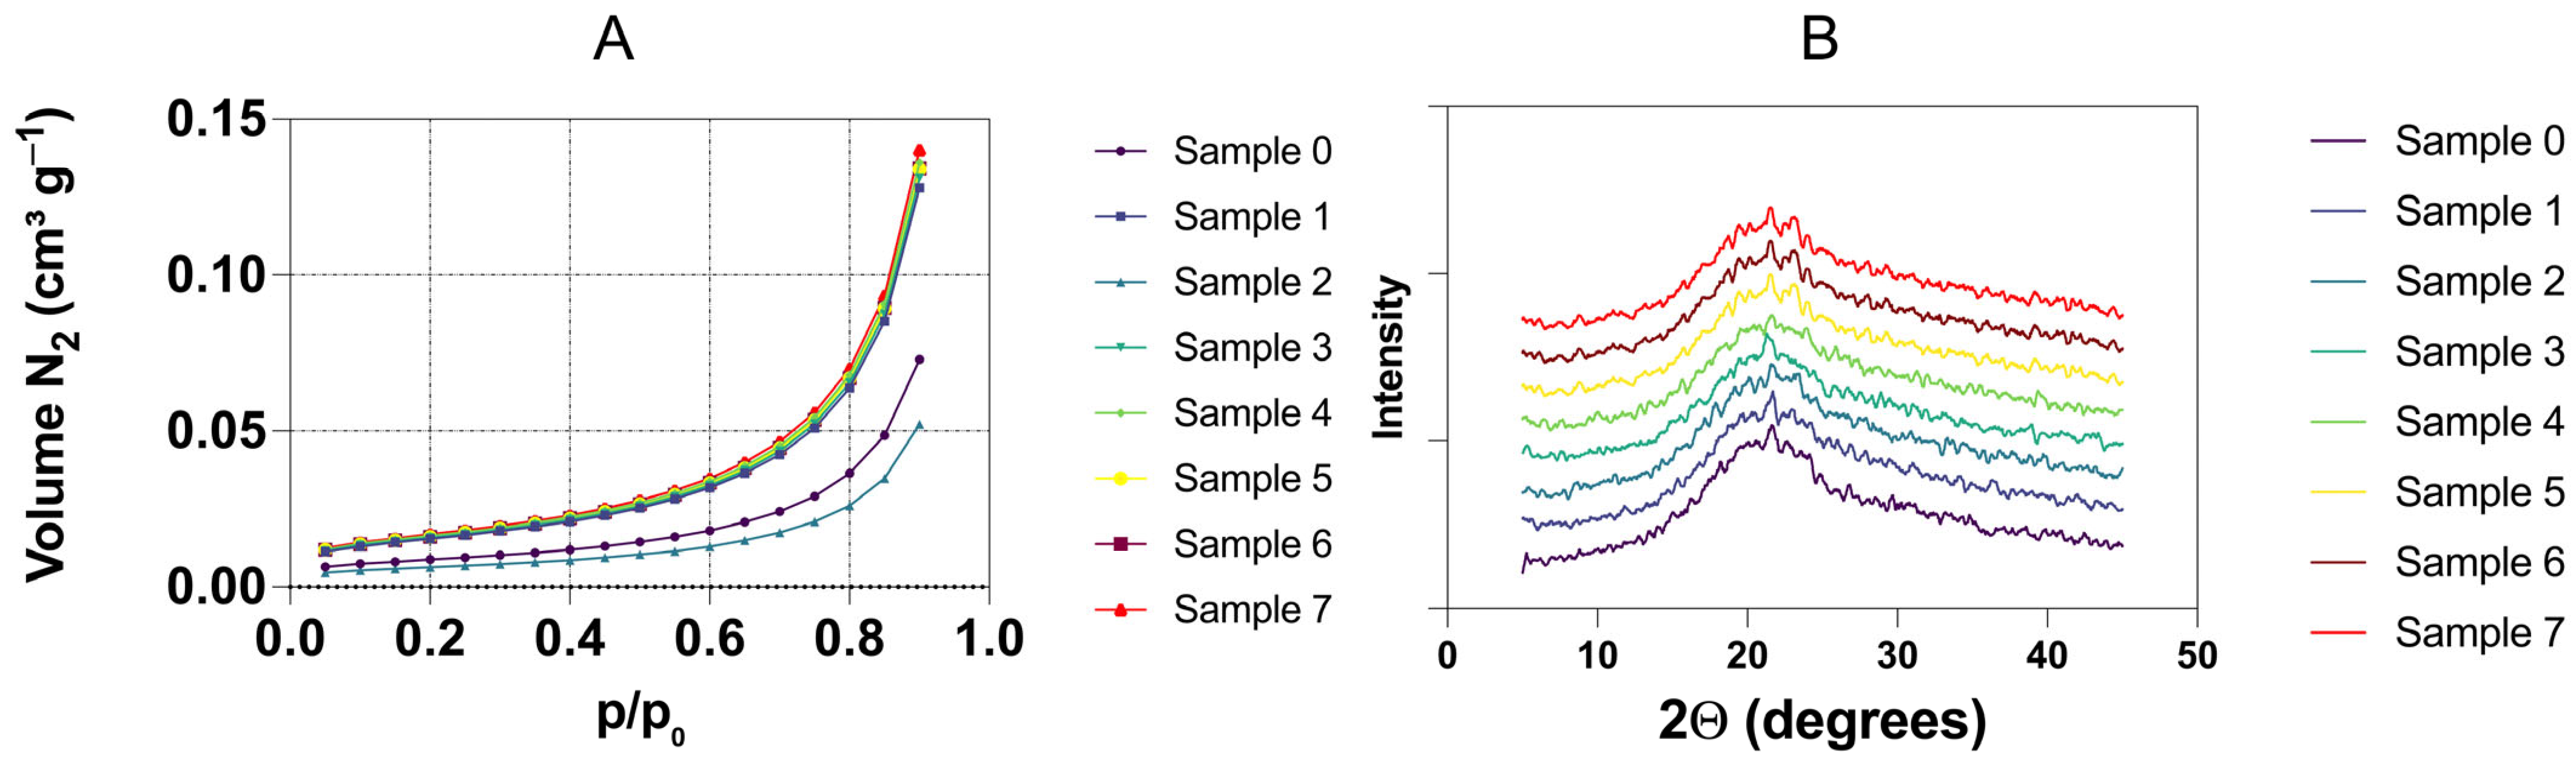
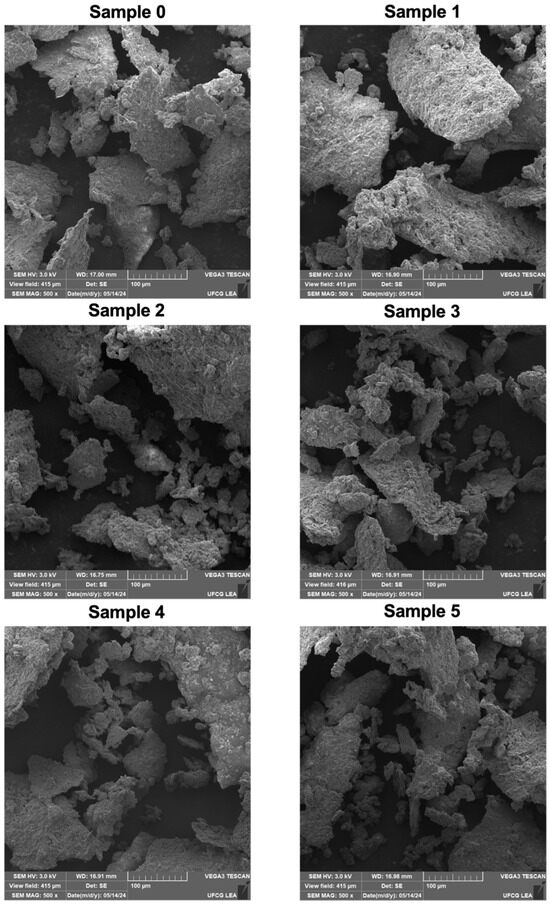
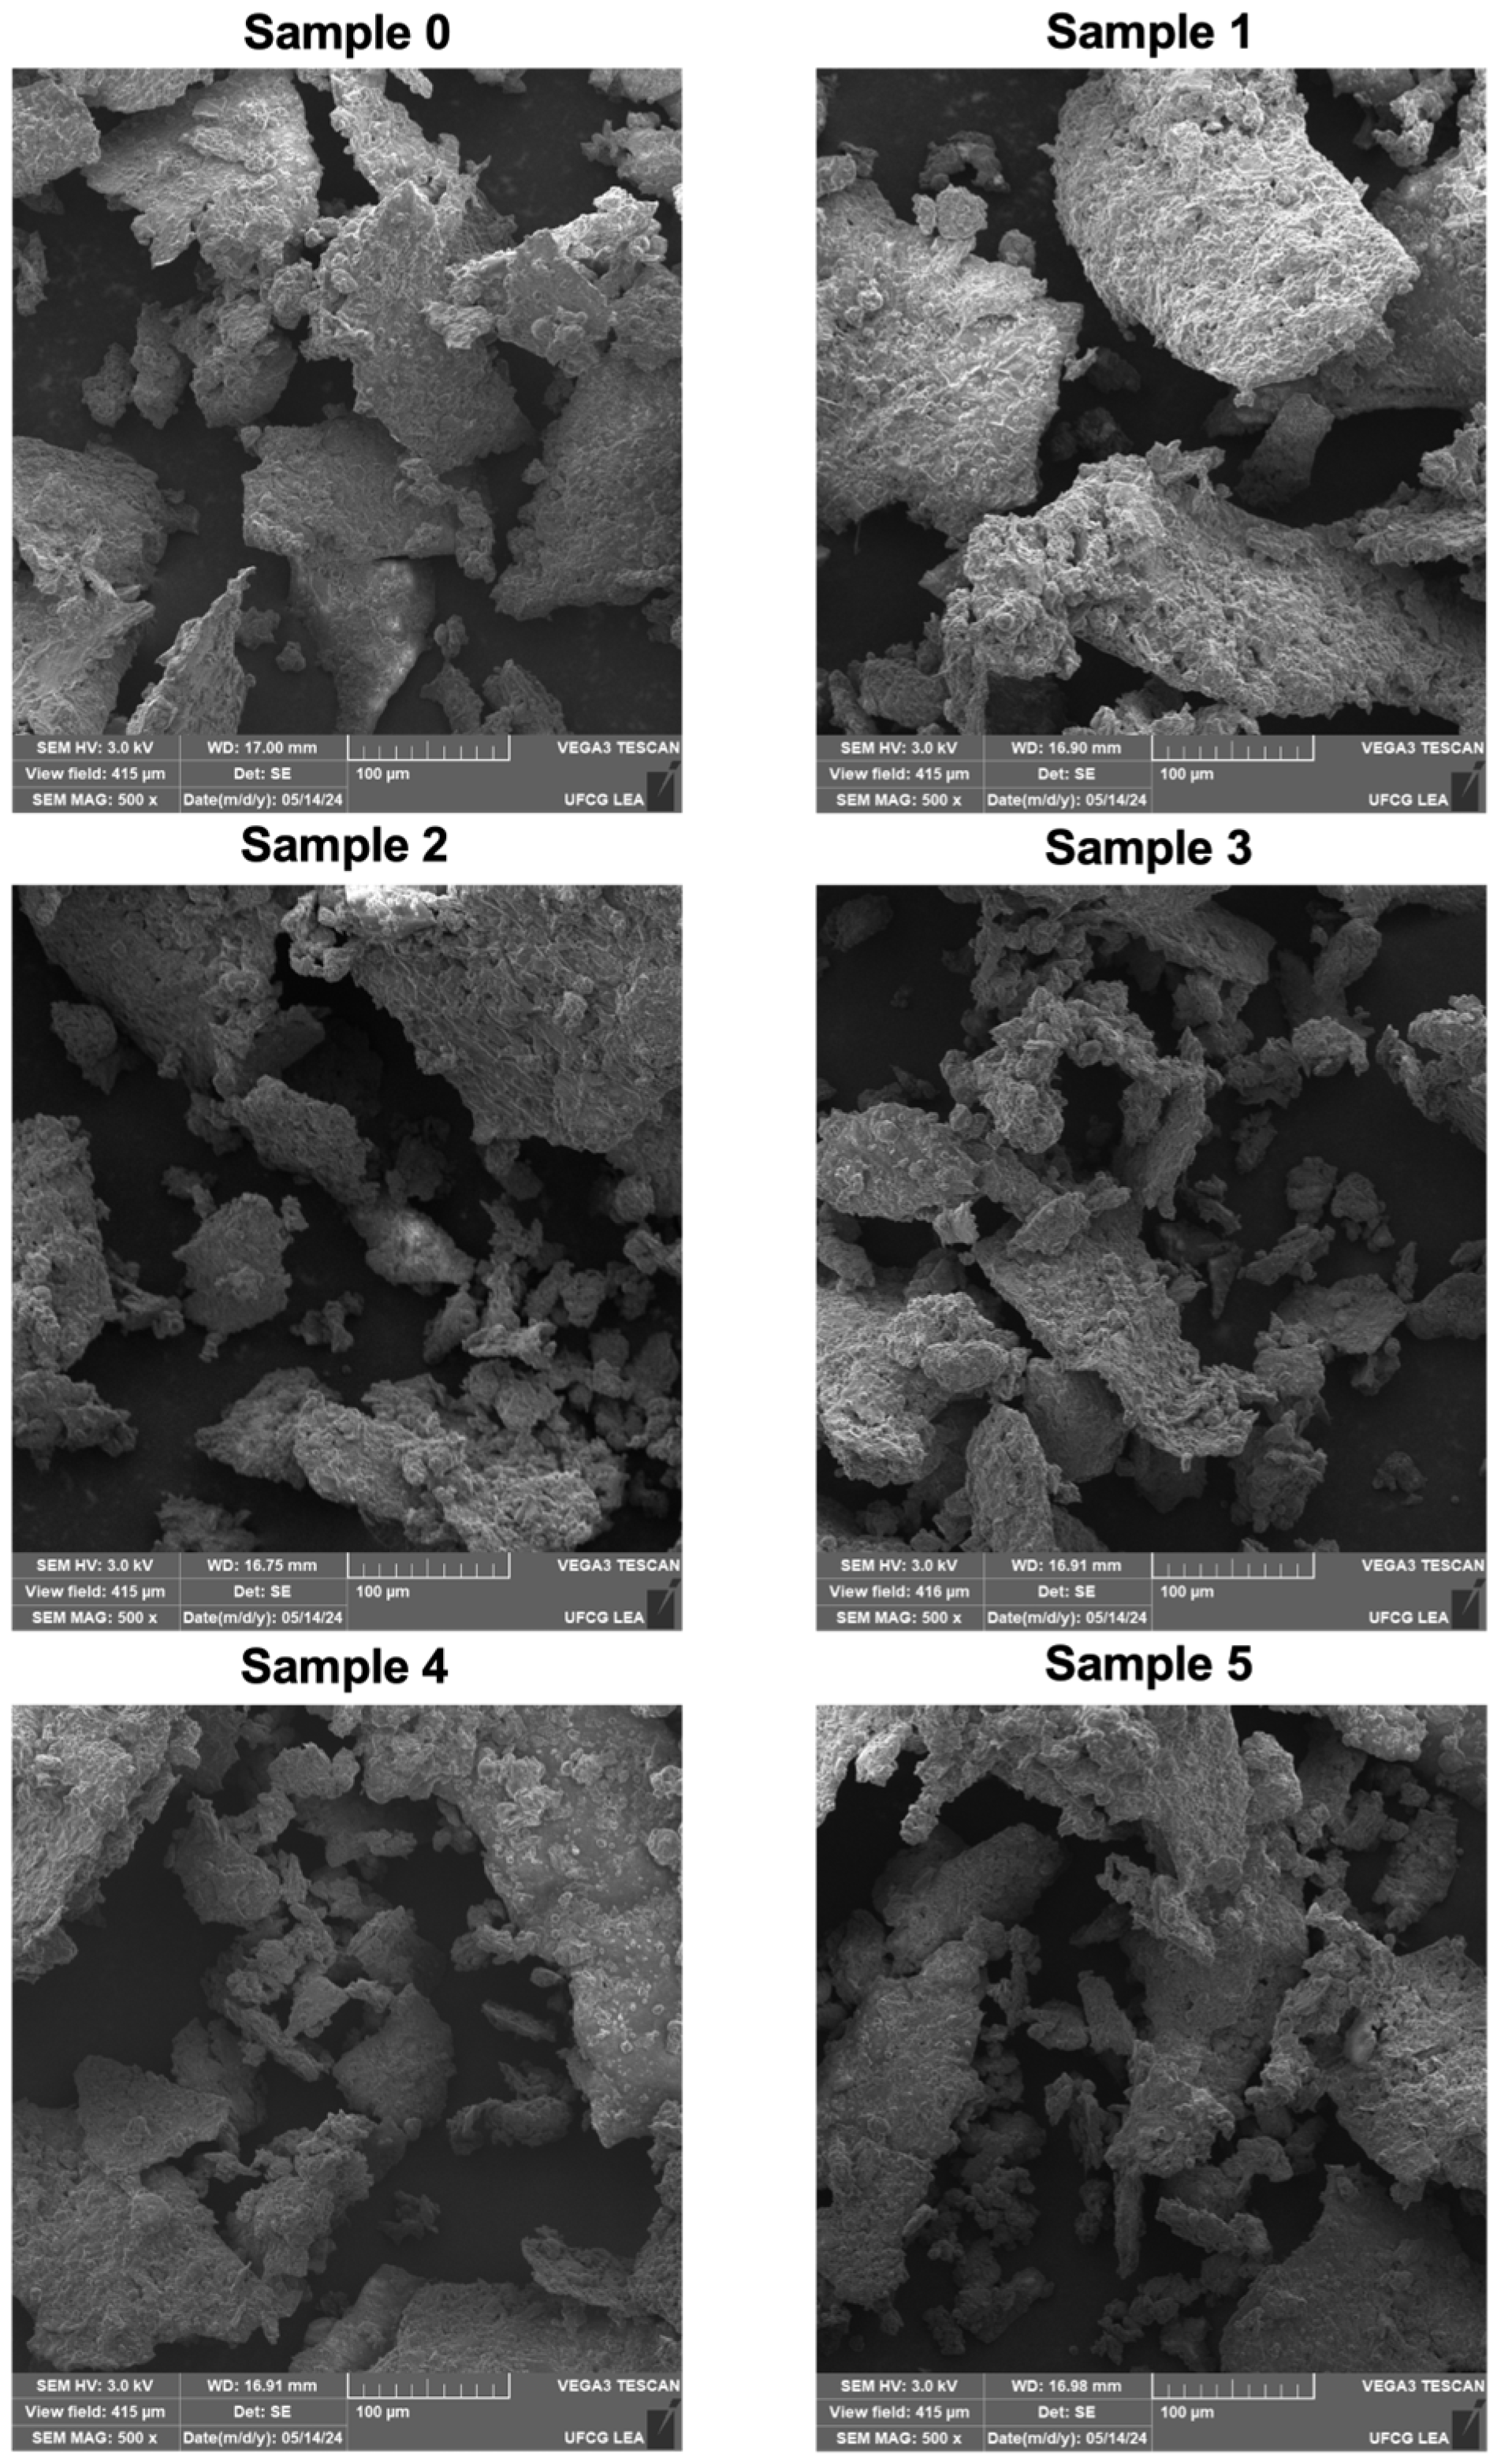
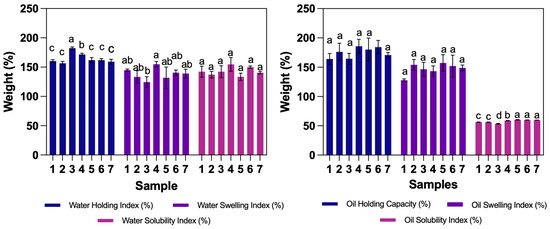
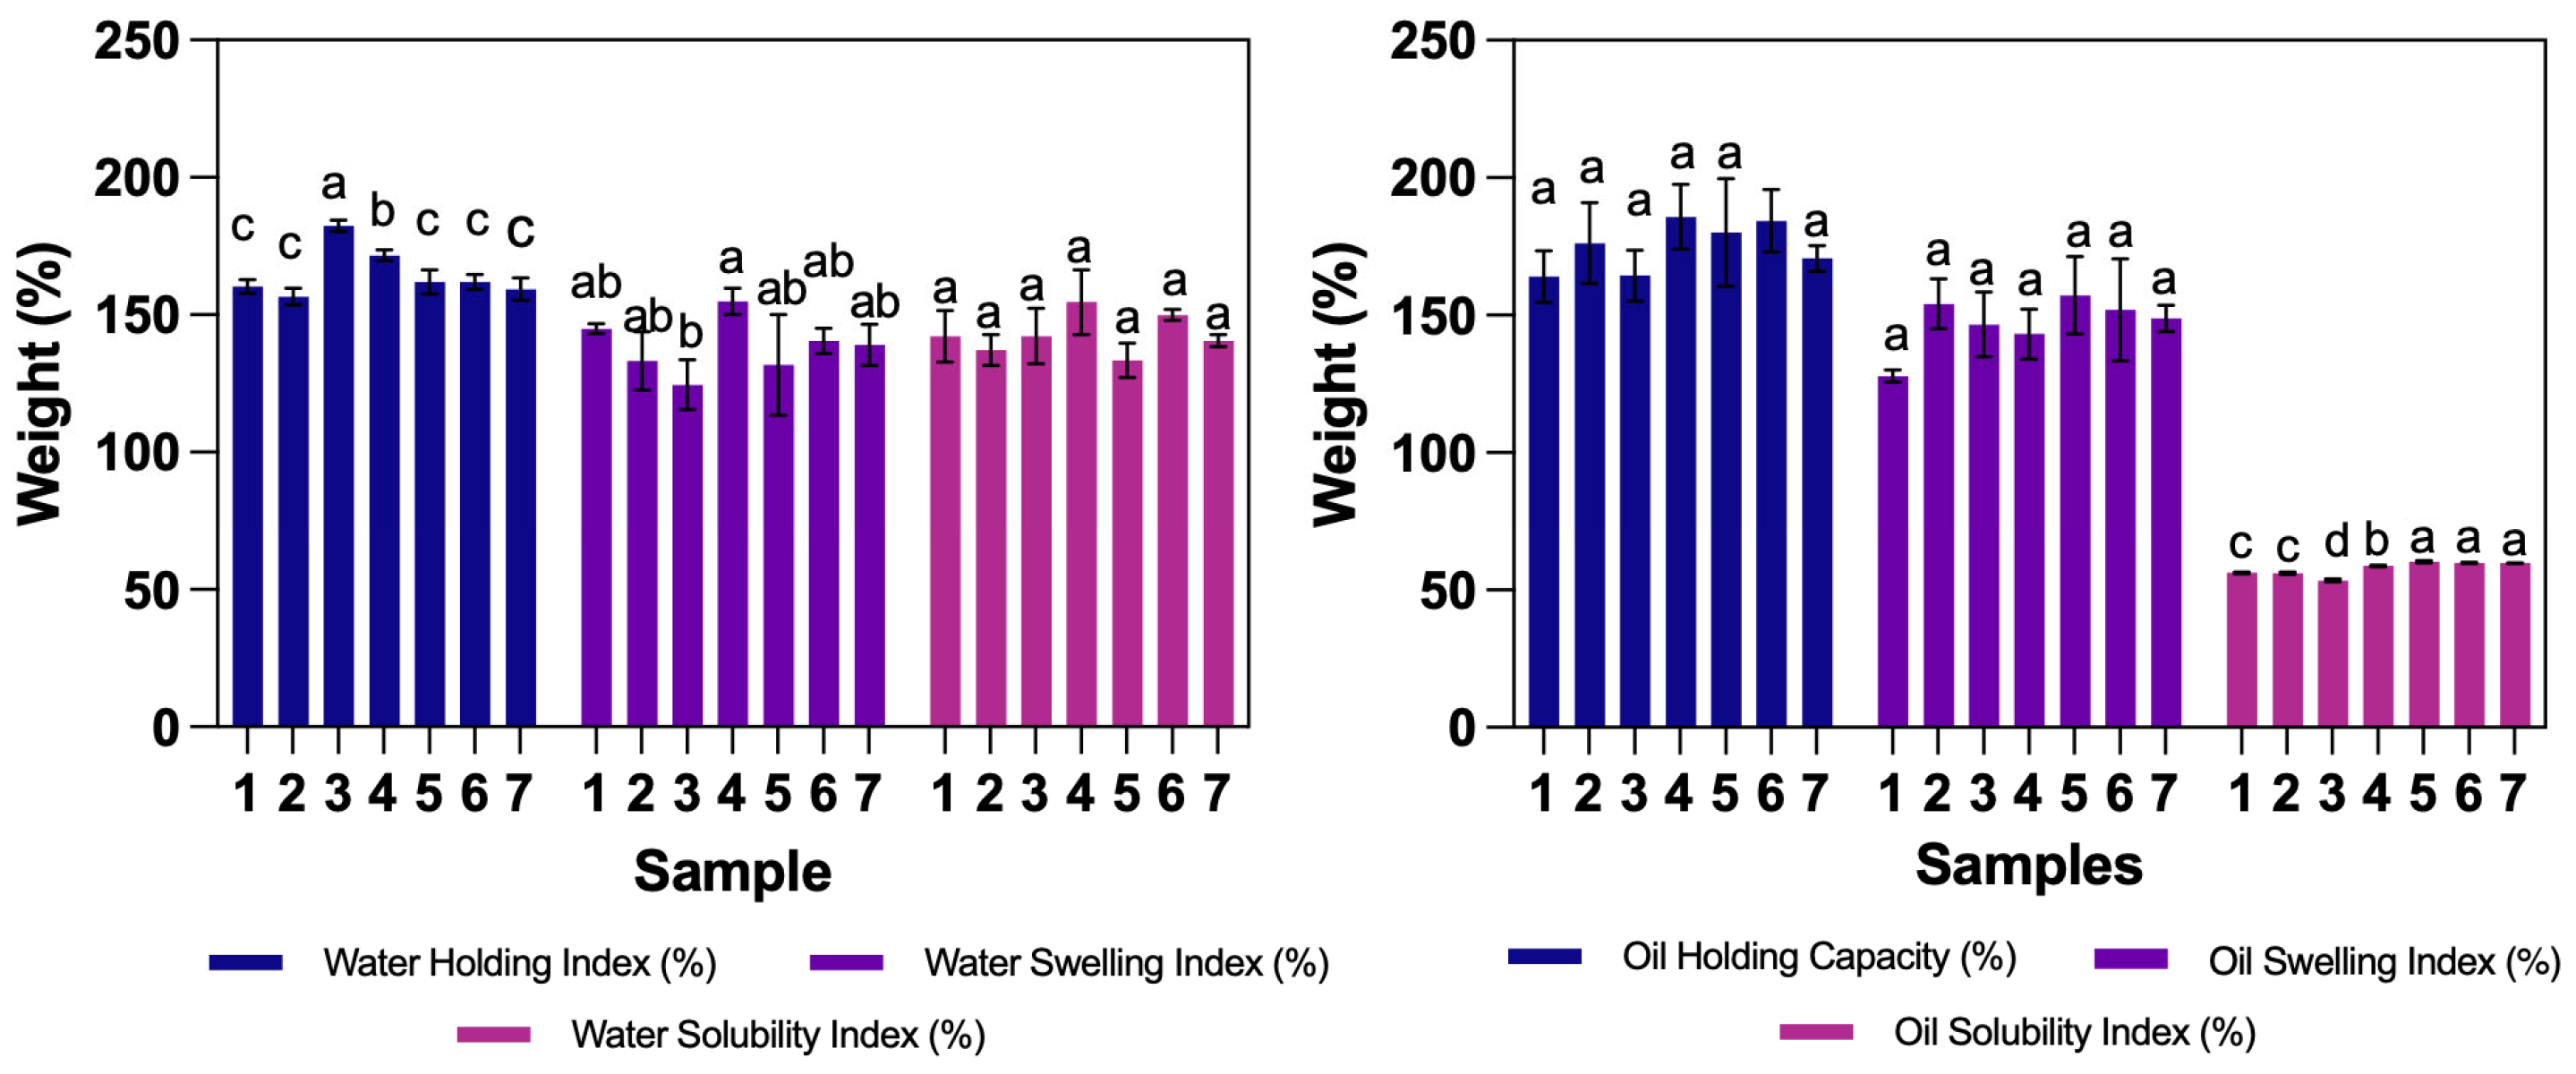
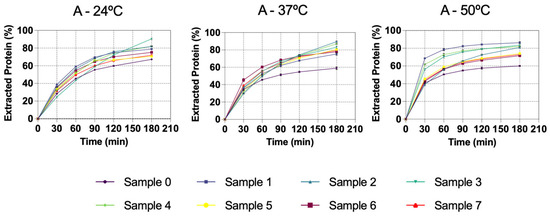
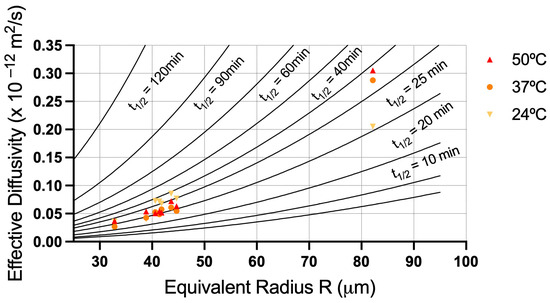
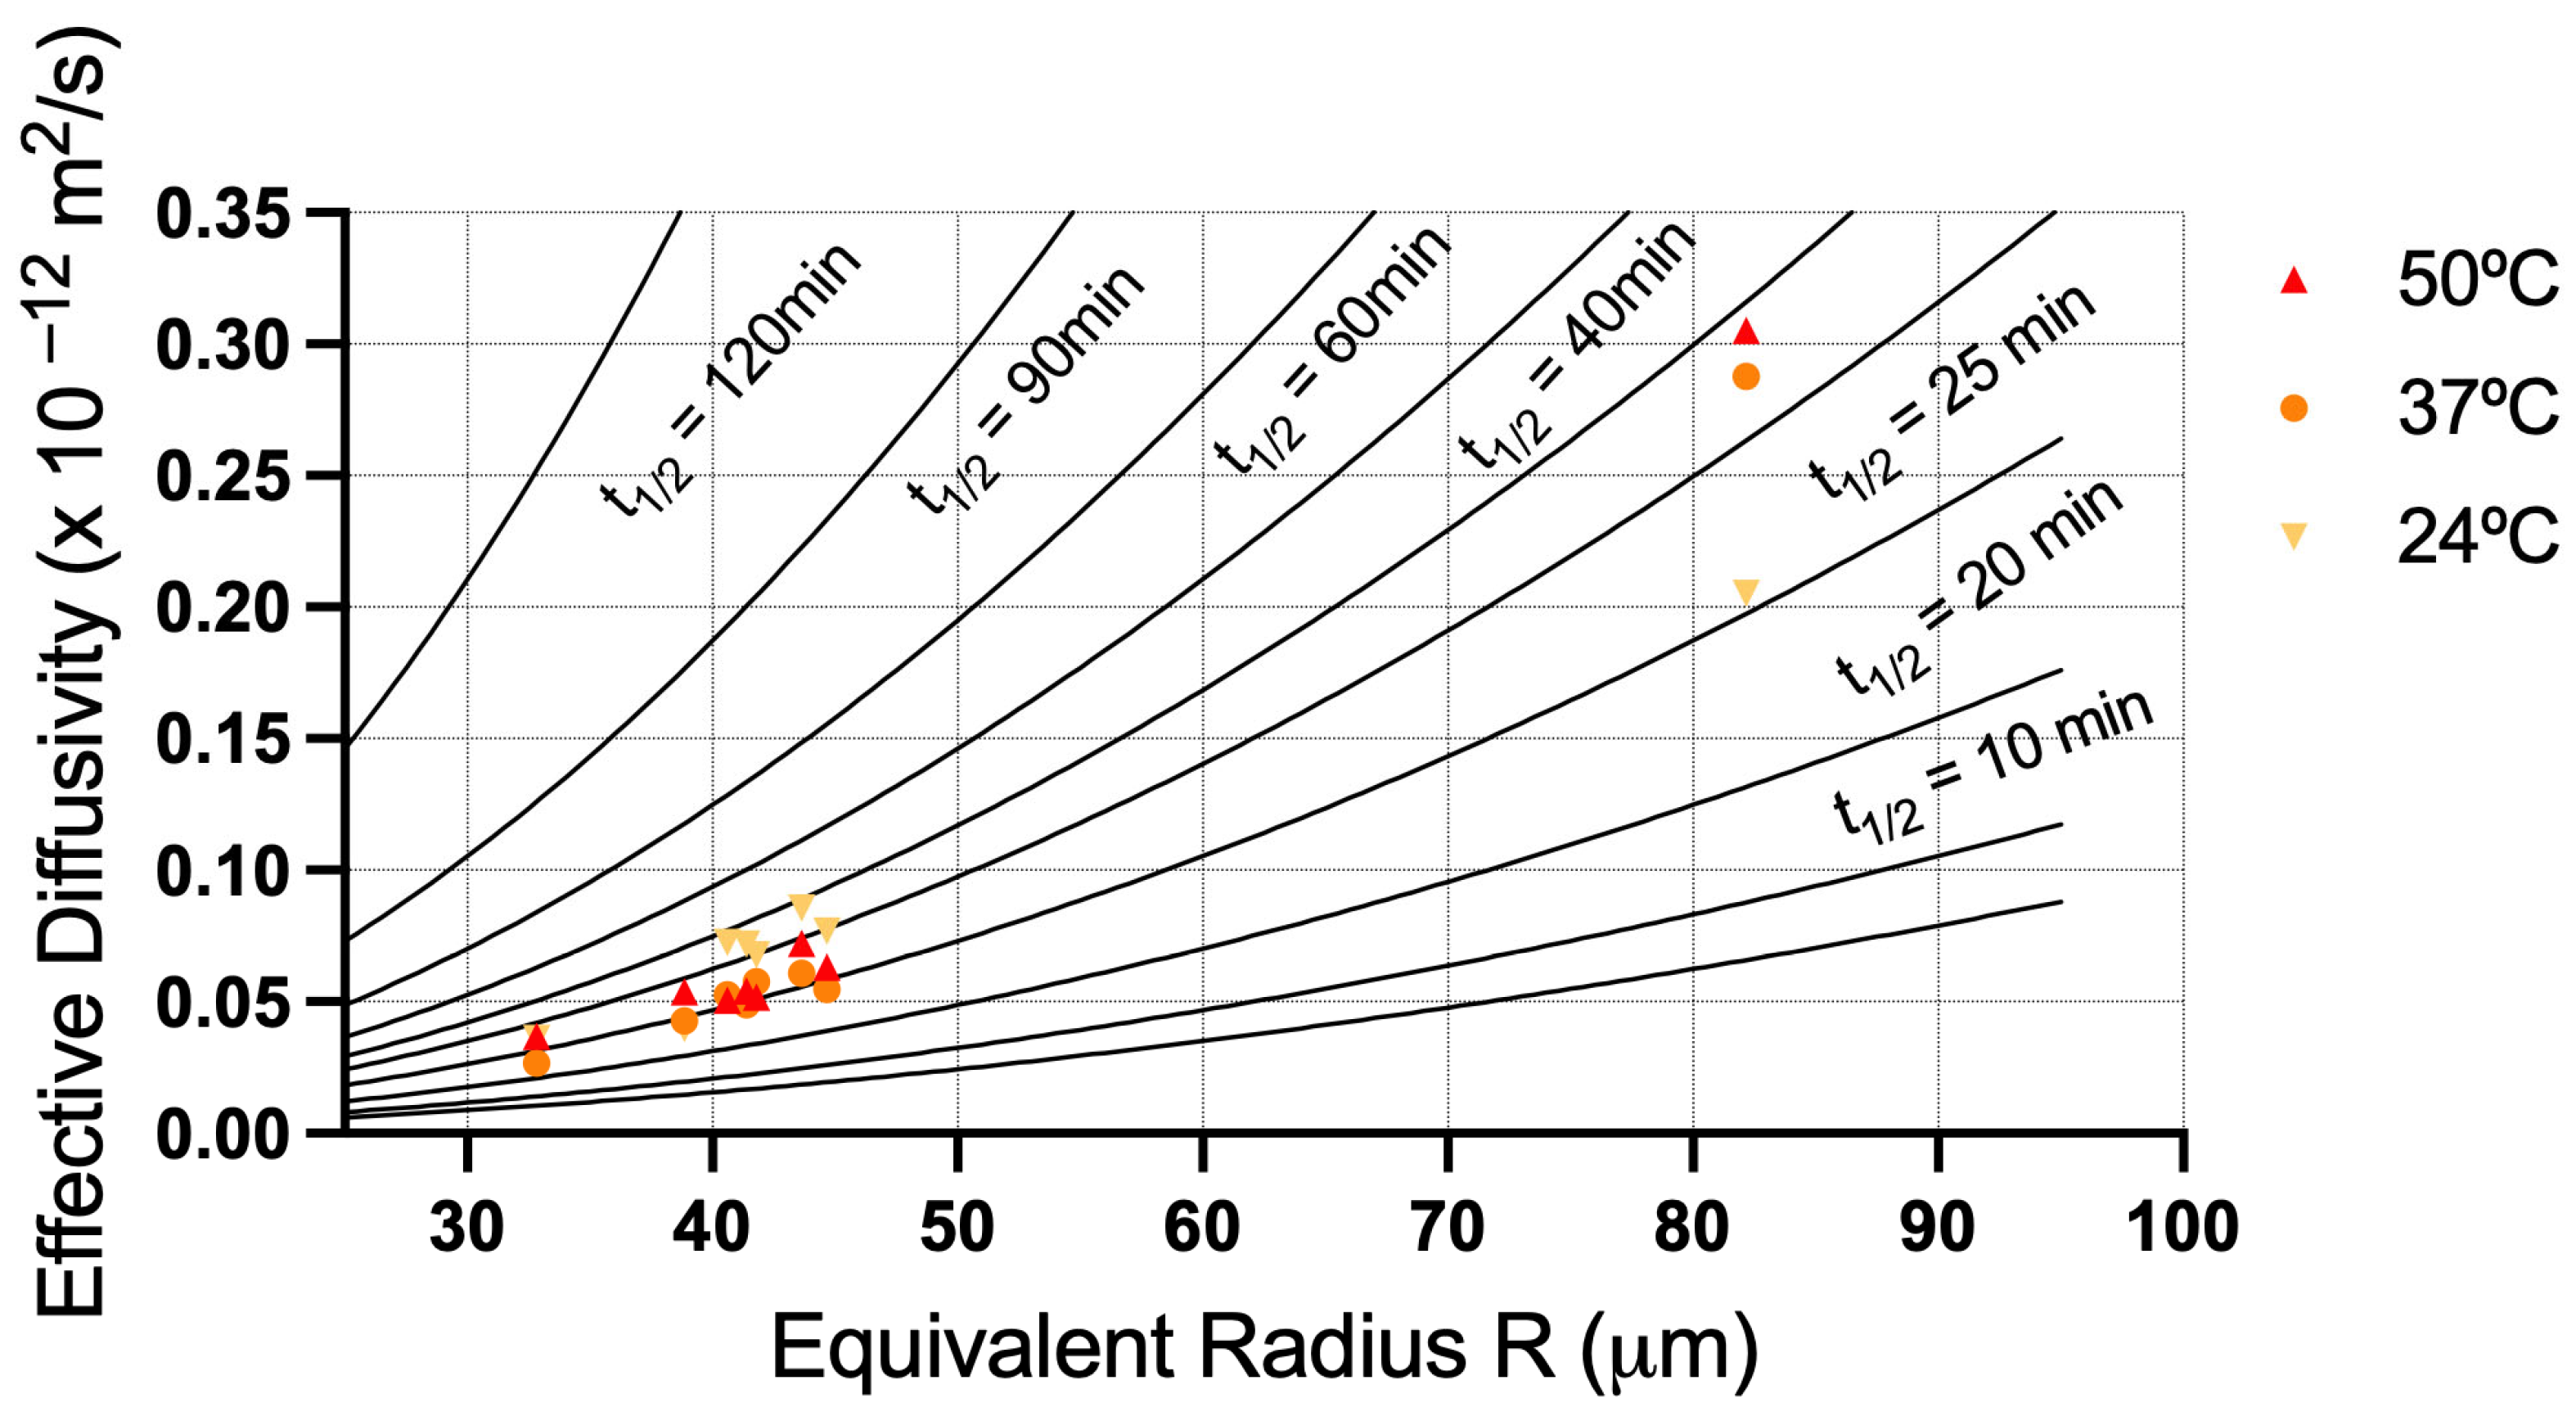
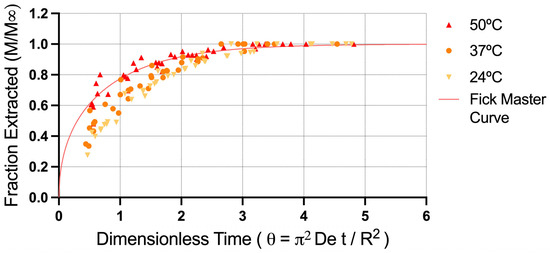
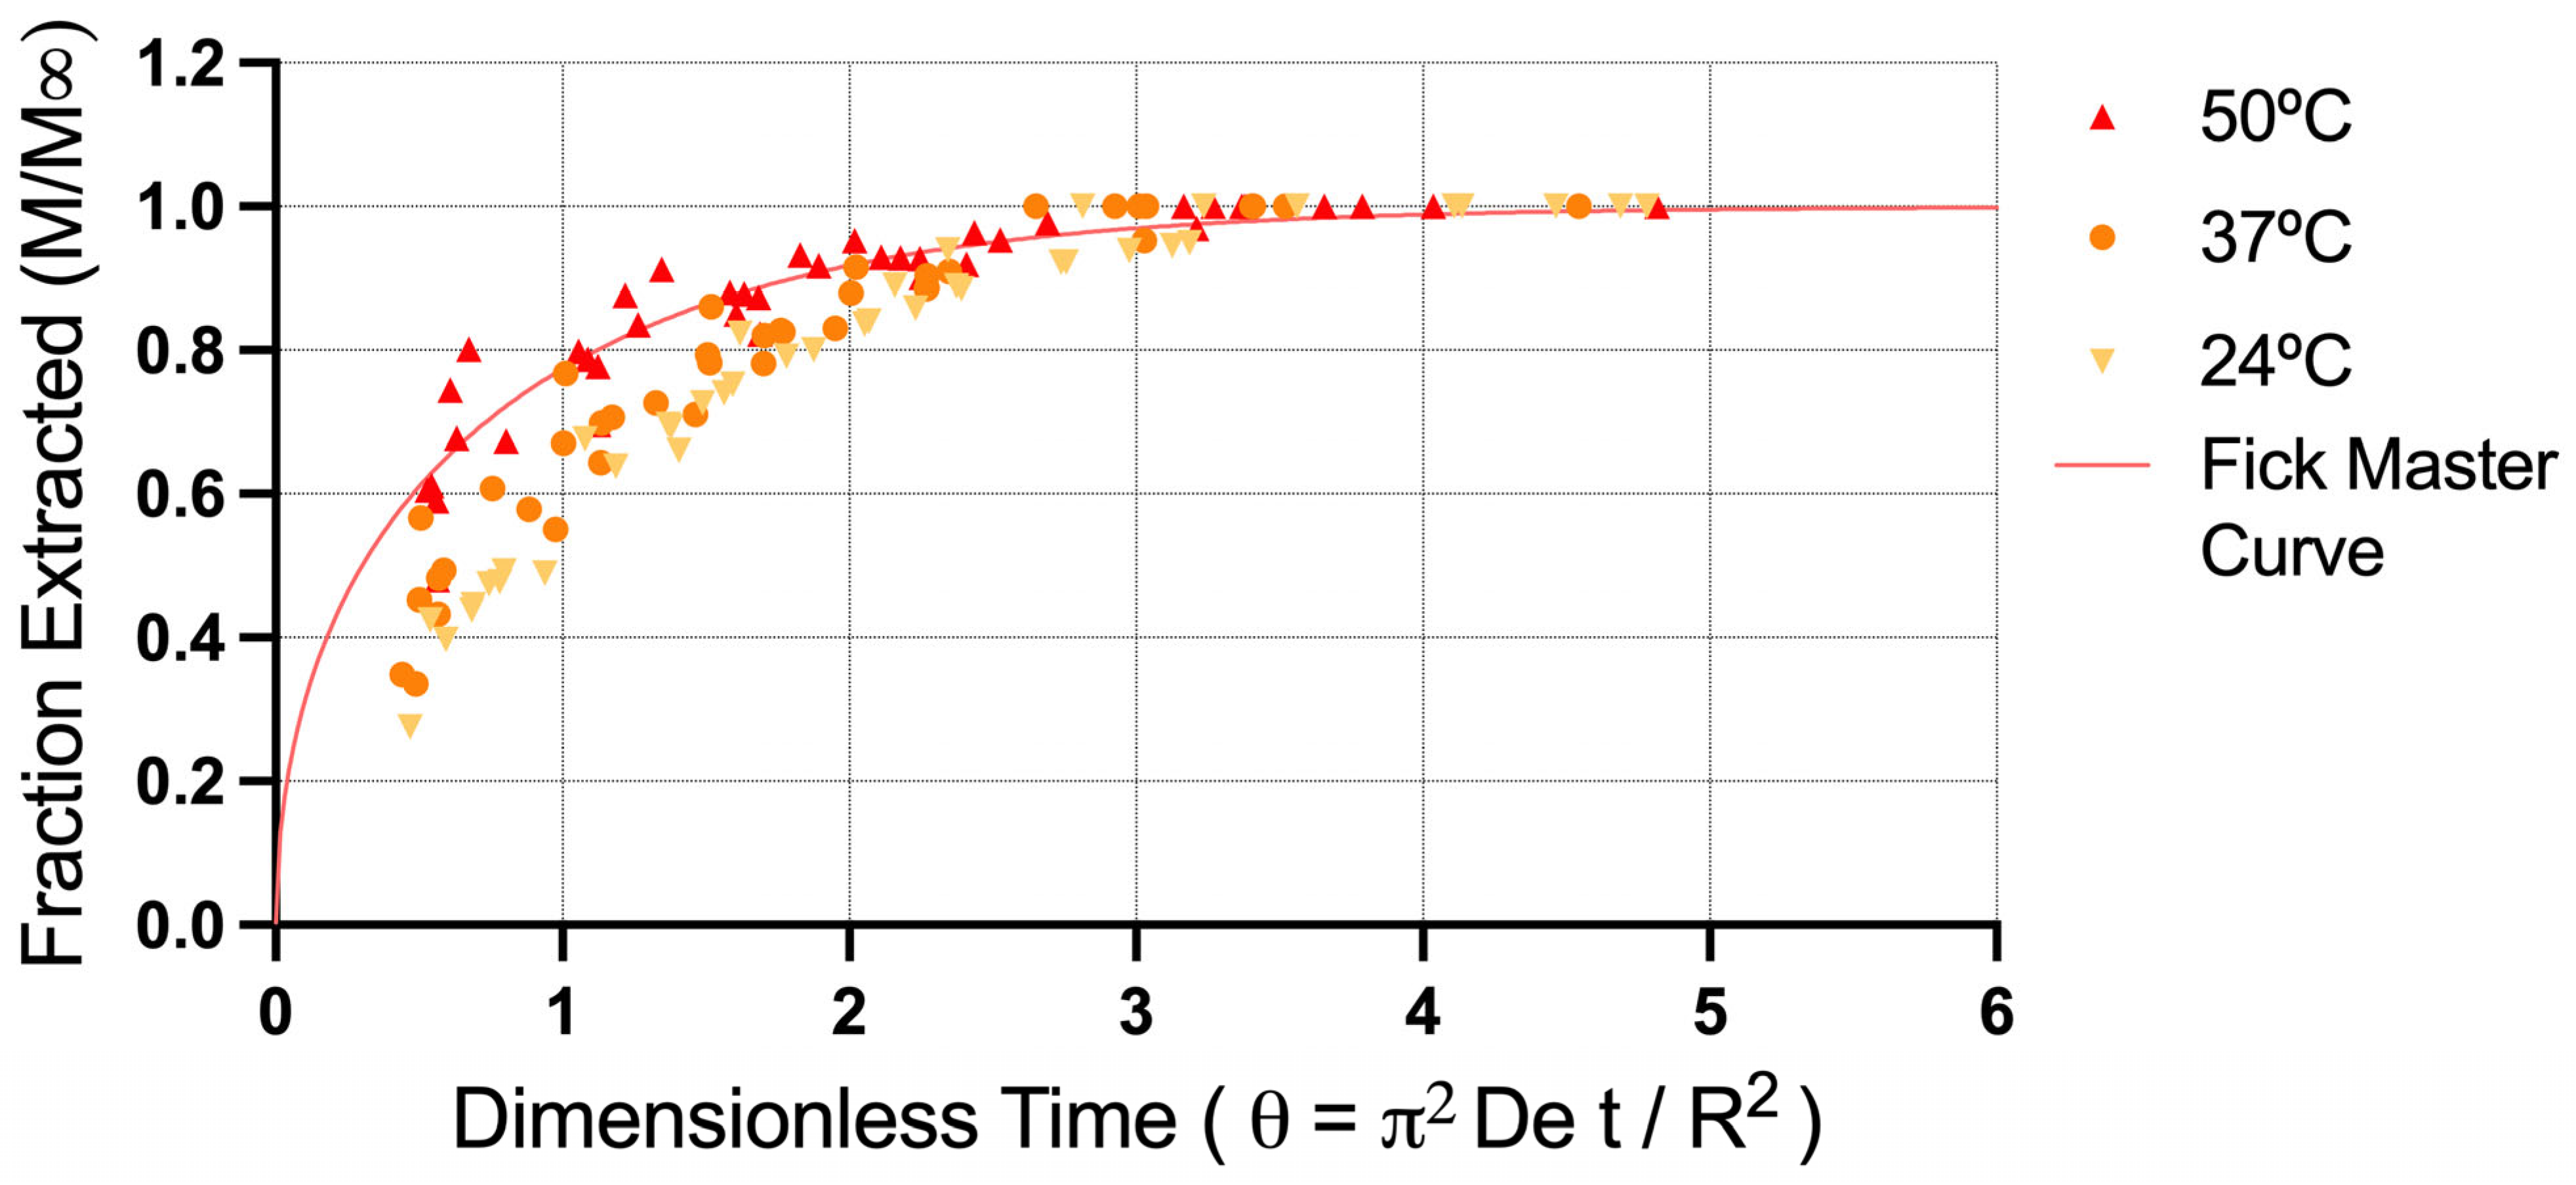

Disclaimer/Publisher’s Note: The statements, opinions and data contained in all publications are solely those of the individual author(s) and contributor(s) and not of MDPI and/or the editor(s). MDPI and/or the editor(s) disclaim responsibility for any injury to people or property resulting from any ideas, methods, instructions or products referred to in the content. |
© 2026 by the authors. Licensee MDPI, Basel, Switzerland. This article is an open access article distributed under the terms and conditions of the Creative Commons Attribution (CC BY) license.