Article

Input Data for Molecular Reconstruction of Petroleum Fractions—A Reality Check

1
University Prof. Dr. Assen Zlatarov, Professor Yakimov 1, 8010 Burgas, Bulgaria
2
LUKOIL Neftohim Burgas, 8104 Burgas, Bulgaria
3
Institute of Biophysics and Biomedical Engineering, Bulgarian Academy of Sciences, Georgi Bonchev 105, 1113 Sofia, Bulgaria
4
Sustainable Energy & Power Systems Research Centre, The Research Institute of Sciences and Engineering (RISE), University of Sharjah, Sharjah 27272, United Arab Emirates
5
Chemical Engineering Department, Faculty of Engineering, Minia University, El-Minia 61715, Egypt
*
Author to whom correspondence should be addressed.
Processes 2026, 14(10), 1606; https://doi.org/10.3390/pr14101606
Submission received: 24 April 2026 / Revised: 11 May 2026 / Accepted: 14 May 2026 / Published: 15 May 2026
(This article belongs to the Section Chemical Processes and Systems)

Abstract

Molecular reconstitution of petroleum is a computer simulation based on petroleum characterization data and applying various computational techniques to generate individual molecules, predict their properties, and construct a composition model. The accuracy of molecule physical property calculation affects the exactness of the whole process of building the molecular composition model of petroleum. To the best of our knowledge, no report has appeared yet that deals with the accuracy of the calculation of the properties of the predefined molecules used in the process of molecular reconstitution of oil. To bridge this gap we used three of the most employed group contribution methods of Joback and Reid (1987) (J&R), Abdulelah–Gani (2022) (A&G) and Constantinou–Gani (1994) (C&G) to calculate the properties of 110 molecules from gasoline range and 139 molecules from diesel range, whose measured properties were found in the Design Institute for Physical Properties (DIPPR) and API Technical Databook databases, and which were used by Xie et al. (2026) to reconstruct the molecular composition of 22 crude oils. It was found that no single group contribution method was universally superior. The J&R method performed better for most heteroatomic compounds, while the A&G method outperformed it for certain hydrocarbon classes. Only the A&G method can be used to calculate specific gravity. In general, the error of physical property calculations was variable, reaching as high as 20% (absolute) depending on the molecular weight of the molecules and their chemical class. The implementation limitations of these methods in software libraries must be carefully considered during the process of molecular reconstitution of petroleum.

1. Introduction

Crude oil stands as one of humankind’s most critical natural resources, serving as the foundational feedstock for the global energy and petrochemical sectors [1]. However, its extreme molecular complexity, comprising millions of distinct hydrocarbon compounds, presents a significant challenge for its efficient utilization [2]. To maximize the value derived from each barrel and ensure its wise use, the optimization of refining processes is paramount. This necessitates a shift from traditional bulk property analysis to a more fundamental, molecular-level understanding of the feedstock [3,4,5]. Advanced modeling techniques, particularly molecular reconstruction, have emerged as a powerful tool to achieve this task [6,7,8]. By converting obtainable bulk properties into a detailed molecular composition, this methodology aims at the accurate prediction of product qualities, facilitates the precise optimization of refinery operations, and ultimately guides the molecular management required to enhance the value of every molecule within the complex petroleum matrix [9,10,11].
The molecular modeling of complex oils has evolved through numerous reconstruction techniques, such as stochastic reconstruction (SR) [12], reconstruction by entropy maximization (REM) [13], molecular-type homologous series (MTHS) [14,15], the hybrid structural unit and bond–electron matrix (SU-BEM) approach [16], and structure-oriented lumping (SOL) [17]. Many advanced methods are derived from extensions or combinations of these core techniques [18]. More details about the molecular reconstruction methods of petroleum and their evolution through the years are presented in our recent research review [19]. Common to all these methods is a general workflow consisting of three key steps:
-
Library Generation: A molecular library, designed to represent the oil’s constituents, is constructed.
-
Property Calculation: The physicochemical properties of each molecule in the library are determined.
-
Composition Optimization: The mixture’s composition is solved by optimizing a probability distribution function (PDF—e.g., gamma or histogram distribution) over the molecular library. This process employs mixing rules and an optimization algorithm to minimize the deviation between calculated mixture properties and experimental bulk data. Weight factors are assigned to each property to prioritize its influence on the final compositional distribution.
The first two steps—library generation and property calculation—are critically important for achieving an accurate molecular reconstruction. The selection of components for the library is not mechanistic; it requires researcher expertise and a deep understanding of the specific petroleum fraction. For instance, straight-run naphtha from an atmospheric crude distillation unit (ACDU) typically contains negligible olefins, whereas naphtha from a fluid catalytic cracking unit (FCCU) contains significant amounts.
For physical property calculation, two primary approaches exist: (1) using simple correlations to determine key properties (e.g., normal boiling point and specific gravity), with all remaining properties (e.g., critical properties, acentric factor, thermal properties, viscosity) derived from standard pseudo-component generation correlations [20]; or (2) employing group contribution methods, which describe molecules as a set of structural units [21]. Historically, group contribution methods were the only viable option when experimental data was unavailable [22]. This remains particularly relevant for petroleum fractions, where experimental data is typically limited to low-molecular-weight components within the naphtha or diesel boiling range.

2. Materials and Methods

2.1. Simple Correlations for Calculation of Normal Boiling Point and Specific Gravity

In their work Jaffe et al. [23] used the correlations developed by Altgelt and Boduszinski [24] who related the normal boiling point and specific gravity to structural properties for gas oils and residua. Since the structure of each compound is defined using the SOL method, the elemental composition for each compound is fixed. This makes the calculation of the molecular weight (MW) and hydrogen-to-carbon (H/C) ratio straight-forward. The correlation to determine the normal boiling point (2) comes from the rearrangement of the molecular weight correlation shown in Equations (1) and (2) [23]:
M W   =   170   +   2.67 × 10 - 7 N B P 3 H / C 0.9
N B P = M W - 170 2.67 × 10 - 7 H / C 0.9 3
The correlation to the determine the specific gravity (Equation (4)) [23] is derived through rearrangement from another correlation for the molecular weight (Equation (3)) [23]:
M W   =   140   +   3.4   ×   10 - 7 B P 3 S G 2.5
S G = 3.4 / 2.67 M W - 170 M W - 140 H / C 0.9   2.5
where
MW is the molecular weight of the component, kg/kmol;
NBP is the normal boiling point, degrees Fahrenheit;
SG is the specific gravity;
H/C is the atomic hydrogen to carbon ratio.
Riazi [25] provided a correlation for calculating several physical properties—melting point, normal boiling point, specific gravity at 15 °C and 20 °C, refractive index parameter I, Tbr = (Tb/Tc) from which critical temperature can be calculated, critical pressure, critical density and acentric factor. These properties can be calculated for four groups of compounds: n-alkanes, n-alkylcyclopentanes, n-alkylcyclohexanes and n-alkylbenzenes. The equation used for the physical property calculations is as follows (Equation (5)) [24]:
l n θ   -   θ   =   a   -   b M c
where
θ∞ is a constant for the calculated property, when the molecular weight M → ∞;
θ—the calculated property;
M—molecular weight, kg/kmol;
a, b, c—constants for each property and compound group, given in Table 1 below.
The use of the above correlation can be extrapolated beyond the specified range of carbon numbers with reasonable error because of the limiting value of the parameter θ.
This method is used by some researchers in molecular characterization and calculation of the individual molecule properties [26].

2.2. Group Contribution Methods for Calculation of Physical Properties of Individual Components

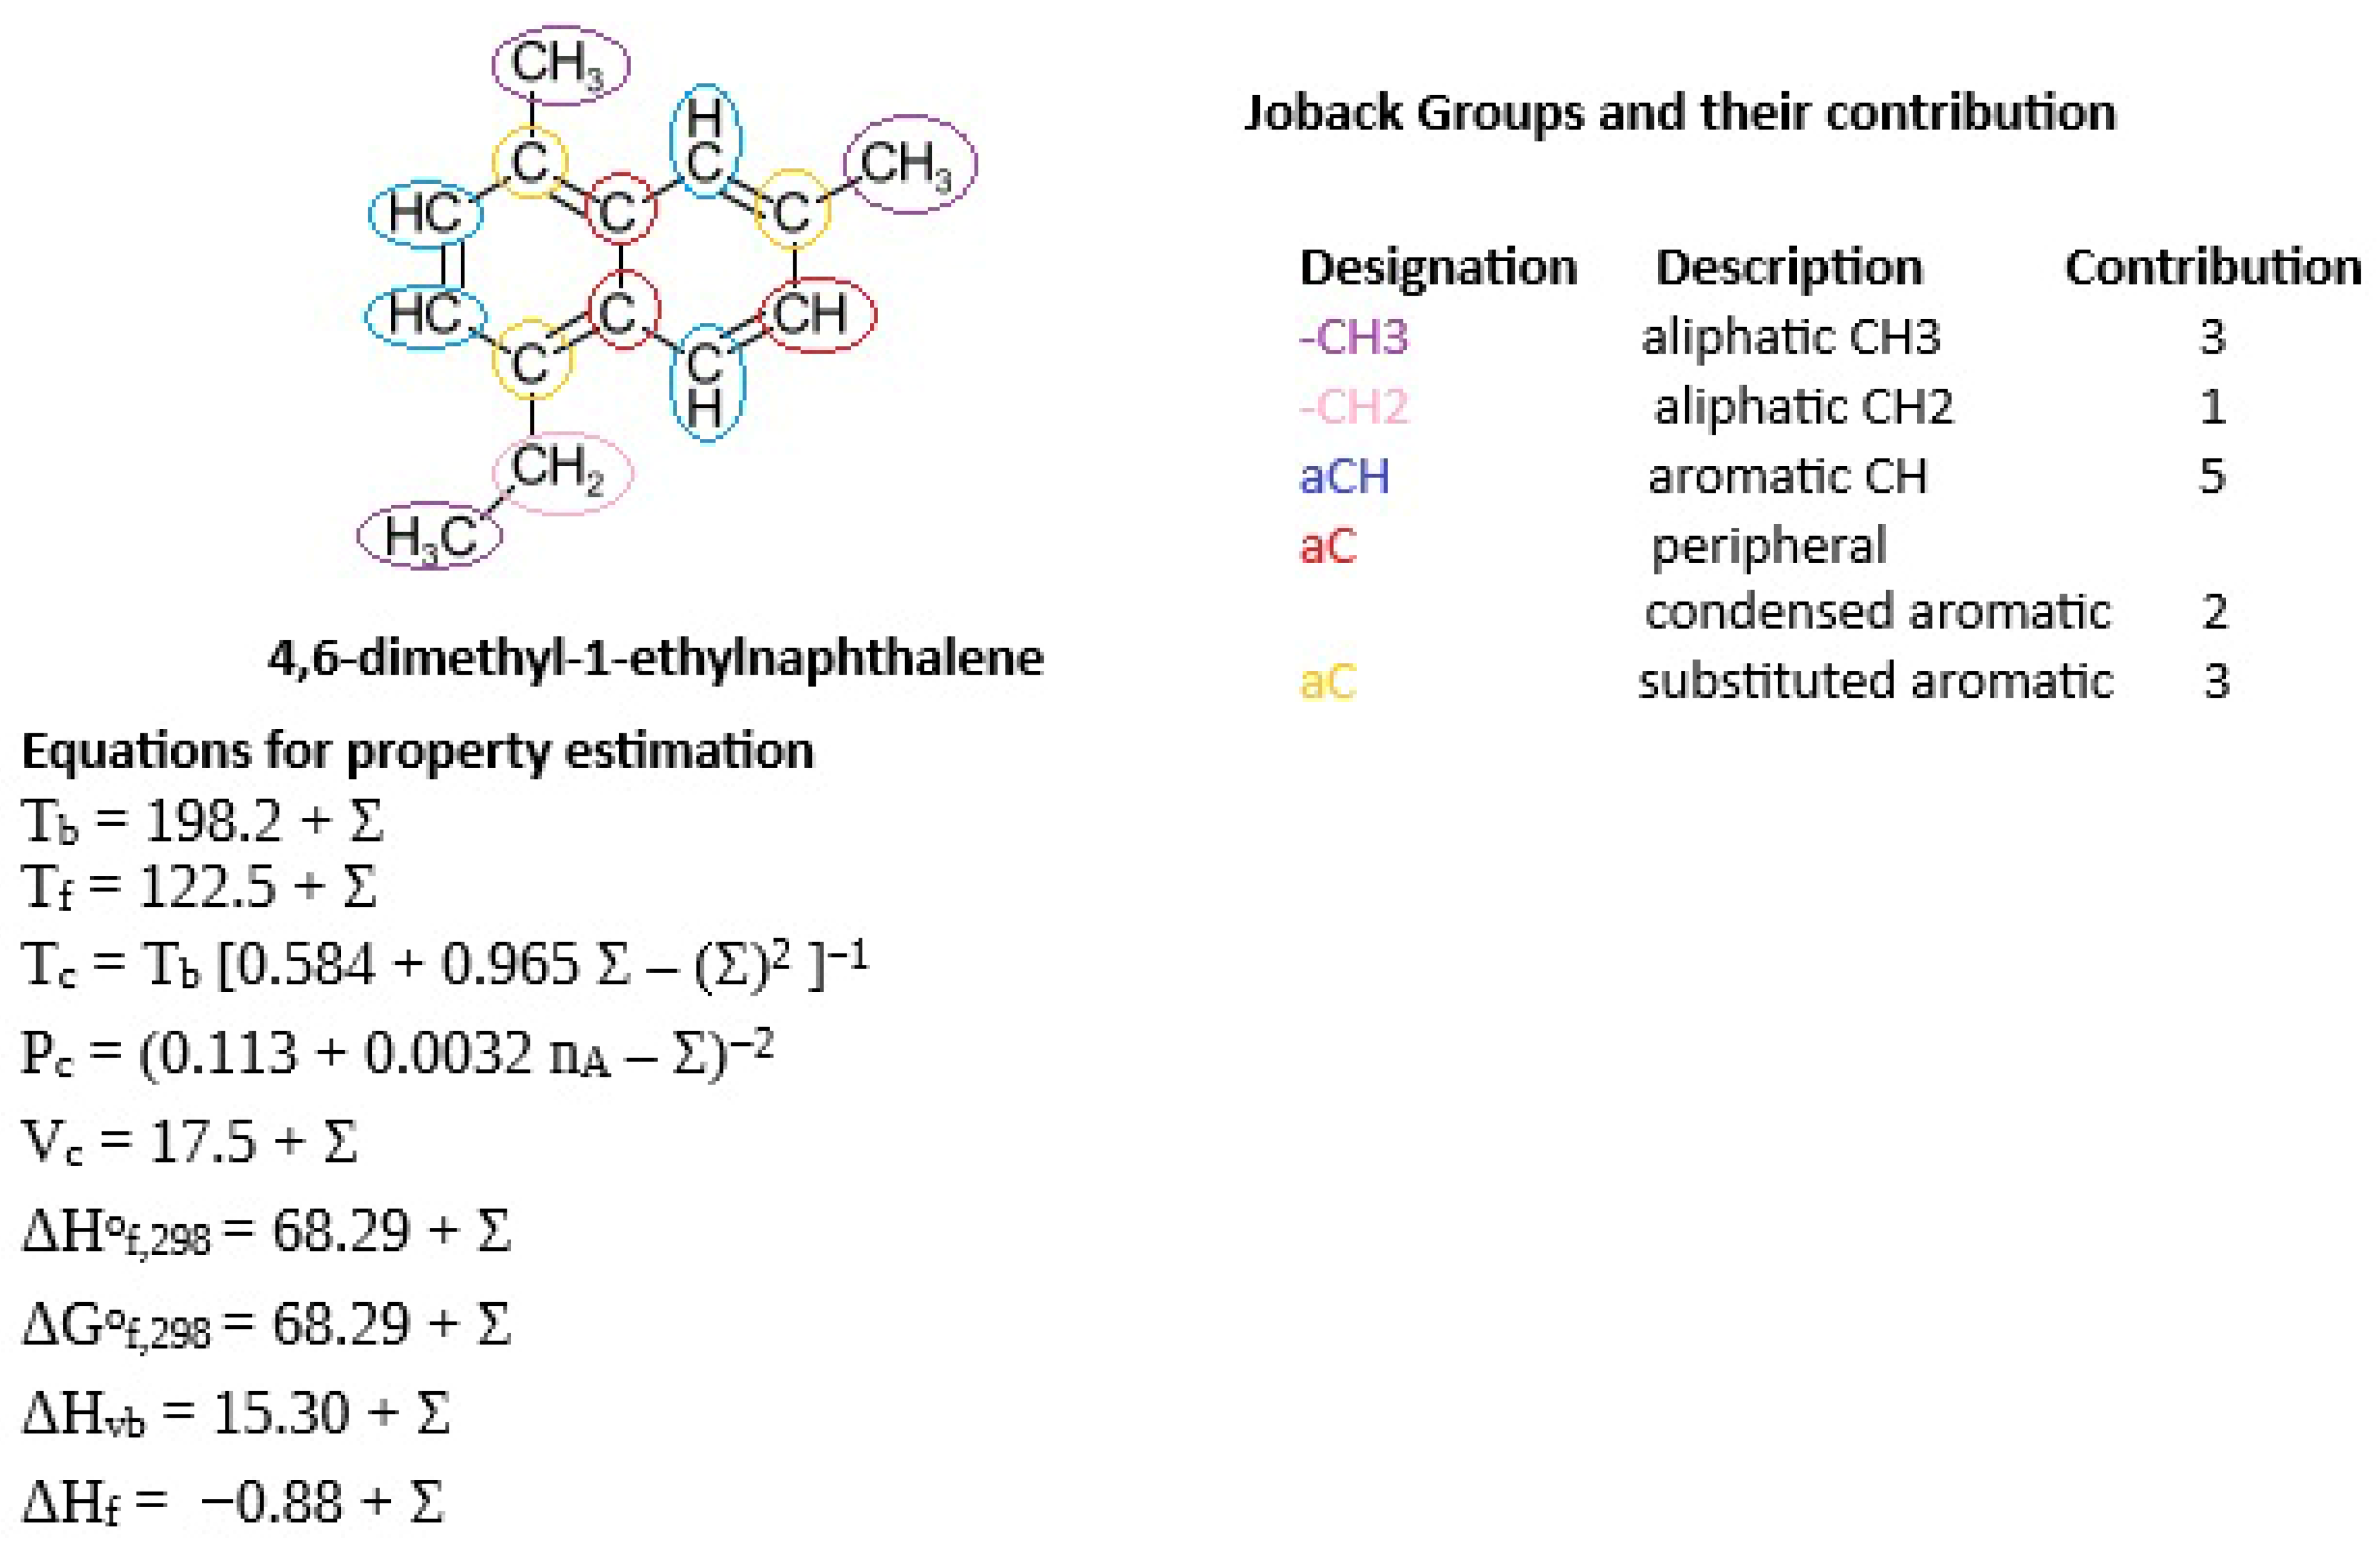
The group contribution approach is a powerful and widely used method for estimating the physicochemical properties of molecules [22]. The core principle of the approach is that molecule’s properties can be represented as a sum of contributions from its constituent structural units, known as functional groups (e.g., -CH3, -OH, -COOH). Rather than treating each molecule as a unique entity, the method breaks it down into smaller, standardized fragments. The value of any property (e.g., boiling point, critical temperature and pressure, enthalpy of formation, viscosity) is then calculated by summing the predetermined contribution values for each group present in the molecule and accounting for any necessary correction factors for molecular interactions. This approach is particularly valuable because it allows for the prediction of properties for a vast array of compounds, including novel molecules or those for which experimental data is unavailable. The work of Lydersen [27] in 1955 for the estimation of critical properties of compounds can be considered as the foundational method of using the group contribution approach. An improved group contribution method for calculation of the critical properties was proposed by Ambrose [28]. The method developed by Joback and Reid [28] expands the set of functional groups to cover more heteroatoms (nitrogen, halogens) and broadens application to 11 properties (normal boiling point, normal freezing point, critical temperature, critical pressure, critical volume, standard enthalpy of formation, standard Gibbs energy of formation, ideal gas heat capacity, enthalpy of vaporization at normal boiling point, enthalpy of fusion and liquid viscosity). Due to its simplicity and wide range of predicted properties the method of Joback and Reid [29] is adopted in many molecular reconstruction research works [30]. While the method by Joback and Reid is based on first-order groups, it introduced pseudo-second-order effects by incorporating topological corrections for ring structures and conjugated bonds. To improve predictive accuracy, researchers often introduce specialized corrections, such as one for the normal boiling point of aromatic compounds [31]. It is important to note that while numerous group contribution methods exist, most are designed to estimate a single specific property (e.g., critical properties, ideal gas heat capacity, normal boiling point, freezing point, or viscosity). Each method typically employs a unique set of structural groups, necessitating a distinct molecular breakdown for every property calculated. This makes unified methods like that of Joback and Reid highly advantageous, as a single molecular decomposition enables the estimation of a wide range of properties. An example of this group breakdown and subsequent property calculation is provided in Figure 1 and Table 2.
Constantinou and Gani [32] introduced a major advancement with the two-level framework. They use first-order groups for basic structure and second-order groups to describe molecular fragments more accurately, capturing branching, isomerism and proximity effects. The range of properties calculated by the Constantinou and Gani method include normal boiling and melting points, critical temperature, critical pressure, critical volume, standard Gibbs energy of formation, standard enthalpy of formation and standard enthalpy of vaporization. Marrero and Gani [33] further evolved the approach to a three-level system (first-, second- and third-order groups) designed to handle large, complex polycyclic compounds, improving the estimation of critical properties, enthalpies of formation and vaporization. Alshehri et al. [34] further improved the group contribution method (often referred to as Abdulelah–Gani method) utilizing functional groups for molecular representation and two parallel property estimation models, where the group contributions for each property are regressed through traditional regression techniques and machine learning techniques. Twenty-five pure component properties can be predicted using this method: critical temperature, pressure and volume; acentric factor; normal boiling and melting point; auto-ignition temperature; flash point; standard enthalpy of formation; standard Gibbs energy of formation; enthalpy of fusion and enthalpy of vaporization; liquid molar volume (from where specific gravity can be calculated); lethal doses LC50 and LD50; photochemical oxidation potential; bioconcentration factor; permissible exposure limit; physicochemical acid dissociation constant; water-solubility; octanol–water partition coefficient; Hildebrandt solubility parameter; and Hansen solubility parameter.
Examination of the dataset published by the authors of the Abdulelah–Gani method [34] on their Guthub site [35] shows that:
-
The normal boiling point group contributions were estimated with 5276 compounds with an average absolute error of 1.32% and a maximum absolute error of 288.06%. The machine learning (ML) variant of the method provides a typical error below 1 K between the predicted and the experimental value, with sudden values of 90.55 K error for certain compounds (210 compounds of 5276 total).
-
The critical temperature group contributions were estimated with 776 compounds with an average absolute error of 0.11% and a maximum absolute error of 94.77%. The machine learning variant of the method provides a typical error below 1 K, with a maximum not exceeding 1.9 K.
-
The critical pressure group contributions were estimated with 774 compounds with an average absolute error of 0.50% and a maximum absolute error of 59.90%. The machine learning variant of the method provides an average absolute error of 0.87%, with a maximum of 65.08%.
-
The acentric factor group contributions were estimated with 1723 compounds with an average absolute error of 2.65% and a maximum absolute error of 77.55%. The machine learning variant of the method provides an average absolute error of 1.08%, with a maximum of 102.65%.
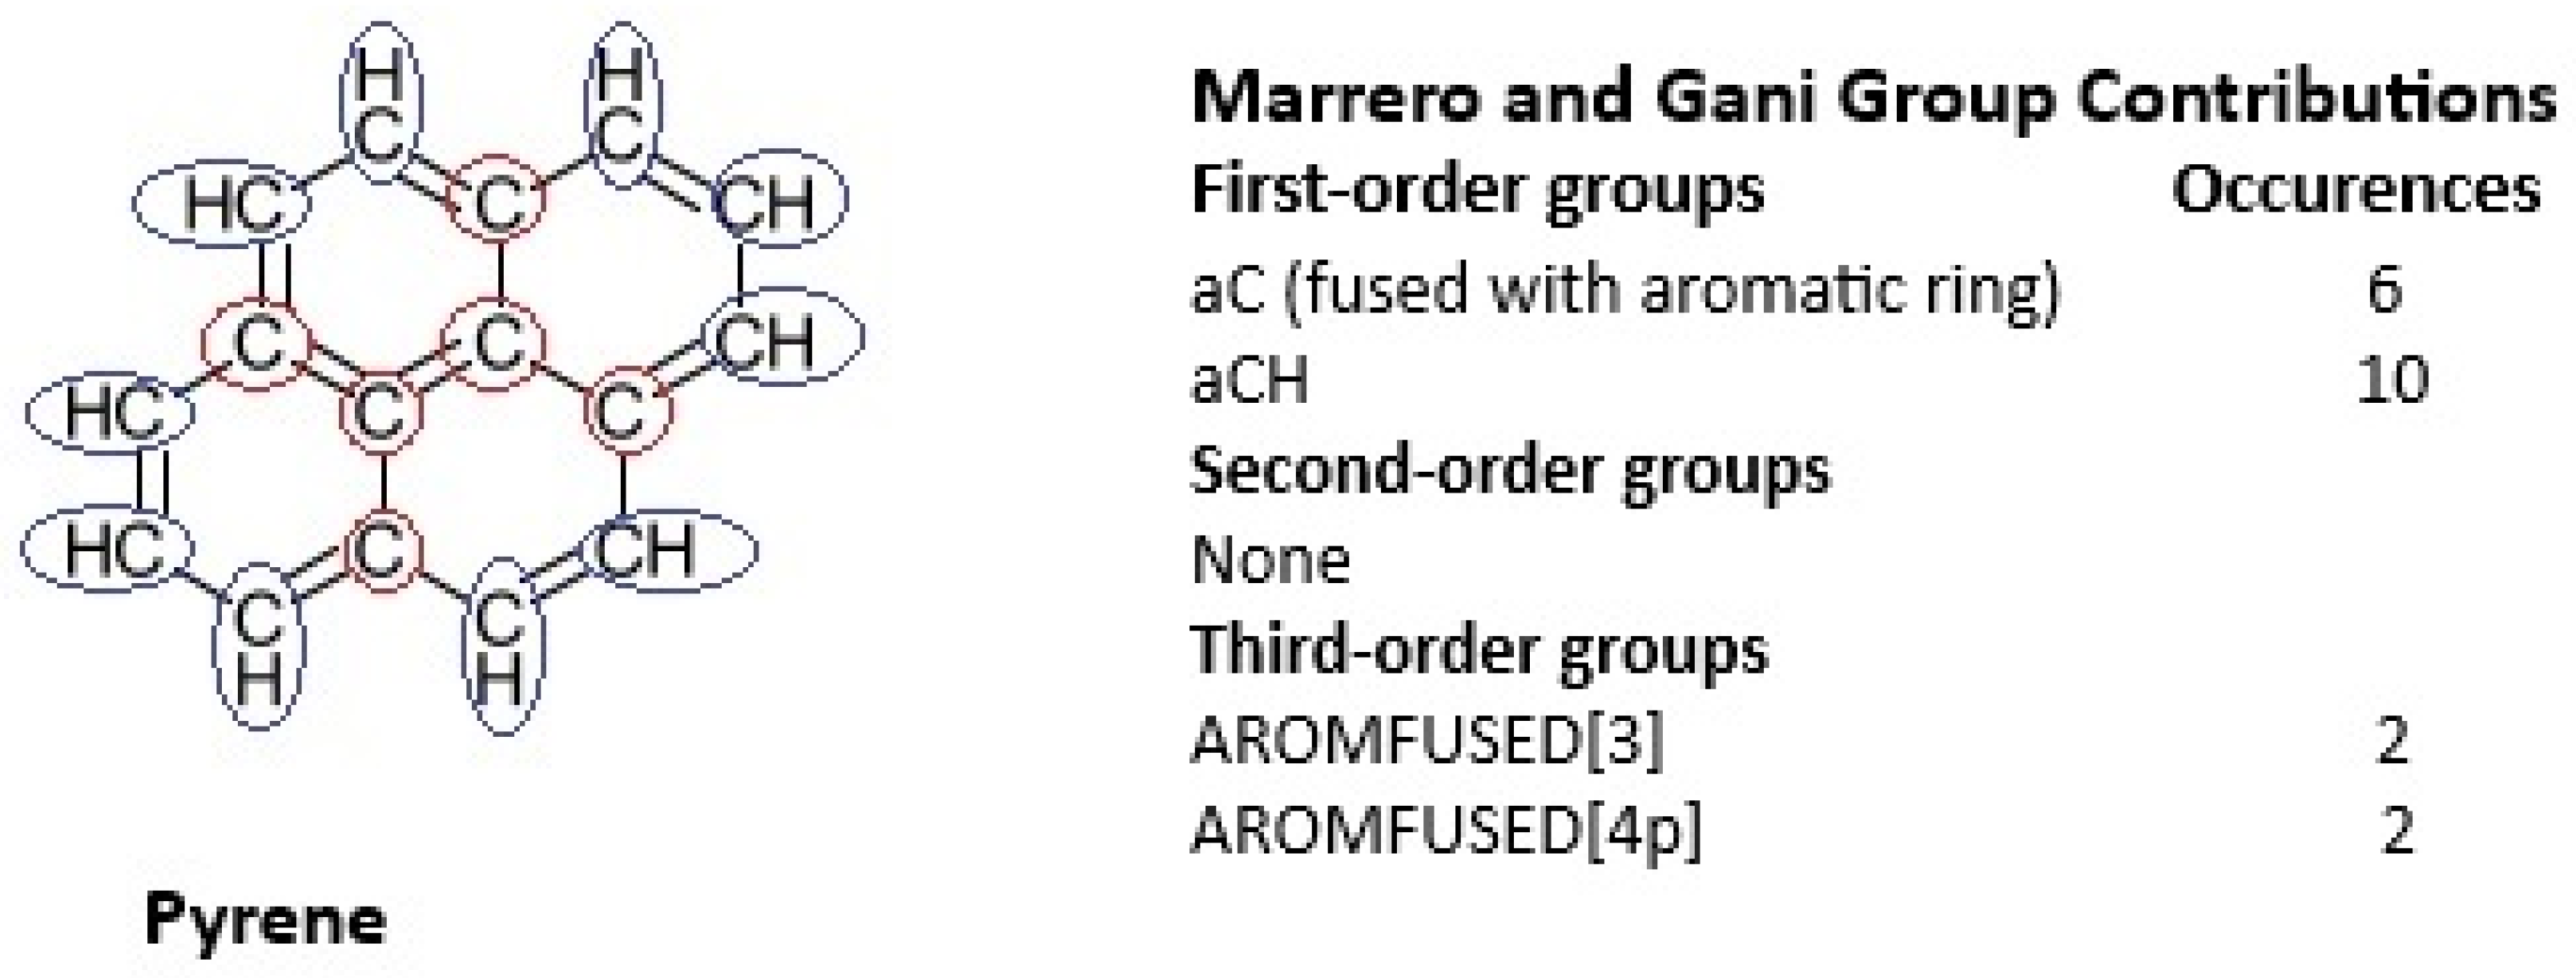
An example of group breakdown and properties calculation for the Marrero and Gani method [33] is presented in Figure 2 and Table 3.

3. Results

3.1. Case Study for Physical Property Calculations of Molecule Database Employing Group Contribution Methods

This study utilizes an open-source molecular reconstruction database for naphtha, diesel, vacuum gas oil (VGO), and vacuum residue (VR), developed by Xie et al. [36] and available on GitHub [37]. Their method reconstructs a crude oil’s molecular composition from standard evaluation reports by first modeling the four individual fractions based on bulk properties and then blending them according to their mass yields.
The provided database, in MS Excel format, contains a comprehensive molecular list for each fraction with associated data, including a SMILES string, structural unit (SU) string, InChI Key, elemental formula, molecular weight, and pre-calculated properties (e.g., boiling point, double-bond equivalent, ring counts). The library contains 161, 885, 7464, and 31,611 molecules for the naphtha, diesel, VGO, and VR fractions, respectively, totaling 32,650 for the combined crude oil.
A custom Python program was developed to process this database. For each molecule, the program:
  • Reads the SMILES string.
  • Calculates physical properties using two group contribution methods: Joback and Reid [29] and the method by Alshehri et al. (hereafter referred to as the Abdulelah–Gani method) [34]. The ugropy library [38,39] was used to automatically identify the required functional groups from the SMILES strings for both methods.
  • Attempts to retrieve the IUPAC name from the PubChem database via the pubchempy library [40] using the SMILES string. This was successful for 160 (naphtha), 561 (diesel), 749 (VGO), and 585 (VR) molecules.
For the naphtha and diesel fractions, the successfully identified IUPAC names were used to search for experimental property data in the DIPPR [41] and API Technical Databook [42] databases. Experimental data was found for 110 naphtha and 139 diesel compounds. This experimental dataset was used to evaluate the predictive accuracy of the two group contribution methods for five key properties: normal boiling point, critical temperature, critical pressure, acentric factor, and specific gravity. It is important to note that, of the two methods, only the Abdulelah–Gani method provides a correlation for specific gravity (via calculation of liquid molar volume at 298 K, which is then converted to density using molecular weight).
According to its documentation [39], the ugropy library’s implementation of the Abdulelah–Gani (AG) method is incomplete. While first- and second-order group contributions function correctly, third-order groups and their associated corrections are not yet fully operational. Furthermore, ugropy implements the GC-SIMPLE variant of the AG method, omitting the machine learning (ML) option. We also identified that ugropy does not calculate all properties defined in the AG method. A key example is the normal boiling point, which in this study was instead calculated using the similar Constantinou and Gani method [32].

3.2. Evaluating Group Contribution Methods for Naphtha Components

The 110 compounds for which experimental data was obtained were divided into several categories:
-
Iso-alkanes, consisting of 20 compounds;
-
Normal alkanes, consisting of 11 compounds;
-
Mono-aromatic hydrocarbons, consisting of 16 compounds;
-
Naphthenes, consisting of 34 compounds;
-
Nitrogen-containing compounds, consisting of 5 compounds;
-
Sulfur-containing compounds, consisting of 14 compounds;
-
Oxygen-containing compounds, consisting of 10 compounds.
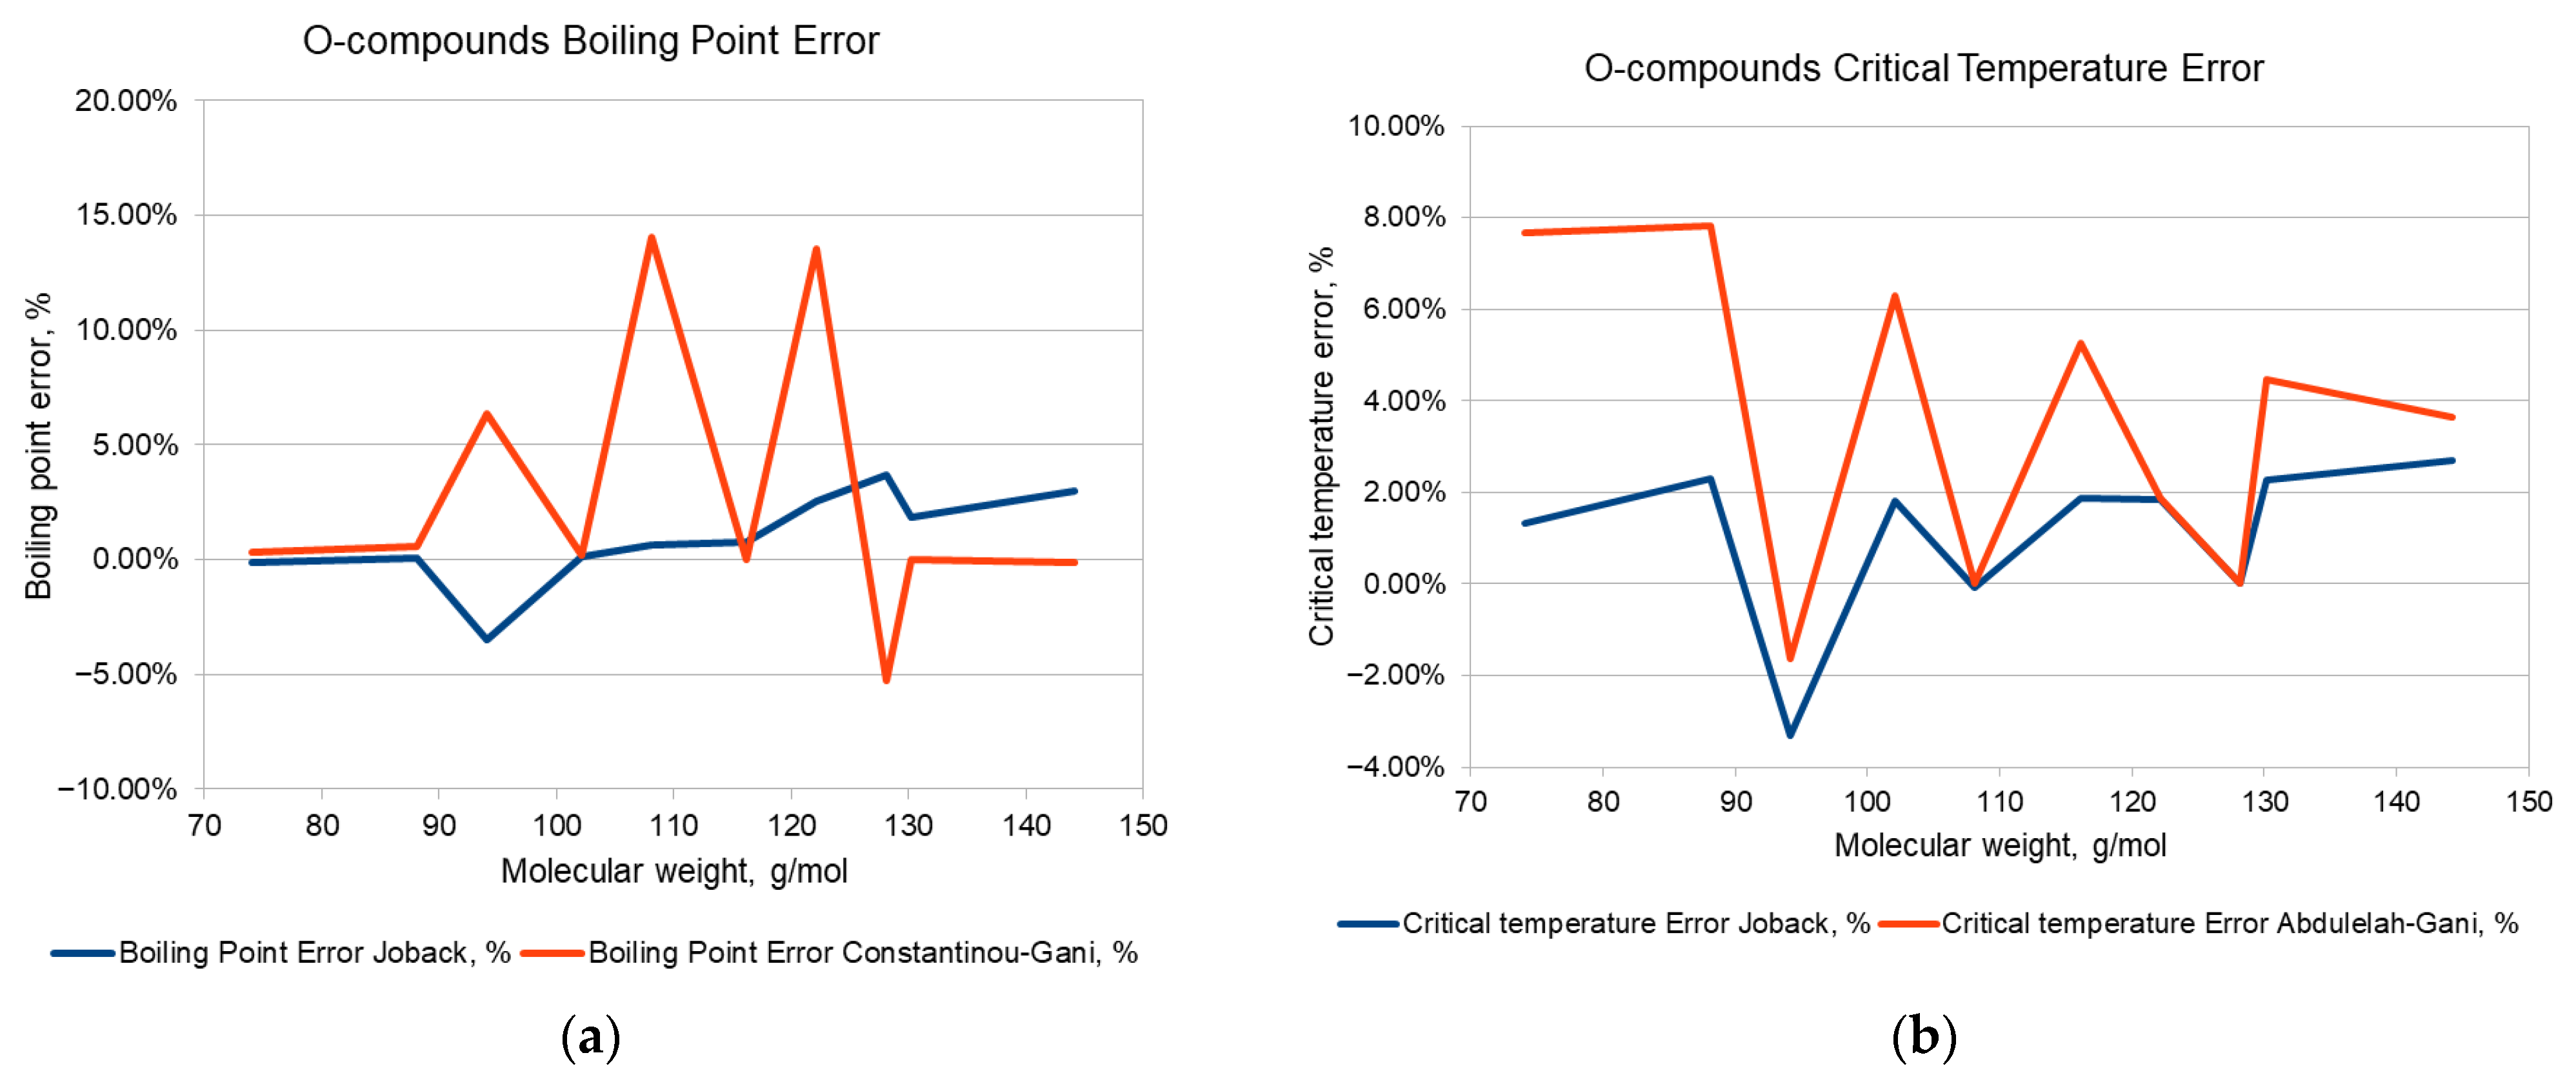
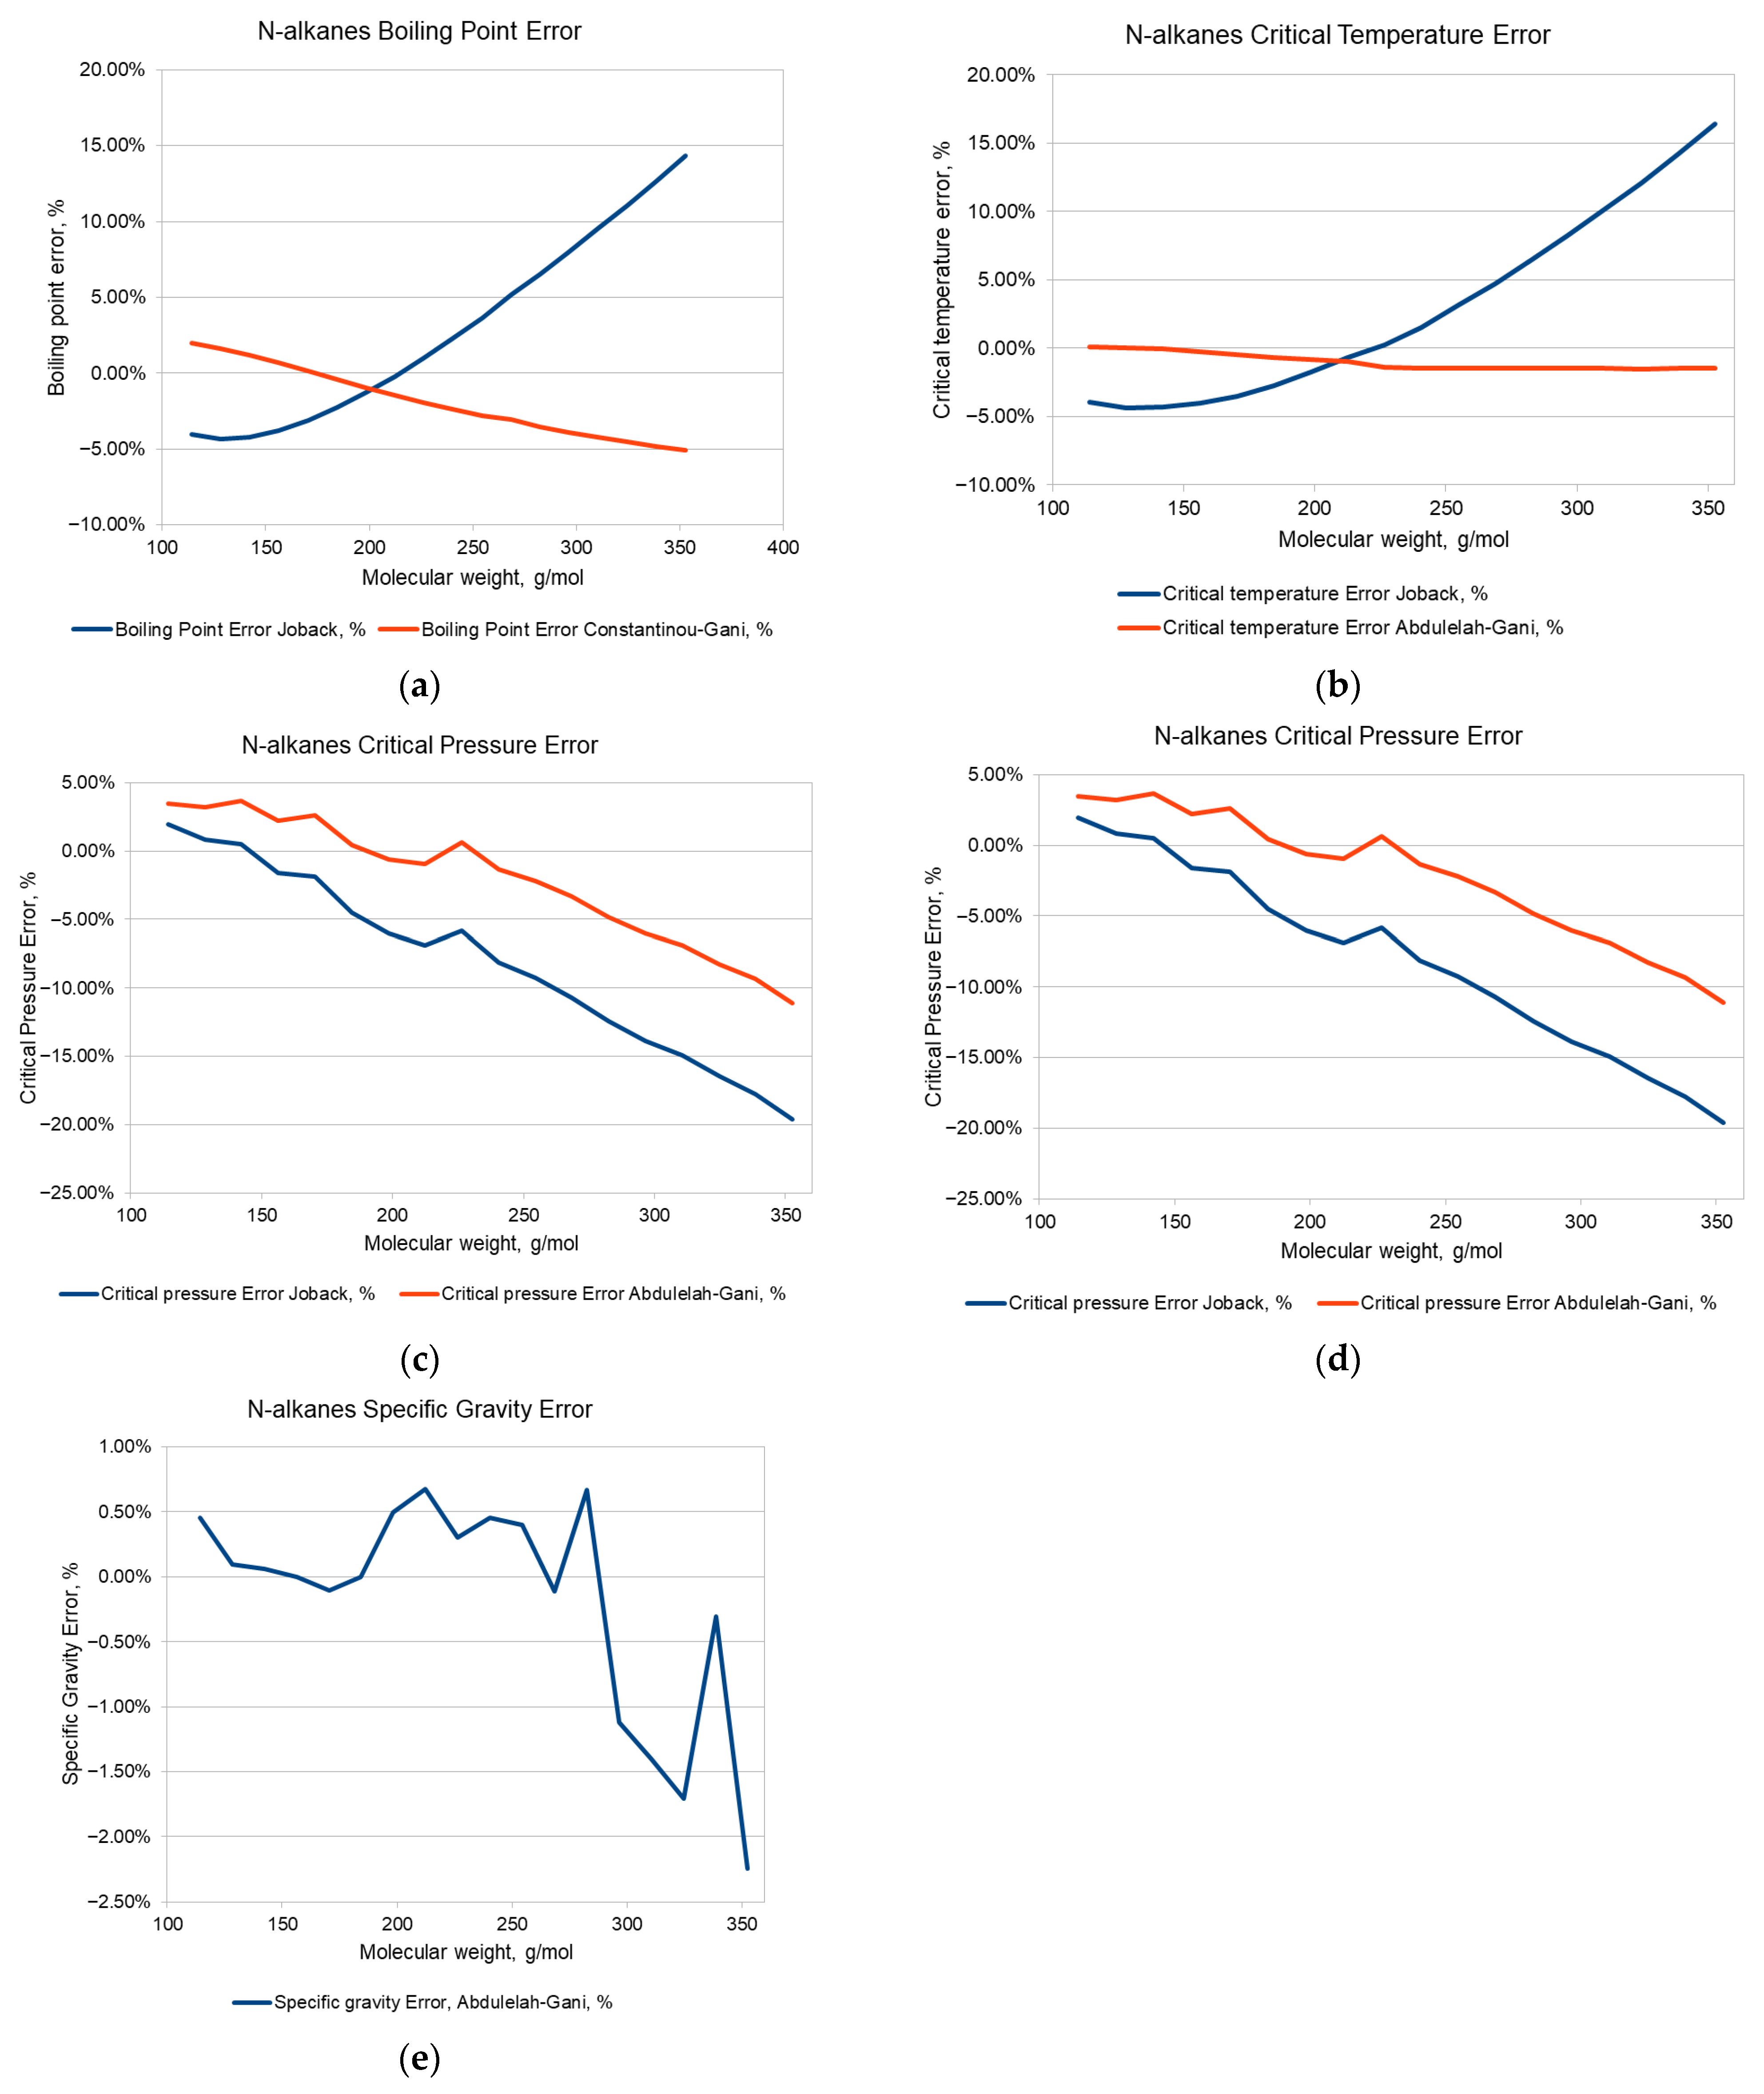
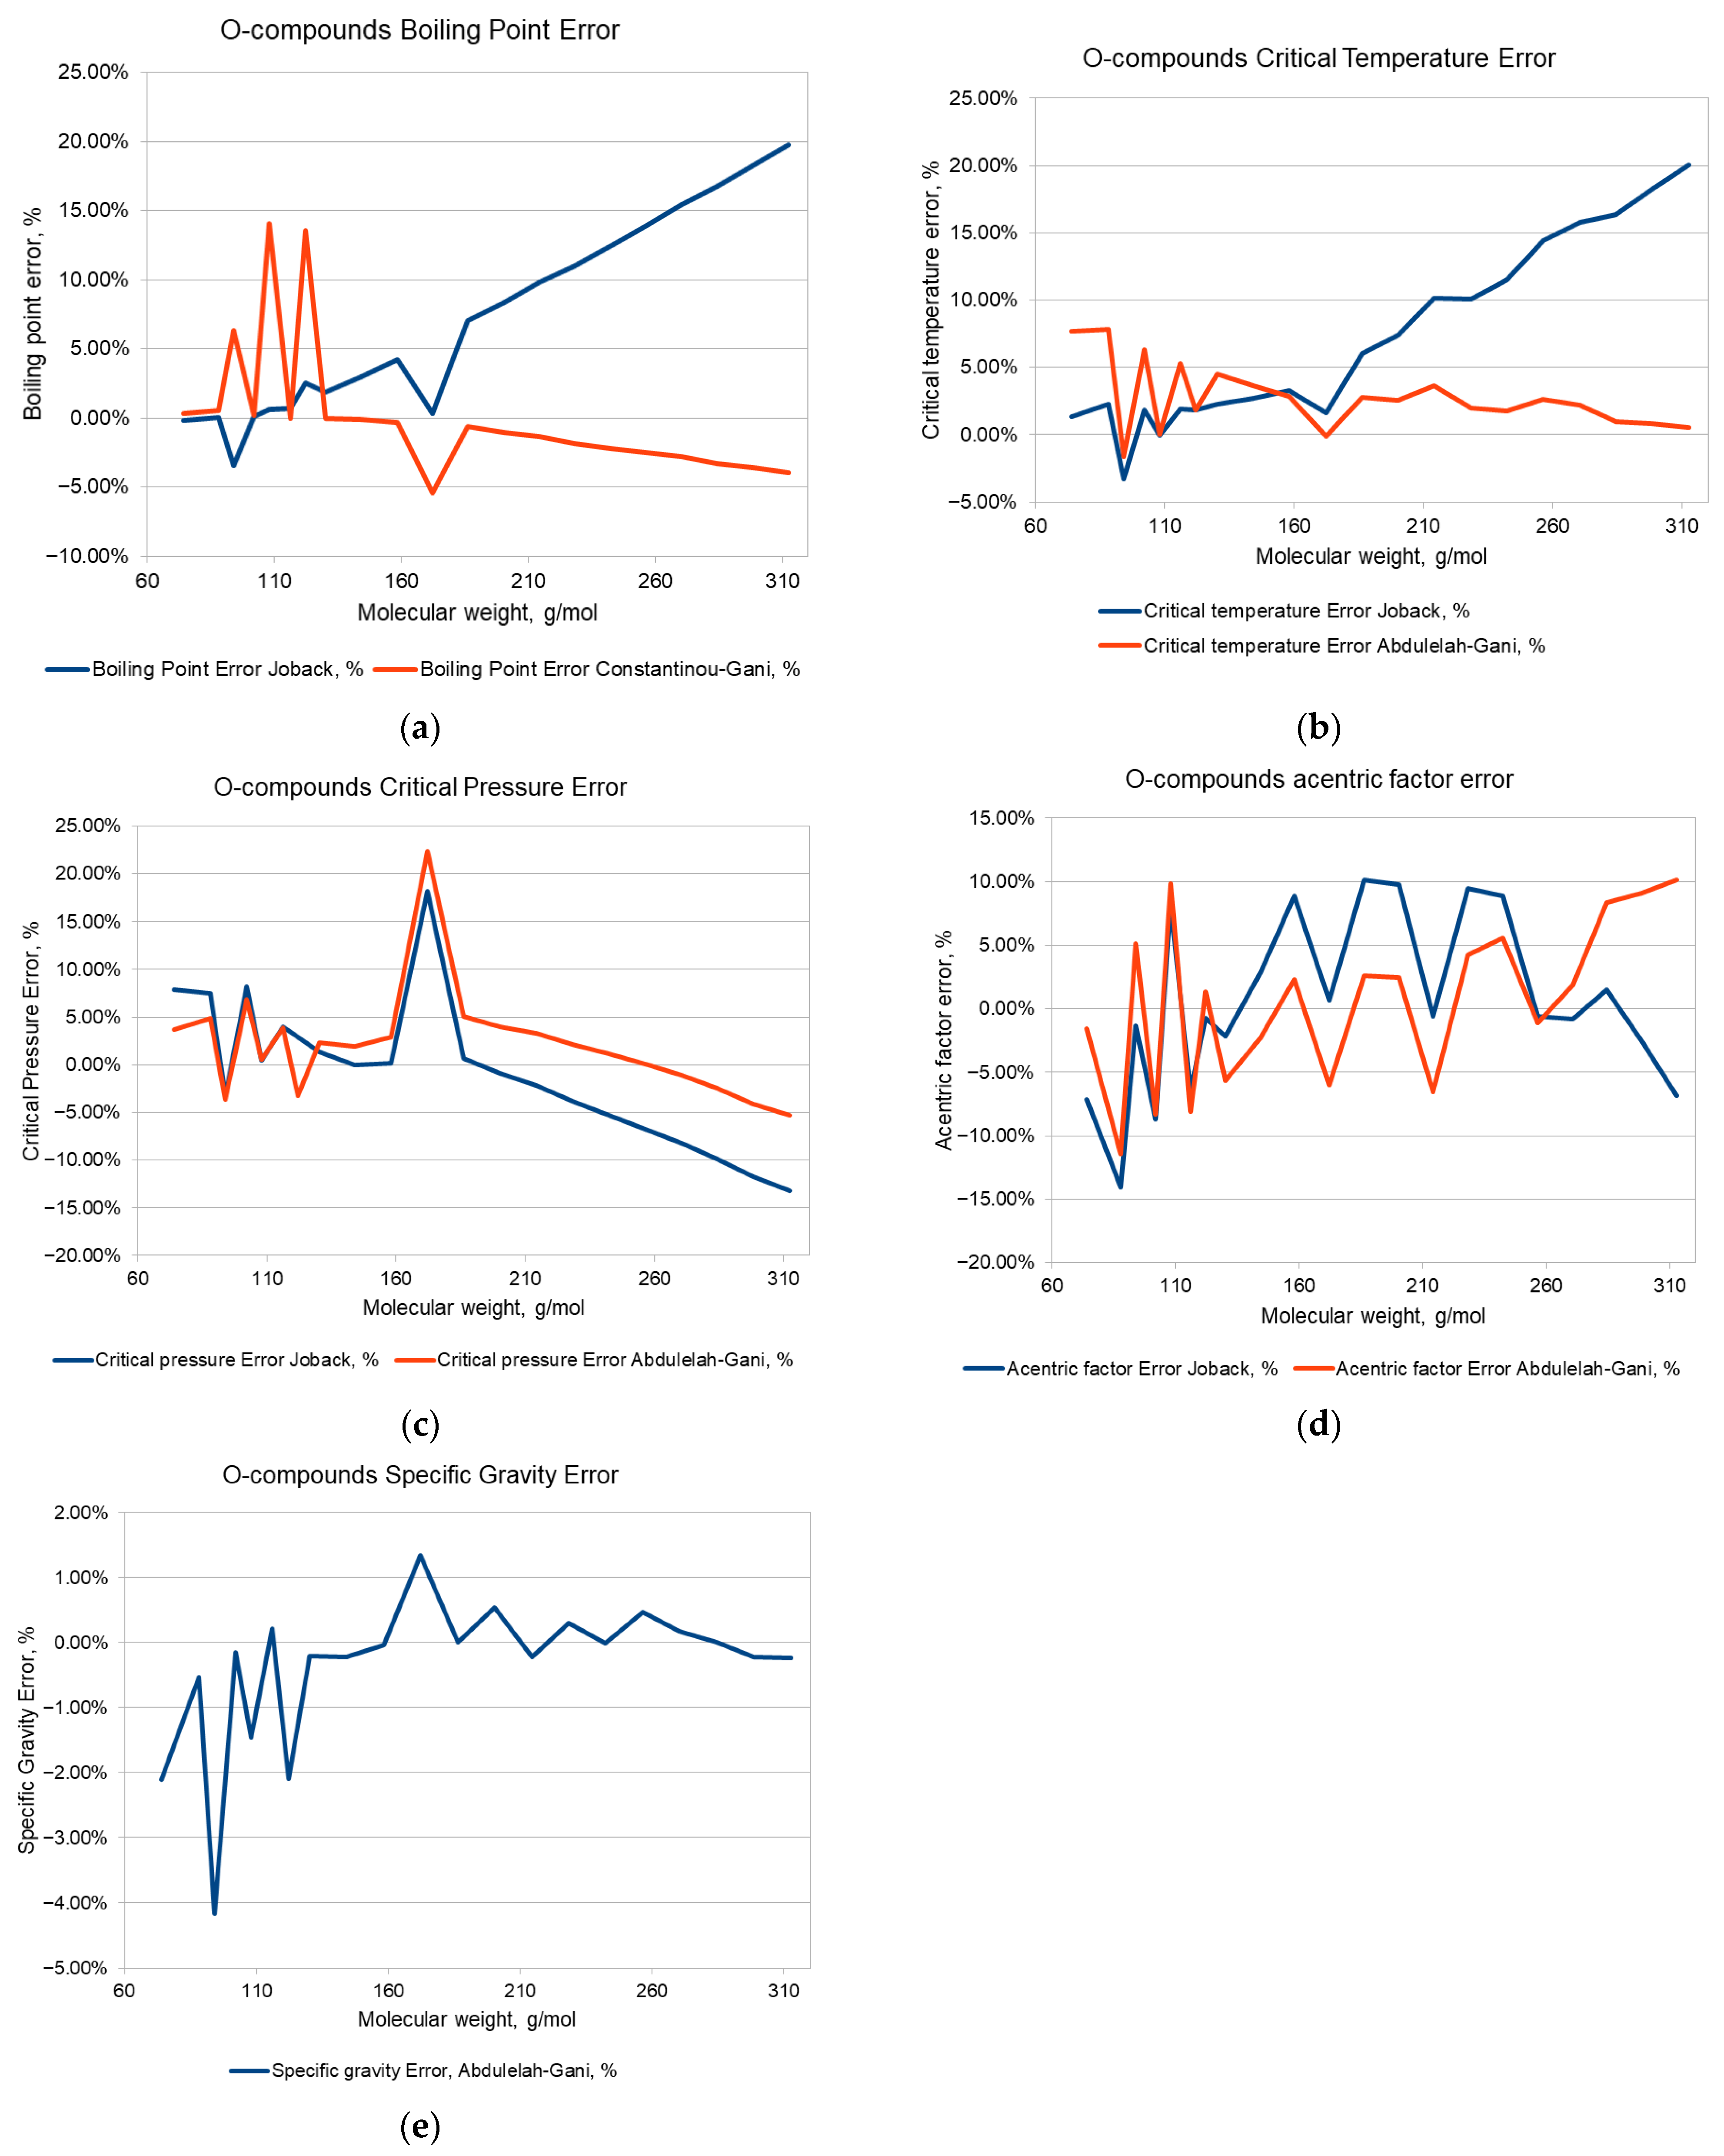
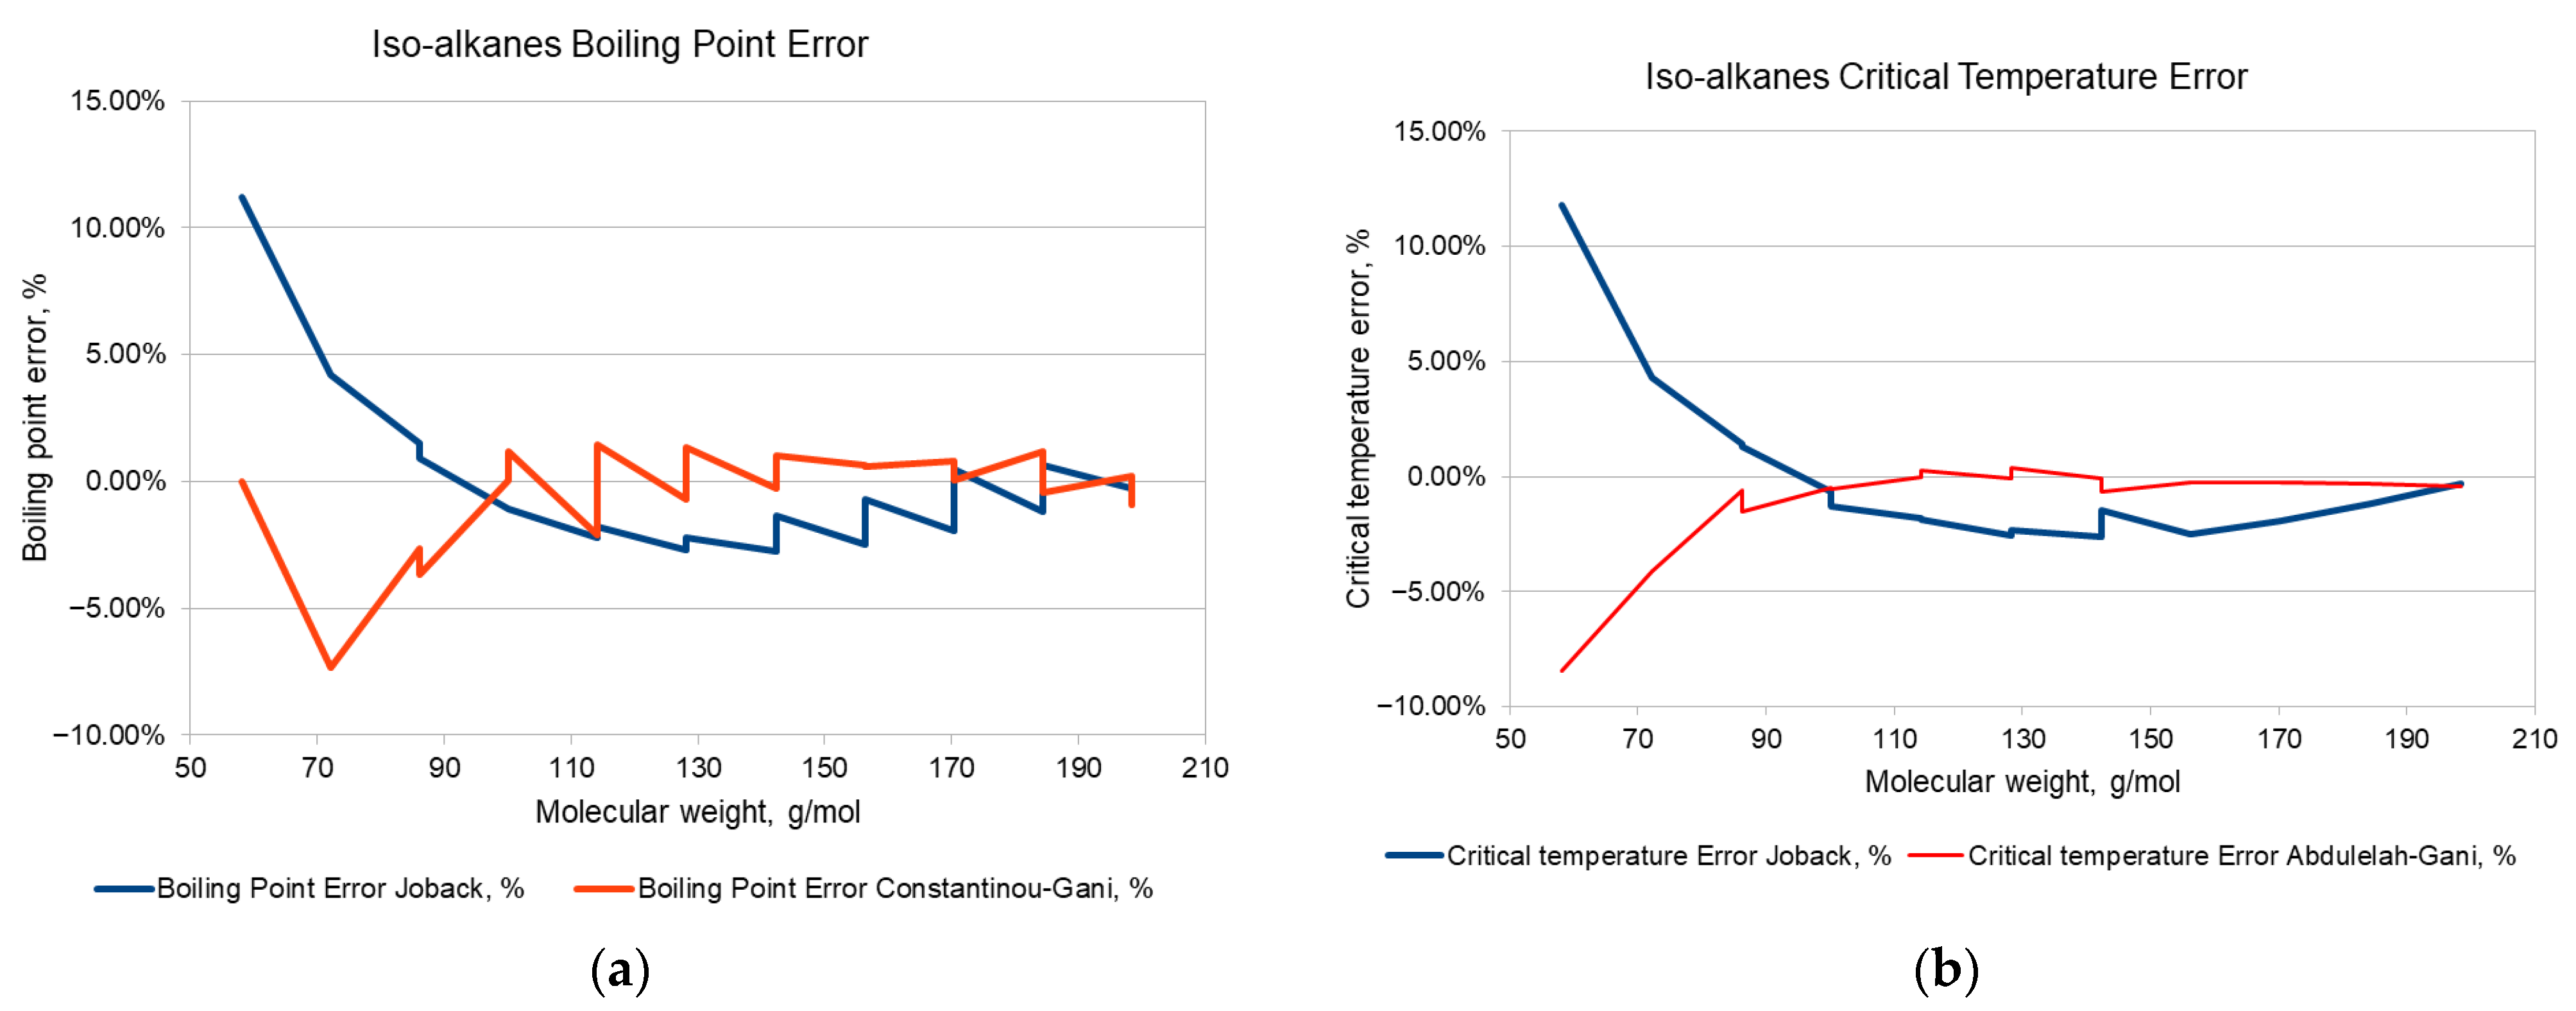
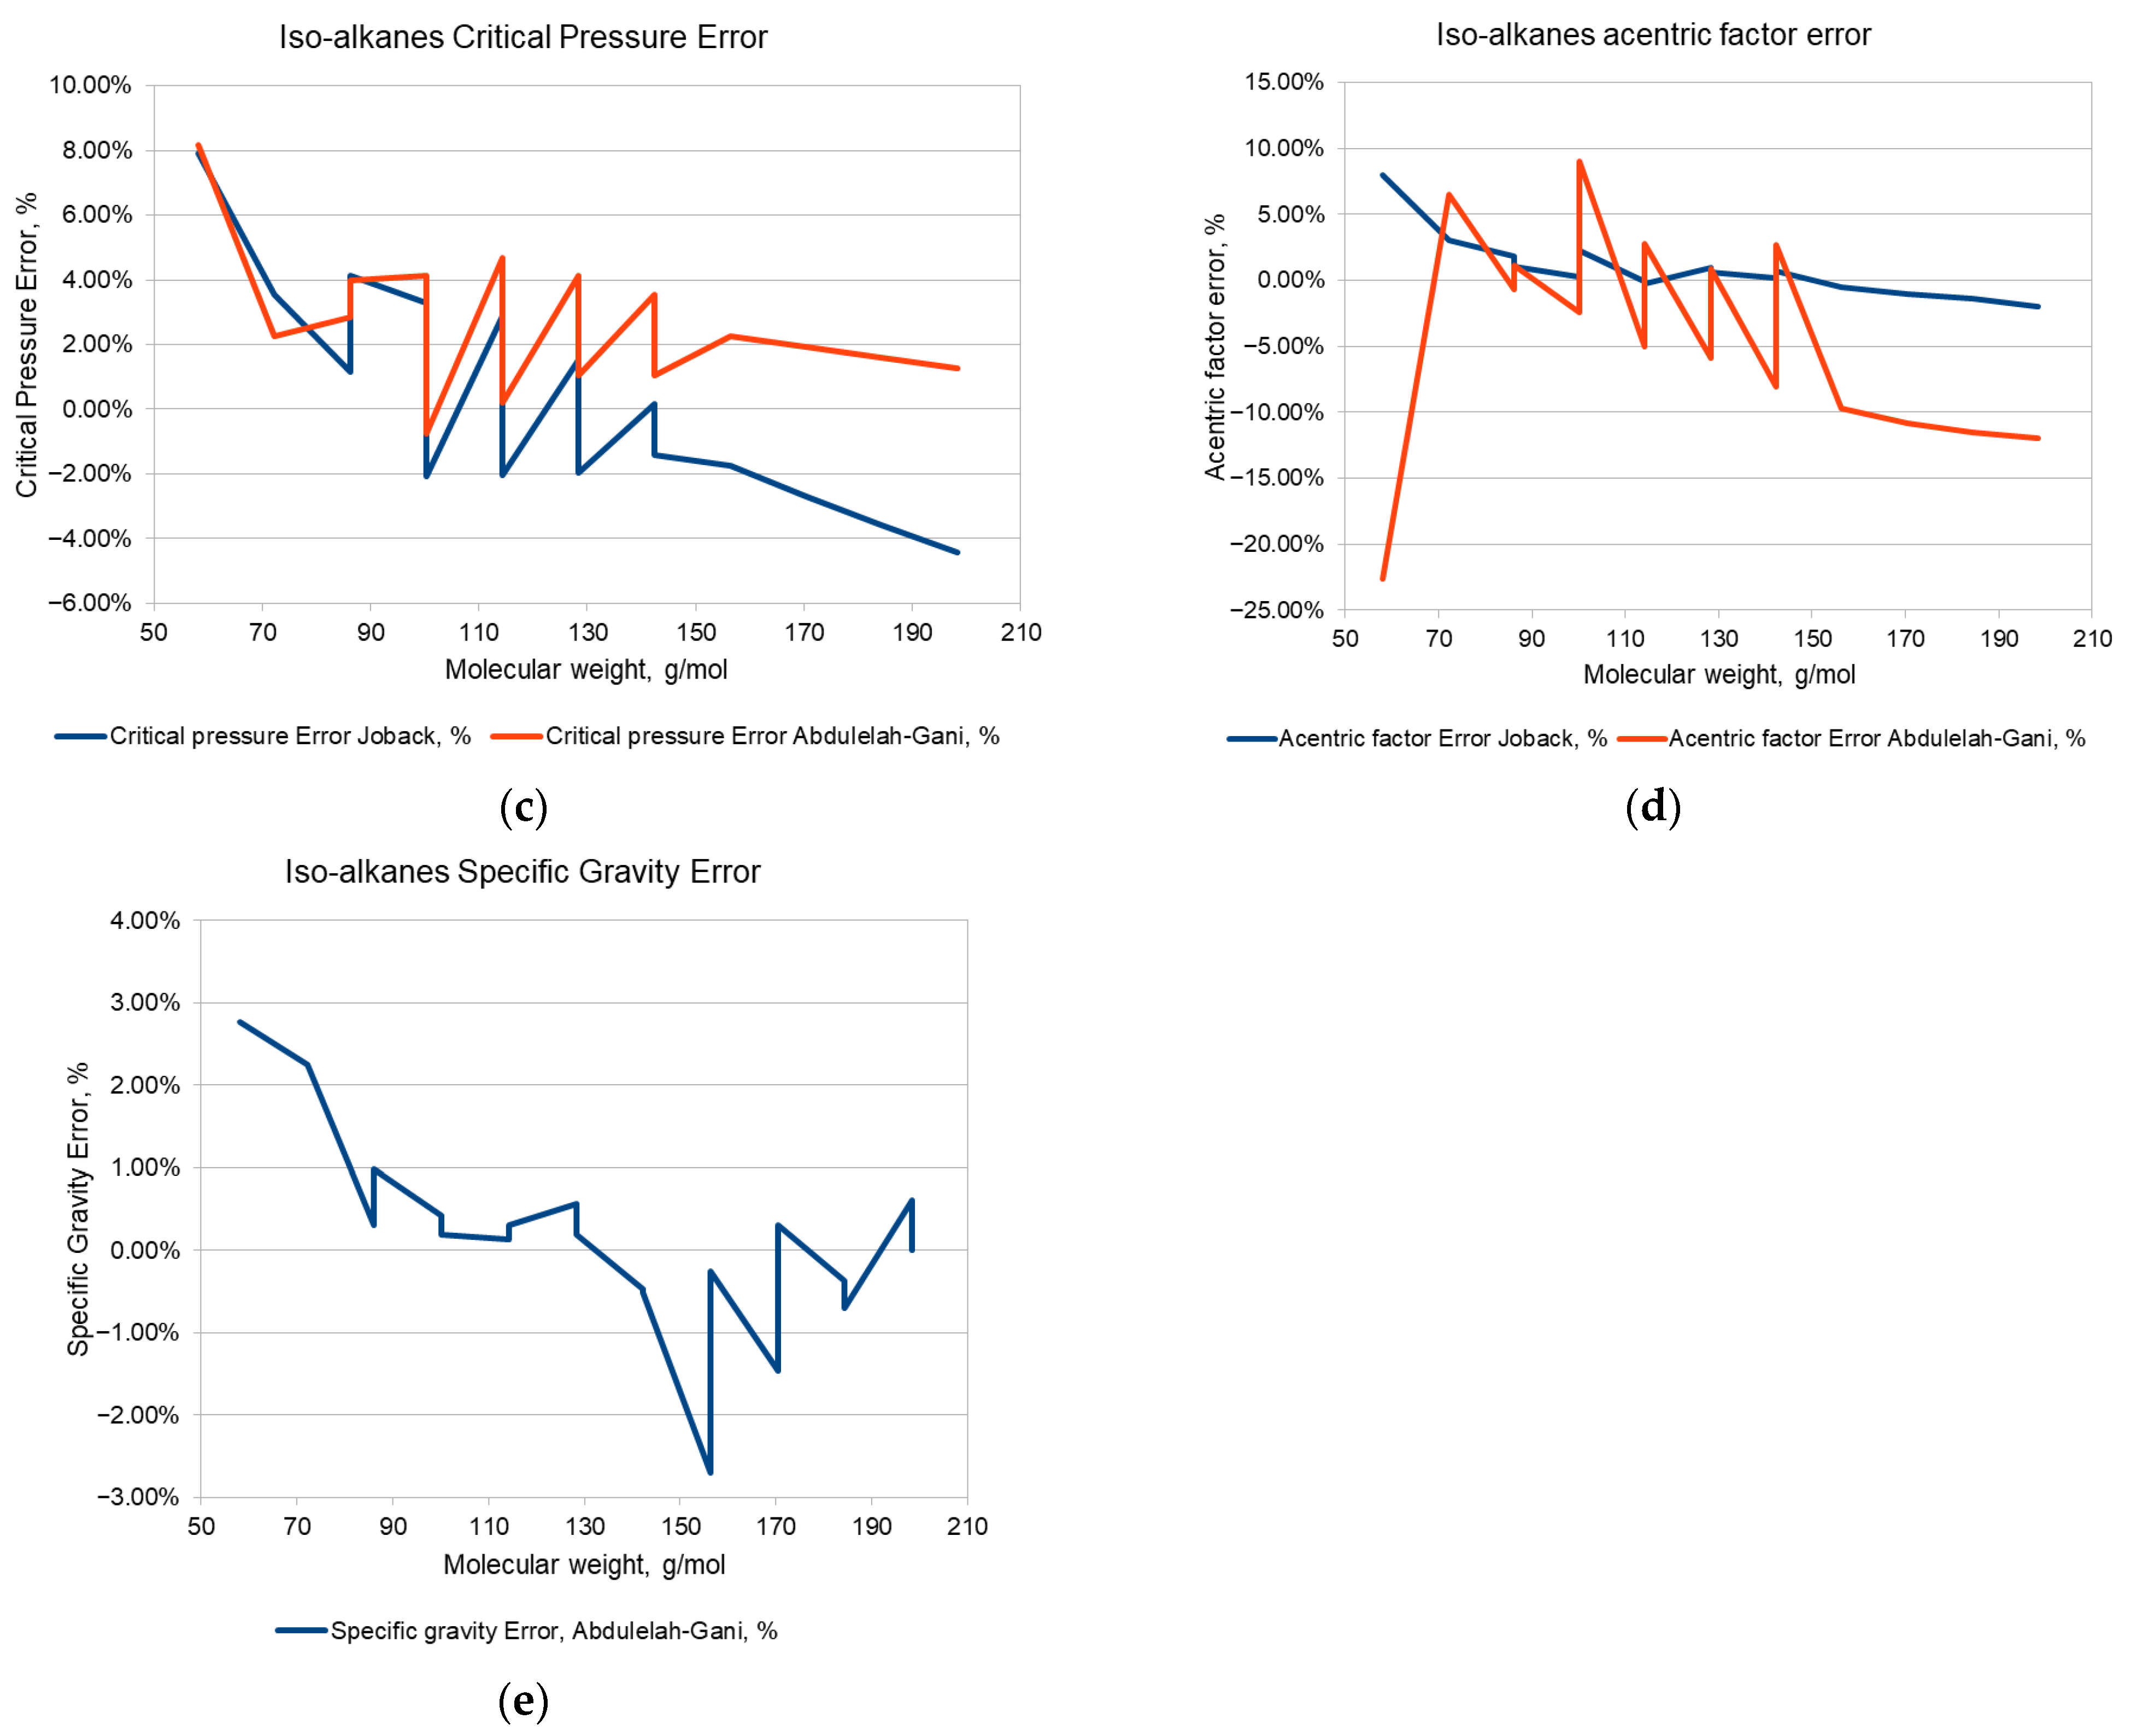
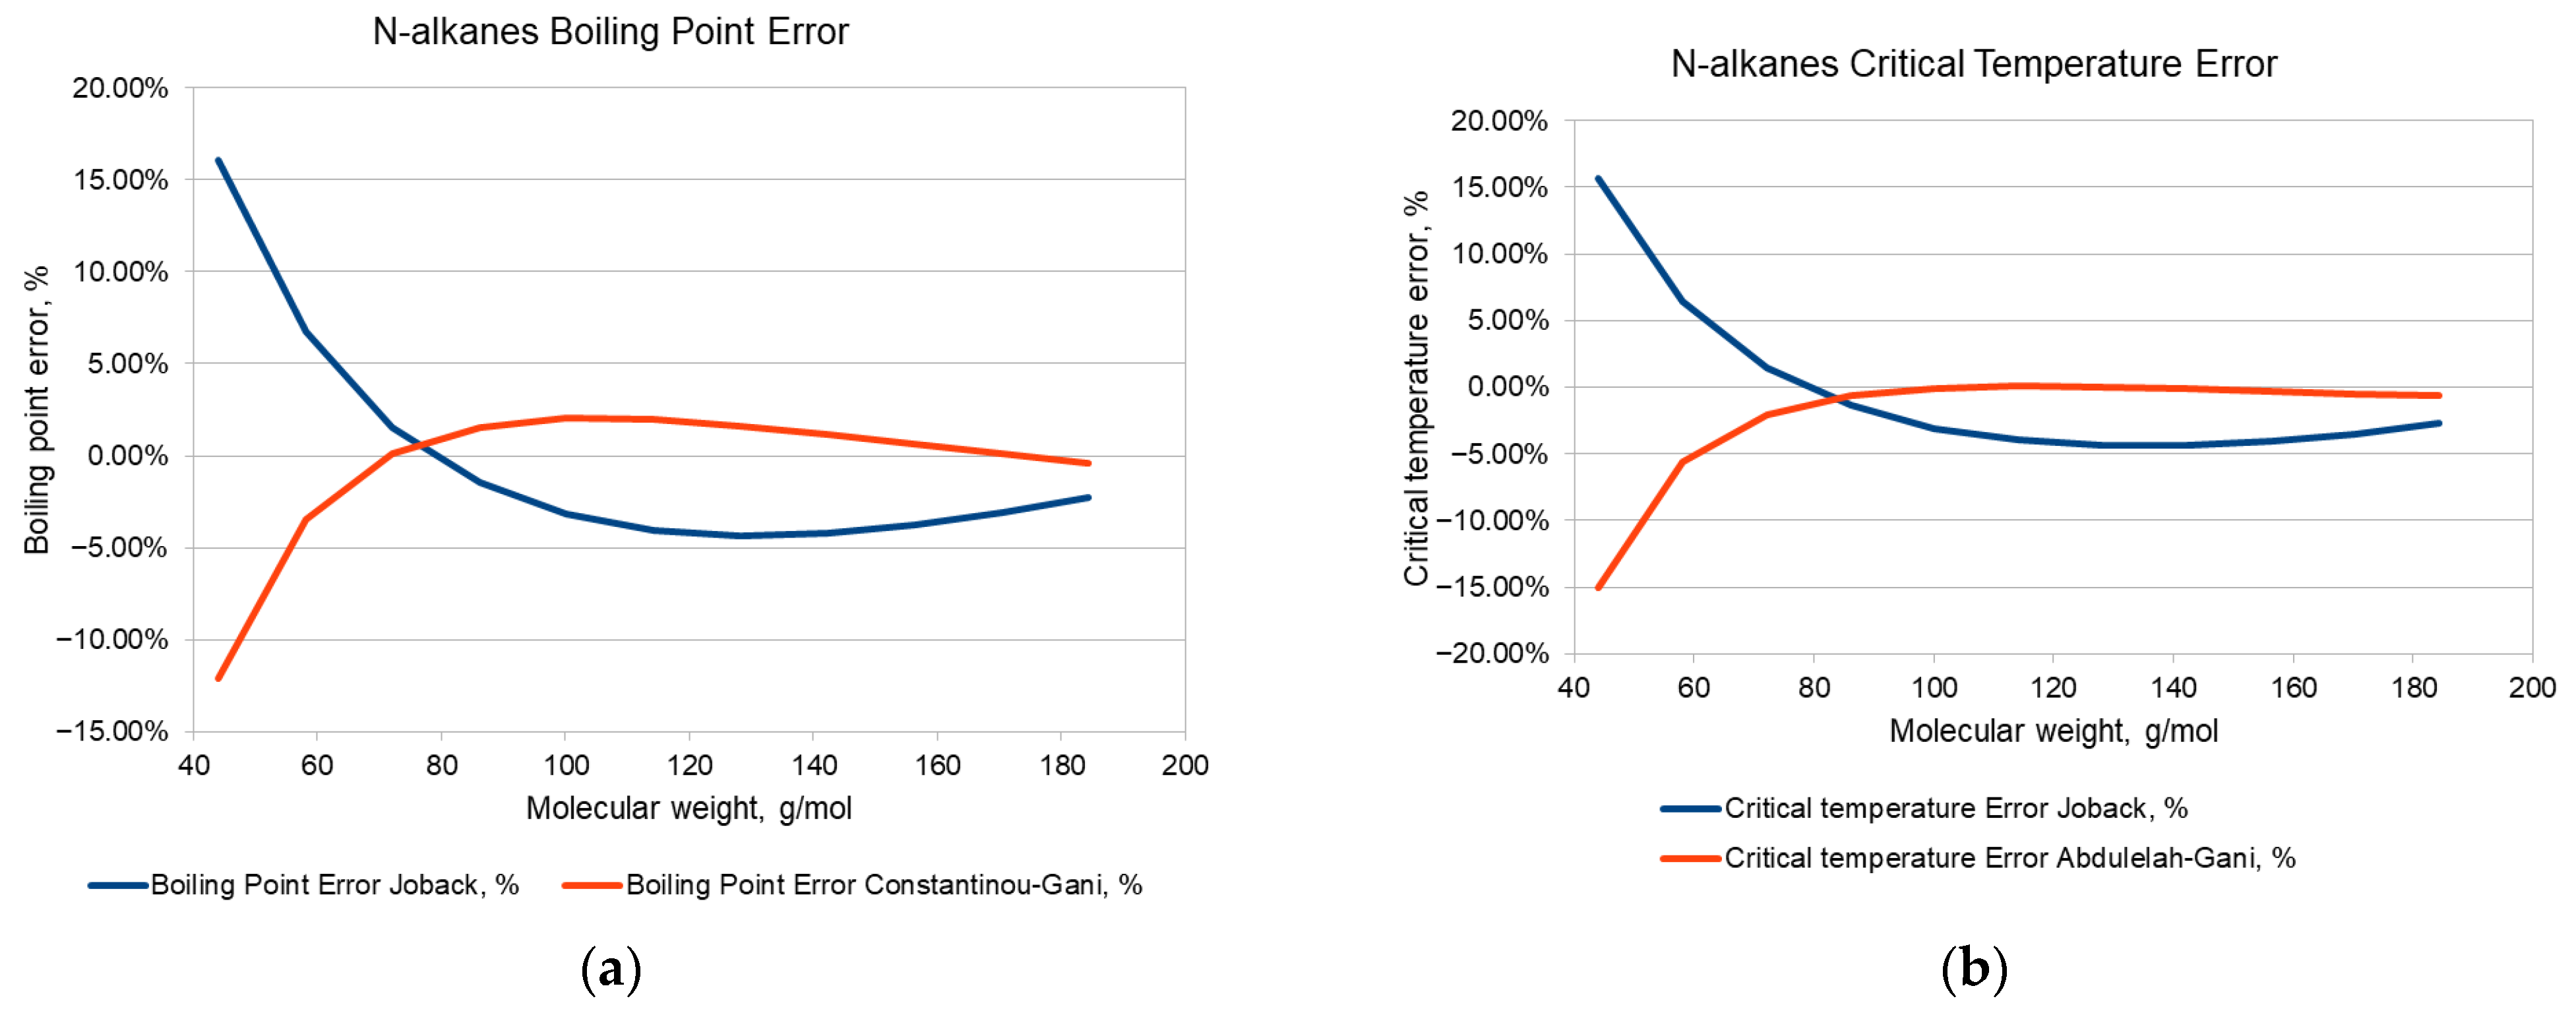
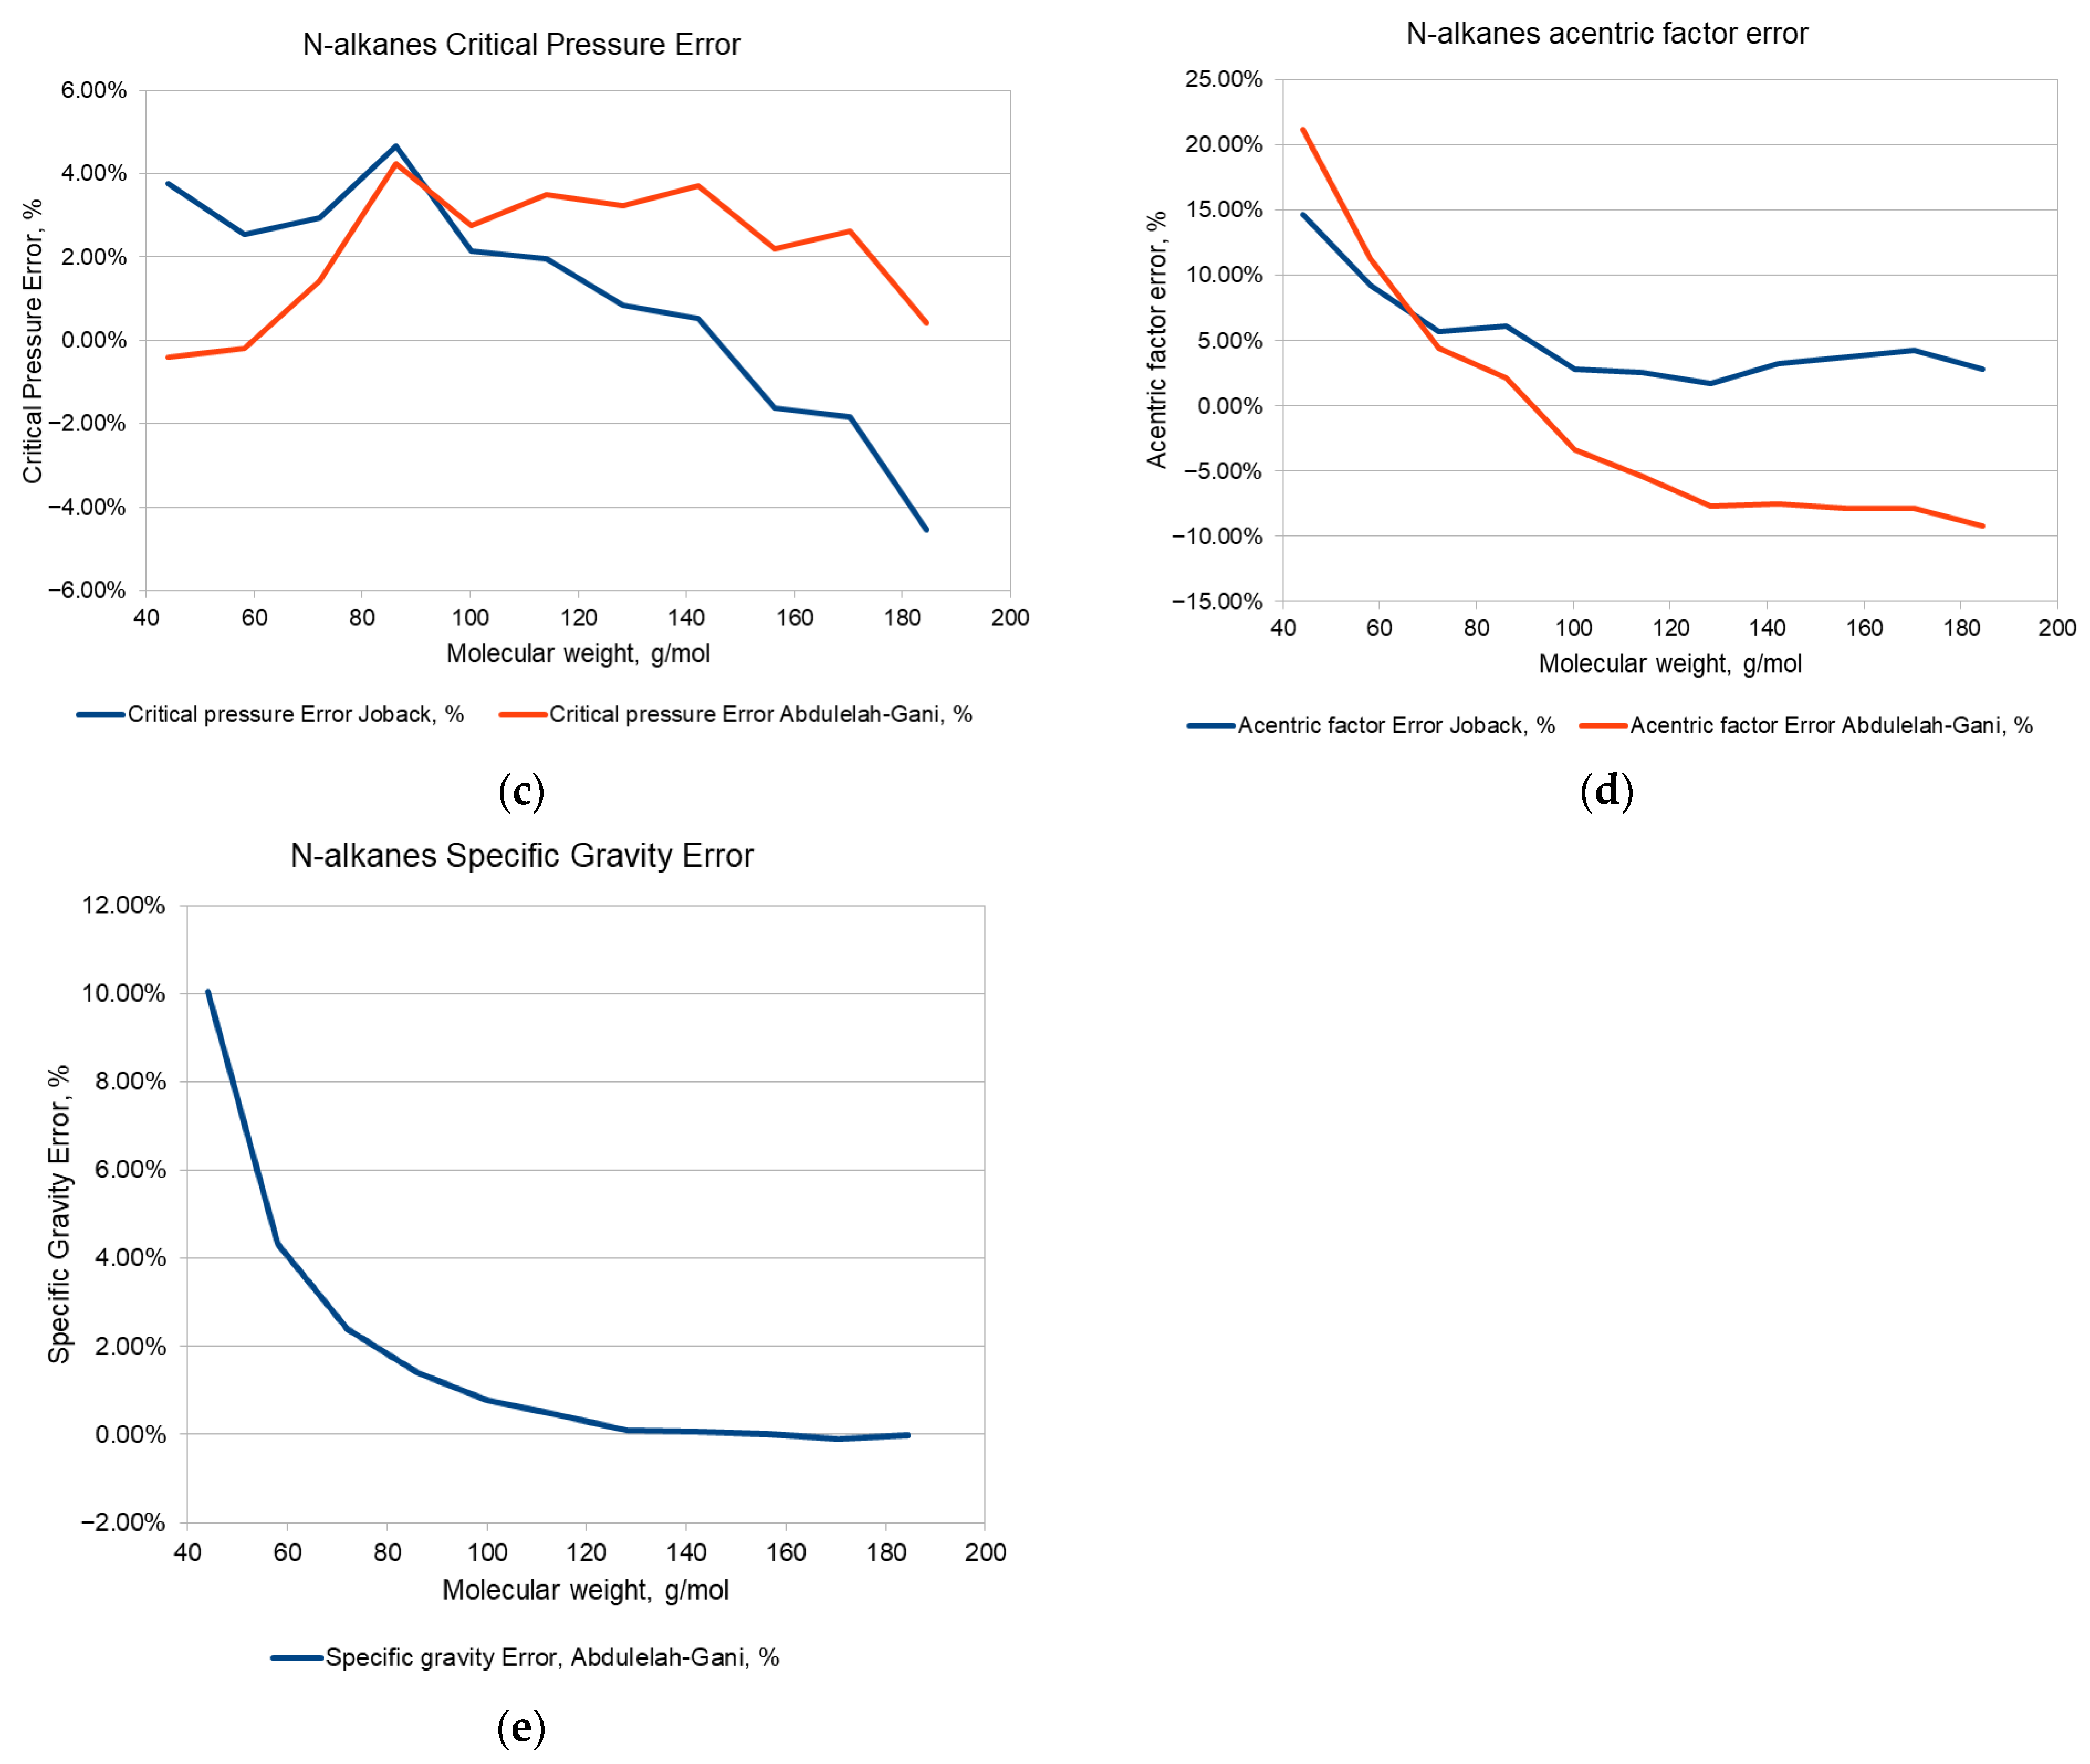
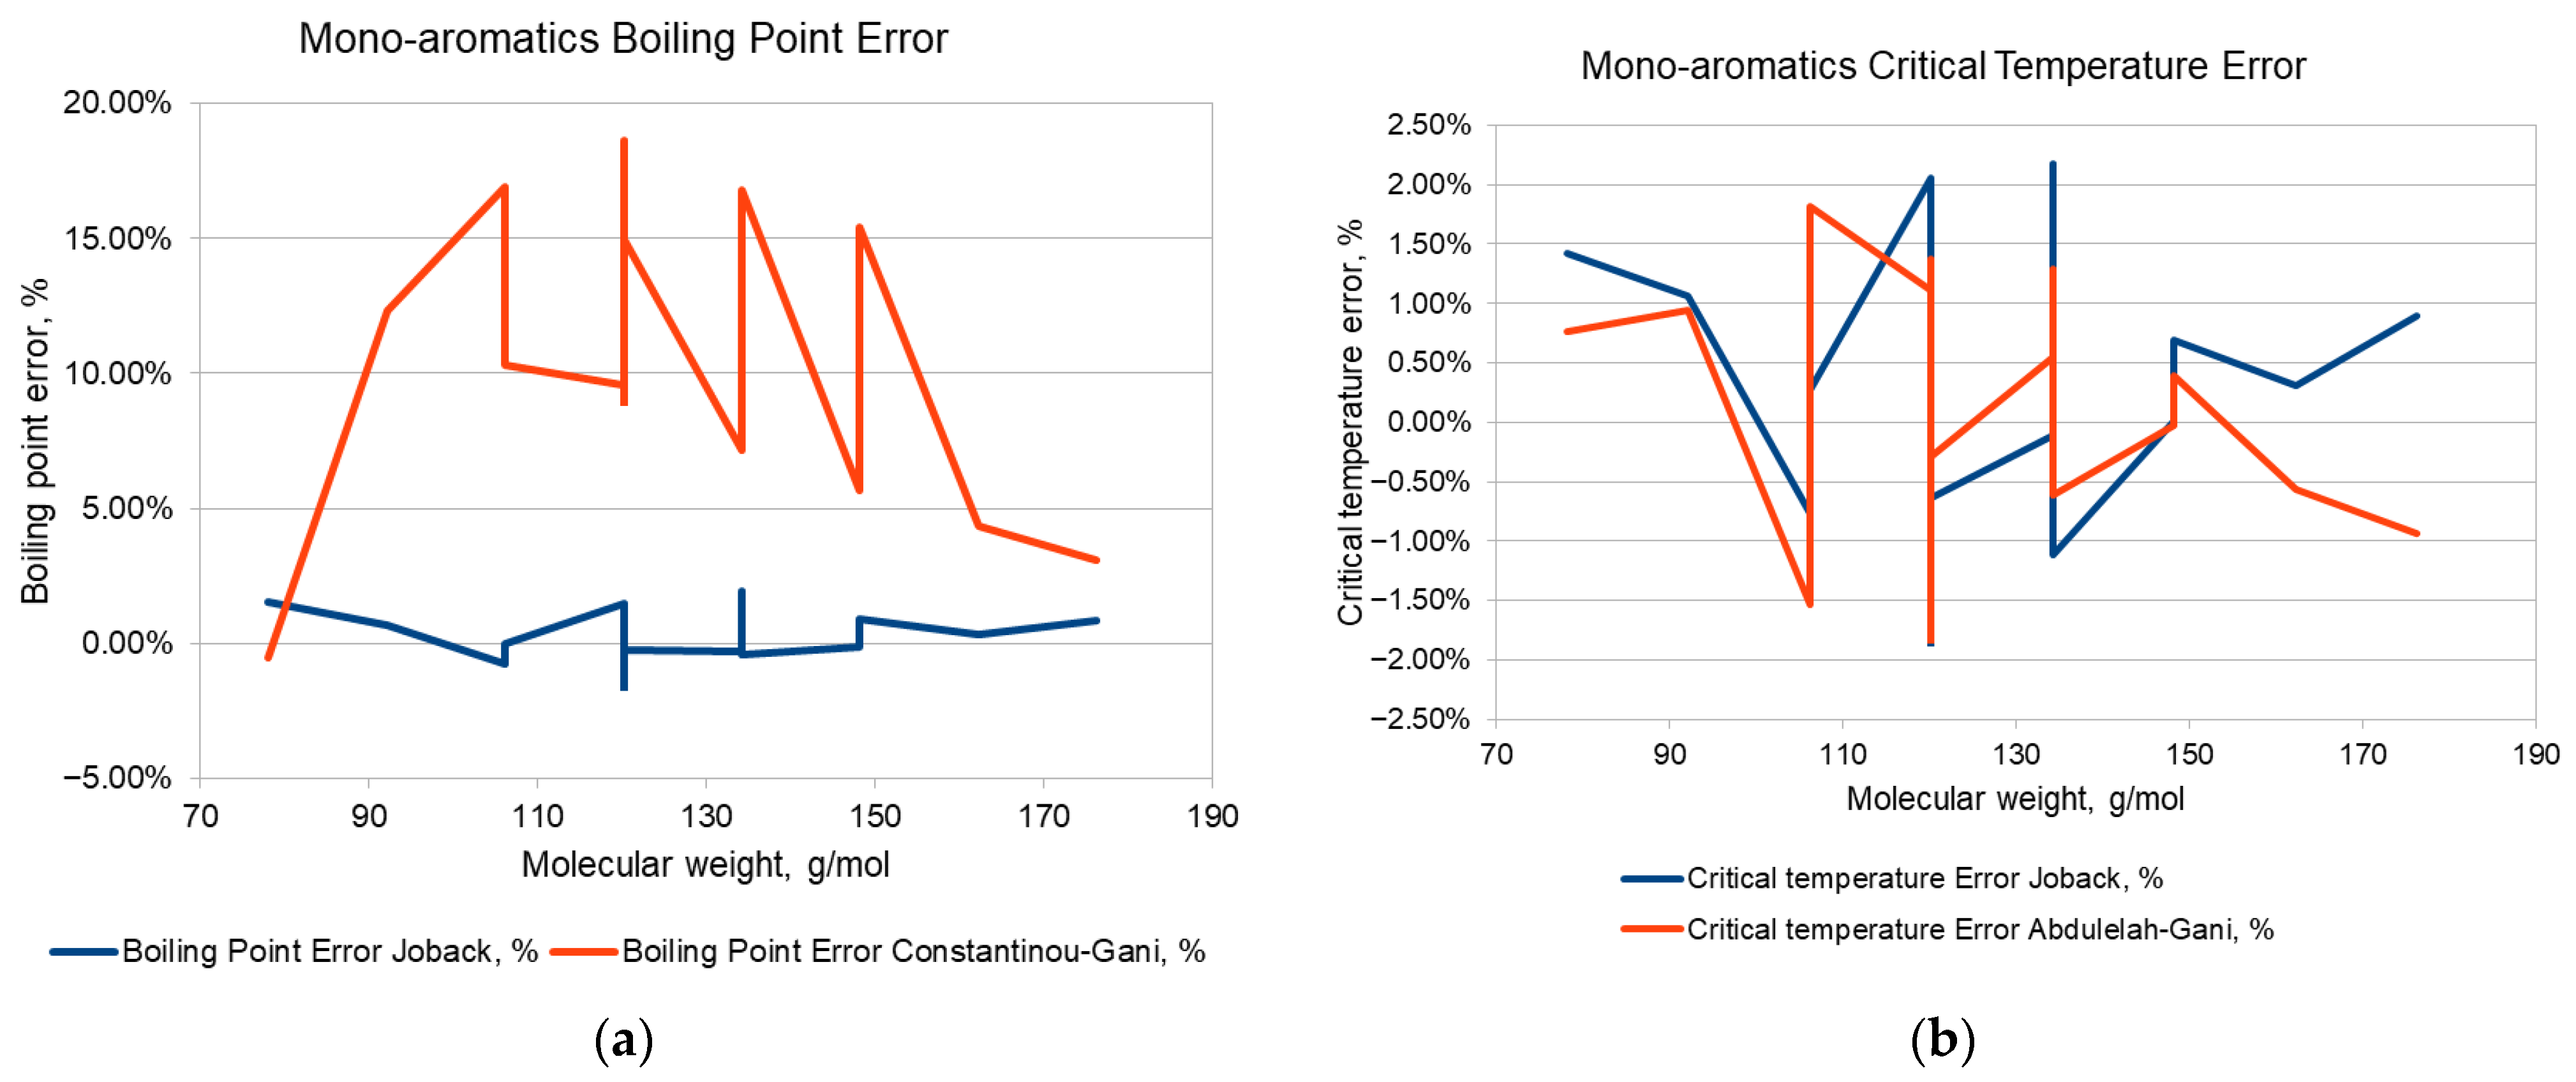
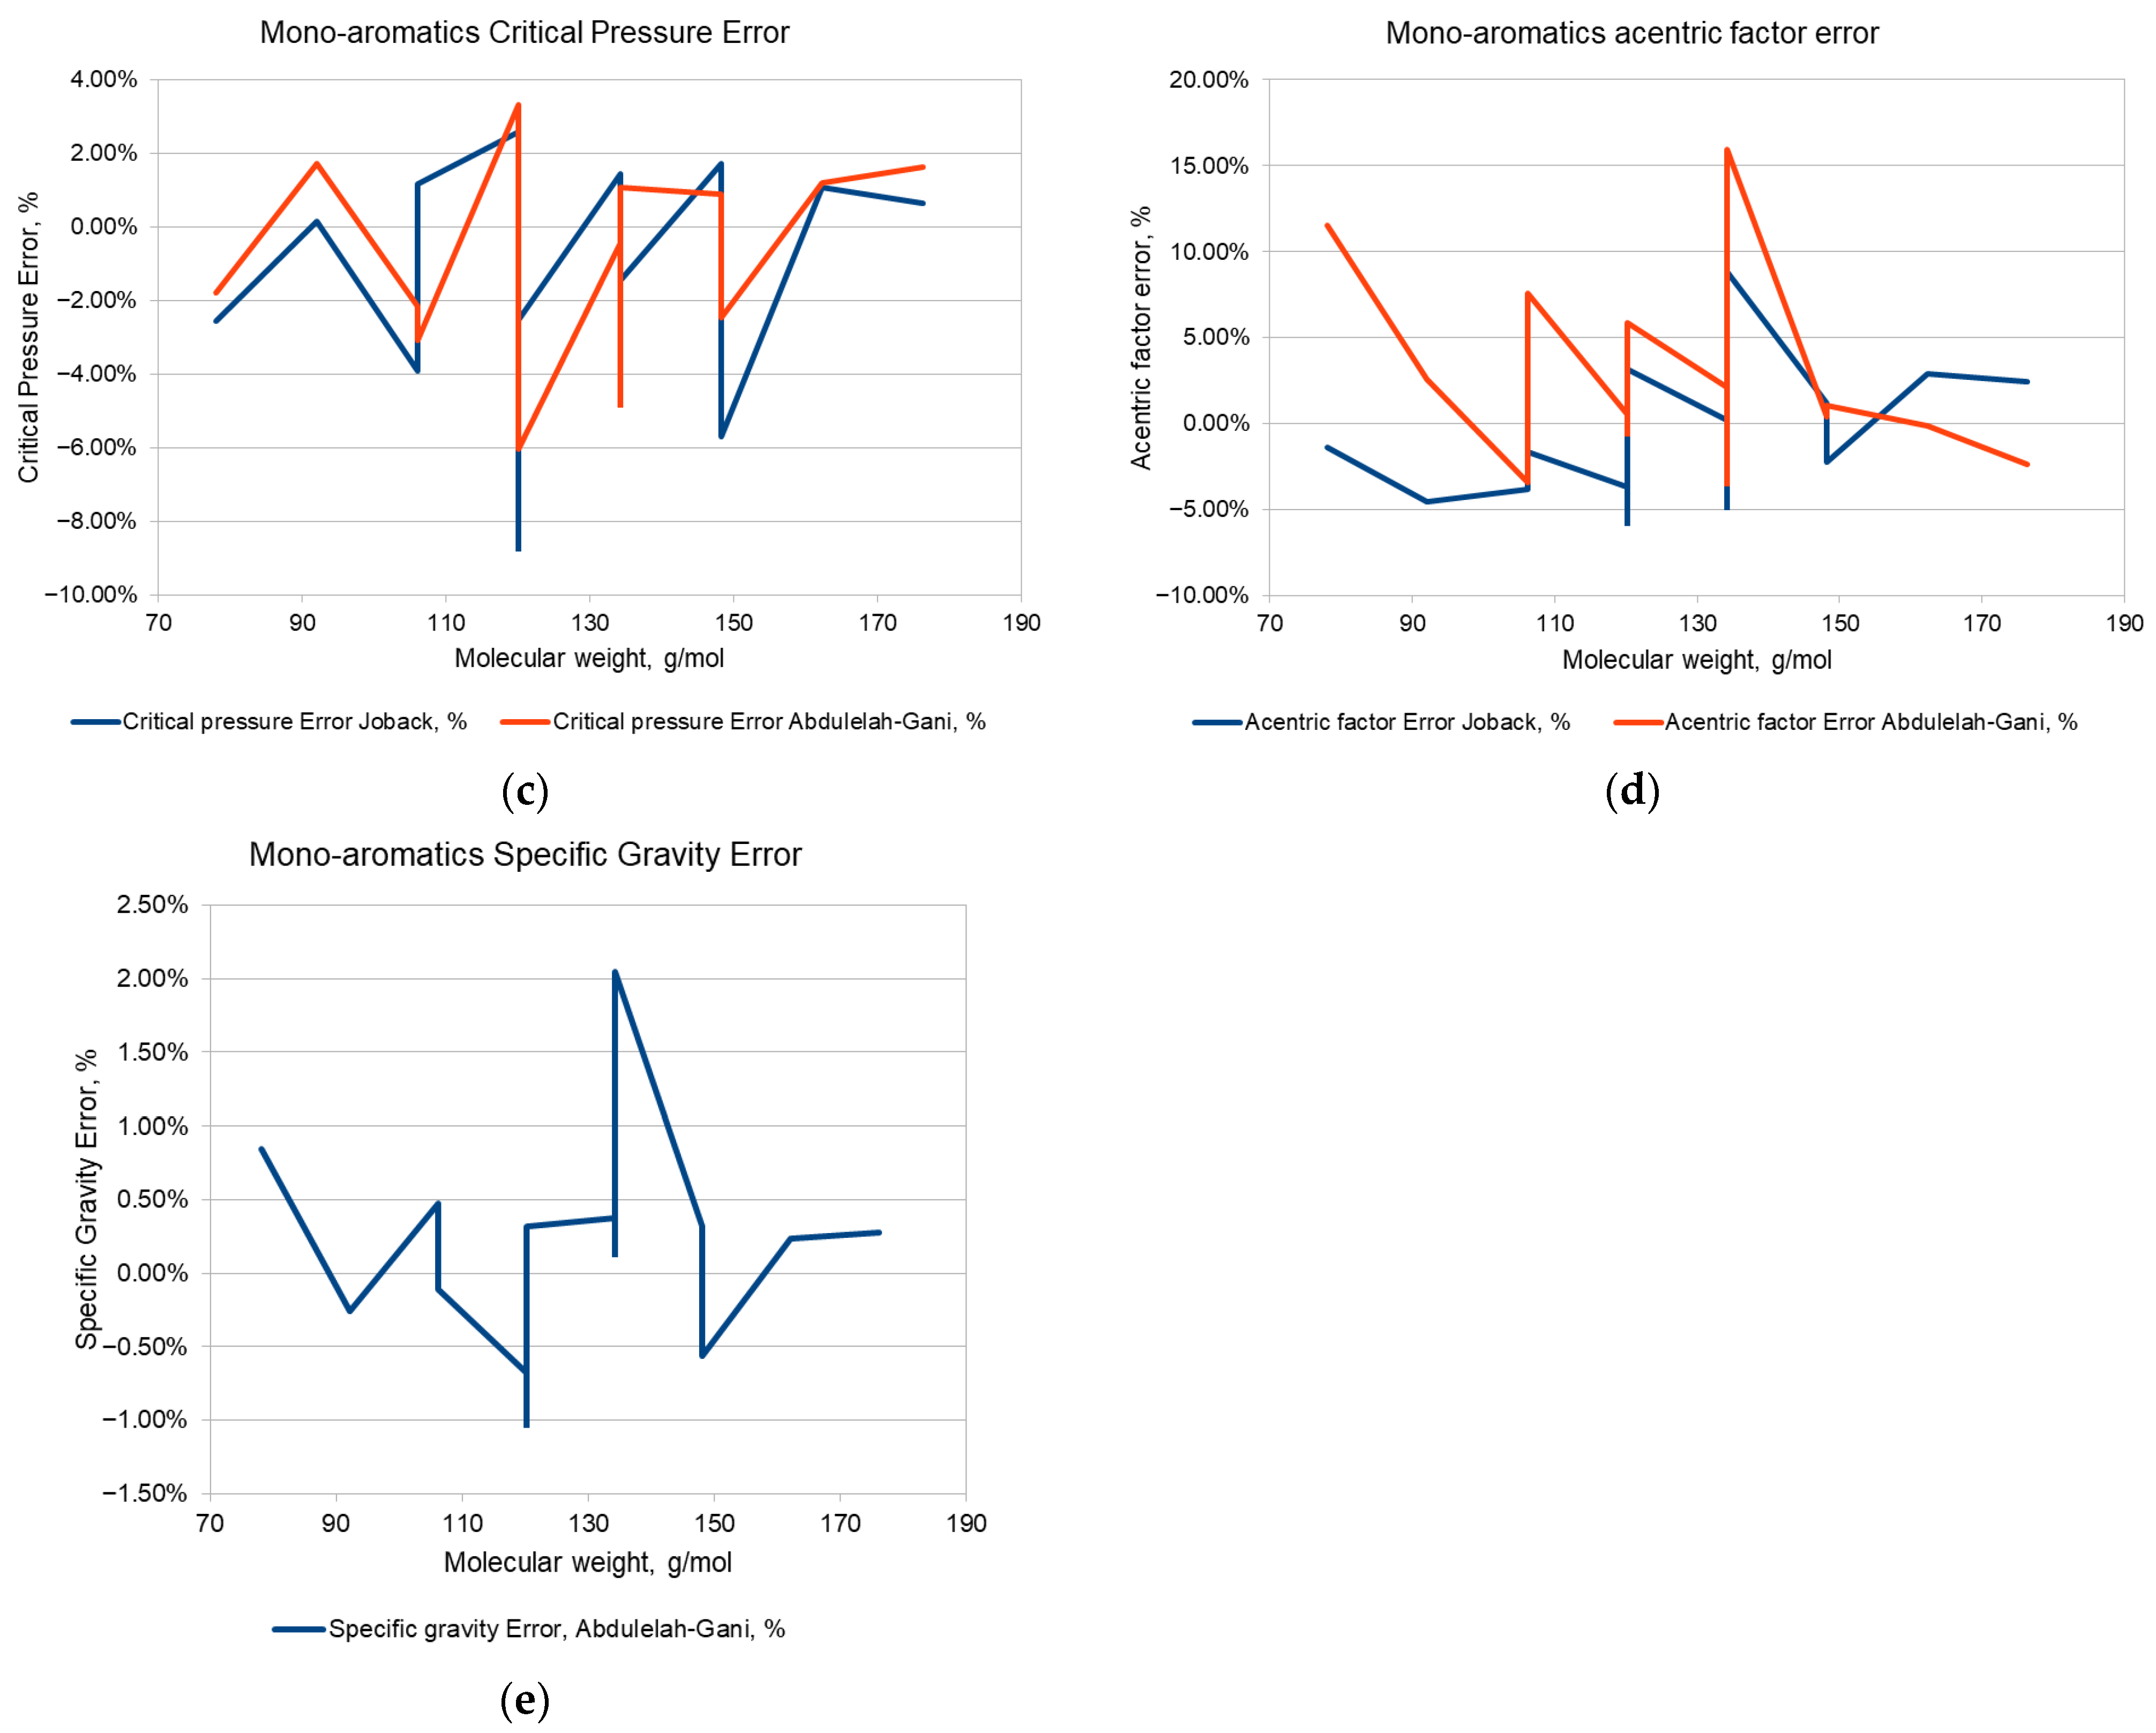
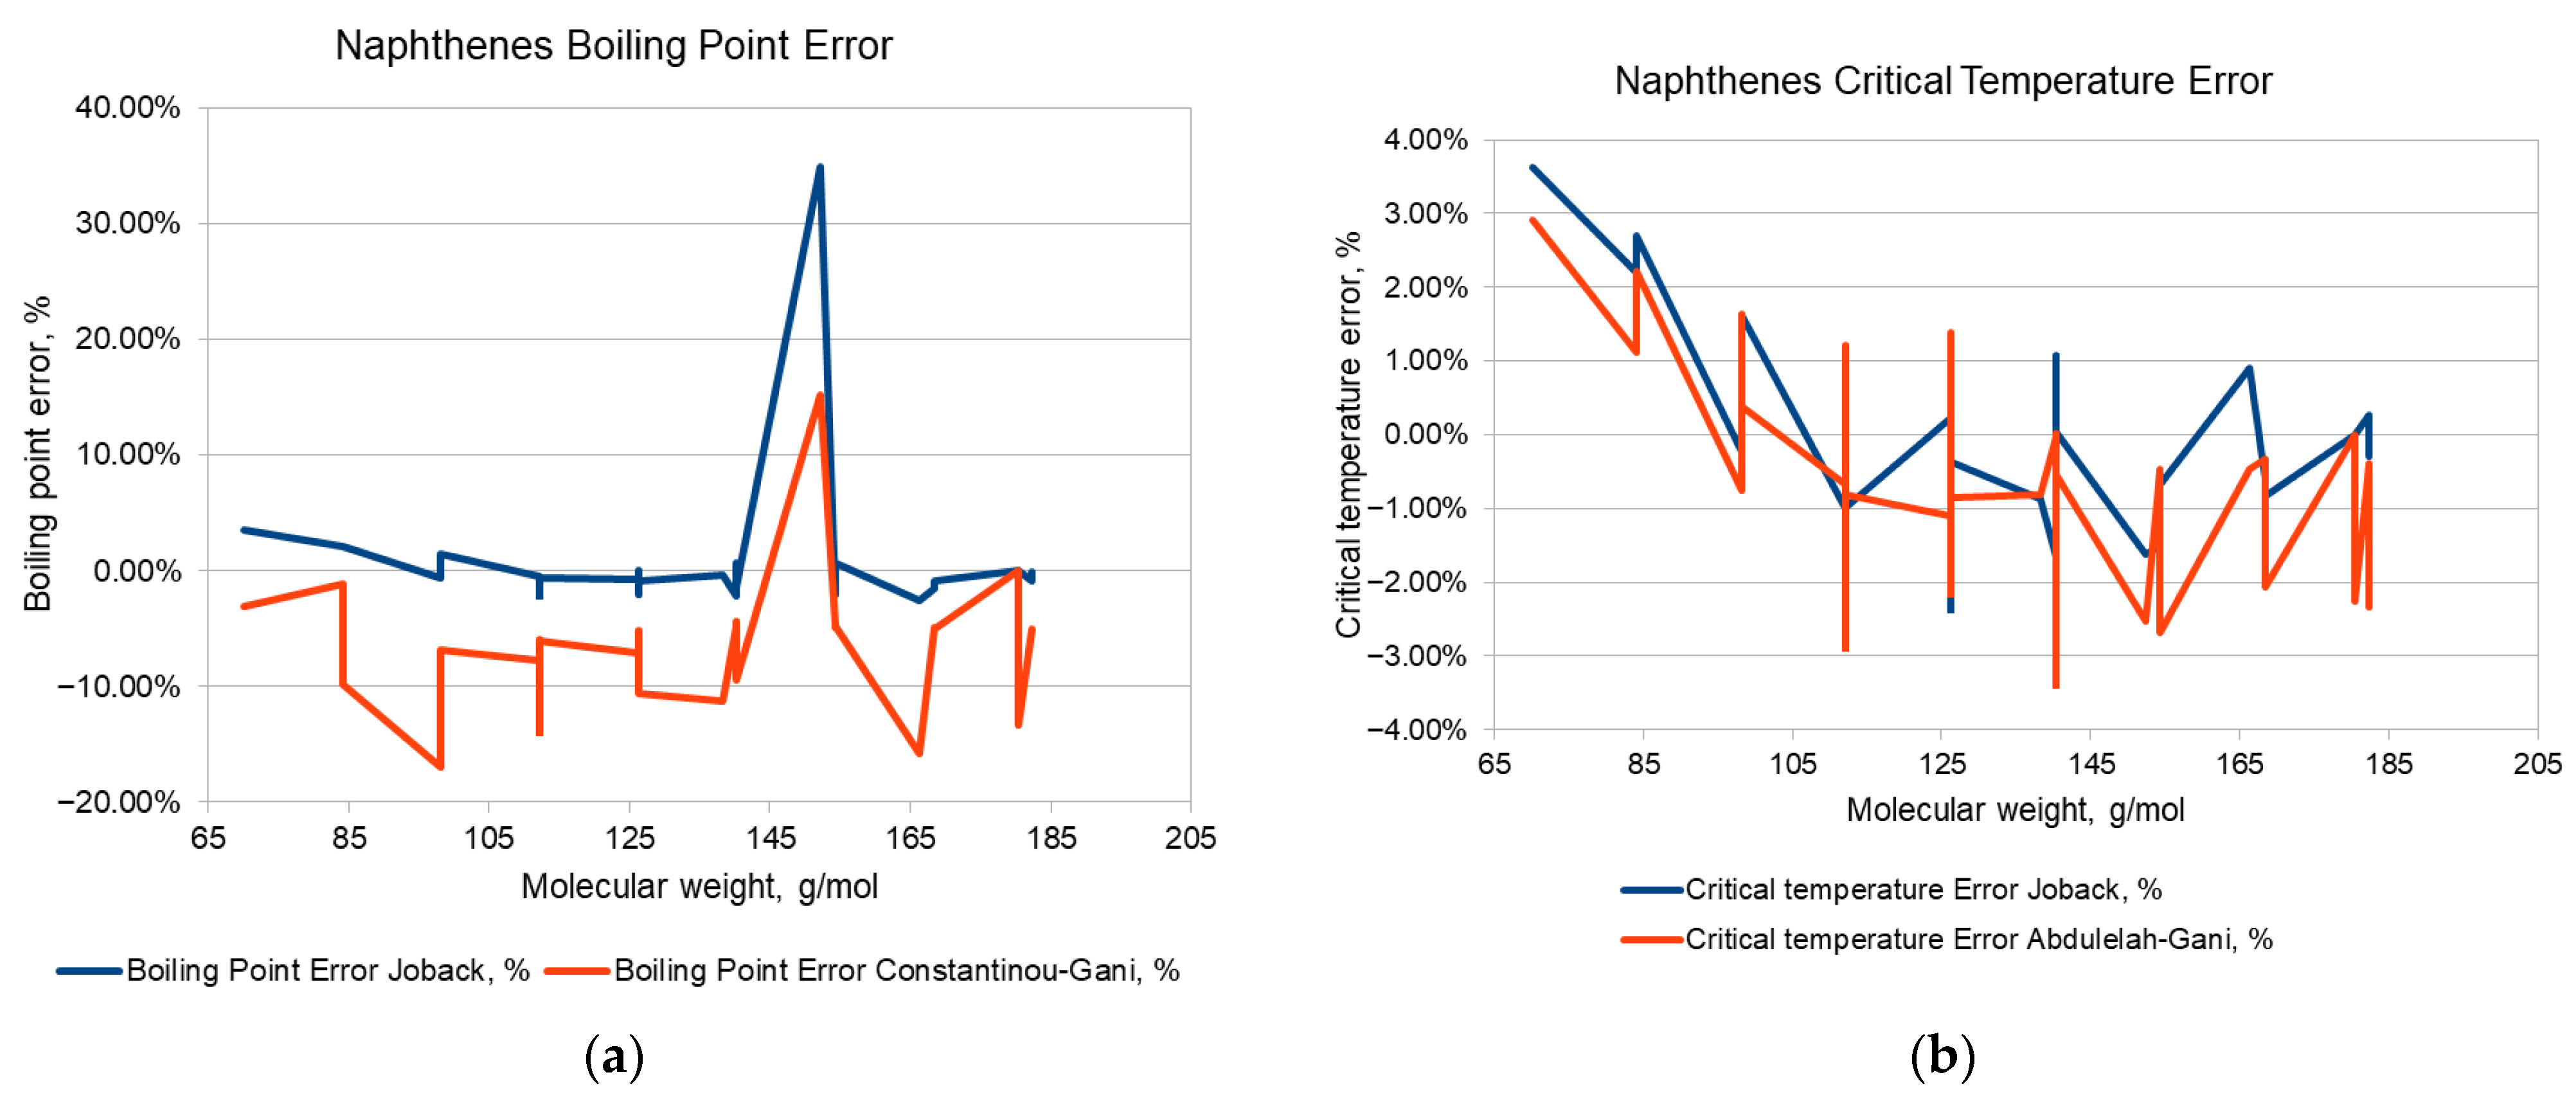
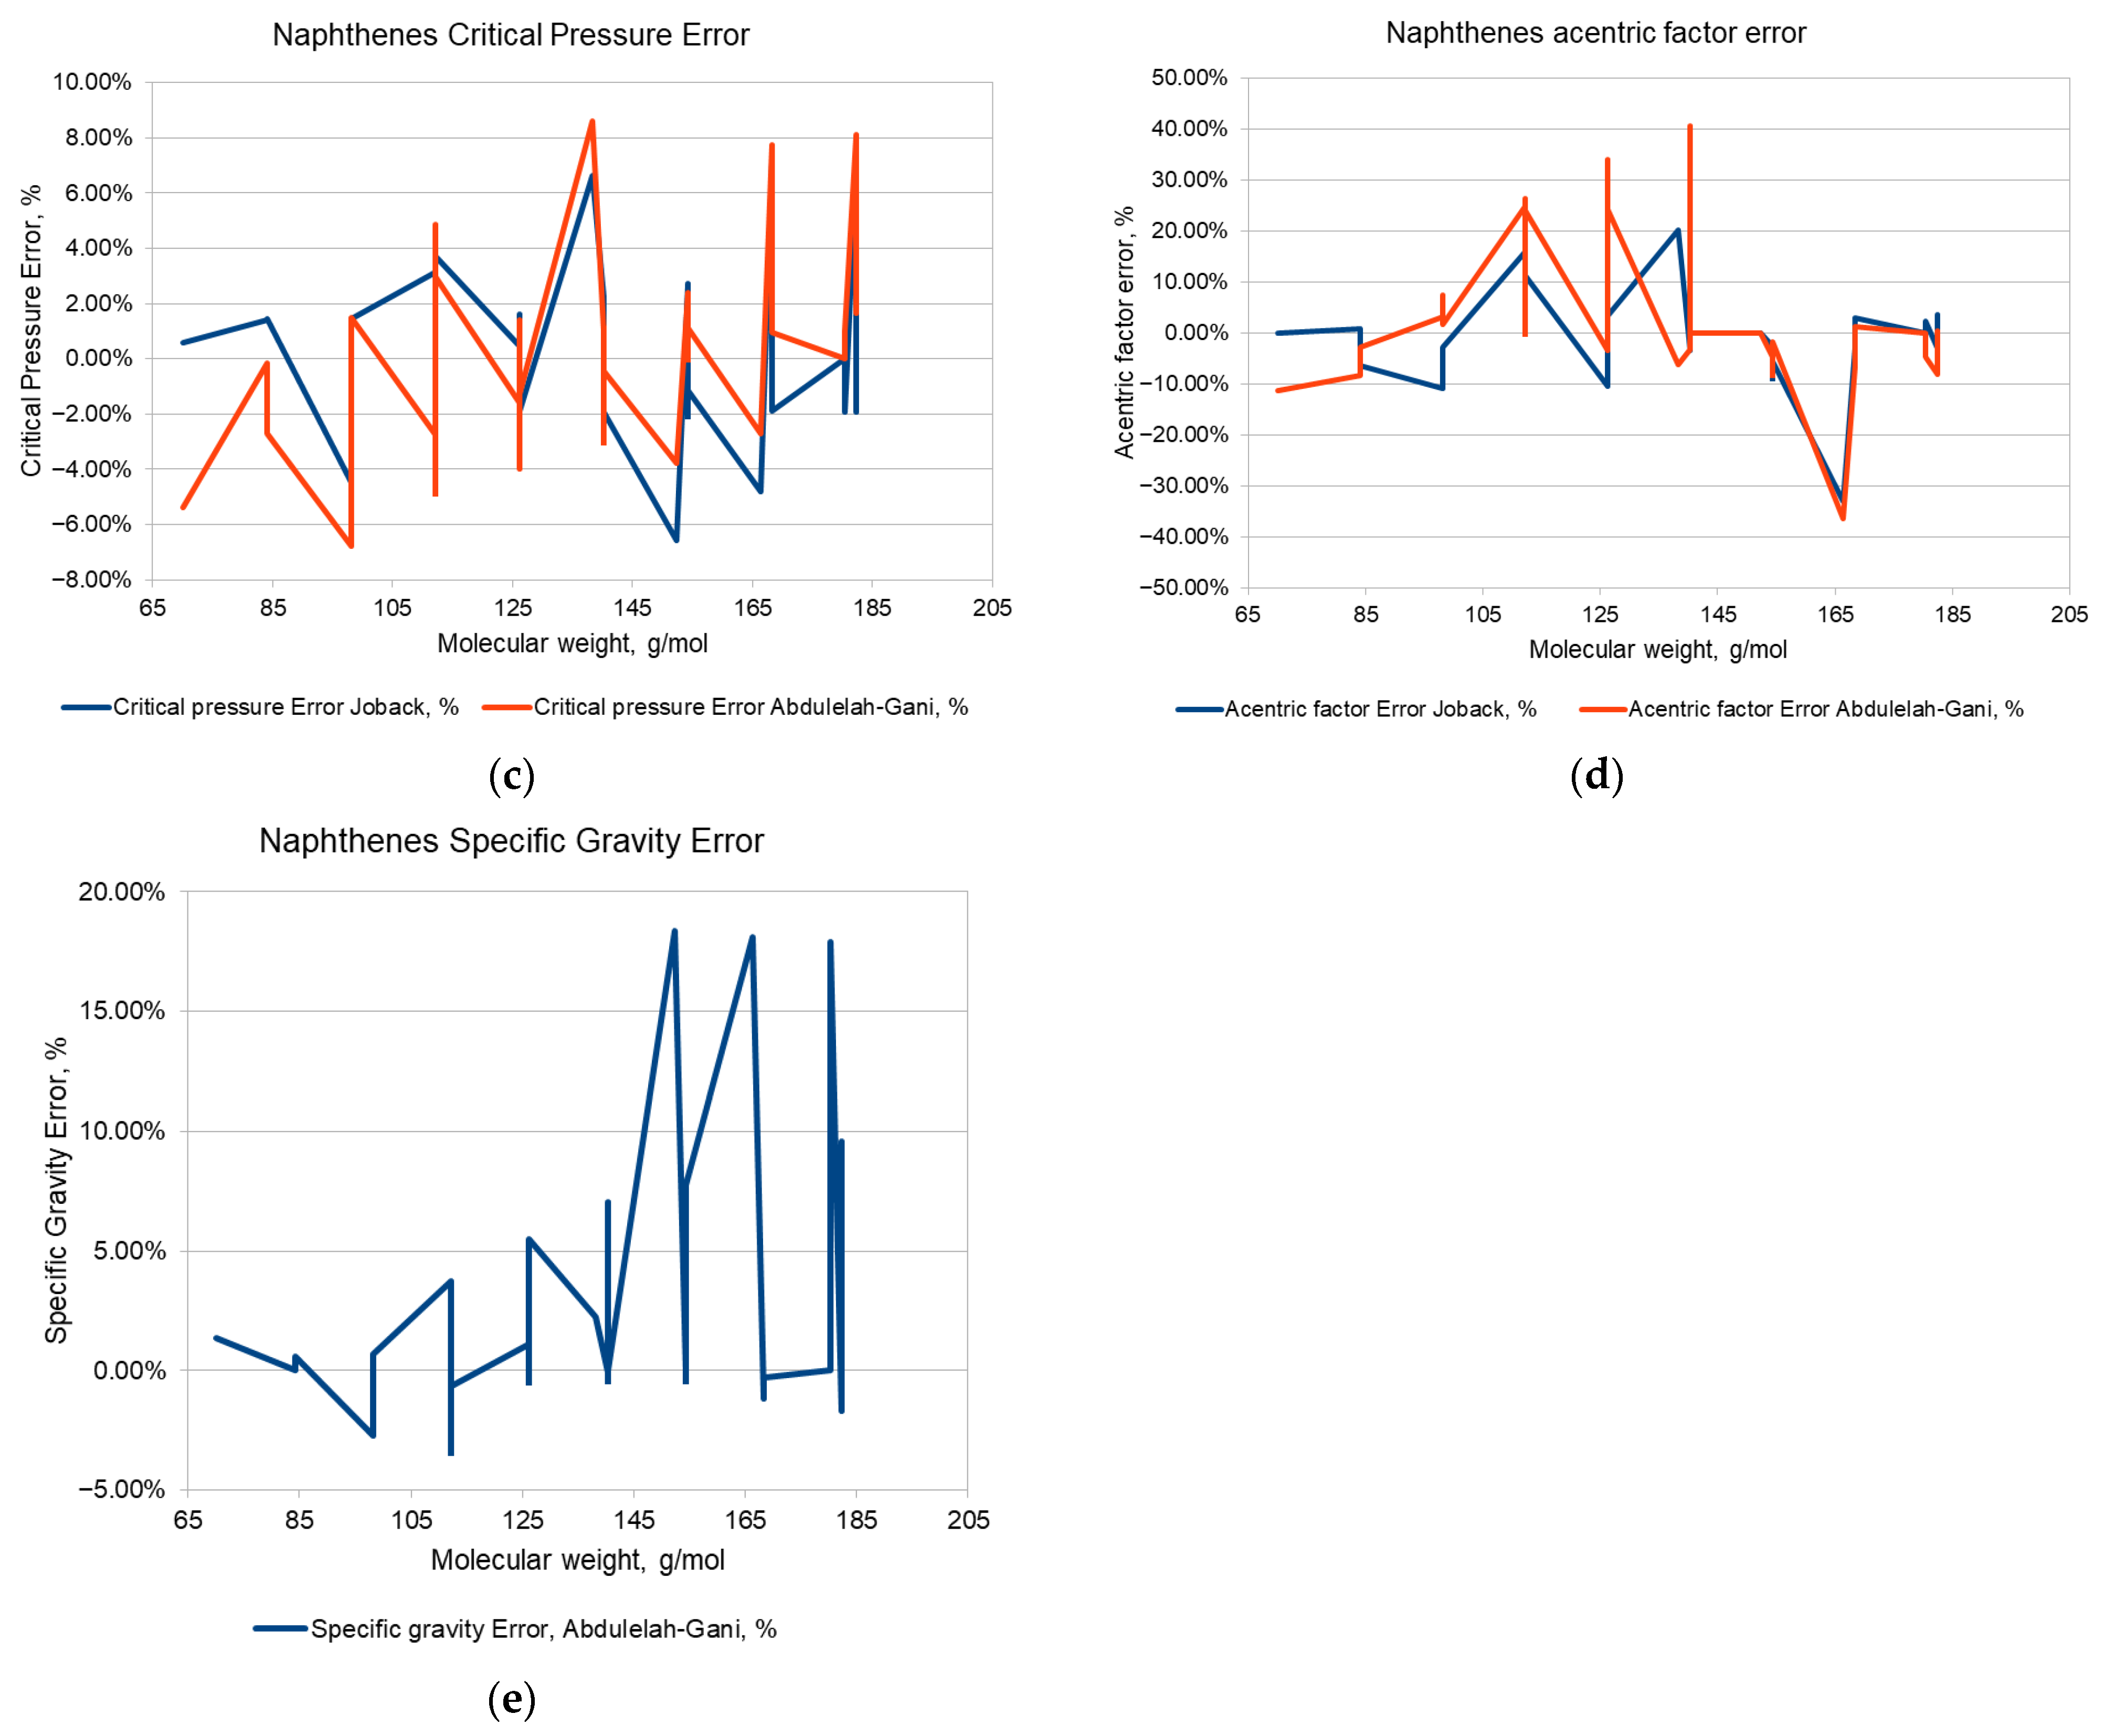
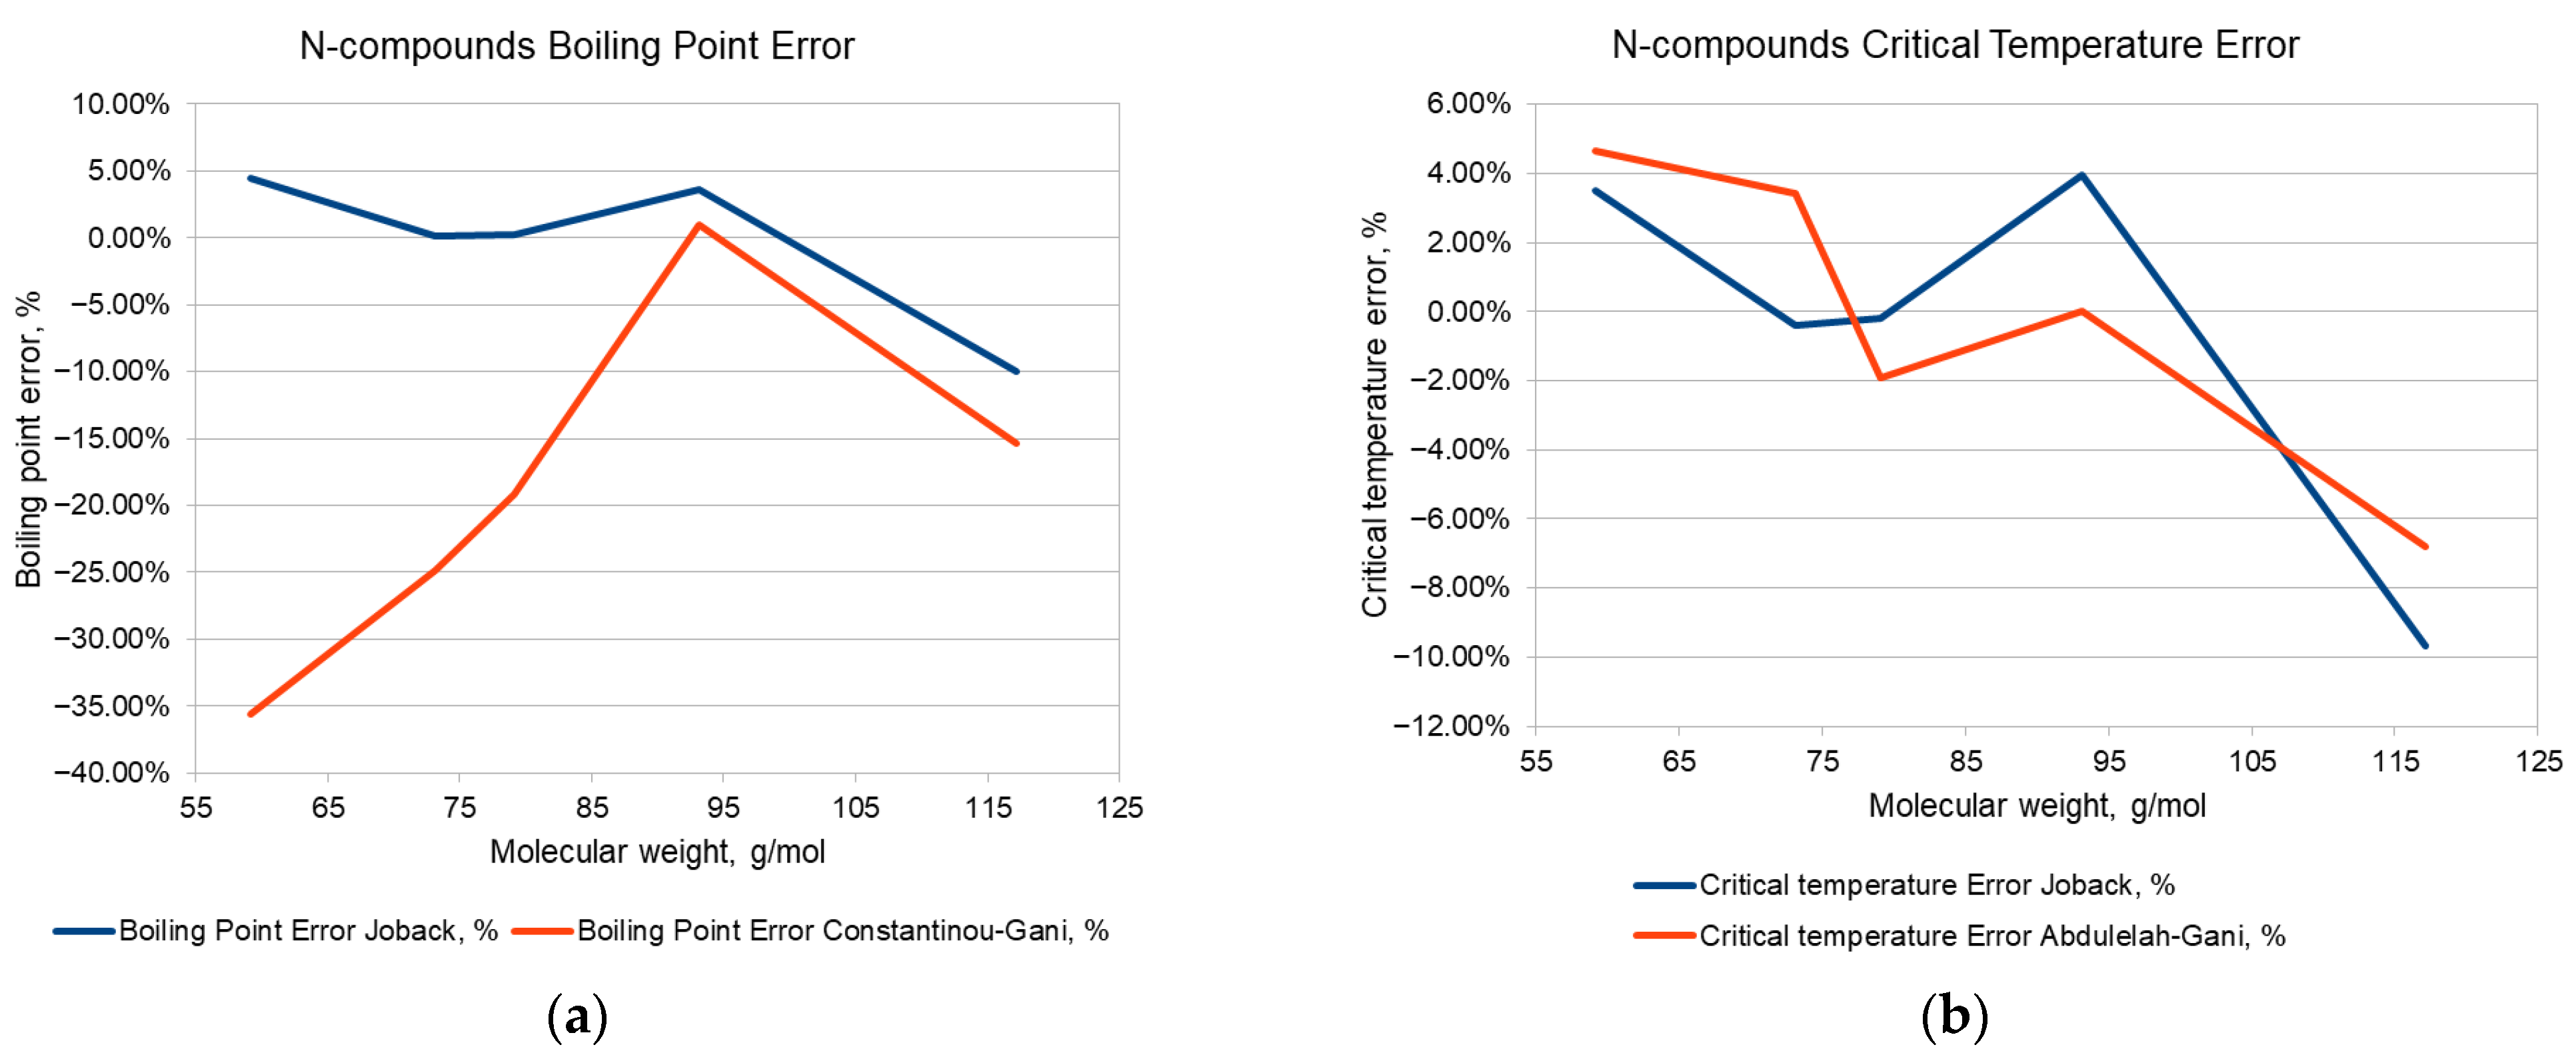
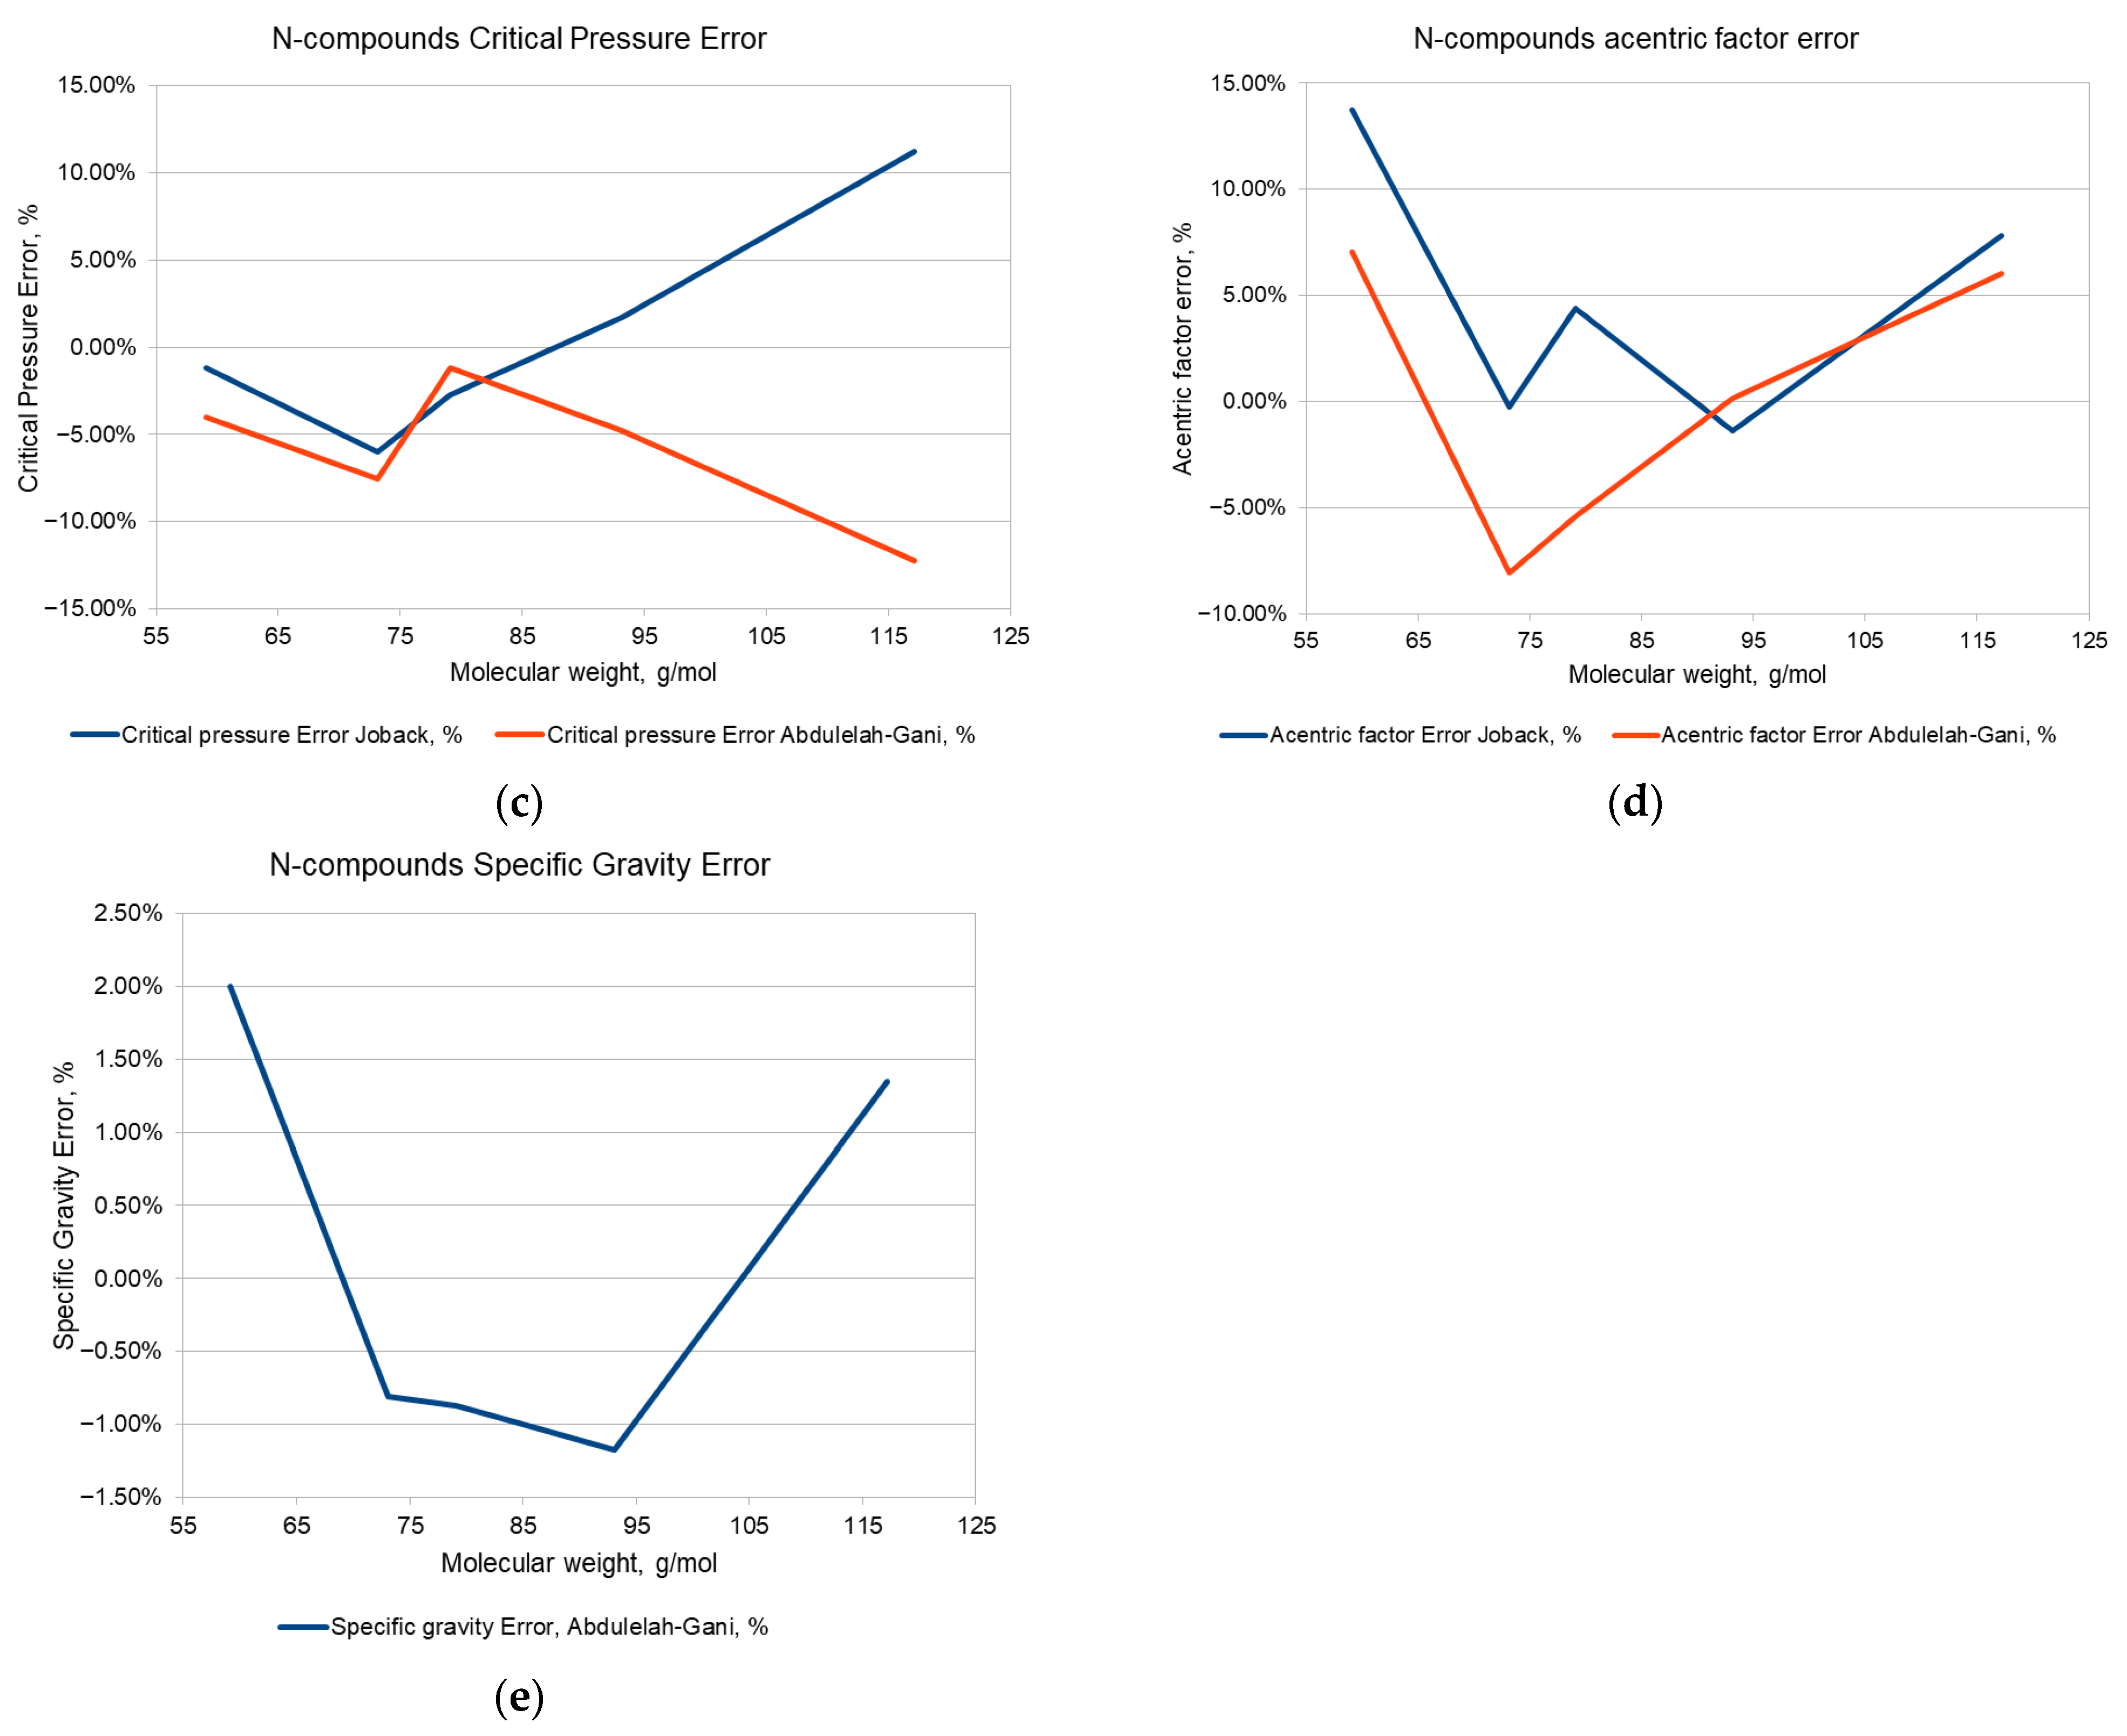
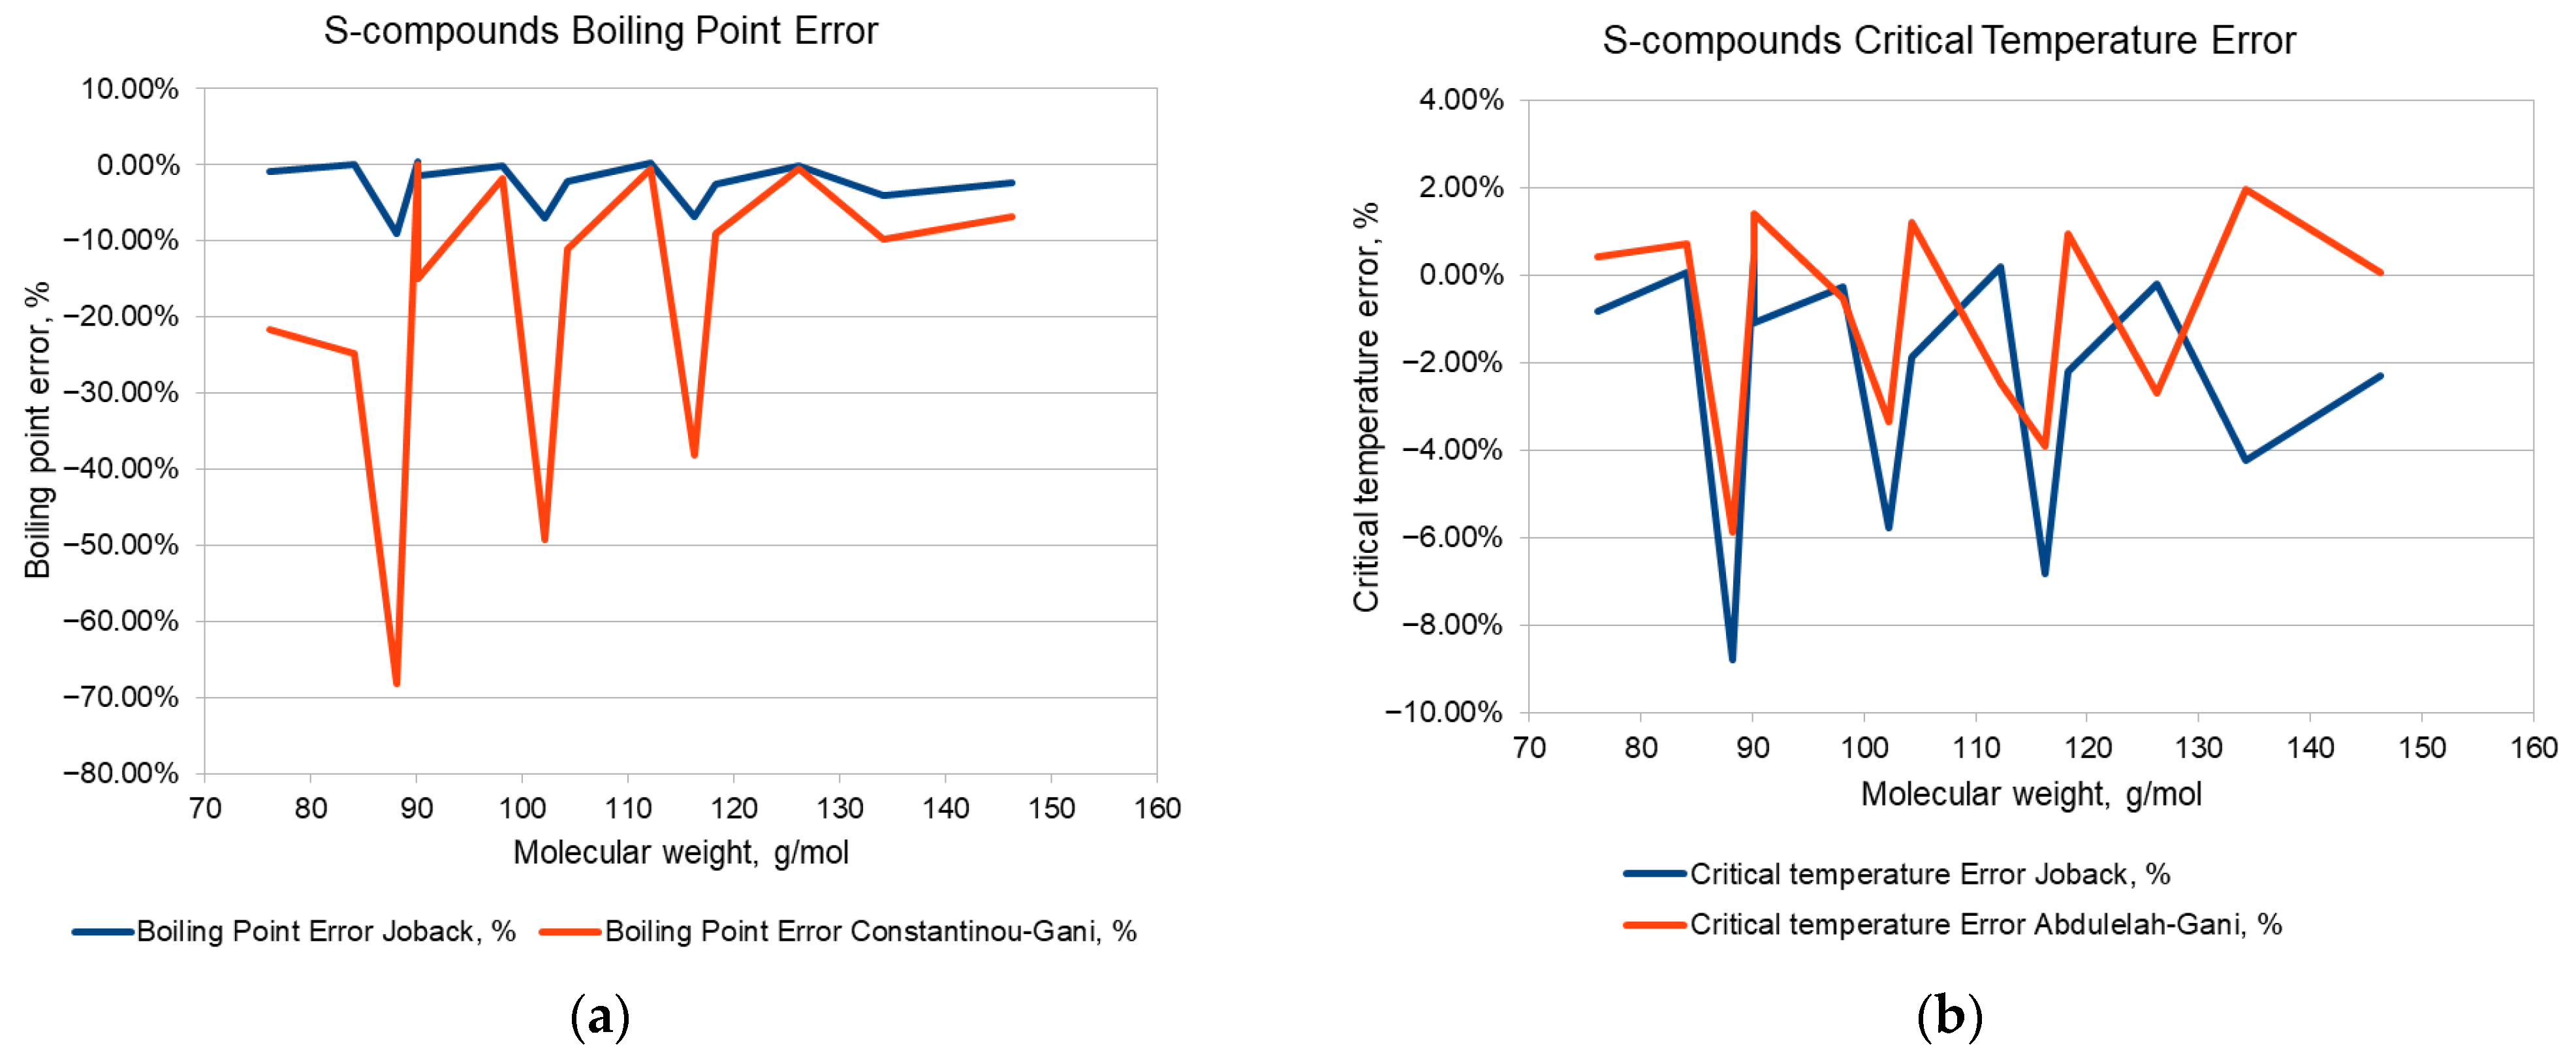
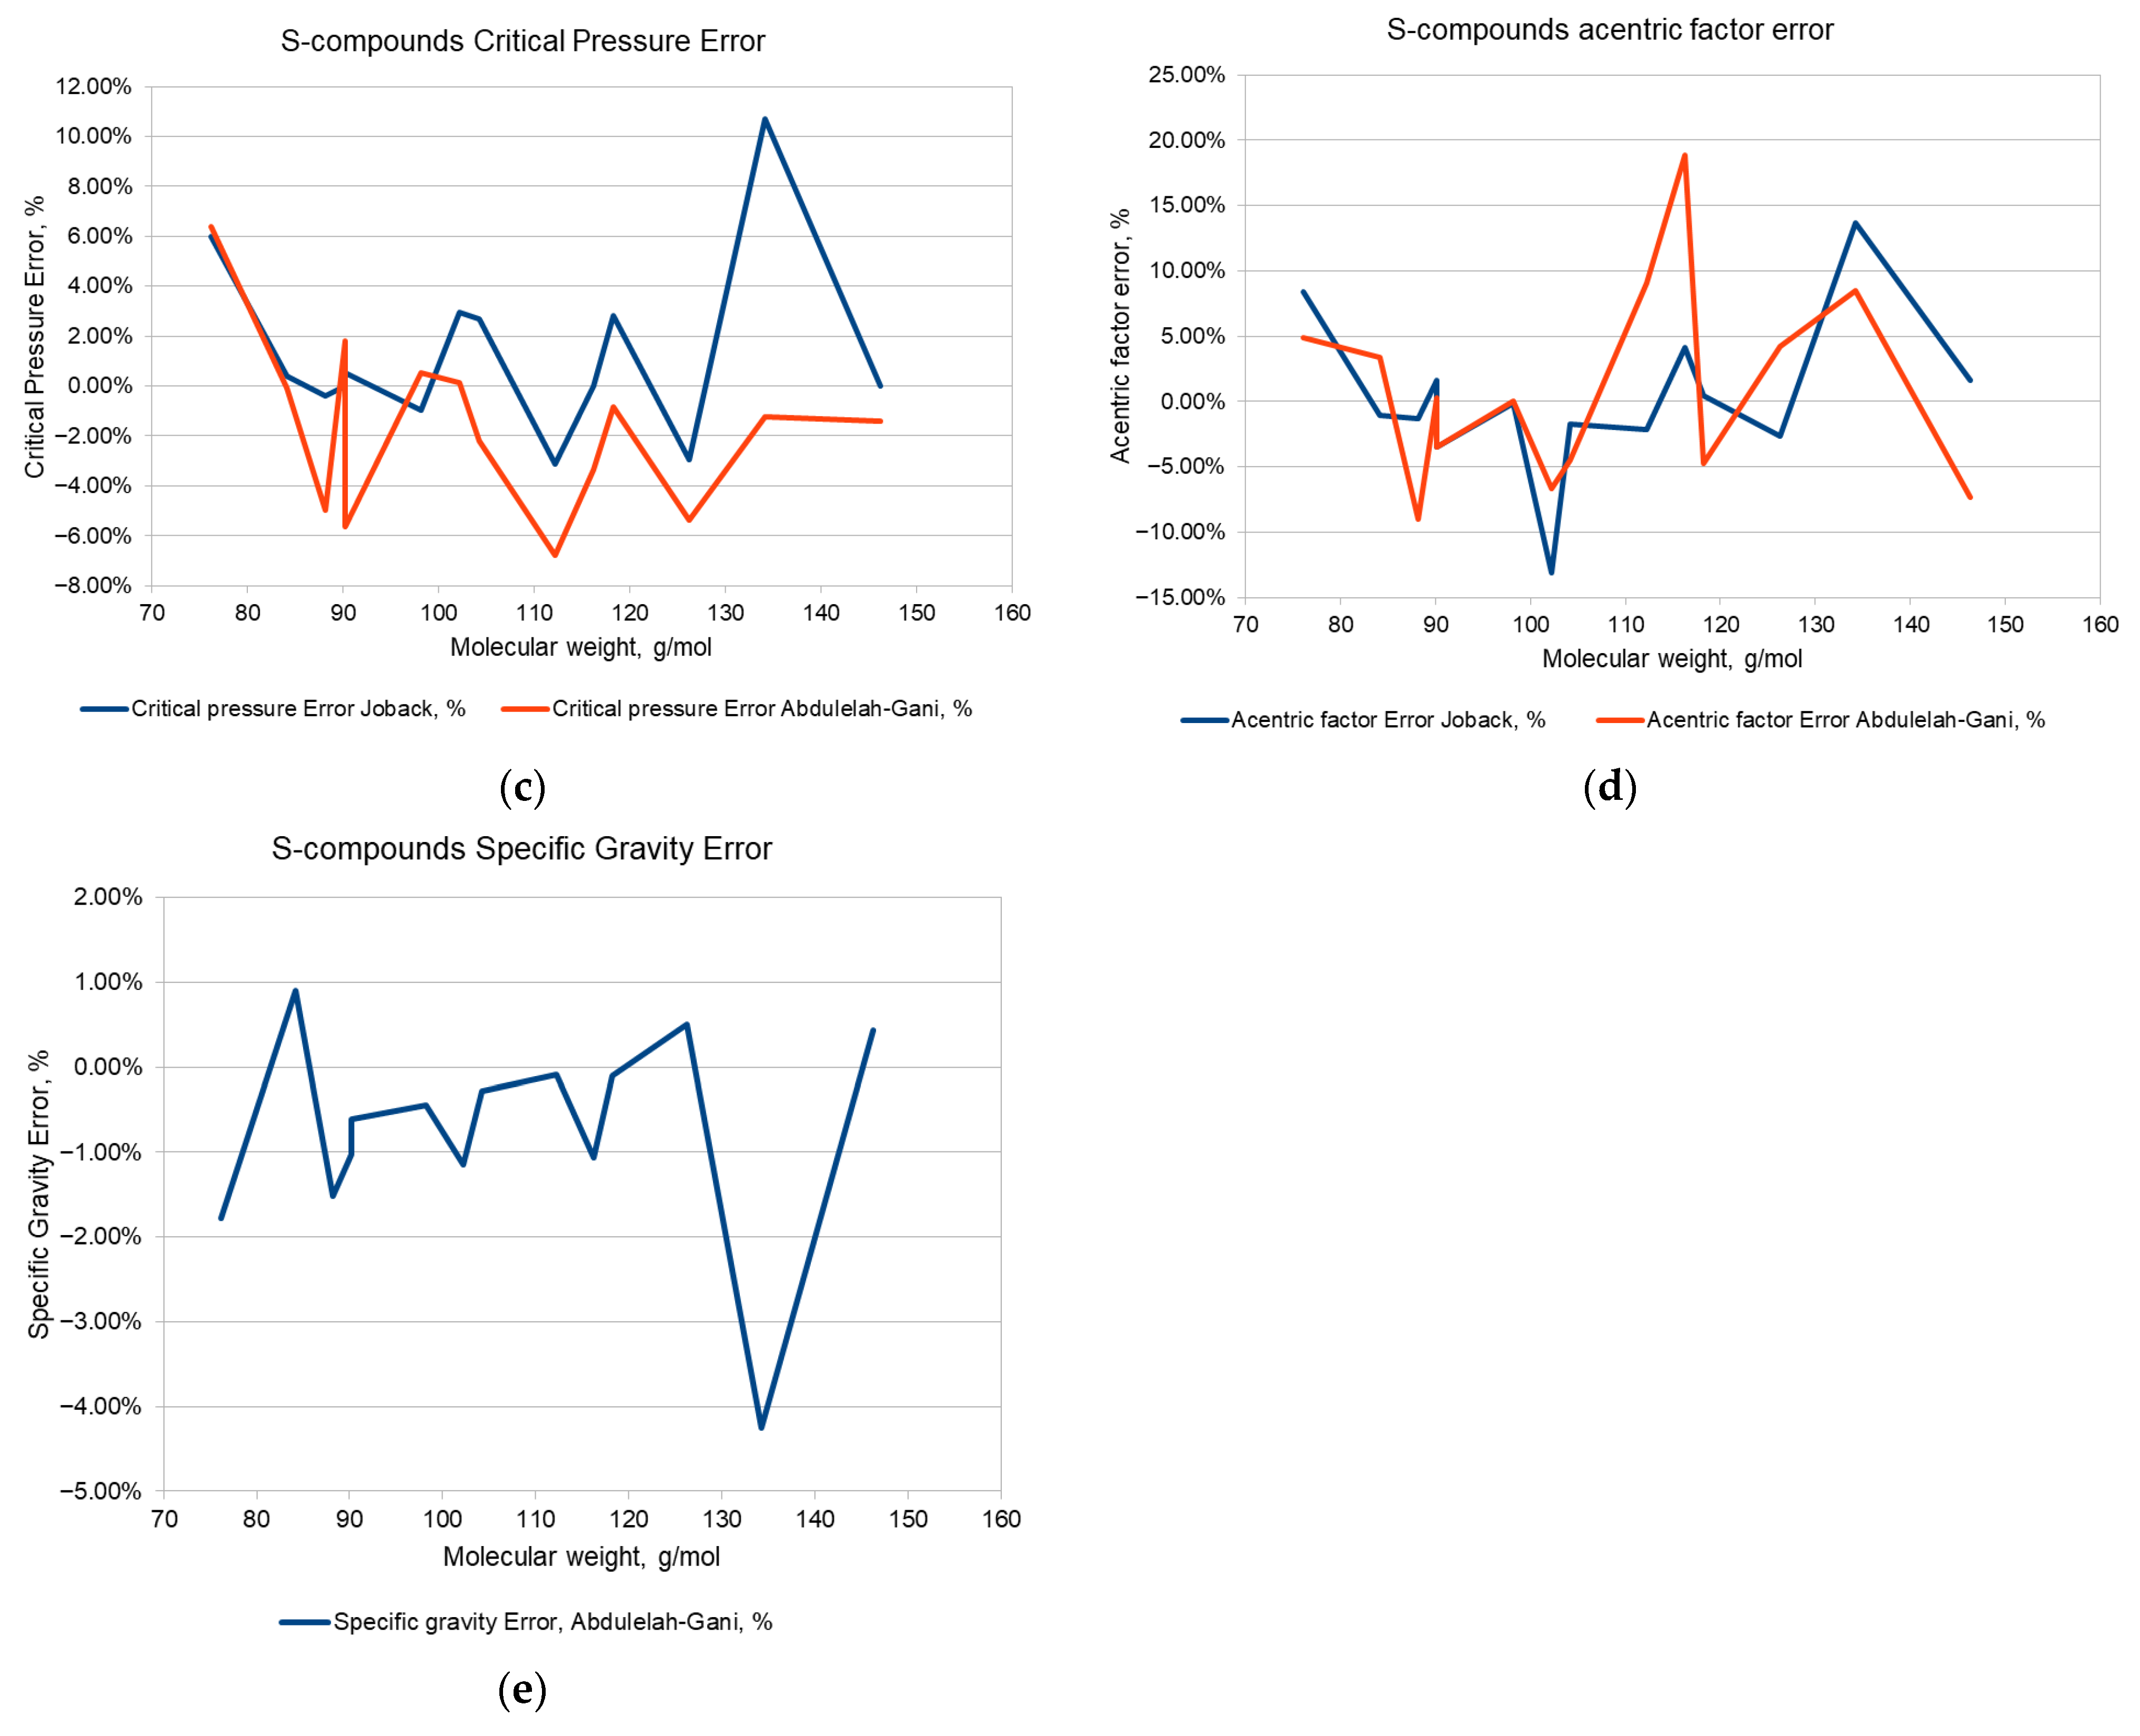
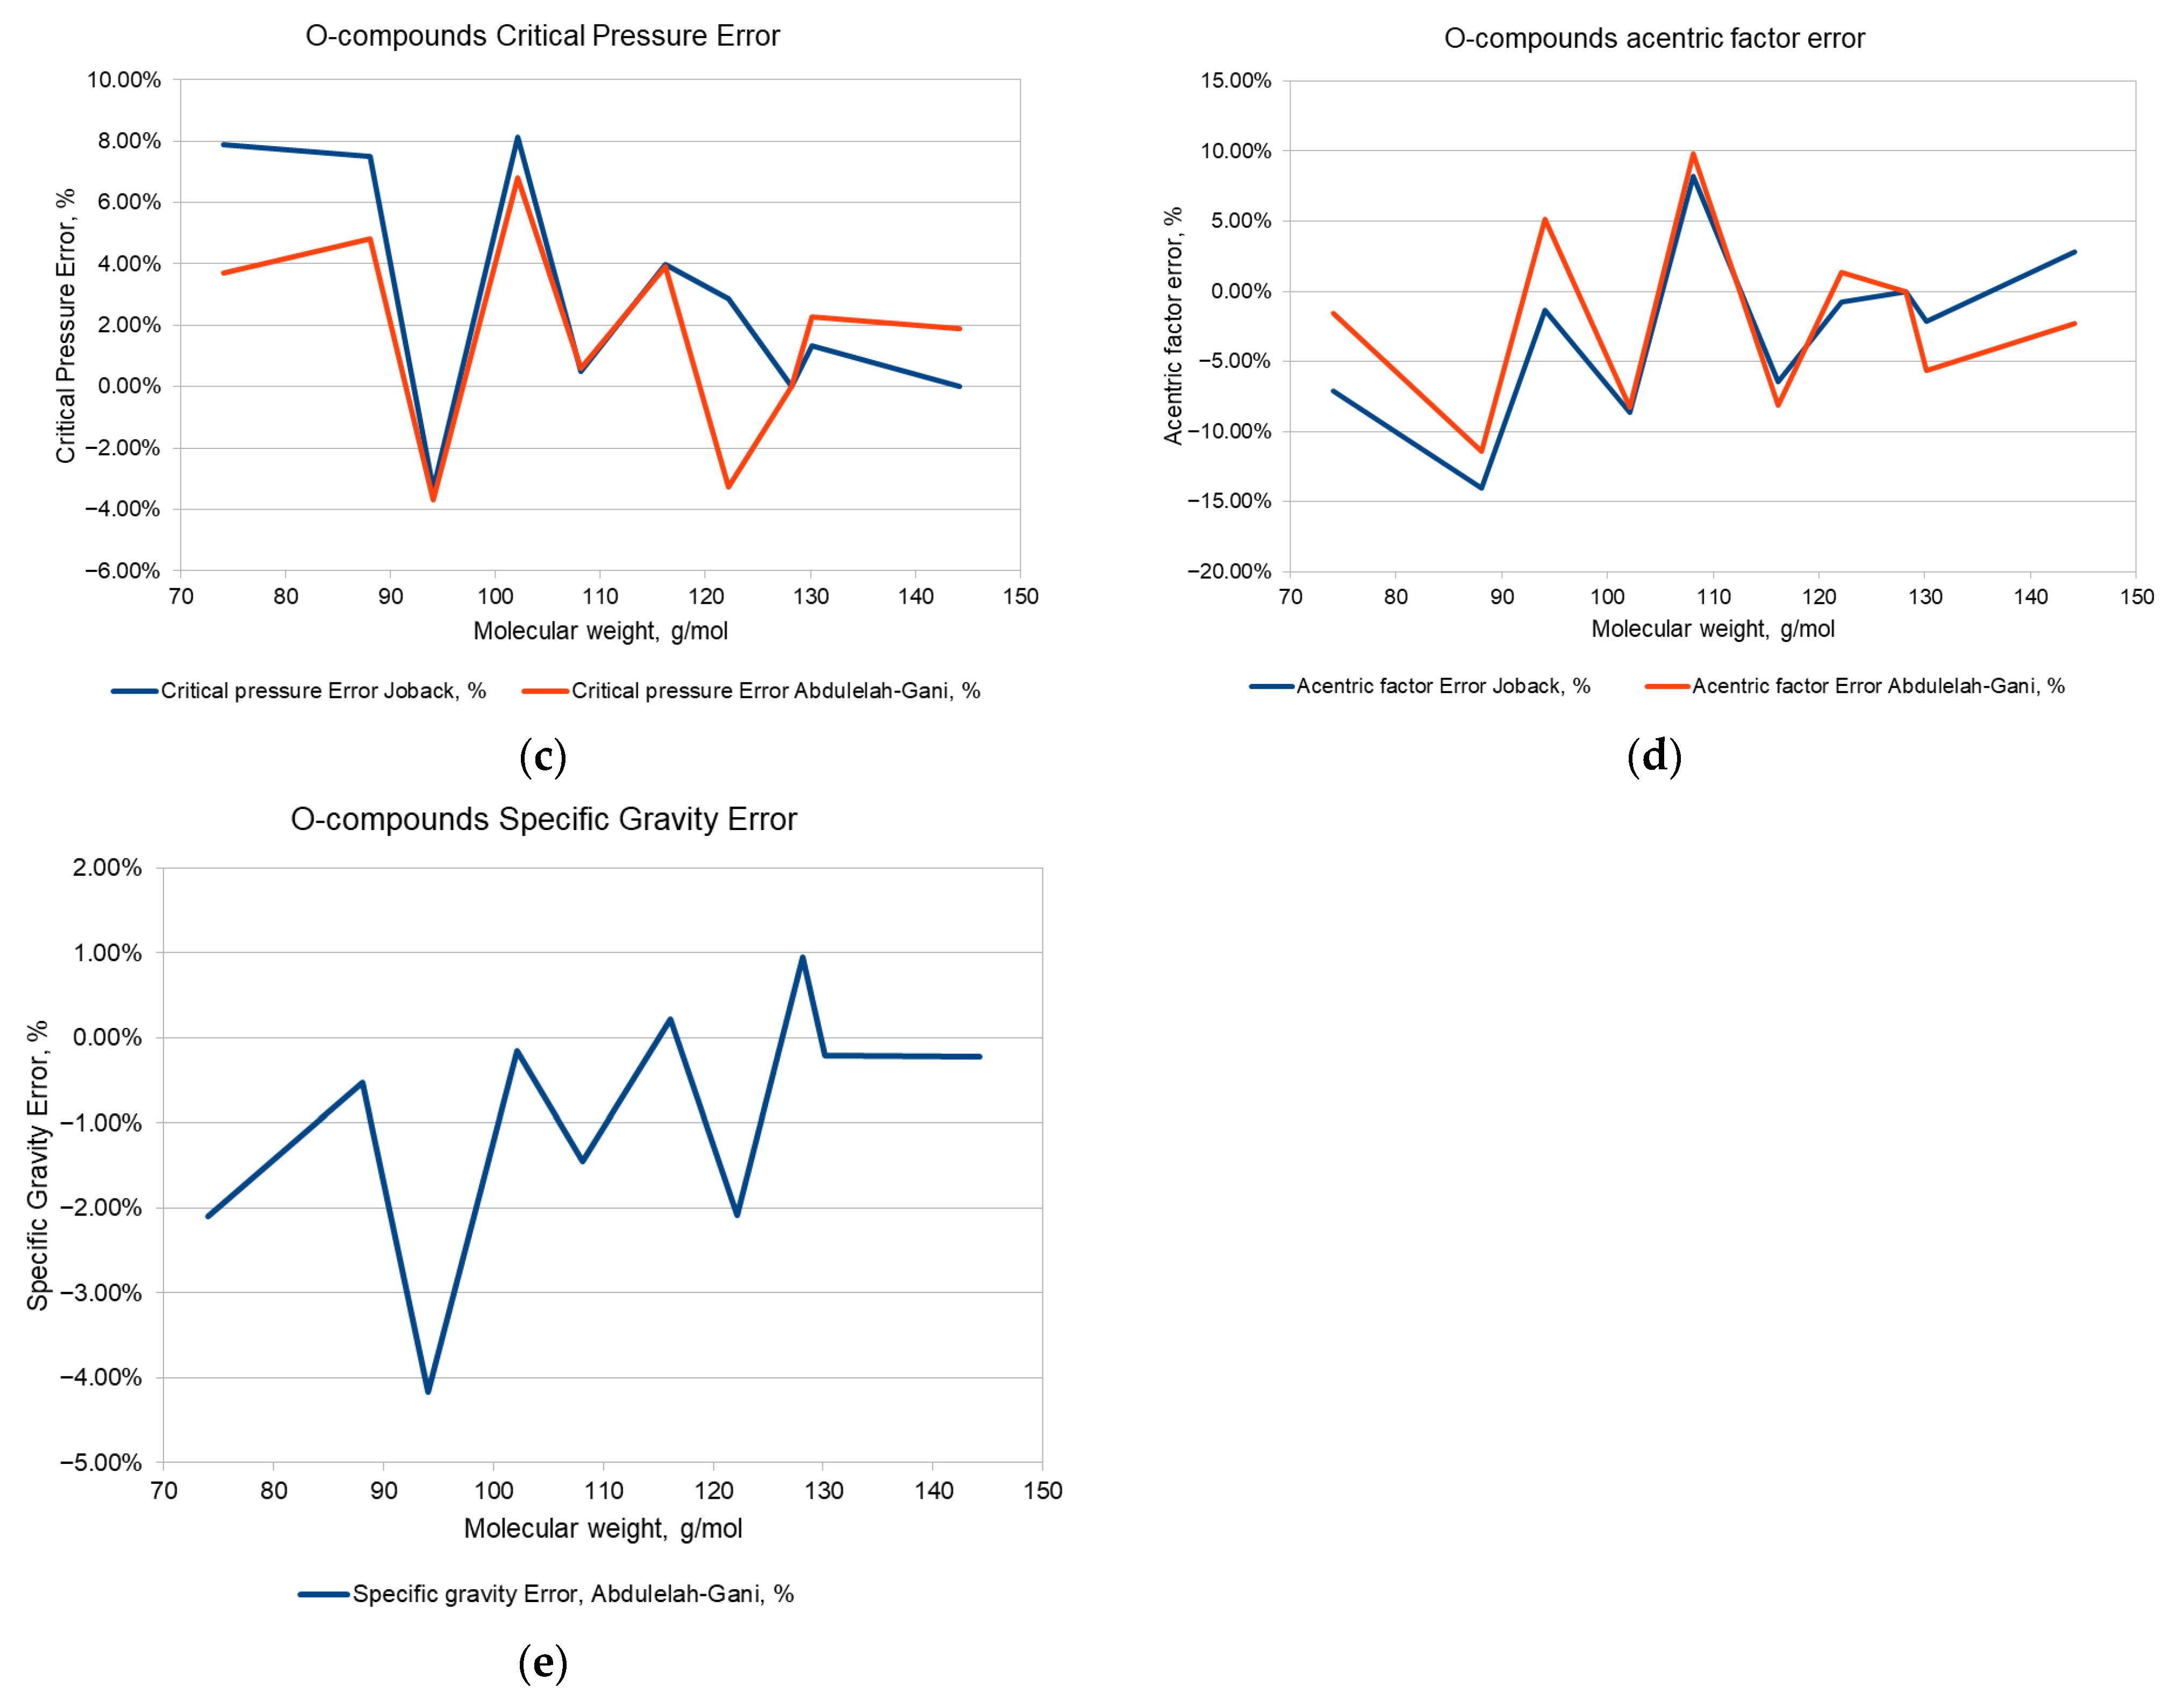
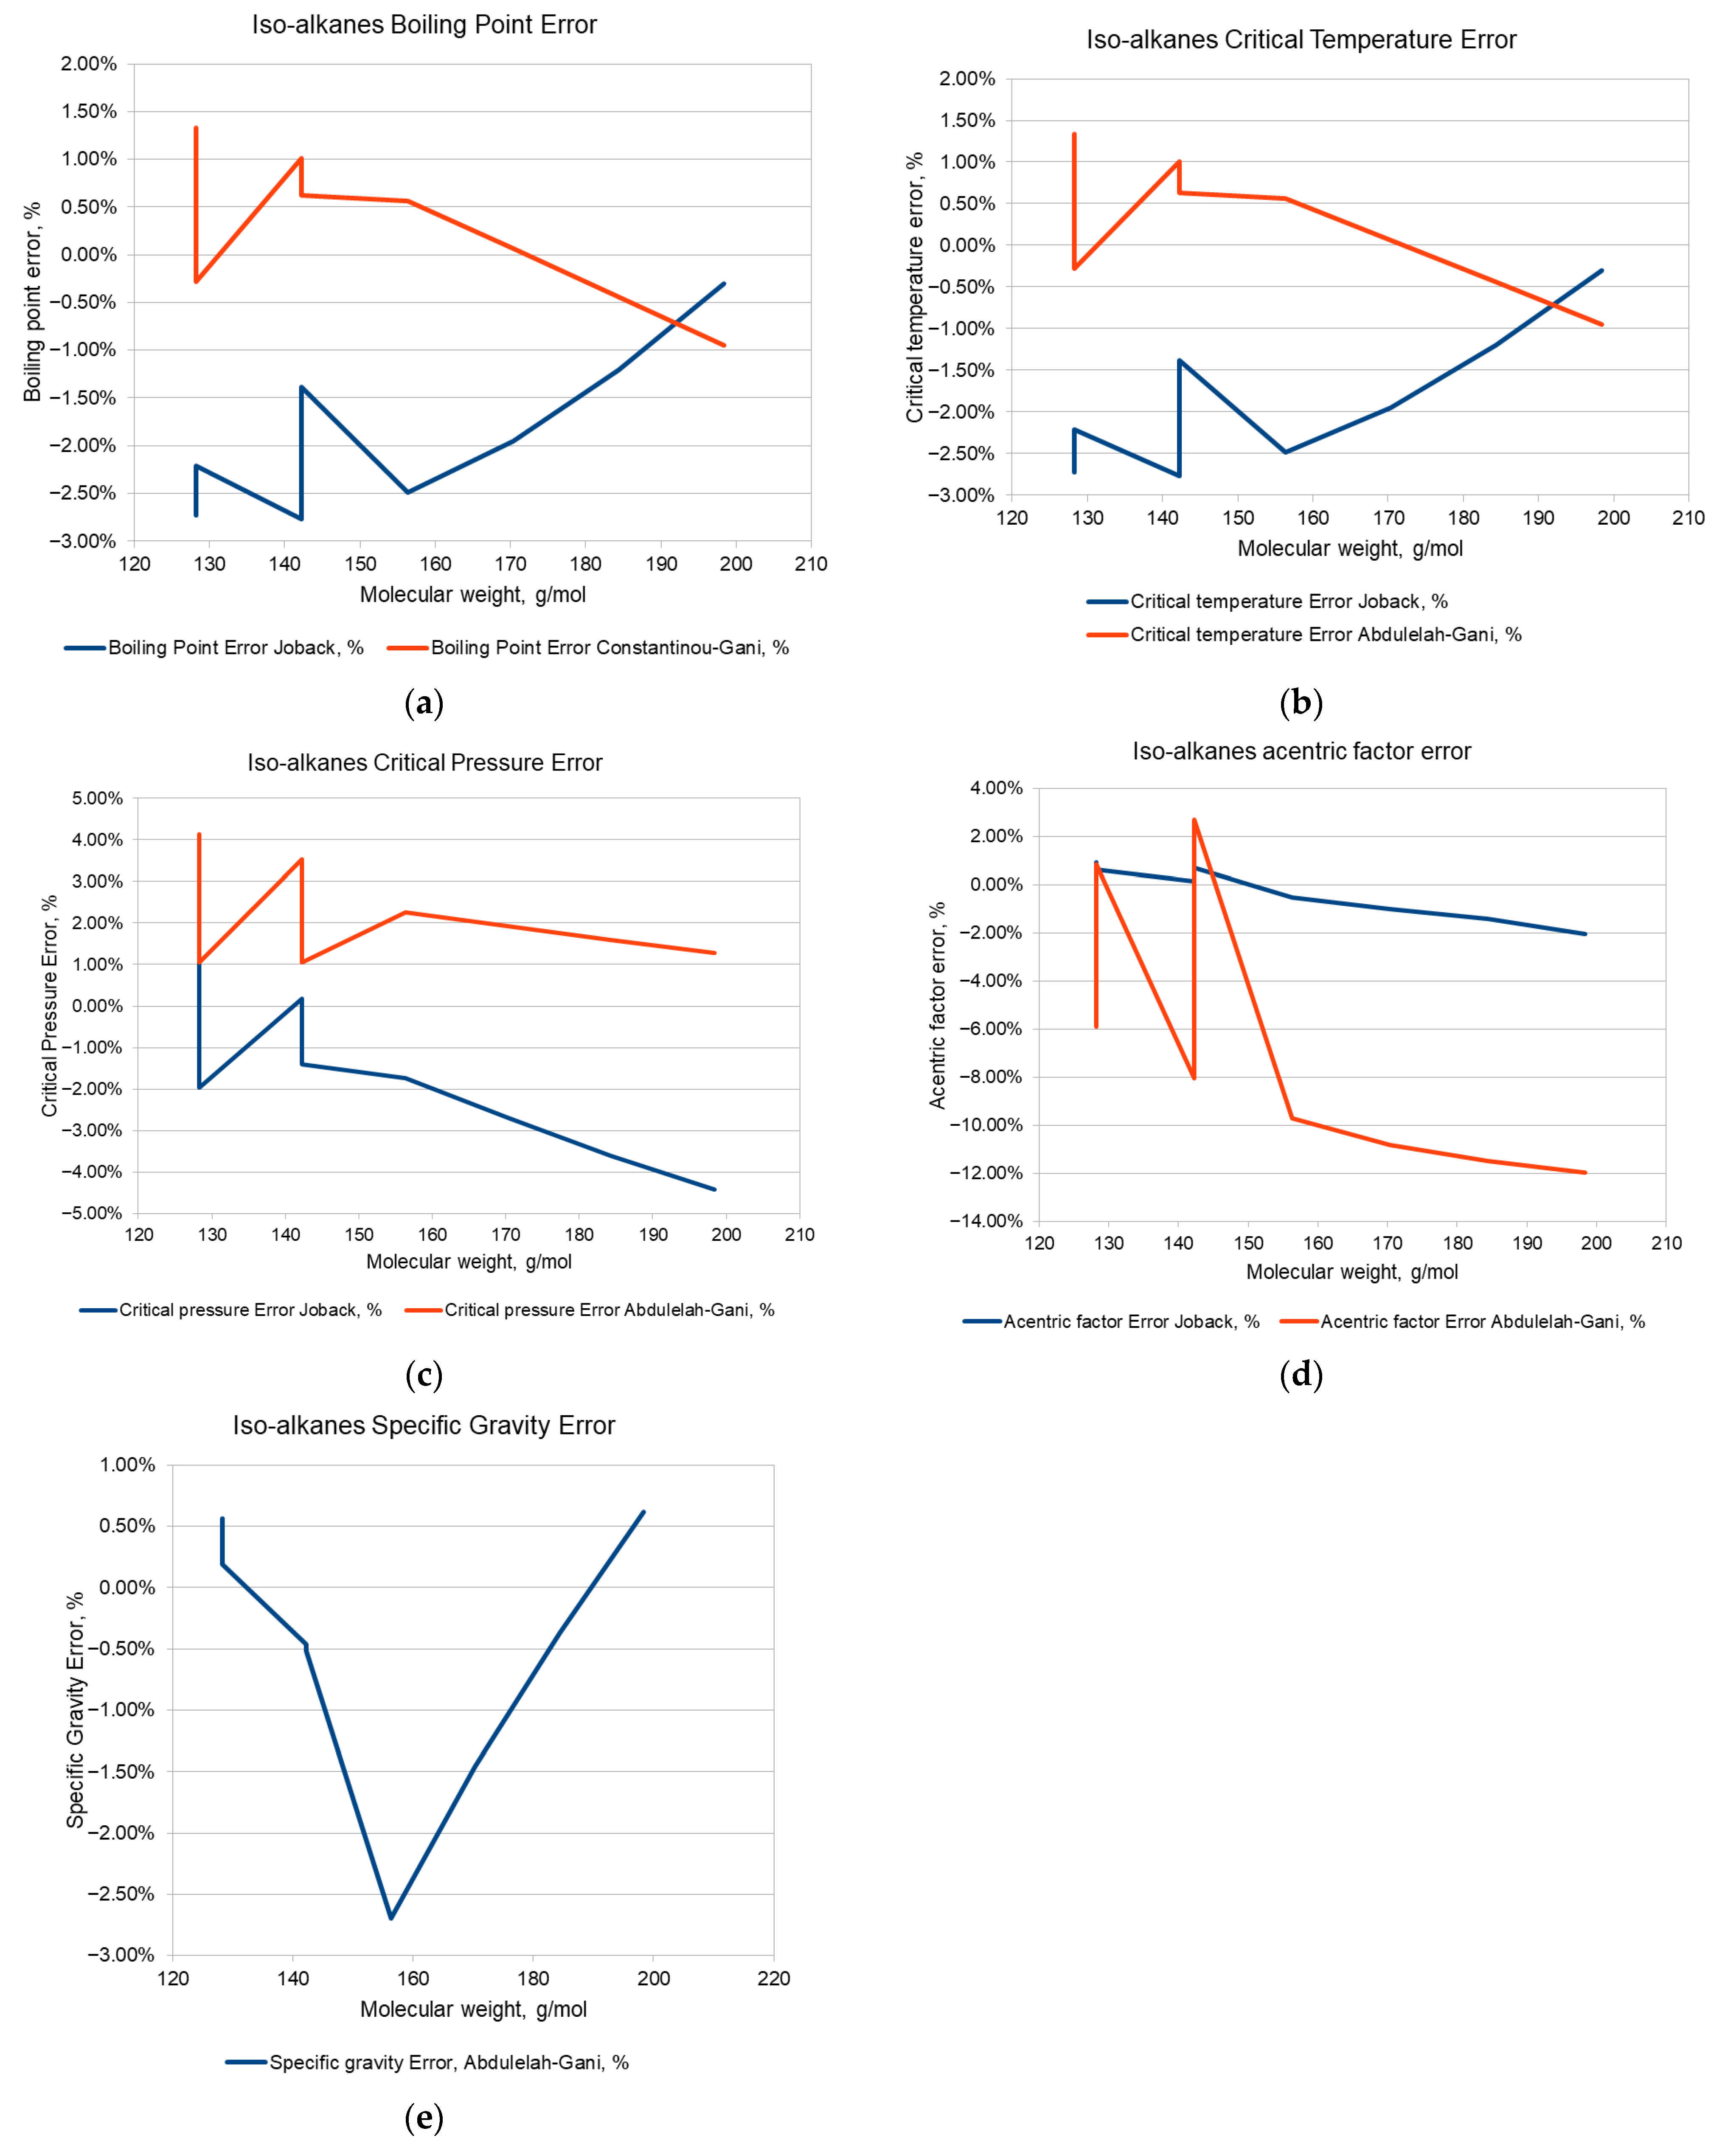
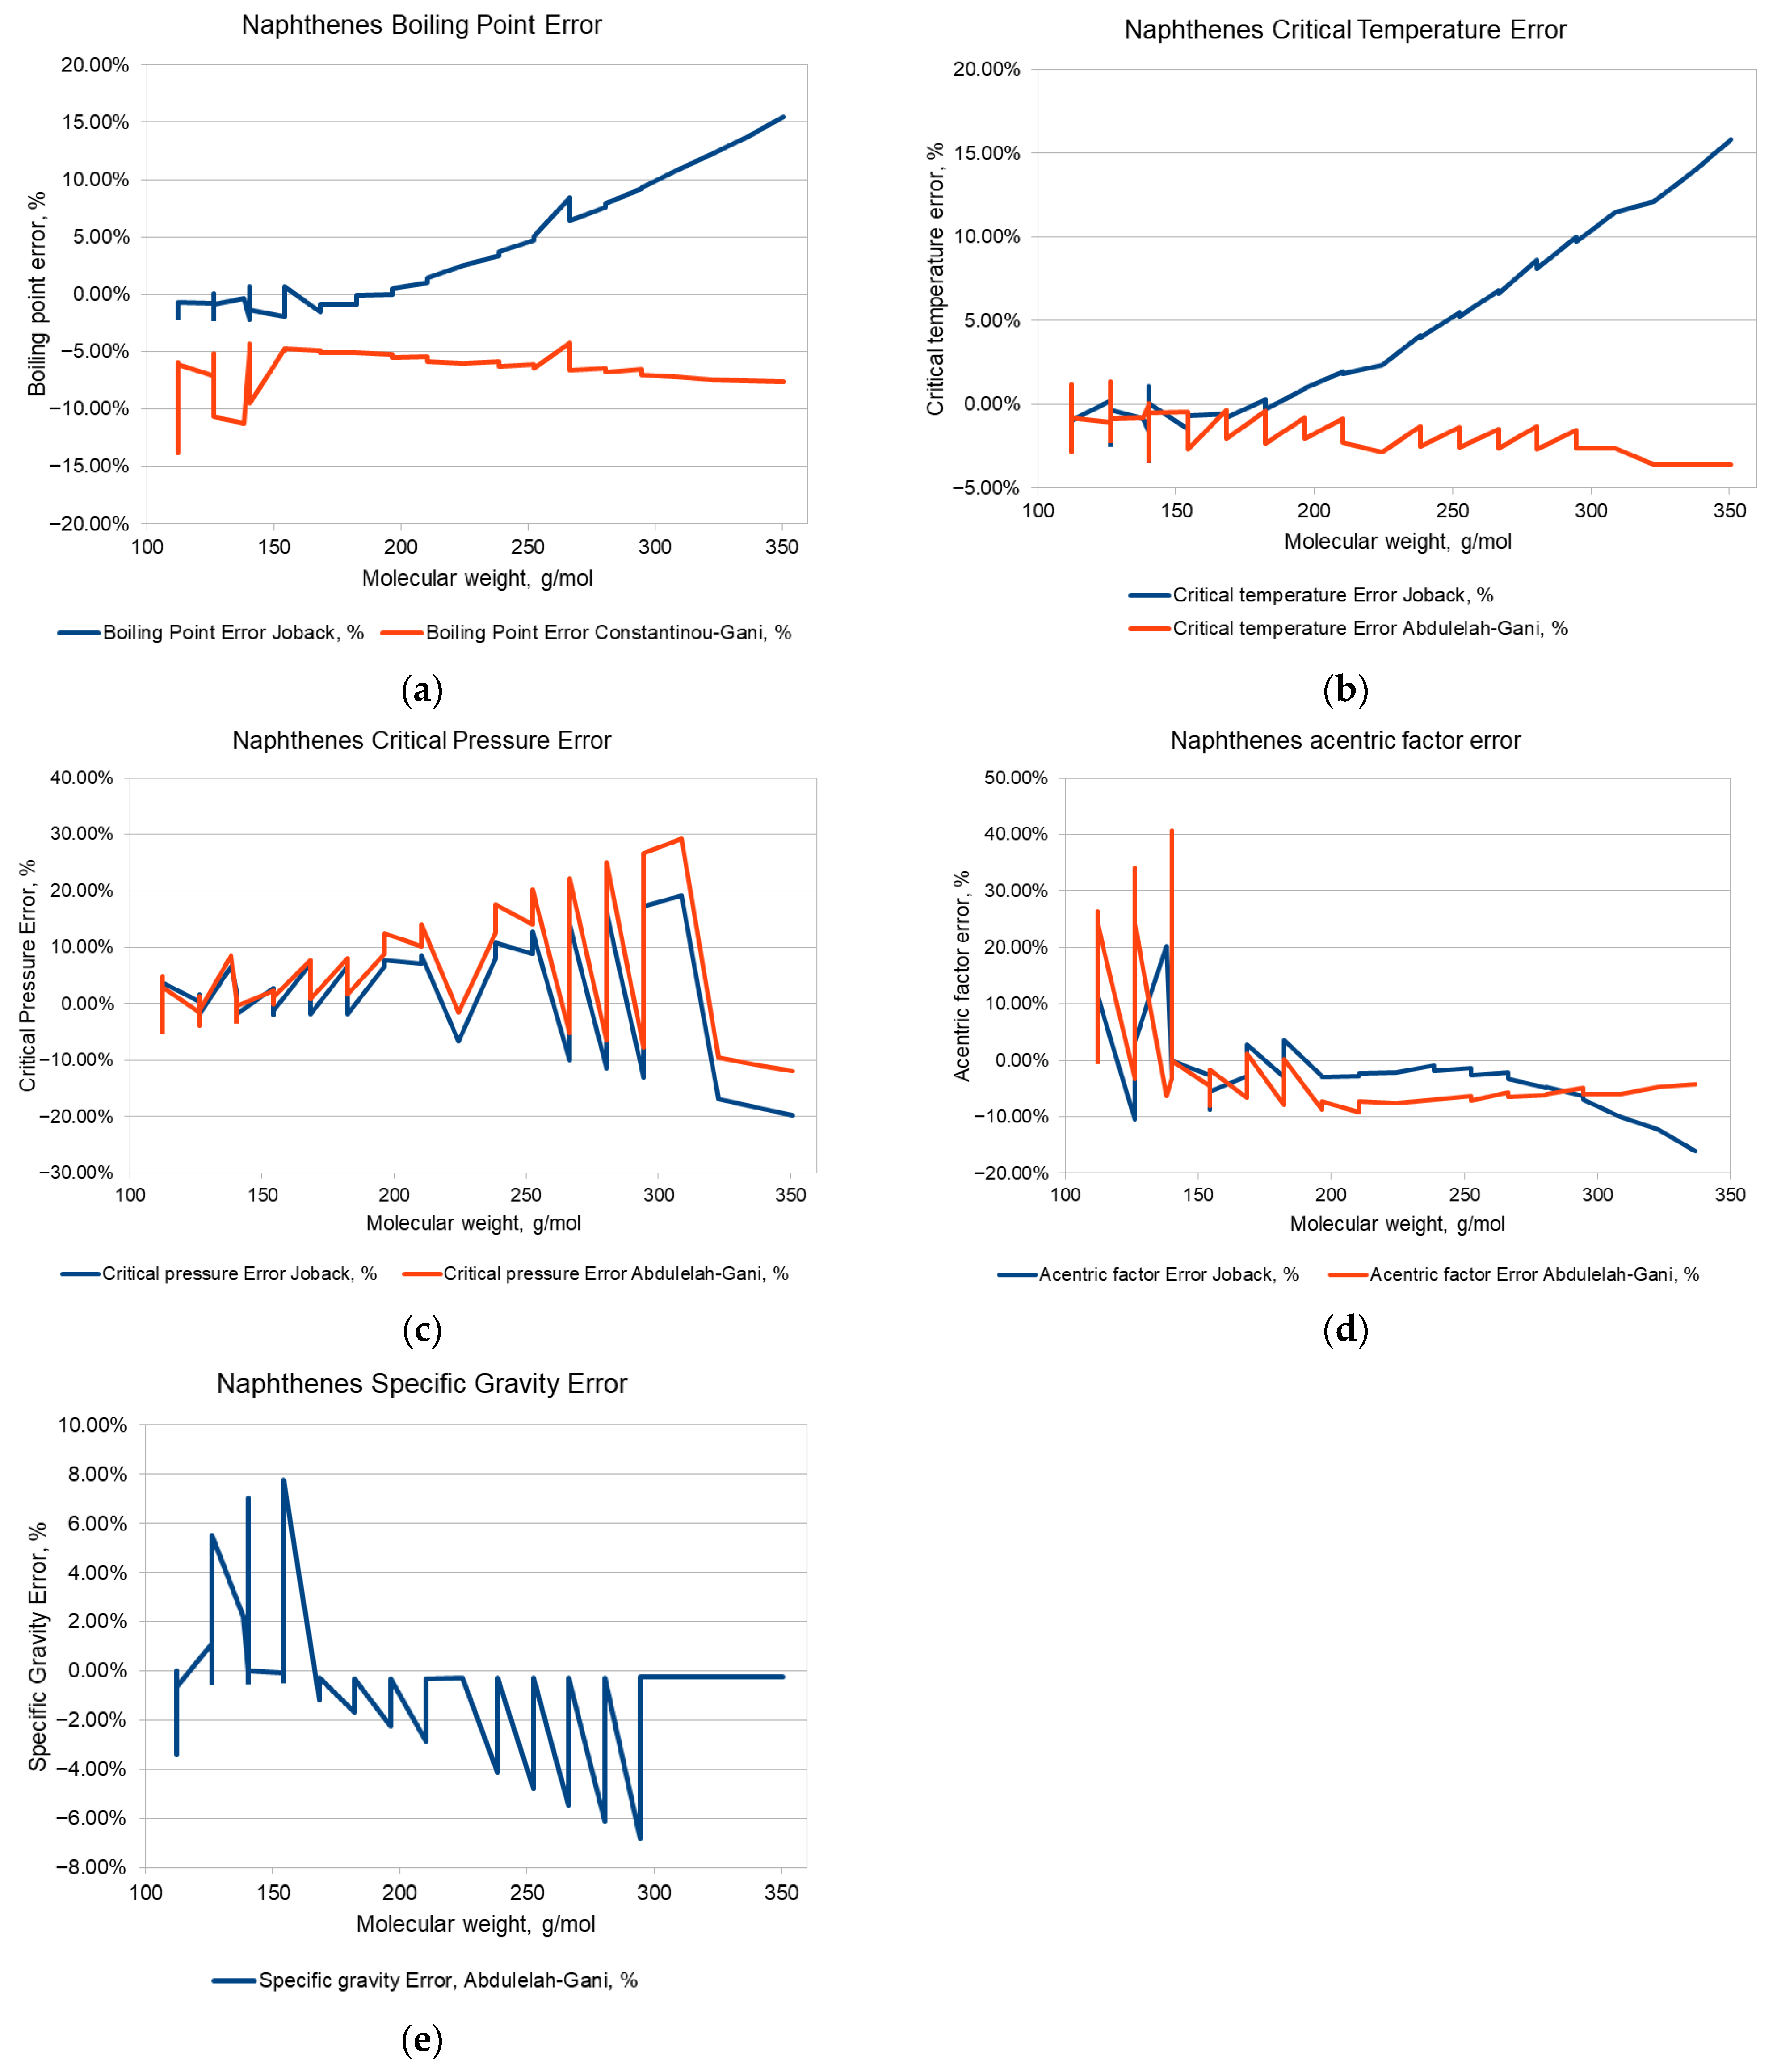
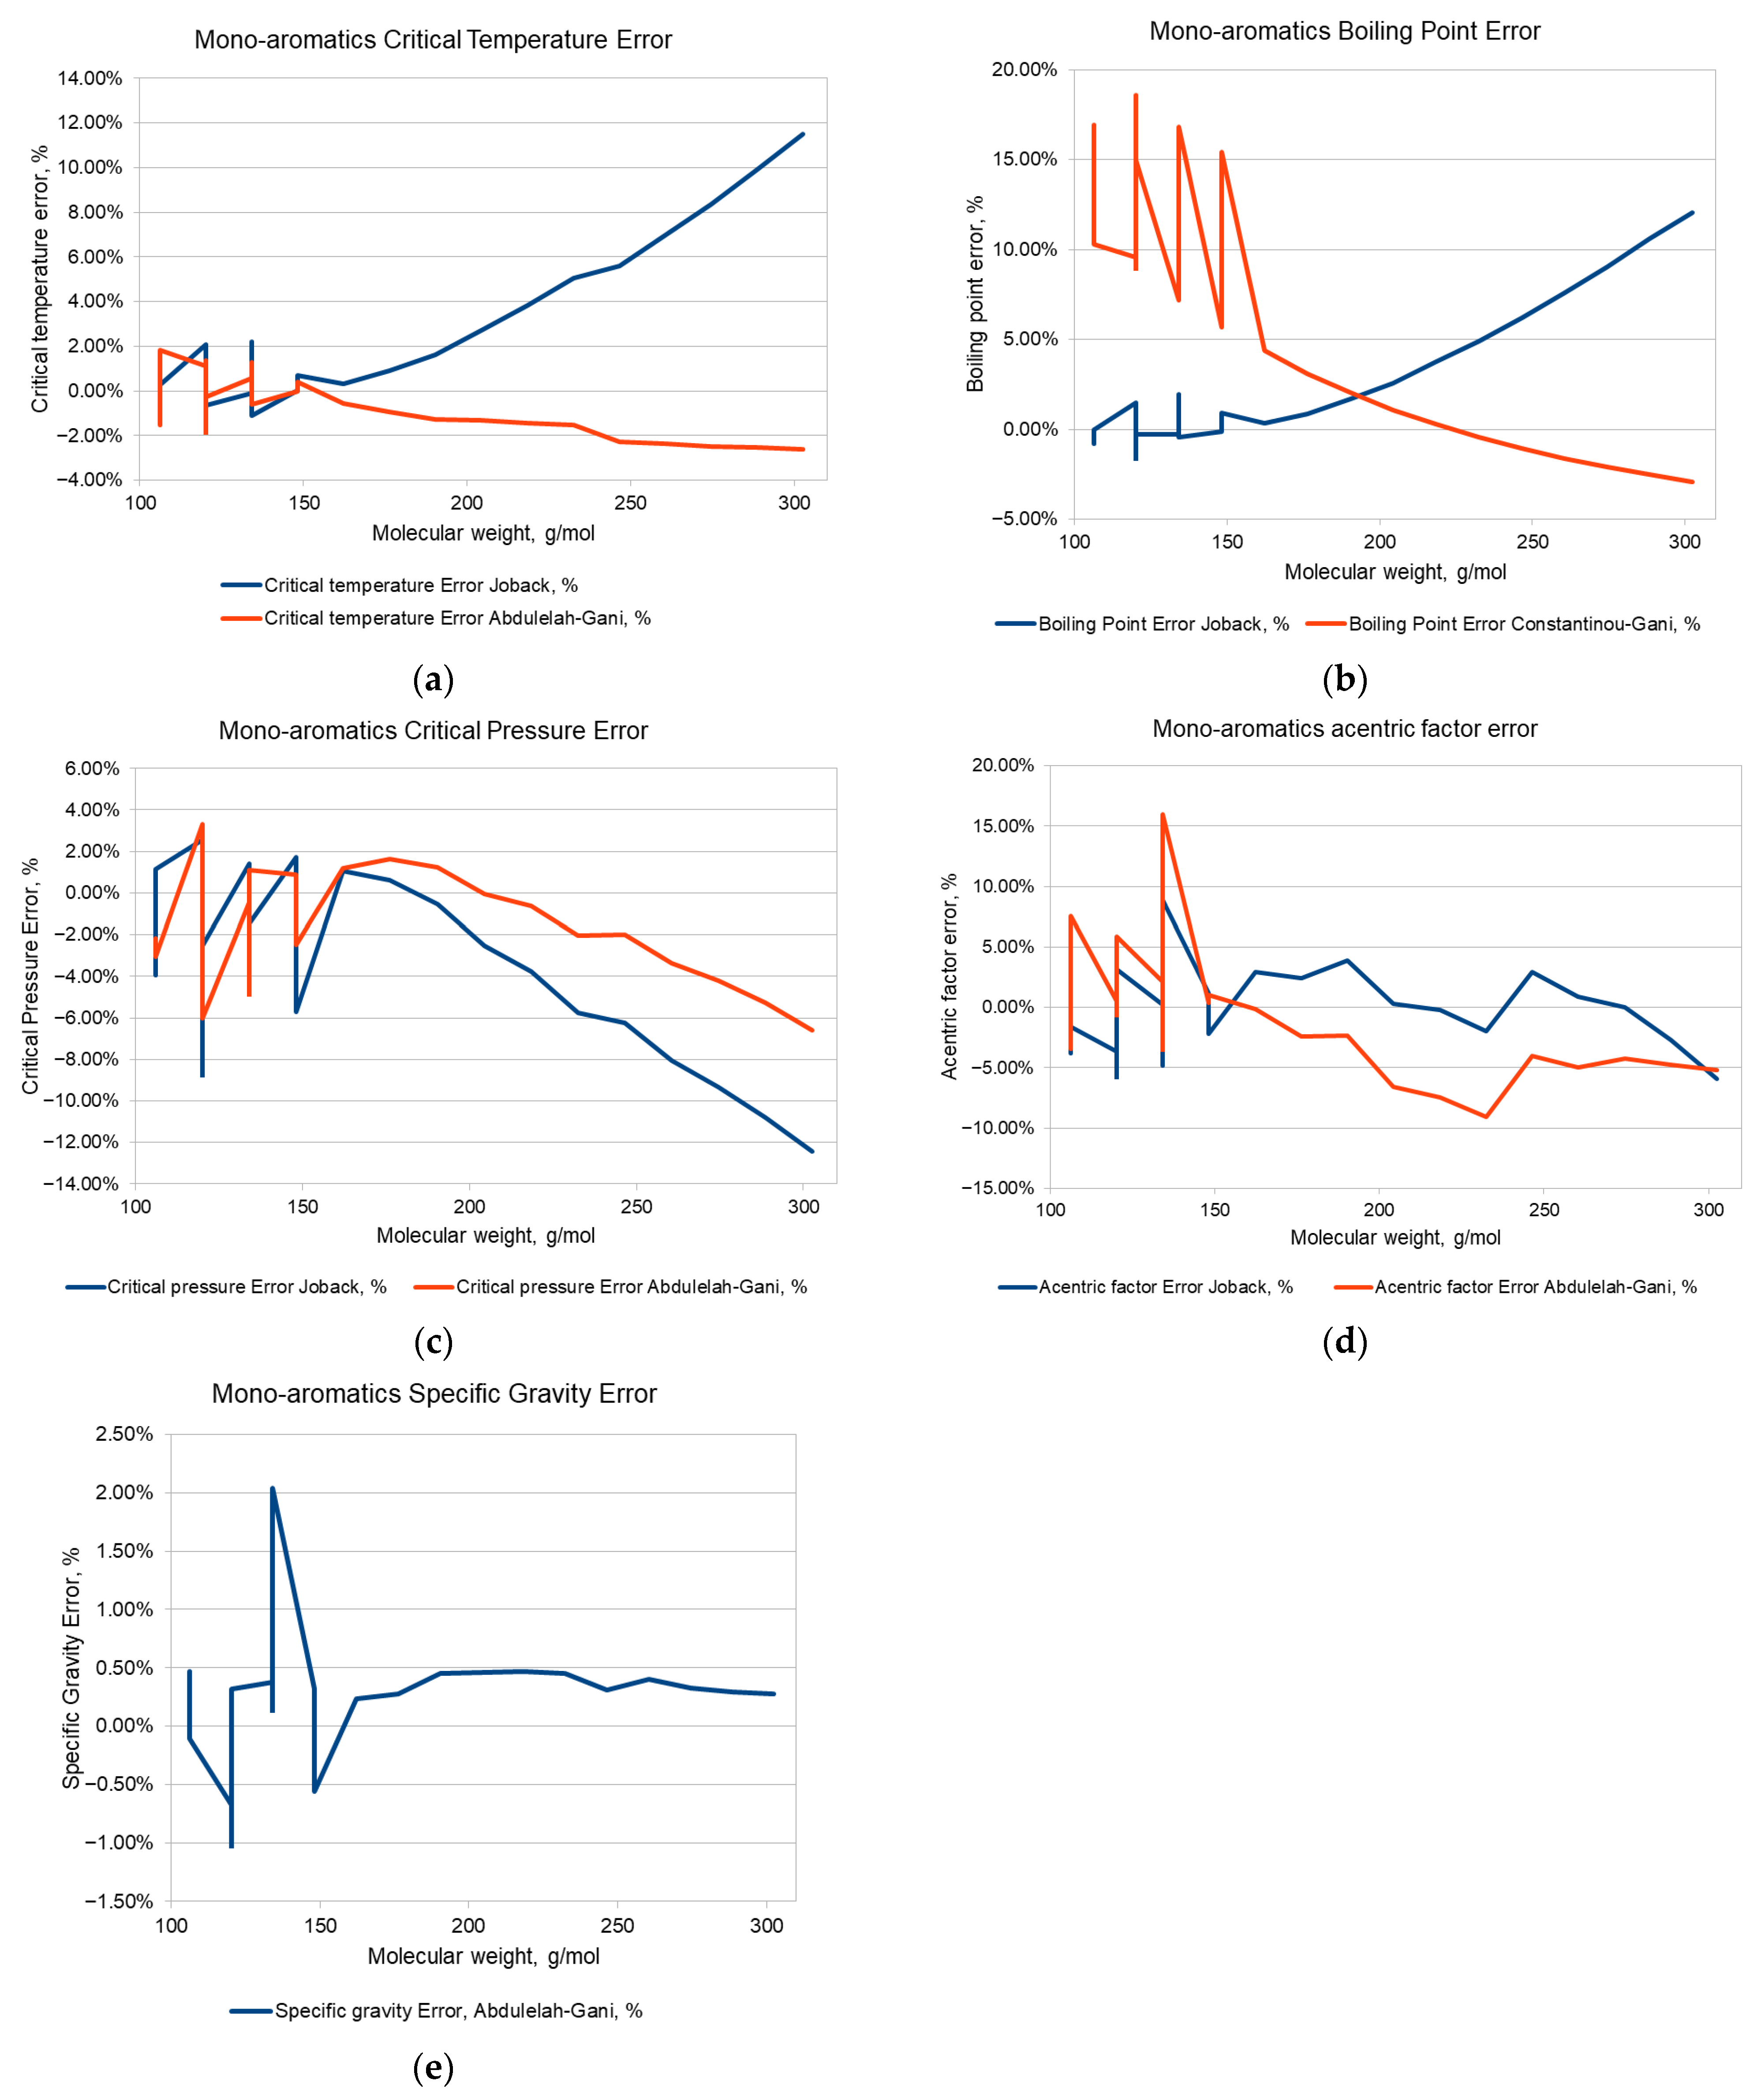
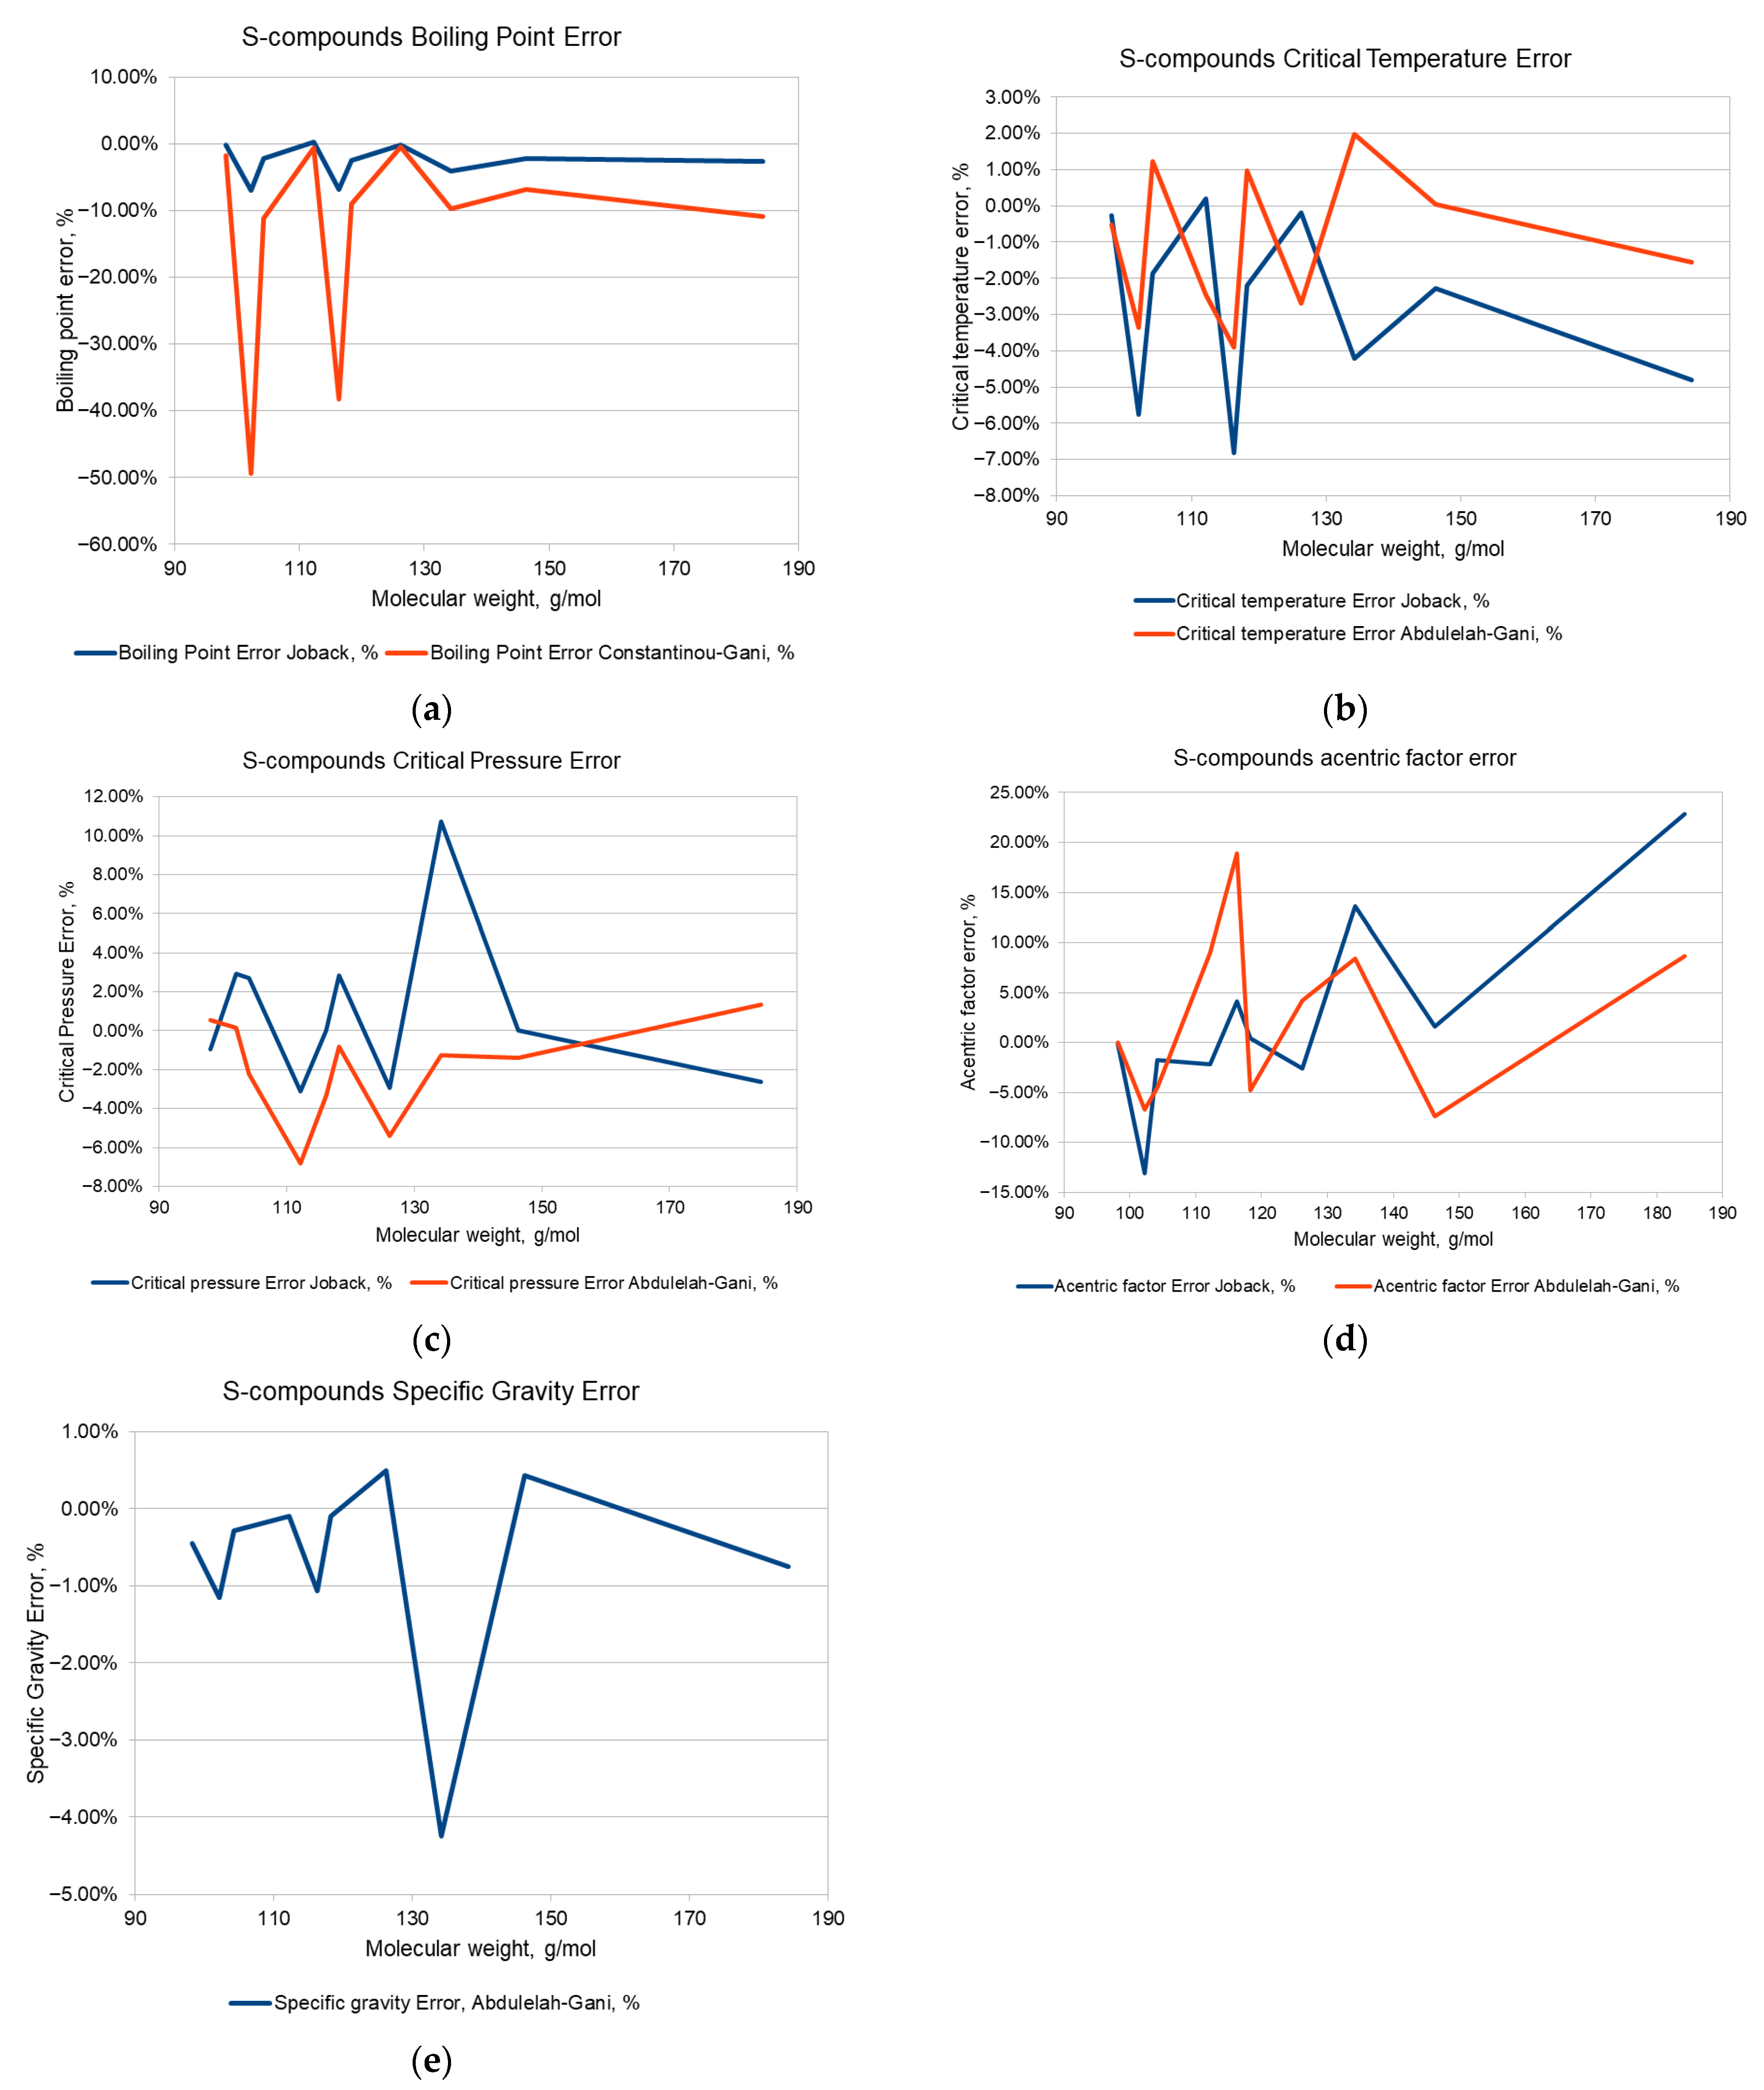
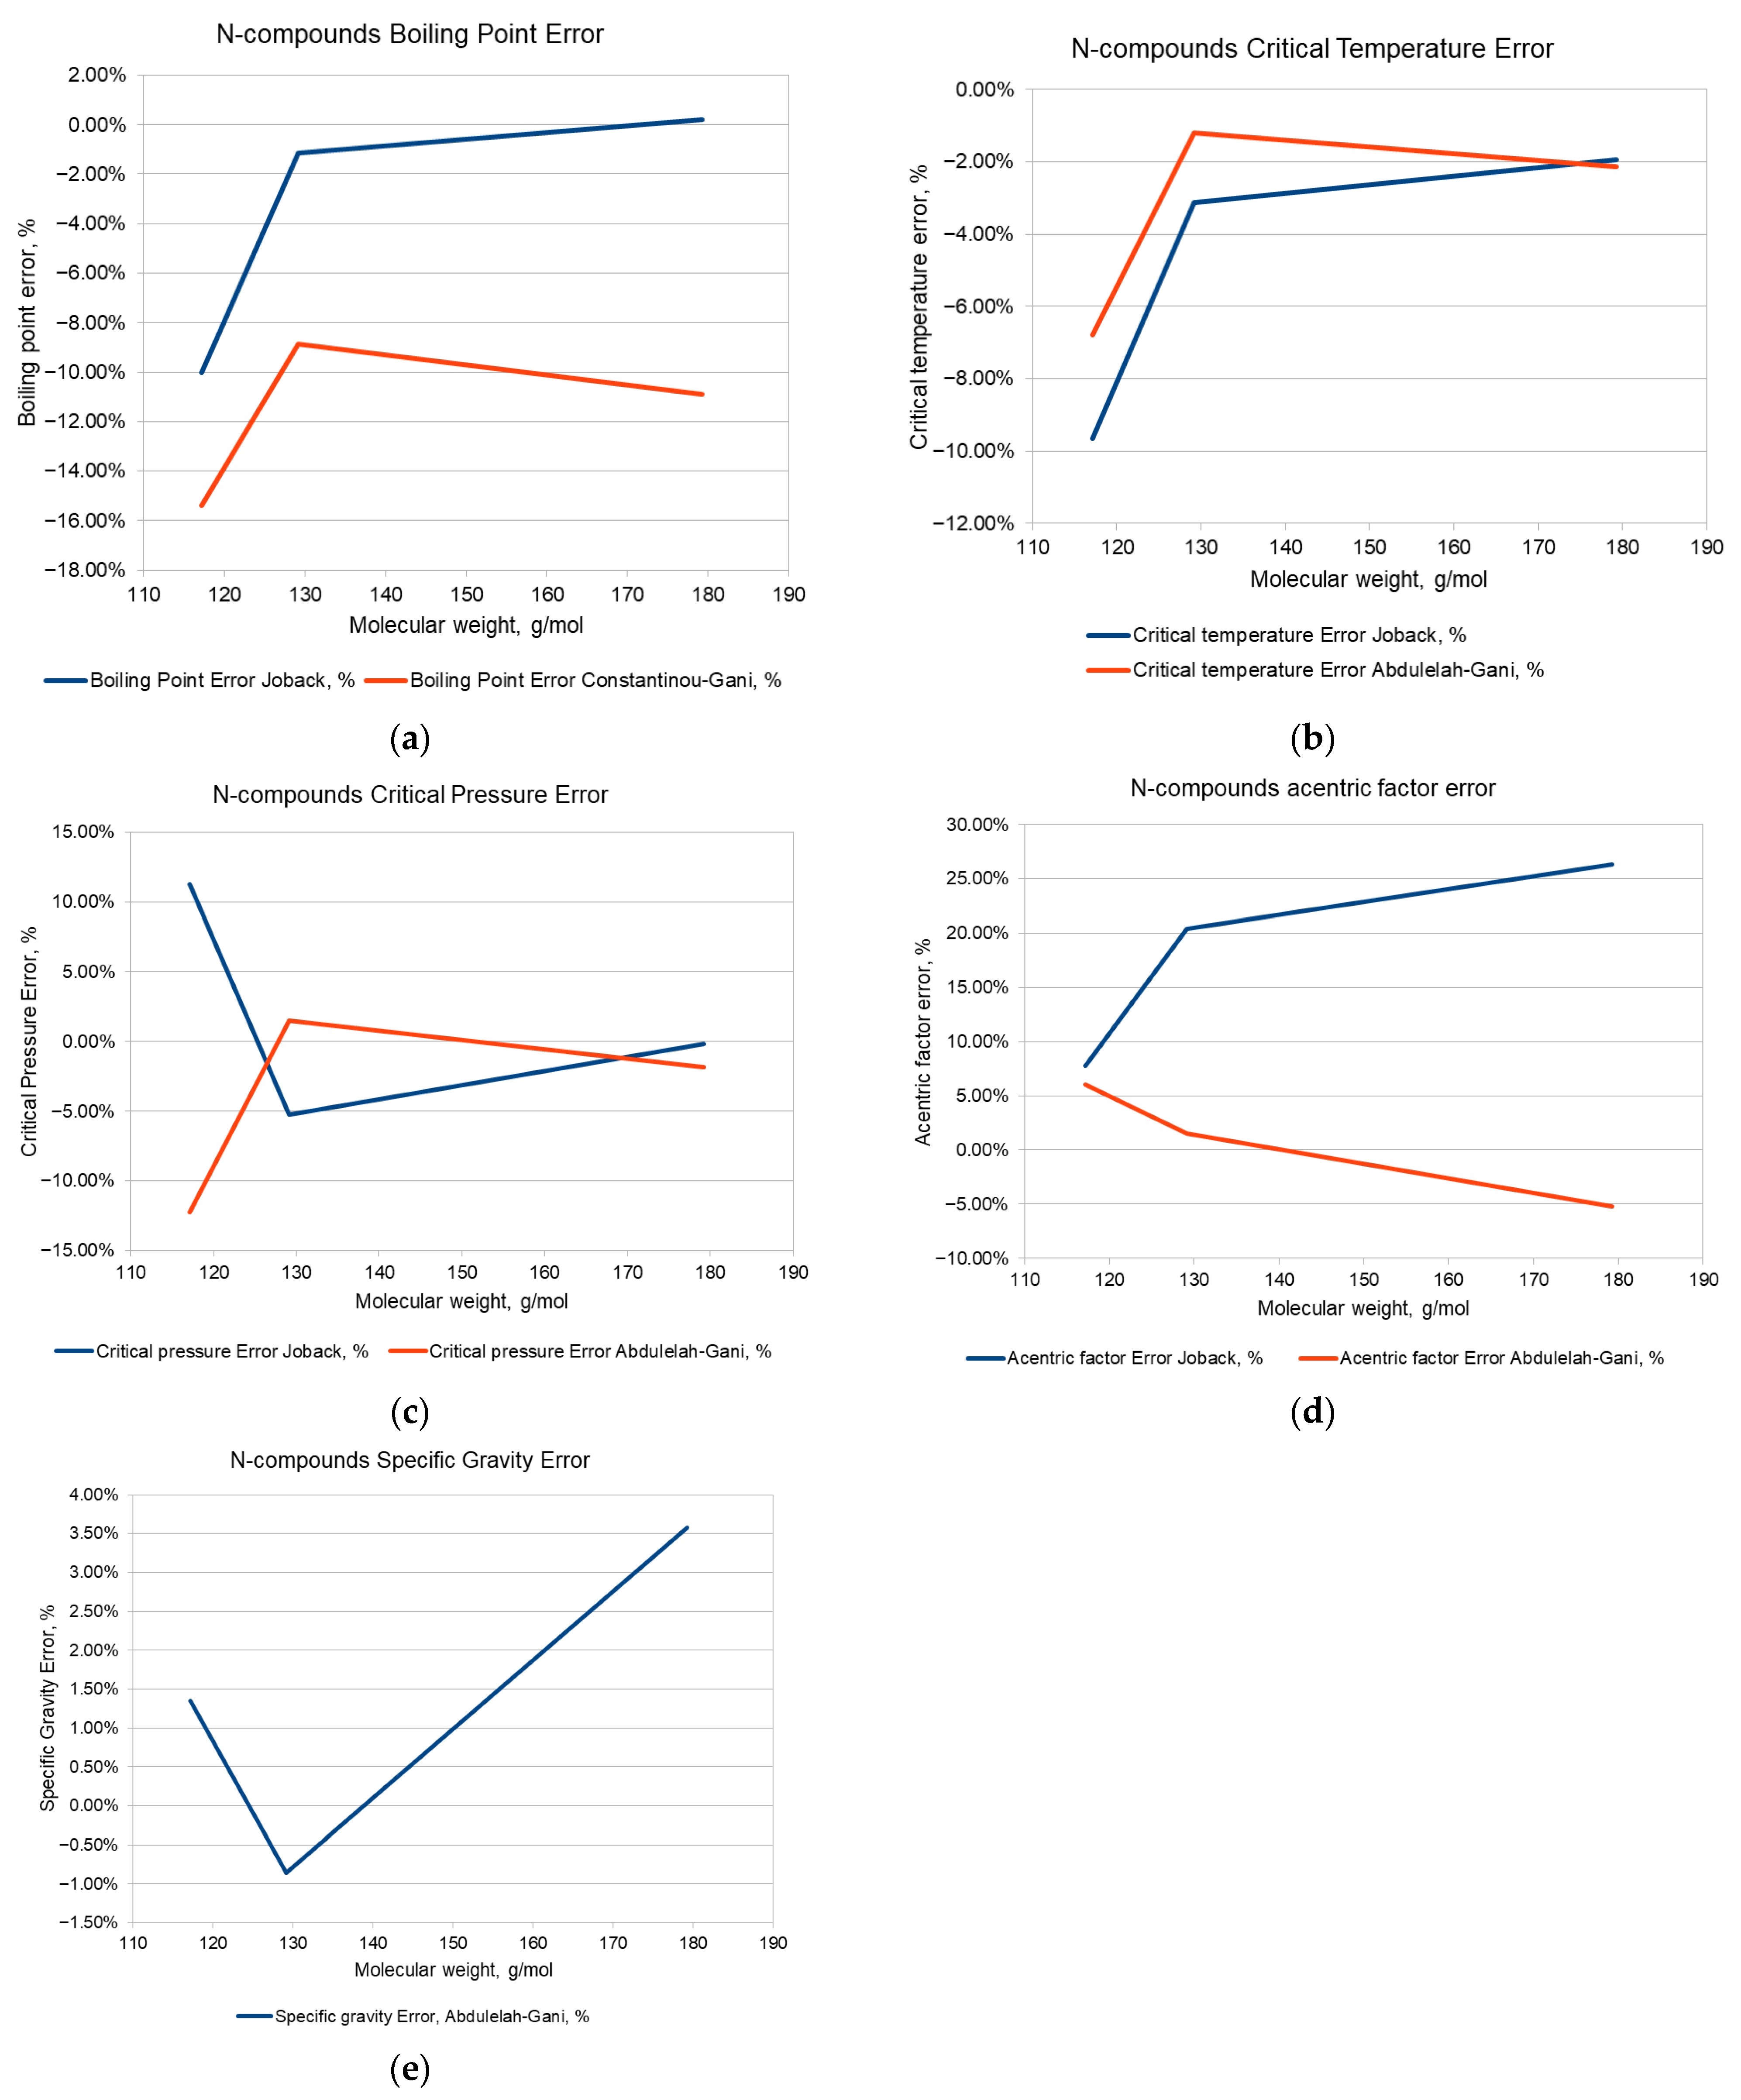
Figure 3, Figure 4, Figure 5, Figure 6, Figure 7, Figure 8 and Figure 9 show the absolute error between the predicted and the experimental normal boiling point (a), critical temperature (b), critical pressure (c), acentric factor (d) and specific gravity (e) respectively for iso-alkanes, normal alkanes, mono-aromatics, naphthenes, nitrogen-, sulfur- and oxygen-containing compounds. The absolute error is displayed as a function of the molecular weight of the compound.

3.3. Evaluating Group Contribution Methods for Diesel Components

The 139 compounds, for which experimental data was obtained, were divided into several categories:
-
Normal alkanes, consisting of 18 compounds;
-
Iso-alkanes, consisting of 8 compounds;
-
Naphthenes, consisting of 42 compounds;
-
Mono-aromatic hydrocarbons, consisting of 23 compounds;
-
Di- and tri-aromatic hydrocarbons, consisting of 14 compounds;
-
Sulfur-containing compounds, consisting of 10 compounds;
-
Nitrogen-containing compounds, consisting of 3 compounds;
-
Oxygen-containing compounds, consisting of 21 compounds.
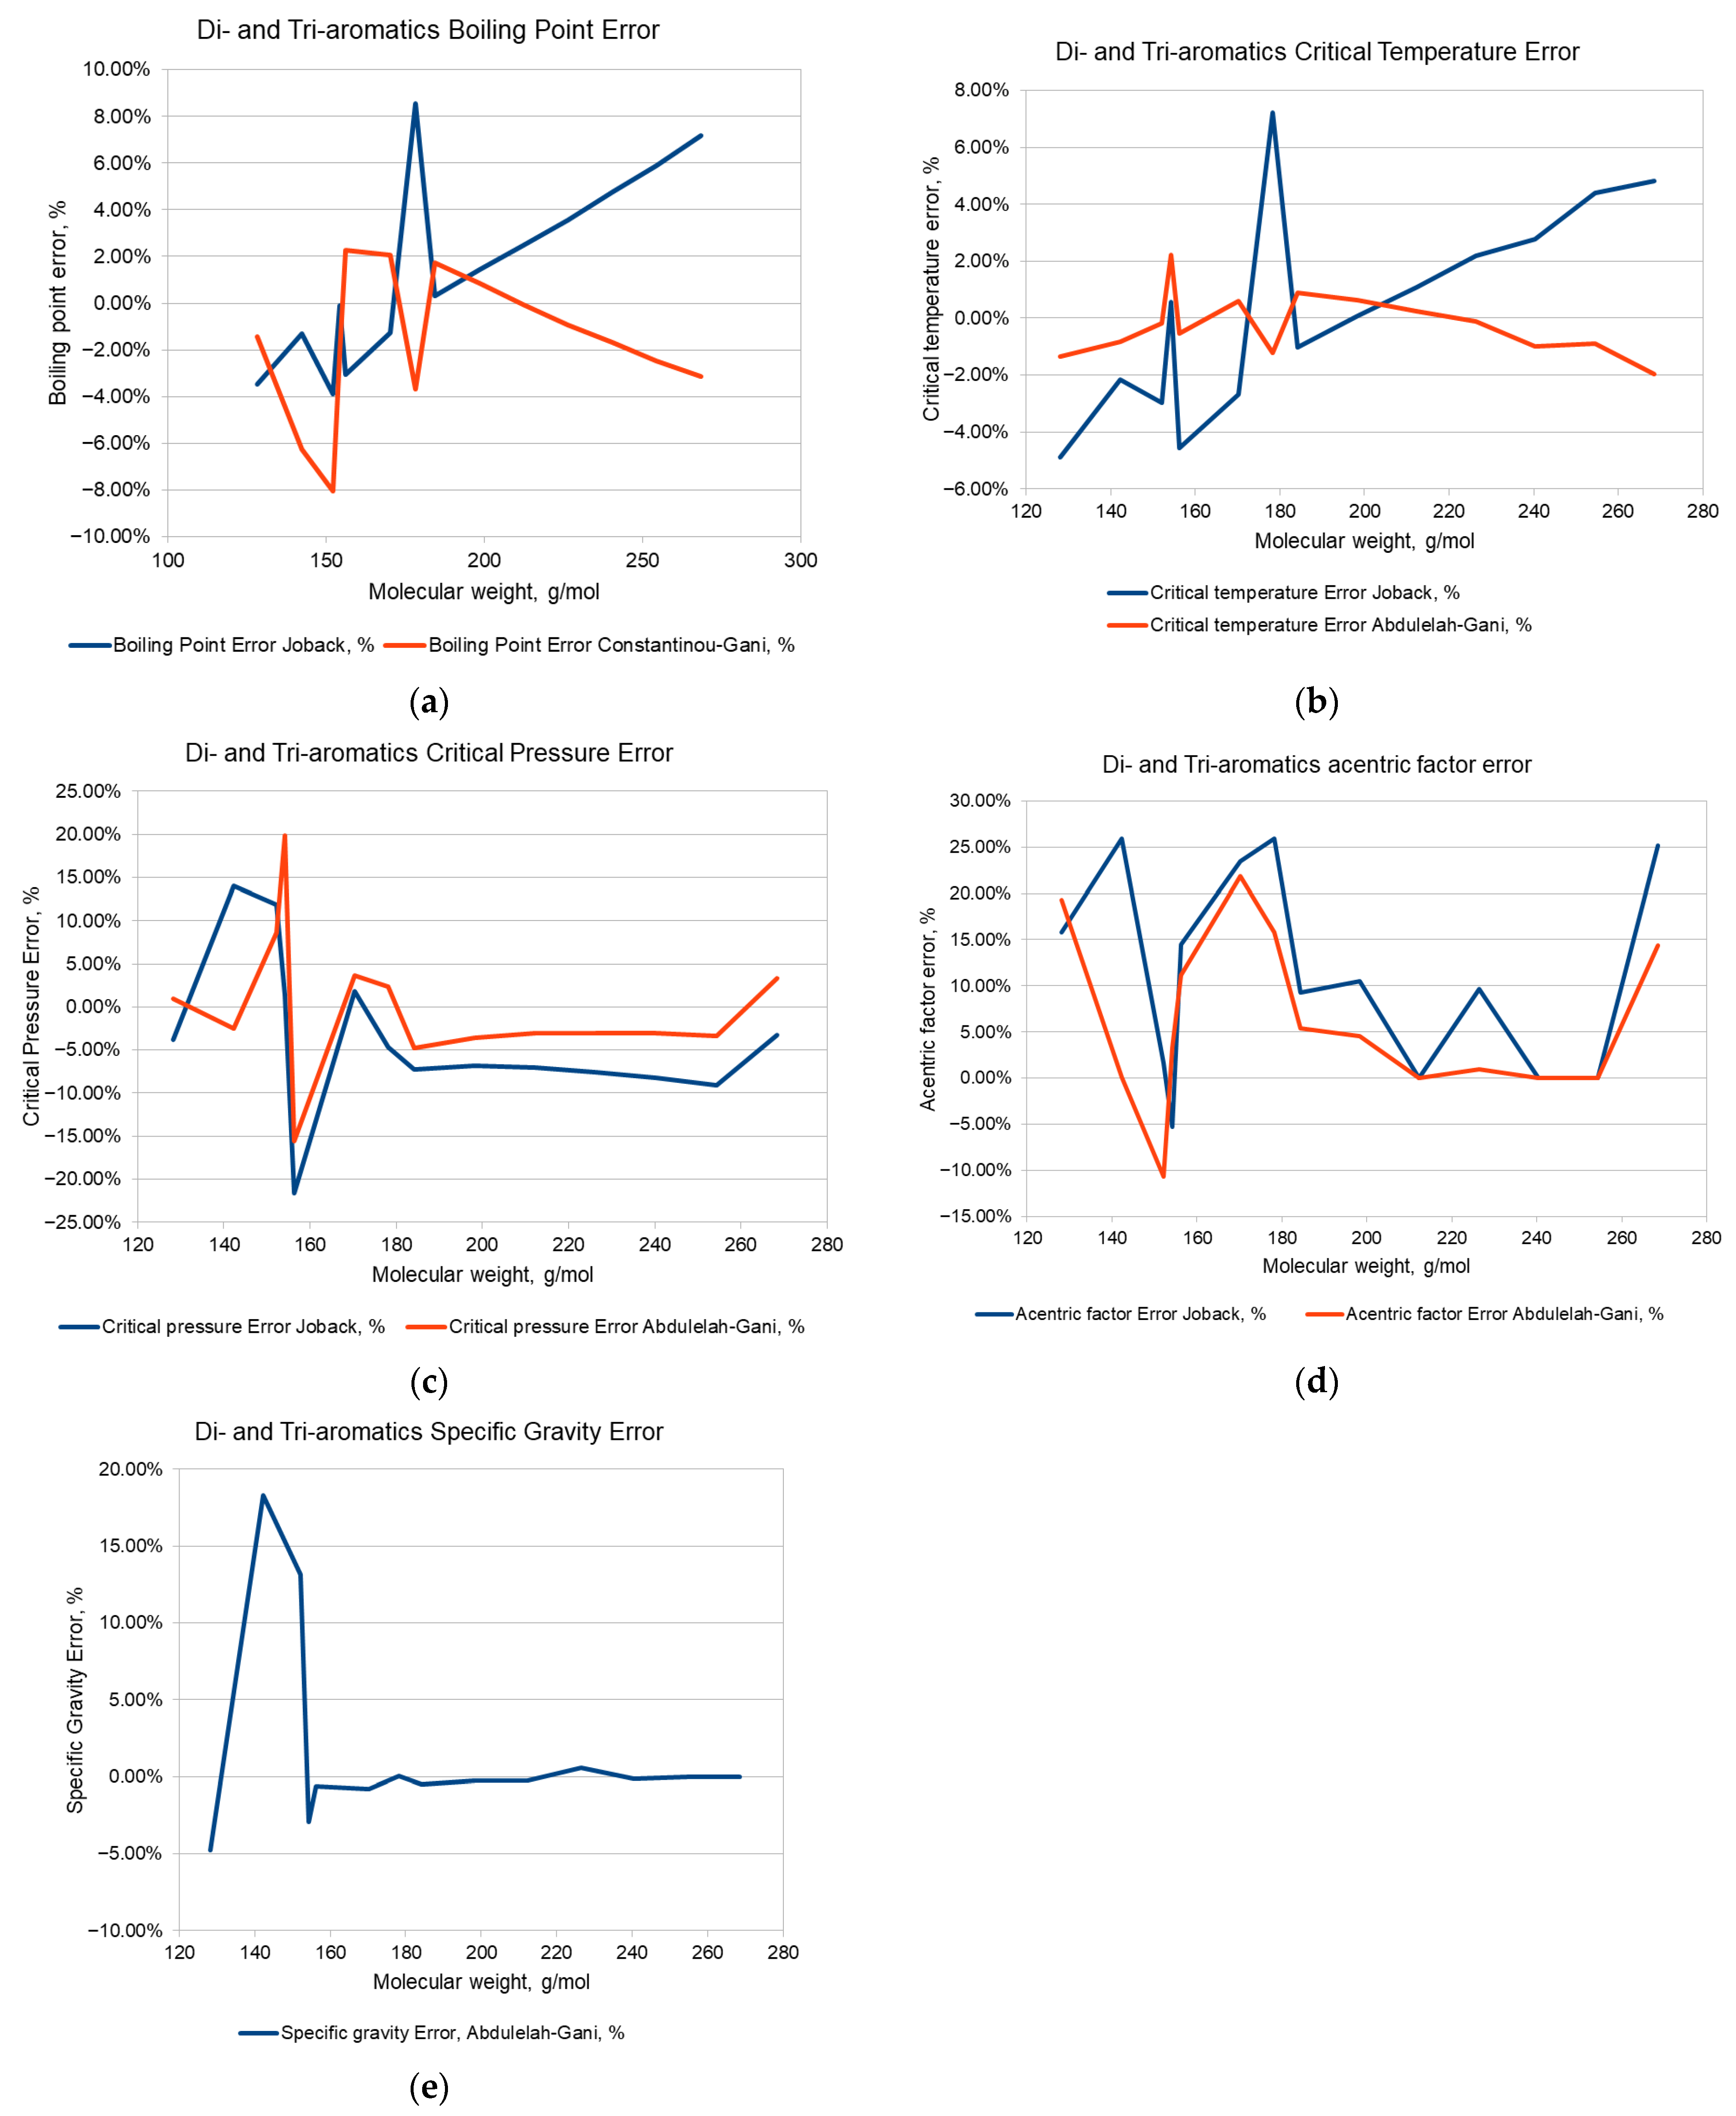
Figure 10, Figure 11, Figure 12, Figure 13, Figure 14, Figure 15, Figure 16 and Figure 17 present the absolute error between the predicted and the experimental normal boiling point (a), critical temperature (b), critical pressure (c), acentric factor (d) and specific gravity (e) respectively for normal alkanes, iso-alkanes, naphthenes, mono-aromatics, di- and tri-aromatics, sulfur-, nitrogen- and oxygen-containing compounds. The absolute error is displayed as a function of the molecular weight of the compound.

3.4. Summary of the Performance of Group Contribution Methods for Light Petroleum Fractions

The results obtained for the performance of the Joback and Reid (J&R) and Abdulelah–Gani (A&G) (Constantinou–Gani (C&G) for normal boiling point) group contribution methods are summarized in Table 4 below. The information in Table 4 contains the Average Absolute Deviation (AAD), the Maximum Absolute Deviation (MAD) and bias for each property calculated for the different compound class in the naphtha or diesel range.

4. Discussion

This study evaluated the predictive accuracy of group contribution methods for key physicochemical properties against experimental data for naphtha and diesel components. The findings reveal method-specific strengths and weaknesses, highly dependent on molecular class.

4.1. Normal Boiling Point Prediction

The normal boiling point (NBP) is a critical property, as it is directly used to fit the molecular composition to the experimental distillation curve. Our analysis shows distinct trends:
Alkanes: The Joback and Reid (J&R) method shows increasing error with molecular weight for n-alkanes, a trend less pronounced in the Constantinou–Gani (C&G) method. For iso-alkanes, both methods show decreasing error with increasing molecular weight.
Naphthenes: Prediction accuracy is poorer for the J&R method, while the C&G method maintains a more consistent, though not always superior, performance.
Aromatics: For mono-aromatics, the C&G method improves with molecular weight, whereas the J&R method becomes less accurate. For di- and tri-aromatics, absolute error fluctuates at lower molecular weights but increases significantly at higher weights, particularly for the J&R method.
Heteroatomic Compounds: The J&R method demonstrably outperforms the C&G method for sulfur-, nitrogen-, and oxygen-containing compounds. The C&G method shows large, unpredictable fluctuations in error for these classes, with peaks exceeding 50% for some sulfur compounds.
It is important to note that the C&G method (a second-order method) cannot benefit from the more precise third-order corrections available in the newer Abdulelah–Gani (A&G) method. Furthermore, the NBP calculation has not yet been implemented for the A&G method in the ugropy library.

4.2. Specific Gravity

Prediction specific gravity is another fundamental property for matching experimental bulk data. As the J&R method lacks a correlation for it, the A&G method was used exclusively. Despite using only first- and second-order groups (lacking third-order corrections), its accuracy is generally very good. The greatest deviations from experimental values were observed for naphthenes and aromatics, likely due to the absence of these higher-order corrections.

4.3. Possible Origin of the Observed Errors in the Predicted Properties for the Investigated Group Contribution Methods

In their work [29] Joback and Reid (1987) state that multiple linear regression techniques were used to determine the group contributions for each parameter. These group contributions predict the change in the calculated property in linear fashion, which is most often not an accurate assumption. An example of this is the change in the normal boiling point in compounds within a certain homologous series (n-alkanes, n-alkylbenzenes, etc.) where the normal boiling point increases in non-linear fashion. Thus, the error increases with the increase in the carbon number/molecular weight of the compound. Another drawback of the Joback and Reid method is the fact that a portion of the data used to regress the group contributions were actually estimated using additive methods during data compilation and nonexperimental sources may not have been screened out [32].
The calculation procedure in the work of Constantinou and Gani [32] uses the DIPPR databank and, additionally, experimental data of Nikitin et al. of the critical properties of heavy alkanes, not included in the DIPPR databank. The use of first- and second-order groups allows an increase in the accuracy of the predicted properties. Another important achievement of the Constantinou and Gani [32] method is the ability to distinguish isomers in calculating their properties—while first-order group contributions give the same result, the second-order correction gives more accurate results. The optimization algorithm used for the regression of group contributions in Constantinou and Gani [32] method is the modified Levenberg approach, with objective function set to minimize the sum of squares of the difference between experimental and predicted values. Another feature worth noting is that the left-hand side of the equation for normal boiling point, normal melting point and critical properties is exponential, which is expected to better represent the exponential nature of the property value within the higher molecular weight members in the homologous series. The more recent and more advanced method of Abdulelah–Gani [34] uses the same framework as the Constantinou and Gani [32] method, introducing third-order groups to fine-tune the calculation accuracy of certain molecular fragments and configurations. The root cause of errors in the Constantinou and Gani [32] and Abdulelah–Gani [34] methods can be attributed to the wide variety of components used in the dataset for each property—presence of chemicals with high polarity, presence of multiple heteroatoms, and hydrogen bonding effects which cannot be fully accounted for with group contributions.

4.4. Evaluation of the Molecular Library

A crucial finding of this work concerns the composition of the molecular library itself [35]. For the naphtha fraction (161 molecules), the inclusion of 23 nitrogen-containing and 12 oxygen-containing compounds (e.g., alcohols, carboxylic acids) is chemically unjustified. Straight-run naphtha typically contains only trace amounts of nitrogen (30–50 ppm, primarily as pyridines) and negligible oxygen; amines and acids are not present. Similarly, 30 sulfur-containing compounds are excessive for a fraction where sulfur rarely exceeds 400 ppm, and the absence of prevalent species like mercaptans is notable. This over-representation of heteroatomic species (58 components for <1 wt% of the fraction) artificially dilutes the hydrocarbon resolution.
This issue persists in the diesel fraction (885 molecules), where over 200 sulfur-containing and 200+ nitrogen/oxygen-containing compounds are used to represent heteroatom contents typically below 1 wt% and in the hundreds of ppmw, respectively. The presence of alcohols and carboxylic acids in straight-run diesel is also highly improbable.
This work underscores both the power and the limitations of current tools for the molecular modeling of petroleum fractions. The synergy of open-source molecular databases [34] and programming libraries like ugropy [38,39] provides an unprecedented foundation for research. The use of SMILES strings enables automated property prediction and database mining, significantly advancing the field.

5. Conclusions

Based on the performed calculations using both group contribution methods, that of Joback and Reid [29] (J&R) and the method of Abdulelah–Gani [34] (A&G), the following conclusions can be made:
(1)
The selection of the method for physical property estimation is critical. No single group contribution method is universally superior. The J&R method performs better for most heteroatomic compounds, while the A&G method is required for specific gravity and shows strengths for certain hydrocarbon classes. The implementation limitations of these methods in software libraries must be carefully considered.
(2)
Empirical data is preferred: For lighter fractions like naphtha and diesel, the optimal strategy is to use available experimental property data (e.g., from DIPPR, API Databook) whenever a compound is identified. Group contribution methods should serve as a fallback for missing data, not the primary source. This hybrid approach will enhance the fidelity of molecular reconstruction optimization.
(3)
Molecular library realism is paramount: The accuracy of any molecular reconstruction is contingent on the chemical realism of its underlying molecular library. The over-representation of improbable or incorrect compound classes (e.g., acids in naphtha, excessive heteroatoms) introduces significant bias. Future libraries must be rigorously validated against typical petroleum fluid compositions to ensure they reflect plausible chemistry rather than just mathematical convenience.
(4)
A persistent challenge remains in the scarcity of reliable experimental data. As noted by Joback and Reid [29], great care must be taken to avoid data contaminated by earlier predictions, a task that becomes increasingly difficult for heavier fractions where experimental data is exceedingly rare.
(5)
A possible good practice when dealing with fractions heavier than diesel, where experimental data is scarce, is to use the available methods for property prediction for pseudo-components to complement the properties calculated with the group contribution methods. Since these correlations are consistent with a wide range of molecular weights, they can be used as pivotal data to compare the predictions of the group contribution methods. If a discrepancy of more than 10% between the two calculation approaches is observed, the result of the pseudo-component correlation shall be used instead of the group contribution method result.
(6)
In future research the effect of precision of methods to calculate properties of individual molecules on the accuracy of the final petroleum reconstitution should be explored.

Author Contributions

Conceptualization, S.V. and D.S.; methodology, I.S.; software, S.S.; validation, E.S., V.G. and A.D.; formal analysis, R.N.; investigation, D.Y.; resources, D.S.; data curation, T.M.M.A.; writing—original draft preparation, S.V. and D.S.; writing—review and editing, S.V. and D.S.; visualization, S.V.; supervision, D.S.; project administration, A.D.; funding acquisition, A.D. All authors have read and agreed to the published version of the manuscript.

Funding

This study is co-financed by the European Union through the Program “Research, innovation and digitalization for smart transformation 2021–2027”, project Center of Competence “Blue Coastal Marine and Riverine Innovative & Sustainable Management of Environments and Resources (Blue Cristal)”, contract #BG16RFPR002-1.014-0016-C01.

Data Availability Statement

The original contributions presented in this study are included in the article. Further inquiries can be directed to the corresponding author(s).

Conflicts of Interest

The authors Dicho Stratiev and Ivelina Shiskova were employed by the company LUKOIL Neftohim Burgas. The remaining authors declare that the research was conducted in the absence of any commercial or financial relationships that could be construed as a potential conflicts of interest.

References

  1. British Petroleum. Statistical Review of World Energy; British Petroleum: London, UK, 2023. [Google Scholar]
  2. Broeke, T. PAC core GC portfolio. In Proceedings of the IV ROFA Symposium, Belgrade, Serbia, 7–9 May 2025. [Google Scholar]
  3. Deniz, C.U. Artificial Neural Network Modeling of the Heavy Petroleum Fractions at Molecular Level. Ph.D. Thesis, Istanbul University, Istanbul, Turkey, 2017. [Google Scholar]
  4. Qin, X.; Liu, J.; Wang, C.; Ye, L.; Xing, B.; Yu, W.; Xie, J.; Wang, H.; Ji, Y.; Lu, D. Molecular level analysis on performance of diameter expanding reactor to improve gasoline quality in FCC process. Fuel 2021, 290, 119978. [Google Scholar] [CrossRef] [Scilit]
  5. Qin, X.; Ji, Y.; Cai, G.; Wang, T.; Du, Y.; Mu, G.; Zhang, J.; Duan, X.; Pu, X.; Han, X.; et al. Molecular level simulation and analysis of removal of sulfur, nitrogen and carbon residue in residual oil hydrotreating process. Chem. Eng. J. 2025, 508, 161176. [Google Scholar] [CrossRef] [Scilit]
  6. Yang, X.; Shen, H.; Fang, G.; Ma, Q.; Cheng, S.; Yang, J. Practical molecular reconstruction method for heavy oil based on SARA fractions simulated blending. Chem. Eng. J. 2025, 508, 161050. [Google Scholar] [CrossRef] [Scilit]
  7. Xu, W.; Wang, Y.; Zhang, D.; Yang, Z.; Yuan, Z.; Lin, Y.; Yan, H.; Zhou, X.; Yang, C. Transparent AI-assisted chemical engineering process: Machine learning modeling and multi-objective optimization for integrating process data and molecular-level reaction mechanisms. J. Clean. Prod. 2024, 448, 141412. [Google Scholar] [CrossRef] [Scilit]
  8. Zhou, X.; Li, Z.; Zhang, Z.; Zhu, M.; Yan, H.; Chen, X.; Wu, L.; Yang, C. Molecular-Driven Multi-Objective optimization for direct crude oil catalytic cracking via Physics-Informed Neural Networks. Chem. Eng. Sci. 2026, 323, 123243. [Google Scholar] [CrossRef] [Scilit]
  9. Wu, Q. Core techniques of the molecular engineering and molecular management of petroleum resources and its application. Sci. Sin. Chim. 2020, 50, 173–182. [Google Scholar] [CrossRef] [Scilit]
  10. Wang, H.; Chen, Q.; Ouyang, D.; Sun, L.; Wang, Z.; Luo, G.; Tian, W.; Yang, D.; Liu, Y.; Yuan, Z. Simulation research on molecular-level overall petroleum refining process based on structure-oriented lumping. Chem. Eng. Sci. 2025, 312, 121629. [Google Scholar] [CrossRef] [Scilit]
  11. Chen, Z.; Zhao, X.; Wu, J.; Xu, C.; Zhang, L. Recent progress toward molecular-level kinetic model for complex hydrocarbon conversion processes. Chem. Eng. J. 2024, 487, 150462. [Google Scholar] [CrossRef] [Scilit]
  12. De Oliveira, L.P.; Vazquez, A.T.; Verstraete, J.J.; Kolb, M. Molecular reconstruction of petroleum fractions: Application to vacuum residues from different origins. Energy Fuels 2013, 27, 3622–3641. [Google Scholar] [CrossRef] [Scilit]
  13. Hudebine, D.; Verstraete, J.J. Reconstruction of petroleum feedstocks by entropy maximization. Application to FCC gasolines. Oil Gas. Sci. Technol. 2011, 66, 437–460. [Google Scholar] [CrossRef] [Scilit]
  14. Ahmad, M.I.; Zhang, N.; Jobson, M. Molecular components-based representation of petroleum fractions. Chem. Eng. Res. Des. 2011, 89, 410–420. [Google Scholar] [CrossRef] [Scilit]
  15. Ren, Y.; Liao, Z.; Sun, J.; Jiang, B.; Wang, J.; Yang, Y.; Wu, Q. Molecular reconstruction of naphtha via limited bulk properties: Methods and comparisons. Ind. Eng. Chem. Res. 2019, 58, 18742–18755. [Google Scholar] [CrossRef] [Scilit]
  16. Feng, S.; Cui, C.; Li, K.; Zhang, L.; Shi, Q.; Zhao, S.; Xu, C. Molecular composition modelling of petroleum fractions based on a hybrid structural unit and bond-electron matrix (SU-BEM) framework. Chem. Eng. Sci. 2019, 201, 145–156. [Google Scholar] [CrossRef] [Scilit]
  17. Chen, J.; Fang, Z.; Qiu, T. Molecular reconstruction model based on structure oriented lumping and group contribution methods. Chin. J. Chem. Eng. 2018, 26, 1677–1683. [Google Scholar] [CrossRef] [Scilit]
  18. Ren, Y.; Liao, Z.; Sun, J.; Jiang, B.; Wang, J.; Yang, Y.; Wu, Q. Molecular reconstruction: Recent progress toward composition modeling of petroleum fractions. Chem. Eng. J. 2019, 357, 761–775. [Google Scholar] [CrossRef] [Scilit]
  19. Vasilev, S.; Stratiev, D.; Shishkova, I.; Dinkov, R.; Yordanov, D.; Abdellatief, T.M.M.; Sotirov, S.; Sotirova, E.; Dimitrov, A.; Georgieva, V.; et al. Oil Characterization, Molecular Modelling and Process Simulation in Petroleum Research and Industry, Opportunities, Challenges and Perspectives. Molecules 2026, 31, 1645. [Google Scholar] [CrossRef] [Scilit]
  20. Calculating PVT Properties. Available online: https://onepetro.org/spe/general-information/1296/Calculating-PVT-properties (accessed on 24 April 2026).
  21. Keßler, T.; Kunde, C.; Linke, S.; McBride, K.; Sundmacher, K.; Kienle, A. Computer Aided Molecular Design of Green Solvents for the Hydroformylation of Long-Chain Olefines. In Proceedings of the 30 European Symposium on Computer Aided Process Engineering (ESCAPE30), Milano, Italy, 24–27 May 2020. [Google Scholar] [CrossRef] [Scilit]
  22. Gani, R. Group contribution-based property estimation methods: Advances and perspectives. Curr. Opin. Chem. Eng. 2019, 23, 184–196. [Google Scholar] [CrossRef] [Scilit]
  23. Jaffe, S.B.; Freund, H.; Olmstead, W.N. Extension of structure-oriented lumping to vacuum residua. Ind. Eng. Chem. Res. 2005, 44, 9840–9852. [Google Scholar] [CrossRef] [Scilit]
  24. Altgelt, K.; Boduszynski, M. Composition and Analysis of Heavy Petroleum Fractions, 1st ed.; CRC Press: Boca Raton, FL, USA, 2014. [Google Scholar]
  25. Riazi, M.R. Characterization and Properties of Petroleum Fractions, 1st ed.; ASTM International: West Conshohocken, PA, USA, 2005; pp. 1–407. [Google Scholar]
  26. Song, W.; Gong, Y.; Zhang, N. Database integrated molecular characterization framework for full-range petroleum fractions. Energy Fuels 2025, 39, 20213–20227. [Google Scholar] [CrossRef] [Scilit]
  27. Lydersen, A.L. Estimation of Critical Properties of Organic Compounds; University of Wisconsin: Madison, WI, USA, 1955. [Google Scholar]
  28. Ambrose, D. National Physical Laboratory Report Chemistry 92; National Physical Laboratory: London, UK, 1978. [Google Scholar]
  29. Joback, K.G.; Reid, R.C. Estimation of pure component properties from group-contributions. Chem. Eng. Commun. 1987, 57, 233–243. [Google Scholar] [CrossRef] [Scilit]
  30. Fernandes, D.T.; Klock da Costa, K.; Maciel, H.S.; Pinto Gonçalves, R.L.; Noriler, D. MAG-SOLex molecular representation: A methodology for handling complex molecules in algorithms. ACS Omega 2025, 10, 5645–5658. [Google Scholar] [CrossRef] [Scilit] [PubMed]
  31. Bang, S.H.; Lim, S.J.; Taeseon, Y. Boiling point estimation program especially for aromatic compounds supplementing the Joback method. Int. J. Chem. Eng. Appl. 2014, 5(4), 331–334. [Google Scholar] [CrossRef] [Scilit]
  32. Constantinou, L.; Gani, R. New group contribution method for estimating properties of pure compounds. AIChE J. 1994, 40, 1697–1710. [Google Scholar] [CrossRef] [Scilit]
  33. Marrero, J.; Gani, R. Group-contribution based estimation of pure component properties. Fluid Ph. Equilib. 2001, 183–184, 183–208. [Google Scholar] [CrossRef] [Scilit]
  34. Alshehri, A.S.; Tula, A.K.; You, F.; Gani, R. Next generation pure component property estimation models: With and without machine learning techniques. AIChE J. 2022, 68, e17469. [Google Scholar] [CrossRef] [Scilit]
  35. Pure Component Property Estimation Website for Abdulelah-Gani Method. Available online: https://github.com/PEESEgroup/Pure-Component-Property-Estimation (accessed on 20 April 2026).
  36. Xie, Z.; Wu, Y.; Chen, Z.; Zhang, L. Crude oil molecular reconstruction based on bulk property evaluation data. Chem. Eng. Sci. 2026, 322, 123880. [Google Scholar] [CrossRef] [Scilit]
  37. Crude Oil Molecular Model. Available online: https://github.com/IntelligentMolecularEngineering/CrudeOilMolModel (accessed on 20 April 2026).
  38. Brandolín, S.E.; Benelli, F.E.; Ivana, M.; Scilipoti, J. Ugropy: An Extensible Python Package for Thermodynamic Model Functional Group Identification via Mathematical Optimization. Ind. Eng. Chem. Res. 2025, 64, 17217–17227. [Google Scholar] [CrossRef] [Scilit]
  39. Ugropy Python Library, Version 3.1.6. Available online: https://github.com/ipqa-research/ugropy (accessed on 20 April 2026).
  40. PubChemPy Python Library. Available online: https://github.com/mcs07/PubChemPy (accessed on 20 April 2026).
  41. DIPPR Website. Available online: https://www.aiche.org/dippr (accessed on 20 April 2026).
  42. Technical Data Book–Petroleum Refining, 6th ed.; American Petroleum Institute: Washington, DC, USA, 1997.
Figure 1. Physical property estimation for 4,6-dimethyl-1-ethylnaphthalene using the Joback and Reid method [29].
Processes 14 01606 g001
Figure 2. Group contributions for pyrene using the Marrero and Gani method [33].
Processes 14 01606 g002
Figure 3. Absolute error between the predicted and experimental properties for iso-alkanes, boiling in naphtha range, using the Joback and Reid and Abdulelah–Gani group contribution methods: normal boiling point (a), critical temperature (b), critical pressure (c), acentric factor (d) and specific gravity (e).
Processes 14 01606 g003aProcesses 14 01606 g003b
Figure 4. Absolute error between the predicted and experimental properties for normal alkanes, boiling in naphtha range, using the Joback and Reid and Abdulelah–Gani group contribution methods: normal boiling point (a), critical temperature (b), critical pressure (c), acentric factor (d) and specific gravity (e).
Processes 14 01606 g004aProcesses 14 01606 g004b
Figure 5. Absolute error between the predicted and experimental properties for mono-aromatics, boiling in naphtha range, using the Joback and Reid and Abdulelah–Gani group contribution methods: normal boiling point (a), critical temperature (b), critical pressure (c), acentric factor (d) and specific gravity (e).
Processes 14 01606 g005aProcesses 14 01606 g005b
Figure 6. Absolute error between the predicted and experimental properties for naphthenes, boiling in naphtha range, using the Joback and Reid and Abdulelah–Gani group contribution methods: normal boiling point (a), critical temperature (b), critical pressure (c), acentric factor (d) and specific gravity (e).
Processes 14 01606 g006aProcesses 14 01606 g006b
Figure 7. Absolute error between the predicted and experimental properties for nitrogen-containing compounds, boiling in naphtha range, using the Joback and Reid and Abdulelah–Gani group contribution methods: normal boiling point (a), critical temperature (b), critical pressure (c), acentric factor (d) and specific gravity (e).
Processes 14 01606 g007aProcesses 14 01606 g007b
Figure 8. Absolute error between the predicted and experimental properties for sulfur-containing compounds, boiling in naphtha range, using the Joback and Reid and Abdulelah–Gani group contribution methods: normal boiling point (a), critical temperature (b), critical pressure (c), acentric factor (d) and specific gravity (e).
Processes 14 01606 g008aProcesses 14 01606 g008b
Figure 9. Absolute error between the predicted and experimental properties for oxygen-containing compounds, boiling in naphtha range, using the Joback and Reid and Abdulelah–Gani group contribution methods: normal boiling point (a), critical temperature (b), critical pressure (c), acentric factor (d) and specific gravity (e).
Processes 14 01606 g009aProcesses 14 01606 g009b
Figure 10. Absolute error between the predicted and experimental properties for normal alkanes, boiling in diesel range, using the Joback and Reid and Abdulelah–Gani group contribution methods: normal boiling point (a), critical temperature (b), critical pressure (c), acentric factor (d) and specific gravity (e).
Processes 14 01606 g010
Figure 11. Absolute error between the predicted and experimental properties for iso-alkanes, boiling in diesel range, using the Joback and Reid and Abdulelah–Gani group contribution methods: normal boiling point (a), critical temperature (b), critical pressure (c), acentric factor (d) and specific gravity (e).
Processes 14 01606 g011
Figure 12. Absolute error between the predicted and experimental properties for naphthenes, boiling in diesel range, using the Joback and Reid and Abdulelah–Gani group contribution methods: normal boiling point (a), critical temperature (b), critical pressure (c), acentric factor (d) and specific gravity (e).
Processes 14 01606 g012
Figure 13. Absolute error between the predicted and experimental properties for mono-aromatics, boiling in diesel range, using the Joback and Reid and Abdulelah–Gani group contribution methods: normal boiling point (a), critical temperature (b), critical pressure (c), acentric factor (d) and specific gravity (e).
Processes 14 01606 g013
Figure 14. Absolute error between the predicted and experimental properties for di and tri-aromatics, boiling in diesel range, using the Joback and Reid and Abdulelah–Gani group contribution methods: normal boiling point (a), critical temperature (b), critical pressure (c), acentric factor (d) and specific gravity (e).
Processes 14 01606 g014
Figure 15. Absolute error between the predicted and experimental properties for sulfur-containing compounds, boiling in diesel range, using the Joback and Reid and Abdulelah–Gani group contribution methods: normal boiling point (a), critical temperature (b), critical pressure (c), acentric factor (d) and specific gravity (e).
Processes 14 01606 g015
Figure 16. Absolute error between the predicted and experimental properties for nitrogen-containing compounds, boiling in diesel range, using the Joback and Reid and Abdulelah–Gani group contribution methods: normal boiling point (a), critical temperature (b), critical pressure (c), acentric factor (d) and specific gravity (e).
Processes 14 01606 g016
Figure 17. Absolute error between the predicted and experimental properties for oxygen-containing compounds, boiling in diesel range, using the Joback and Reid and Abdulelah–Gani group contribution methods: normal boiling point (a), critical temperature (b), critical pressure (c), acentric factor (d) and specific gravity (e).
Processes 14 01606 g017
Table 1. Constants used in Equation (5) for calculating various physical properties.
Calculated PropertyApplicable RangeConstants in Equation (5)
θθabc
Constants for physical properties of n-alkanes
Melting point Tm, KC5–C403976.50960.141870.470
Normal boiling point, Tb, KC5–C4010706.982910.020132/3
Specific gravity SGC5–C190.8592.2279389.823010.01
Density at 20 °C, d20 g/cm3C5–C400.85988.0137985.74460.01
Refractive index parameter IC5–C400.283387.659386.621670.01
Reduced boiling pointC5–C201.15−0.419660.024360.58
Tbr = Tb/Tc
Critical pressure, −Pc, barC5–C2004.657570.134230.5
Critical density, −dc, g/cm3C5–C200.26−3.505321.5 × 10−62.38
Acentric factor, −ωC5–C200.3−3.06826−1.049870.2
Constants for physical properties of n-alkylcyclopentanes
Melting point Tm, KC7–C473706.525040.049452/3
Normal boiling point, Tb, KC6–C4110286.956490.022392/3
Specific gravity SGC7–C250.85397.7253295.735890.01
Density at 20 °C, d20 g/cm3C5–C410.85785.182483.657580.01
Refractive index parameter IC5–C410.28387.5523886.975560.01
Reduced boiling pointC5–C181.20.067650.137630.35
Tbr = Tb/Tc
Critical pressure, −Pc, barC6–C1807.258571.131390.26
Critical density, −dc, g/cm3C6–C20−0.255−3.188460.16580.5
Acentric factor, −ωC6–C200.3−8.25682−5.339340.08
Constants for physical properties of n-alkylcyclohexanes
Melting point Tm, KC7–C203606.559420.046810.7
Normal boiling point, Tb, KC6–C2011007.002750.019772/3
Specific gravity SGC6–C200.845−1.515180.051820.7
Density at 20 °C, d20 g/cm3C6–C210.84−1.584890.050960.7
Refractive index parameter IC6–C200.277−2.455120.056360.7
Reduced boiling pointC6–C201.032−0.110950.13630.4
Tbr = Tb/Tc
Critical pressure, −Pc, barC6–C20012.31075.533660.1
Critical density, −dc, g/cm3C6–C20−0.15−1.861060.006620.8
Acentric factor, −ωC7–C200.6−5.00861−3.048680.1
Constants for physical properties of n-alkylbenzenes
Melting point Tm, KC9–C423756.535990.049122/3
Normal boiling point, Tb, KC6–C4210156.910620.022472/3
Specific gravity, −SGC6–C20−0.8562224.7257218.5180.01
Density at 20 °C, −d20 g/cm3C6–C42−0.854238.791232.3150.01
Refractive index parameter, −IC6–C42−0.2829137.0918135.4330.01
Reduced boiling pointC6–C201.03−0.298750.068140.5
Tbr = Tb/Tc
Critical pressure, −Pc, barC6–C2009.779683.075550.15
Critical density, −dc, g/cm3C6–C20−0.22−1.430830.127440.5
Acentric factor, −ωC6–C200−14.97−9.483450.08
Table 2. Calculated properties for 4,6-dimethyl-1-ethylnaphthalene using the Joback and Reid method [29] and comparison with the experimental values.
Calculated PropertyGroupContributionValueCalculated ValueExperimental Value
Normal Boiling Point, Tb [K]-CH3323.58Σ = 338.19
Tb = 536.39 K
Tb = 585.41 K
-CH2122.88
aCH521.78
aC(cond)221.32
aC(subst)331.01
Critical Temperature, Tc [K]-CH330.0141Σ = 0.1735
Tc = 743.34 K
Tc = 811.44 K
-CH210.0189
aCH50.01
aC(cond)20.0042
aC(subst)30.0082
Critical Pressure, Pc [bar]-CH33−0.0012Σ = 0.013
Pc = 26.03 bar
Pc = 24.24 bar
-CH210
aCH50.0004
aC(cond)20.0061
aC(subst)30.0008
Critical Volume, Vc [cm3/mol]-CH3365Σ = 591
Vc = 608.5 cm3/mol
Vc = 633.5 cm3/mol
-CH2156
aCH538
aC(cond)227
aC(subst)332
Normal Melting point, Tm [K]-CH33−5.1Σ = 326.73
Tm = 449.23 K
Tm = 333.04 K
-CH2111.27
aCH519.88
aC(cond)260.15
aC(subst)337.02
Table 3. Calculated normal boiling point and normal melting point for pyrene using the Marrero and Gani method [33] and comparison with the experimental values.
Physical PropertyGroupsGroup Occurrences × Contribution
Normal Boiling Point [K]First-order groups
aC (fused with aromatic ring)
aCH
Σi Ni Tb1i = 18.7593
Second-order groups
none
Third-order groups
AROMFUSED [3]
AROMFUSED [4p]
Σk Ok Tb3k = 1.9056
Tb = Tb0 ln (Σi Ni Tb1i + Σj Mj Tb2j + Σk Ok Tb3k)
Tb = 222.543 ln (18.7593 + 0 + 1.9056)
Tb = 673.96 K
Tb (experimental) = 677.15 K
1.7324 × 6
0.8365 × 10
0.0402 × 2
0.9126 × 2
Normal Melting Point [K]First-order groups
aC (fused with aromatic ring)
aCH
Σi Ni Tm1i = 17.233
Second-order groups
none
Third-order groups
AROMFUSED [3]
AROMFUSED [4p]
Σk Ok Tm3k = 0.1488
Tm = Tm0 ln (Σi Ni Tm1i + Σj Mj Tm2j + Σk Ok Tm3k)
Tm = 147.45 ln (17.233 + 0 + 0.1488)
Tm = 421.03 K
Tm (experimental) = 423.77 K
1.8955 × 6
0.5860 × 10
1.6600 × 2
−1.5856 × 2
Table 4. Performance of the Joback and Reid and Abdulelah–Gani group contribution methods for the calculated properties across different classes of compounds.
Bias, %MAD, %AAD, %RangeProperty/MethodCompound Class
−0.19%16.07%4.54%naphthaNormal Boiling Point, J&R N-alkanes
2.83%14.30%5.37%diesel
−0.62%12.12%2.62%naphthaNormal Boiling Point, C&G
−1.87%5.08%1.97%diesel
−0.34%15.64%4.47%naphthaCritical Temperature, J&R
2.88%16.39%5.82%diesel
−2.27%15.03%2.93%naphthaCritical Temperature, A&G
−0.99%1.51%0.53%diesel
1.03%4.66%2.14%naphthaCritical Pressure, J&R
−8.14%19.58%5.54%diesel
2.14%4.25%1.33%naphthaCritical Pressure, A&G
−2.14%11.12%3.87%diesel
5.17%14.69%2.74%naphthaAcentric Factor, J&R
−5.47%33.92%9.87%diesel
−0.91%21.20%7.76%naphthaAcentric Factor, A&G
−7.57%9.57%1.25%diesel
1.77%10.04%2.08%naphthaSpecific Gravity, A&G
−0.19%2.25%0.65%diesel
−0.17%11.19%2.08%naphthaNormal Boiling Point, J&R Iso-alkanes
−1.88%2.77%0.69%diesel
−0.51%7.35%1.52%naphthaNormal Boiling Point, C&G
0.24%1.33%0.64%diesel
−0.11%11.77%2.40%naphthaCritical Temperature, J&R
−1.86%2.62%0.66%diesel
−1.08%8.43%1.36%naphthaCritical Temperature, A&G
−0.21%0.65%0.21%diesel
0.29%7.90%2.80%naphthaCritical Pressure, J&R
−1.77%4.42%1.40%diesel
2.64%8.17%1.62%naphthaCritical Pressure, A&G
2.11%4.14%0.91%diesel
0.84%7.96%1.49%naphthaAcentric Factor, J&R
−0.32%2.02%0.92%diesel
−4.11%22.67%6.59%naphthaAcentric Factor, A&G
−6.80%11.96%4.51%diesel
0.13%2.76%0.74%naphthaSpecific Gravity, A&G
−0.52%2.70%0.78%diesel
0.29%1.95%0.73%naphthaNormal Boiling Point, J&R Mono-aromatics
2.64%12.05%3.10%diesel
10.33%18.61%4.52%naphthaNormal Boiling Point, C&G
6.36%18.61%6.12%diesel
0.32%2.18%0.83%naphthaCritical Temperature, J&R
2.53%11.50%2.93%diesel
0.18%1.82%0.88%naphthaCritical Temperature, A&G
−0.72%2.62%1.17%diesel
−1.21%8.73%2.54%naphthaCritical Pressure, J&R
−3.32%12.45%3.61%diesel
−1.08%6.03%2.13%naphthaCritical Pressure, A&G
−1.75%6.61%2.21%diesel
−0.72%8.86%3.04%naphthaAcentric Factor, J&R
−0.36%8.86%2.77%diesel
2.76%15.97%4.12%naphthaAcentric Factor, A&G
−0.81%15.97%4.19%diesel
0.20%2.04%0.46%naphthaSpecific Gravity, A&G
0.27%2.04%0.31%diesel
1.50%8.56%3.35%dieselNormal Boiling Point, J&RDi- and tri-aromatics
−1.63%8.06%2.28%dieselNormal Boiling Point, C&G
0.34%7.22%2.95%dieselCritical Temperature, J&R
−0.25%2.23%0.86%dieselCritical Temperature, A&G
−3.58%21.65%6.26%dieselCritical Pressure, J&R
−0.01%19.88%5.53%dieselCritical Pressure, A&G
14.22%25.95%8.24%dieselAcentric Factor, J&R
7.82%21.88%7.89%dieselAcentric Factor, A&G
1.56%18.32%4.05%dieselSpecific Gravity, A&G
0.58%34.93%2.50%naphthaNormal Boiling Point, J&R Naphthenes
2.44%15.47%3.99%diesel
−6.77%16.96%3.51%naphthaNormal Boiling Point, C&G
−6.58%13.83%1.56%diesel
−0.28%3.62%1.02%naphthaCritical Temperature, J&R
2.68%15.83%4.02%diesel
−0.54%3.37%1.12%naphthaCritical Temperature, A&G
−1.47%3.63%1.09%diesel
0.24%7.18%2.59%naphthaCritical Pressure, J&R
1.38%19.76%6.90%diesel
−0.18%8.61%2.86%naphthaCritical Pressure, A&G
4.27%29.20%8.29%diesel
1.98%35.98%8.93%naphthaAcentric Factor, J&R
−0.30%35.98%7.19%diesel
4.56%40.71%12.55%naphthaAcentric Factor, A&G
0.95%40.71%9.83%diesel
2.61%3.99%3.99%naphthaSpecific Gravity, A&G
−0.25%7.75%1.92%diesel
−2.57%8.97%2.38%naphthaNormal Boiling Point, J&R Sulfur-containing
compounds
−2.78%7.02%1.92%diesel
−18.36%68.25%15.80%naphthaNormal Boiling Point, C&G
−13.81%49.32%11.99%diesel
−2.40%8.79%2.28%naphthaCritical Temperature, J&R
−2.82%6.80%2.06%diesel
−0.83%5.87%2.02%naphthaCritical Temperature, A&G
−1.03%3.90%1.77%diesel
1.33%10.72%2.64%naphthaCritical Pressure, J&R
0.96%10.72%3.07%diesel
−1.65%6.80%2.64%naphthaCritical Pressure, A&G
−1.92%6.80%2.01%diesel
0.31%13.65%4.00%naphthaAcentric Factor, J&R
2.30%22.89%6.75%diesel
0.95%18.90%6.16%naphthaAcentric Factor, A&G
2.59%18.90%7.25%diesel
−0.75%4.25%0.90%naphthaSpecific Gravity, A&G
−0.72%4.25%0.87%diesel
−0.31%10.02%3.88%naphthaNormal Boiling Point, J&R Nitrogen-containing
compounds
−3.66%10.02%4.24%diesel
−18.81%35.64%9.29%naphthaNormal Boiling Point, C&G
−11.72%15.40%2.46%diesel
−0.56%9.66%3.64%naphthaCritical Temperature, J&R
−4.91%9.66%3.17%diesel
−0.13%6.80%3.38%naphthaCritical Temperature, A&G
−3.38%6.80%2.28%diesel
0.59%11.22%4.70%naphthaCritical Pressure, J&R
1.93%11.22%6.20%diesel
−5.97%12.24%3.14%naphthaCritical Pressure, A&G
−4.20%12.24%5.36%diesel
4.85%13.72%4.73%naphthaAcentric Factor, J&R
18.19%26.33%6.93%diesel
−0.06%8.06%5.35%naphthaAcentric Factor, A&G
0.77%6.02%3.98%diesel
0.10%2.00%1.26%naphthaSpecific Gravity, A&G
1.35%3.57%1.48%diesel
0.90%3.72%1.50%naphthaNormal Boiling Point, J&R Oxygen-containing
compounds
6.80%19.78%6.18%diesel
2.97%14.06%5.01%naphthaNormal Boiling Point, C&G
0.28%14.06%3.19%diesel
1.20%3.30%1.28%naphthaCritical Temperature, J&R
6.94%20.05%5.86%diesel
3.93%7.83%2.64%naphthaCritical Temperature, A&G
2.76%7.83%1.87%diesel
3.20%8.14%3.26%naphthaCritical Pressure, J&R
−0.69%18.12%5.59%diesel
1.90%6.82%2.68%naphthaCritical Pressure, A&G
2.14%22.33%3.59%diesel
−3.27%14.02%5.15%naphthaAcentric Factor, J&R
0.41%14.02%5.40%diesel
−2.34%11.44%5.36%naphthaAcentric Factor, A&G
0.57%11.44%5.34%diesel
−0.97%4.17%1.18%naphthaSpecific Gravity, A&G
−0.43%4.17%0.82%diesel
Disclaimer/Publisher’s Note: The statements, opinions and data contained in all publications are solely those of the individual author(s) and contributor(s) and not of MDPI and/or the editor(s). MDPI and/or the editor(s) disclaim responsibility for any injury to people or property resulting from any ideas, methods, instructions or products referred to in the content.