1. Introduction
As most major oilfields worldwide have entered high or ultra-high water-cut stages, the objective of waterflooding has gradually shifted from sustaining formation energy to enhancing sweep efficiency and maximizing ultimate recovery [
1]. Prolonged high-pressure water injection can irreversibly alter reservoir pore structures, such as cement detachment and microfracture formation, promoting the development of high-permeability dominant channels connecting injection and production wells [
2,
3]. Once established, these channels disturb the originally uniform flow field, directing injected water preferentially along paths of least resistance toward production wells. This behavior reduces sweep efficiency, leaving substantial residual oil in unswept or stagnant regions, and increases operational costs [
4,
5,
6]. Reliable identification of dominant channels is therefore critical for conformance control, water shutoff, and optimized injection–production strategies in complex reservoirs.
Current methods for identifying dominant channels primarily include interwell tracer testing, well testing analysis, and numerical simulation. Tracer techniques provide direct insights into flow pathways but are constrained by prolonged testing periods, high operational costs, and potential environmental concerns [
7,
8]. Well testing approaches typically rely on simplified flow assumptions, often requiring homogeneous or mildly heterogeneous conditions, which may yield non-unique interpretations and limit resolution of complex interwell connectivity [
9,
10]. Numerical simulations using finite difference schemes reproduce interwell flow behavior but are prone to discretization errors and numerical dispersion under complex well-pattern configurations [
11]. Collectively, these approaches involve trade-offs among computational expense, operational efficiency, and the ability to capture heterogeneous reservoir behavior.
Advances in the connection element method and graph-based modeling have introduced an alternative perspective, representing reservoirs as weighted networks of nodes and edges [
12,
13]. Within this framework, wells and discretized reservoir elements are treated as nodes, and transmissibility between nodes is encoded as edge weights. Dominant channel identification can then be formulated as a path-search problem within this network. Ant colony optimization (ACO) simulates competitive flow transport, allowing effective detection of dominant flow paths under complex topologies [
14,
15].
Despite these advantages, ACO performance is highly sensitive to hyperparameter selection [
16,
17]. Variations in reservoir topology—such as branching patterns, connectivity density, and heterogeneity—result in substantial differences in optimal parameter configurations. Conventional strategies using fixed parameters, often determined empirically or by trial-and-error, lack flexibility across diverse reservoir conditions [
18]. Search-based tuning methods, including particle swarm optimization and Bayesian optimization, can enhance adaptability but require repeated execution for each sample, leading to high computational cost, slow convergence, and limited suitability for real-time applications.
Algorithm parameters are inherently linked to task characteristics. Features of reservoir well networks—such as node scale, average degree, spatial distribution, and connectivity complexity—influence path competition dynamics and search difficulty, shaping optimal parameter choices [
19]. This observation motivates the development of a structure-driven approach, mapping reservoir graph attributes directly to ACO parameters, replacing iterative search with prediction.
To address these challenges, this study proposes a promising GIN-ACO framework integrating physics-driven modeling, geometric approximation, and a graph isomorphism network (GIN). A physics-constrained benchmark is established using Darcy’s law with the connection element method to model interwell flow. A distance–direction coupled geometric surrogate model efficiently generates graph samples that preserve physical consistency at low computational cost. Sensitivity analysis identifies key parameters, followed by GIN training to capture the nonlinear relationship between reservoir topology and optimal ACO parameters, enabling adaptive parameter selection during identification without iterative online search [
20].
To support both controlled evaluation and realistic assessment, the framework is applied to two types of data. First, synthetic reservoir graphs are used to provide large-scale, fully controlled samples for systematic ablation studies and algorithm validation. Second, semi-realistic SPE10 layers are introduced to evaluate generalization and robustness under realistic heterogeneous reservoir conditions. These complementary datasets allow the proposed framework to be thoroughly tested in both idealized and practical scenarios.
The main contributions of this work are summarized as follows:
- (1)
A structure-driven parameter tuning framework converting sample-by-sample search into a graph-based prediction problem;
- (2)
A scalable data generation pipeline combining physics-constrained benchmark and geometric surrogate models for reservoir graph construction and parameter learning;
- (3)
Extensive experiments demonstrating superior identification accuracy, computational efficiency, and stability compared with conventional methods, verified on both synthetic and SPE10 reservoir datasets.
2. Theoretical Framework and Physical Modeling
2.1. Graph-Theoretic Representation of Complex Reservoir Networks
In contemporary reservoir engineering, representing continuous porous media as complex networks has become an effective approach for reducing problem dimensionality [
21,
22]. In this work, the injection–production system is formulated as a weighted directed graph:
In Equation (1), the node set V corresponds to key control locations within the reservoir, including injection wells (sources), production wells (sinks), and additional virtual nodes introduced to capture the spatial distribution of remaining oil between wells.
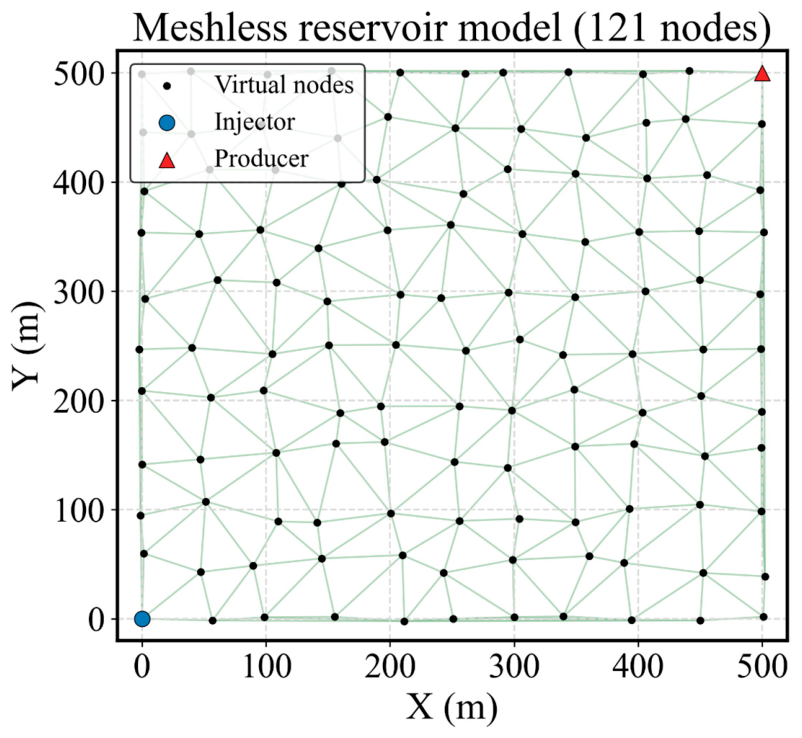
For the idealized single-injector–single-producer reservoir model illustrated in
Figure 1, a total of 121 nodes are defined, consisting of two physical wells and 119 virtual nodes. The arrangement of these virtual nodes reflects the geometric features of the formation.
The edge set
E denotes possible fluid flow pathways, whose presence is governed by hydraulic connectivity between nodes [
23]. Within the mesh-free simulation framework based on the connection element method, a radius of influence
R is introduced [
12]. In this study,
R = 80.0 m, indicating that an edge is created when the Euclidean distance between two nodes satisfies the prescribed connectivity condition. Under this criterion, 386 connection elements are generated, resulting in a sparse yet fully connected network structure.
The weight set
W represents the flow capacity associated with each edge. Physically, it corresponds to the splitting coefficient, which defines the likelihood of fluid passing through a specific path and governs flow partitioning at branching locations [
24].
The model domain measures 500 m × 500 m and includes 121 discrete virtual nodes (black points). The blue circle and red triangle indicate the injector and producer, respectively, forming a single-injector–single-producer well configuration. Light green lines denote the topological connections between nodes, representing potential flow paths and the underlying network used for pressure calculation.
2.2. Physics-Driven Computation of Splitting Coefficients
To ensure physically consistent flow distributions and to provide a dependable reference for subsequent data-driven modeling, a benchmark model constrained by flow physics is constructed [
25,
26]. This model evaluates inter-node flow allocation and serves as a reference for both the geometric surrogate model and the parameter prediction framework. Its primary role lies in delivering high-accuracy solutions for small-scale samples, rather than supporting large-scale dataset generation.
In contrast to purely geometric formulations, the physics-driven splitting coefficient is derived by solving the governing flow equations, explicitly accounting for connectivity, transmissibility, and the global pressure field. Using the connection element method, the reservoir is discretized into nodes and connection elements, with inter-node flow governed by Darcy’s law and mass conservation principles [
27,
28]. For a given node
i, the discrete pressure equation is expressed as:
Here, denotes the number of neighboring nodes connected to node i, and represent nodal pressures, corresponds to source or sink terms, and is the transmissibility between nodes.
The transmissibility
quantifies the conductive capacity of connection elements and forms the foundation for flow partitioning. Following standard transmissibility treatments in reservoir simulation and unstructured-grid flow modeling, it is evaluated by combining reservoir properties, such as permeability
k, with geometric characteristics, including control volume and shape factors [
29]:
In this expression, denotes fluid viscosity, while the shape factor reflects the spatial configuration of mesh-free nodes.
By imposing boundary conditions of constant-rate injection and constant-pressure production, a large sparse linear system is assembled and solved to obtain the global pressure distribution [
30]. The instantaneous flow rate from node
to node
is then calculated according to Darcy’s law:
Flow occurs only when .
Using the computed inter-node flow rates, the physics-driven splitting coefficient is defined as the fraction of flow from node
that is directed toward a downstream node
:
where
out denotes the set of downstream neighboring nodes satisfying
.
For the ideal reservoir configuration described in
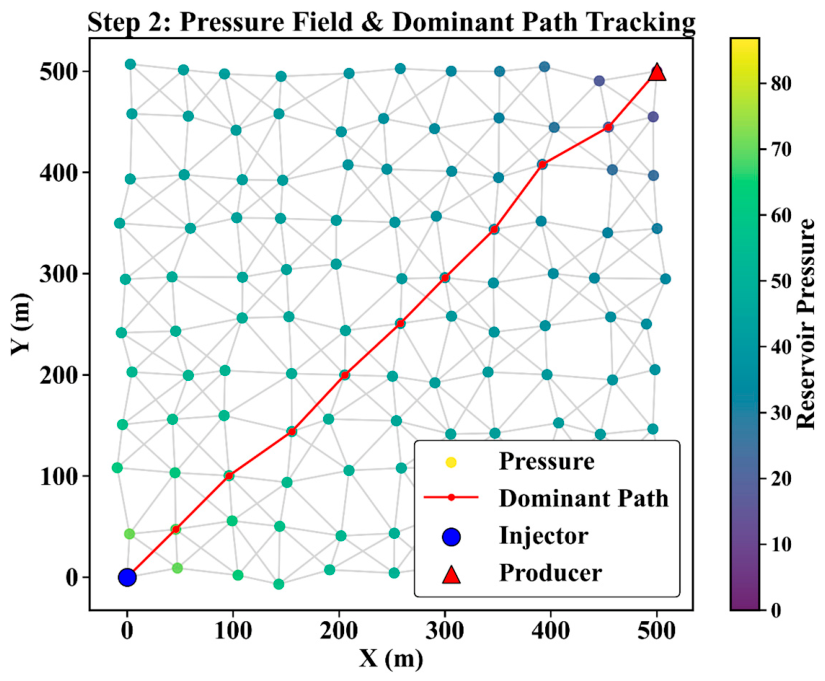
Section 2.1, constant-rate injection and constant-pressure production are imposed. The injector is modeled as a source term, whereas the producer is assigned a Dirichlet boundary condition with the bottom-hole pressure fixed at zero. The resulting pressure field decreases monotonically from the injector (86.85) to the producer (0.00), establishing a clear driving gradient. Based on Equation (5), the splitting coefficients
are computed for all connection elements.
The
Figure 2 presents the simulated pressure field together with the dominant flow pathways identified using the physics-driven model.
The resulting incorporates the full set of governing physical mechanisms and is subsequently adopted as the target value for calibrating the parameters of the geometric surrogate model, specifically the distance factor and directional guidance coefficients.
2.3. Geometry-Based Surrogate Model for Flow Splitting
The evaluation of splitting coefficients
described in
Section 2.2 depends on solving the complete set of flow equations. While this approach ensures high accuracy, it incurs substantial computational cost and is therefore impractical for large-scale dataset generation [
31,
32]. To address this limitation, a geometry-based surrogate model is developed to reduce computational demand while retaining consistency with the underlying physical behavior [
33]. This model assumes that flow tendencies are predominantly influenced by distance attenuation (distance factor) and directional guidance toward the production well. For a node
, its neighboring node
, and the target producer
, the relevant geometric features are defined as follows:
Using these features, the geometric weight function is formulated as:
In this expression,
(
in
Appendix A) represents the distance factor exponent, governing attenuation with increasing distance, while
(
in
Appendix A) denotes the directional guidance exponent, capturing the preference of flow toward the target well. The directional filter is given by:
The geometric splitting coefficient is obtained by normalization:
where
is the set of neighboring nodes of node
, ensuring that the sum of all outgoing splitting coefficients equals unity.
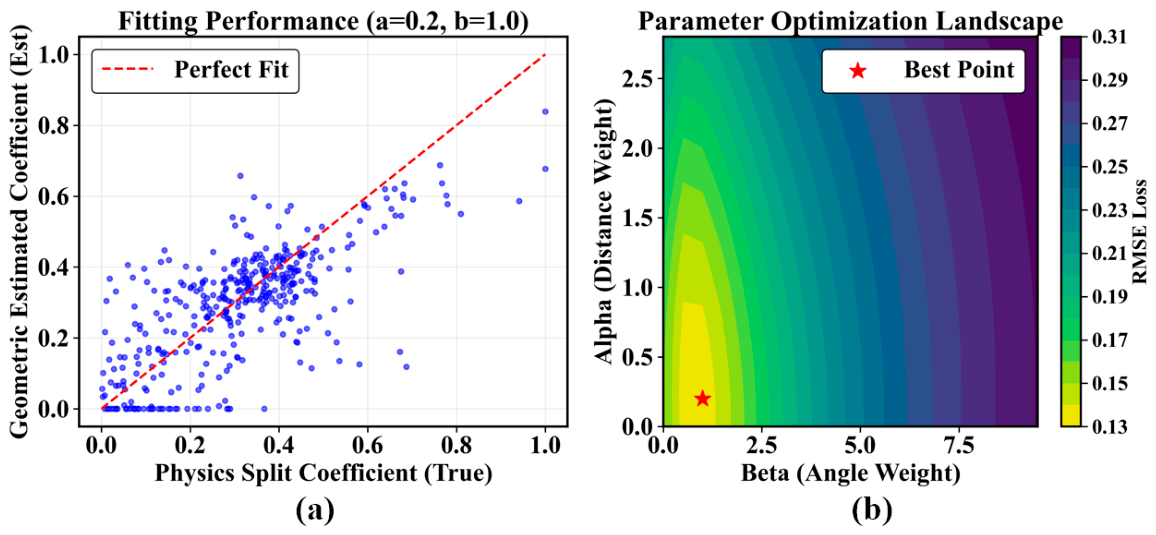
To align the surrogate model with physical behavior, the parameters and are calibrated via grid search, using as the reference and RMSE as the evaluation criterion. Experiments conducted on the ideal reservoir model (121 nodes and 386 connections) indicate that the optimal parameter combination achieves an RMSE of 0.1329.
The
Figure 3 indicate that distance attenuation has a limited effect on local flow allocation under homogeneous and isotropic conditions, whereas directional guidance strongly aligns flow toward the production well, consistent with pressure-gradient-driven mechanisms. Overall, the geometric surrogate model efficiently approximates the physics-based flow distribution, retaining principal flow characteristics while reducing computational cost. The current model assumes single-phase flow and fixed connectivity, yet captures the essential patterns needed for dominant channel identification. Future extensions could incorporate multiphase flow, geomechanical effects, and chemical interactions (e.g., enhanced oil recovery) by adjusting edge weights or node features to reflect phase-dependent transmissibility, pressure-driven deformations, or chemical reactions, enabling GIN-ACO to handle more complex physics while maintaining efficient inference.
2.4. Flow Simulation Mechanism of Ant Colony Optimization
Ant colony optimization is a bio-inspired evolutionary algorithm derived from the foraging behavior of ants. In reservoir systems, fluid migration through porous media exhibits a clear analogy to this process: the injection well acts as the source, the production well as the sink, and fluid particles are represented by artificial ants. In this study, the algorithm’s positive feedback mechanism is utilized to simulate the development and evolution of streamlines within a discrete connection-element network, enabling identification of dominant channels at a specific time step.
During the simulation, each fluid particle is modeled as an ant
. When positioned at node
, the ant selects its next node
jbased on a probabilistic transition rule:
This transition probability depends on both pheromone intensity and heuristic information. The heuristic term
captures the local geometric preference of flow and is defined using the normalized geometric splitting coefficient introduced in
Section 2.3. In this way, the search process is guided toward paths that are shorter and more directionally aligned with the production well.
The pheromone intensity
represents the global desirability of a path at time
. From a physical standpoint, it can be interpreted as the evolving preference for certain flow pathways, analogous to the development of dominant channels under sustained injection. The parameters
and
(see
Appendix A) regulate the relative influence of pheromone and heuristic information, thereby balancing exploitation of accumulated path information with exploration driven by geometric features. These parameters are the key variables targeted for optimization in this study. The set
includes all feasible downstream neighboring nodes of node
.
A defining characteristic of the algorithm is its reliance on positive feedback. When an ant successfully traverses from the injection well to the production well, it deposits pheromone along its path, increasing the probability that subsequent ants will follow the same trajectory. To avoid premature convergence and preserve system adaptability, a pheromone evaporation mechanism, which is commonly used in ant colony optimization and pheromone-update models, is incorporated [
34,
35,
36]. The global pheromone update process is described as:
Here, denotes the evaporation coefficient, representing dissipation effects or the decay of system memory, while corresponds to the pheromone deposited by the -th ant on edge . Paths associated with lower resistance, or equivalently higher cumulative splitting coefficients, receive greater reinforcement.
Through successive iterations, pheromone concentration progressively increases along high-conductivity pathways, attracting more flow particles. This self-organizing behavior leads to the gradual formation of dominant flow channels that connect injection and production wells.
2.5. Applicability of Graph Isomorphism Network
Traditional convolutional neural networks are primarily developed for Euclidean data structures and are not directly applicable to irregular reservoir networks [
37]. While graph convolutional networks and graph attention networks extend deep learning techniques to graph-structured data, their neighborhood aggregation schemes impose limitations in distinguishing certain non-isomorphic graph structures [
38].
In dominant channel identification, even minor variations in network topology—such as differences in local connectivity density—can correspond to fundamentally distinct geological features, including zones of fracture development [
39]. This places a clear requirement on the model to possess strong structural discrimination capability.
To meet this requirement, a graph isomorphism network is employed as the parameter prediction model in this study. This architecture attains discriminative capacity comparable to the Weisfeiler–Lehman graph isomorphism test by integrating learnable aggregation functions with multilayer perceptrons [
20]:
This formulation indicates that the model aggregates information from neighboring nodes while explicitly retaining the representation of the central node, followed by a nonlinear transformation through a multilayer perceptron. Such a structure enables the model to capture high-order topological features embedded within complex reservoir networks.
Consequently, the network is able to learn the underlying relationship between reservoir topology and optimal algorithm parameters, establishing a foundation for structure-driven parameter prediction. In this study, it is applied to encode reservoir graph characteristics and directly infer suitable parameter configurations. Its effectiveness is further examined through comparative analyses with conventional models in the following sections.
2.6. Overall Workflow of the Proposed GIN-ACO Framework
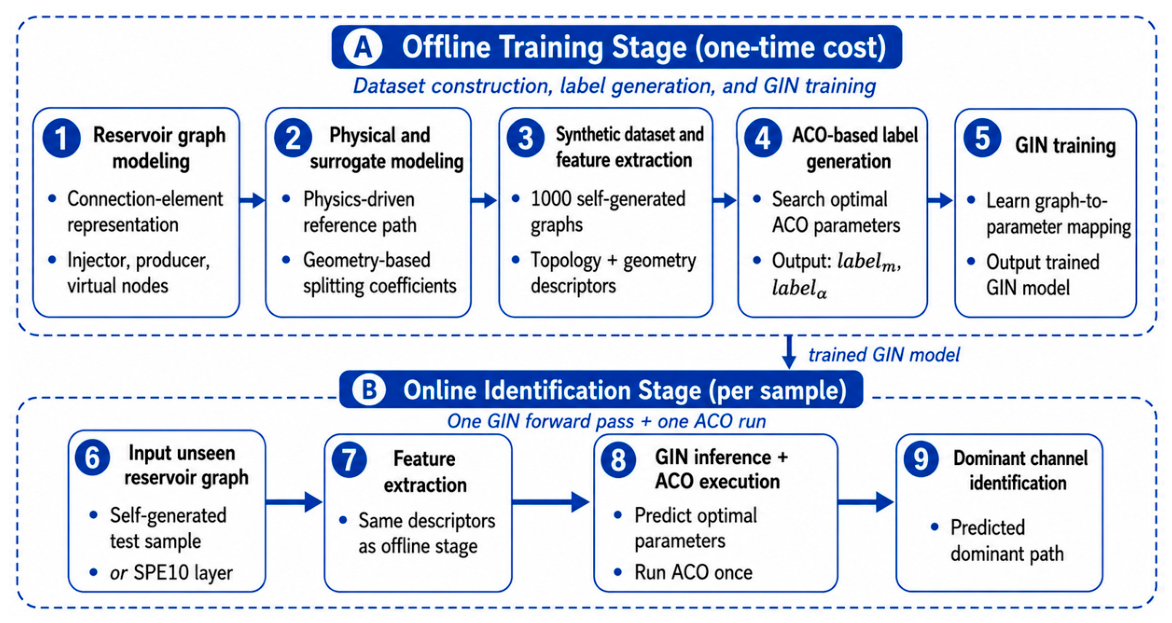
To clarify the complete procedure of the proposed method,
Figure 4 summarizes the overall workflow of the framework, which is divided into two stages: an offline training stage, including graph construction, surrogate-assisted label generation, and GIN training; and an online identification stage, including GIN inference and a single ACO execution for dominant channel identification. This distinction clarifies the relationship among the physics-driven model, the surrogate model, ACO-based label generation, and the final online application of the trained GIN–ACO framework.
3. Methodology and Experimental Design
3.1. Orthogonal Design for ACO Parameter Sensitivity Analysis
To determine which hyperparameters most strongly affect algorithm performance and to define appropriate targets for subsequent parameter prediction, a systematic sensitivity analysis is carried out. Using the ideal single-injector–single-producer reservoir model introduced in
Section 2.1, an L27 orthogonal array is constructed to examine six key hyperparameters across multiple levels. These parameters include population size
, pheromone importance factor
, heuristic importance factor
, evaporation coefficient
, total pheromone amount
, and the maximum number of iterations
.
Each parameter is assigned a set of levels within a reasonable range to reflect varying degrees of exploration intensity and convergence behavior. Algorithm performance is evaluated using the success rate of dominant channel identification, defined as the proportion of runs in which the algorithm correctly recovers the physically derived dominant flow path. Given the stochastic characteristics of the algorithm, each parameter combination is executed 30 times to ensure a reliable assessment of stability. The resulting data are analyzed through analysis of variance to quantify the relative contribution of each parameter. The results show that population size and the pheromone importance factor exert a statistically significant influence on performance, whereas the remaining parameters have comparatively weaker effects under the current experimental conditions. Accordingly, these two parameters are selected as the primary targets for subsequent prediction.
It is important to note that this analysis is intended to evaluate parameter importance rather than to identify a universally optimal configuration. Since reservoir topology differs across samples, each graph instance may correspond to a distinct optimal parameter set. This observation provides the basis for adopting a data-driven strategy to capture the relationship between structural features and optimal parameter values.
3.2. Graph Dataset Construction and SPE10 Test Design
To support training and evaluation of the GIN-ACO framework, a comprehensive dataset was constructed, comprising 1000 synthetically generated reservoir graphs and 20 semi-realistic SPE10 layers. Each synthetic sample represents an independent injection–production unit and includes both graph topology (adjacency matrix) and multi-dimensional node features. Reservoir structures were generated using the connection element method, and inter-node flow splitting coefficients were computed via the geometric surrogate model introduced in
Section 2.3, ensuring physical consistency while reducing computational cost. The synthetic dataset covers three categories of geological complexity: (1) regular grids with random perturbations representing relatively homogeneous formations, (2) randomly distributed nodes reflecting stochastic heterogeneity, and (3) random structures augmented with faults (random edge removal) and high-conductivity channels (enhanced edge weights) to simulate highly heterogeneous and challenging reservoirs. Rejection sampling was applied to regulate the proportion of complex samples, enhancing the model’s ability to generalize to difficult path identification tasks.
Node-level features include network scale (number of nodes and edges), average node degree, injector–producer distance, local density variance, topological path length, and geometric distance, capturing both global topology and local flow behavior.
Training Label Generation and Parameter Search: Training labels are obtained through a predefined ACO parameter space search. The search explores population size m ∈ [10, 100] (see
Appendix A) with a step of 5, and pheromone importance factor α ∈ [0.5, 5.0] (see
Appendix A) with a step of 0.1, while other ACO parameters are fixed at recommended defaults. Each parameter combination is evaluated through 10 independent runs with a fixed random seed. If multiple configurations satisfy the success criterion (predicted dominant path exactly matches the reference), the configuration with the minimal population size is selected; if multiple minimal configurations exist, the one with the shortest runtime is chosen.
Impact of Surrogate Model Error: The geometric surrogate model has an RMSE of 0.1329 relative to the physics-driven splitting coefficients. To assess how this error propagates through the ACO search, label generation, and GIN training, perturbation experiments were performed by adding controlled noise to the splitting coefficients and evaluating path identification stability across the 20 SPE10 semi-realistic layers.
Dataset Partitioning and Runtime Definition: The combined dataset was partitioned into training, validation, and test subsets in an 8:1:1 ratio, maintaining consistent distributions of reservoir types and difficulty levels, with no overlap between subsets. Success rate is defined as the proportion of test samples for which the predicted dominant path exactly matches the physics-based reference path. Online runtime per sample is defined as the time from input features to output of the dominant path, including one forward pass of the trained GIN model and a single ACO execution. Offline costs (dataset construction, label generation, GIN training, hyperparameter tuning) are excluded but can be amortized across all samples. For other methods (Fixed-parameter ACO, PSO-ACO, BO-ACO), runtime corresponds to the full online optimization per sample, ensuring consistent and fair comparison.
Importantly, the 20 SPE10 test samples represent 20 distinct reservoir models, allowing evaluation of the framework’s generalization to more realistic heterogeneous structures. Each SPE10 model is tested with 10 independent runs for each method, enabling statistically meaningful success rate and runtime measurements.
3.3. Ablation Study Design
To assess the contribution of graph-structure learning to the performance of the proposed GIN-ACO framework, a series of ablation experiments are conducted on the 20 SPE10 models. The experimental design includes four main comparisons:
- (1)
Comparison of graph neural network architectures: GIN versus GCN, GAT, and GraphSAGE, to evaluate the relative capacity of each model to capture structural information from reservoir graphs.
- (2)
Comparison with traditional machine learning models: GIN versus MLP, XGBoost, and Random Forest trained on handcrafted graph features, to determine whether simple statistical descriptors can approximate performance.
- (3)
Feature-level ablation: evaluation of topology-only features, geometry-only features, and combined features, to quantify the contribution of structural and spatial information individually and in combination.
- (4)
Effect of GIN-based parameter prediction: comparing ACO with and without GIN-inferred parameters (i.e., vanilla ACO vs. GIN-ACO), to verify that the observed improvement originates from informed parameter selection rather than random or fixed configurations.
These experiments are designed to demonstrate that performance gains are attributable to graph-structure learning rather than dataset biases or labeling rules. All runtime comparisons follow the definition provided in
Section 3.2, ensuring consistency between methods.
4. Results and Discussion
4.1. Dominant Channel Identification Performance
The proposed GIN-ACO framework was first evaluated on the synthetic reservoir dataset described in
Section 3.2. This dataset consists of 1000 graph samples generated from a single base reservoir model by varying inter-node flow parameters, and it was partitioned into training, validation, and test subsets at an 8:1:1 ratio. To provide an overall comparison of different parameter configuration strategies on the synthetic test set,
Table 1 summarizes the success rate and average computation time of Fixed-parameter ACO, PSO-ACO, BO-ACO, and the proposed GIN-ACO.
As shown in
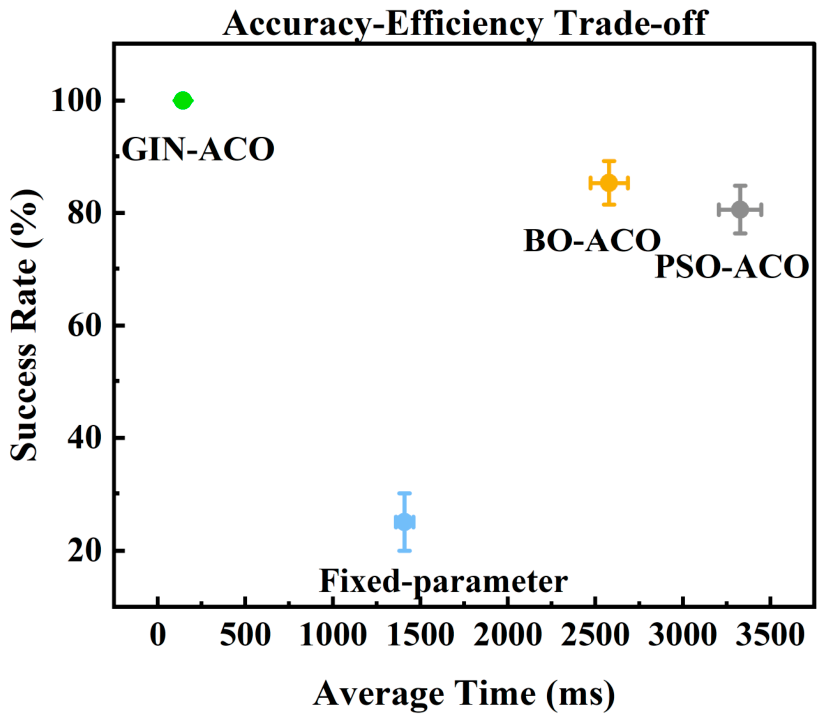
Table 1, the proposed GIN-ACO achieves the highest success rate and the lowest average computation time on the synthetic test set. Fixed-parameter ACO performs poorly, indicating that manually selected parameters cannot adapt well to varying flow conditions even within the synthetic samples. Search-based methods, including PSO-ACO and BO-ACO, improve identification accuracy by optimizing parameters online, but they require substantially longer computation time due to repeated search iterations. In contrast, GIN-ACO directly predicts suitable ACO parameters from graph structure, thereby avoiding iterative online tuning and achieving a much better balance between accuracy and efficiency.
To further illustrate the identification performance,
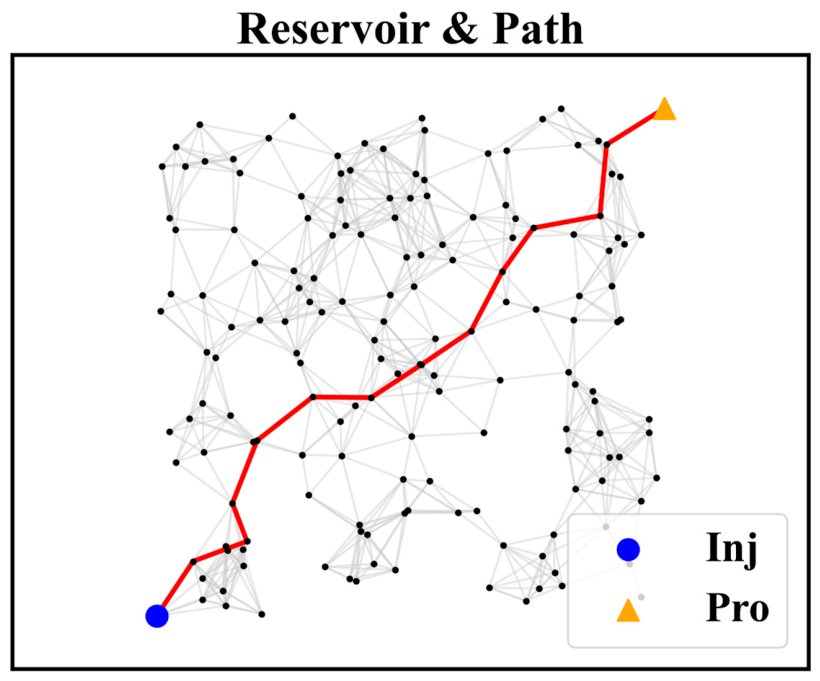
Figure 5 presents a representative dominant channel prediction result on a synthetic reservoir sample. The figure shows that the dominant channel identified by GIN-ACO agrees well with the physics-based reference path, indicating that the proposed framework can effectively capture the principal flow pathway in the synthetic reservoir graph.
For a more intuitive comparison of method performance,
Figure 6 shows the trade-off between identification accuracy and computational efficiency. The proposed GIN-ACO is located in the most favorable region of the plot, combining the highest identification success rate with the shortest computation time. By comparison, PSO-ACO and BO-ACO improve accuracy over Fixed-parameter ACO, but their high computational overhead limits their efficiency. These results demonstrate that structure-driven parameter prediction through GIN provides an effective way to improve dominant channel identification while maintaining low online computational cost.
4.2. Ablation Study I: GNN Architecture Comparison
To evaluate the contribution of graph-structure learning, the proposed GIN-ACO framework was compared with other GNN architectures—GCN, GAT, and GraphSAGE—using 20 distinct SPE10 reservoir models, each tested 10 times to ensure statistically robust results. The success rate, 95% confidence intervals, and average runtime for each architecture are summarized in
Table 2.
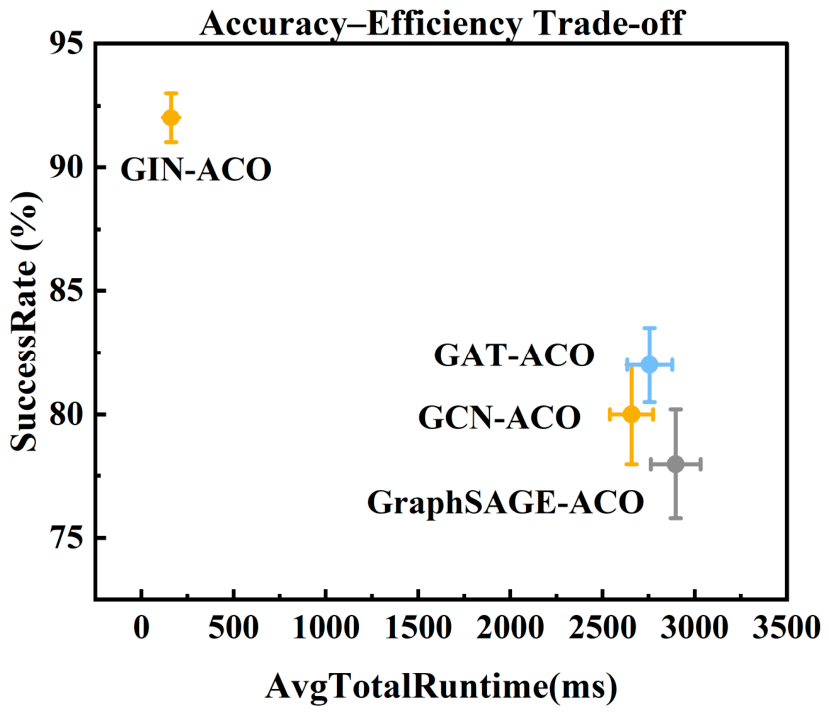
GIN-ACO consistently outperforms the other GNN variants, achieving the highest identification success while maintaining the lowest computational cost. GCN, GAT, and GraphSAGE either reduce identification accuracy or incur substantially longer runtime, highlighting the importance of GIN’s expressive power in capturing complex connectivity patterns within heterogeneous reservoirs.
Figure 7 visualizes the trade-off between identification accuracy and computational efficiency for the different GNN-ACO variants, illustrating the superior performance of GIN-ACO across all tested SPE10 models.
4.3. Ablation Study II: Conventional ML Models
The generalization capability of simpler machine learning models was evaluated on 20 distinct SPE10 reservoir models, each repeated 10 times. Multi-layer Perceptron (MLP), XGBoost, and Random Forest were trained using handcrafted graph features and compared with GIN-ACO. The comparison focuses on success rate and average computation time (
Table 3).
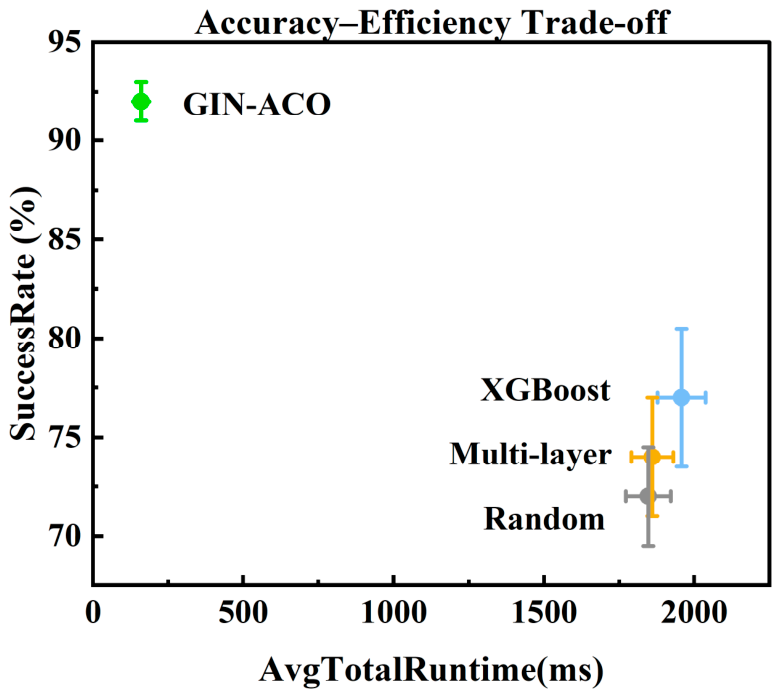
Across all 20 SPE10 models, GIN-ACO consistently achieves the highest success rate while maintaining the lowest runtime. Simpler ML models perform moderately but are less robust to variations in reservoir topology, demonstrating that handcrafted features alone cannot fully capture the complex connectivity present in heterogeneous reservoirs.
Figure 8 visualizes the accuracy–efficiency trade-off, showing that GIN-ACO combines high accuracy with low computation cost, whereas MLP, XGBoost, and Random Forest either compromise accuracy or incur significantly higher runtimes. This result emphasizes the critical role of graph-structure learning for reliable dominant channel identification.
4.4. Ablation Study III: Feature Groups
To quantify the effect of different feature groups on dominant channel identification, experiments were conducted on 20 distinct SPE10 models, with 10 repeated runs per model. Three configurations were tested: topology-only, geometry-only, and combined topology–geometry features.
Table 4 summarizes the success rate, 95% confidence intervals, and average runtime.
The results show that combining topology and geometry features consistently improves identification accuracy and reduces runtime. Topology-only or geometry-only features individually lead to lower success rates and longer computation times, demonstrating that both structural and geometric information are necessary to capture heterogeneous reservoir connectivity effectively.
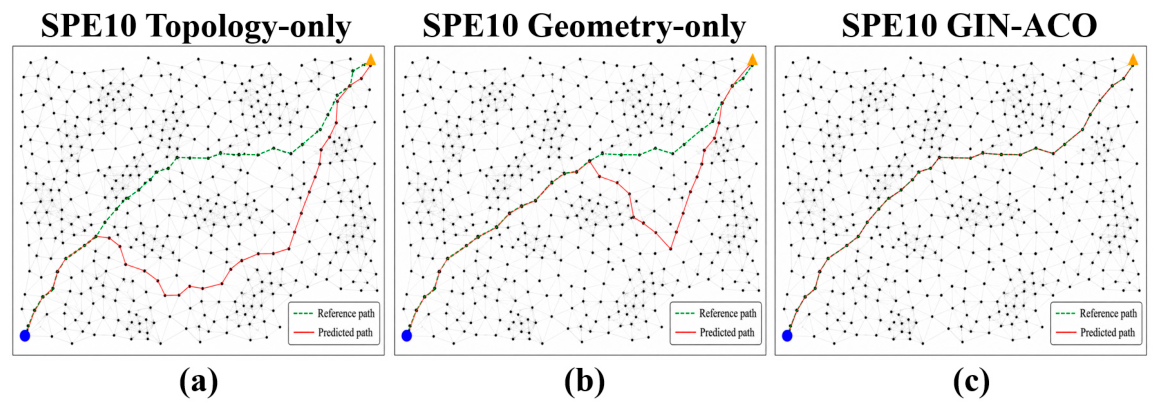
Figure 9 illustrates the predicted dominant channels for a challenging SPE10 sample. The topology-only and geometry-only configurations deviate from the physics-based reference, while the combined feature configuration produces paths closely aligned with the reference, indicating that the geometric surrogate’s simplifications introduce minimal bias when both feature types are included.
4.5. Ablation Study IV: Effect of GIN-Based Parameter Prediction
To quantify the contribution of GIN-based parameter prediction, experiments were conducted on 20 distinct SPE10 reservoir models, with 10 repeated runs per model, by comparing ACO without GIN-based parameter prediction and GIN-ACO. The corresponding success rate, 95% confidence interval, and average runtime are reported in
Table 5.
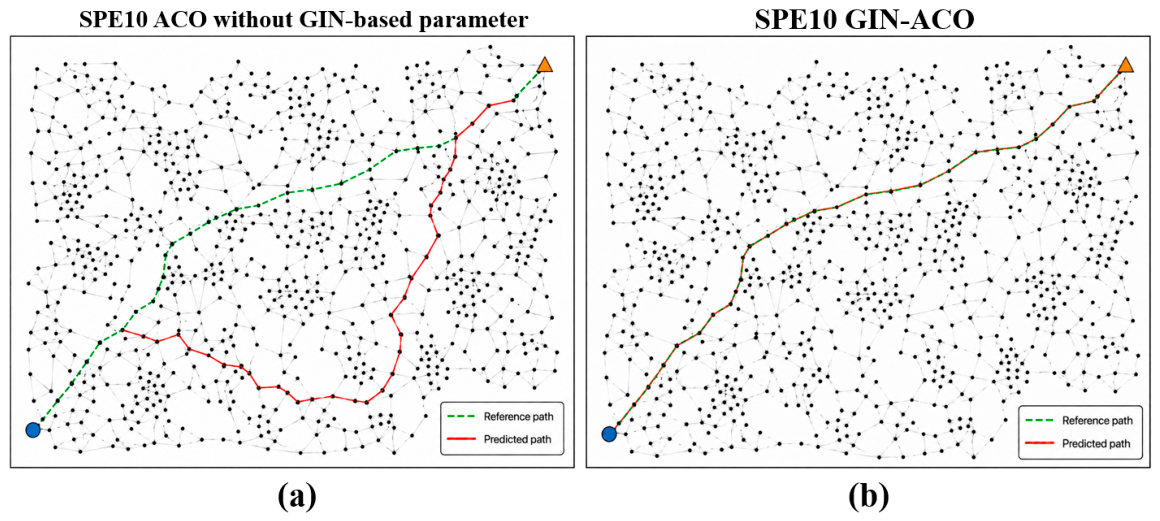
Table 5 shows that GIN-based parameter prediction improves both identification accuracy and computational efficiency. Without GIN-based parameter inference, ACO relies on non-adaptive parameter settings and achieves a lower success rate with substantially higher runtime. In contrast, GIN-ACO predicts task-specific ACO parameters directly from reservoir graph structure, resulting in more accurate dominant channel identification and a significant reduction in online computation time.
To further illustrate this effect,
Figure 10 presents the predicted dominant channel paths for a representative challenging SPE10 sample. The grey network denotes reservoir connectivity, and the red paths represent the identified dominant channels. The prediction obtained without GIN-based parameter inference deviates from the reference path, whereas GIN-ACO produces a path closely aligned with the reference. This comparison indicates that structure-informed parameter prediction is critical for improving performance on heterogeneous reservoir graphs and also suggests that the approximation bias introduced by the simplified geometric model does not materially affect the final identification when combined with GIN-based parameter prediction.
4.6. Mechanism Analysis
To further interpret the observed performance improvements, a mechanistic analysis is conducted from three perspectives: structure-aware parameter selection, the coupling between flow behavior and network topology, and the transition in methodological paradigm.
(1) Structure-Aware Parameter Selection
Optimal ACO parameters—including pheromone importance, evaporation coefficient, and heuristic weighting—exhibit strong nonlinear dependence on network topology. Variations in node scale, connectivity density, and heterogeneity directly affect path competition dynamics and search complexity. GIN models the mapping from structural and geometric features to instance-specific parameters, eliminating the need for iterative online search and enhancing both efficiency and robustness.
(2) Coupling between Flow Behavior and Network Topology
Path identification is influenced by local pressure gradients and connectivity patterns. High-conductivity channels attract stronger pheromone reinforcement, biasing ants toward dominant routes, while lower-conductivity edges allow exploration of alternative paths. Although the geometric surrogate model introduces minor deviations from physics-driven splitting coefficients, the combination of topology and geometry features stabilizes path selection across heterogeneous regions.
(3) From Search-Based Optimization to Learning-Based Prediction
Replacing iterative search with a single-pass GIN inference reduces computational complexity and runtime while maintaining physical consistency. Offline training captures the nonlinear relationship between graph features and optimal parameters, enabling efficient, accurate, and repeatable identification of dominant channels.
Summary of mechanism-level advantages
The observed improvements of GIN-ACO arise from exploiting the intrinsic relationship between reservoir topology and optimal ACO parameters, accounting for the coupled effects of flow behavior, pressure gradients, and network connectivity on path competition, and replacing iterative search with learning-based parameter prediction. Together, these mechanisms provide a new theoretical perspective and a practical framework for efficient, robust, and physically consistent dominant channel identification in complex heterogeneous reservoirs.
5. Conclusions
This study presents a framework for adaptive identification of dominant channels in complex reservoirs, integrating a graph isomorphism network (GIN) with a physics-constrained ant colony optimization (ACO) algorithm. A reservoir modeling scheme based on Darcy’s law and the connection element method is combined with a geometry-based surrogate model and a large-scale graph dataset, allowing systematic evaluation under complex well-network topologies. The main conclusions are as follows:
(1) Improved Accuracy and Robustness: The proposed GIN–ACO framework achieves high success rates across both synthetic and semi-realistic SPE10 reservoirs. On the synthetic dataset, fixed-parameter ACO achieves 25%, PSO-ACO 80.6%, BO-ACO 85.3%, and GIN-ACO reaches 100%. On 20 distinct SPE10 semi-realistic models, each repeated 10 times, GIN-ACO achieves 92 ± 1%, demonstrating robust generalization under more heterogeneous and realistic conditions. Ablation experiments indicate that using topology-only or geometry-only features reduces success rates to 81 ± 3% and 79 ± 2%, respectively, confirming that combining both structural and spatial features is essential for robust dominant channel identification.
(2) Structure-Driven Adaptive Parameter Configuration: Algorithm parameters—including pheromone importance factor, evaporation coefficient, and heuristic weighting—exhibit strong nonlinear dependence on network topology and heterogeneity. GIN captures these relationships from offline training, enabling automatic, instance-specific parameter prediction without iterative online search. Ablation experiments show that removing the GIN or geometric surrogate components reduces success rates, demonstrating the importance of structure-aware parameter selection.
(3) Online Computational Efficiency: Online runtime per sample for GIN-ACO is approximately 143 ms. Compared with the longest online execution among conventional search-based methods, this represents a substantial reduction in computation time while maintaining high accuracy. The framework’s direct parameter prediction eliminates redundant iterations and accelerates convergence, enabling efficient large-scale applications.
(4) Unified Structure–Parameter–Flow Modeling Paradigm: The framework explicitly couples reservoir topology, algorithm parameters, and flow dynamics. Dominant channel formation emerges from the interaction of network connectivity and local flow behavior, modulated by algorithm parameters. This integrated perspective provides a rigorous methodological foundation for intelligent channel identification.
In summary, the proposed GIN-ACO framework is a promising framework for identifying dominant channels in complex reservoirs. By integrating structural information with physics-driven modeling, it transitions from empirical parameter tuning to adaptive, data-driven prediction. Future work will extend the framework to multi-well systems and field-scale spatiotemporal models, incorporate real reservoir data for transfer learning, and introduce uncertainty quantification to enhance reliability.