1. Introduction
In recent years, the rapid advancement of unconventional oil and gas development has positioned lacustrine shale oil as a crucial replacement resource. Unlike conventional reservoirs, shale formations exhibit pronounced heterogeneity and a highly complex, multi-scale pore–throat system, in which the modes of oil occurrence and the processes of spontaneous imbibition and fluid migration are tightly coupled, jointly constraining hydrocarbon mobility and production performance [
1,
2,
3]. Based on pore-size classification, the storage space typically comprises micropores (<2 nm), mesopores (2–50 nm), macropores (50 nm–2 μm), and microfractures (>2 μm). Micropores and nanopores contribute the majority of storage capacity, whereas fractures and macropores provide cross-scale connectivity and flow pathways. This hierarchical framework has been repeatedly validated in various shale systems and is widely used to explain the governing roles of storage and transport structures [
4,
5,
6,
7].
In particular, numerous international studies have also confirmed the multi-scale heterogeneity of shale pore systems. Kuila and Prasad [
8] demonstrated through N
2/CO
2 adsorption that shales typically contain organic pores, interparticle pores, and microcracks with distinct size distributions and wettability characteristics, whereas Clarkson [
9] verified using combined N
2 adsorption, MICP, and NMR that the integration of multiple techniques is essential for accurately characterizing shale storage spaces.
Previous studies have elucidated shale pore architectures and connectivity from multiple scales, forming two complementary research directions. The first focuses on quantitative characterization of nanopore structures using gas adsorption and mercury intrusion, clarifying the relationships between pore-size distribution and storage capacity. Loucks [
10] and Chalmers [
11], through CO
2/N
2 adsorption and field-emission scanning electron microscopy (FE-SEM), demonstrated that micropores and mesopores dominate shale storage; however, their work placed limited emphasis on micrometer-scale macropores and natural fractures, potentially leading to underestimation of their contribution to effective pore volume and flow pathways. Yang [
12] and Guo [
13] further highlighted that the development of microfractures significantly enhances pore-network connectivity and extends fluid transport pathways, playing a key role in mobilizing shale oil. Investigations by Hua et al. [
14,
15,
16] on the Chang 7 Member of the Yanchang Formation revealed that pore sizes primarily fall within 2–50 nm, and the pore-network exhibits a multi-level pattern of “micropore storage–mesopore transition–fracture conduction.” Complementing these domestic findings, Curtis [
17] and Klaver [
18] demonstrated using FIB-SEM and BIB-SEM that shale matrices commonly contain interconnected organic pores, intra-mineral pores, and nm–μm scale fracture networks, which together control effective porosity and fluid-accessible pathways. These international investigations collectively reinforce that pore-scale heterogeneity and organic–inorganic pore coordination are globally recognized governing factors of shale storage behavior.
The second research direction targets spatial analysis and dynamic response of pore–throat connectivity. Advances in microscopy and 3D imaging have enabled direct reconstruction of pore–throat networks. Techniques such as μCT and FIB-SEM allow the resolution of pores and fractures > 0.1 μm without the artifacts introduced by mercury intrusion, enabling robust two-dimensional–to–three-dimensional topological mapping when combined with adsorption and electron microscopy data. Chao [
19] and Raeesi [
20] showed through spontaneous imbibition and contact-angle tests that improved wettability significantly enhances capillary force and imbibition rate. He [
21] and Song [
22], based on integrated NMR–μCT analysis, found that increases in pore connectivity correlate linearly with imbibition rate and trigger mobility transitions controlled by a “connectivity threshold.” Zhang et al. [
23] further revealed a temperature–pressure coupled mechanism, whereby imbibition exhibits a “thermal enhancement–pressure suppression” behavior, indicating that structural strain and interfacial-energy variations exert strong control on imbibition dynamics. Beyond domestic investigations, several international studies have further elucidated the topological and transport constraints imposed by pore connectivity, tortuosity, and coordination number. Mehmani [
24] demonstrated via pore-network modeling that capillary-driven imbibition follows critical connectivity thresholds that shift flow regimes from interface-controlled to channel-dominated. Miletić [
25], using high-resolution micro-CT imaging, observed quantifiable pore-scale structural evolution in tight sandstones during spontaneous imbibition, including local porosity enhancement and reorganization of pore–throat linkages, indicating that fluid invasion can actively modify the functional flow network. Odusina [
26] showed through NMR analysis that wettability-induced variations in capillary pressure strongly regulate imbibition behavior and affect effective connectivity in shale. Razavifar [
27] provided a comprehensive evaluation of pore-structure characterization techniques for low-permeability rocks, highlighting limitations of gas-adsorption and mercury-intrusion methods and underscoring the necessity of integrating image-based techniques with multiphysics measurements to reliably quantify pore geometry, connectivity, and transport-relevant parameters. Moreover, Foroughi [
28] demonstrated that when contact angles are calibrated using μCT-derived pore geometries, both pore-network and Lattice-Boltzmann models can accurately reproduce fluid configurations and flow behavior, confirming the feasibility of predictive image-based pore-scale modeling.
Although originating from different engineering settings, these international findings collectively establish a unifying conceptual framework in which pore-scale topology governs imbibition dynamics. They further indicate that structural evolution and connectivity enhancement are inherent responses to fluid invasion in complex porous media.
In addition, recent advances in the study of mining-induced fracture systems—including diffusion evolution of grouting slurry within overlying strata and structural optimization of working-face entries—have highlighted the key role of fracture-network evolution and fluid–structure interaction under dynamic loading. Despite disciplinary differences, these studies underscore the broader relevance of connectivity evolution and multiscale flow pathways, offering conceptual insights for understanding pore–fracture interactions in geological media [
29,
30].
Despite these advances, several key issues remain unresolved. First, existing research lacks a unified quantitative framework that simultaneously incorporates pore–throat geometry (pore size, tortuosity), topological descriptors (coordination number, connectivity), and interfacial parameters (contact angle, surface tension). Second, the dynamic evolution of connectivity-threshold-controlled mobility transitions and their thermo-mechanical coupling mechanisms remain insufficiently validated through experiments. International studies have also repeatedly emphasized the absence of integrative models capable of linking pore geometry, wettability, topological evolution, and multi-field coupling, further confirming the global significance of this research gap. These gaps highlight the need for an integrated imbibition-dynamics model that links “pore–flow–interface” processes under multi-scale structural constraints, thereby improving the mechanistic understanding of shale oil occurrence and migration.
Unlike previous studies that separately investigated pore-scale storage states, wettability effects, or macroscopic imbibition behavior, this work establishes an integrated quantitative framework that couples pore–throat geometry, topological evolution, and μCT-derived structural reorganization during imbibition. For the first time, the coordination-number increase, connectivity enhancement, and tortuosity reduction induced by spontaneous imbibition are jointly quantified and linked to fluid-invasion pathways. This integrative evidence provides a previously unreported mechanism showing that imbibition not only redistributes fluids but also actively reconstructs pore networks, thereby distinguishing this study from existing models that treat pore structure as static during imbibition.
To systematically address these scientific gaps, this study is conducted in three sequential stages. (i) The first stage establishes the pore–throat geometrical and topological framework through gas adsorption, NMR T2 spectrum inversion, and μCT reconstruction, enabling quantitative determination of pore-size distribution, coordination number, connectivity, and tortuosity. (ii) The second stage investigates the dynamic imbibition response under multi-field conditions (temperature–pressure–wettability), including measurements of imbibition rate, equilibrium uptake, capillary pressure evolution, and the transition between interface-dominated and channel-dominated flow regimes. (iii) The third stage analyzes pore-network structural evolution during imbibition by integrating μCT voxel statistics, connectivity tracking, and interfacial energy analysis, leading to the formulation of a three-stage synergistic mechanism of “pore-throat activation–energy conversion–structural reconfiguration.” Together, these stages construct a unified experimental–topological framework for elucidating oil occurrence and capillary-driven migration in lacustrine shale systems.
2. Experimental Section
2.1. Materials and Instruments
- (1)
Materials:
Shale samples from the Chang 7 Member of the Yanchang Formation were collected from a continuous coring interval at depths of 2703.0–2704.0 m in the Ordos Basin. Five representative shale core samples (denoted A–E) were produced from this continuous coring interval and served as the basic sample set for all subsequent adsorption, NMR, μCT, wettability, and spontaneous imbibition experiments. After collection, the samples were dried at 105 °C for 12 h, crushed, and sieved to a particle size of 0.25–0.50 mm to ensure measurement consistency. All samples were subsequently washed with dichloromethane (analytical grade, Sinopharm Chemical Reagent Co., Ltd., Shanghai, China) to remove residual oil and then dried in a vacuum oven to eliminate moisture prior to testing. To ensure geological representativeness across the lithological variability of the Chang 7 Member, the five sample groups (A–E) were selected to span the major ranges of mineral composition, organic matter abundance, and pore–structure heterogeneity typical of this interval. XRD results show clay contents of 26.4–48.7%, quartz contents of 22.1–41.3%, and carbonate contents of 4.6–12.5%, encompassing the principal mineralogical end-members of the lacustrine shale. TOC values range from 6.1% to 12.8%, representing low-, medium-, and high-organic-matter facies. μCT-derived porosity spans 4.8–9.3%, and coordination numbers range from 1.9 to 3.8, capturing both low- and moderate-connectivity pore systems. The samples collectively include silt-rich laminae, massive mudstone, organic-rich layers, and microfractured units, thereby representing the key structural and compositional variations that control imbibition behavior. These considerations ensure that samples A–E adequately represent the geological heterogeneity of the Chang 7 shale and provide a robust basis for mechanism analysis.
- (2)
Instruments:
X-ray diffraction (XRD) analysis was performed using a D8 Advance diffractometer (Bruker, Berlin, Germany). Pore structure was characterized using an ASAP 2460 automated surface area and porosimetry analyzer (Micromeritics, Norwood, MA, USA), and specific surface area and pore-size distribution were calculated using the built-in MicroActive software (Version 3.0, Micromeritics, Norwood, MA, USA). Nuclear magnetic resonance (NMR) T2 measurements were conducted with a MacroMR12-150H-I low-field NMR analyzer (Niumag, Shanghai, China). Three-dimensional pore–throat structures were obtained using a Skyscan 1272 micro-computed tomography (μCT) system (Bruker MicroCT, Kontich, Belgium), with image reconstruction and quantitative analysis conducted using CTAn software (Version 1.18, Bruker MicroCT, Kontich, Belgium). Microscopic morphology was observed using an SU8020 field-emission scanning electron microscope (Hitachi, Tokyo, Japan). Wettability was evaluated using a JC2000D contact-angle goniometer (Zhongchen Digital Technology, Shanghai, China). Thermal control during imbibition tests was provided by an HH-6 thermostatic water bath (Yiheng Scientific Instruments, Shanghai, China). Drying and moisture removal were conducted with a DZ-2BC vacuum oven (Huxi Industrial, Shanghai, China). Sample dispersion was assisted by an SMI-5000 ultrasonic processor (Suotuo Scientific Instruments, Shanghai, China). Sample mass was measured with an FA2004B precision analytical balance (Jingke Instruments, Shanghai, China).
2.2. Experimental Methods
2.2.1. Specific Surface Area and Pore-Size Distribution
The specific surface area and pore-size distribution of the shale samples were measured using an ASAP 2460 surface area and porosimetry analyzer (Micromeritics, Norwood, MA, USA). Prior to testing, bulk shale cores were first crushed using a tungsten-carbide jaw crusher, and the resulting fragments were sieved to 60–80 mesh to ensure uniform particle size suitable for adsorption analysis. Samples were degassed under vacuum at 105 °C for 12 h to remove adsorbed water and residual gases. Nitrogen adsorption–desorption isotherms were obtained over a relative pressure range of 0.01–0.99. The Brunauer–Emmett–Teller (BET) model was used to calculate the specific surface area, while the Barrett–Joyner–Halenda (BJH) method was applied to analyze micropore and mesopore volume distributions. All adsorption and desorption branches were collected with a 30 s equilibration time at each pressure step to ensure measurement stability. These parameters were used to characterize the multi-scale pore structure of the shale.
2.2.2. Microscopic Structure and Pore–Throat Connectivity
The microscopic pore morphology was observed using an SU8020 field-emission scanning electron microscope (Hitachi, Japan). Shale blocks were cut into 5 mm × 5 mm × 3 mm pieces, embedded in epoxy resin, and polished with progressively finer diamond suspensions (6 μm → 3 μm → 1 μm). Surfaces were coated with a ∼10 nm gold layer prior to imaging. High-resolution micrographs were captured at an accelerating voltage of 5 kV to identify pore–throat morphologies and structural types.
Three-dimensional pore–throat connectivity was analyzed using a SkyScan 1173 μCT scanner (Bruker MicroCT, Kontich, Belgium) with a spatial resolution of 0.2 μm. Scanning was performed over a rotation range of 0–180° with an exposure time of 800 ms. Beam hardening correction (20%) and ring-artifact reduction (10%) were applied during reconstruction to ensure high-quality voxel resolution. Image reconstruction was conducted using NRecon software (Bruker MicroCT, Kontich, Belgium), followed by segmentation, voxel analysis, and skeleton extraction using CTAn software (Version 1.18, Bruker MicroCT, Kontich, Belgium) and Avizo software (Version 2021.1, Thermo Fisher Scientific, Waltham, MA, USA). Topological parameters including pore–throat radius distribution, coordination number, tortuosity, and connectivity were obtained. These data provided the structural basis for digital core reconstruction and pore-network flow modeling.
2.2.3. Fourier Transform Infrared Spectroscopy (FTIR)
Organic matter structures and surface functional groups of the shale samples were analyzed using a Tensor 27 FTIR spectrometer (Bruker, Germany). Powdered samples were dried at 60 °C for 6 h prior to testing to remove moisture that may interfere with absorption peaks. Measurements were performed in attenuated total reflectance (ATR) mode over a wavenumber range of 4000–400 cm−1, with a resolution of 4 cm−1 and 32 accumulated scans. Variations in characteristic absorption peaks (e.g., C = O, C–H, Si–O) were examined to qualitatively assess the influence of organic matter and clay minerals on pore-surface chemical properties.
2.2.4. NMR T2 Relaxation Analysis
Fluid occurrence states in the shale were characterized using a MesoMR23-060H NMR imaging system (Niumag, China). Measurements were conducted at 23 MHz with an echo spacing of 0.2 ms and 8000 echoes. Before saturation, samples were dried at 60 °C for 24 h and weighed to obtain dry mass M0. After vacuum saturation, samples were tested under isothermal conditions at 60 °C, selected to reflect the representative reservoir temperature of the Chang 7 Member and to maintain experimental stability without inducing thermal alteration of the pore structure. T2 relaxation distributions were obtained through inverse Laplace transformation and used to distinguish adsorbed oil (T2 < 1 ms), bound oil (1–10 ms), and movable oil (T2 > 10 ms). The integrated T2 components were used to evaluate the distribution of oil in different pore-size intervals and assess pore connectivity. Repeatability was evaluated by conducting duplicate measurements on each specimen, and deviations remained within 3%.
2.2.5. X-Ray Diffraction (XRD) and Total Organic Carbon (TOC)
Mineralogical compositions were determined using a D8 Advance X-ray diffractometer (Bruker, Germany) with Cu–Kα radiation (λ = 1.5406 Å), operated at 40 kV and 30 mA. Samples were milled to <200 mesh to ensure representative mineralogical quantification. Scans were performed over a 2θ range of 5–80° with a step size of 0.02°. Quantitative mineral analysis was conducted via Rietveld refinement.
Total organic carbon (TOC) content was measured using a MultiEA 4000 elemental analyzer (Analytik Jena, Jena, Germany). Samples were pretreated with HCl to remove inorganic carbon and subsequently combusted at 950 °C. The instrument automatically corrected CO2 yield using calibration standards to ensure analytical accuracy. XRD and TOC results were combined to establish the coupled “mineral–organic matter–pore structure” relationships.
2.2.6. Spontaneous Imbibition Experiments
Spontaneous imbibition tests were conducted using an HH-6 thermostatic water bath to maintain a constant temperature. Deionized water was used as the imbibition fluid, and the temperature was fixed at 60 °C. Cylindrical samples (φ25 mm × 25 mm) were dried to constant mass and their initial dry mass M0 was recorded. Vacuum-degassed samples were brought into contact with water, and mass changes were recorded over 150 min. The relationship between imbibition mass and the square root of time (√t) was used to determine the initial imbibition rate constant k and the equilibrium uptake meq based on linear regression. Each experiment was repeated three times, and the average values were reported.
2.2.7. Wettability Measurements
Wettability parameters were measured using a JC2000D contact-angle goniometer (Zhongchen, China). Rock slices were ground to a smooth surface (roughness < 50 nm) before testing to eliminate surface irregularity effects. Deionized water was used as the probe liquid, and tests were conducted at 60 °C. Five measurements were taken for each sample, and the average value was reported. Surface tension was determined using a KRÜSS DSA100 tensiometer (KRÜSS, Hamburg, Germany). The wettability index (
WI) was calculated as:
This parameter reflects the affinity of the shale surface toward the imbibition fluid, enabling quantitative assessment of wettability effects on imbibition rate and uptake capacity.
2.2.8. μCT 3D Reconstruction and Topological Analysis
Reconstructed μCT datasets were processed using NRecon and CTAn software and then imported into Avizo 2020.2 for segmentation and skeletonization. Noise reduction was performed using a non-local means filter, and thresholding was optimized using Otsu’s method to ensure accurate pore identification. Three-dimensional visualization was used to extract the number of primary flow channels, branch lengths, and connectivity probability (PL). Effective pore volume and average coordination number were also calculated. Topological descriptors were cross-compared with imbibition parameters (k, meq) using Pearson correlation analysis to quantify the pore–connectivity–transport relationship.
3. Results and Discussion
3.1. Oil Occurrence Modes and Interfacial Mechanisms in Shale
3.1.1. Zonation of Shale Oil Occurrence Across Pore Sizes
Analyses of the Chang 7 shale samples reveal a distinct zonation of oil occurrence across different pore-size intervals, with the relevant testing procedures described in
Section 2.2.1. The main experimental results are presented in
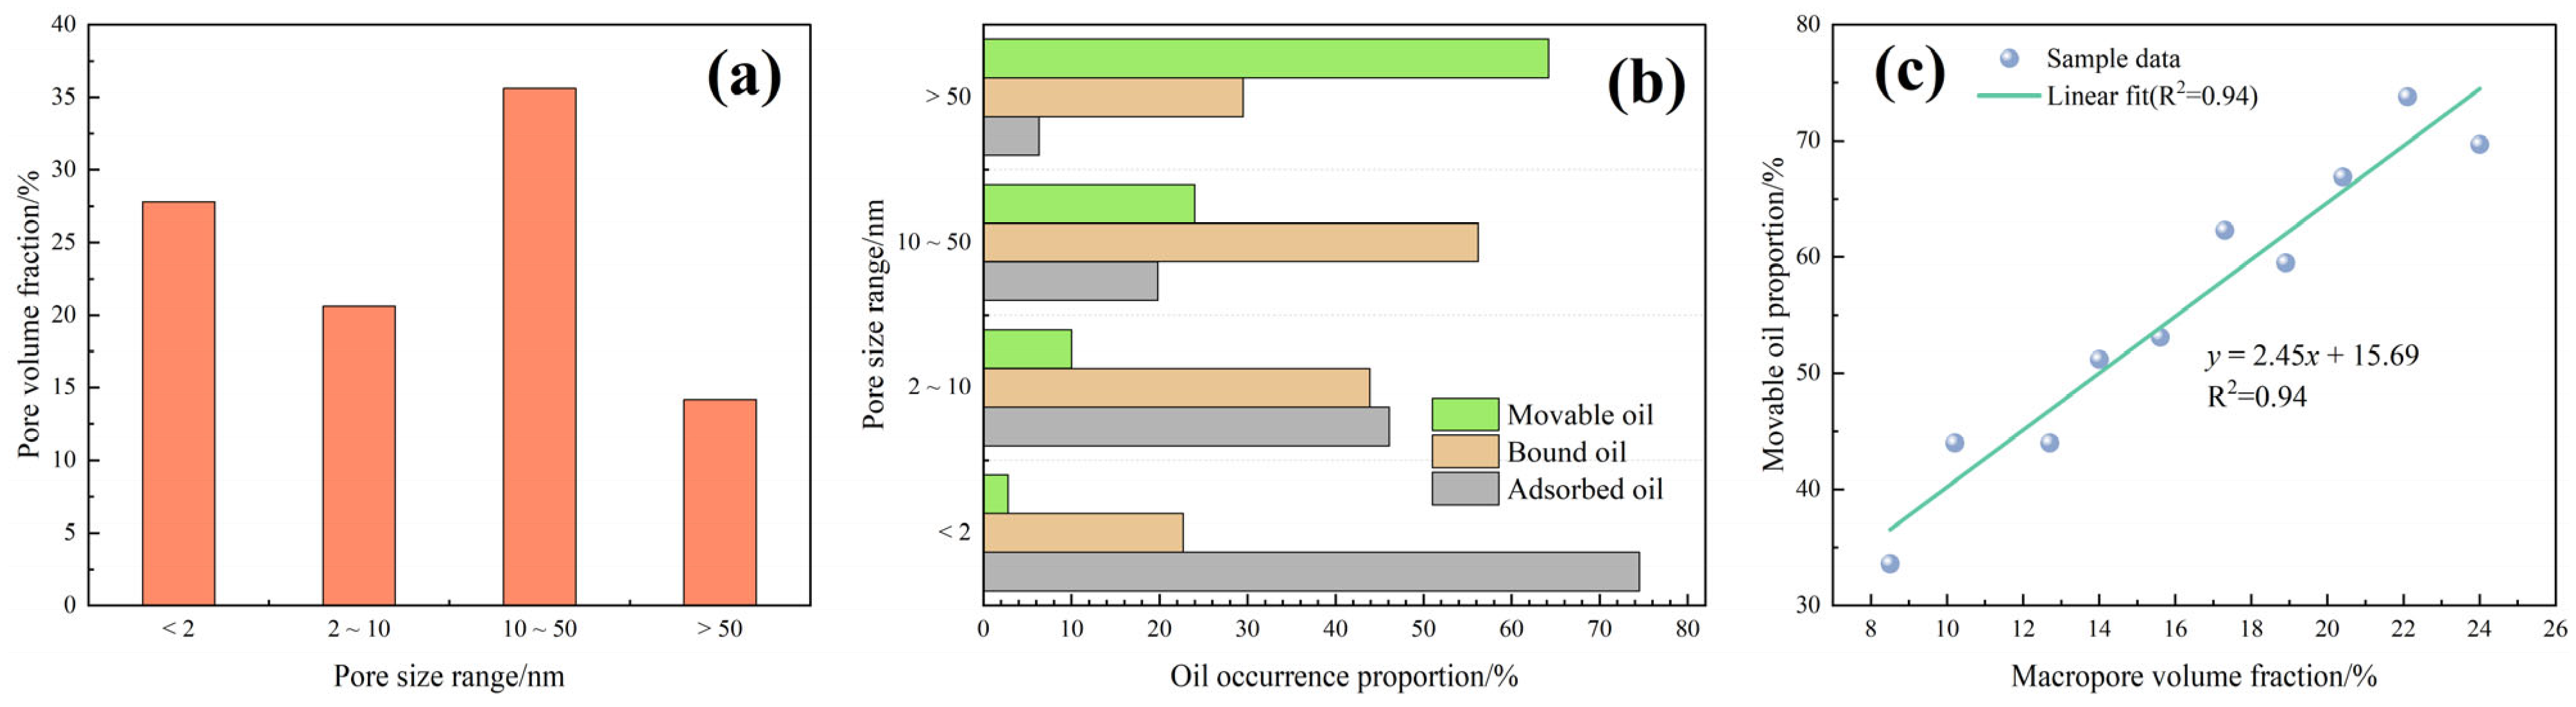
Figure 1.
As shown in
Figure 1a, the pore volume is dominated by mesopores (2–50 nm), accounting for 35.6%, followed by micropores (<2 nm, 27.8%) and macropores (>50 nm, 14.2%). Correspondingly, the distribution of oil-phase components across these pore-size intervals (
Figure 1b) demonstrates a clear dependence of oil occurrence on pore size. Micropores contain the highest proportion of adsorbed oil (74.5%) due to their small curvature radius and large specific surface area, which promote mono- or multilayer adsorption films tightly attached to pore walls. Mesopores host predominantly bound oil (56.2%), where capillary pressure and interfacial tension jointly facilitate the formation of quasi-continuous thin films. In contrast, macropores and microfractures provide the primary storage space for movable oil, with a movable-oil proportion of up to 64.2%, indicating reduced capillary resistance and the onset of localized slip and volumetric flow. In this study, the term “movable-oil fraction” refers to the fraction of oil hosted in pores larger than 50 nm or in microfractures, where capillary resistance is sufficiently low to permit bulk fluid displacement. Quantitatively, this movable-oil proportion is obtained from the oil-phase volume associated with macropores, as shown in
Figure 1b.
Beyond their role as the principal hosts of movable oil, macropores (>50 nm) exert a controlling influence on large-scale fluid transport. Their wide apertures generate extremely low capillary resistance, allowing rapid fluid entry once connected to adjacent throats. In addition, macropores tend to form relatively straight and high-conductivity pathways that reduce local tortuosity and facilitate the merging of mesopore clusters into continuous flow networks. These structural characteristics indicate that macropores function as backbone conduits within the multi-scale pore system, and even modest variations in their volume fraction or connectivity can produce disproportionate enhancements in oil mobility and bulk imbibition efficiency.
A quantitative correlation further reveals that the fraction of movable oil exhibits a strong linear relationship with the macropore volume fraction (R
2 = 0.94) (
Figure 1c). This result confirms that an increase in pore–throat radii significantly enhances oil mobility.
Overall, the occurrence pattern of shale oil in the Chang 7 shale can be categorized into a three-tier zonation model: “micropore adsorption–mesopore confinement–macropore mobility.” This hierarchical pore-size distribution governs the spatial occurrence modes and mobility fractions of the oil phase at the macro-scale, and provides essential structural constraints for subsequent analyses on spatial distribution and imbibition–flow coupling. Within this zonation, mesopores are not only passive “confinement spaces” but also provide the main reservoir for bound and early-stage movable oil and form the key transitional bridges between isolated nanopore clusters and connected macropore–fracture channels. Consequently, even relatively small changes in mesopore volume fraction and connectivity can significantly modify the partitioning among adsorbed, bound, and movable oil, and thus alter the macroscopic imbibition response.
3.1.2. Spatial Distribution of Shale Oil in the Multi-Scale Pore System
The spatial distribution of shale oil in the multi-scale pore system exhibits pronounced heterogeneity and hierarchical characteristics, as demonstrated by μCT reconstruction and NMR T
2 analyses (
Section 2.2.2 and
Section 2.2.4).
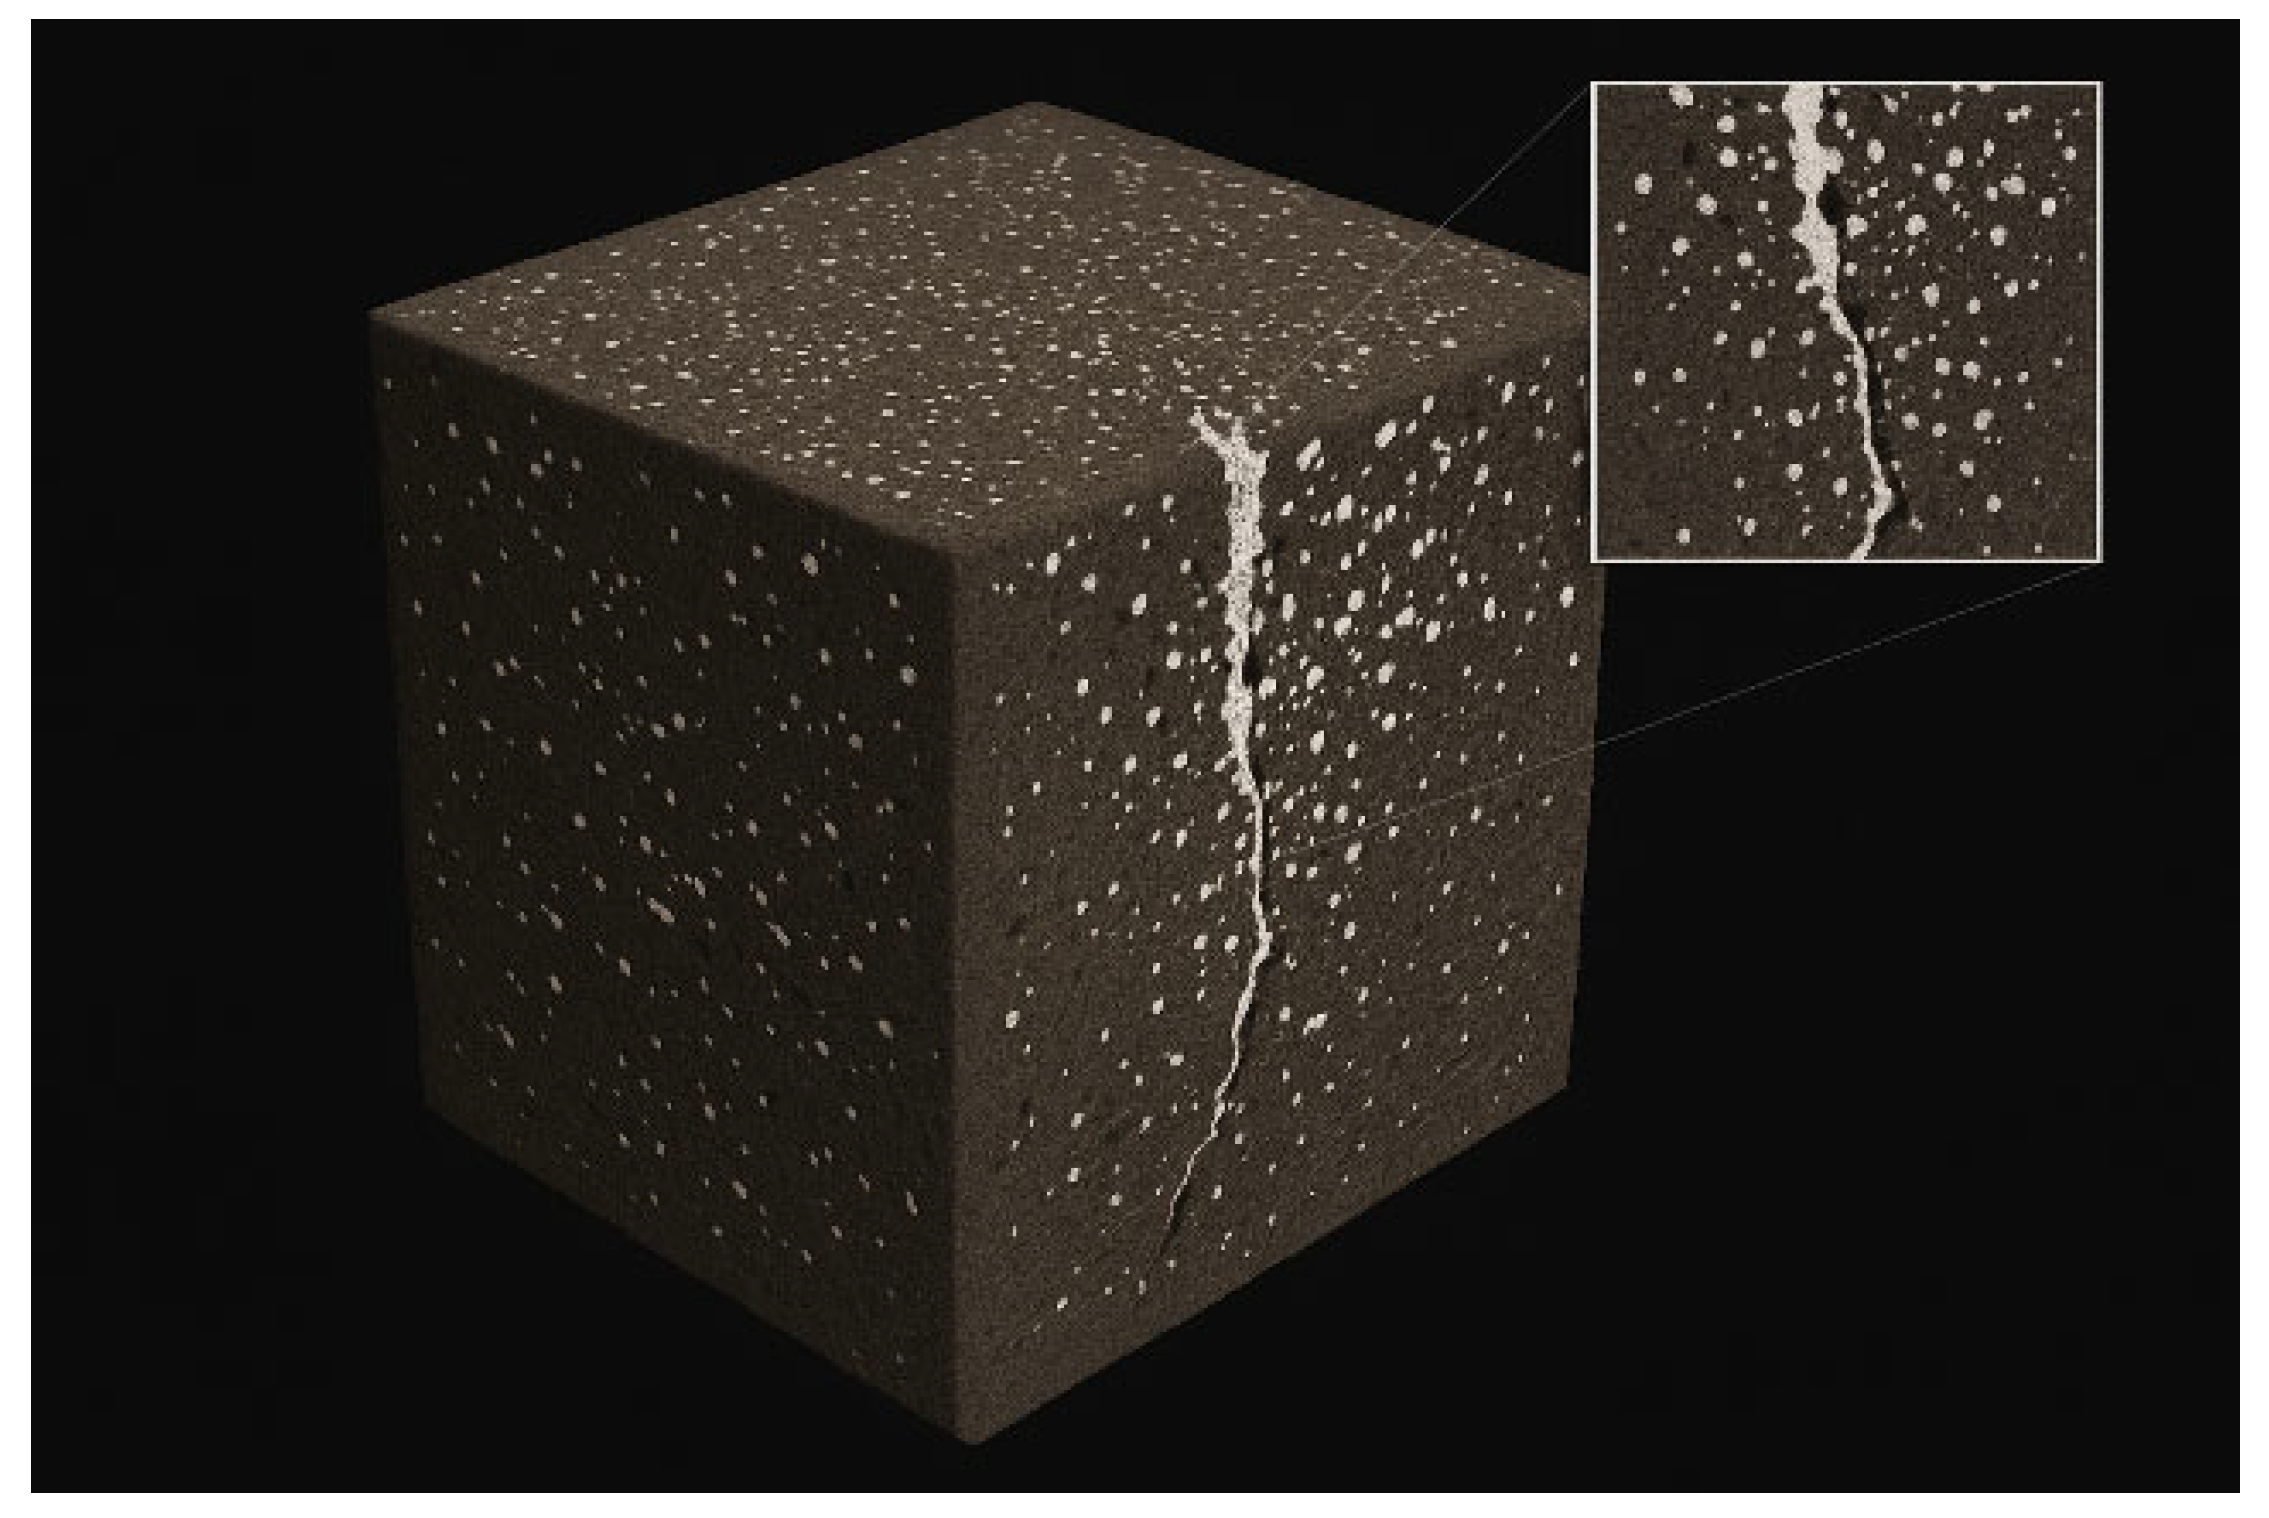
The μCT three-dimensional reconstructions of the Chang 7 shale (
Figure 2) reveal that the pore system is composed of isolated nanopores, semi-connected mesopores, and a limited number of penetrating microfractures. Pore connectivity increases progressively from bottom to top along the vertical profile. As shown in
Table 1, when the pore-throat radius increases from 2 to 100 nm, connectivity improves from 18.4% to 47.3%, while the pore-volume fraction rises from 26.1% to 52.7%. This trend indicates that, while macropores and fractures provide long-range flow pathways, mesopores act as the critical bridging elements within the pore–throat network: they connect clusters of adsorption-dominated nanopores to the macropore–fracture system and thereby control the spatial expansion of the movable-oil domain.
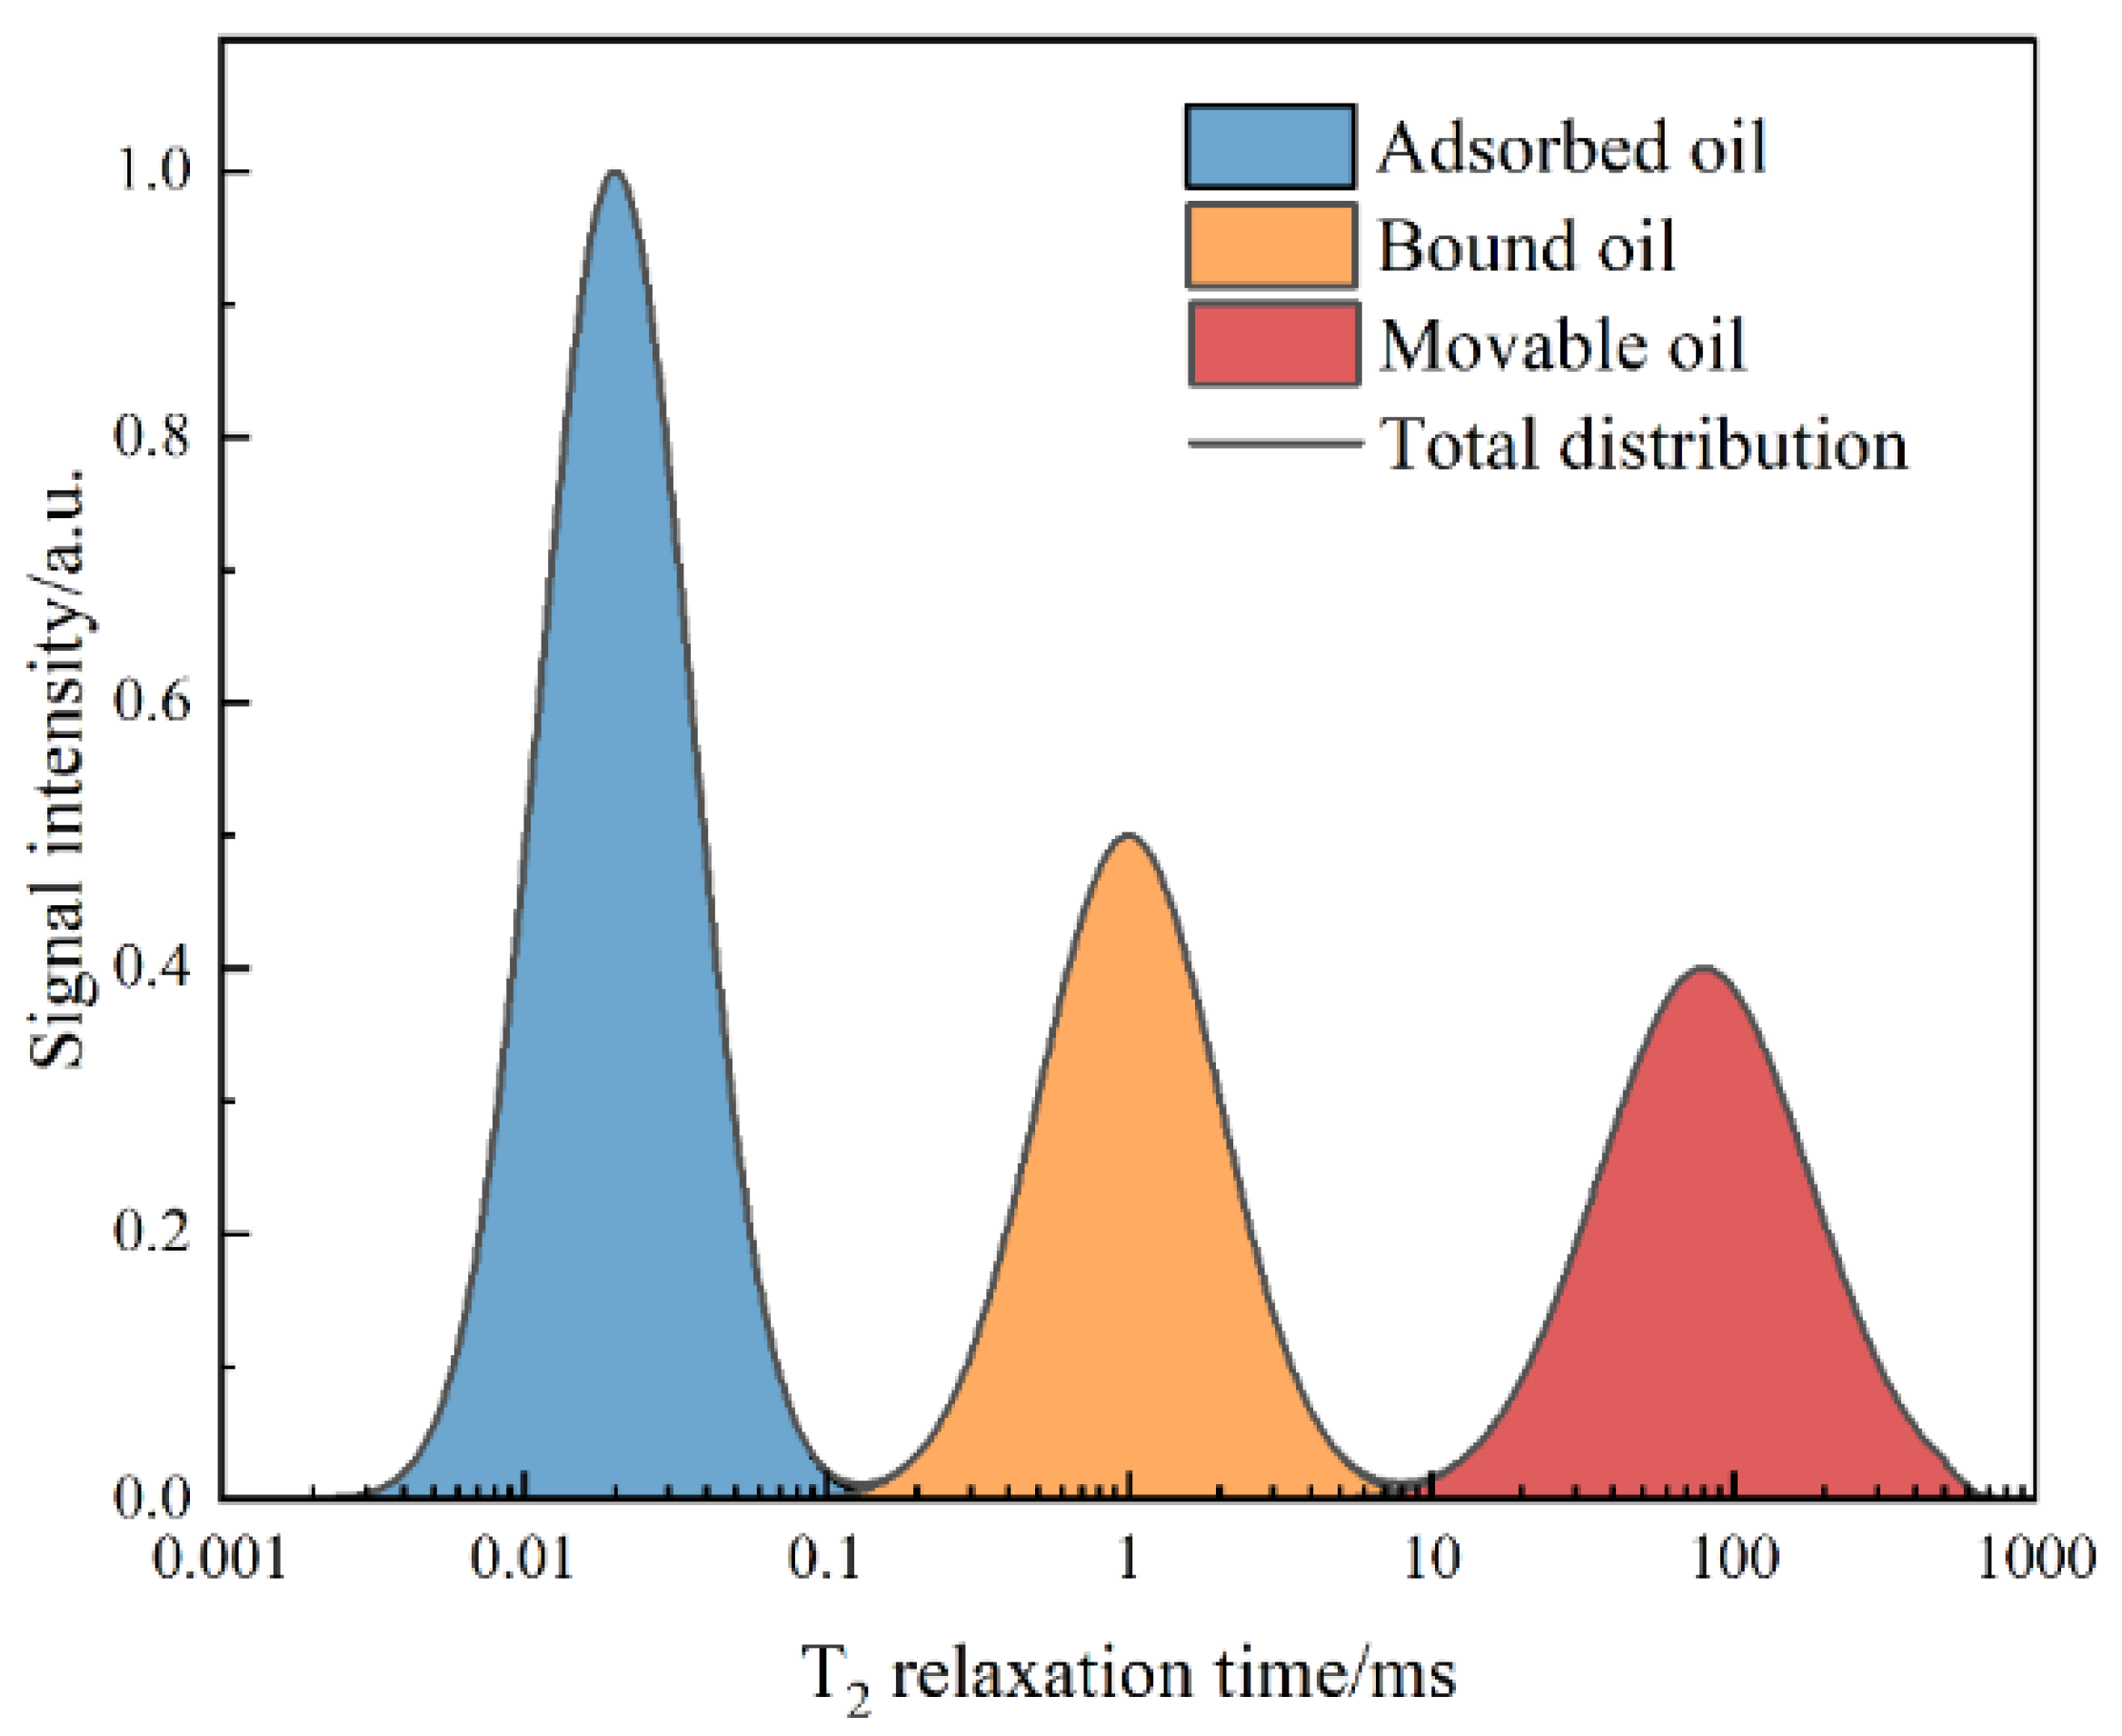
Integration of NMR T
2 data (
Figure 3;
Table 2 and
Table 3) further clarifies the oil-occurrence patterns. Shale oil predominantly occurs in three types of regions:
- (1)
Adsorbed oil in isolated nanopores, forming uniformly distributed thin films within organic matter-dominated pores;
- (2)
Bound oil in mesopores and fine microfractures, accumulating as discontinuous or semi-continuous films;
- (3)
Movable oil in macropores and fracture networks, continuously distributed along connected flow pathways.
Figure 3.
NMR T2 spectra and three-tier occurrence model of adsorbed, bound, and movable oil.
Figure 3.
NMR T2 spectra and three-tier occurrence model of adsorbed, bound, and movable oil.
Table 2.
Vertical variation in connectivity, movable-oil proportion, percolation probability, and average channel length.
Table 2.
Vertical variation in connectivity, movable-oil proportion, percolation probability, and average channel length.
| Depth/m | Connectivity/% | Movable Oil/% | PL (Dimensionless) | Avg. Channel Length/mm |
|---|
| 2703.0~2703.2 | 18.4 | 22.1 | 0.31 | 1.6 |
| 2703.2~2703.4 | 25.6 | 31.8 | 0.42 | 2.1 |
| 2703.4~2703.6 | 33.2 | 41.7 | 0.56 | 2.9 |
| 2703.6~2703.8 | 40.5 | 52.3 | 0.69 | 3.7 |
| 2703.8~2704.0 | 47.3 | 57.9 | 0.77 | 4.4 |
Table 3.
Structural zones and oil-phase occurrence proportions.
Table 3.
Structural zones and oil-phase occurrence proportions.
| Structural Zone | Adsorbed/% | Bound/% | Movable/% |
|---|
| Isolated nanopores (organic-rich) | 82.4 | 16.1 | 1.5 |
| Semi-connected mesopores (film oil) | 28.7 | 54.2 | 17.1 |
Connected macropore–fracture
network | 7.6 | 27.4 | 65.0 |
Statistical analyses show that movable-oil proportion increases systematically with pore-throat connectivity. When connectivity exceeds 40%, the average movable-oil fraction rises by approximately 22%, indicating that structural connectivity is the dominant factor governing the spatial expansion and mobility of shale oil.
A combined interpretation of
Table 3 and
Table 4 demonstrates that micropores primarily host adsorbed oil, mesopores contain a high fraction of bound oil, and macropores–fractures are enriched in movable oil, forming a three-tier “adsorbed–bound–movable” spatial configuration (
Figure 3). Notably, the connected macropore–fracture system markedly increases the percolation probability
PL (from 0.31 to 0.77) and significantly enhances the long-relaxation T
2 component (T
2 > 10 ms), confirming its role as the primary conduit for movable oil.
Overall, the spatial distribution of shale oil in the Chang 7 shale exhibits a hierarchical pattern of “isolated adsorption zone—semi-connected confinement zone—fully connected mobility zone”. Within this framework, the connected mesopore–macropore–fracture system forms the dominant transport pathway for movable oil. In particular, the semi-connected mesopore domain acts as the critical transition region that determines whether adsorbed and bound oil can be effectively transferred into the mobility zone. Consequently, mesopore connectivity is a key internal factor controlling the shift from interface-limited flow to network-scale imbibition, providing the structural basis for subsequent analyses of imbibition dynamics.
3.1.3. Composition-Controlled Effects on Pore Structure and Oil Occurrence
The mineralogical composition and organic matter content exert a pronounced influence on the pore structure and oil-occurrence states of the Chang 7 shale (testing methods described in
Section 2.2.3 and
Section 2.2.5). The XRD–TOC results and corresponding pore-structure parameters for samples A–E are summarized in
Table 4.
As shown in
Table 4, quartz + feldspar content increases from 41.8% to 57.3% from sample A to E, while clay-mineral content decreases from 38.6% to 27.4%. TOC ranges from 3.2% to 7.1%. Although the mineral types remain consistent across samples, their proportions vary and produce differentiated effects on pore formation. With increasing quartz and TOC content, both pore-volume fraction and the proportion of larger pores increase systematically; the average pore size increases from 12.6 to 23.4 nm, and connectivity rises to 46.8%. These trends indicate that brittle minerals promote the development of connected pore–throat pathways, whereas organic matter contributes predominantly to nanopore-dominated adsorption sites.
A more detailed examination of the clay components reveals that the samples contain different proportions of illite and illite–smectite (I/S) mixed-layer minerals, which impart contrasting controls on pore architecture. Illite-rich samples (e.g., Sample A with 22.4% illite) exhibit stronger layer-bonding strength and higher structural rigidity, which facilitate the preservation of slit-shaped pores and microfractures. These features enhance meso–macropore continuity and moderately increase the proportion of movable oil. In contrast, samples with higher I/S mixed-layer content (e.g., Samples C–E with 14–12%) show stronger hydration tendencies and greater surface polarity, leading to partial throat constriction, increased tortuosity, and enhanced capillary confinement. These characteristics shift the oil-occurrence pattern toward higher proportions of adsorbed and bound oil within nanopore domains.
The comparison indicates that illite performs better than I/S mixed layers in promoting fluid mobility because its lower swelling capacity and stronger structural stability help maintain open pore–throat geometries. However, I/S mixed layers are more effective in generating abundant adsorption sites due to their high surface activity and interlayer water retention. Therefore, the influence of clay minerals on oil occurrence is not unidirectional but reflects a competitive balance between structural preservation (illite) and capillary confinement (I/S).
Overall, the oil-occurrence characteristics of the Chang 7 shale are governed by a synergistic composition-controlled mechanism: organic matter generates adsorption-dominated nanopores; clay-mineral subtypes modulate pore-scale confinement and throat openness, and brittle minerals promote the development of mesopores, macropores, and microfractures that enhance movable-oil flow. Within this ternary system, illite-rich clay assemblages show superior performance in supporting movable-oil migration due to their lower swelling potential and better microfracture preservation, whereas I/S-rich assemblages contribute mainly to adsorbed and bound-oil storage. This ternary coupling model—“organic matter–clay–brittle minerals”—clarifies the intrinsic links between composition, pore-structure development, and fluid occurrence, and provides essential material constraints for subsequent imbibition-dynamics analysis.
3.1.4. Microscopic Configuration and Pore–Throat Network Characteristics
The microscopic configuration of the pore–throat system plays a direct role in hydrocarbon storage and migration behaviors in shale (testing procedures described in
Section 2.2.8). Based on μCT voxel datasets, three-dimensional digital cores were reconstructed at a spatial resolution of 0.2 μm to identify the geometry and connectivity of pore–throat structures. Image segmentation, skeleton extraction, and topological analysis yielded quantitative parameters including pore–throat radius, coordination number, tortuosity, and connectivity (
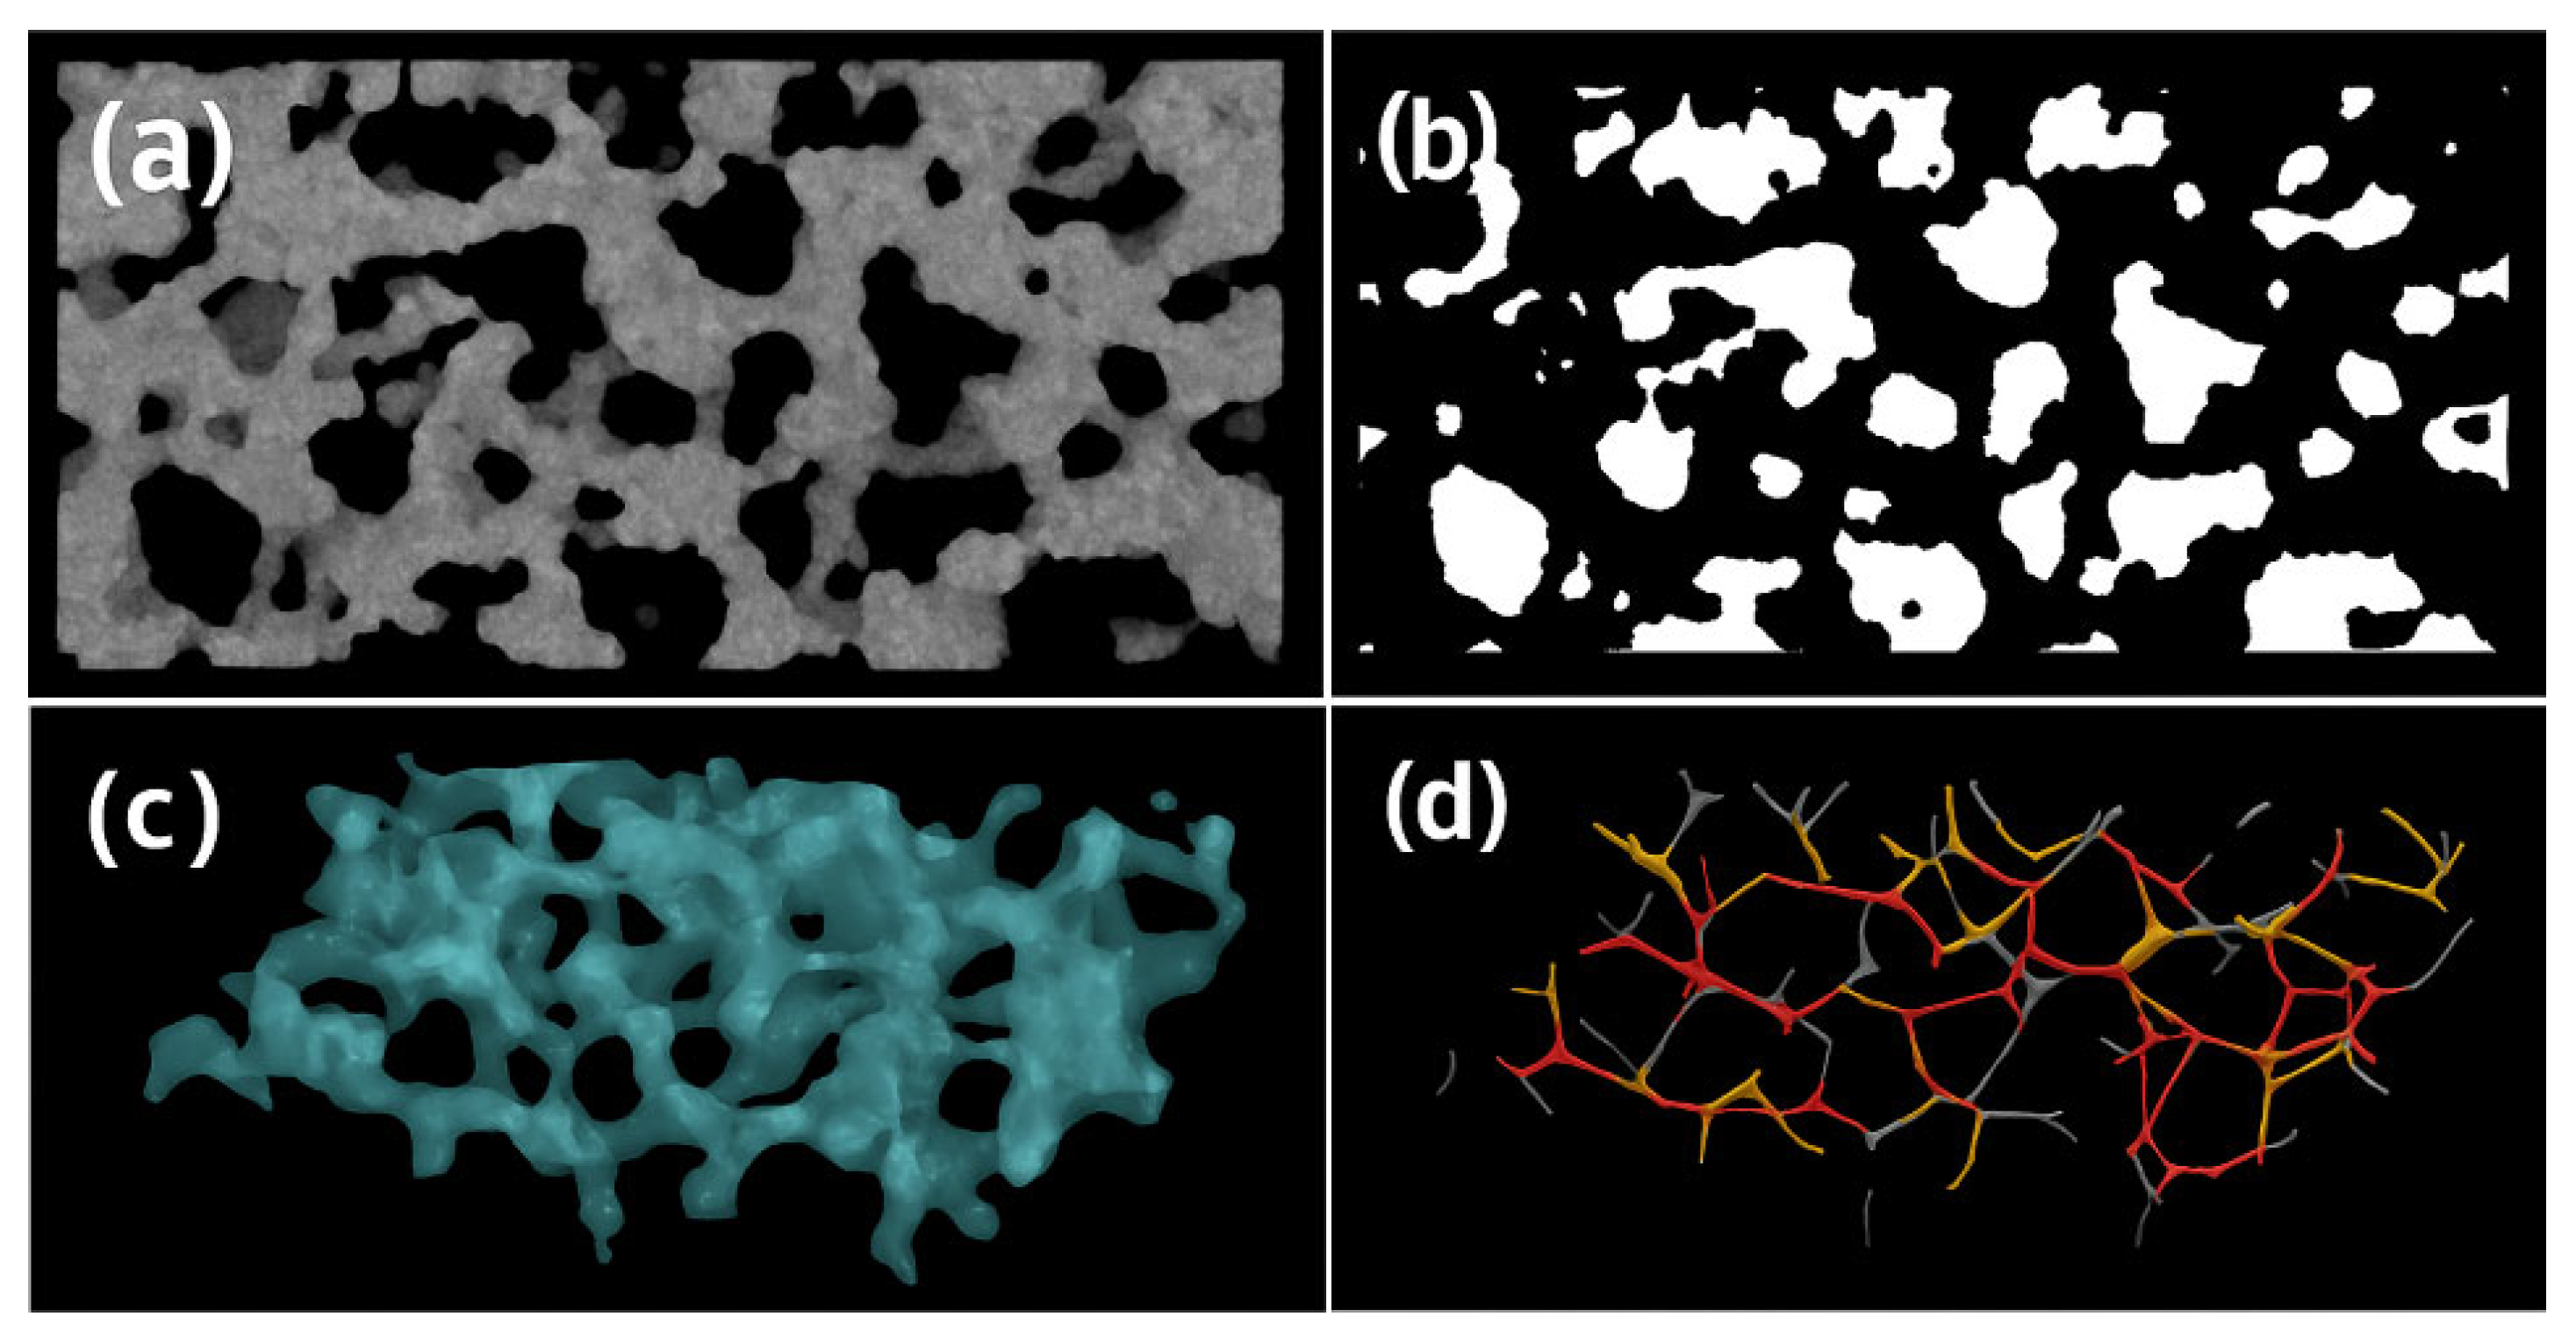
Table 5). These parameters were subsequently used to develop representative digital-core models (
Figure 4).
As indicated by
Table 5, the pore–throat system of the Chang 7 shale exhibits a typical multi-scale bimodal distribution. Micropores (<1 μm) account for ~30% of the total pore volume, yet possess low coordination numbers (1.7) and high tortuosity (4.1), indicating that they function mainly as isolated storage domains. In contrast, meso–macropores (1–10 μm) contribute ~47% of the pore volume, with the coordination number increasing to 3.5 and connectivity rising to 44.6%, thereby forming the principal migration channels for shale oil. Although fracture-scale throats (>10 μm) account for only ~24%, they exhibit the highest coordination number (4.1) and connectivity (58.1%), establishing the backbone of the flow network.
A linear regression between tortuosity and connectivity yields a pronounced negative correlation (R2 = 0.91), indicating that straighter and less tortuous pore–throat pathways result in reduced flow resistance and enhanced fluid-migration capability.
The reconstructed digital cores in
Figure 4 provide additional visual evidence. The grayscale slices and binary images (
Figure 4a,b) reveal marked heterogeneity in spatial pore distribution. The 3D pore geometry (
Figure 4c) demonstrates that meso–macropores dominate the pore network, forming a hierarchical structure that transitions from dispersed micropores to an interconnected fracture network. The skeletonized network (
Figure 4d) highlights high-coordination primary channels with strong connectivity, consistent with the contributions of high-connectivity zones identified in the voxel statistics.
Overall, the pore–throat system of the Chang 7 shale can be subdivided into three structural domains:
- (1)
low-connectivity micropore clusters,
- (2)
moderately connected mesopore groups, and
- (3)
high-connectivity fracture-dominated pathways.
These domains collectively form a hierarchical architecture of “micropore storage—mesopore transition—fracture conduction,” providing the fundamental microscale channel framework that governs shale-oil occurrence and imbibition–flow coupling. Within this hierarchy, the mesopore groups serve as the key structural intermediaries, as they integrate a substantial proportion of the effective pore volume while offering moderate coordination numbers and tortuosity; consequently, even subtle variations in mesopore abundance or connectivity can materially reshape the available pathways for spontaneous imbibition and large-scale fluid migration.
3.2. Imbibition–Transport Coupling and Multiscale Migration
3.2.1. Imbibition Kinetics
To characterize the spontaneous imbibition behavior of the Chang 7 shale under different pore–throat structures (testing procedures in
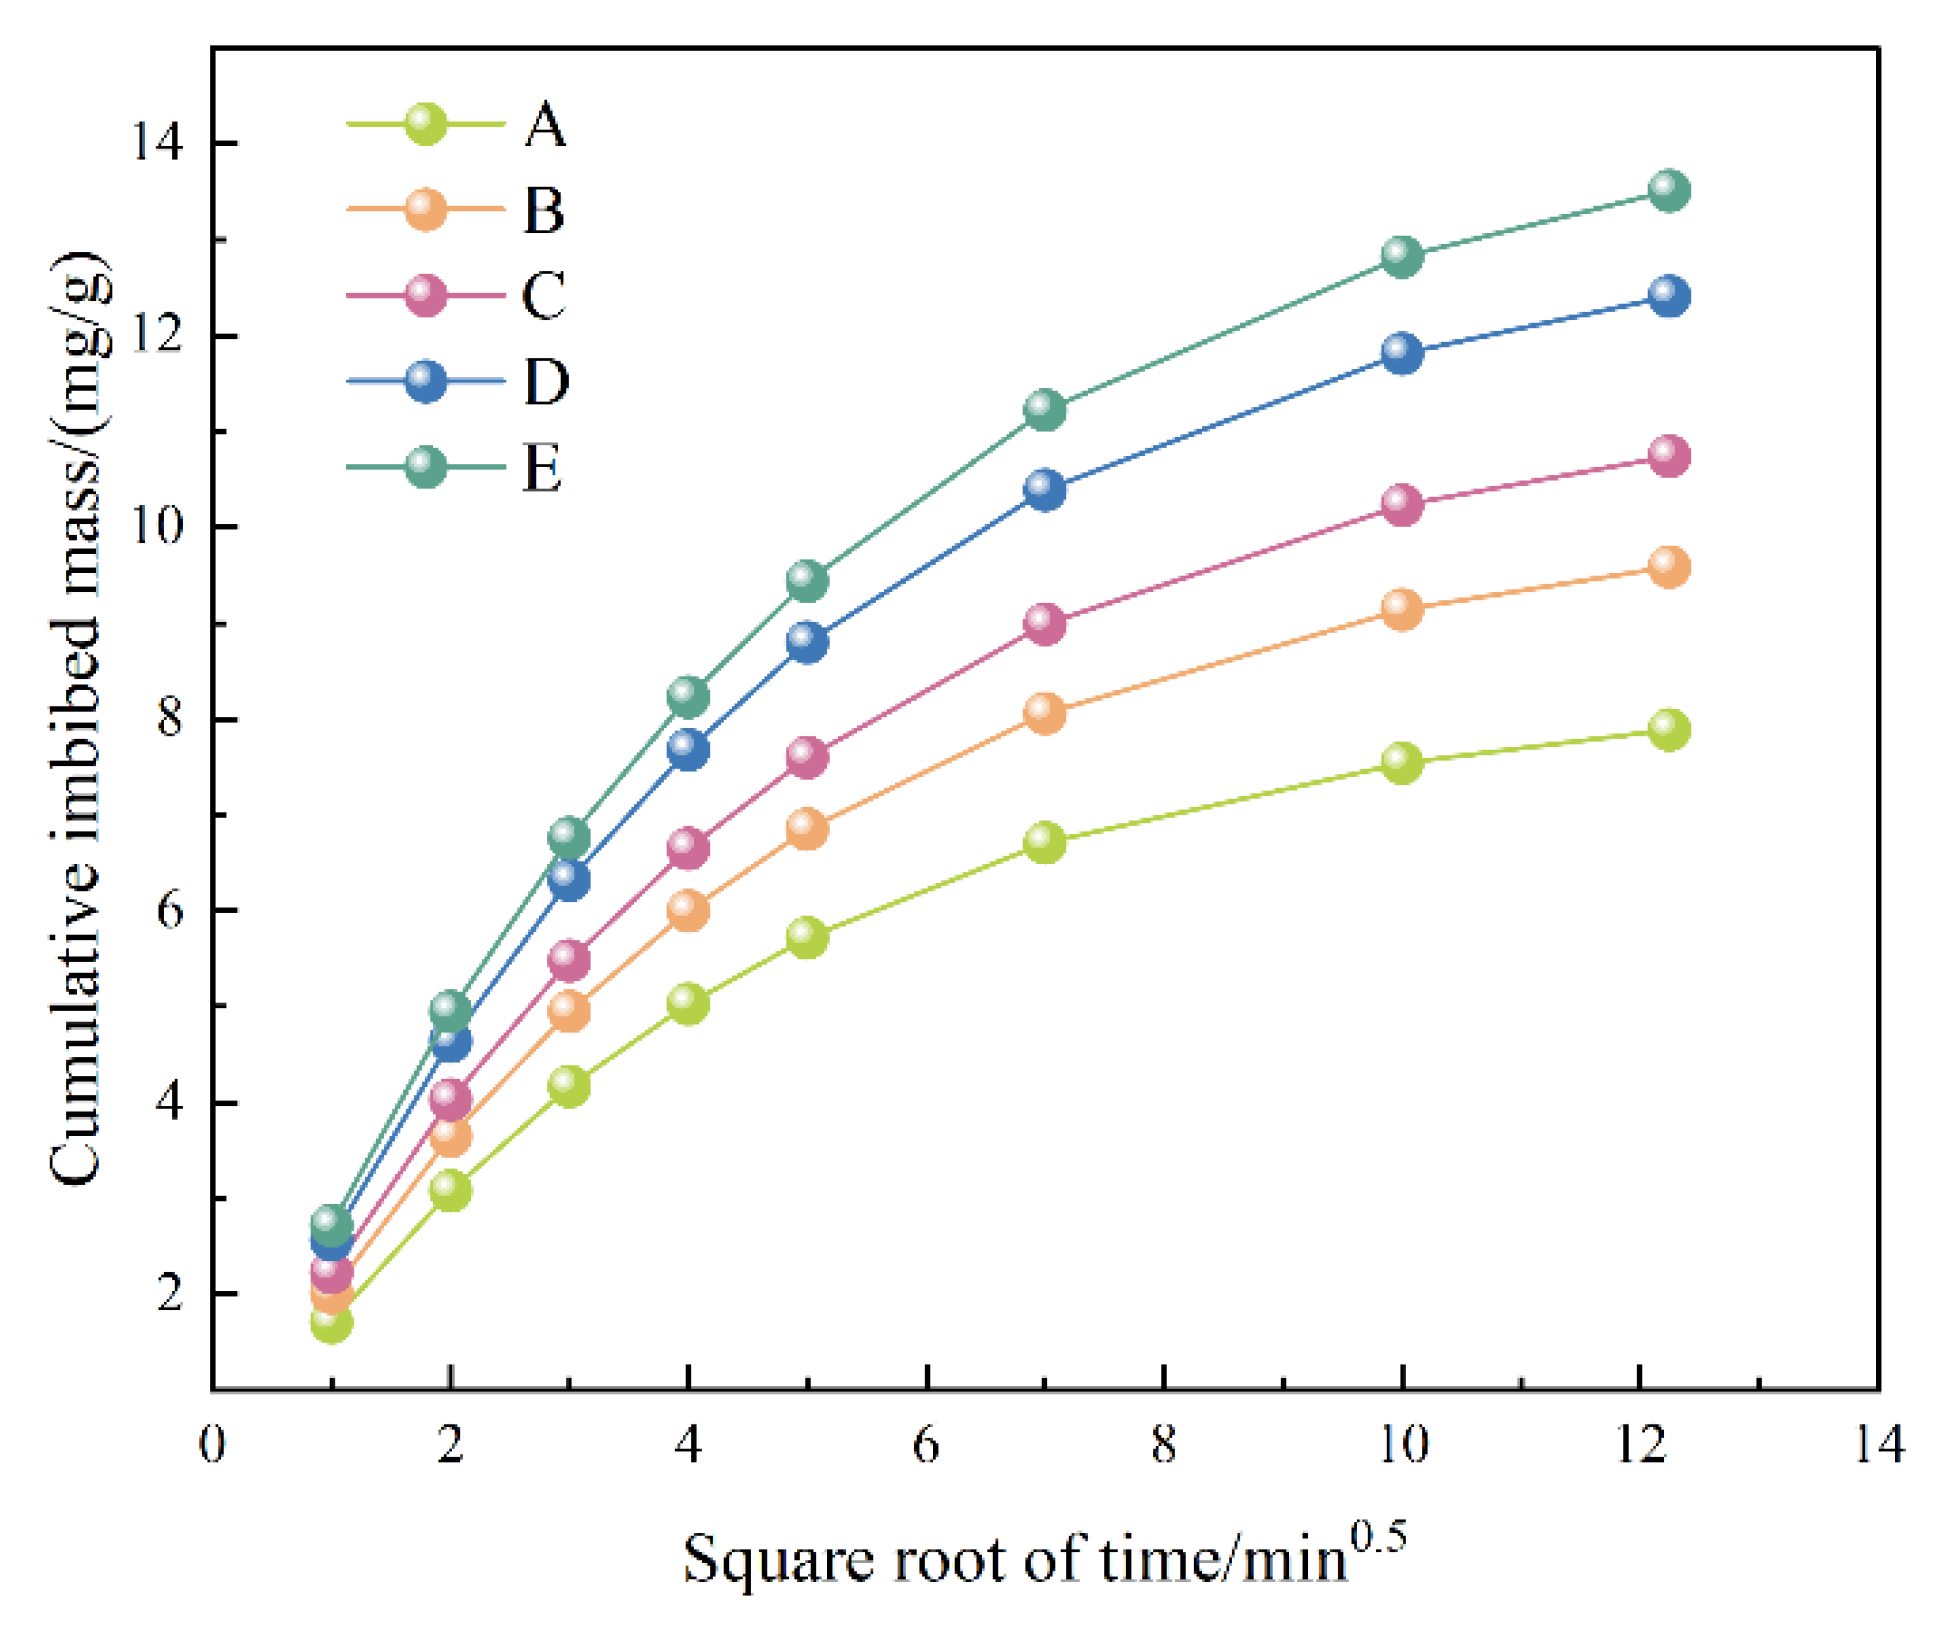
Section 2.2.6), representative samples A–E were subjected to capillary-driven imbibition tests using deionized water at 60 °C. The mass of imbibed fluid was continuously recorded, capturing a rapid uptake stage within the first 30 min followed by a slower diffusion-dominated stage over the subsequent 120 min. The imbibition data were fitted using the square-root-of-time (√
t) model to determine the initial imbibition rate (
k), equilibrium uptake (
meq), and fitting coefficients (R
2). The results are listed in
Table 6 and illustrated in
Figure 5.
As shown in
Figure 5 and
Table 6, all samples exhibit a characteristic three-stage imbibition profile:
- (1)
Rapid stage (√t < 4 min0.5):
The imbibition rate increases sharply, dominated by capillary pressure.
- (2)
Transition stage (4 ≤ √t ≤ 10 min0.5):
The slope progressively decreases as imbibition becomes increasingly constrained by pore–throat tortuosity and interfacial resistance.
- (3)
Quasi-equilibrium stage (√t > 10 min0.5):
The uptake approaches a plateau, indicating the entry into a diffusive–equilibrium regime.
A systematic increase in both meq and k is observed with enlarging pore size. As the average pore diameter increases from 12.6 nm to 23.4 nm, the equilibrium uptake rises from 8.4 to 14.7 mg/g, and k increases from 1.92 to 3.02 mg·g−1·min−0.5. This trend confirms that enlargement of the capillary-active pore–throat network substantially enhances both the imbibition capacity and the initial uptake rate. It is noted that this enlargement primarily reflects an increase in the abundance and connectivity of mesopores, rather than a simple expansion of isolated macropores. Because mesopores provide the dominant intermediate-scale pathways linking micropore clusters to macropore–fracture channels, their progressive development from samples A to E offers the primary structural explanation for the observed increases in k and meq.
Samples D and E exhibit R2 values above 0.99, indicating that the √t model provides an excellent description of the capillary-dominated imbibition behavior in the shale matrix.
Notably, samples A and B show an earlier reduction in the slope within the √t = 4–10 min0.5 interval, consistent with their smaller pore sizes and higher tortuosity; in these samples, fluid uptake is more strongly governed by diffusion resistance in fine pore–throat clusters. In contrast, samples D and E maintain higher slopes over the same interval, reflecting the facilitating effect of highly connected pore–throat networks on continuous capillary-driven flow.
A comparison of the kinetic parameters (
Table 6) with pore–throat structural attributes (
Table 5) further shows that higher connectivity (from 32.8% to 58.1%) and lower tortuosity (from 3.2 to 2.3) both contribute to substantial enhancements in
k and
meq. This quantitatively verifies that pore–throat connectivity and geometric tortuosity are the dominant controls on imbibition kinetics.
Overall, the imbibition process of the Chang 7 shale can be recognized as a multiscale coupling of adsorption–diffusion–capillary flow within the hierarchical pore–throat network:
- ①
Micropores govern molecular adsorption and early wetting,
- ②
Mesopores facilitate capillary-driven fluid migration,
- ③
Macropores and microfractures form rapid flow pathways enabling effective imbibition propagation.
Pore–throat enlargement and improved connectivity not only accelerate the initial imbibition rate but also broaden the accessible storage space, leading to faster and more extensive fluid propagation throughout the pore system.
3.2.2. Influence of Interfacial Wettability on Imbibition Behavior
To evaluate the role of surface wettability in governing imbibition behavior, the static contact angle (
θ), surface tension (
γ), and wettability index (
WI) of the shale samples were measured and correlated with their imbibition responses (testing procedures in
Section 2.2.7). All measurements were performed at 60 °C with deionized water as the wetting phase and air as the ambient phase. The results are summarized in
Table 7 and
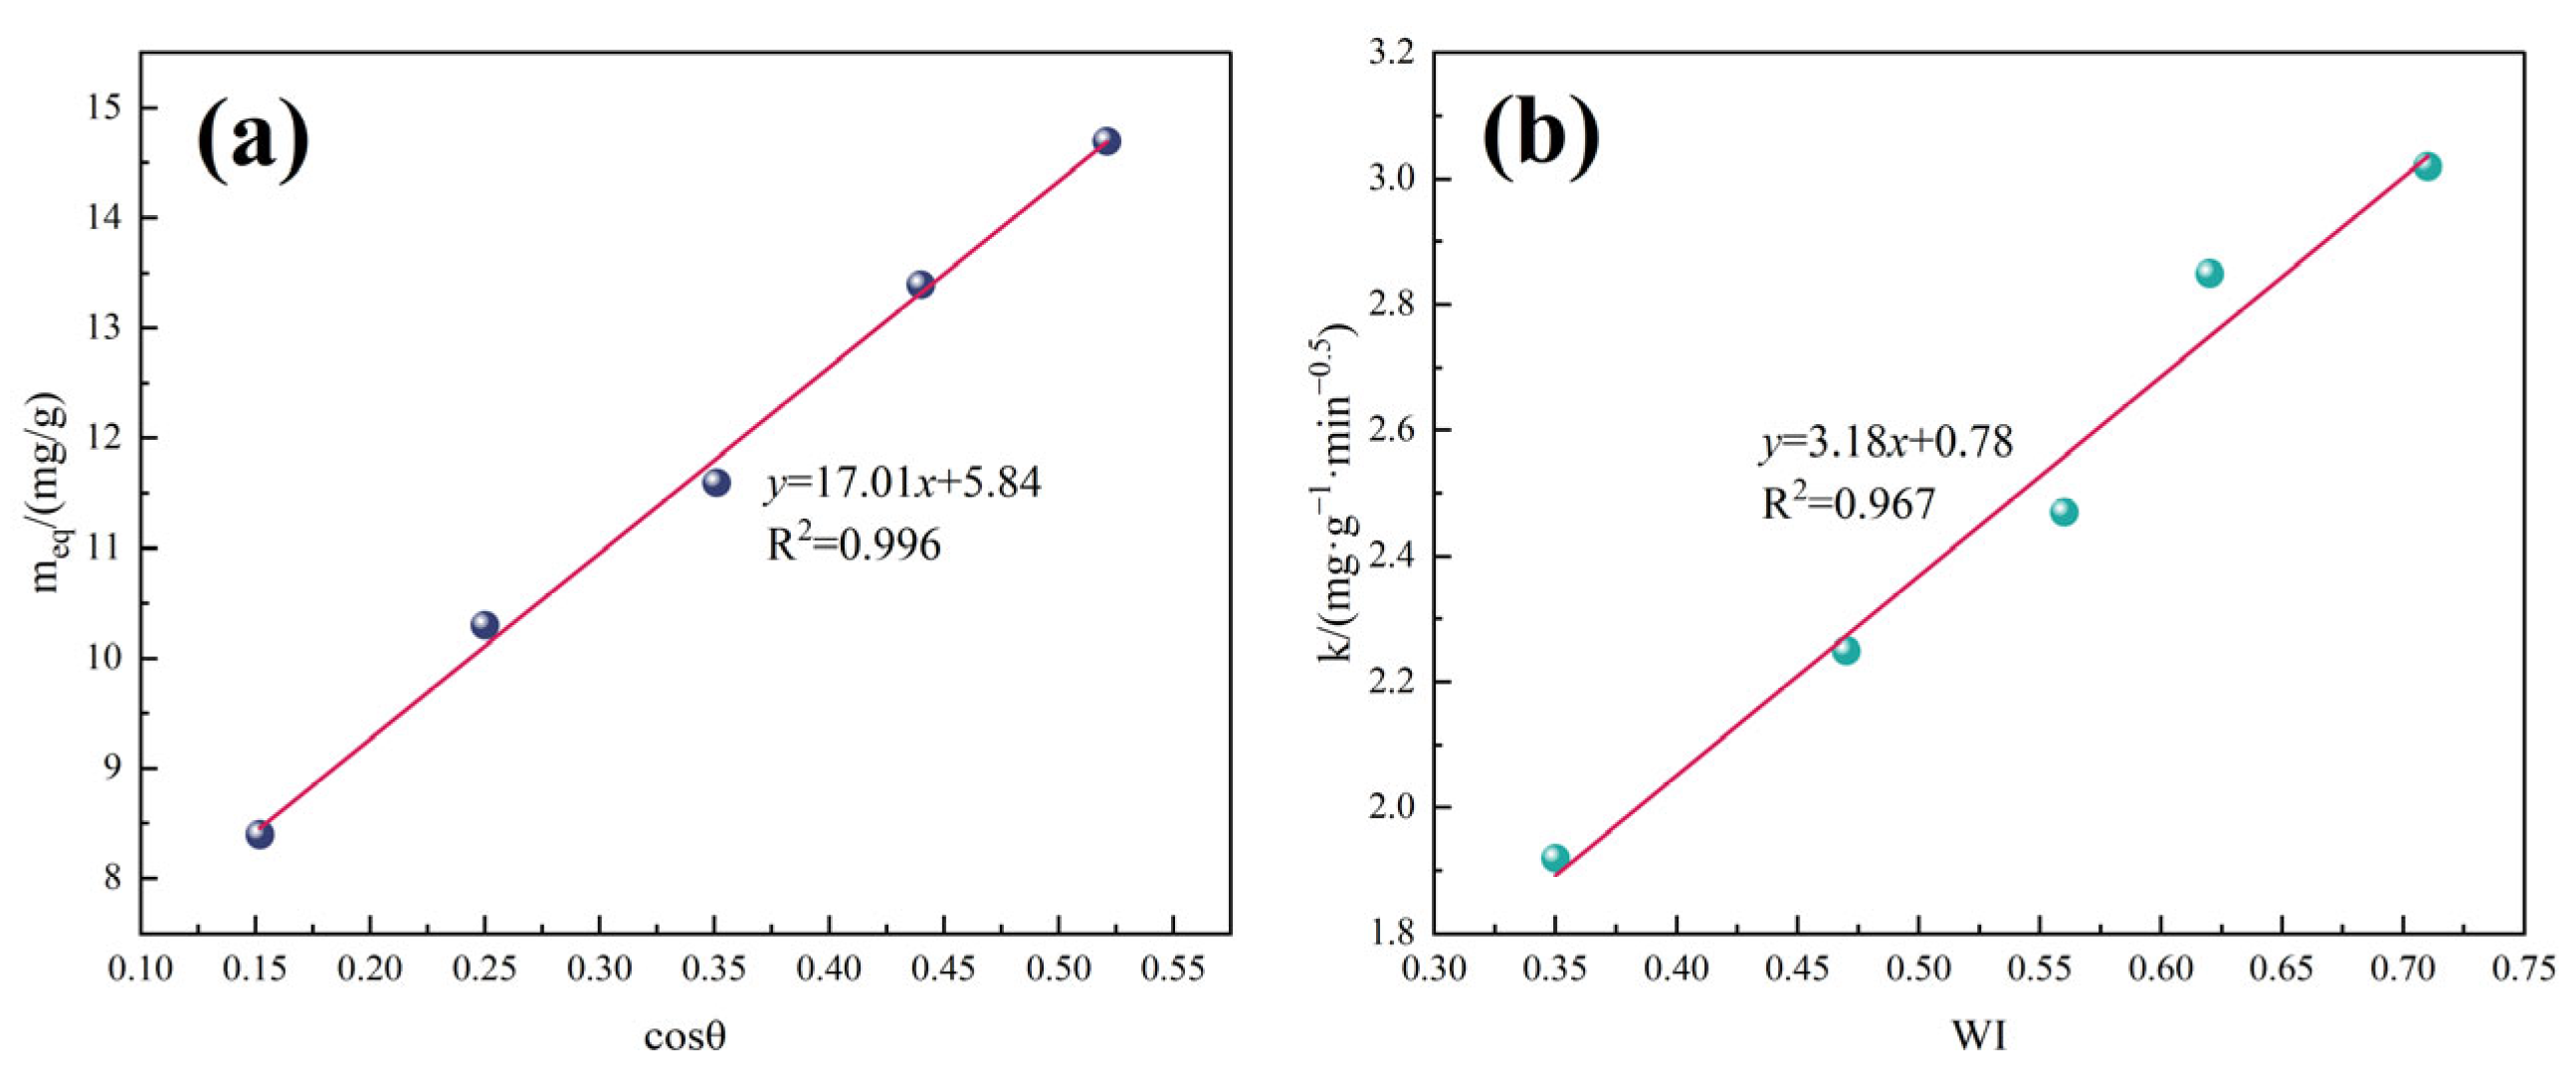
Figure 6.
The contact angles of the samples range from 58.7° to 81.2°, indicating weakly to moderately water-wet surfaces. As wettability increases (i.e., decreasing θ and increasing WI), the imbibition performance is significantly enhanced: the equilibrium uptake (meq) increases from 8.4 to 14.7 mg/g, while the initial imbibition rate (k) increases from 1.92 to 3.02 mg·g−1·min−0.5.
Figure 6a shows an approximately linear correlation between
meq and cos
θ (R
2 = 0.996), indicating that interfacial wettability directly controls the capillary driving force governing liquid entry into the pore–throat system.
Figure 6b further shows that the initial imbibition rate (
k) increases rapidly with
WI (R
2 = 0.93), confirming that enhanced wettability reduces the solid–liquid interfacial energy barrier and promotes capillary-driven uptake.
The influence of wettability on imbibition can be interpreted in terms of three key microscopic processes: (1) Initial wetting stage: More strongly water-wet surfaces possess higher surface free energy, allowing rapid formation of a continuous liquid film and generating a higher initial capillary pressure. (2) Diffusion and transport stage: Enhanced wettability reduces contact-line hysteresis, facilitating liquid spreading across pore–throat junctions and improving pathway continuity. (3) Equilibrium stage: Samples with higher wettability can accommodate greater adsorption of water molecules along pore walls, leading to higher equilibrium uptake.
To provide a unified quantitative descriptor of the wettability-controlled imbibition response, an imbibition efficiency index (
Eimb) is introduced that integrates both the kinetic and storage components of the process. In this study, this efficiency is defined as:
where
k represents the initial imbibition rate,
meq denotes the equilibrium uptake, and
mmax corresponds to the theoretical maximum uptake determined by pore-volume capacity. This efficiency index reflects the composite ability of the pore–throat system to accommodate imbibed fluid while simultaneously transmitting capillary-driven flow. Higher values of
Eimb indicate that a larger fraction of the pore–throat network actively participates in imbibition rather than functioning as isolated or low-permeability domains.
Integrating the results of
Table 7 and
Figure 6, the coupling between wettability parameters and imbibition behavior can be expressed as:
This relationship shows that interfacial wettability modulates both capillary pressure and diffusion resistance, thereby exerting indirect but strong control over imbibition kinetics. When wettability is enhanced, the invading fluid can more effectively penetrate mesopores, macropores, and microfractures. Consequently, wettability acts synergistically with pore–throat structural attributes to determine both the imbibition rate and the maximum attainable fluid uptake in the Chang 7 shale.
3.2.3. Imbibition Pathways: Topology and Connectivity
To elucidate the spatial migration pathways and connectivity characteristics of imbibed fluids within the Chang 7 shale, high-resolution μCT datasets were subjected to skeletonization and pore–throat network analysis (testing procedures in
Section 2.2.8). Skeleton extraction provided quantitative descriptors including the number of primary flow channels, branch-length distribution, and connectivity probability (
PL). These parameters were then correlated with the imbibition characteristics obtained previously. The results are summarized in
Table 8.
The results demonstrate a pronounced increase in imbibition efficiency with increasing pore–throat connectivity. As
PL increases from 0.42 to 0.82, the equilibrium uptake (
meq) rises from 8.4 to 14.7 mg/g, while the initial rate constant (
k) increases from 1.92 to 3.02 mg·g
−1·min
−0.5. Both parameters display strong linear correlations with
PL (R
2 > 0.95), highlighting pore–throat continuity as a primary control on fluid uptake capacity. Consistent with the definition of the imbibition efficiency index
Eimb introduced in
Section 3.2.2, this indicates that higher
PL not only increases the rate and magnitude of imbibition, but also raises
Eimb, indicating that a larger fraction of the geometrically available pore volume actively participates in fluid invasion rather than remaining hydraulically isolated. From the pore-system perspective, a high
Eimb thus reflects the conversion of previously ineffective or dead-end pores into dynamically connected elements within the flow network.
In addition, the geometric extensibility of the pore network exerts a significant influence on the stability of imbibition. The number of primary channels increases from 37 to 97, and the average branch length extends from 8.5 to 18.6 μm, corresponding to a ~1.6-fold enhancement in imbibition rate. The proliferation of flow channels and elongation of branches reduce local resistance and shorten capillary-pressure transmission pathways, thereby increasing penetration depth and fluid retention within the network. Structurally, this channel proliferation enlarges the portion of the pore–throat system that can be effectively swept by the imbibing fluid, which is directly manifested as an increase in meq and, consequently, in Eimb.
A critical transition occurs when PL exceeds ~0.70: the imbibition mechanism shifts from interface-controlled to channel-controlled behavior. Under this regime, the topological configuration and energy-dissipation pattern within the pore network control the migration rate. Junctions between branches and primary channels act as key nodes that mediate capillary propagation across micro-, meso-, and macro-scale pores and fractures. Detailed inspection of the μCT-derived networks shows that this PL threshold is reached primarily when mesopore clusters become sufficiently interconnected to form continuous links between micropore-dominated matrices and macropore–fracture conduits, indicating that mesopore connectivity is the main structural lever controlling the onset of channel-dominated imbibition. In terms of imbibition efficiency, this transition implies that once mesopore-dominated bridges and macropore conduits are jointly activated, the accessible storage volume approaches the theoretical pore-volume capacity mmax, so that k and meq rise cooperatively and Eimb approaches its upper bound.
In addition to the mesopore-driven connectivity enhancement, macropores play a decisive role in the structural transition toward channel-dominated imbibition. μCT visualization reveals that once activated, macropores behave as high-conductivity conduits that rapidly transmit capillary pressure across the pore network. Their large apertures reduce local flow resistance and facilitate the coalescence of mesopore clusters into continuous pathways. This macropore-assisted enlargement of effective throat radii not only accelerates the establishment of percolated channels but also contributes to the observed decrease in tortuosity and the sharp rise in PL. Therefore, the emergence of macropore-linked pathways represents a key structural condition enabling the transition from interface-controlled to channel-controlled imbibition when PL approaches the 0.70 threshold. Consequently, samples in which macropore-connected backbones are well developed exhibit higher Eimb, because a greater proportion of both mesopore and micropore domains are hydraulically coupled to these high-permeability routes and can be effectively drained or refilled during imbibition.
Based on PL, the Chang 7 shale samples can be categorized into three structural types:
- (1)
Isolated network (PL < 0.50):
Dispersed pores with sparse channels; limited imbibition capacity (meq < 9 mg/g).
- (2)
Semi-connected network (0.50 ≤ PL < 0.75):
Branches merge into localized primary pathways; imbibition improves (meq = 10–13 mg/g).
- (3)
Well-connected network (PL ≥ 0.75):
Continuous pathways throughout the system; minimal diffusion resistance and high uptake (meq > 14 mg/g).
Overall Mechanistic Insight
Enhanced connectivity promotes efficient capillary pressure transmission and reduces diffusion resistance, leading to a progressive mechanism of:
Within this progressive mechanism, the evolution of mesopore connectivity represents the key intermediate step: once mesopore clusters are sufficiently activated and linked, connectivity enhancement propagates from micro-scale storage domains to macro-scale flow channels, enabling system-wide pressure homogenization and imbibition intensification.
This finding further reinforces the multi-scale coupling between pore architecture and imbibition dynamics established in
Section 3.2.1 and
Section 3.2.2.
3.2.4. Temperature–Pressure Coupling and the Imbibition–Diffusion Response
The imbibition behavior of the Chang 7 shale exhibits pronounced thermal–mechanical coupling under variable temperature and confining pressure (testing procedures in
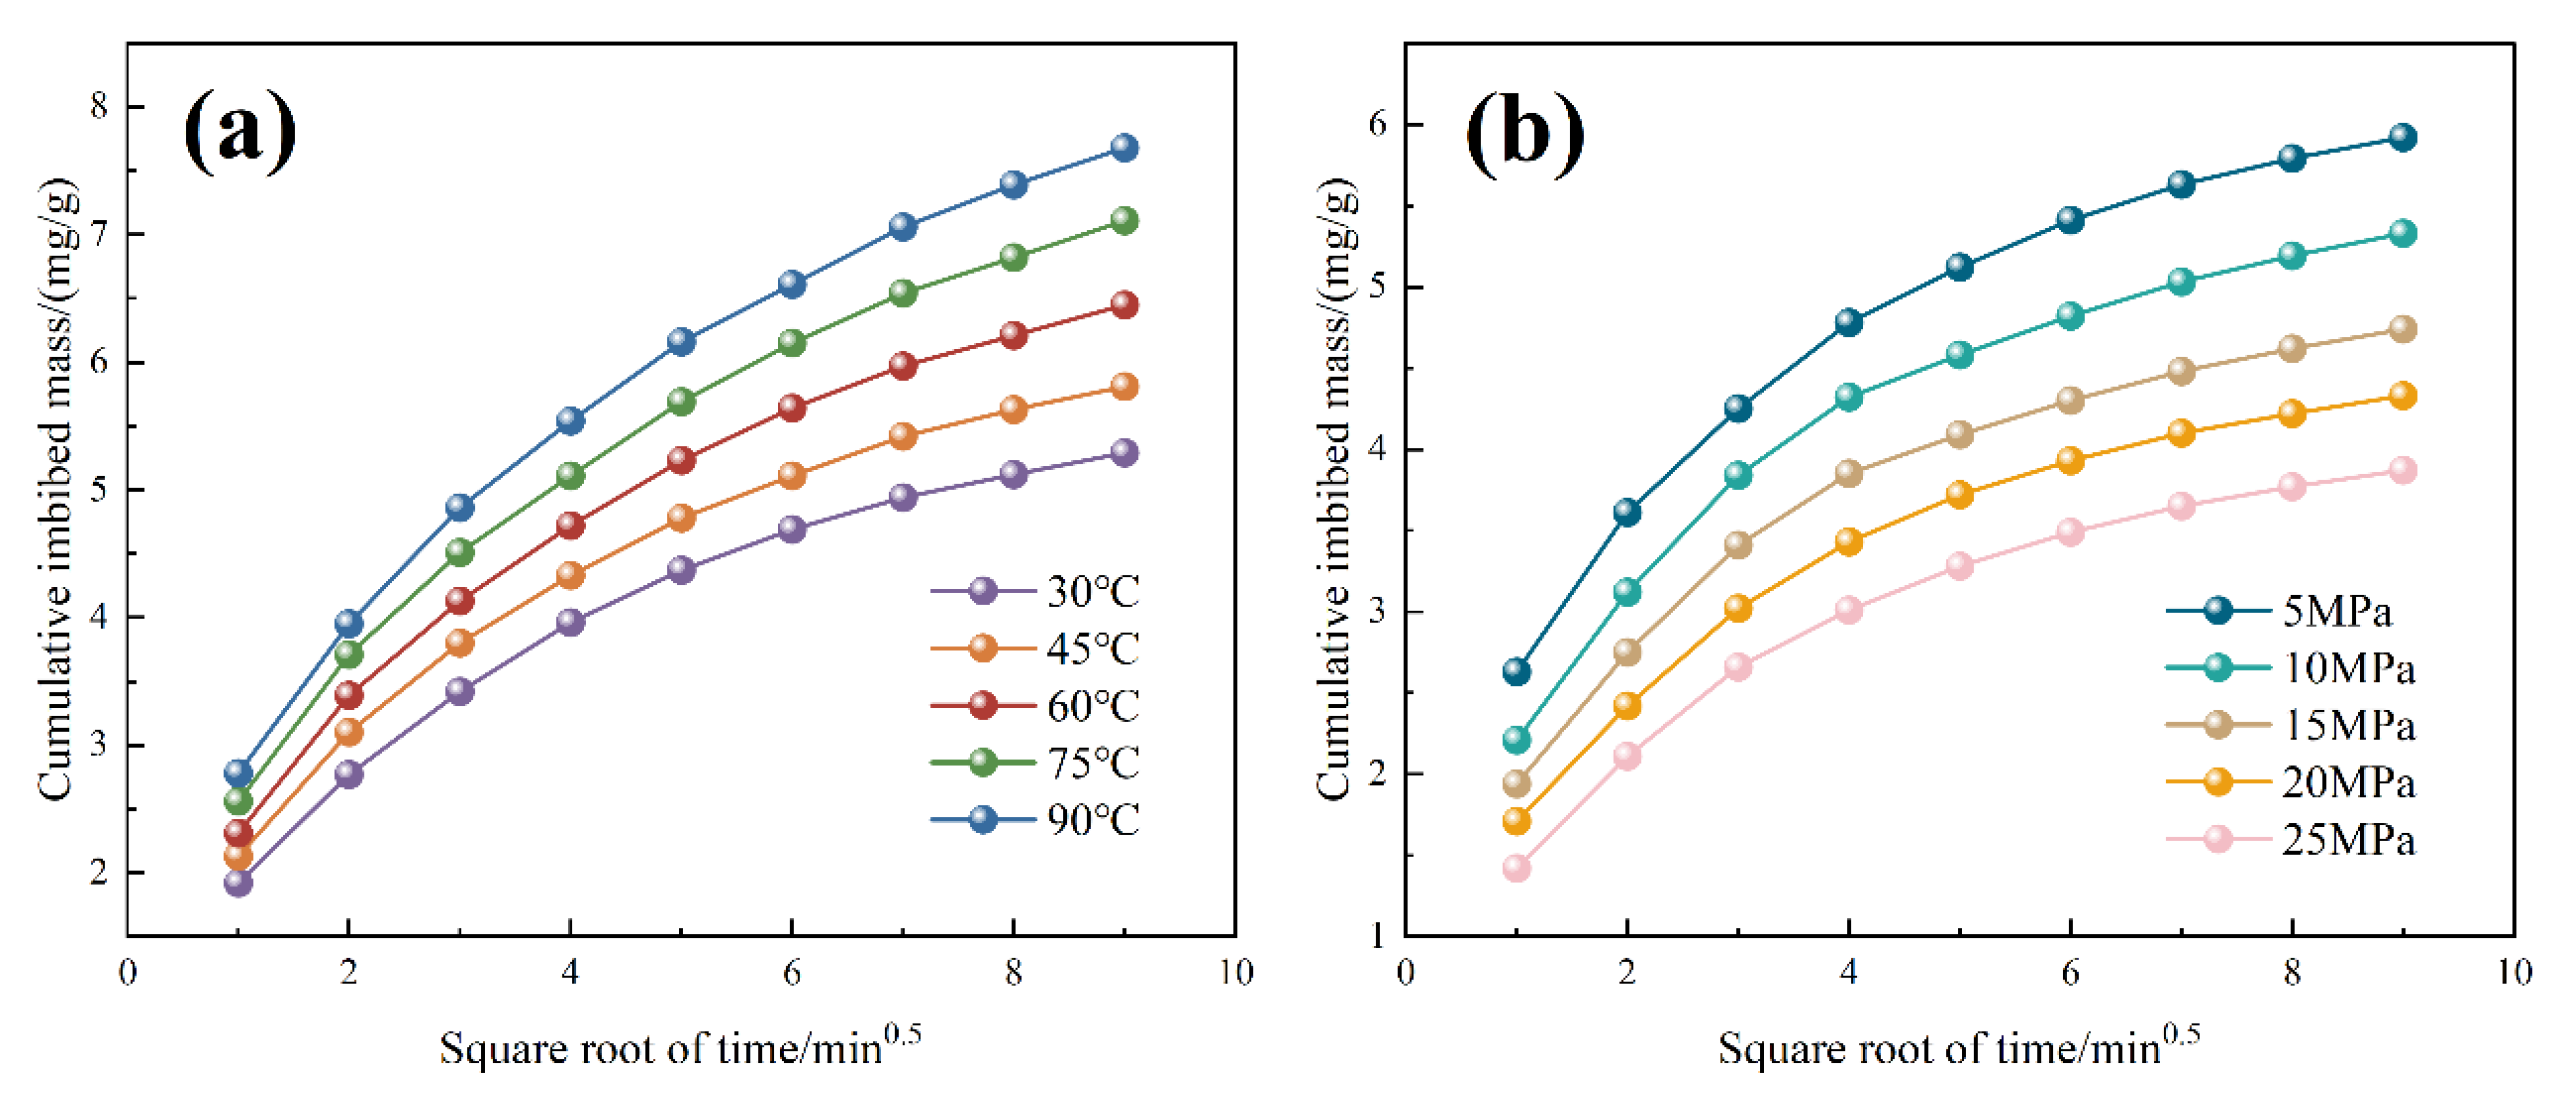
Section 2.2.4). The experimental results are illustrated in
Figure 7.
As shown in
Figure 7a, increasing temperature from 30 to 90 °C shifts the imbibition curves upward, with a marked increase in the slope of the initial rise stage. The equilibrium uptake (
meq) increases from 5.29 to 7.68 mg/g, and the initial imbibition rate constant (
k) rises from 1.92 to 2.78 mg·g
−1·min
−0.5. Elevated temperature reduces liquid viscosity and interfacial tension, thereby enhancing capillary driving forces and molecular diffusion. This promotes rapid invasion into micro–nano pores and accelerates the progression from capillary-controlled imbibition to diffusion-dominated transport. In addition, the stability of the adsorbed oil layer decreases at higher temperatures, facilitating the transition from adsorbed/bound oil to movable oil.
In contrast, confining pressure exerts a strong inhibitory effect on imbibition (
Figure 7b). As pressure increases from 5 to 25 MPa,
meq decreases sharply from 14.23 to 7.53 mg/g, and
k declines from 3.02 to 1.42 mg·g
−1·min
−0.5. Elevated confining pressure compresses pore–throat apertures and reduces connectivity, thereby weakening capillary pressure and increasing flow resistance. The imbibition curves increasingly exhibit a steep initial rise followed by a flattened tail, indicating a transition from capillary-driven infiltration to diffusion-limited transport. The combined influence of temperature and pressure thus forms a clear “thermal enhancement–pressure suppression” effect: high temperature promotes diffusion and desorption, while high pressure restricts pore opening and suppresses volumetric flow, thereby jointly controlling the nonlinear evolution of the imbibition–diffusion profile.
To quantify the structural response of the pore–throat network under coupled thermal–mechanical conditions, a coupling index (
CID) was introduced to represent the synergistic interaction between pore connectivity and interfacial energy:
where
is the connectivity ratio derived from μCT reconstruction,
is the effective pore volume fraction estimated from helium pycnometry and mercury intrusion, and
is the interfacial energy term measured from contact-angle and surface-tension tests.
CID ranges between 0 and 1, with higher values indicating stronger pore connectivity and wettability cooperation and thus lower imbibition resistance. It is noted that CID in this study primarily reflects structural evolution under confining pressure (via changes in and ). Since temperature mainly affects interfacial energy and diffusion kinetics rather than pore geometry, CID was not recalculated for temperature-sequence experiments; instead, thermal effects were independently analyzed through their impact on k and diffusion characteristics.
Table 9 shows that
CID correlates strongly with the initial imbibition rate (R
2 = 0.95). When
CID exceeds ~0.7,
k increases sharply, indicating that higher pore connectivity significantly enhances capillary-pressure transmission. The apparent diffusion coefficient (
Dapp) also exhibits a linear positive correlation with
CID (R
2 = 0.91), suggesting that the late-stage diffusion rate is governed primarily by pore–throat topology and connectivity.
Overall, the coupled temperature–pressure response of the Chang 7 shale can be divided into three stages: (1) Pressure-controlled pore compression: Reduced pore–throat radii suppress connectivity; diffusion becomes restricted. (2) Temperature-enhanced energy activation: Increased thermal energy accelerates diffusion and weakens adsorbed-layer stability. (3) Steady-state structural equilibrium: Migration is controlled jointly by pore tortuosity and interfacial energy balance.
Temperature primarily regulates diffusion rates by altering fluid–solid interfacial energy and viscosity, whereas confining pressure modulates pore connectivity and flow resistance. Their combined action determines the temporal–spatial evolution of fluid migration in shale. This thermally enhanced yet pressure-suppressed imbibition–diffusion mechanism provides critical insights for predicting imbibition efficiency and optimizing production strategies in high-temperature, high-pressure shale reservoirs.
3.3. Pore-Structure Response and Imbibition Reaction Mechanism
The imbibition–diffusion process in the Chang 7 shale is controlled by both fluid properties and external thermo-mechanical fields, and by pronounced pore–throat structural responses and energy-conversion effects. μCT reconstruction, voxel-based statistics, and NMR-derived fluid-state transitions reveal that the pore network undergoes measurable reconfiguration during imbibition, which directly affects fluid transport continuity and capillary-driven migration.
Following imbibition, quantitative image analysis demonstrates a coherent set of structural dilation indicators. The total porosity increases from 6.8% to 8.9%, corresponding to a 31% rise in void volume accessible to the invading fluid. The average coordination number increases from 2.3 to 3.7, indicating a 61% enhancement in local pore–pore linkages, while the connectivity ratio grows from 41.8% to 64.2%, representing a 54% improvement in the probability of forming continuous flow pathways. The number of isolated pore clusters decreases from 176 to 93, showing that previously disconnected pore regions merge into a more unified network during fluid invasion. Tortuosity along the dominant transport pathways decreases from 3.4 to 2.7, reflecting a 21% reduction in transport complexity. Collectively, these integrated indicators illustrate a clear “structural dilation” response, defined not as mineralogical swelling but as a capillary-force–induced activation of sub-micron throats and partially closed microfractures, which increases the effective throat radius and converts previously isolated pores into connected elements. The progressive opening of these constricted conduits increases the effective throat radius and converts isolated pores into semi-connected or fully connected elements, thereby enhancing macroscopic permeability and facilitating sustained imbibition.
Integration of NMR T2 distributions with thermal and pressure-dependent kinetic responses reveals a characteristic energy-partitioning behavior during imbibition. In micro- to mesopores, the system is dominated by adsorbed and bound oil, and the stored energy resides mainly in interfacial potential. In contrast, large pores and microfractures facilitate the conversion of capillary potential into viscous dissipation and diffusive energy. Increasing temperature (30–90 °C) simultaneously reduces interfacial tension and viscosity, enhancing wettability-driven transport and causing the imbibition rate constant k to increase near-exponentially with temperature. Arrhenius fitting of ln k versus 1/T, ln k = −Ea/RT + ln A, yields an apparent activation energy Ea = 6.94 kJ/mol (R2 = 0.97) confirming a low interfacial migration energy barrier. Conversely, increasing confining pressure (5–25 MPa) reduces the throat radius ratio r/r0 to 0.92 and decreases the connectivity probability PL from 0.70 to 0.58, leading to a pronounced decline in imbibition rate. These trends demonstrate the competing and balancing effects of temperature-dominated fluid-driving forces and pressure-dominated structural constraints. This competition can be characterized using an Energy Interaction Coefficient (EIC): , where Pc is the capillary pressure calculated from the advancing imbibition front and pore-throat radius, γcosθ represents the wettability-driven interfacial energy term, and μ denotes fluid viscosity and the associated viscous resistance. Higher EIC values indicate dominance of capillary driving forces and more efficient fluid migration, whereas lower values reflect viscosity-dominated and diffusion-limited conditions. When EIC > 0.8, imbibition becomes continuous and channel-controlled; when EIC < 0.6, the system is governed by viscous retardation and diffusion constraints.
Three-Stage Synergistic Mechanism
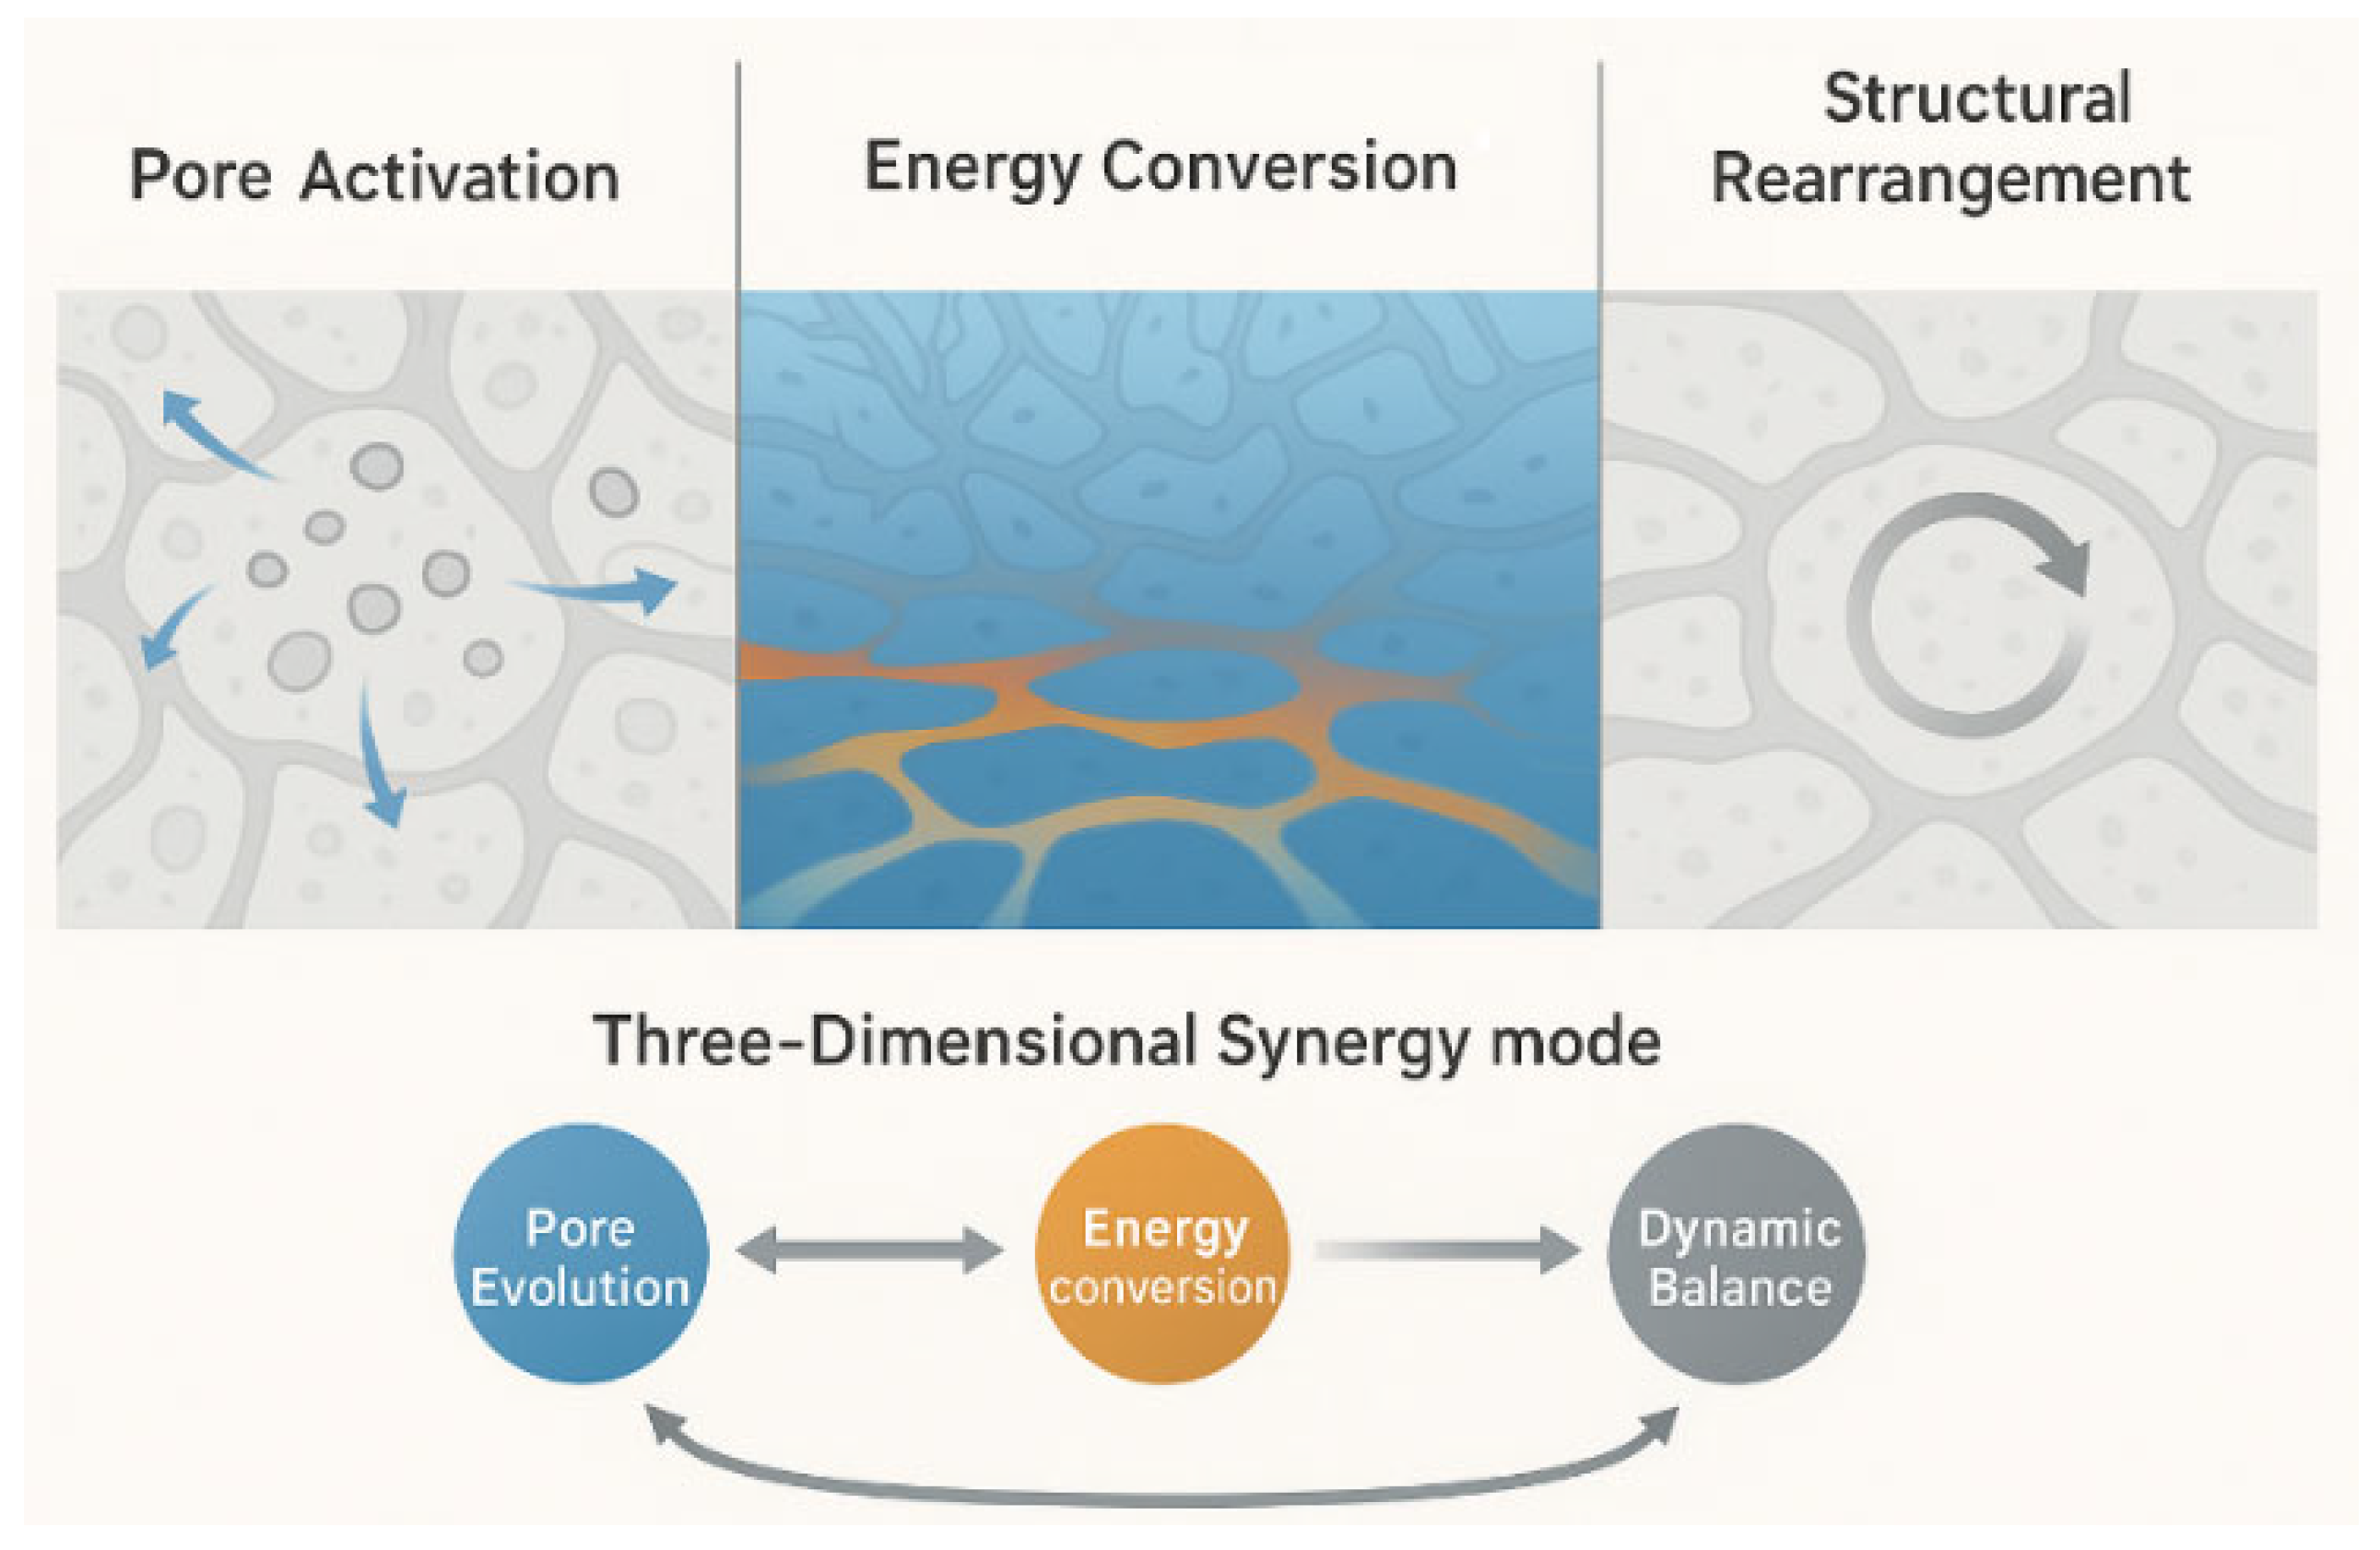
Synthesizing the multi-source data, the imbibition reaction mechanism of the Chang 7 shale can be generalized into a three-stage synergistic model (
Figure 8):
Stage I—Pore–Throat Activation:
Capillary-pressure gradients initiate fluid invasion into previously closed nanopores and microfractures, increasing the effective throat radius and enhancing network connectivity.
Stage II—Energy Conversion:
As imbibition progresses, interfacial energy is converted into viscous dissipation and diffusive work. This drives oil–water displacement and forms a stabilized diffusion front.
Stage III—Structural Reconfiguration and Dynamic Equilibrium:
Fluid filling reduces tortuosity and simplifies flow pathways, transitioning the system into a diffusion-controlled regime that gradually approaches dynamic equilibrium.
In summary, the pore-structure response and imbibition mechanism of the Chang 7 shale can be conceptualized as a “structural evolution–energy conversion–dynamic equilibrium” three-dimensional synergistic mode. This framework reveals the fundamental coupling between capillary-driven structural reconfiguration and multi-field energy interactions, providing a physical and theoretical basis for understanding fluid migration in deep shale reservoirs under complex pore–fluid–thermal conditions.
Figure 8.
Schematic illustration of the three-stage synergistic mechanism of the imbibition reaction in the Chang 7 shale (The arrows indicate the dominant direction of fluid migration, energy conversion, and structural evolution during imbibition, as well as the progressive transition between different stages. The circular arrows in the three-dimensional synergy mode represent the dynamic coupling and feedback among pore-structure evolution, energy conversion, and system balance. Different colors are used to distinguish pore regions with varying activation states and dominant physical processes, highlighting fluid-invaded pathways, energy-conversion zones, and structurally reconfigured domains).
Figure 8.
Schematic illustration of the three-stage synergistic mechanism of the imbibition reaction in the Chang 7 shale (The arrows indicate the dominant direction of fluid migration, energy conversion, and structural evolution during imbibition, as well as the progressive transition between different stages. The circular arrows in the three-dimensional synergy mode represent the dynamic coupling and feedback among pore-structure evolution, energy conversion, and system balance. Different colors are used to distinguish pore regions with varying activation states and dominant physical processes, highlighting fluid-invaded pathways, energy-conversion zones, and structurally reconfigured domains).
3.4. Comparison with Alternative Models
Classical capillary-tube models, such as the Lucas–Washburn formulation, provide a clear analytical description of early-time capillary rise, yet they inherently idealize porous media as bundles of uniform tubes and thus fail to represent pore-scale topology, such as coordination number evolution or tortuosity reduction during imbibition. Experimental and pore-network simulation work has repeatedly demonstrated that this simplifying assumption limits their applicability in heterogeneous rocks. For example, Sun [
31] showed that real imbibition pathways in consolidated porous media deviate significantly from Lucas–Washburn predictions because pore-scale geometry and throat constrictions dominate fluid advancement trajectories. Similarly, Qin [
32] reported through pore-scale simulations that dynamic wetting, variable meniscus curvature, and connectivity fluctuations lead to imbibition kinetics that cannot be captured by static capillary-tube analogs.
At the reservoir scale, dual-porosity/dual-permeability (DPDP) models remain powerful for representing matrix–fracture interactions; however, they reduce pore-scale structure to a few effective parameters, which limits their ability to resolve how specific topological changes (e.g., an increase in coordination number or a decrease in tortuosity) influence imbibition behavior. Recent applications of DPDP formulations to imbibition and waterflooding in tight formations—for instance, Shun [
33]—highlight this limitation, as microscale connectivity evolution must be prescribed rather than dynamically reproduced.
Although pore-scale modeling has made significant progress, including the incorporation of wettability heterogeneity and structural disorder, it still seldom quantifies how measurable topological evolution influences transport dynamics. For example, Liu [
34] simulated spontaneous imbibition at the pore scale and confirmed the importance of wettability and geometric heterogeneity, yet the model did not explicitly link changes in connectivity or coordination number to kinetic transitions.
In contrast, the present study establishes direct quantitative links between topology and imbibition dynamics—specifically, a +22.4% increase in connectivity, a +1.4 rise in coordination number, and a 0.7 reduction in tortuosity during imbibition—thereby capturing the measurable structural dilation observed by μCT. These topology shifts correspond to the transition from interface-dominated to channel-dominated flow. Integrated μCT–NMR studies in recent years support this structural–dynamic coupling mechanism, confirming that fluid–structure co-evolution is physically realistic in low-permeability rocks. Therefore, instead of replacing Lucas–Washburn or DPDP models, the three-stage synergistic framework proposed here provides a complementary, structure-explicit pathway for representing pore-scale activation and flow-regime transition in deep lacustrine shale systems.
3.5. Limitations and Accuracy Considerations
Although the experimental workflow provides a comprehensive multi-scale characterization of pore structure, wettability, and imbibition dynamics, several methodological limitations should be acknowledged to clarify the study’s accuracy and reproducibility.
First, the number of shale core samples used in this study is limited to five representative plugs (A–E) collected from a continuous coring interval. These samples were deliberately selected to span the principal ranges of mineral composition, TOC content, porosity, and pore-network heterogeneity of the Chang 7 Member, ensuring structural representativeness for mechanistic analysis; nevertheless, they do not constitute a statistically exhaustive dataset at the reservoir scale, and this distinction should be noted when generalizing the results.
Second, the spatial resolution of μCT (0.2 μm) restricts the detection of micropores and fine throats below this threshold, meaning that connectivity within the sub-micron pore domain is inferred indirectly from NMR T2 distributions rather than directly imaged. Third, SEM imaging requires surface polishing and gold coating, which may generate minor alteration of near-surface pore edges, potentially affecting the recognition of nano-scale pore morphologies. Fourth, NMR T2 relaxation relies on the assumed correlation between relaxation time and pore size; thus, the quantification of adsorbed, bound, and movable fluids involves model-dependent uncertainties. Fifth, spontaneous imbibition experiments under atmospheric pressure cannot fully reproduce in situ reservoir conditions, and the effects of confining stress, multi-phase competition, and variable wettability may be underestimated.
To minimize these uncertainties, all measurements were repeated multiple times, instrument calibrations were performed before data acquisition, and cross-validation among adsorption, NMR, μCT, and SEM datasets was conducted to ensure internal consistency. These limitations do not alter the main trends, mechanistic interpretations, or the proposed pore–throat activation and structural reconfiguration processes, but they should be considered when interpreting absolute quantitative values or extending the conclusions to reservoir-scale heterogeneity.
5. Recommendations
Based on the multi-scale characterization results and the established coupling mechanisms between pore structure, wettability, and imbibition behavior, several recommendations can be proposed for future research and engineering applications:
- (1)
Strengthen pore–throat connectivity to enhance shale-oil mobility.
Since a connectivity threshold of PL ≈ 0.70 marks the transition to channel-dominated imbibition, stimulation strategies that enlarge mesopores or activate macropore–fracture networks (e.g., mild thermal treatment, micro-fracture induction, or wettability modifiers) are recommended to promote continuous flow pathways.
- (2)
Prioritize wettability-regulation techniques.
The strong linear correlations between cosθ, wettability index, and imbibition efficiency suggest that modest wettability enhancements can significantly accelerate fluid penetration. Chemical agents that reduce contact angle or interfacial tension may therefore serve as effective capillary-driven enhancement tools in tight shale reservoirs.
- (3)
Incorporate thermo-mechanical effects into reservoir-scale simulations.
Given the demonstrated sensitivity of imbibition to temperature and confining stress, field-scale models should integrate temperature-dependent viscosity, stress-dependent throat shrinkage, and capillary-pressure evolution to more accurately predict fluid migration in deep shale formations.
- (4)
Adopt multi-scale imaging in future mechanism studies.
Because μCT resolution (0.2 μm) limits nano-pore detection, future work should combine μCT with nano-CT, FIB-SEM, adsorption-based fractal analysis, and pore-network modeling to obtain a complete description of structural evolution during imbibition.
- (5)
Extend the framework to multiphase and hydrocarbon systems.
The current study focuses on water imbibition; however, shale reservoirs involve complex oil–water–gas competitive imbibition. Future research should evaluate how wettability alteration, phase trapping, and interfacial interactions affect the proposed three-stage synergistic mechanism.
These recommendations highlight the practical implications of the mechanistic insights gained in this study and provide a foundation for guiding reservoir evaluation, simulation improvements, and enhanced-mobility strategies in lacustrine shale oil systems.