Article

Recent Advances in Green and Low-Carbon Energy Resources: Navigating the Climate-Friendly Microgrids for Decarbonized Power Generation

by
Daniel Akinyele
1,* and
Olakunle Olabode
2
1
Department of Electrical and Electronics Engineering, Olusegun Agagu University of Science and Technology, Km. 6, Okitipupa-Igbokoda Road, P.M.B. 353, Okitipupa 350104, Ondo State, Nigeria
2
Department of Electrical and Information Engineering, Achievers University, Km. 1, Idasen/Uteh Road, P.M.B. 1030, Owo 341101, Ondo State, Nigeria
*
Author to whom correspondence should be addressed.
Processes 2025, 13(9), 3028; https://doi.org/10.3390/pr13093028
Submission received: 6 August 2025 / Revised: 15 September 2025 / Accepted: 16 September 2025 / Published: 22 September 2025

Abstract

The role of green and low-carbon energy (gLE) resources in realizing the envisaged future decarbonized energy generation and supply cannot be overemphasized. The world has witnessed growing attention to the application of green energy (gE) sources such as solar, wind, hydro, geothermal, and biomass (energy crops, biogas, biodiesel, etc.). There is also the existence of low-carbon energy (LE) resources such as power-to-X, power-to-fuel, power-to-gas, e-fuel, waste-to-energy, etc., which possess huge potential for delivering sustainable energy, thus facilitating a pathway for achieving the desired environmental sustainability. In addition, the evolution of the cyber-physical power systems and the need for strengthening capacity in advanced energy materials are among the key factors that drive the deployment of gLE technologies around the world. This paper, therefore, presents the recent global developments in gLE resources, including the trends in their deployments for different applications in commercial premises. The study introduces different conceptual technical models and configurations of energy systems; the potential of multi-energy generation in a microgrid (m-grd) based on the gLE resources is also explored using the System Advisor Model (SAM) software. The m-grd is being fueled by solar, wind, and fuel cell resources for supplying a commercial load. The quantity of carbon emissions avoided by the m-grd is evaluated compared to a purely conventional m-grd system. The paper presents the cost of energy and the net present cost of the proposed m-grid; it also discusses the relevance of carbon capture and storage and carbon sequestration technologies. The paper provides deeper insights into the understanding of clean and unconventional energy resources.

1. Introduction

With the progress in advanced energy research and development (R&D), the global community is poised to witness unprecedented breakthroughs and advances in energy generation technologies for better experience and utilization around the world in the near future. This is occasioned by the evolution of green and low-carbon energy (gLE) resources, which are envisaged to be critical players for realizing the future decarbonization and sustainability plans [1,2].
Importantly, in response to the climate change and global warming concerns, nations around the world, including decision-makers, relevant stakeholders, industrialists, developers, planners, etc., have reached a unanimous agreement to advocate for a net-zero carbon economy/carbon neutrality [2,3,4,5,6]. To realize this feat, i.e., net-zero emissions, a balance is sought between the amount of greenhouse gases (GHGs) being released to the atmosphere and the quantity of GHGs removed from the atmosphere [7,8,9]. The net-zero emissions system deeply relies on technological developments through innovative fronts and collaborative efforts across different sectors of the economy—manufacturing, energy, transportation, agriculture, industry, etc.—by extension between countries of the world [6,10].
This development is part of the factors driving the R and D investments in renewable energy (RE) technologies—also regarded as green energy (gE)—which are essentially based on carbon-free resources such as sun, wind, hydro, biomass, wave, geothermal, and tide, including low-carbon energy (LE) technologies because of their potential for realizing net-zero CO2 emissions [11,12]. The idea of exploring the excess RE resources in the process of power-to-X [13], power-to-liquid, power-to-gas, etc., is part of the decarbonization and LE technologies that are of interest. By the power-to-X concept, it is possible to convert RE resources into other energy forms such as chemicals, green H2 that can be stored (power-to-H2), and other fuels through electrolysis and subsequent synthesis with CO2 gas; green H2 may also be further processed into methanol (power-to-liquid) and ammonia [13,14]. Renewable natural gas (RNG)—also regarded as biomethane, for instance—may also be obtained from the methanation of biogas, i.e., by removing CO2 gas from the biogas fuel (power-to-gas applications) [14,15].
Several research studies have been published on the aspect of gLE technologies with a focus on delivering clean electricity production. Ogbannaya et al. [16] reviewed the current and emerging gE systems for electrical power production, using Nigeria as a test case. Apart from electricity generation, the authors presented the possibility of producing hydrogen fuel from the excess gE resources such as solar, wind, hydro, etc. Ang et al. [17] discussed the application of gE technologies for electricity generation. The paper looked into different hybrid energy systems, including their technical performances. The authors also presented the barriers to gE proliferation in terms of the techno-economic perspective. Maheshwar et al. [18] discussed the progress in RE harvesting systems for sustainable electric power production. The authors presented different technologies, such as solar photovoltaic power, concentrated solar power, wind power, water power, etc., and the integration of these distributed generation systems into a hybrid power supply system, while a similar application of gE technologies was discussed by Esan et al. [19].
Kiehbadroudinezhad et al. [20] examined the role of energy security and resilience in achieving sustainable green microgrids (m-grids) for reliable carbon-free electricity production. The authors introduced different methods and tools to assess the m-grid system’s resilience and security. In addition to this, the authors identified the barriers to transitioning to eco-friendly energy systems and presented future perspectives. Tatar et al. [21] presented an optimal design and evaluation of integrated m-grid systems operating on RE resources and green H2 and varying energy consumption, while Mewafy et al. [22] discussed the optimal design of hybrid m-grid systems based on the green H2–ammonia resource. The paper considered the concept of m-grid design for a multi-application purpose, viz., power-to-gas-to-heat-oxygen supply. Ram et al. [23] presented the application of m-grids for green H2 for fuel cells (FCs) using Fiji as a case study. The study focused on the techno-economic aspects, including sizing hybrid microgrids operating on solar photovoltaic and wind power systems for generating H2 gas while considering the grid-tied and off-grid energy configurations.
Zhai et al. [24] reviewed H2-based power-to-X technology and utilization status using China as a case study. The authors presented the relevance of large-scale application of gE resources to decarbonization. Marvin and Sarbinbaka [25] presented the concept of power-to-X and its application for large-scale utilization of RE resources using the case of Nigeria as a reference. Kilic in [26] presented the m-grd-driven power-to-X technologies through optimal RE power generation towards large-scale H2 production. Quizhpe et al. [27] discussed the optimization of m-grd planning for renewable electricity integration in power grids towards a decentralized energy supply. The paper presented different energy configurations for managing energy storage systems. Daiyan et al. [28] discussed the prospects and the difficulties associated with renewable power-to-X.
The mentioned existing studies [16,17,18,19,20,21,22,23,24,25,26,27,28] have considered the application of green energy and low-carbon (gLE) technologies in different directions, which can serve as a useful background to this presented research work. However, the focus of this paper is first directed to the discussion of some existing low-carbon energy (LE) resources such as power-to-X, power-to-fuel, power-to-gas, electrofuel (e-fuel), waste-to-energy, etc., which have huge potential for delivering sustainable energy. The evolution of cyber-physical (i.e., smart) power systems and the need to strengthen capacity in advanced energy materials are also part of the key motivating factors for deploying gLE technologies. It is against this backdrop that this current research work first presents the recent global developments in gLE resources, including the trends in their deployments for different applications in different sections of the economy.
This current study discussed the relevance of the power-to-X, power-to-gas, power-to-liquid, e-fuel, and carbon sequestration. The commonality between the works in [16,17,18,19,20,21,22,23,24,25,26,27,28] and one of the contributions of this work is that it introduced different technical models and configurations of energy systems with state-of-the-art conversion technologies, such as electrolysis, biomass valorization, and methanation, which were not considered in the scholarly works in [16,17,18,19,20,21,22,23,24,25,26,27,28] mentioned earlier. Another distinct focus of this research study is that it examines the potential of multi-energy generation in a microgrid (m-grd), which is based on the gLE resources using the System Advisor Model (SAM) software (version 2025.4.16) developed by the National Renewable Energy Laboratory (NREL), US. This aspect, which is from a different perspective from the existing works in [16,17,18,19,20,21,22,23,24,25,26,27,28] mentioned earlier, is to showcase the utilization of different energy resources in a microgrid. In this case, the m-grd is being fueled by solar, wind, and fuel cell (FC) resources for supplying a commercial load. The quantity of carbon emissions avoided by the m-grd is evaluated compared to a purely conventional m-grd system, such as those fueled by diesel, natural gas, and gasoline. The costs of diesel, natural gas, and gasoline consumed are then compared with the cost of H2 utilized in FCs. The paper also presents some policy frameworks and initiatives from the authors’ considerations reported in [16,17,18,19,20,21,22,23,24,25,26,27,28]. The paper provides deeper insights into the understanding of clean and unconventional energy resources.
The remaining part of the paper is arranged as follows: Section 2 is on the recent progress in green energy and decarbonization technologies; Section 3 considers the utilization and application of green and low-carbon fuels in microgrids and the approach to multi-energy generation in microgrids in the SAM environment; Section 4 presents the results and discussion including the policy framework, limitations of the simulation, and future work, while Section 5 concludes the paper.

2. Recent Progress in Green Energy and Decarbonization Technology

2.1. Green Energy Technologies

Over the past decade, an appreciable increase has been recorded in the development and deployment of renewable energy technologies, especially for solar power, wind power, hydro power, and others—biopower, geothermal, marine power, and concentrated solar power. For instance, the global renewable power capacity (GRPC) at the end of 2019 was 2906 GW [29]; additional capacity of 195 GW was reported for 2020, thus making the GRPC at the end of 2020 to be 3101 GW and making the GRPC to be 3370 GW at the end of 2021. The additional capacity recorded for 2022 was 314 GW, which translated to a GRPC of 3684 GW at the end of 2022. The additional capacity reported for the year 2023 was 346 GW, and this made the GRPC to be 4030 GW while the additional capacity for the year 2024 was about 740 GW, making the GRPC at the end of 2024 to be 4770 GW. For the 740 GW additions in 2024, solar power, wind power, hydro power, and the other technologies accounted for 81%, 16%, 2%, and 1%, respectively. Therefore, the annual growth in global renewable power capacity at the end of the year 2024 was over 18%. Based on the foregoing, it was then posited that more than double the GRPC is required between now and 2030 to meet the global renewable capacity target of 11,000 GW at the end of 2030 [29]. Therefore, over 1000 GW additions are projected to satisfy the global target. Renewable energy has also, over the years, attracted a growing interest in R&D. Recent scholarly works show different applications in different parts of the world, both for grid-integrated and off-grid systems, one of which is the role of renewable energies for global transformations published by Hassan et al. [30].

2.2. Decarbonization Technologies

The global Sustainable Development Goals (SDGs) of the United Nations, particularly SDG-13, emphasize the deployment of any known deliberate acts to curb climate change and its attendant consequences across all sectors. This SDG-13 calls for the need to decarbonize many of the hard-to-decarbonize sectors, given the attainment of the net-zero energy architecture in view [31,32]. Its ability to strike a balance showcases this energy concept as a sustainable effort that can be effectively deployed towards arresting the global warming and climate change scenario, not only in the energy sector but also in the transportation systems and other allied carbon dioxide-generating processes [33]. This raises the hope for the continual usage of conventional energy sources in modern-day energy systems despite being the chief sources of carbon dioxide emission [34,35]. This net-zero energy scheme implies that the rate of generation and absorption of carbon dioxide emissions produced from greenhouse gases must strike an equilibrium [33,34].
Also, recent times have witnessed the evolution of several viable techniques that can be deployed to decarbonize the hard-to-decarbonize sectors, and some of these technologies include power-to-X, power-to-fuel, power-to-gas, e-fuels, fuel cells, carbon capture and storage, carbon sequestration, waste-to-energy, enhanced geothermal system, algae-based biofuels, and magnetic confinement fusion [36,37,38,39,40], among others. Needless to say, these techniques are platforms for enhanced capacities not only for high penetration of renewable energy but also for widening the adoption and usage of green electrons (green hydrogen) in several segments of power generation and transportation systems [39,40]. They are viewed as an indispensable pillar required to catalyze the transformation of the energy sector towards achieving a sustainable energy system that could passionately support electrification of remote communities, large- and small-scale industries, and smart cities of the future [41,42].
Also, the key concern of many of these technologies centers on developing innovative approaches designed to accelerate the re-utilization of excess energy surplus from renewable energy resources by strengthening the medium deployed for its storage [40,41]. Additionally, some schools of thought perceived these evolving technologies as frontline game changers that could dramatically pivot the global energy transition stressed in SDG7 of the United Nations, whose core mandate surrounds the provision of clean and affordable energy for all and sundries across the globe [43]. It is therefore of great essence to bring to mind that many of these evolving technologies are helping to produce re-usable feedstocks, which are prominent sources of renewable gases such as green hydrogen, whose usage transcends mere adoption for the production of renewable electricity but also an excellent medium for driving low-carbon industrial high-heating processes in manufacturing industries [44]. The central position of these technologies in energy transition and environmental sustainability calls for a holistic assessment of the recent progress and trends.

2.2.1. Power-to-X Technology

It is one of the formidable pillars supporting the energy transition in prosumer-driven energy markets of recent times. Power-to-X belongs to the family of recently evolving innovative technologies that are capable of converting excess renewable electricity into feedstocks, which are entirely carbon-neutral energy carriers [38]. This technology could be deployed to act as a dependable nexus between the electricity sector and several other hard-to-decarbonize segments of the economy, such as the transportation system, high-heating industrial processes, and coal-fired power plants, among others [45]. The end product of this technique is green hydrogen, which is obtained through electrolysis of water using the energy obtained from renewable energy resources such as solar energy and wind energy [46]. The general hydrogen value chain from feedstock to end-use applications is as described, with the block diagram shown in Figure 1.
From Figure 1, the renewable energy resources are used to dissociate water into green hydrogen (H2) and oxygen (O2) in the electrolyzer. Raw oxygen, being one of the by-products, can be treated and used for other life support ventures, such as fish farming and therapeutic oxygen in medical centers [45]. Hydrogen, the second by-product of the process of electrolysis, is the fuel of future smart cities aimed at mitigating global warming and climate change. This green hydrogen then becomes a foundational input (“X”) for various downstream processes as depicted in Figure 1.
Although storing H2 presents a major issue due to its prominent physical and chemical properties, it can be processed into compressed gas, liquid in tanks, or hydrogen carrier gas such as ammonia (NH4) before it can be transported via specially designed pipelines, ships, trucks, and tanker trailers [46]. The transported H2 can be stored at hydrogen filling stations where it can be further distributed to meet various downstream processes such as refilling of hydrogen vehicles, power generation, decarbonization of high-heating processes, production of fertilizer, fuel cells applications, and feedstocks in several chemical reactions [45,46]. Also, many of the downstream processes into which power-to-X can exist include power-to-gas, power-to-liquids, power-to-heat, and power-to-chemicals, among others. All of these forms are designed to strike carbon neutrality in hard-to-decarbonize processes across all segments of the economy in a bid to achieve net-zero emissions [38].
Furthermore, several countries, especially Germany, Denmark, Norway, Chile, and Argentina, among others, are investing heavily in this power-to-X technology, being one of the viable tools not only for driving energy transition but also as a means to curb the threat of climate change and global warming events [47]. In addition, the adoption of power-to-X technologies has equally helped in expanding the renewable energy penetration in the energy landscape towards achieving sustainability and a dependable medium to unlock emission reductions unprecedentedly [47,48]. In this regard, there are three roles that power-to-X energy seeks to perform in the drive for sustainable energy transition, which encompass carbon emission reduction through generation of clean fuels and chemicals, promotion of enhanced energy storage, thus creating a platform for storing renewable energy in various versions to combat intermittency in its supplies, and lastly, providing alternatives to fossil-based fuels and feedstocks as a tool to decarbonize hard-to-decarbonize heating industrial processes [48]. Table 1 shows the comparison of various forms of power-to-X in terms of the end product, procedure of synthesis, and possible areas of application.
A wide range of areas of applications of power-to-X technologies can be deduced from Table 1, which includes decarbonization of heavy industry, such as steel and cement factories, where green hydrogen can be used to drive high-temperature processes and also as active reducing agents in many redox reactions occurring in the industrial processes [49]. Similarly, power-to-X technologies are adept for the production of e-fuel, and e-fuels are a better alternative fuel in the aviation and shipping industries. E-fuels are generally characterized by low emissions of greenhouse gases and are a better alternative fuel for applications where battery-electric options are limited, thus providing a platform for repositioning of transportation industries [49]. Also, many of the chemical manufacturing industries heavily rely on using hydrogen produced from fossil-based materials, and with the advent of power-to-x technologies, green hydrogen can be produced in sufficient quantity, thus replacing fossil fuel-produced hydrogen in the production of ammonia and methanol, which are core products of chemical manufacturing industries [50].
Leveraging the information presented in Table 1, it can also be inferred that the core benefits of power-to-X technologies, among others, include grid stability, sector coupling, decarbonization, and enhanced energy storage of renewable energy resources. For instance, power-to-X technologies help to strike an equilibrium in prosumer-driven energy markets through the absorption of excess renewable power, most especially during the peak production period [51,52]. Also, this new technology is a sustainable platform for integrating energy generation into other sectors (sector coupling) such as transportation, heating industries, and commerce, with the overall objective of improving the energy supply system across these sectors. In addition, power-to-X technologies are central to realizing the SDGs 7, 11, and 13 of the United Nations, thus helping to wage war against events of climate change and global warming caused by dangerous emissions of greenhouse gases with the central theme of realizing sustainable cities and communities where clean energy is affordable for all and sundries [52]. It is of the essence to reiterate that the advent of power-to-X techniques has created an impressive opportunity for expanding energy storage in the renewable energy landscape, thus permitting storage of renewable energy in chemical form, which consequently makes provision for long-duration and seasonal storage without fear of intermittent energy supply [51,52].
However, the implementation of power-to-X technologies comes with some prominent challenges, such as the high cost of implementation, increased loss of efficiency in energy conversion processes, and a dire need for heavy investment in supporting infrastructures [51]. To further buttress this assertion, the cost implication of the products and production processes of power-to-X technologies is comparatively higher relative to the traditional fossil fuel-based production processes, thus limiting their adoption and implementation in less developed nations of the world [28]. Some schools of thought argued that the cost-competitiveness of power-to-X technologies is largely dependent on the availability and accessibility of cheap and excess renewable electricity, as this is one of the major drivers required to initiate the process [53].
Furthermore, power-to-X technologies involve multiple energy conversion processes; this alone could be a major roadblock to the occurrence of lower overall system efficiency relative to direct electrification processes [14]. Inadvertently, the transition to power-to-X technologies comes with the need to heavily invest in the procurement of new or retrofitted pipelines, storage systems, and industrial processes, among other infrastructures. However, utilizing this new infrastructure requires possession of adequate technical know-how skills, which are out of reach for developing countries. This serves as a direct indicator of the low participation of developing countries in the move to swiftly adopt power-to-X technologies [49].

2.2.2. Power-to-Fuel

Recent times have witnessed a growing demand for synthetic fuels as an alternative approach to the decarbonization of sectors that heavily rely on the use of fossil fuels, whose end products are the chief cause of national climate change and global warming issues [54]. Power-to-fuel is one of the recent technologies that amazingly supports the production of synthetic fuels in sustainable quantities through the conversion of surplus energy from renewable energy resources into chemical energy, which can be stored either as liquid fuels or gaseous fuels [55]. Synthetic fuels could exist as synthetic hydrocarbons, synthetic natural gas, methanol, and ammonia, and these forms of synthetic fuels are widely utilized for transportation and industrial heating processes [55,56]. Synthetic fuels are the chief cornerstone for net-zero emissions, offering astonishing opportunities for the decarbonization of many of the economic sectors that are potentially hard to electrify directly [55].
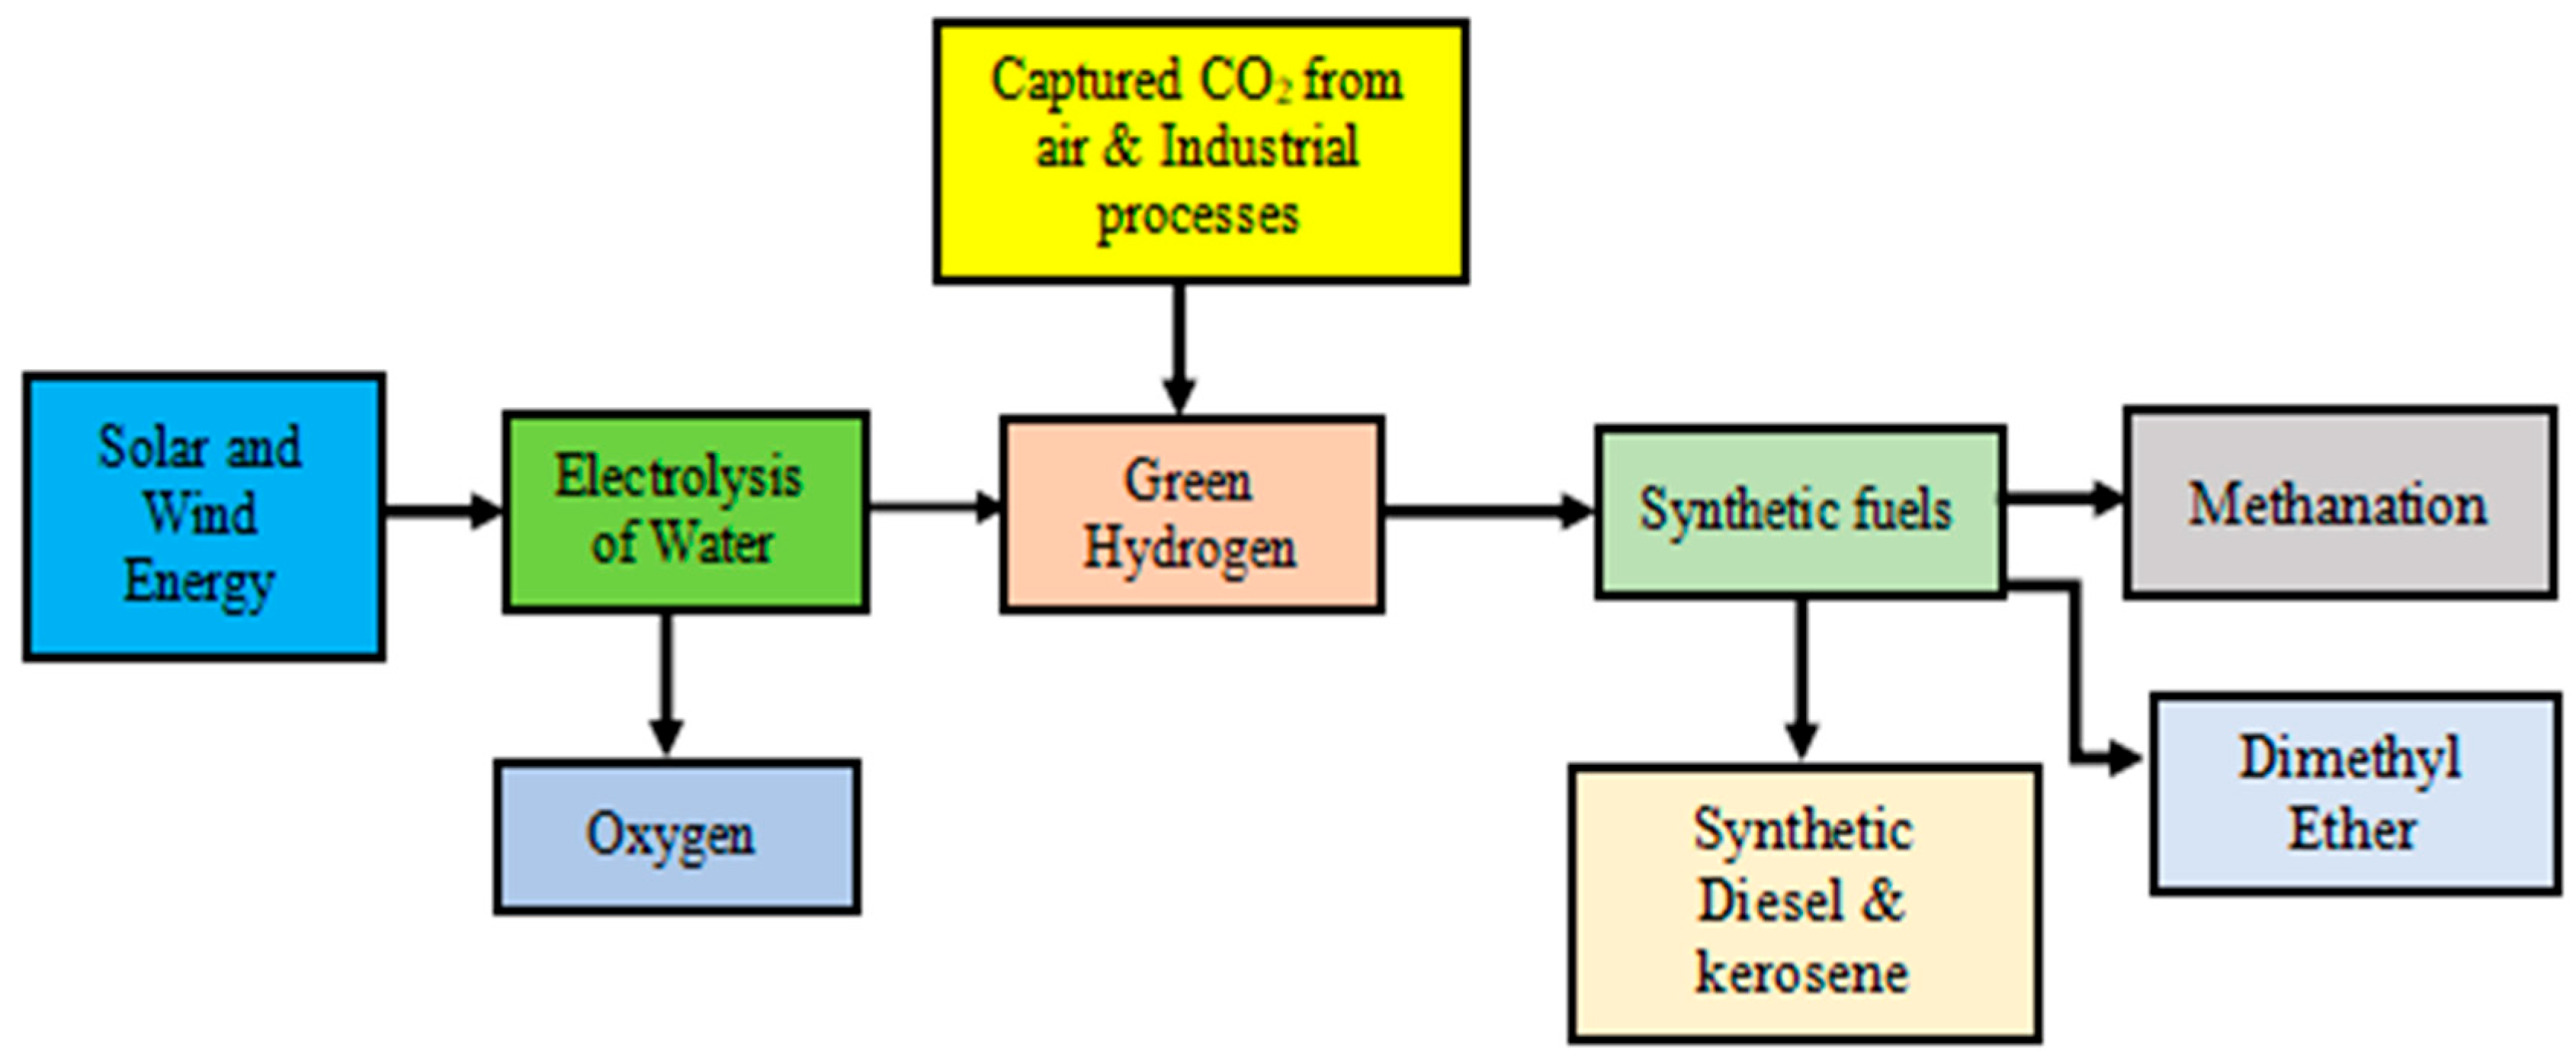
One of the factors driving the recent growing demand for synthetic fuels can be attributed to the ease of compatibility with the existing infrastructure, thus facilitating its seamless integration with the traditional energy system [55]. The block diagram shown in Figure 2 illustrates the flow of production of synthetic fuels through surplus renewable energy resources for the electrolysis of water. The by-product of the electrolysis, which is hydrogen, is used as the input that reacts with the captured CO2 to produce different forms of synthetic fuels.
The chemical equation describing the production of synthetic methane, known as methanation, is as described in Equation (1), where the captured carbon dioxide reacts with the green hydrogen to form synthetic methane.
CO2 + 4H2 → CH4 + 2H2O
Also, liquid hydrocarbons such as diesel and kerosene are produced through Fischer–Tropsch synthesis, where carbon monoxide (CO) reacts with the green hydrogen produced during the electrolysis process. The Fischer–Tropsch is as described with Equation (2), thus,
CO + H2 → Hydrocarbons (like diesel, kerosene)
Similarly, dimethyl ether (DMES), usually methanol, is produced by direct reaction of carbon dioxide captured either from air or industrial process with the green hydrogen produced through electrolysis and represented with Equation (3):
CO2 + 3H2 → CH3OH + H2O
Several major countries, such as Germany, Norway, Denmark, the Netherlands, Spain, France, and Iceland, among others, are frontliners in the implementation of power-to-fuel as a tool for combating climate change and global warming events. For instance, Germany at present has invested heavily in the production of e-gas through the Audi e-gas plant [57]. Norway is known for the production of e-kerosene for the aviation industry through the Norsk e-fuel project, and likewise, the production of green ammonia using hydropower [58]. Also, Denmark is equally pulling efforts in producing a sufficient quantity of e-fuel through the development of e-fuel projects [59]. Similarly, Spain has a touch of e-fuel through the development of green hydrogen [60], while Iceland has invested heavily in the development of large-scale methanol through a CO2 plant [61].
The major strengths of power-to-fuel include the cheap availability of CO2, which can be sustainably captured directly from the air or industrial processes, creating an avenue for the development of carbon-neutral fuels [62]. Also, the existence of infrastructures such as tanks, pipelines, and engines can be seamlessly used, thus promoting sector coupling [63]. However, some of the notable shortcomings of the implementation and adoption of power-to-fuel can result in high energy losses [64]. Its implementation comes with a high capital cost of an electrolyzer, CO2 capture technique, and synthesis units. Lastly, the implementation of power-to-fuel is still in pilot/demo phase in many regions of the world [63,64].

2.2.3. Carbon Sequestration

As the volume of CO2 emission continues to rise geometrically from different sectors which are difficult to decarbonize, such as transportation, power plants, and industrial processes (factory exhaust), carbon sequestration emerged as a sustainable approach to manage the presence of CO2 in the atmosphere [65]. It entails capturing and storing CO2 with the sole aim of diminishing its concentration in the atmosphere, which, as a consequence, helps in mitigating the occurrence of climate change and global warming seen in recent times as some of the major life-threatening events around the world [65]. Carbon sequestration may be implemented through biological processes such as afforestation, intensive crop farming systems, and improved ocean management systems [66,67,68]. These biological processes have a way of removing CO2 from the atmosphere. For instance, afforestation helps in the absorption of CO2 during the process of photosynthesis and then stores it in different parts of the tree, such as the trunk, roots, bark, and leaves.
Photosynthesis is a continuous natural process in the life cycle of plants; it is the only medium through which plants produce their food. This process helps in the continuous removal of CO2 from the ecosystem. Also, an intensive cropping system helps the soil to retain CO2 as plants transfer carbon into the soil with the help of their rooting systems and decaying organic matter in the soil. With this approach, a sufficient amount of CO2 can be removed from the atmosphere, except that this approach is vegetation-limited. Similarly, an effective ocean management system has the propensity to continuously support the growth of ocean-loving plants and animals such as phytoplankton and marine organisms. For instance, phytoplankton and marine organisms are capable of absorbing and sinking CO2 into the oceanic bed and consequently reducing the volume of CO2 in the atmosphere. In addition, a sufficient quantity of CO2 can also be stored in plant matter and soils through grasslands and wetlands [69]. As viable as these approaches are in removing CO2 from the atmosphere, they are significantly location-dependent, and also, practice may be predominantly effective in rural areas where there are sufficient parcels of land.
Unfortunately, the contribution of CO2 to the atmosphere in rural areas through human activities is comparatively less than the volume of CO2 that is being consistently and continuously released into the atmosphere in urban centers through human activities such as transportation, industrial processes, power plants, and many more [70]. The more viable techniques for removing CO2 from the atmosphere, that are most especially suitable for urban centers, are carbon capture and storage, carbon-to-rock, biochar, direct air capture, and blue carbon protection. These approaches are suitable for removing generated CO2 from several industrial processes, exhaust from automobiles, and the burning of hydrocarbons [70]. For instance, carbon capture and storage is endowed with the ability to capture CO2 from several sources, such as factories, power plants, and automobiles. The captured CO2 usually undergoes compression before being finally injected into depleted oil and gas fields, deep saline aquifers, or basalt rock for storage. The compressed CO2 injected can potentially increase the extraction of oil in addition to its being stored simultaneously [71].
Other advanced techniques, such as the carbon-to-rock approach, cause CO2 to undergo a reaction with rock minerals such as olivine and basalt, and the process leads to the production of limestone, which is a good raw material for the production of cement, an essential building material around the world [72]. Biochar produced through pyrolysis, which entails heating biomass material in a limited amount of oxygen, is another advanced technique of removing CO2 from the atmosphere and indeed a non-negotiable alternative for achieving net-zero in the face of massive emissions of greenhouse gases from various hard-to-decarbonize sources [73]. Biochar has provided an opportunity to remove CO2 on a large scale, typically in the range of 0.44–2.62 gigatons annually [73]. Also, CO2 can be captured directly for storage and re-use through direct air capture [74].
This approach is comparatively new; however, the essential stages involve the use of an air contacting medium (ACM) fortified with sorbent and a regeneration medium [75]. The sorbent medium could be liquid or solid, and the essence of this sorbent is to increase the absorption of CO2 in the air when exposed to the sorbent medium [73,74]. Though the approach is comparatively new, some notable countries piloting its implementation include the United States, Norway, Canada, and China [75]. For instance, the US has implemented large-scale carbon capture and storage in locations such as Petra Nova and Illinois Basin [75], while countries such as the United Kingdom and Australia have heavily invested in geological sequestration and carbon capture and storage techniques [76].
The carbon sequestration technique presents some astonishing benefits, which include offsetting emissions from greenhouse gases from different sectors [75]. It is also a sustainable approach to improving soil fertility, like the case of biochar and blue carbon protection [73], and most importantly, they are essentially non-negotiable techniques of combating climate change and global warming events threatening the possibility of realizing smart cities and sustainability [73,75]. Some of the major shortcomings of carbon sequestration include the high cost of implementation [75]; it is energy-intensive, like the case of direct air capture, and stringent measures must be put in place to prevent leakage, which sometimes requires long-term monitoring. The approach has the propensity to compete with the alternative use of land which may, raise serious social and environment concerns among others [73,75].

2.2.4. Electrofuel (E-Fuel)

Electrofuel, known as e-fuel, is a new, evolving alternative green fuel with the potential to achieve net-zero emissions in the face of rising emissions of greenhouse gases from different hard-to-decarbonize sectors. E-fuel belongs to the family of power-to-X technology [77]. It is another form of clean synthetic fuel that shows a greater similarity to conventional fossil fuel, except that it is produced through a reaction between recycled CO2 or N2 with the green H2 obtained from the electrolysis of water under the influence of renewable energy resources as a source of direct current [77]. This clean synthetic fuel exists as either liquid or gaseous fuels, and typical examples include e-methane (CH4), e-methanol (CH3OH), e-diesel or e-kerosene, and ammonia (NH3) [78]. Generally, there are two distinct approaches to producing these clean synthetic e-fuels: biological techniques and recombination of recycled CO2 or N2 with green H2.
The biological process entails the conversion of CO2 to produce energy-dense, clean e-fuel, while the other technique requires the direct combination of captured CO2 or N2 with H2 generated from electrolysis [78]. The possibility of this e-fuel existing in various forms has provided a means of achieving net-zero in many of the hard-to-decarbonize sectors, such as transportation, particularly aviation and shipping, and industrial heating in factories. For instance, e-methane gas is an excellent feedstock for gas power stations, and with it, the stability and reliability of energy supply for grid operation can be guaranteed [78]. Also, the hard-to-decarbonize industrial heating process can harness methane gas to achieve a carbon-neutral heating process [77,78]. It is no news that another excellent chemical feedstock is e-methanol; its evolution has led to the production of amazing chemicals such as dimethyl ester (DME), methyl tertbutyl ether (MTBE), formaldehyde (HCHO), and acetic acid (CH3COOH) [79].
Furthermore, e-methanol has also contributed to enhancing the quality of paints, plastics, and the manufacturing of automobile parts [77,79]. Similarly, water treatment plants and industrial heating processes alongside the transportation sector, such as the shipping and aviation industry, have benefited immensely from this game-changer called e-methanol, which is an excellent solvent and amazing synthetic fuel [78,79]. It is also necessary to say that e-ammonia, a member of this synthetic e-fuel, can serve as an excellent additive in the manufacturing of ammonia fertilizer, energy carrier gas, and an excellent synthetic fuel for the shipping industry. It is equally imperative to know that e-diesel and e-kerosene are very adept hydrocarbons that can be used to decarbonize heavy-duty vehicles such as trucks hauling long distances, among others [80,81]. Additionally, it is of the essence to bring to mind that one of the major factors contributing to the wide integration and adoption of e-fuel in many sectors of the economy is the possibility of it being used with the existing internal combustion infrastructures [82,83].
The deployment of e-fuel is improving by leaps and bounds as some of the developed countries are frontliners heralding and investing hugely in its development; for instance, Germany recently won the e-fuel European concession as one of the major drivers in the drive to commercially expand the horizon of e-fuel [84]. Also recently, Germany, in conjunction with the European Union, agreed on the usage of e-fuels for new vehicles tagged as zero-emission vehicles by 2035 [85]. This agreement is another giant stride tailored towards realizing a reduction in the volume of CO2 produced from internal combustion engines employed in the automobile industry globally [84,85]. Also, Norway has equally attempted the development of Norsk e-fuel as a means to sustainably develop the aviation industry purposefully to meet its global climate goals [86]. An agreement to build the world’s first largest production facility for e-fuel was also signed between the Norwegian and Norsk e-fuel plants. The partnership was to develop fossil-free aviation fuel on a large scale, and this was aimed to ensure a massive CO2 reduction, approximately by forty-five percent by 2030 [87].
Furthermore, a pilot plant for the large-scale production of e-fuel has been officially opened in Punta Arenas, Chile. This is to ensure carbon-neutral operation of ICE in Chile; in fact, the existing ICE can profitably benefit from this alternative green fuel, thereby decarbonizing the transportation sector [87,88]. The development of ammonia is on the increase in Japan in recent times, and the central goal is to produce a sufficient quantity of e-fuel for the rejuvenation of thermal power plants and the shipping industry with the sole aim of reducing the emission of CO2 from these sectors [89]. The aviation sector in the US is equally being revolutionized with the production of sustainable aviation fuels, purposefully to cut down the emission of CO2 by 50% and also to meet domestic demand by 100% by 2050 [89]. In sum, the benefits of deploying and utilizing e-fuel can be summarized to include carbon neutrality, drop-in compatibility with current fuel systems, enhanced storage of renewable electricity, and decarbonization of hard-to-electrify sectors [84,85,86,87,88,89].

3. Methods and Materials

3.1. Utilization and Application of Green and Low-Carbon Fuels in Microgrids

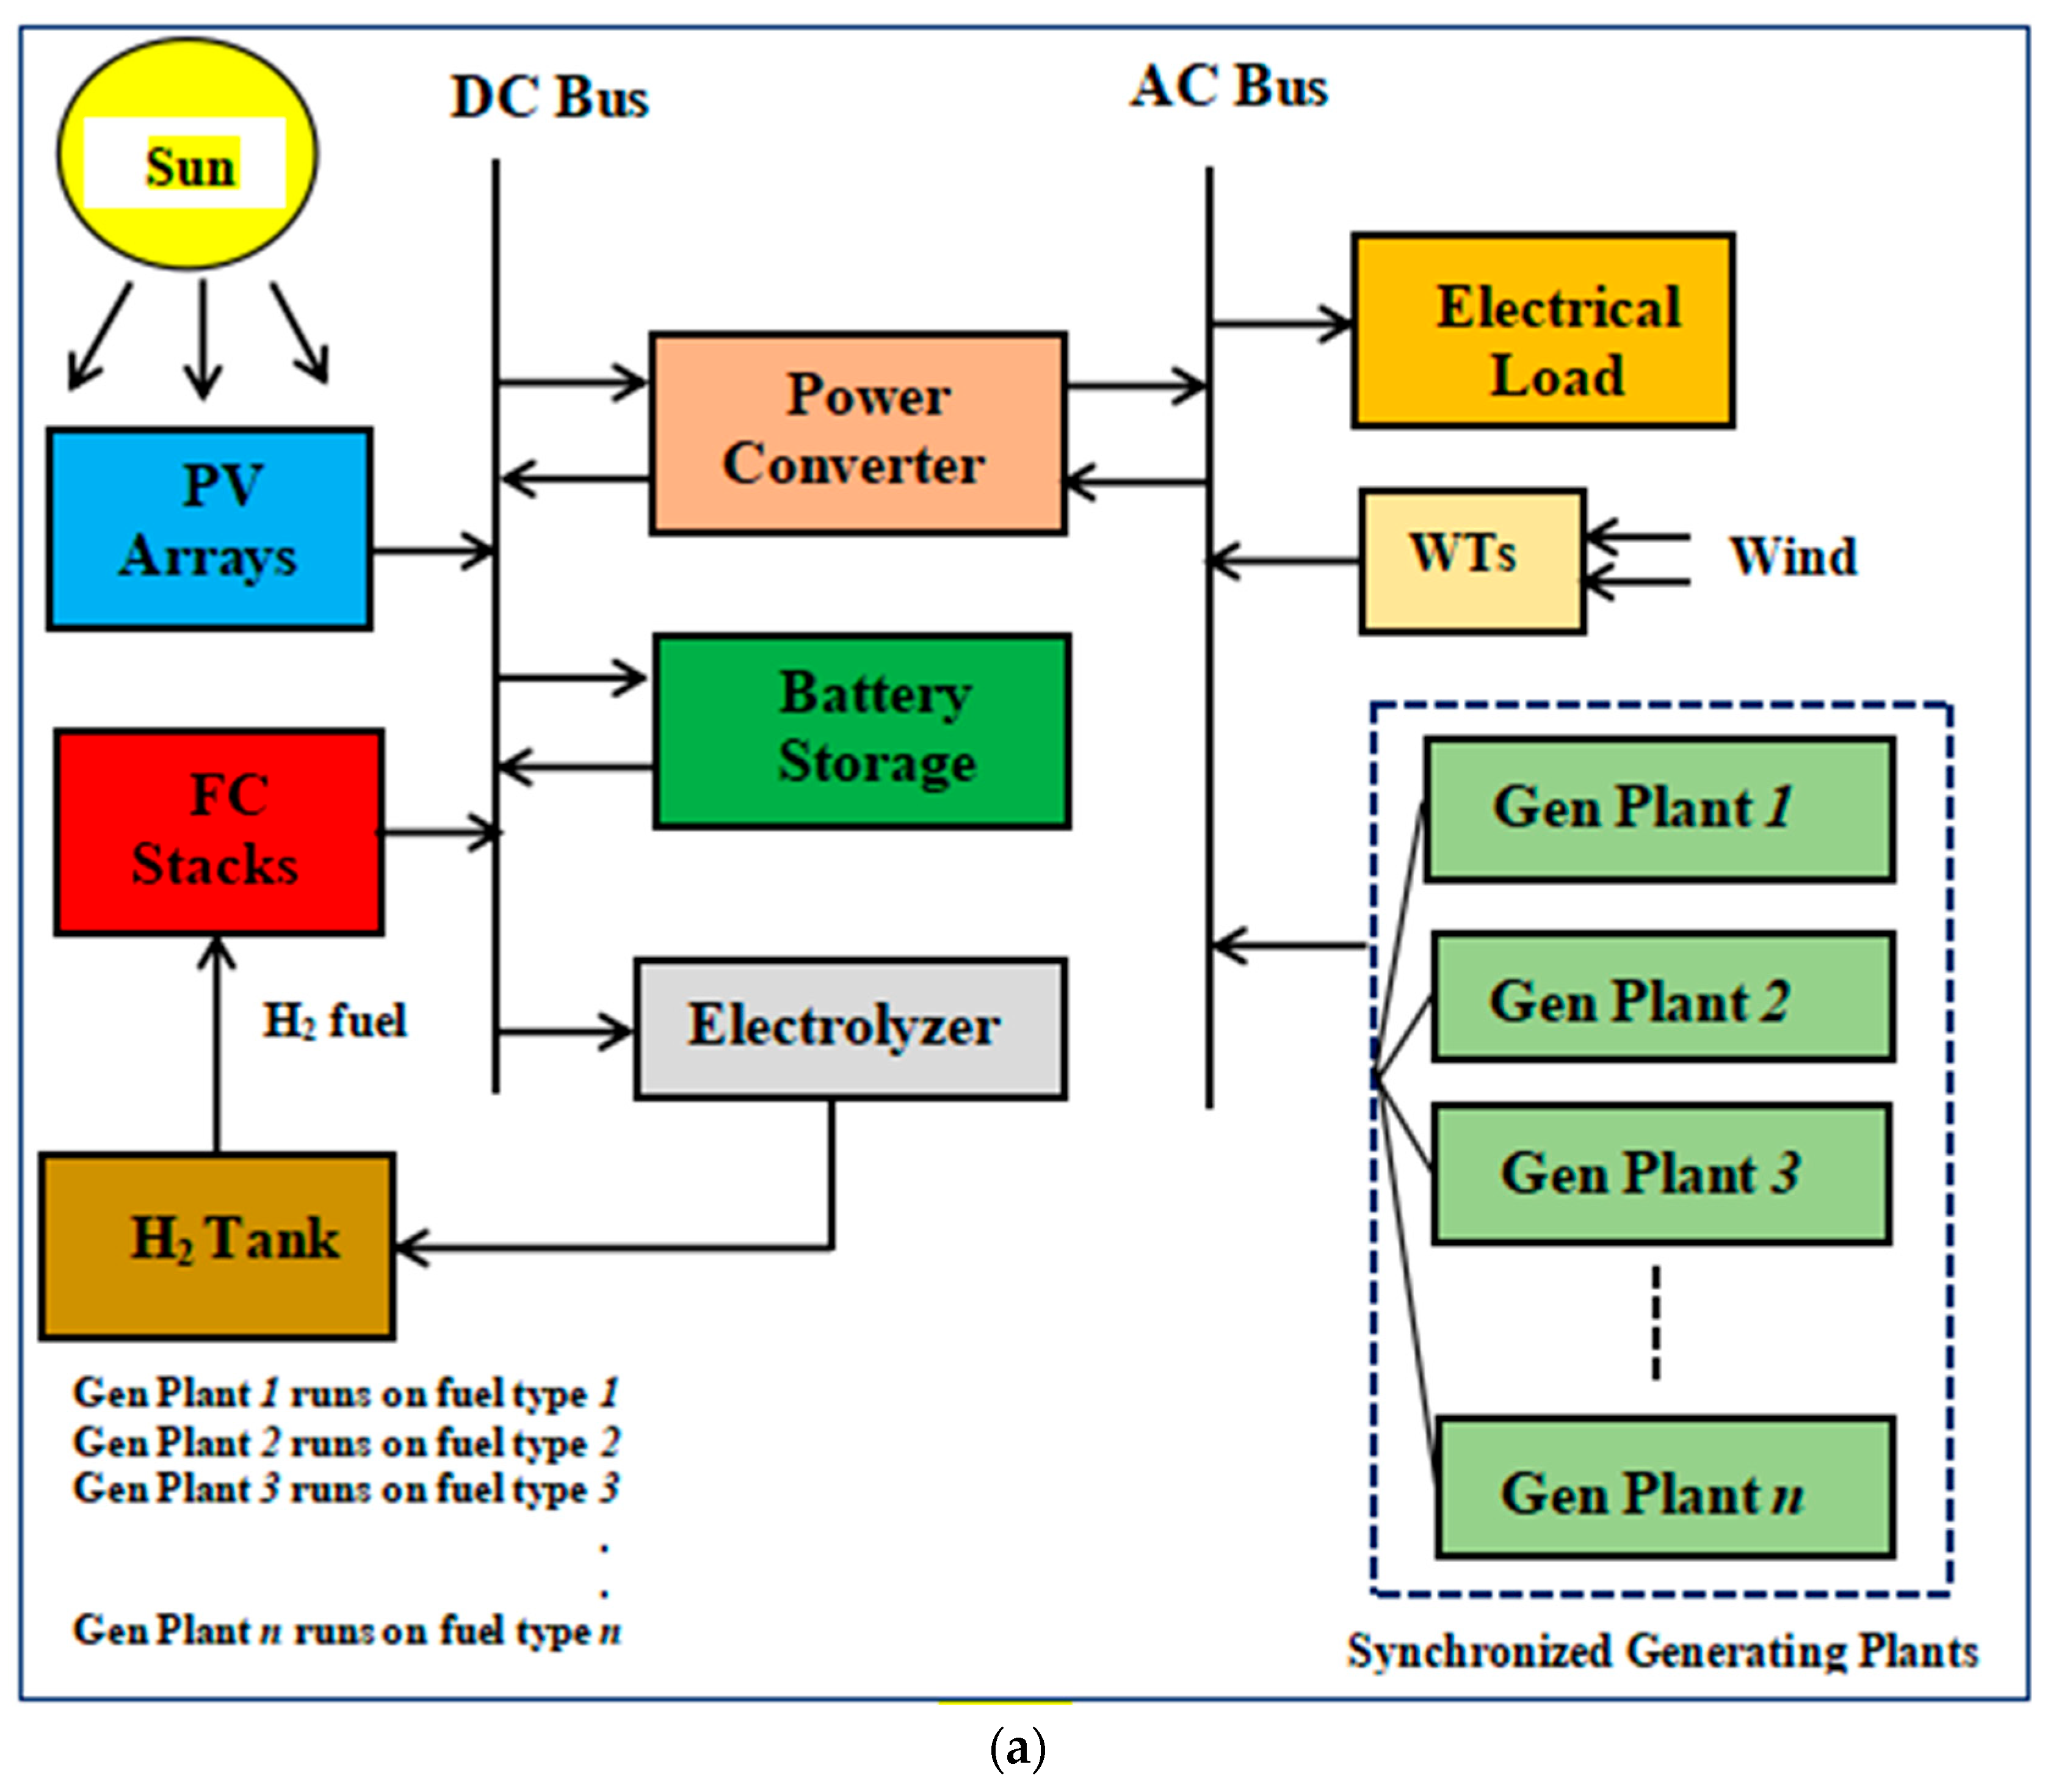
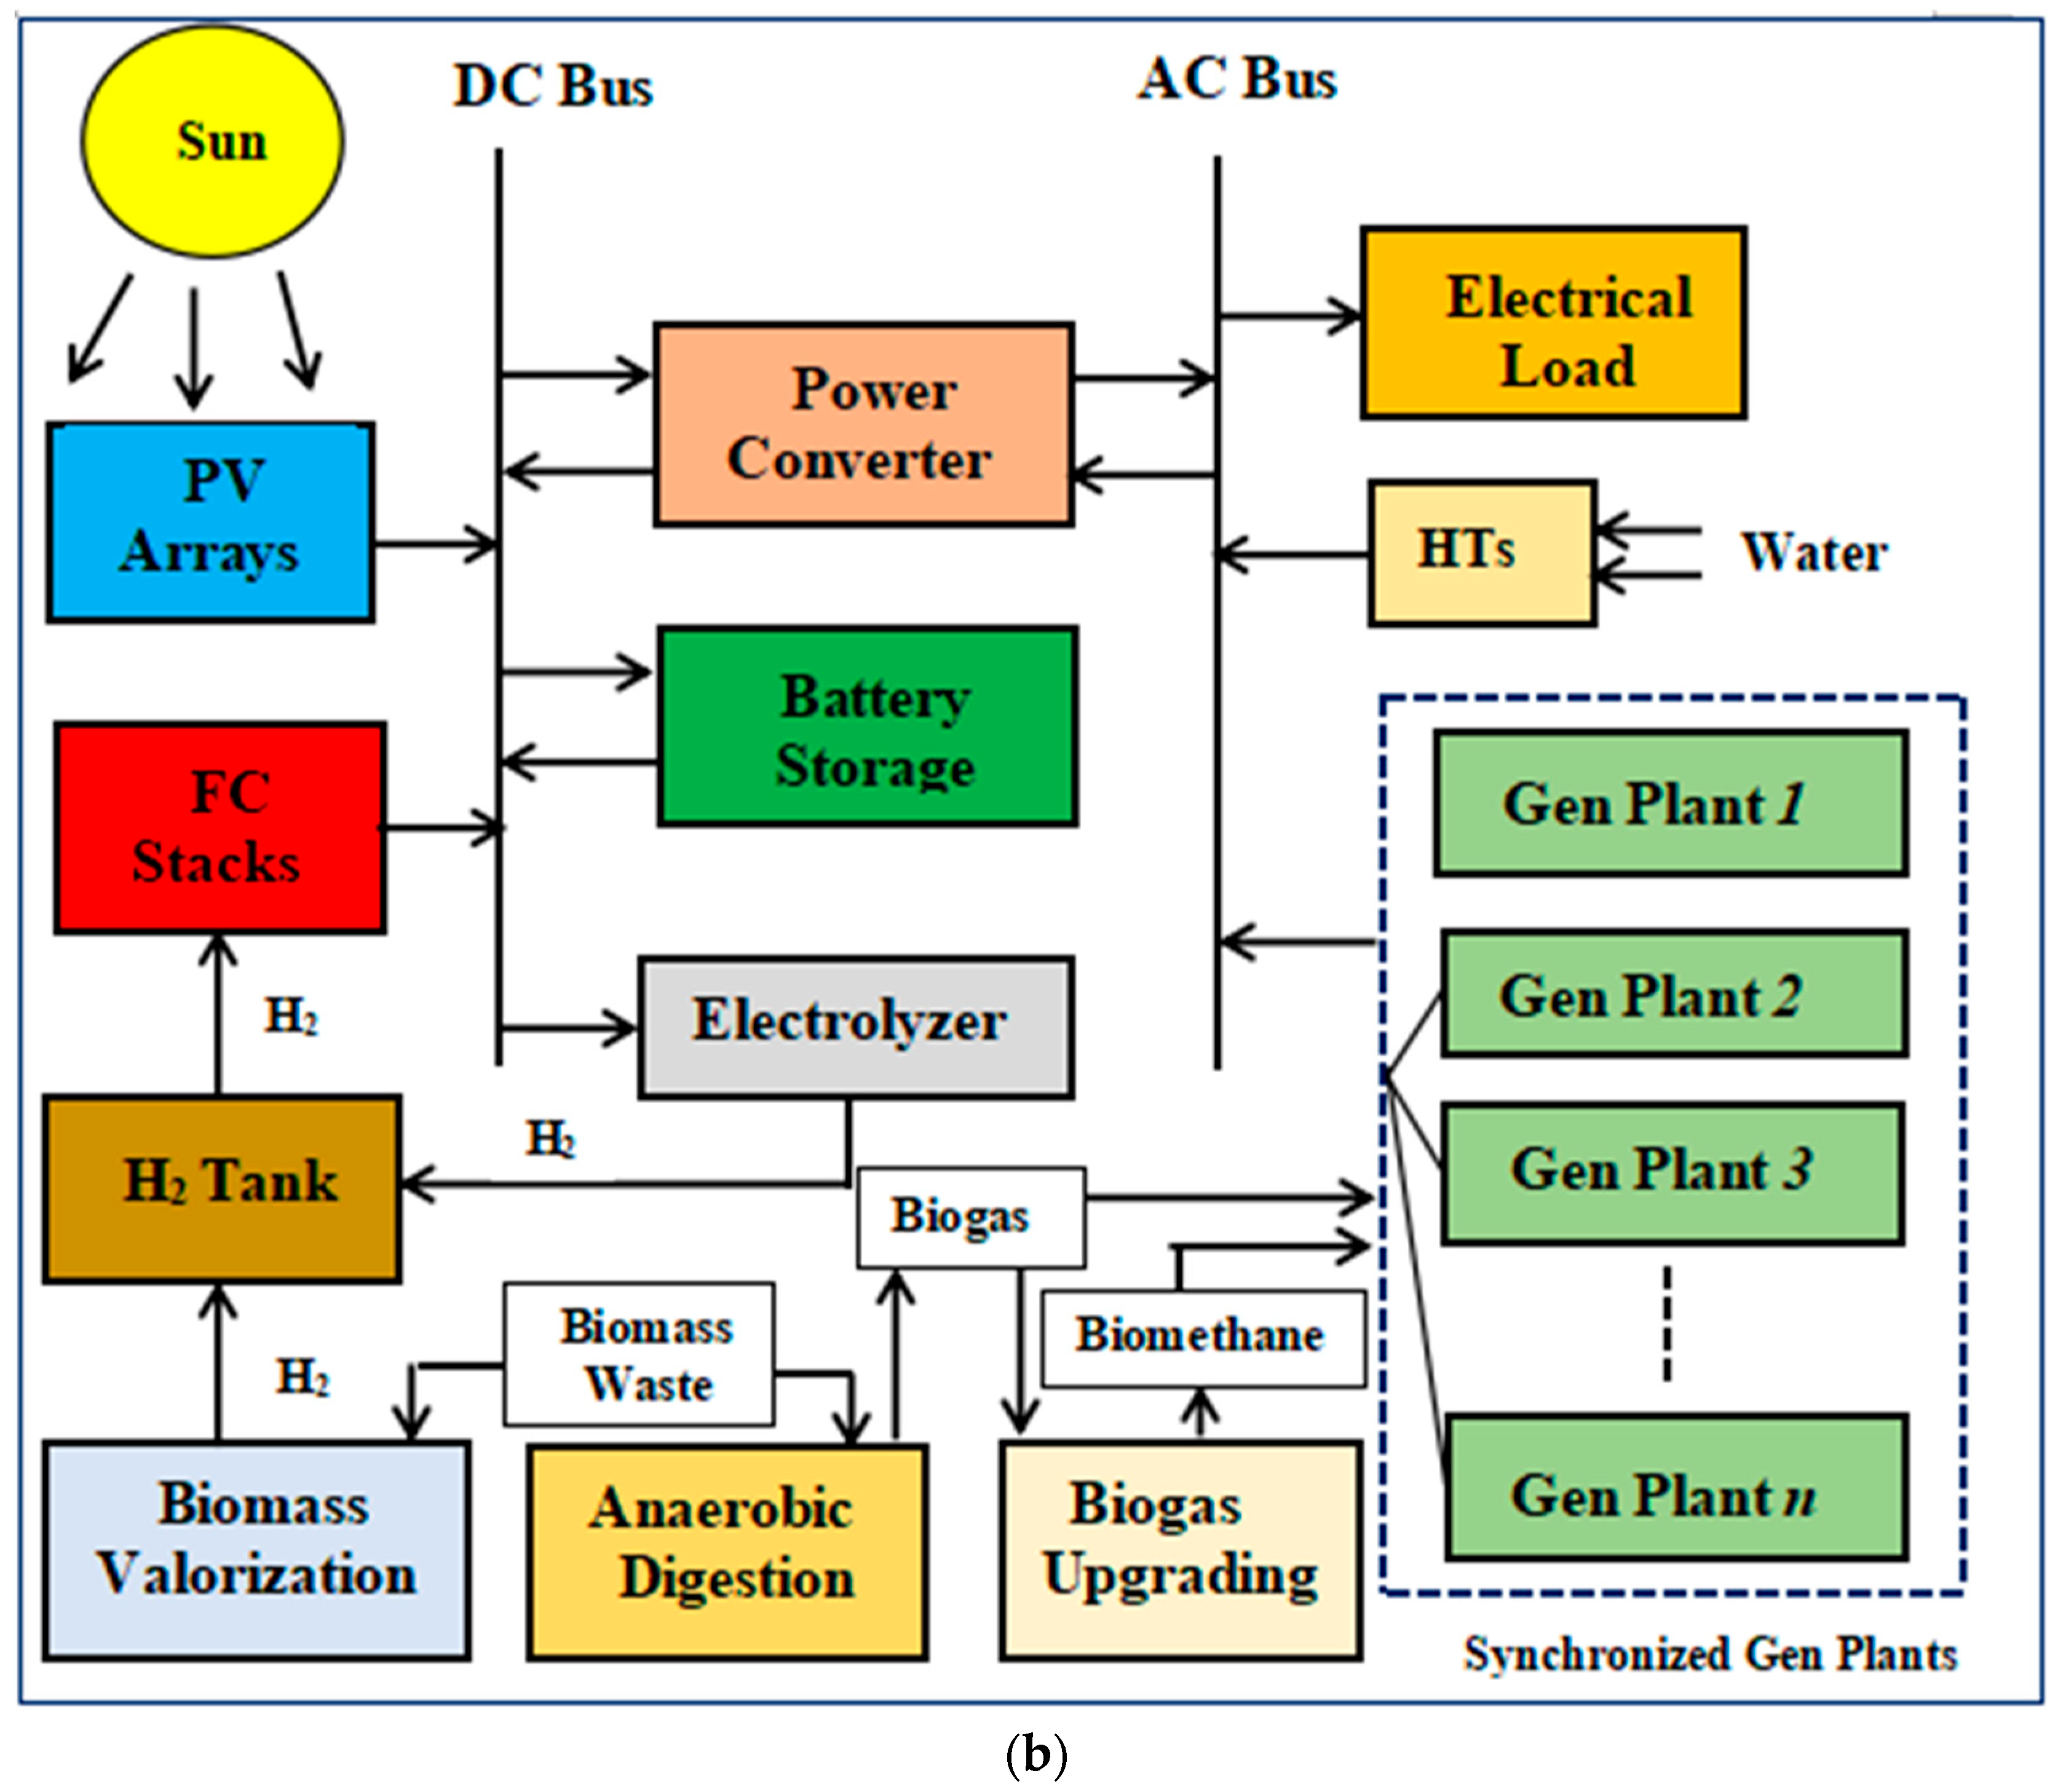
Figure 3a,b represents the technical configurations of the energy systems. They are essentially microgrid configurations designed as multi-energy resources generating systems. For Figure 3a, the green energy (gE) resources include the sun, wind, and hydrogen, and these resources fuel the solar PV arrays, wind turbines (WTs), and the fuel cell (FC) stacks. The configuration consists of several Gen plants wired in parallel, with the possibility of running on different fuels. This way, Gen plant 1 runs on fuel type 1; Gen plant 2 runs on fuel type 2; Gen plant 3 runs on fuel type 3, etc.; so, Gen plant n runs on fuel type n. For Figure 3b, the green energy (gE) resources include the sun, hydro, and hydrogen, and these resources fuel the solar PV arrays, hydro turbines (HTs), and the fuel cell (FC) stacks. The low-carbon energy (LE) resources are biogas and biomethane. It can be seen that the green H2 fuel is produced from two processes, viz., electrolysis and biomass valorization, delivering H2 to the tank from which the supply is fed to the FC. The biomass waste is also processed through anaerobic digestion [90] to produce biogas; the biogas is further processed through biogas upgrading to produce biomethane (i.e., a renewable natural gas obtained from methanation of CO2 in biogas) [91]. These two resources can be employed as part of the fuel to run the Gen plants.
Suppose that all the fuel types 1, 2, 3, to n are based on conventional resources such as diesel, gasoline, natural gas, etc. The Gen plant is regarded as a system that depends on conventional energy resources and is carbon intensive. However, fuel types 1, 2, 3, to n may also be based on the gE of LE resources such as biogas, biodiesel, ethanol, etc., or a mixture of conventional and gE resources and/or unconventional resources. Therefore, the introduced microgrid configurations provide the opportunity to grow a wide range of resources in the energy mix, thereby paving a way for increased gE utilization and penetration in the electricity value chain. Green energy is crucial to the paradigm shift to a carbon-neutral global community.
The power converter has two functions: Firstly, it converts the DC power from the PV and the FC to AC power, supplying this to the AC bus. Secondly, the power converter also converts the AC power from the AC bus to DC power to charge the battery. The AC power from the WTs and the Gen plants is also supplied to the AC bus. The excess renewable energies are also converted into hydrogen to operate the FC; this is through an electrolytic process as shown in Figure 3a. However, Figure 3b takes another dimension by introducing more energy conversion processes such as biomass valorization, anaerobic digestion, and biogas upgrading to generate energy vectors such as H2, biogas, and biomethane, respectively. The electrical architecture presented in Figure 3a,b is AC-DC coupled.
Importantly, two challenges are identified when it comes to managing energy demand and energy supply with renewable energy (RE) resources: one is essentially a mismatch between the availability of the abundant RE resources and the load demand requirements in several locations and applications. The second issue is the need to provide fuel with relatively high energy density (hydrocarbon-based, for instance) to be able to satisfy the users’ energy requirements [92]. These challenges may be addressed by the power-to-X technologies, in which case the excess renewable power is converted to other fuels (gases or liquids), such as in power-to-gas, where H2 or methane (CH4) is produced, or power-to-liquid, whereby gasoline, methanol, or kerosene is produced. These developments create a useful pathway for green hydrogen, green methanol, synthetic natural gas, etc. The proliferation and utilization of the synthetic fuels generated from power-to-X technologies also make it possible to decarbonize certain sectors of the economy that are not possible or overly difficult to electrify. Figure 3b illustrates how biogas may be further processed to produce biomethane.

3.2. Approach to Multi-Energy Generation in Microgrids in the SAM Environment

3.2.1. Commercial Load Demand Model

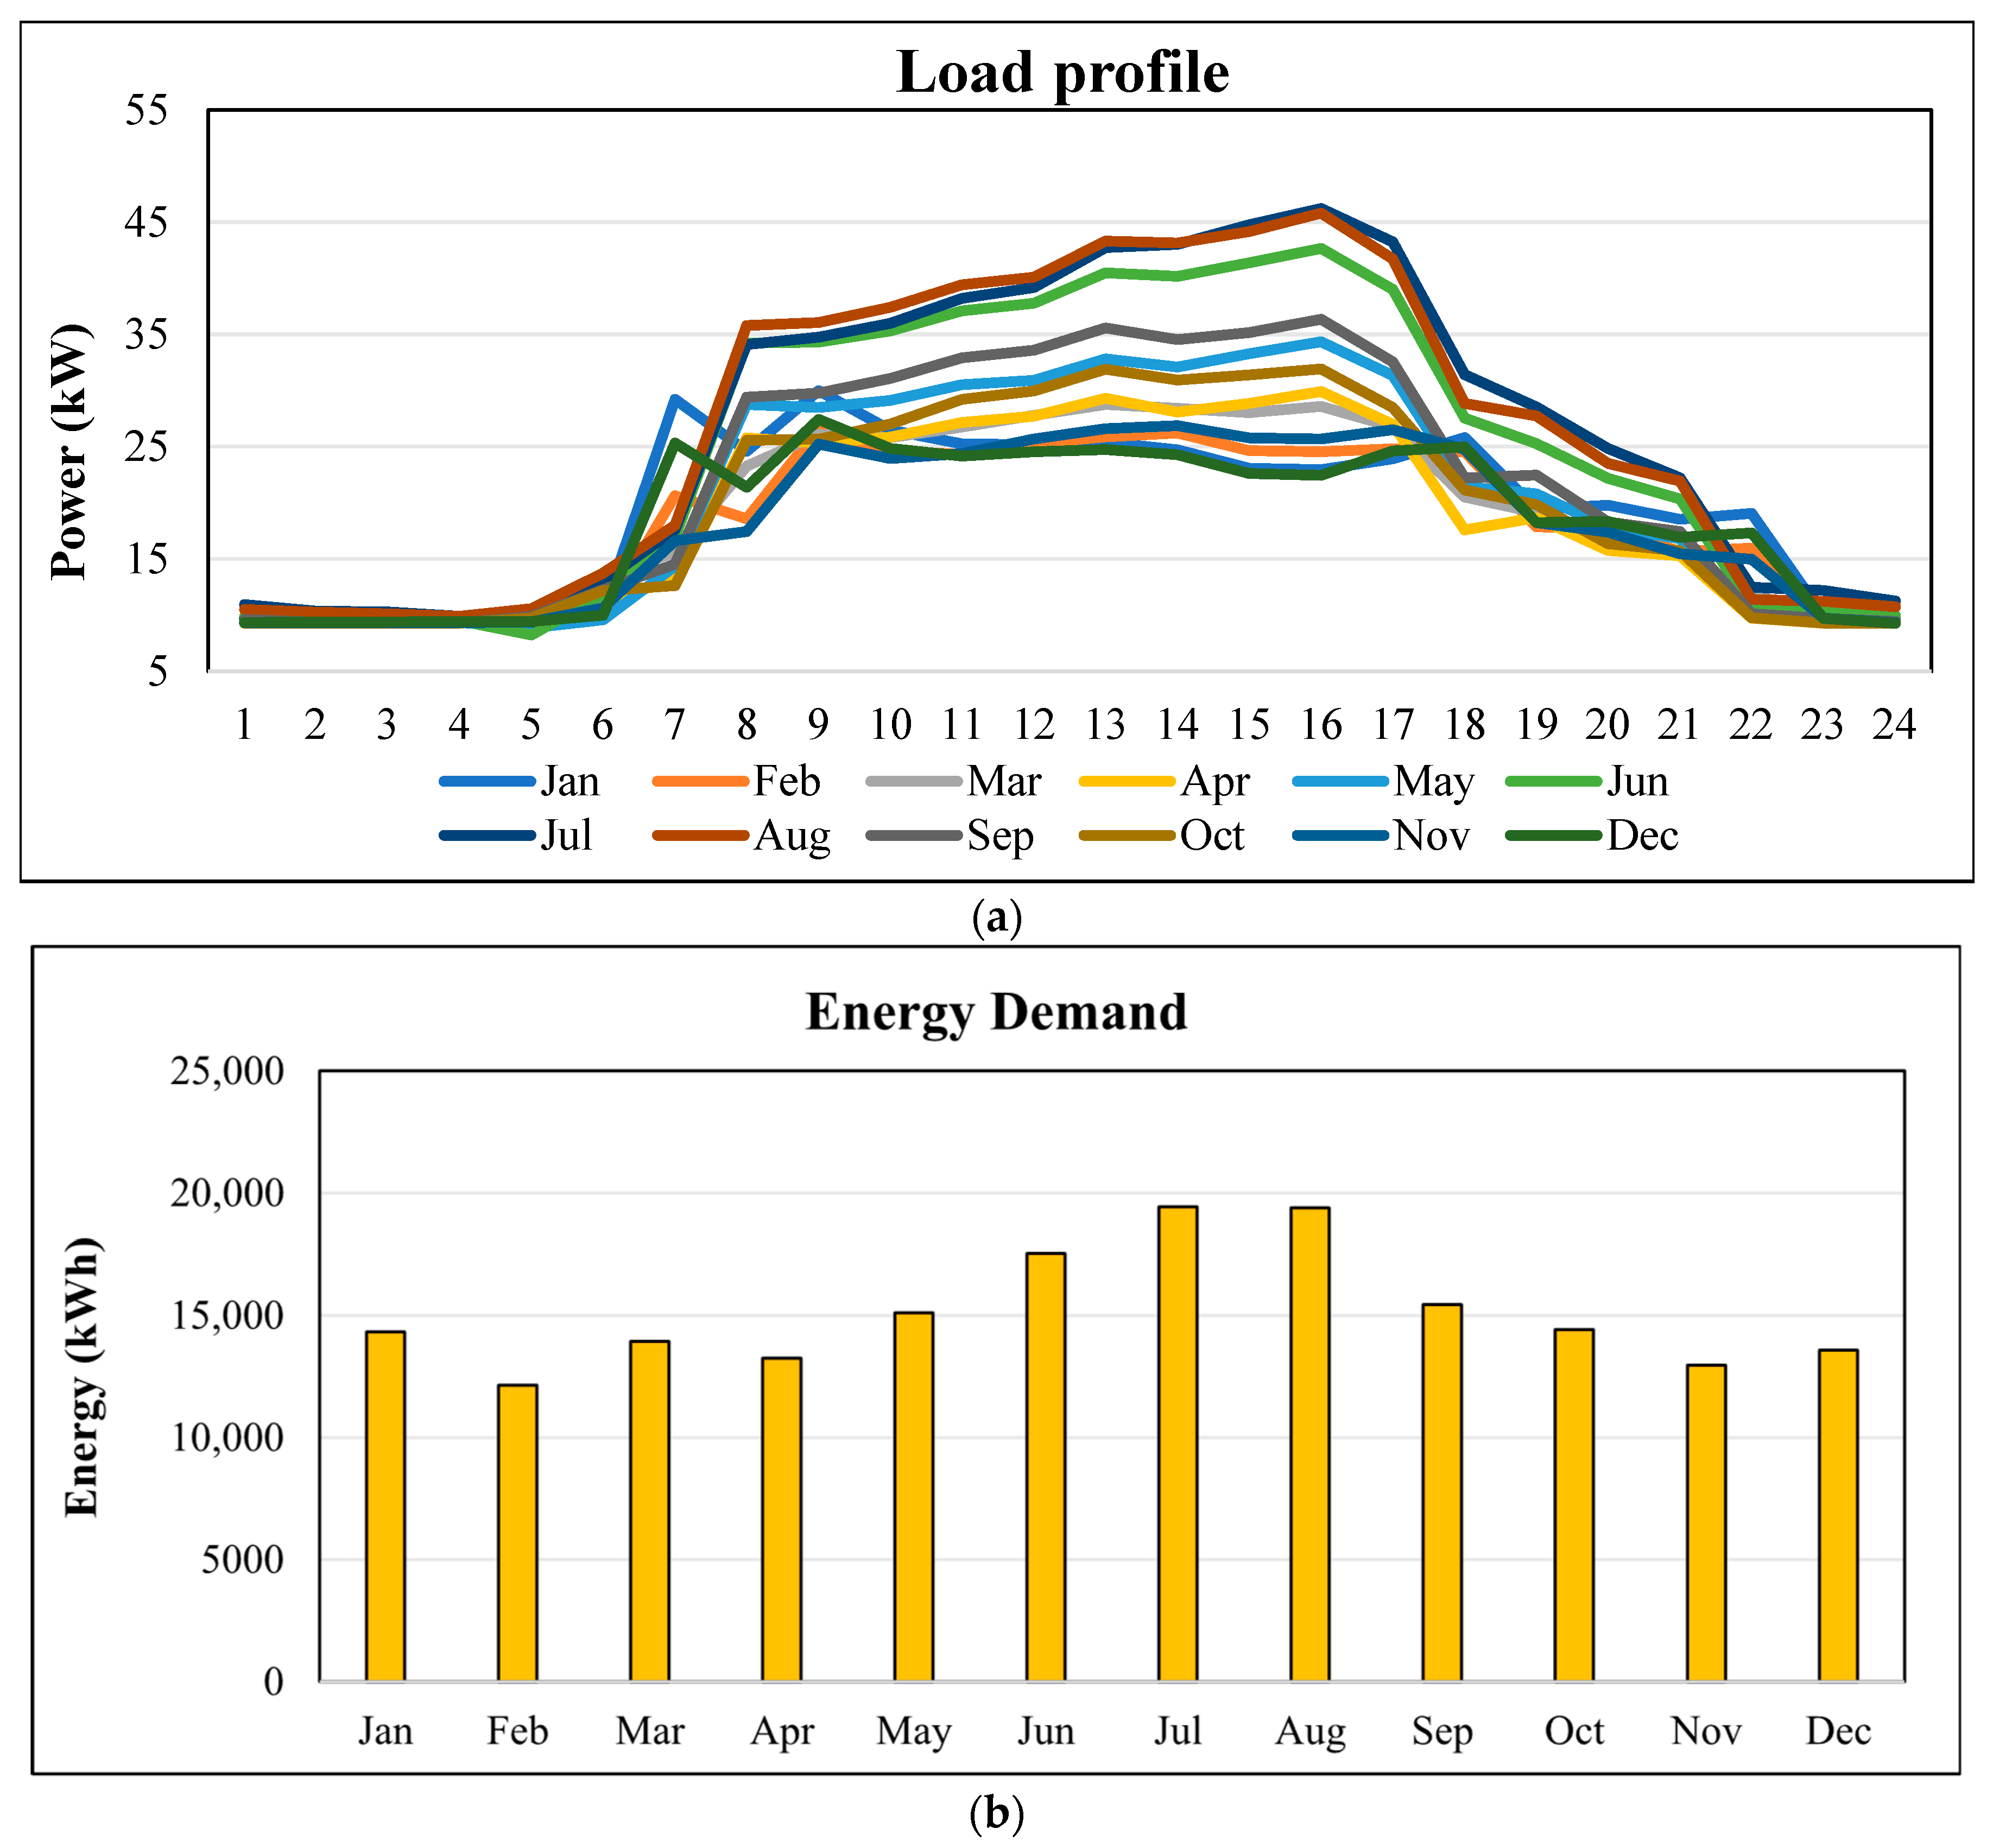
The load profile and the monthly load demand model of the commercial center are shown in Figure 4a,b. This load data has been obtained from the SAM software, described as NREL OpenEI Commercial and Residential Hourly Load Profiles for all TMY3 locations in the US [93]. A commercial load consumption is assumed for the simulation of the multi-energy generation system. The lowest and the highest energy consumption of the commercial facility are 13,937.52 and 19,427.12 kWh for March and July, respectively. The input load model in SAM is shown in Figure 5, where an electric load scaling factor of 25% is applied to the user-center load (i.e., the original load). The annual electric load growth factor is not applied to the load model. The total energy demand is 181,552.09 kWh/yr. The commercial load is assumed to be made up of indoor and outdoor lighting fittings, several electric fans, desktop computers, printers, televisions, air conditioners, etc.

3.2.2. Solar Photovoltaic Power Simulation Methods

The PV is modeled in the SAM environment by employing the standard “PVWAtts” inputs [94]. This way, the set of parameters required at the input stage of the simulation include the system size, solar PV module type (standard crystalline silicon), system losses (14.08%), solar PV array type (fixed open rack), tilt angle (20°), azimuth angle (180°), DC-to-AC ratio (1.15), and the inverter efficiency (96%). The standard crystalline silicon panels, having efficiencies in the range of 14 to 17% and a temperature coefficient of −0.47%/°C, are employed in this paper. In addition, the module is assumed to be covered by glass. It is conventional in modern PV devices that the capacity of the solar arrays is determined in such a way that their rated DC capacity is greater than the rated AC capacity of the inverter. This development allows the harvesting of more energy during the day.
Furthermore, a thermal model is also integrated with the PVWatts to estimate the operating cell temperature, Tc, in line with the first principles of heat transfer of the energy balance model [95]. The installed nominal operating cell temperature (INOCT) of the PV module is 45 °C for the fixed open rack type. The PV module’s DC power is calculated by PVWatts from the PV array with a specified “nameplate” rated DC capacity, Pdc0, with respect to the computed value of Tc and the transmitted plane-of-array (POA) irradiance, Itr, according to Equation (4) [94]. The solar array’s efficiency is assumed to be reduced at a linear rate as the temperature increases, brought about by the PV module’s temperature coefficient, α ; the reference cell temperature, Tref, and the reference solar irradiance is 1000 W per m2.
P d c = I t r 1000 P d c 0   ( 1 + α ( T c T r e f ) )  
The total PV system losses, Ltotal, in the PVWatts are estimated by employing Equation (5) with the assumption that the losses are a proportion of the DC energy [94].
L t o t a l ( % ) = 100 [   1 i 1 L i 100 ]  
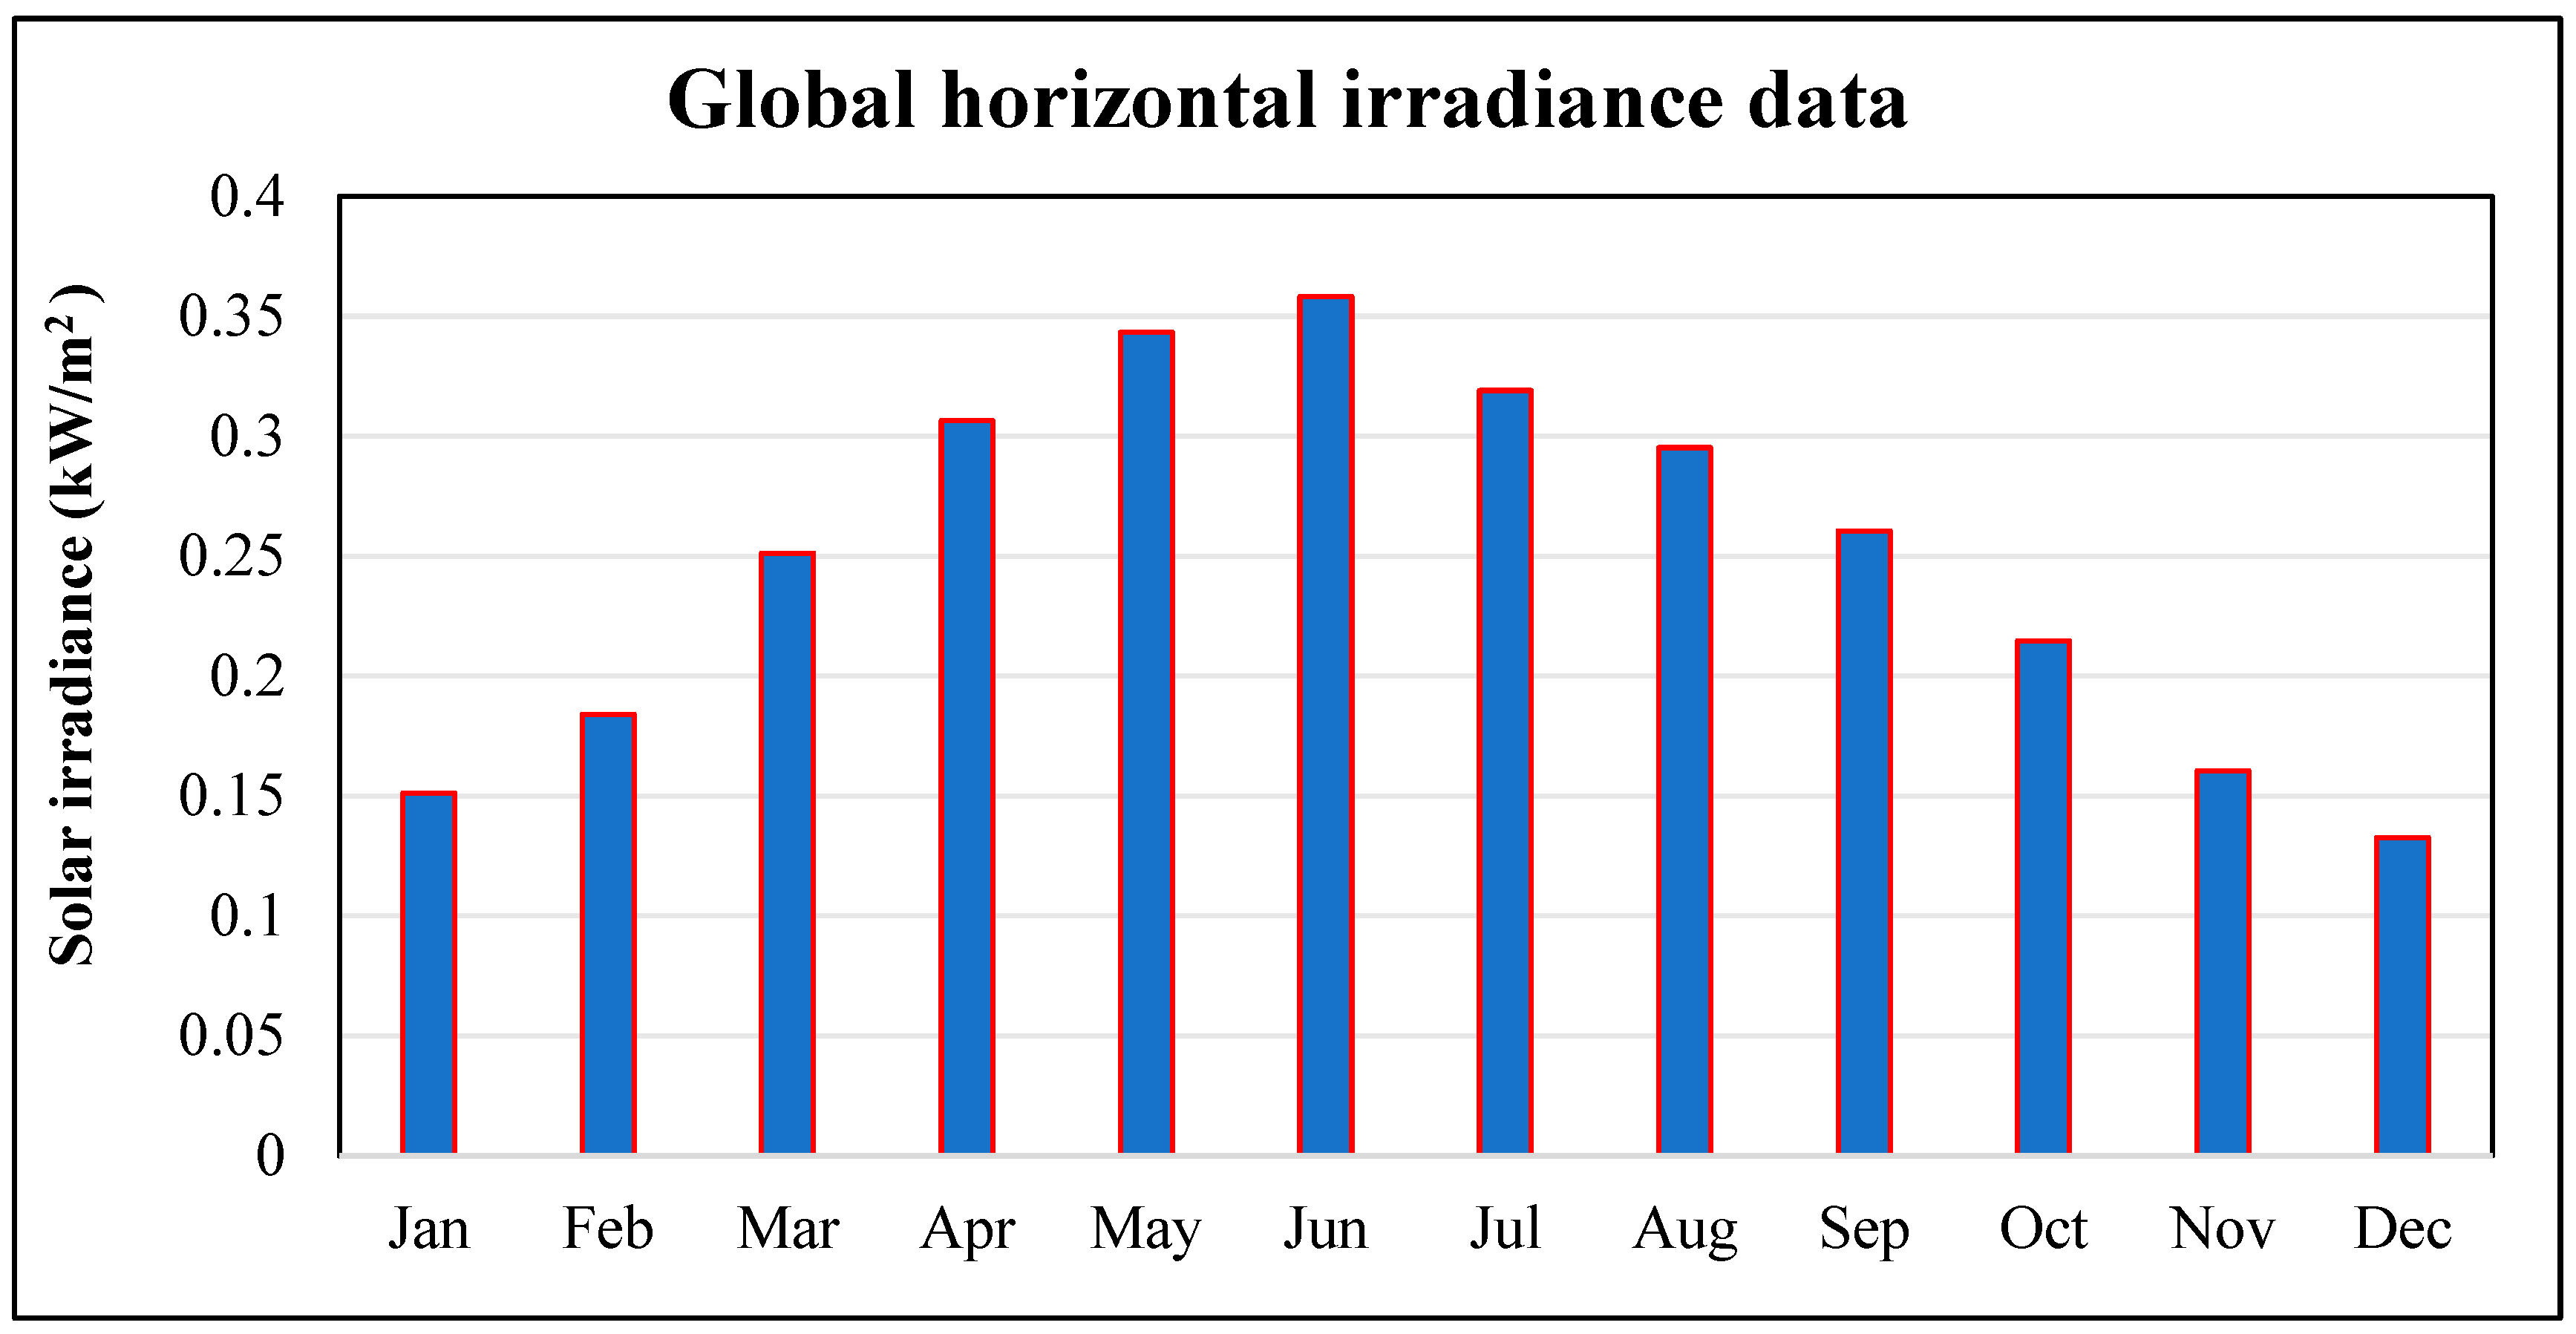
The solar data, blythe_ca_33.617773_-114.588261_psmv3_60_tmy, the latitude, longitude, elevation, and the source are 33.61, −114.58, 82 m, and NSRDB for US location. The global horizontal solar irradiation, average temperature, and average speed are 5.96 kWh/m2/day, 24.1 °C, and 2.3 m/s, respectively. Figure 6 shows the solar irradiance data.

3.2.3. Wind Power Simulation Methods

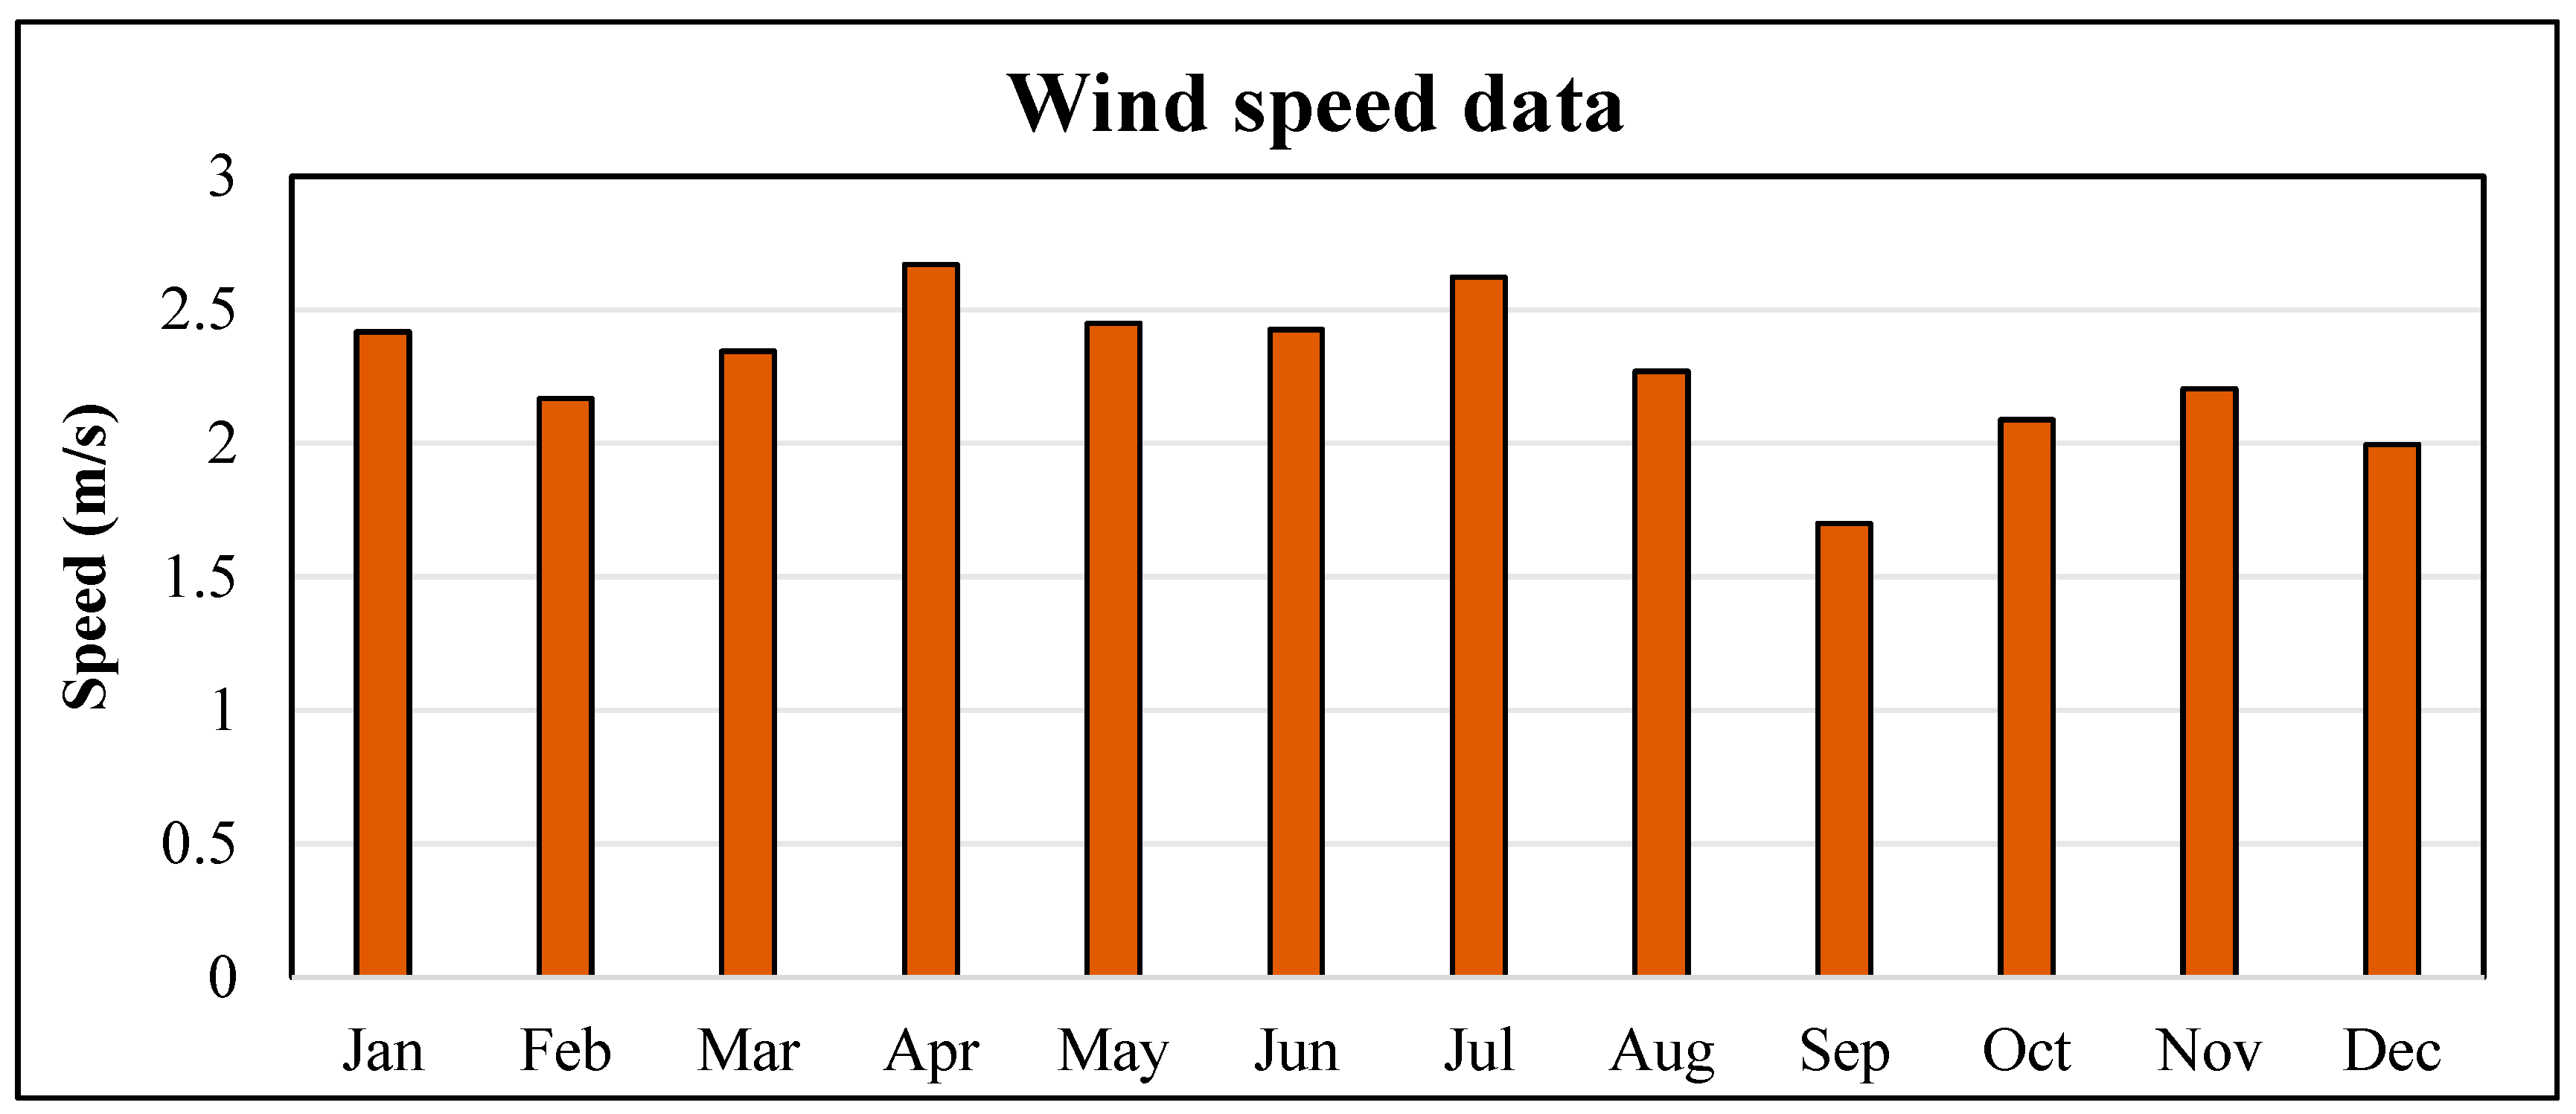
The wind data description is as follows: Eastern AZ—rolling hills (NREL AWS Truepower representative file). The wind resource file is named from the SAM library: C:\SAM\2023.12.17\wind_resource\AZ Eastern-Rolling Hilss.srw. Figure 7 shows the wind speed data for the study. The Evoco 10 kW wind turbine (WT) is used for simulation and analysis, which is obtained from the SAM wind resource library. The output power of a wind turbine (WT) at a particular wind speed may be computed by employing Equation (6) [96]:
W T o p = 1 2 × ρ × C p × A × V 3
where W T o p , ρ, C p , A, and V stand for the WT output power, density of air, maximum power coefficient, swept area of WT’s blade, and the wind speed, respectively. Since a circular area is swept by the blades, the value A is π r 2 where r is the radius of the WT rotor. Also, C p in wind energy design and analysis is described as the power extracted by the WT divided by the power available in the wind [96,97,98]; typical values of C p are found between 25 and 45%, while the theoretical maximum value of C p is 59.3%, regarded as the Bertz limit.
One significant aspect of Equation (3) is that a large increase in W T o p could be obtained with a small increase in V. In addition, WT output performance is usually a function of rotor size and the hub height, h, of the design arrangement. Hence, V at a particular value of h in meters may be calculated by using the power law according to Equation (7) [96,97,98,99,100,101].
V = V R ( h h R ) α
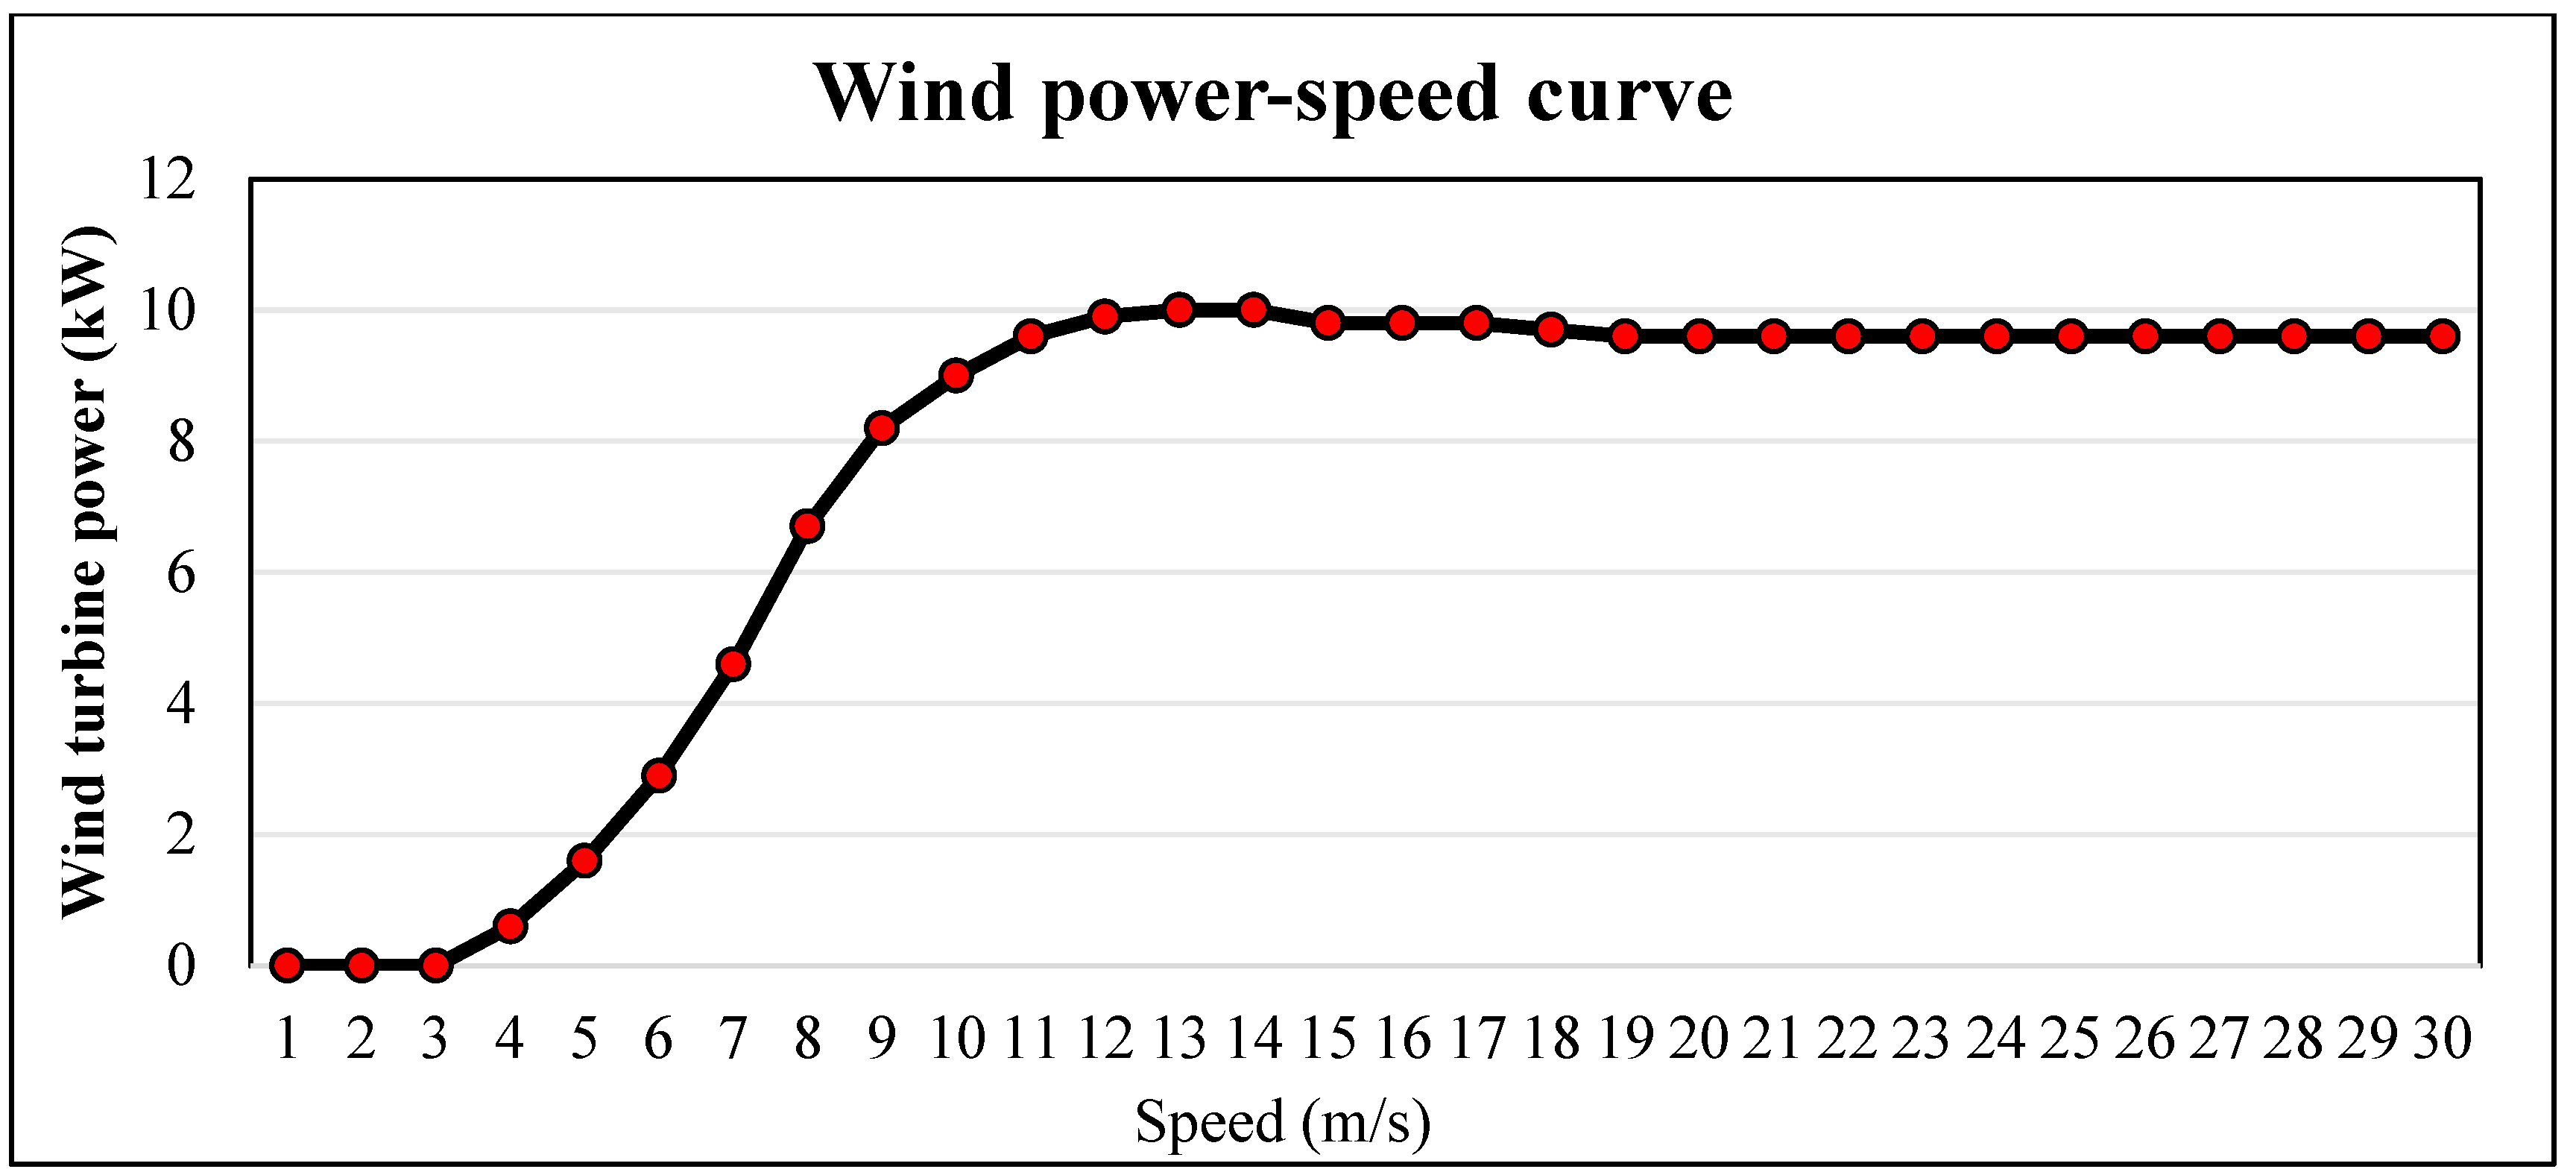
where V R is the value of V at a specified h (referred to as reference height, h R , in meters), while α is the ground surface friction coefficient ranging from less than 0.1 for a flat terrain and water or ice to more than 0.25 for largely forested terrains. A sheer coefficient of 0.14 is used in SAM employed in this study. The rotor diameter and hub height parameters of the WT are 9.7 m and 80 m, respectively, as obtained from the SAM library. Figure 8 shows the WT power-speed characteristics. It is possible to create a wind farm in SAM by specifying the number of WTs in the energy project; such a model includes a simple wind farm layout that is able to assess wake effect losses being developed when there is interference between the upwind turbines and wind energy flowing to downwind turbines [100]. Equation (8) can be used to calculate the layout of the turbines if it is rectangular or a parallelogram [93,94]:
W T s   i n   l a y o u t   ( R e c )   =   W T s / r o w   ×   N o .   o f   r o w s
However, Equation (9) can be employed if the WTs in the layout are assumed to be triangular or trapezoidal, in which case each has a WT less than the previous row [93,100]:
W T s   i n   l a y o u t   ( T r g )   =   W T s   i n   x   +   W T s   i n   y   +   W T s   i n   z   + . . . +   W T s   i n   k
where x, y, z, and k represent the first row, second row, third row, vdes, and the last row, respectively. The layout of the WTs in a rectangular pattern is assumed in this study.

3.2.4. Fuel Cells Power Simulation Methods

The power output of a fuel cell stack may be calculated by Equation (10) [101]:
F C o / p = n × V F C × I F C  
where n , V F C , and I F C   stand for the number of cells (units) wired in the stack series, the voltage output of FC, and FC current, respectively. The total system nameplate (kW) in SAM (rated stack capacity), therefore, may be computed by Equation (11):
R a t e d   F C   s t a c k   c a p a c i t y   ( k W ) = n × U n i t   N a m e p l a t e   ( k W )  
An inverter (DC-to-AC converter) is required to couple the AC and DC buses with multiple energy-generating systems and the loads; this is usually associated with the rated inverter power output and efficiency represented by Equation (12) [101]:
η i n v = P a c P d c  
where η i n v ,   P a c , and P d c   stands for the inverter efficiency, AC-bus power, and the DC-bus power, respectively.
The FC electrical efficiency may be calculated using Equation (13) [101]:
η F C = P F C m   ˙ ×   H H V F C  
where η F C ,   m ˙ and   H H V F C are the FC efficiency, mass flow rate (kg/s), and higher heating value of the fuel, respectively.
The FC fuel consumption is calculated in the SAM simulation environment in light of the electrical efficiency associated with the generated electrical power. The values of efficiency are obtained from the percent output power, which may be determined or defined relative to the original nameplate power. The FC fuel consumption may be calculated by Equations (14) and (15a,b) [102]:
F U E L C o n s u m p t i o n = 3600   ×   t   ×   P F C 100   ×   η F C × L H V    
F U E L C o n s u m p t i o n   ( m 3 ) = ( M C f × 1000 ) × 0.0283168466  
F U E L C o n s u m p t i o n   ( k g   o r   litre ) = F U E L C o n s u m p t i o n   ( m 3 ) × 1000  

3.2.5. Battery Storage System Sizing

The battery size ( B S ) is calculated by using Equation (16a):
B S   ( k W h ) = E D E M M D o D × η B a t · D a u
where E D E M , M D o D   ( % ) , η B a t   % , and D a u represent the maximum daily energy demand (kWh/d), maximum depth of discharge of the battery bank, battery’s efficiency, and the days of autonomy. The values assumed for M D o D , η B a t , and D a u in this study are 80%, 85%, and 1.5, respectively.

3.2.6. Generic Power Plant Simulation Methods

The generic power plant (Gen plant), as mentioned in SAM version 2023.12.17, is essentially a generation profile model that offers the opportunity to represent a thermal power generation plant through a simple model using the capacity factor and nameplate capacity parameters [93]. It is otherwise called the custom generation profile in version 2025.4.16. This study first assumes the constant generation option for a generic power plant running on a conventional fuel (e.g., diesel, gasoline, etc.), which can be compared with renewable energy resources in the m-grd system. The possibility of exploring other resources, such as natural gas, biogas, etc., is also considered in this study. These are then compared with the green energy resources—solar, wind, and hydrogen. The total yearly generation may be calculated by Equation (16b):
T A G   ( k W h / y r ) = P N P × C F ( % ) 100 × ( 1 P L O S S ( % ) 100 ) × 8760   h / y r
where T A G , C F , and P L O S S represents the total annual generation of the plant, capacity factor, and power plant losses. The values of 91 and 9% are used for CF and P L O S S as obtained from the SAM tool.

3.2.7. Total Performance and Reliability Analysis

The total energy generated by the m-grd may be calculated by Equation (17).
E G E N = P V G E N + W T G E N + F C G E N + G P G E N
where the energy generated by the PV, WT, FC, and generic plant is represented by P V G E N , W T G E N , F C G E N , and G P G E N , respectively.
The total excess energy and the total energy deficit from the microgrid may be calculated by Equation (18a,b) [103,104,105,106]:
E E X C = +   ( E G E N E D E M )
  E D E F = ( E G E N E D E M )
where E E X C , E D E F , E G E N , and E D E M represents the excess energy, energy deficit, energy plus energy obtained for January, February, March, April, May, June, July, August, September, October, November, and December, i.e., the sum of E E X C ( J a n ) , E E X C ( F e b ) , E E X C ( M a r ) ,   E E X C ( A p r ) , E E X C ( M a y ) , E E X C ( J u n ) , E E X C ( J u l ) , E E X C ( A u g ) , E E X C ( S e p ) , E E X C ( O c t ) , E E X C ( N o v ) , and E E X C ( D e c ) .
Similarly, E G E N is the sum of E G E N ( J a n ) , E G E N ( F e b ) , E G E N ( M a r ) , E G E N ( A p r ) , E G E N ( M a y ) , E G E N ( J u n ) , E G E N ( J u l ) , E G E N ( A u g ) , E G E N ( S e p ) , E G E N ( O c t ) , E G E N ( N o v ) , and E G E N ( D e c ) . Also, E D E M is the sum of E D E M ( J a n ) , E D E M ( F e b ) , E D E M ( M a r ) , E D E M ( A p r ) , E D E M ( M a y ) , E D E M ( J u n ) , E D E M ( J u l ) , E D E M ( A u g ) , E D E M ( S e p ) , E D E M ( O c t ) , E D E M ( N o v ) , and E D E M ( D e c ) ; and E D E F is the sum of E D E F ( J a n ) , E D E F ( F e b ) , E D E F ( M a r ) , E D E F ( A p r ) , E D E F ( M a y ) , E D E F ( J u n ) , E D E F ( J u l ) , E D E F ( A u g ) , E D E F ( S e p ) , E D E F ( O c t ) , E D E F ( N o v ) and E D E F ( D e c ) .
The loss of energy supply probability (LOESP) and the system availability (SaV) may be calculated by Equations (19) and (20):
L O E S P   ( % ) = T o t a l   D e m a n d   N o t   M e t   ( D N M ) T o t a l   E n e r g y   D e m a n d   ( E D E M ) × 100
where the total DNM is the sum of the demand not met obtained for January, February, March, April, May, June, July, August, September, October, November, and December, i.e., the sum of D N M J a n , D N M F e b , D N M M a r , D N M A p r , D N M M a y , D N M J u n , D N M J u l , D N M A u g , D N M S e p , D N M O c t , D N M N o v , and D N M D e c . In the context of this paper, the total energy deficit translates to the total demand not met.
S a V   ( % ) = 100 L O E S P ( % )

3.2.8. Quantity of Fuel and Carbon Emissions Analyses

The m-grd presented in this study assumes a system functioning with multi-energy resources, viz., solar, wind, hydrogen, and diesel energies for operating the PV, WT, FC, and the generic power plant. While the PV, WT, and FC are fueled by clean energy sources, the generic plant operates on fossil fuel resources (i.e., diesel). The amount of carbon emissions avoided is a function of the fuel mix of the microgrid. The study assumes three different fuel mixes, viz., fuel mix 1: solar, wind, hydrogen, and diesel energies; fuel mix 2: solar, wind, hydrogen, and natural gas energies; fuel mix 3: solar, wind, hydrogen, and gasoline energies. The gen plant (Gen plant) will be run by either diesel, natural, or gasoline in the fuel mixes. The quantity of the fuel consumed by the Gen plant for different cases or scenarios may be calculated by Equation (21):
F U E L C o n s u m p t i o n   b y   G e n   p l a n t   =   F U E L C o n s u m p t i o n / kWh × G P G E N
where F U E L C o n s u m p t i o n / kWh and G P G E N are the amount of fuel required to generate 1 kWh of electricity and the total energy generated by the Gen plant. The emissions may be calculated by Equation (22a,b):
C O 2   e m i s s i o n s   b y   G e n   p l a n t   ( kg )   =   E F a c t o r / kWh × G P G E N
C O 2   e m i s s i o n s   b y   G e n   p l a n t = E F a c t o r / L × F U E L C o n s u m p t i o n
where E F a c t o r / kWh and E F a c t o r / L represent the carbon dioxide emissions released by the fuel for 1 unit of electricity generated, or the emissions produced when 1 L of the fuel is consumed to produce electricity.

3.2.9. Project Cost Analyses

The levelized cost of energy (LCOE) is essentially an overall project’s life cycle cost presented in cents/kWh of electricity that is being delivered by a particular system over its useful life, either to the existing power grid and/or load for “behind-the-meter” or existing grid for “front-of-meter” projects [93,107]. In the cash flow, the financial model for cases like the distributed “behind-the-meter” energy projects with battery storage devices, the cost of energy employed for charging the battery bank is computed as a reduction in the energy savings achieved by the project under study. For such energy projects, the “energy” aspect of the LCOE mathematical relation is considered in terms of the electrical energy delivered to the load and/or power grid over the project’s useful life by the solar PV system or other energy source and the battery storage device. To properly account for the amount expended for charging the battery bank, the mathematical expression for the LCOE will include the cost estimate considering the retail electricity rate structure (that may include tiered and/or time-of-use rates), even though this is not included as part of the project cost in the cash flow.
Equation (23a,b) represents the calculation of the m-grid system’s LCOE [93,107]:
L C O E   ( r e a l ) = C e q x = 1 N C x ( 1 + d n o m ) x x = 1 N Q x ( 1 + d r e ) x
L C O E   ( n o m i n a l ) = C e q x = 1 N C x ( 1 + d n o m ) x x = 1 N Q x ( 1 + d n o m ) x
where Qx (kWh), N, Ceq, Cx, dnom, and dre stand for electrical energy delivered by the m-grid to the load (and/or grid if applicable) in year x, evaluation period in years, the project’s equity investment capital, yearly project costs in year x, discount rate with inflation, and the discount rate without inflation.
The yearly cost of a project (Cx) is the product of the LCOE and the amount of electrical energy (Qx) delivered by the m-grid to the load and/or power grid in that particular year. Therefore, this annual cost may be represented by Equation (24) [93,107], and it is made up of the installation cost, O and M, financial costs, incentives, liability, etc.
C x = Q x · L C O E
The performance model in the SAM tool calculates the yearly energy Qx for x = 1. For x > 1, Qx decreases from one year to another if the rate of degradation is more than zero [93]; otherwise, the yearly energy is the same over the evaluation period.
The overall life cycle cost (OLLC) of the project is the present worth of project costs over the specified evaluation period (N), discounted at a rate (d) as presented in Equation (25) [107]:
O L C C = x = 0 N C x ( 1 + d ) x
By combining Equations (24) and (25), LCOE may then be represented by Equation (26) [93,107]:
L C O E = x = 0 N C x ( 1 + d ) x x = 1 N Q x ( 1 + d ) x
The net present value (NPV) of a particular project shows an indication of the economic viability or feasibility of the project, which includes both the revenue (or savings for residential and commercial systems applications) and the cost [93]. Generally, given the specified discount rate by the designer, a positive NPV shows an economically feasible project, while a negative NPV indicates an economically infeasible project. Therefore, in the SAM environment, the NPV represents the present value of the cash flow discounted after tax to year 1 based on the nominal discount rate according to Equation (27) [93,107]:
N P V = x = 0 N C x ( 1 + d n o m ) x
Cx represents the “after tax” cash flow in year x for the commercial or residential model.
The internal rate of return, as described in SAM, represents the “nominal” value of d, which corresponds to an NPV of 0 for the PPA financial models. This may be estimated by Equation (28) [93]:
N P V = x = 0 N C x ( 1 + I R R ) x = 0
It is important, however, to also note that when considering and assessing the project’s financial viability, it is reasonable to ascertain the NPV, internal rate of return (IRR), and/or the power purchase agreement (PPA) price, and the size of debt metrics together to ensure they are all reasonable. A positive NPV, for instance, with an unreasonably high IRR may show that the project revenues under study are unreasonably high in comparison to the costs of the project. Also, a project that necessitates a high PPA price to achieve a positive NPV may not be competitive in a bidding process. In the wake of this, the following are the strategies for increasing a project’s NPV [93]:
-
Reduction in installation and/or operating costs;
-
Increase in the level of incentives;
-
Increase in discount rate;
-
Increase in revenue (i.e., increase in PPA price, PPA price escalation, or decrease in IRR target) for PPA projects, e.g., PPA, merchant plant, third-party ownership, community solar PV system;
-
Increase in savings (i.e., adjust retail electricity rate or load) for distributed projects (e.g., residential and commercial).
For projects having a “debt” term, equity, as defined in the SAM environment, is the amount of money invested by the project owner, or simply put, the investor, while debt is the amount of money borrowed by the project. How SAM calculates the overall cost indices of a project is determined by the type of financial model used.

4. Results and Discussion

4.1. Energy Mix in the Microgrid

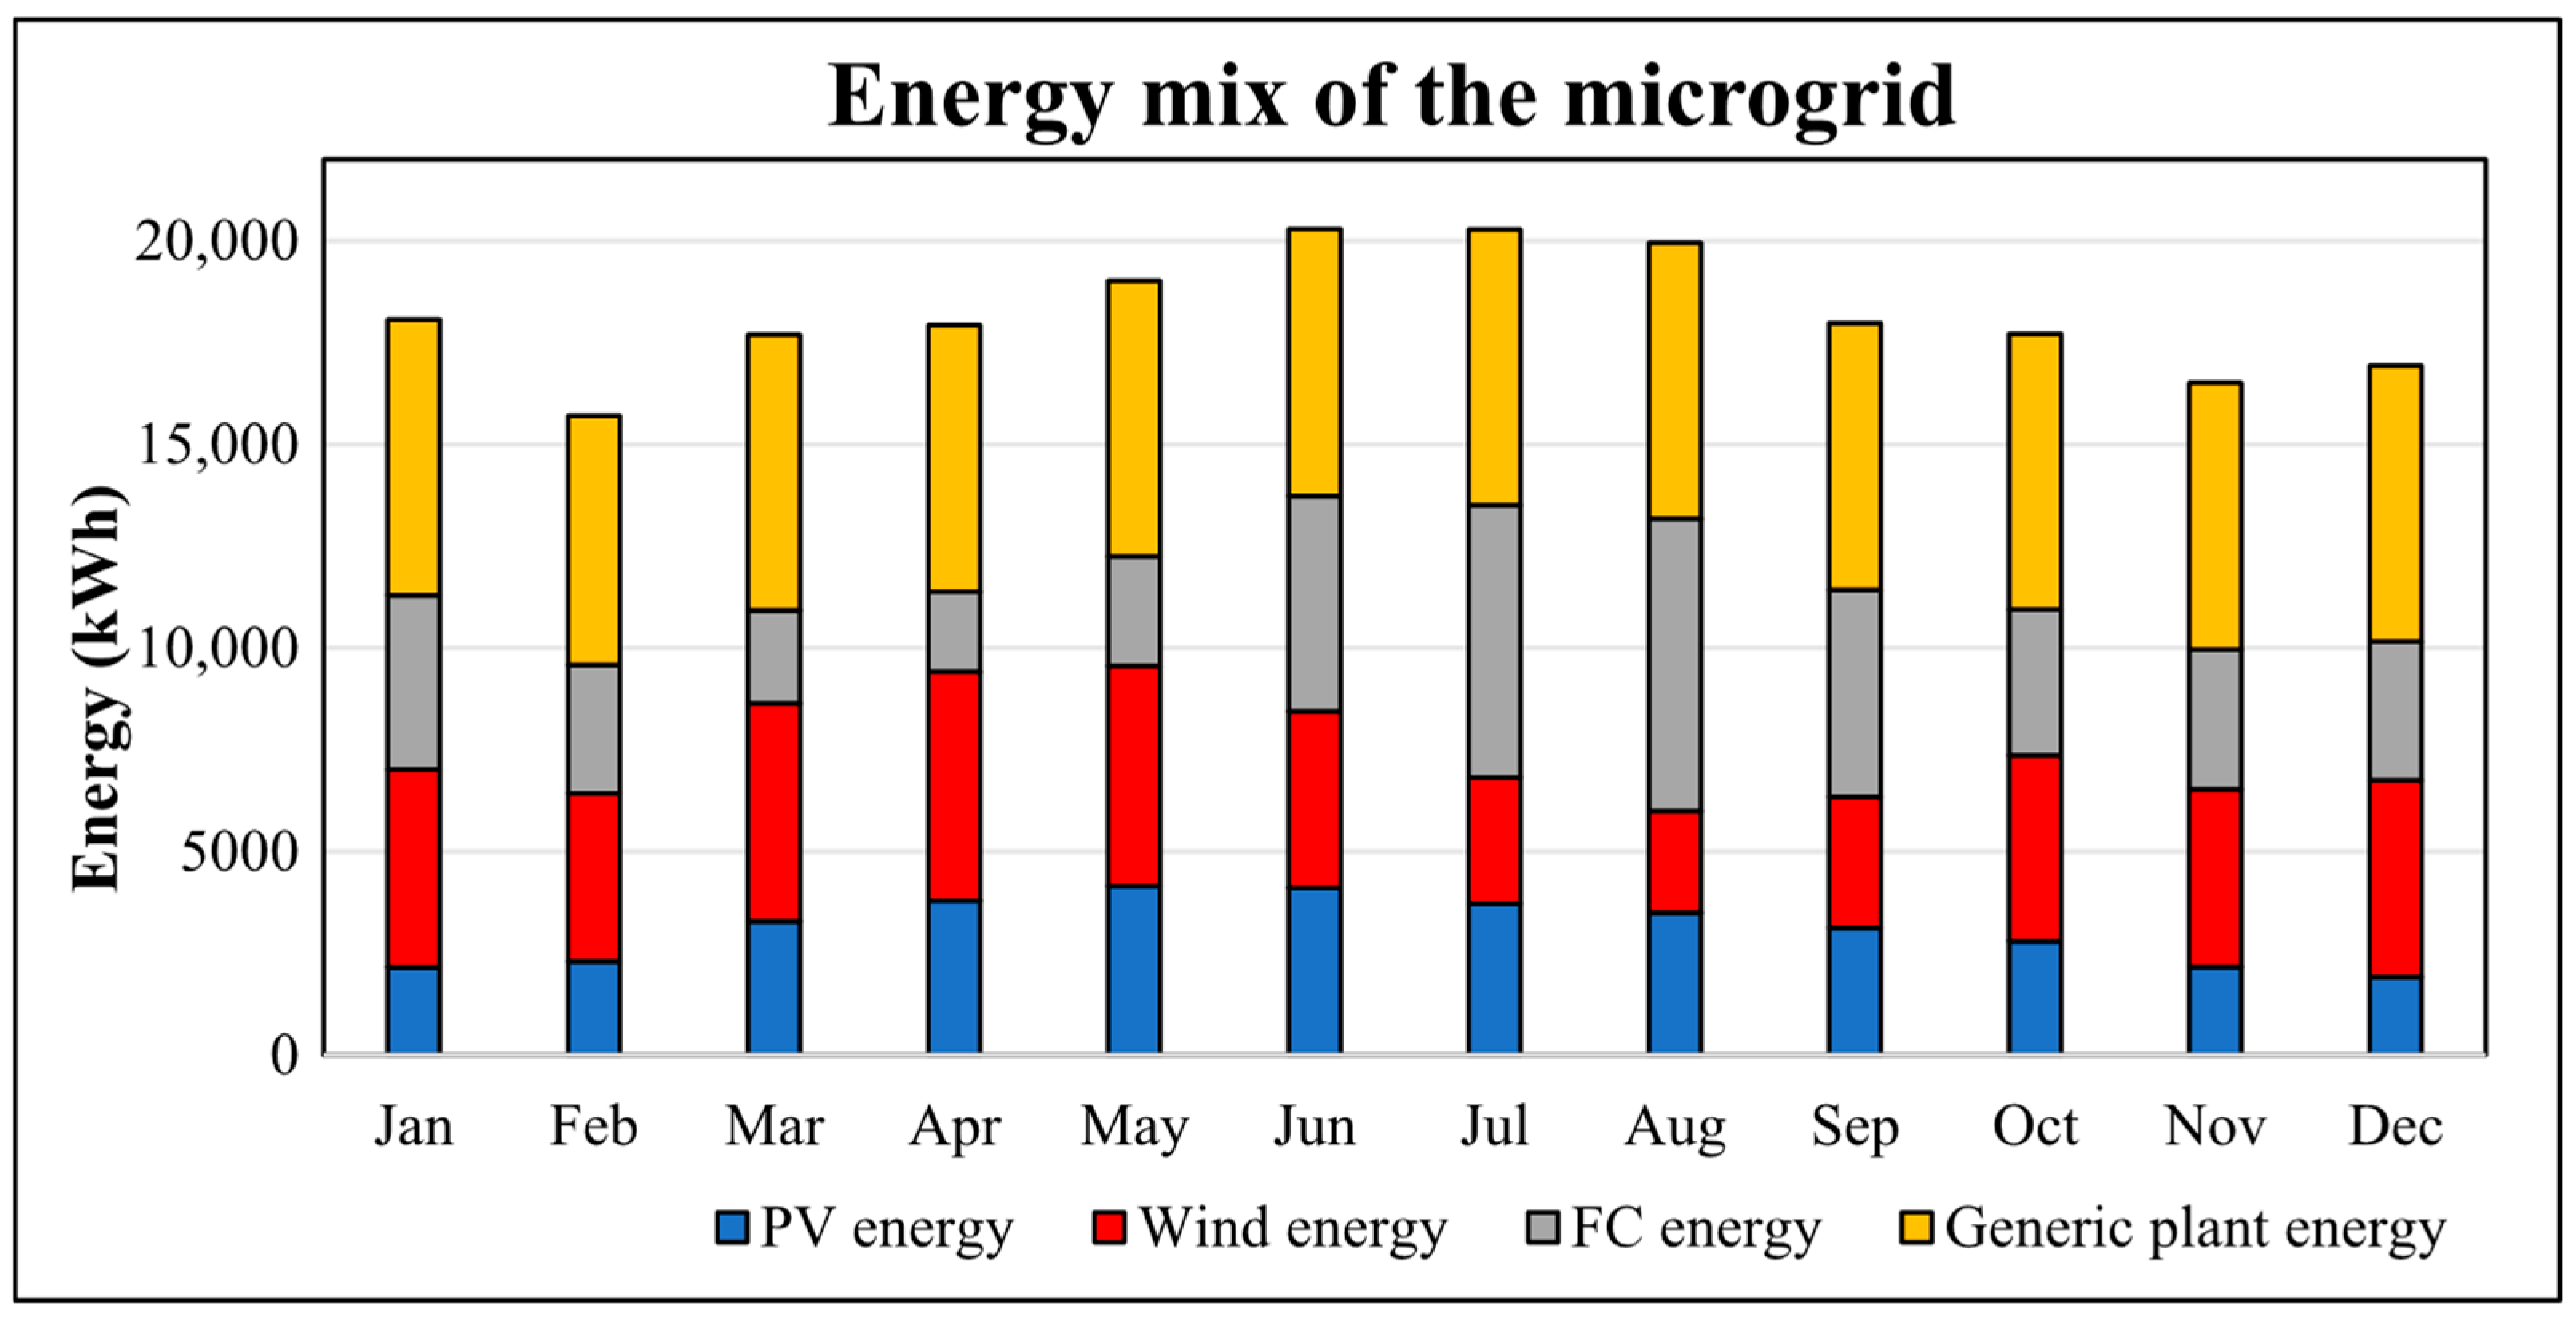
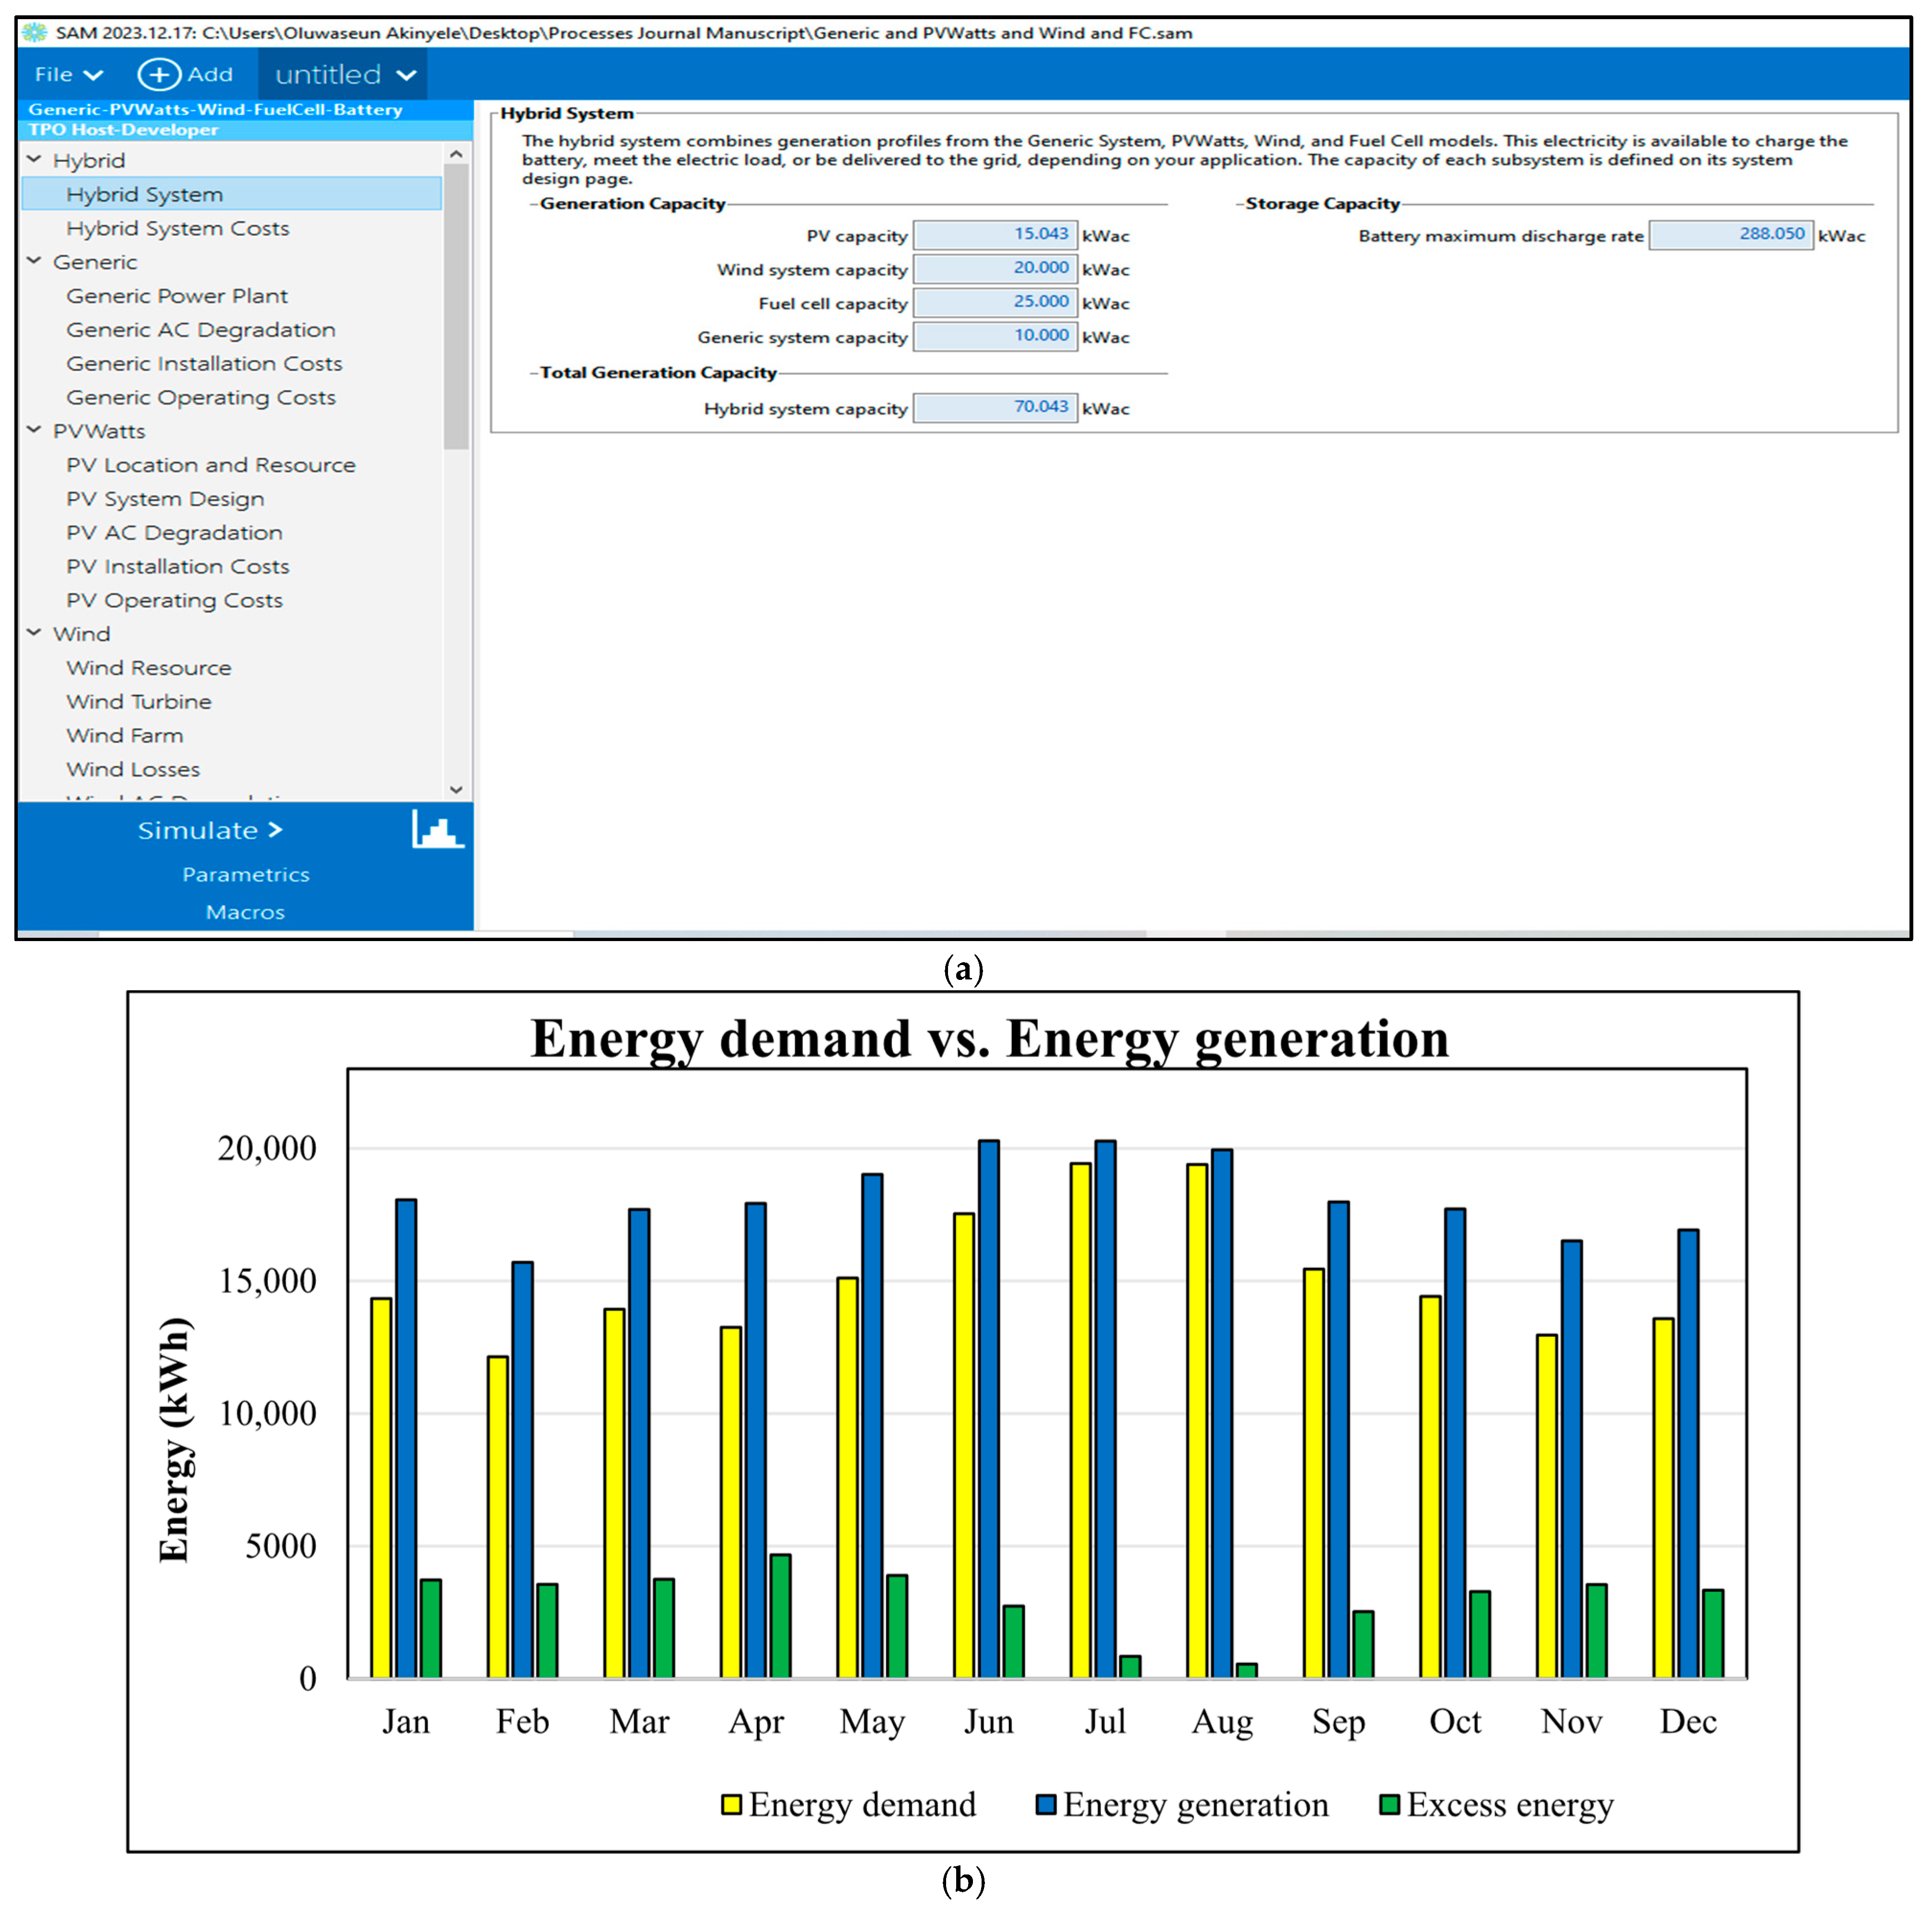
The microgrid’s energy mix is the contributions from the PV, wind, fuel cells, and generic plant energy systems, which are shown in Figure 9. The sizes of the technologies are 17.3, 20, 25, and 10 kW, respectively, making a total capacity of 72.3 kW. However, with the assumption of system losses of 14.08% (see Figure 10) for the PV system, the output of the actual capacity of the PV power generator is 15.04 kW, which makes the total capacity 70.04 kW, as shown in Figure 11a. The 20 kW WT implies that two units of 10 kW WT are arranged in a single row of the layout. The size of the battery for this system is 1097 kWh, and five strings of 104 kWh at 600 V battery pack are assumed for the system arrangement.
The fraction of the solar, wind, fuel cell, and the generic plant resources in the energy mix is 16.99, 23.95, 22.49, and 36.55%, respectively, with the corresponding energy production of 37,058.03, 52,235.45, 49,049.57, and 79,716 kWh. The minimum and the maximum energy delivered by these systems are 1916.51 and 4159.31 kW for December and May; 2493.56 and 5621.5 kW for August and April; 1962.94 and 7186.4 kW for April and August; and 6115.2 and 6770.4 kW with alternating monthly patterns, respectively. The generic plant in this case is assumed to be a generating plant, which may be fueled by biofuels such as biogas, biodiesel, synthesis gas, etc.
The total energy produced by the energy technologies is 218,059.05 kWh/yr, which is more than the total energy demand of 181,552.09 kWh/yr by the commercial facility, as shown in Figure 11b. The electric load following the dispatch option is employed, which is why the energy produced by the microgrid (m-grd) closely follows the electric load demand in Figure 11b. The benefits of the m-grd system are simulated, promising a clean and climate-friendly energy supply for commercial application in the case of this study.

4.2. Sensitivity Analysis

4.2.1. Impact of Load Growth

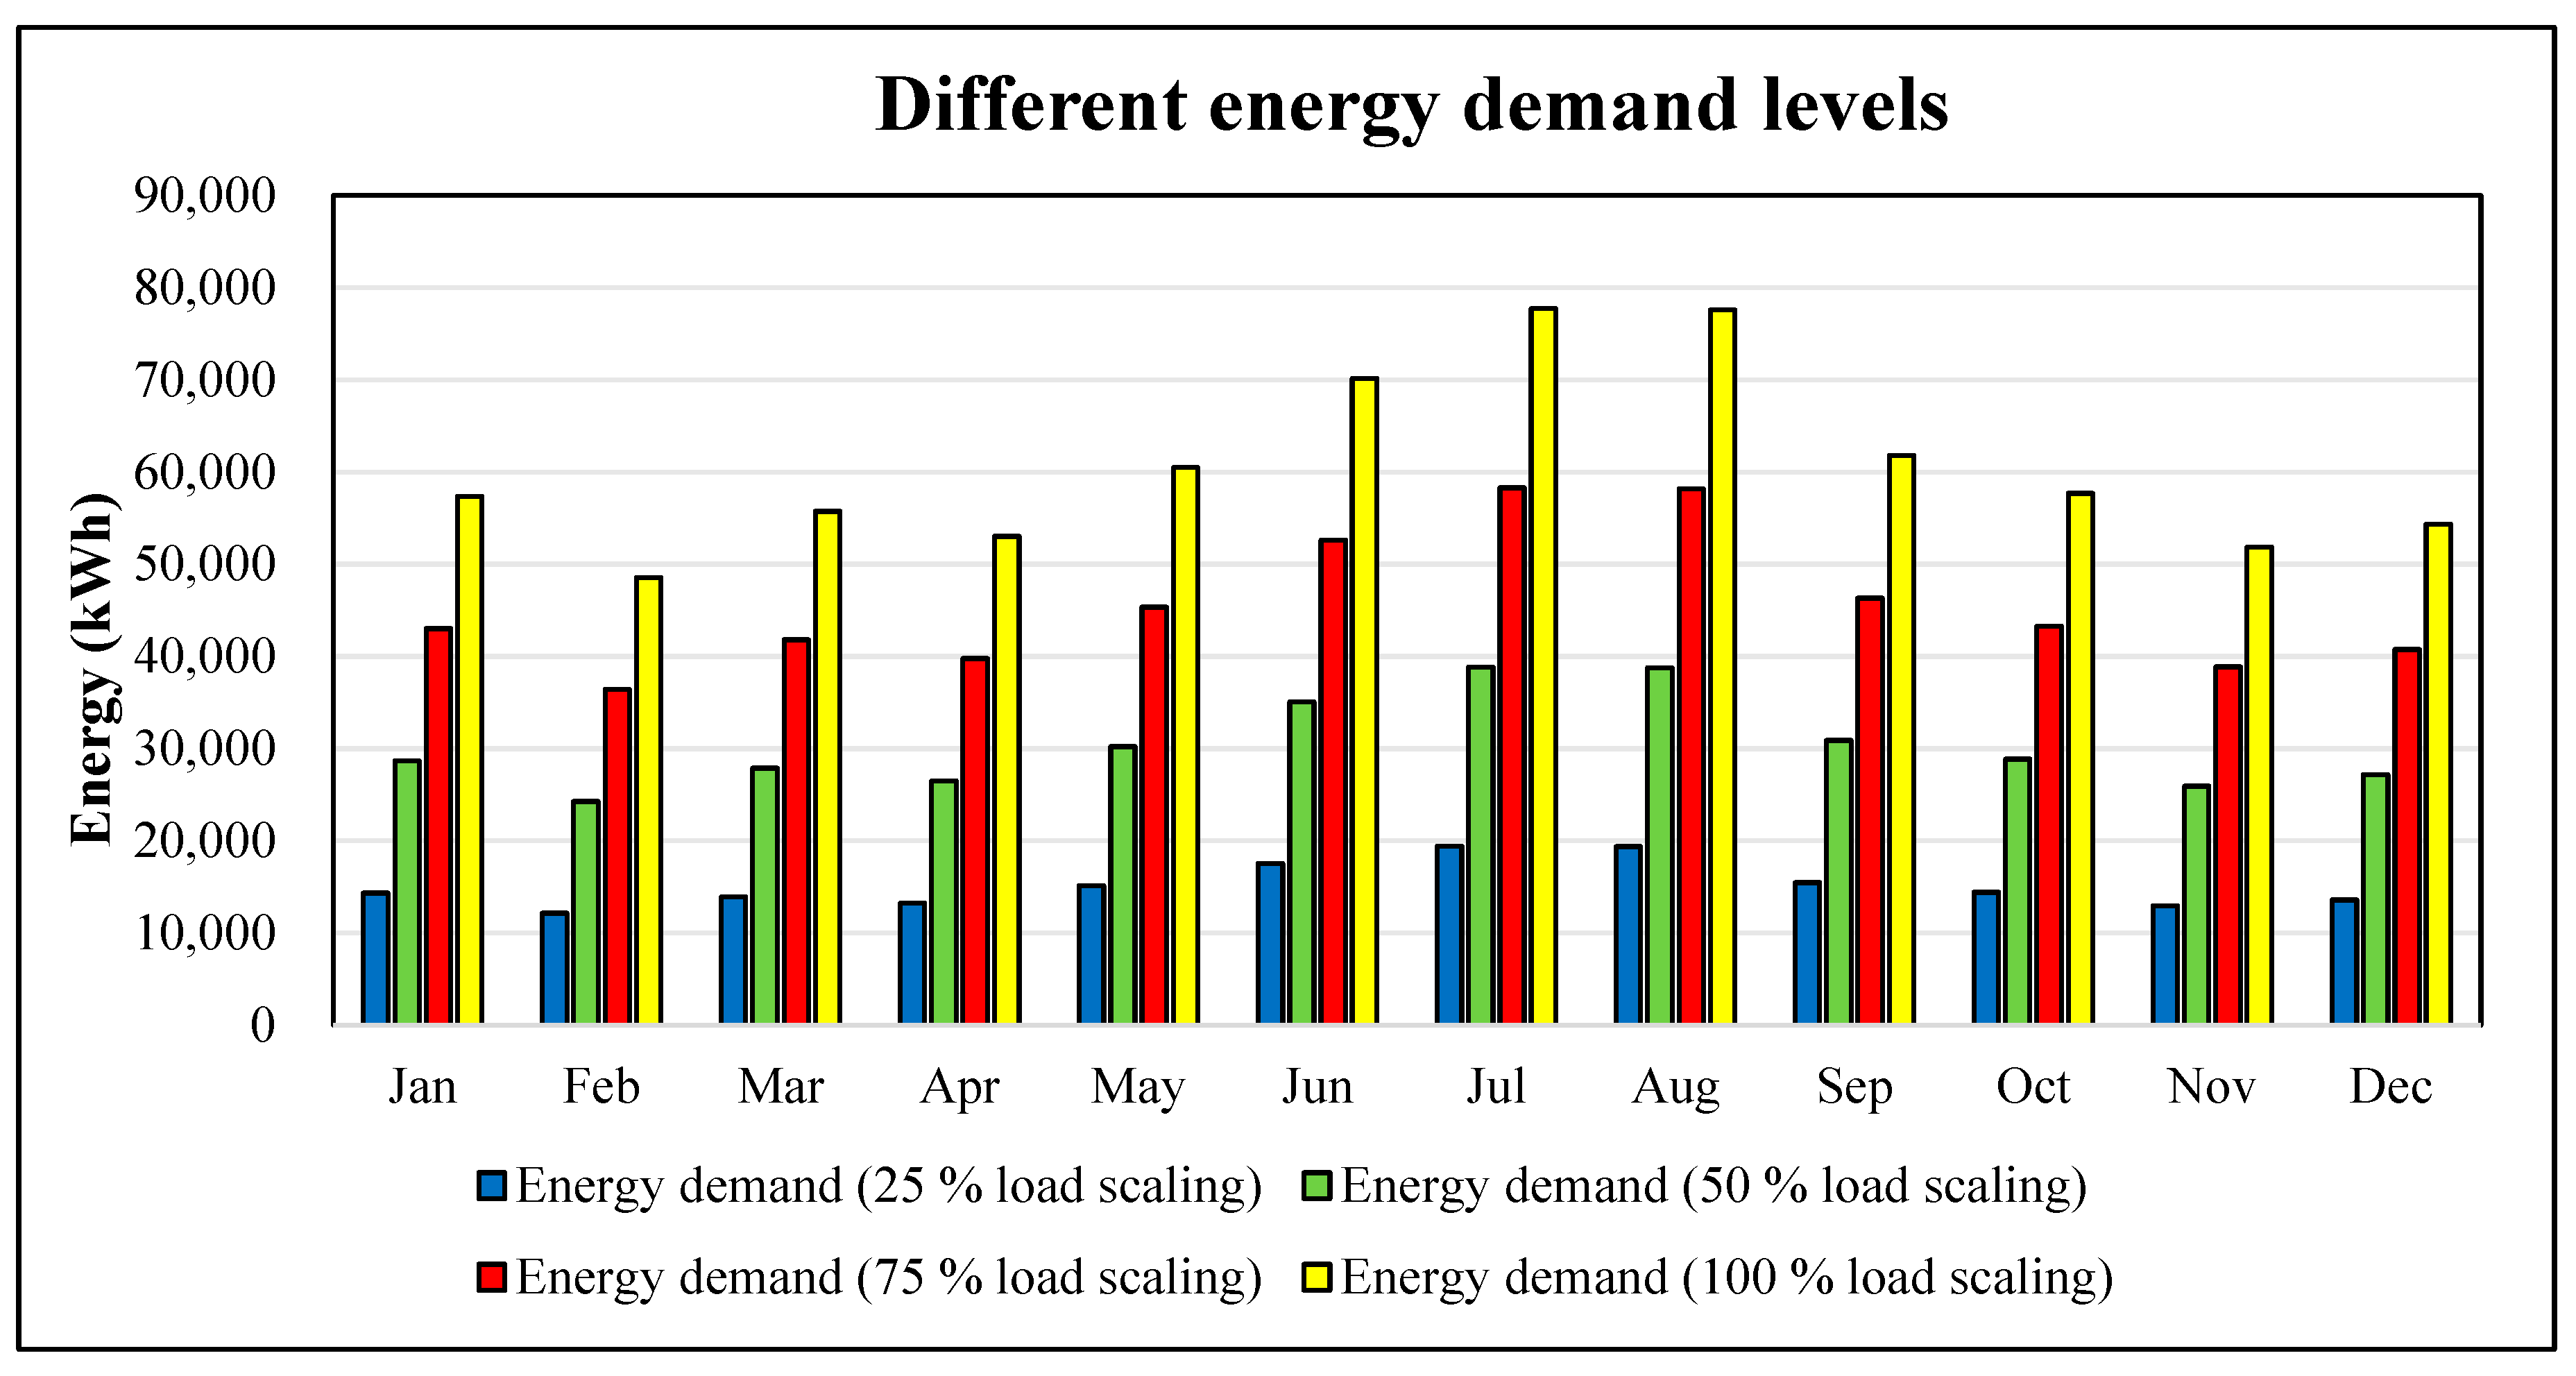
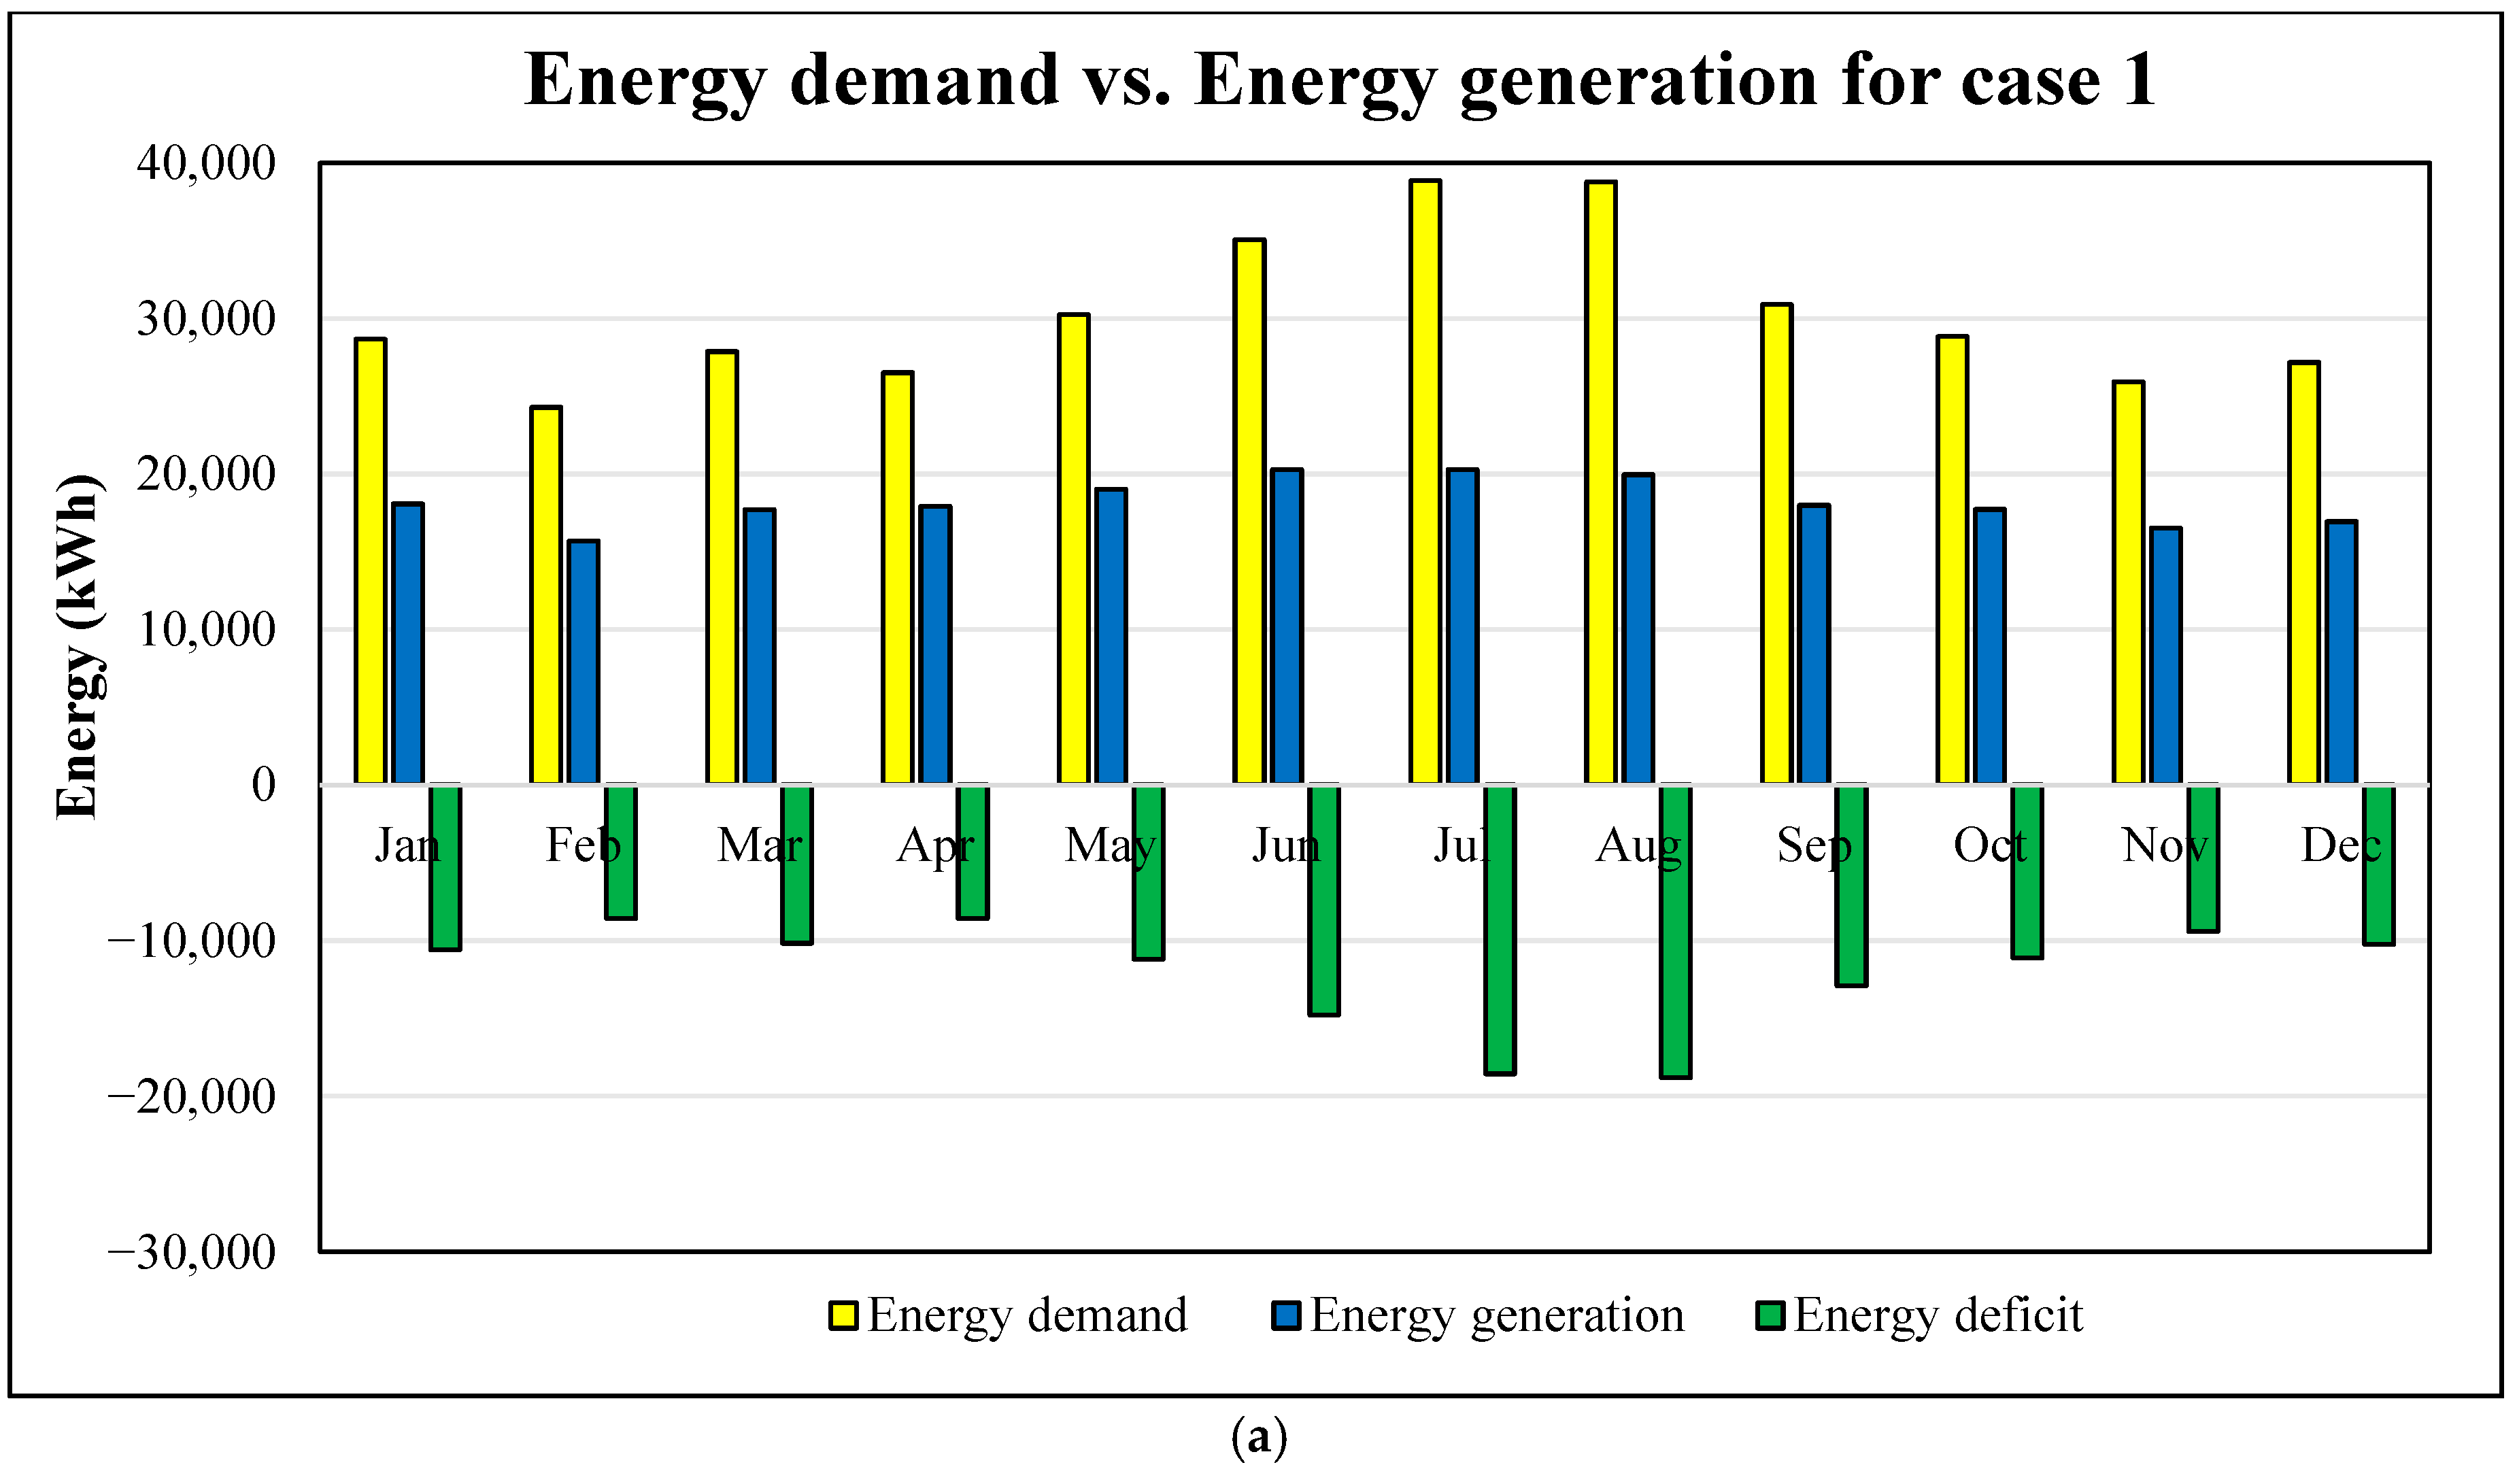
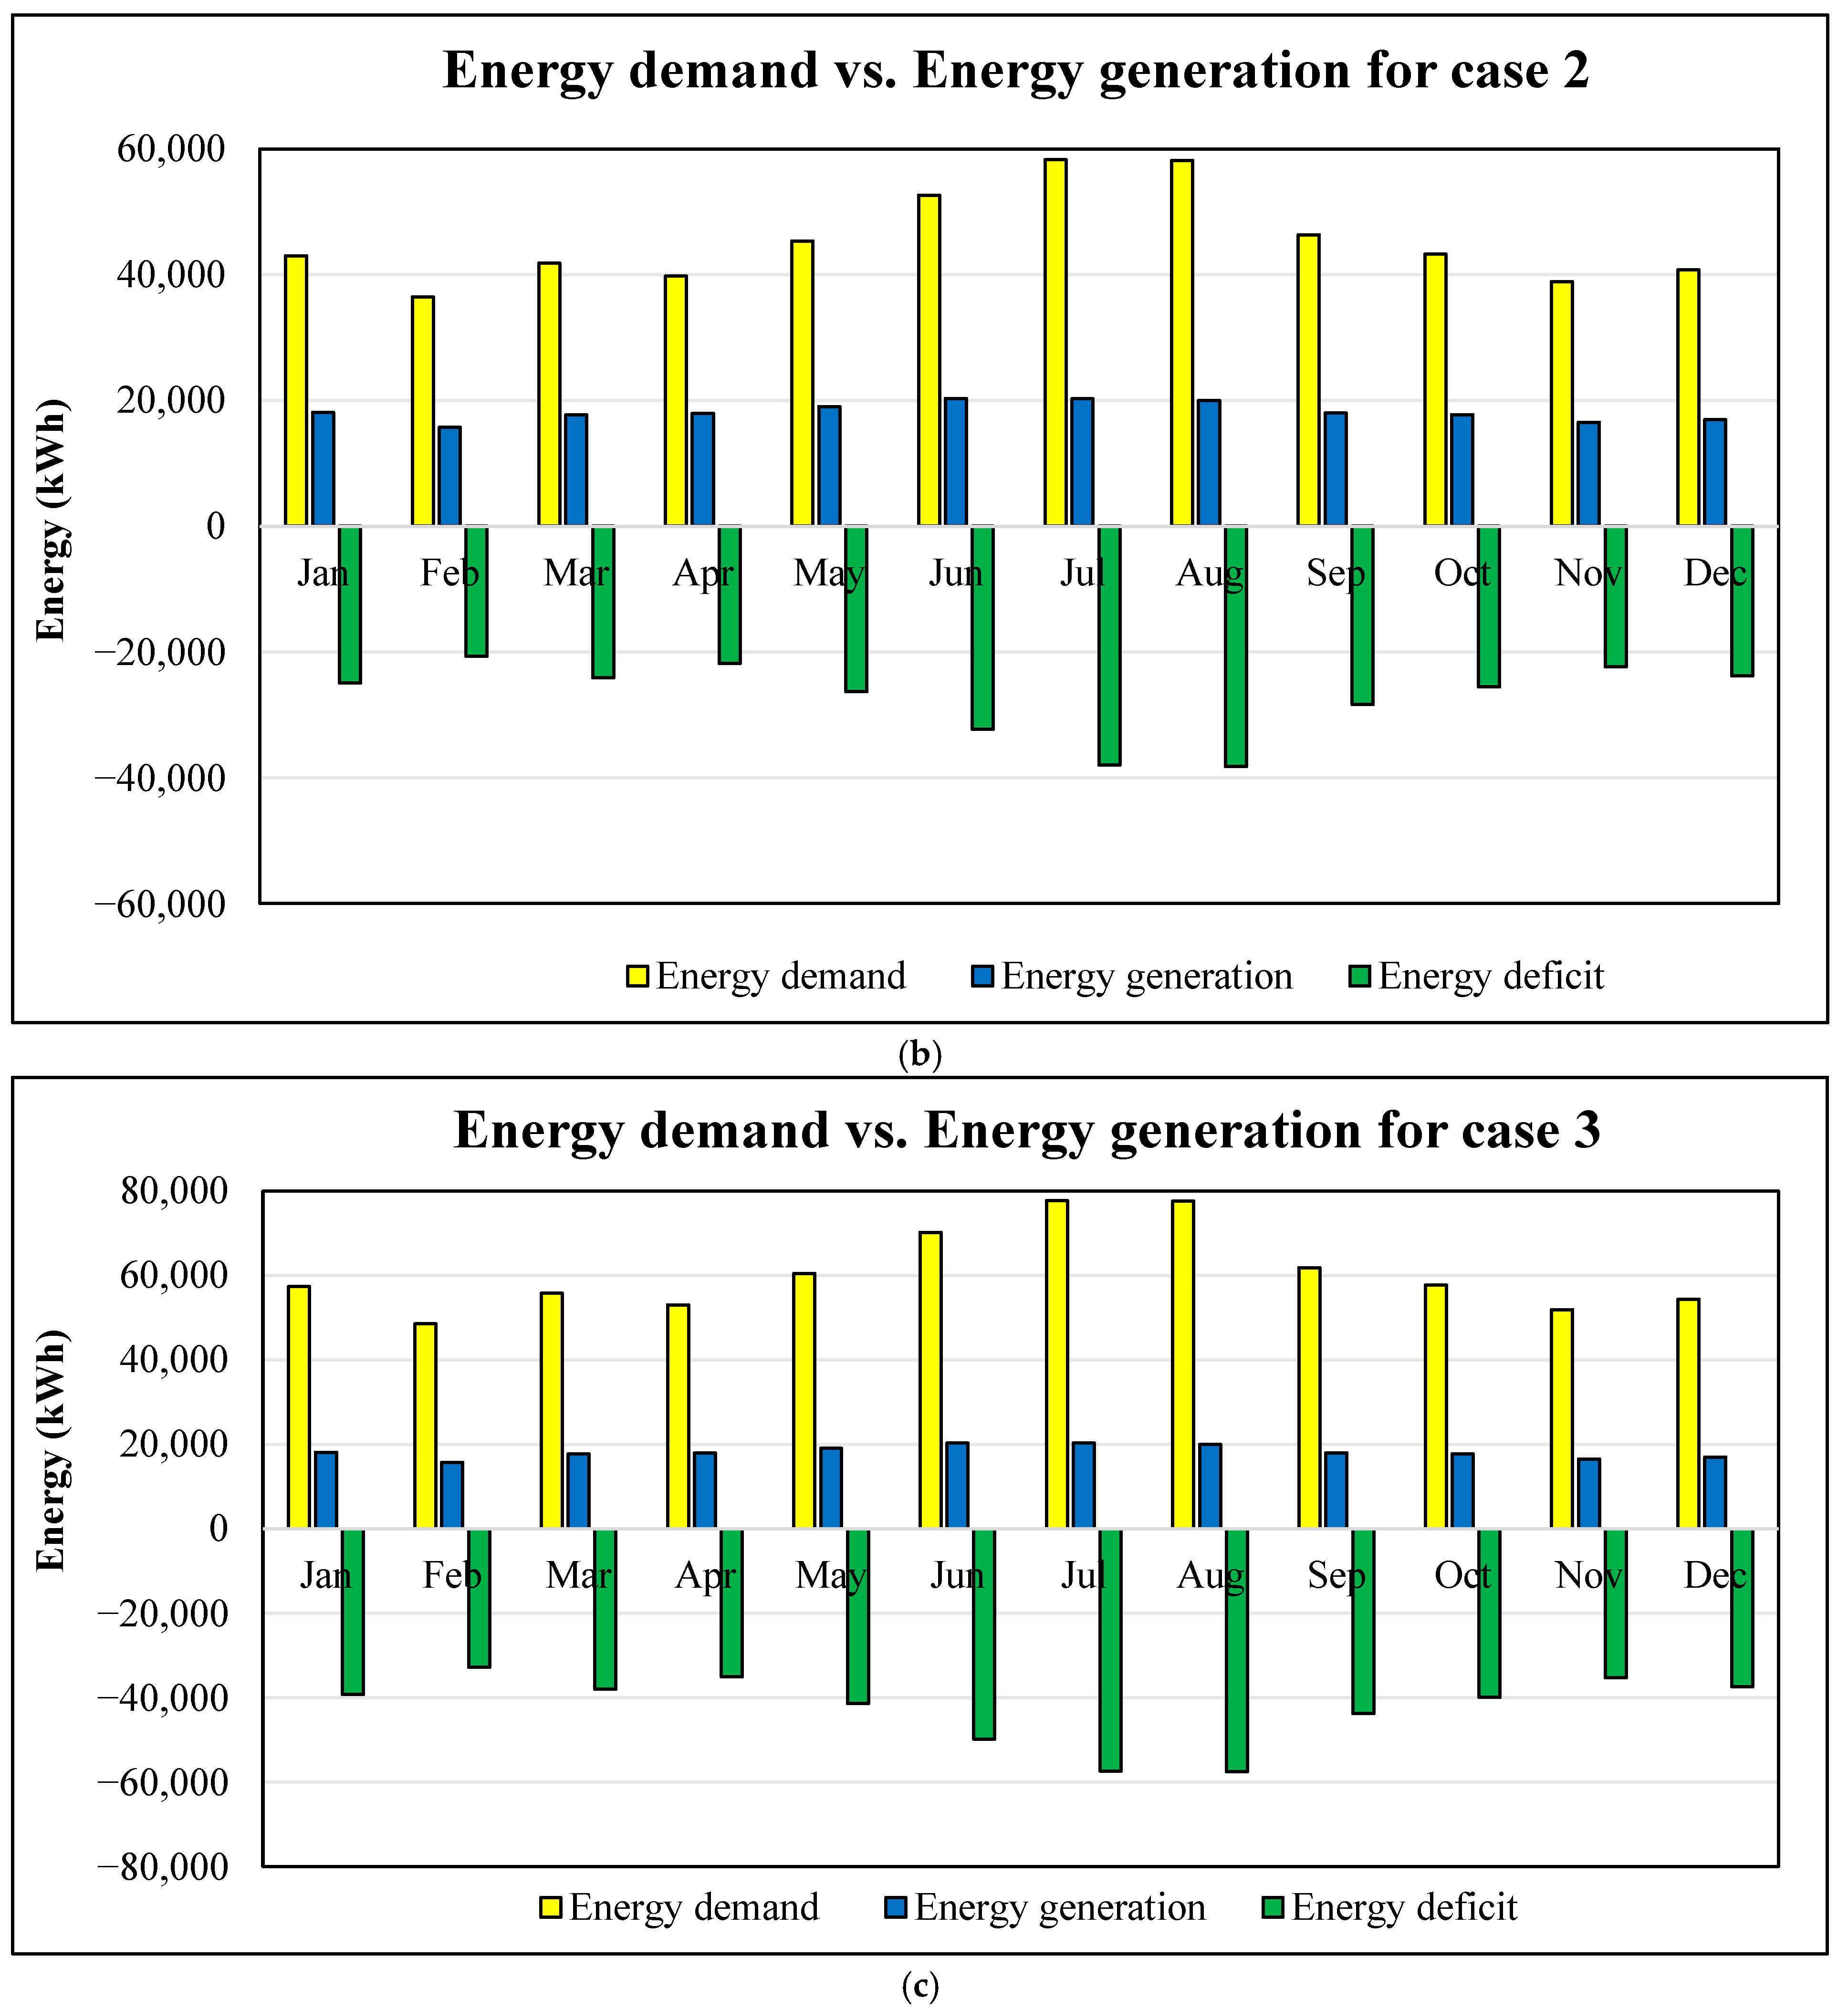
The initial load demand is obtained from SAM by applying a 25% electric load scaling factor. The impact of applying 50, 75, and 100% load scaling factors on the microgrid energy is examined. The different energy demand levels are presented in Figure 12, with the energy demand with a 25% load scaling factor serving as the initial case, while the other three loads represent case 1, case 2, and case 3, respectively. Figure 13a–c shows the energy demand and energy generation results for cases 1, 2, and 3, respectively. The profiles indicate that the initial microgrid capacity of 70.04 kW (where PV, wind, fuel cell, and generic plant contribute 15.04, 20, 25, and 20 kW, respectively) cannot satisfy the energy demand requirements. This results in an energy deficit as the load grows from the initial case to case 3, with the values of energy deficits (the demand not met) obtained for cases 1, 2, and 3 being 145,045, 326,597, and 508,149 kWh/yr.
The severity of these values is that the energy met by the initial microgrid capacity is only 60, 40, and 30%, respectively, representing the values of system availability (SaV) for cases 1, 2, and 3. The loss of energy supply probability (LOESP) of cases 1, 2, and 3 is therefore 40, 60, and 70%, revealing that the customer minutes lost (outage) increases as the load demand increases.

4.2.2. New Microgrid Capacities and Performance

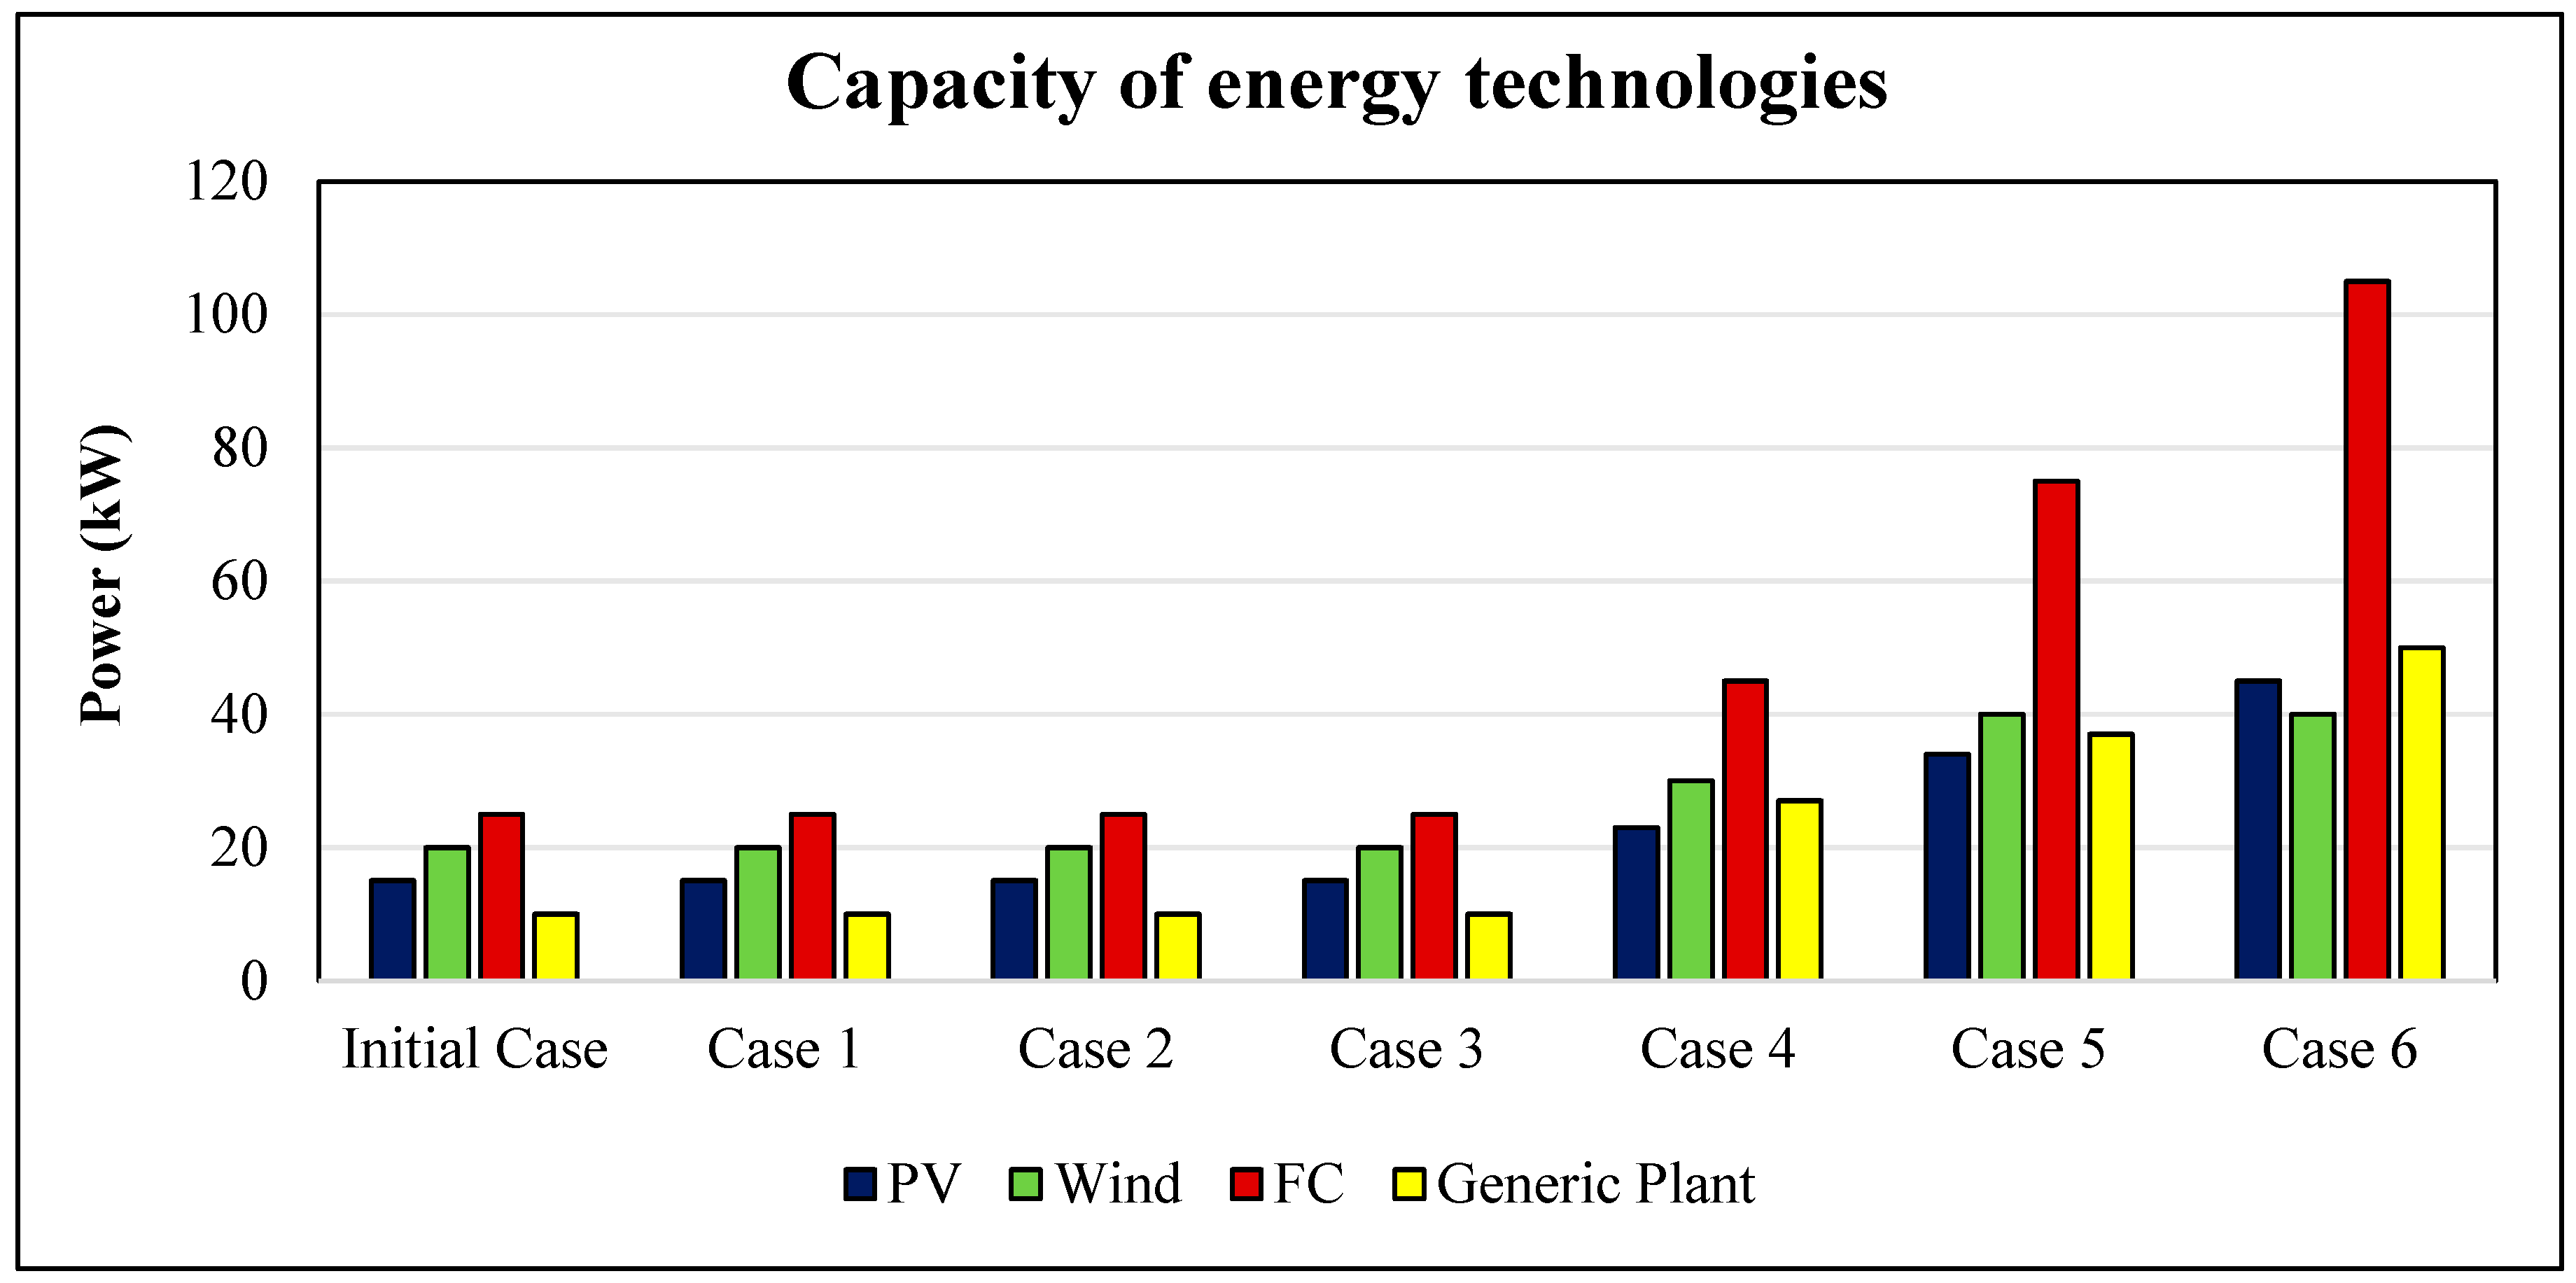
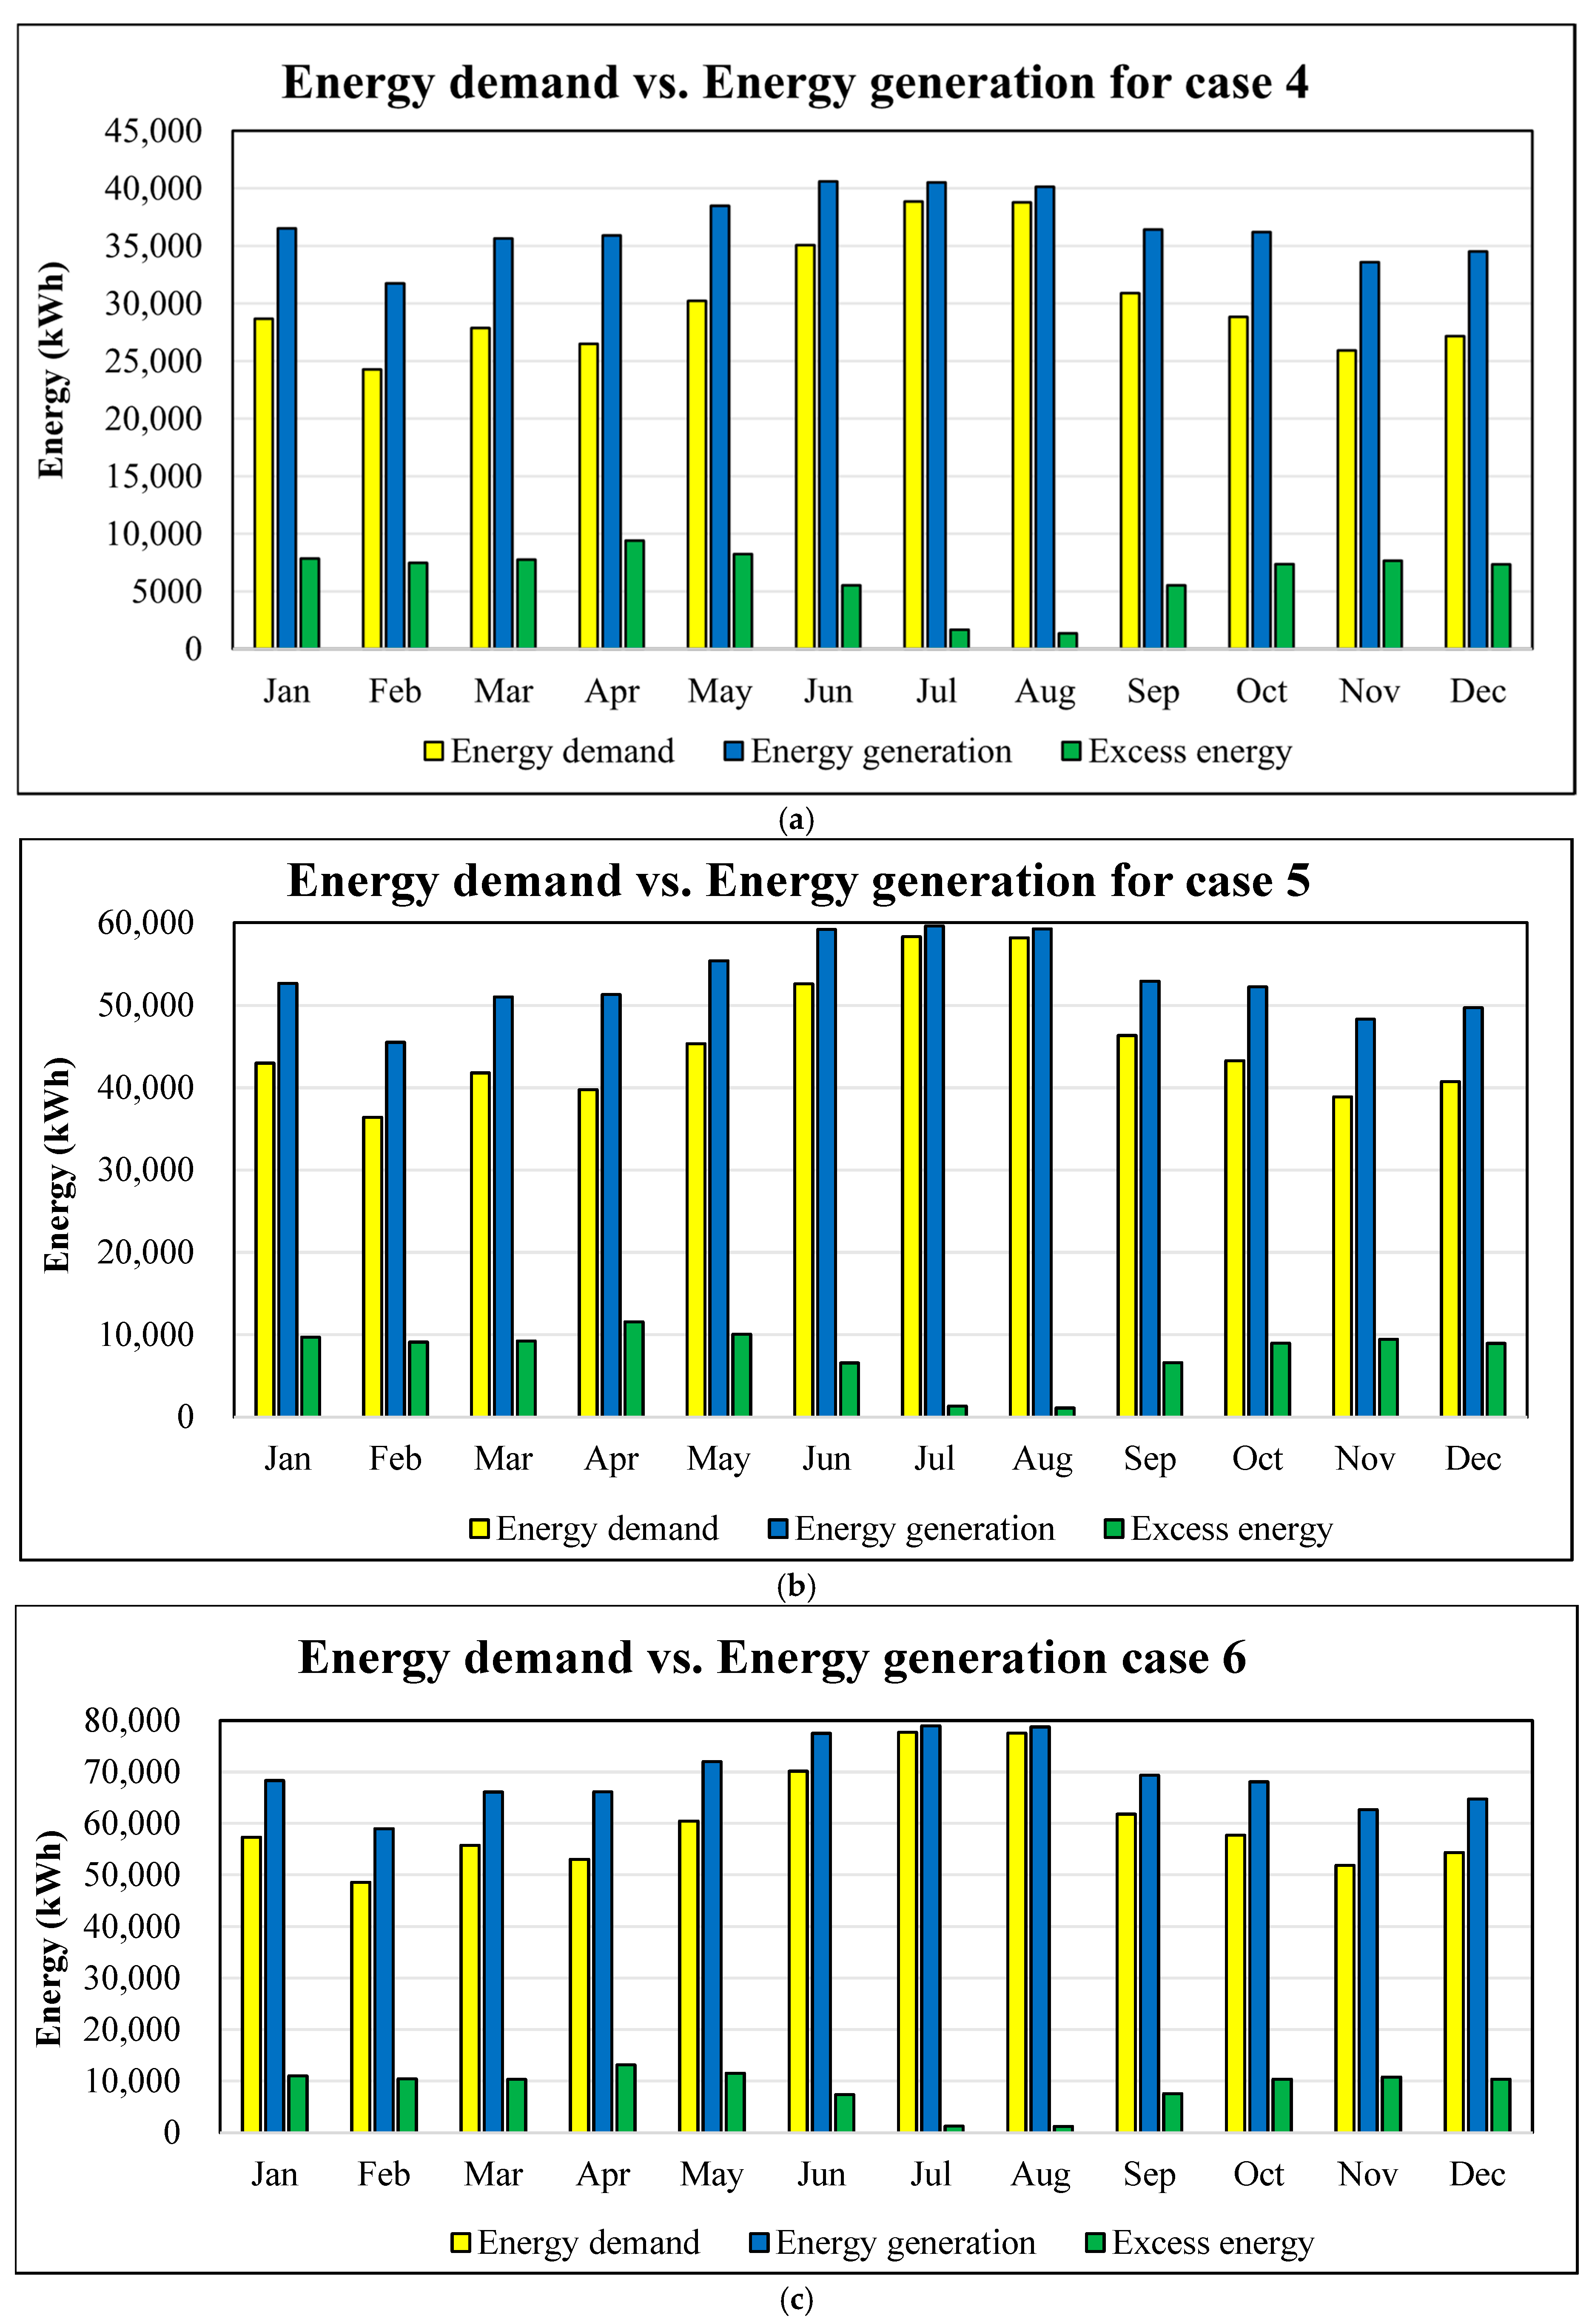
Figure 14 shows the results of different microgrid capacities required to address the issue of customer minutes lost (i.e., LOESP) reported for cases 1, 2, and 3. Cases 4, 5, and 6 stand for new microgrid designs to address the reliability problem in cases 1, 2, and 3. The sizes of the PV, wind, fuel cell, and generic plant energy systems for cases 4, 5, and 6 are 23, 30, 45, and 27 kWac; 34, 40, 75, and 37 kWac; and 45, 40, 105, and 50 kWac, respectively, leading to microgrid capacities of 125, 186, and 240 kWac. Figure 15a–c reports the energy demand and energy generation profiles for cases 4, 5, and 6. The results demonstrate that the new microgrid capacities satisfy the increased energy demand. The difference in energy between the demand and generation is the excess energy, which is used to charge battery storage systems. The total energy generated for cases 4, 5, and 6 is 440,317, 637, 232, and 831,652 kWh/yr, respectively, which can adequately service the corresponding load demand requirements of 363,104, 544,657, and 726,208 kWh/yr.
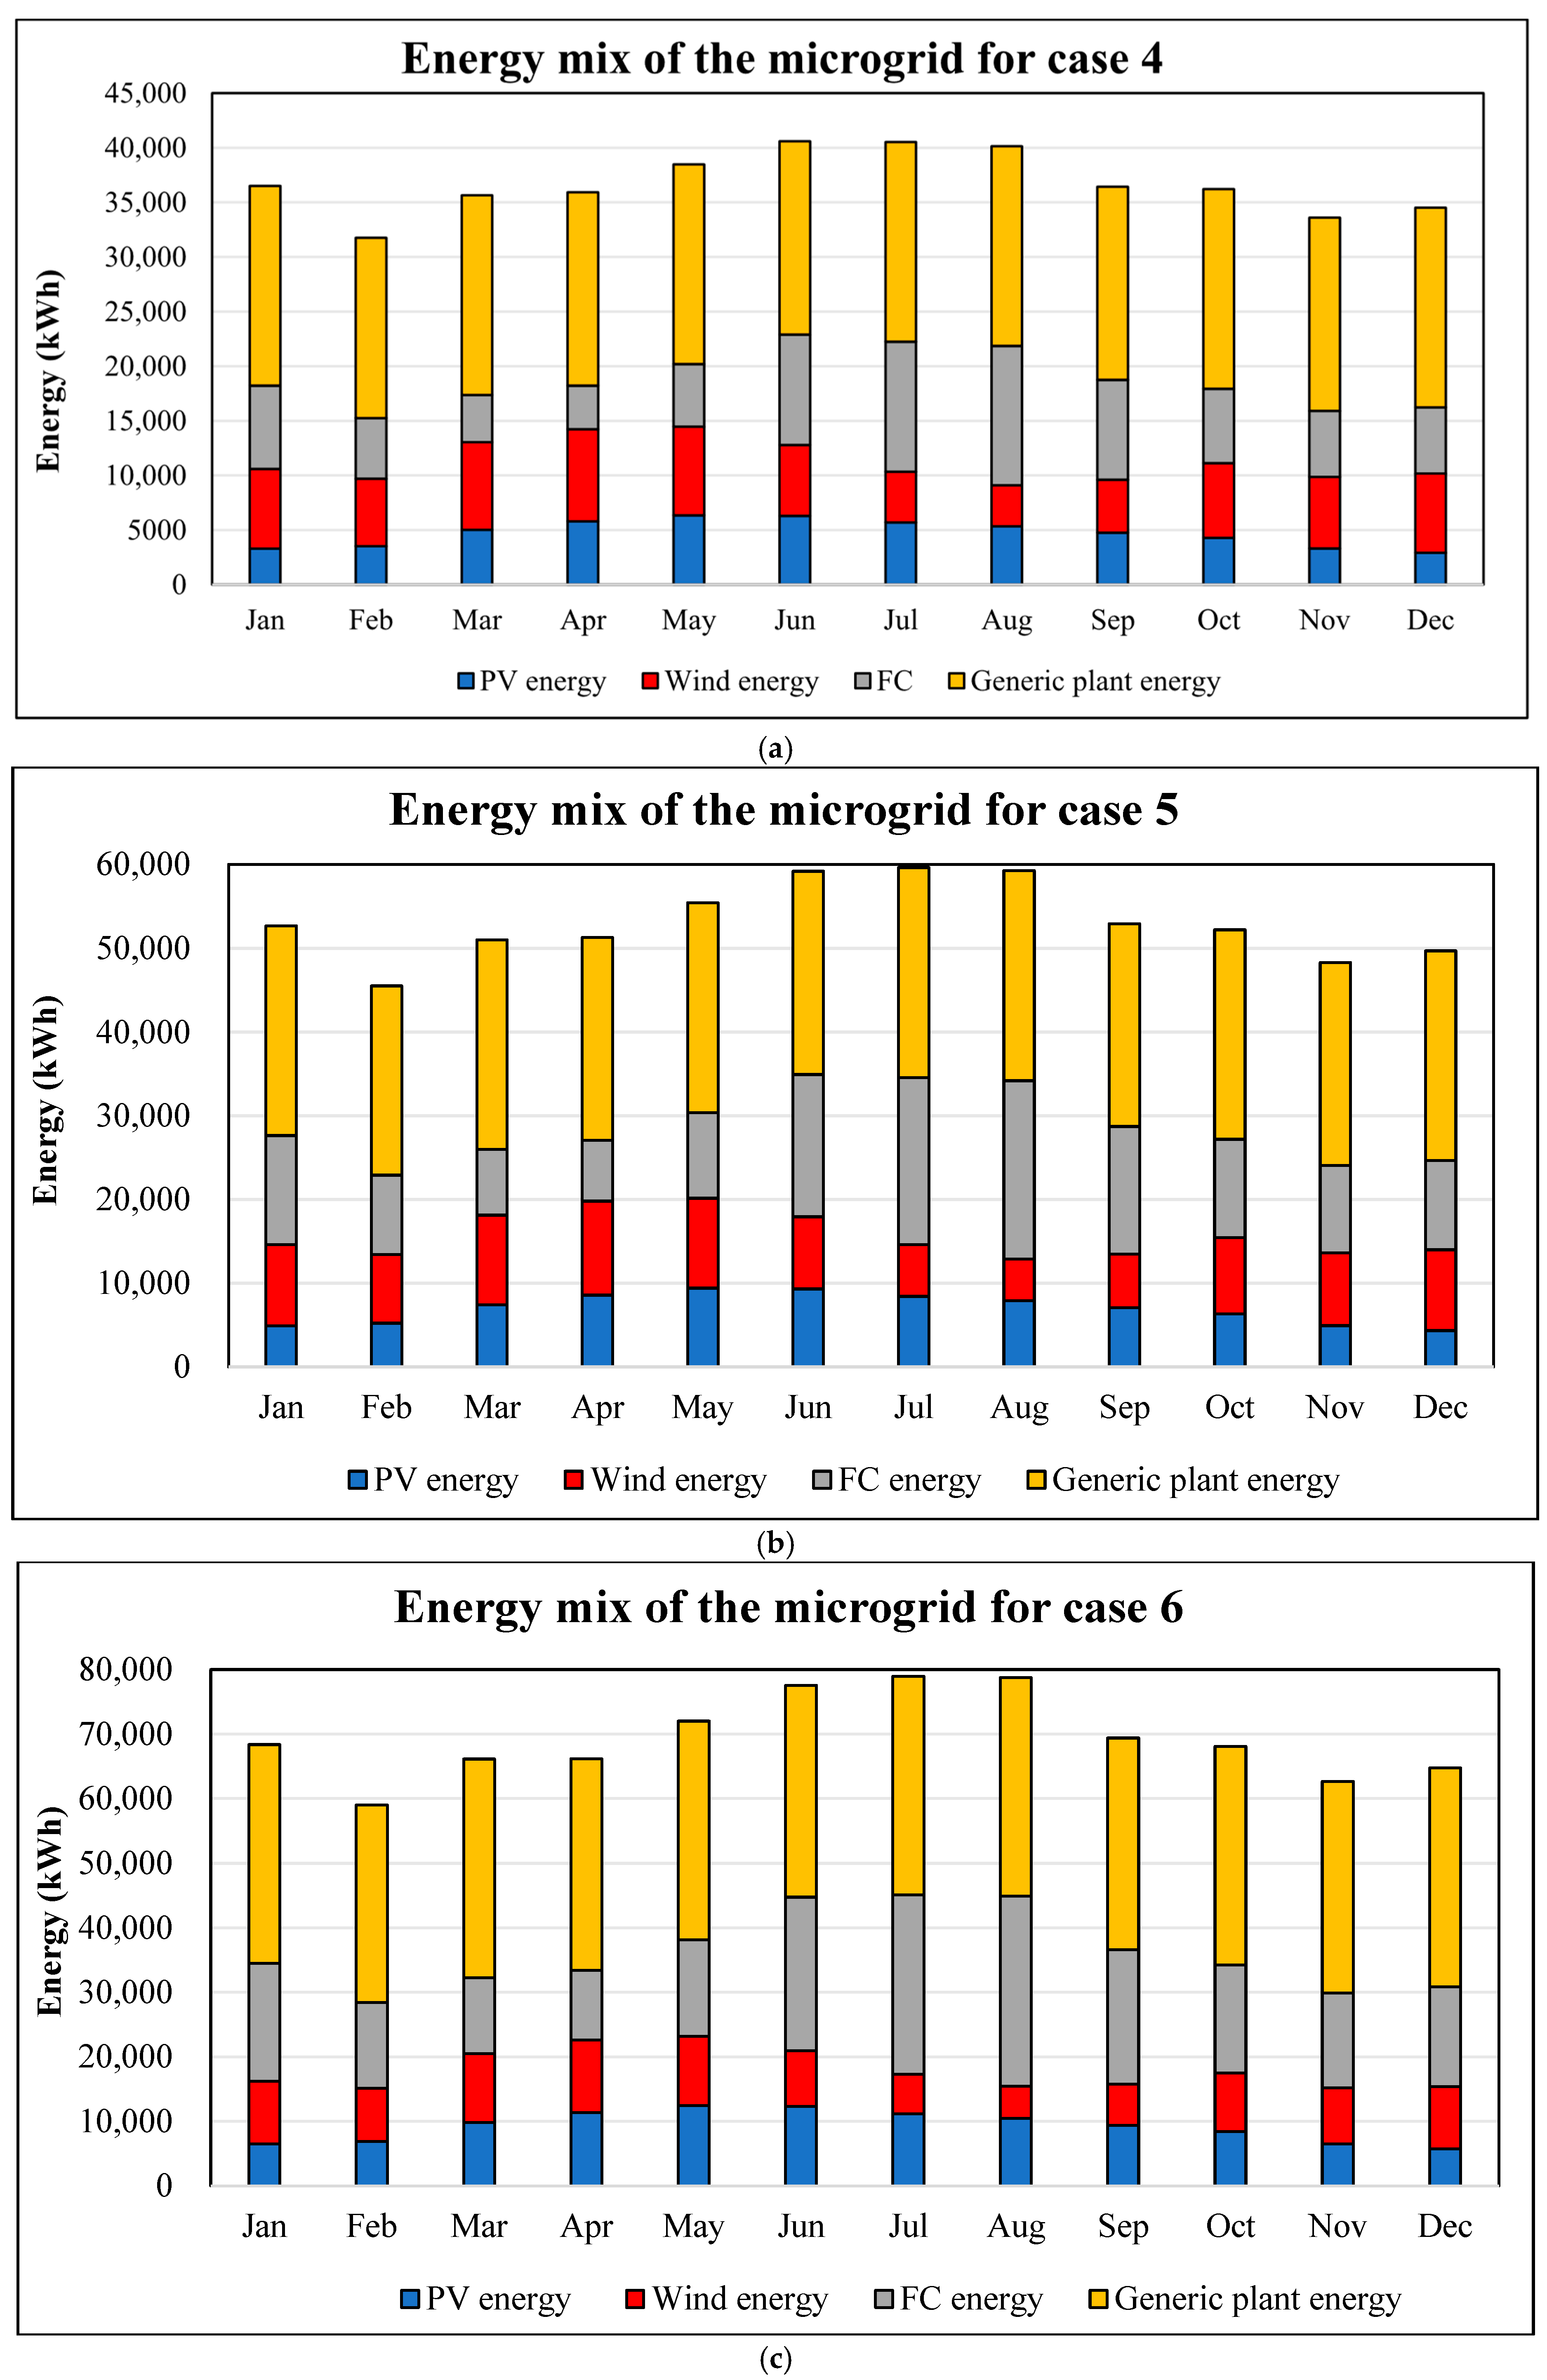
The energy produced by the PV, wind, fuel cell, and generic plant for cases 3, 4 and 5 are 56,653, 78,339, 90,092, and 215,233 kWh/yr; 83,743, 104,291, 154,249, and 294,949 kWh/yr; and 110,832, 104,291, 217,950, and 398,580 kWh/yr, respectively, as shown in Figure 16a–c. The corresponding contributions of the energy-generating sources for case 3, case 4, and case 5 are 12.87, 17.79, 20.46, and 48.88%; 13.14, 16.37, 24.21, and 46.29%; and 13.33, 12.54, 26.21, and 47.93%. The sizes of the battery banks for cases 4, 5, and 6 are 2194, 3291, and 4388 kWh. The arrangement of these battery systems is a multiplier of the arrangement presented in the initial case, i.e., the initial case multiplied by 2, 3, and 4. The generic power plant is essentially a fuel generator, which behaves in such a manner as to be responsive to load growth. The LOESP and SaV values obtained for each of the new cases—cases 4, 5, and 6—are 0 and 100%, demonstrating high system reliability.

4.2.3. Fuel Consumption by FC and Generic Power Plant

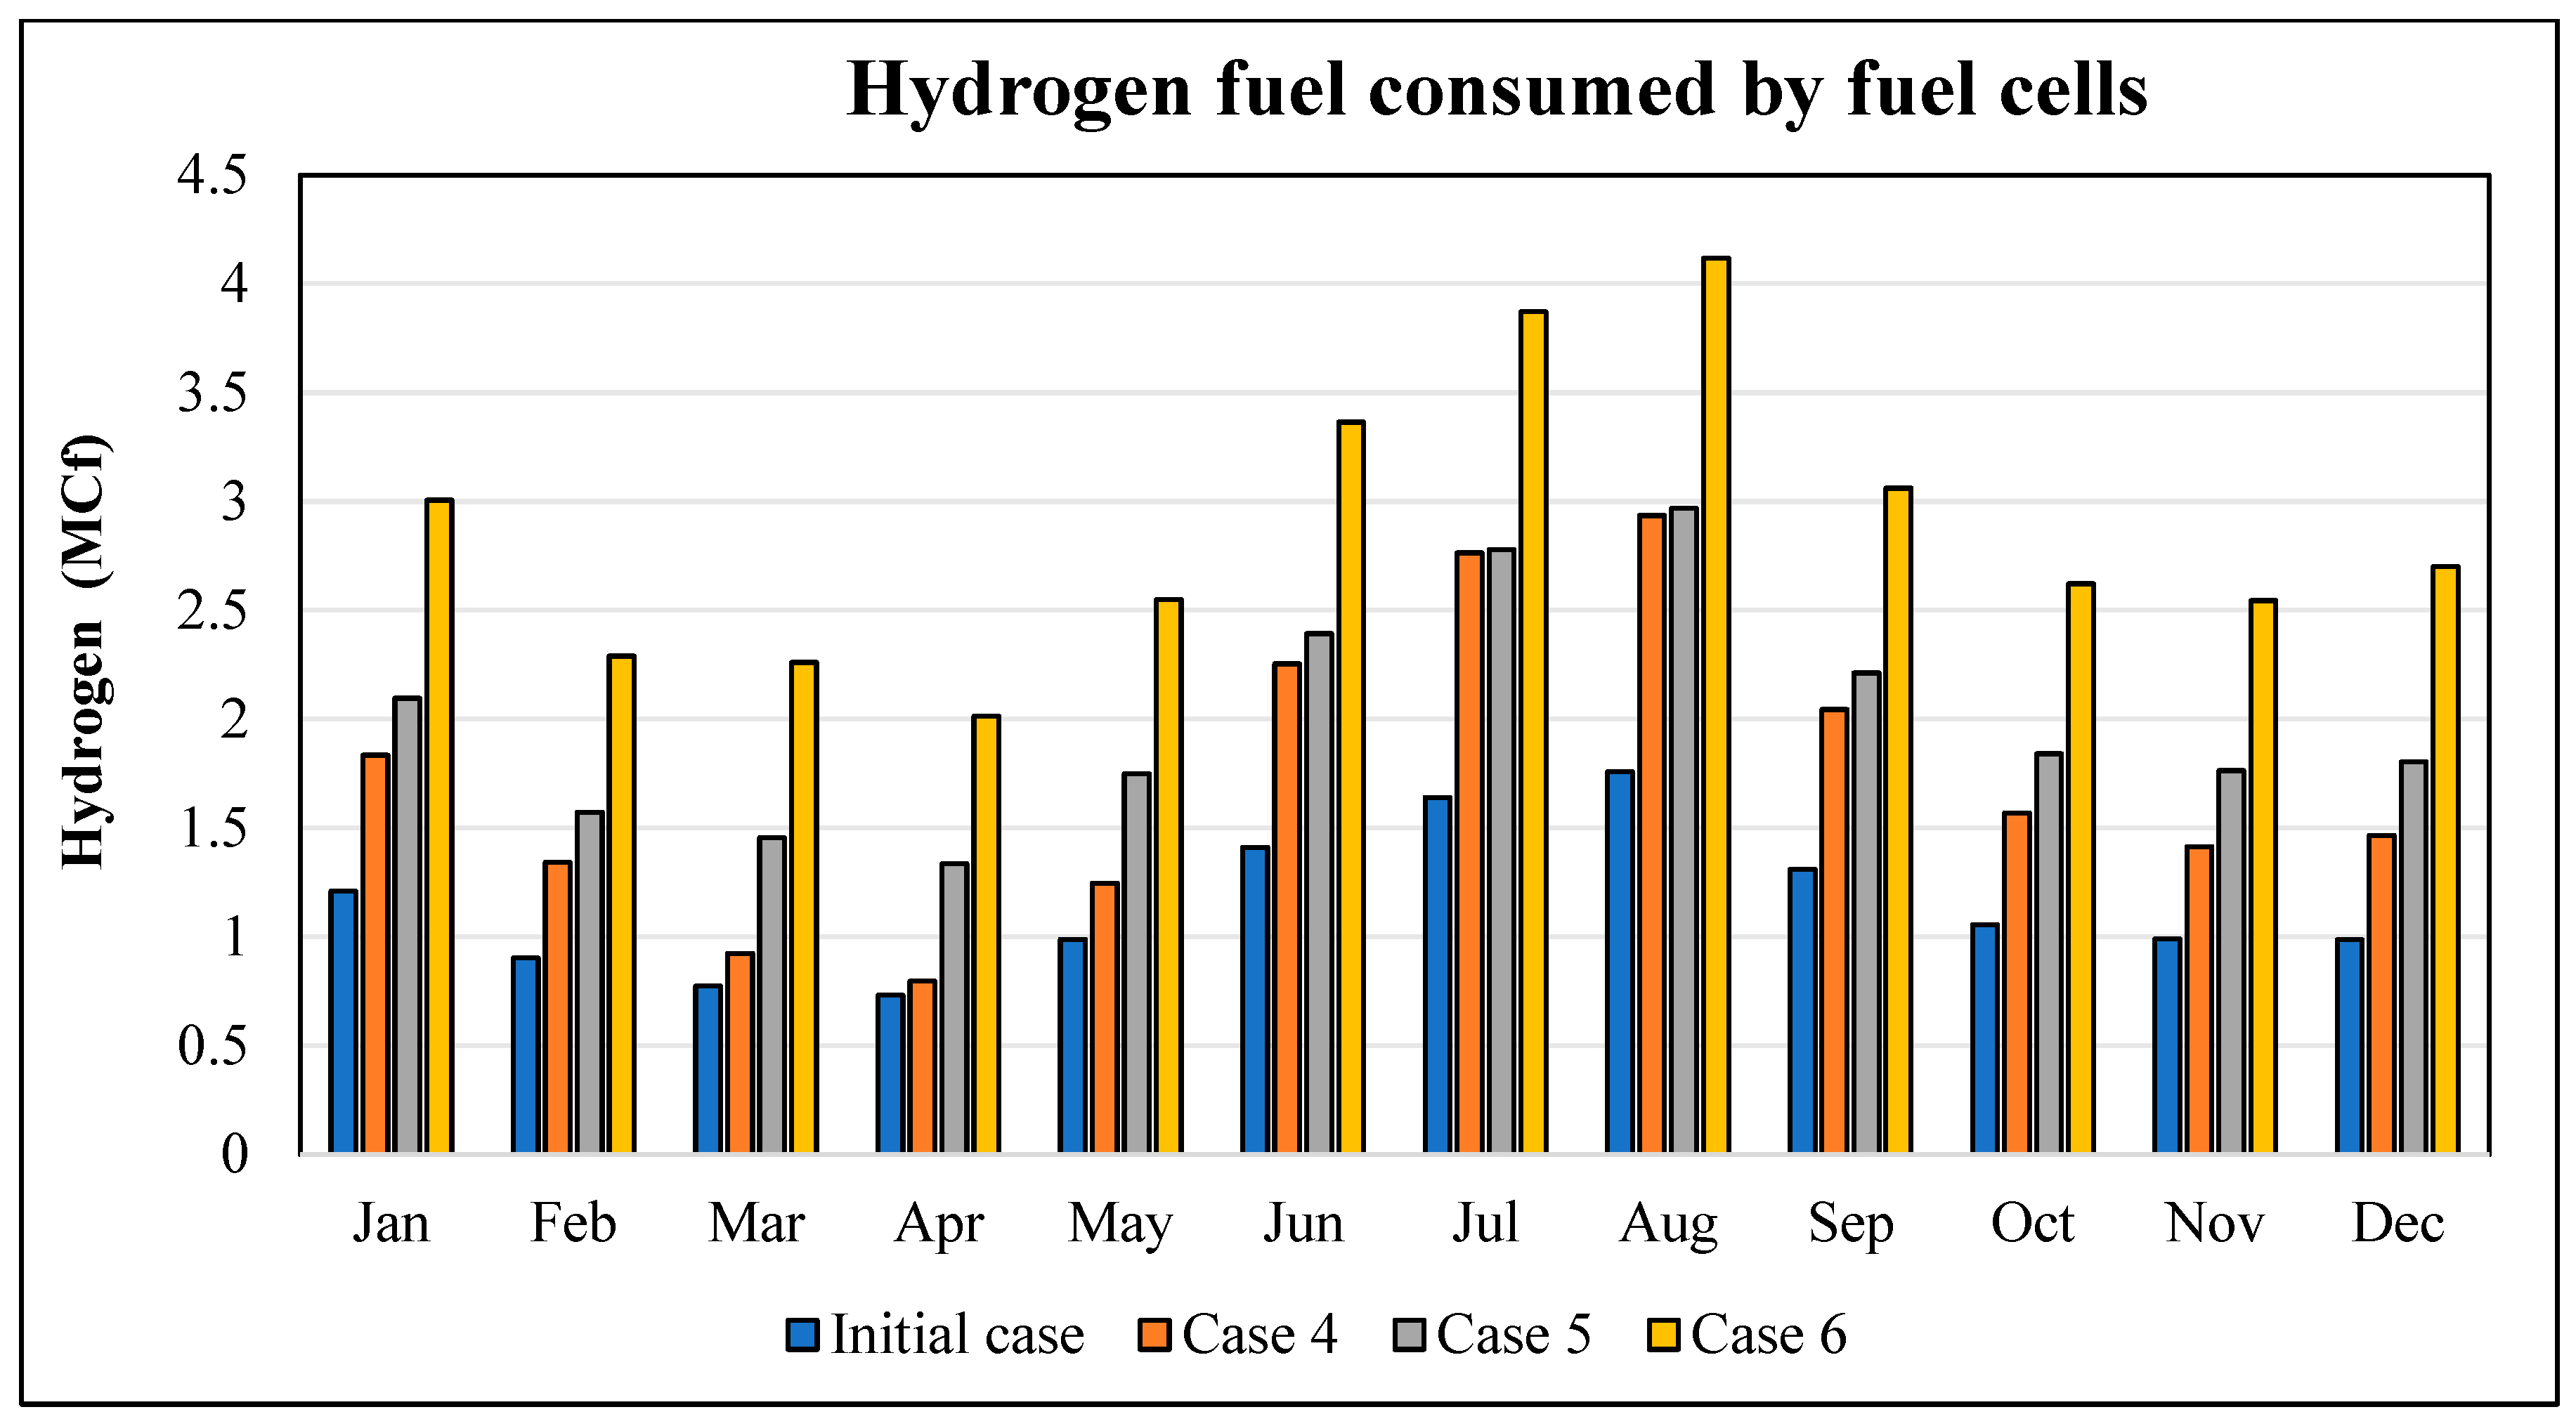
The total H2 fuel consumed for the months is presented in Figure 17 in MCf—i.e., one thousand cubic feet (1000 ft3). The values have been obtained based on the LHV of 51591 British thermal units per ft3 in SAM for the hydrogen fuel resource for fuel cell operation. The maximum and minimum values of H2 consumed for the initial case, case 4, case 5, and case 6 are 1.758 and 0.731 MCf; 2.934 and 0.797 MCf; 2.969 and 1.336 MCf; and 4.117 and 2.013 MCf, respectively, all for the corresponding months of August and April. These values translate to 1758 and 731 ft3; 2934 and 797 ft3; 2969 and 1336 ft3; and 4117 and 2013 ft3 of H2 fuel, respectively, all for the corresponding months of August and April. The values are translated further to 49.79 and 20.71 m3; 83.09 and 22.56 m3; 84.07 and 37.82 m3; 116.57 and 56.99 m3; 49,790 and 20,705 kg or L; 83,086 and 22,556 kg or L; 84,073 and 37,825 kg or L; and 116,572 and 56,990 kg or L, respectively. The consumption of hydrogen increases from the initial case to case 6. This is because of the increase in the FC capacity as the load scaling factor increases from 25 to 100%. It can also be seen from Figure 17 that the H2 fuel consumption profile follows the users’ load demand profile. This is brought about by the load following the dispatch strategy of the FC system.
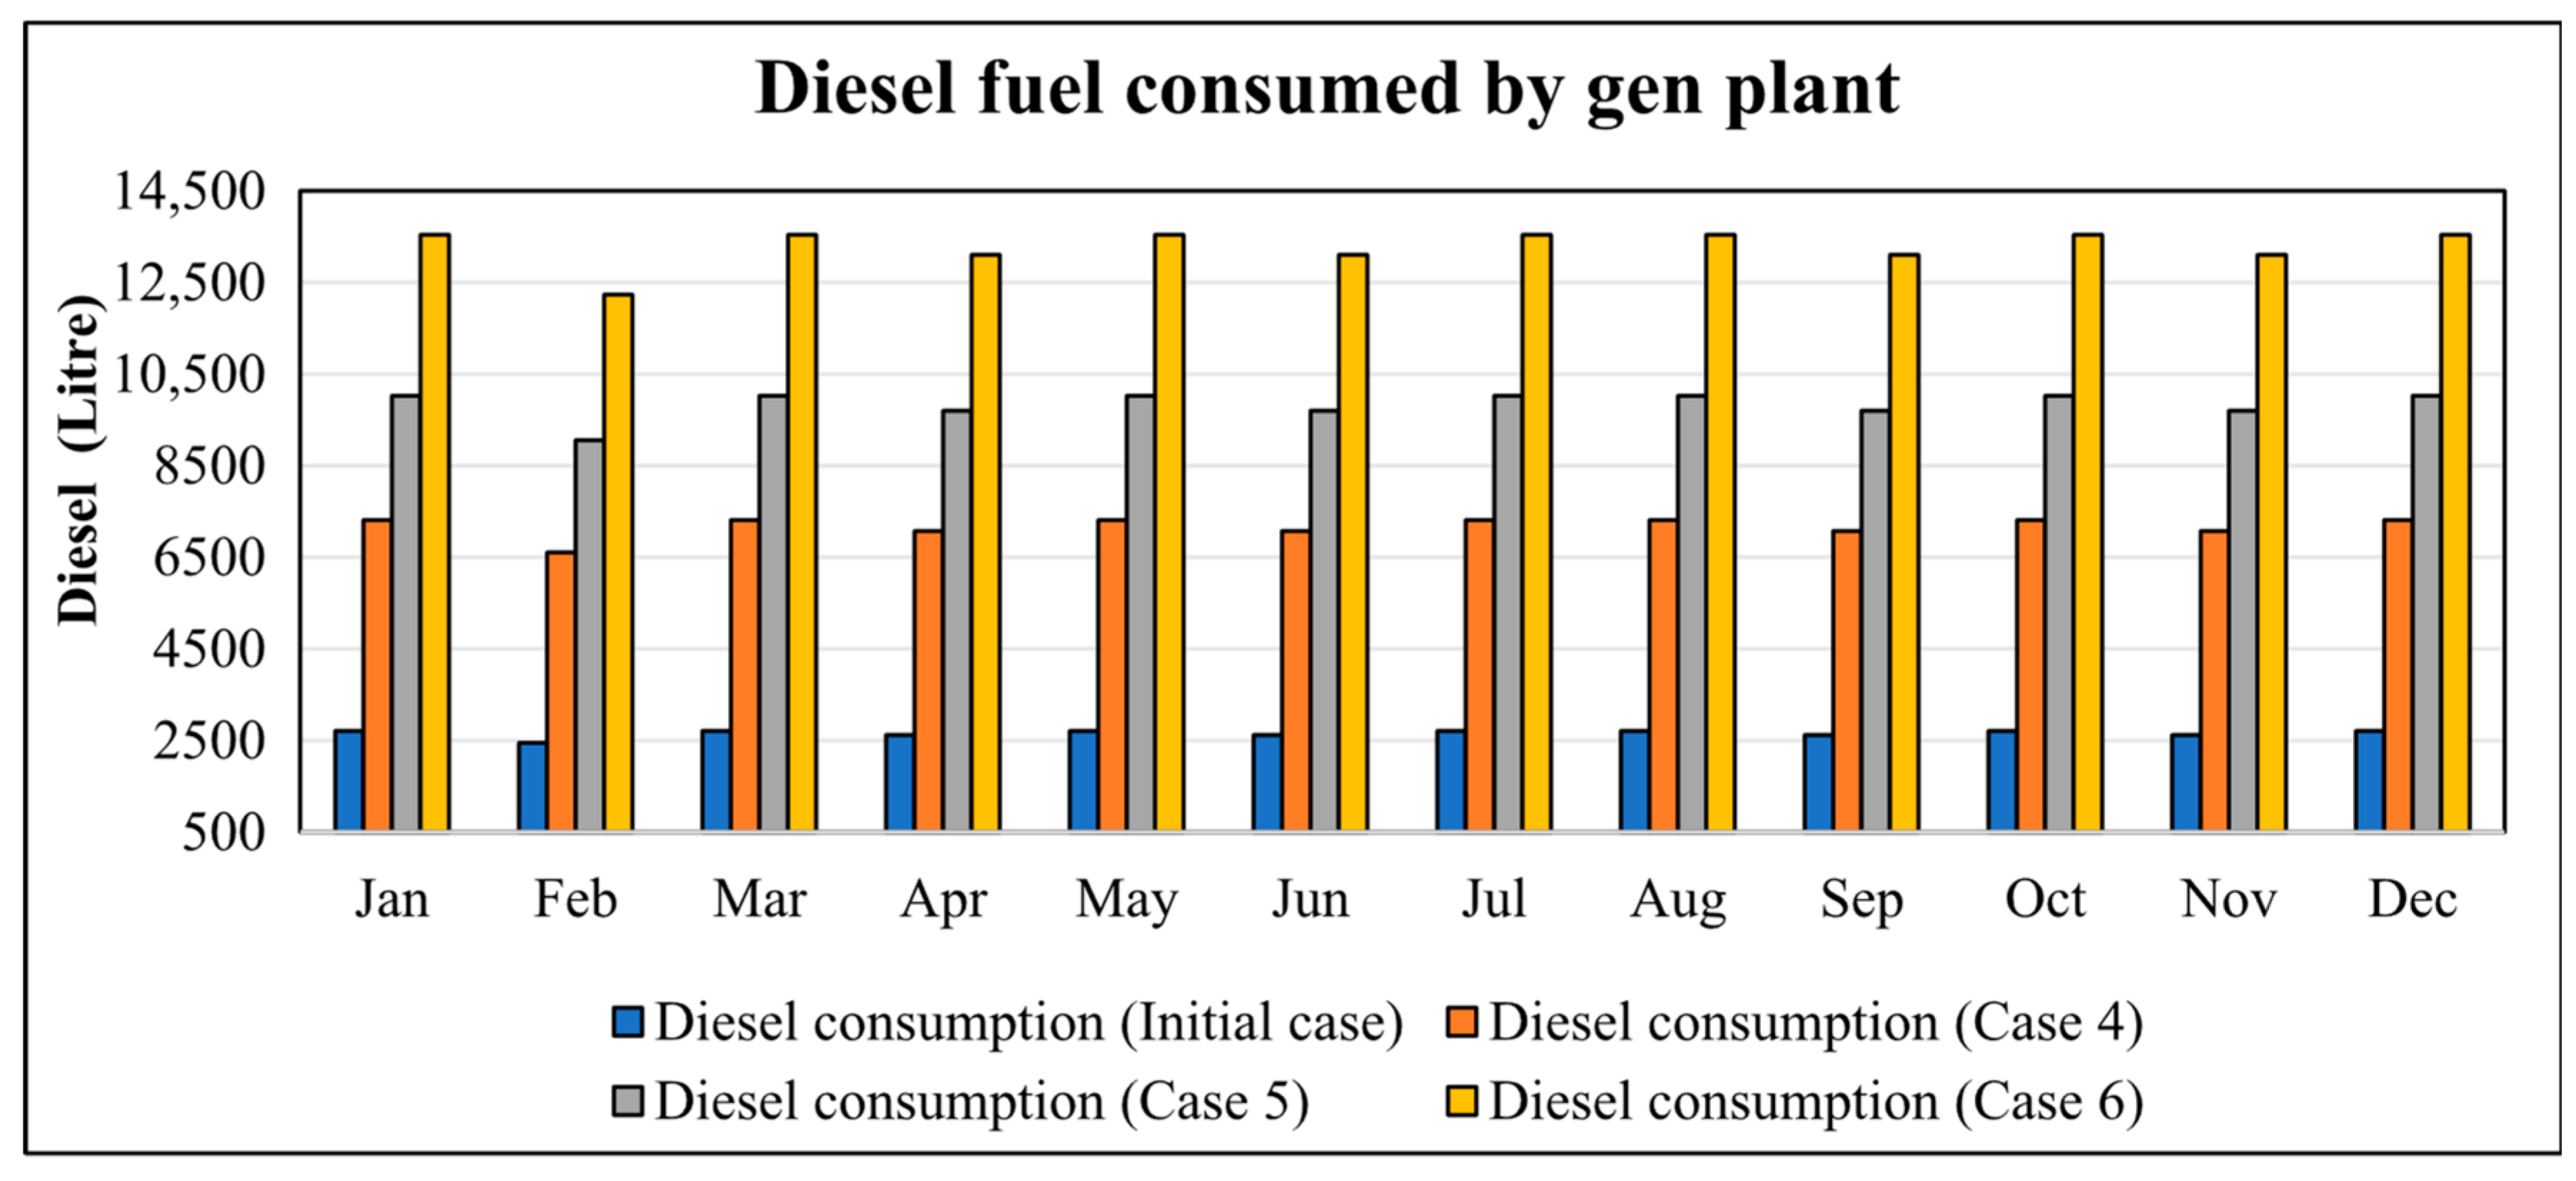
The generic plant is modeled as a thermal plant system regarded as a custom generation in SAM version 2025.4.16, which is run as a base case conventional energy system that may be compared with the renewable energy resource. The generic plant is assumed to be fueled by diesel resources. There is a general rule of thumb that diesel power consumes 0.4 L to generate a unit of kWh of electricity [108]. Different values are reported in the literature on this aspect; for instance, Paul et al. [109] report roughly 0.263 to 0.345 L of diesel per kWh of electricity generated, translating to 3.802 to 2.898 kWh of electricity being produced by 1 L of diesel fuel. However, the F U E L C o n s u m p t i o n   ( L ) by the generic power plant is based on 1 L of diesel per 2.5 kWh of electricity generated in this study. The diesel fuel consumed by the initial case, case 4, case 5, and case 6 is shown in Figure 18. The highest and the lowest values obtained for the cases are 2446 and 2708 L; 6604 and 7321 L; 9050 and 10,020 L; and 12,230 and 13,541 L. However, it can be observed from Figure 18 that the results for each case in the months are almost equal; this is because of the constant generation option used in SAM for the generic plant, which mimics a conventional generator’s behavior. Diesel fuel consumption is also found to increase as the load increases across the different cases considered.
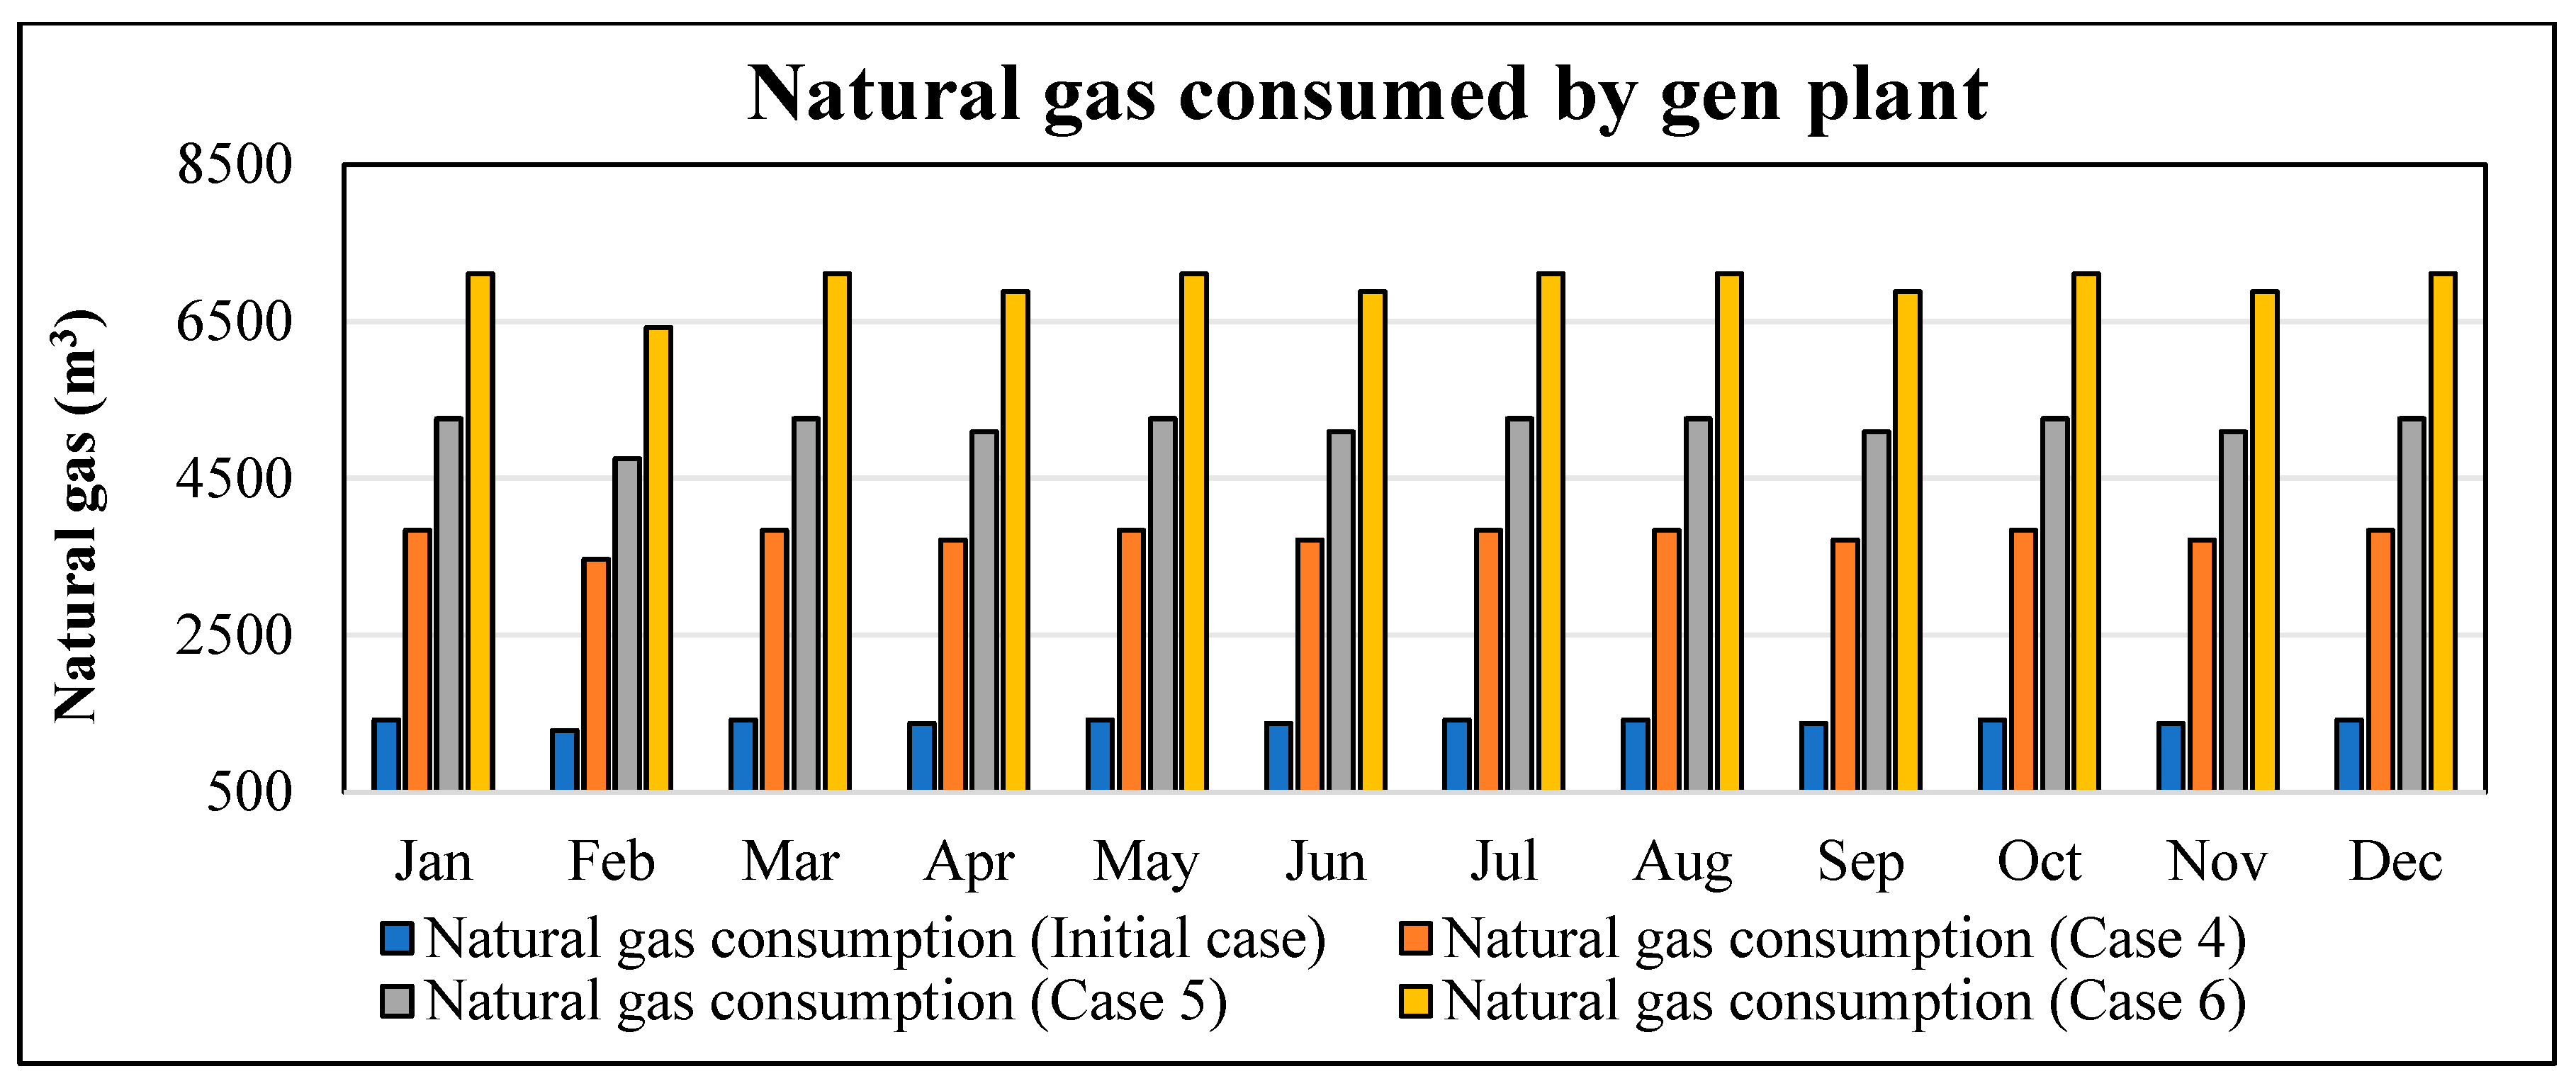
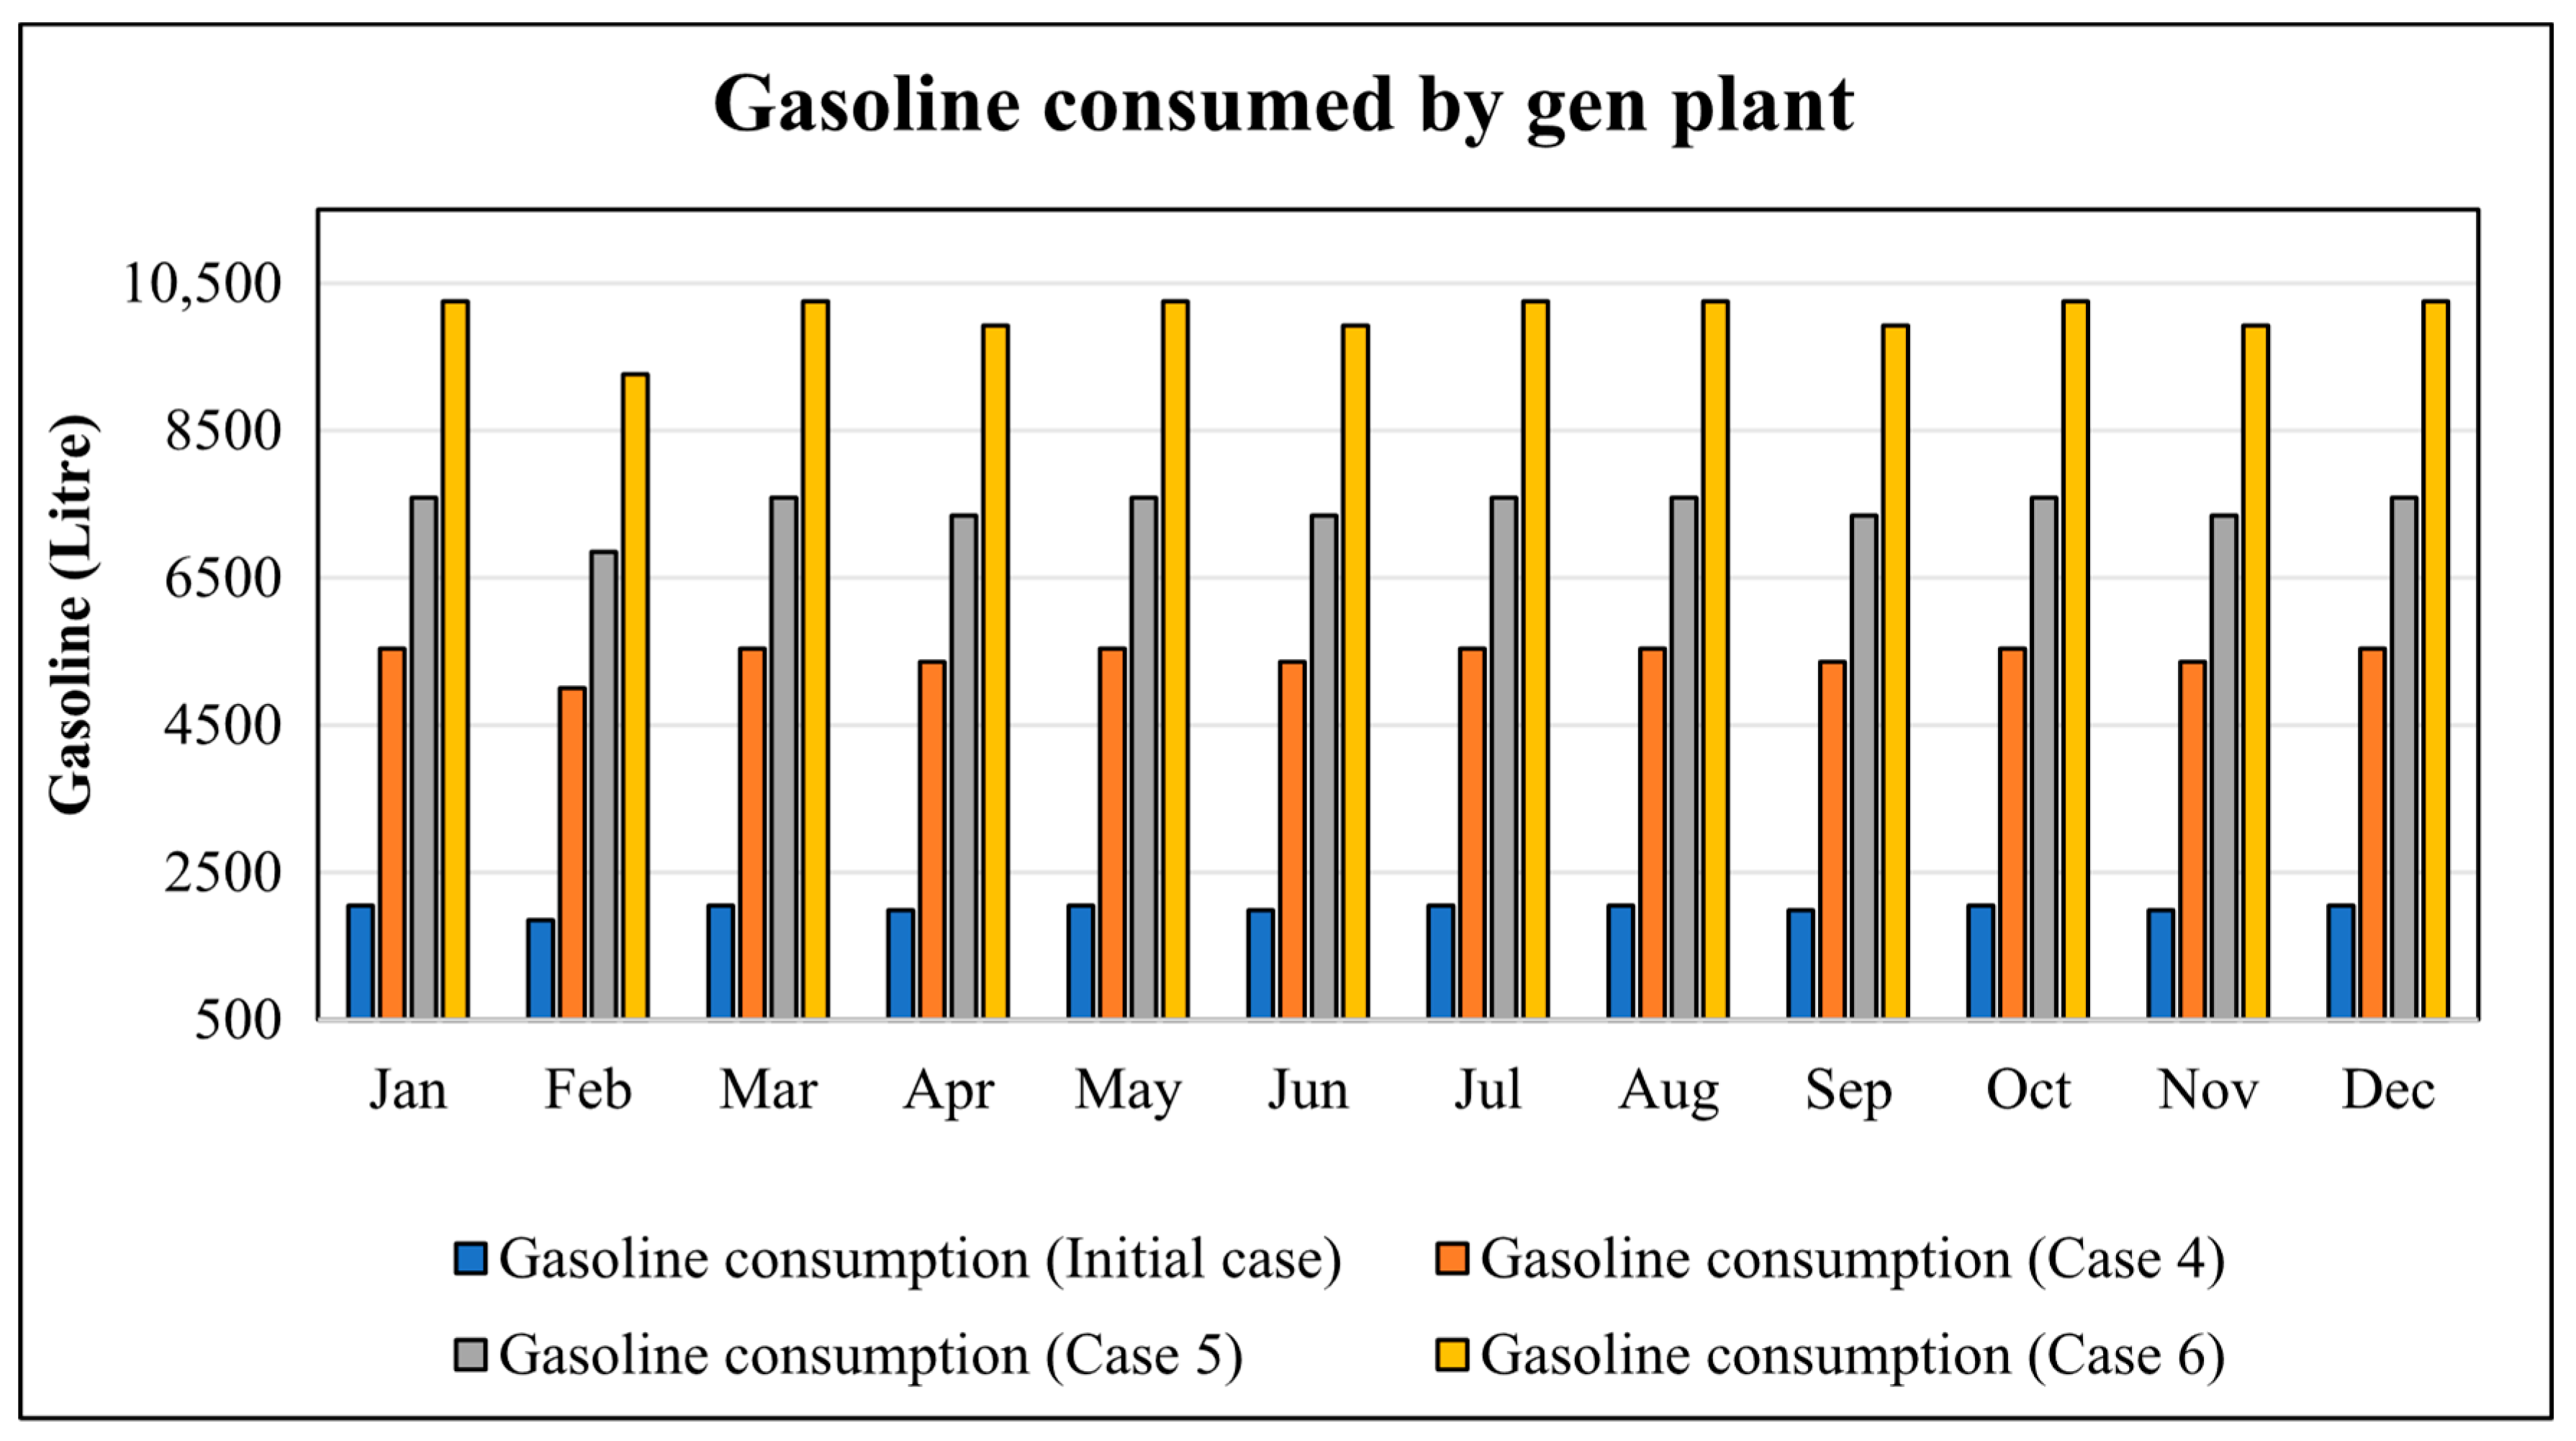
Figure 19 shows the F U E L C o n s u m p t i o n   ( m 3 ) of natural gas by the generic power plant. This is based on 7.42 f t 3 per kWh (i.e., 0.21 m 3 per kWh) of electricity reported by the US Energy Information Administration (US EIA) [110]. The highest and the lowest values obtained for the initial case, case 4, case 5, and case 6 are 1422 and 1284 m 3 ; 3839 and 3464 m 3 ; 5261 and 4752 m 3 ; and 7109 and 6421 m 3 . Just like diesel fuel, natural gas consumption also increases with the load demand. Figure 20 reports the F U E L C o n s u m p t i o n   ( L ) of gasoline for the generic plant. This is based on 0.08 gallons/kWh of electricity reported in [110]. This translates to 0.303 L per kWh of electricity generated. The highest and the lowest values obtained for the cases are 2051 and 1853 L; 5539 and 5003 L; 7590 and 6856 L; and 10,257 and 9265 L. These values are about 25% less than the values obtained for the diesel fuel consumed by the Gen plant. Gasoline is lighter and more volatile than diesel fuel, which burns slowly.

4.2.4. Emissions Analysis for Different Fuels

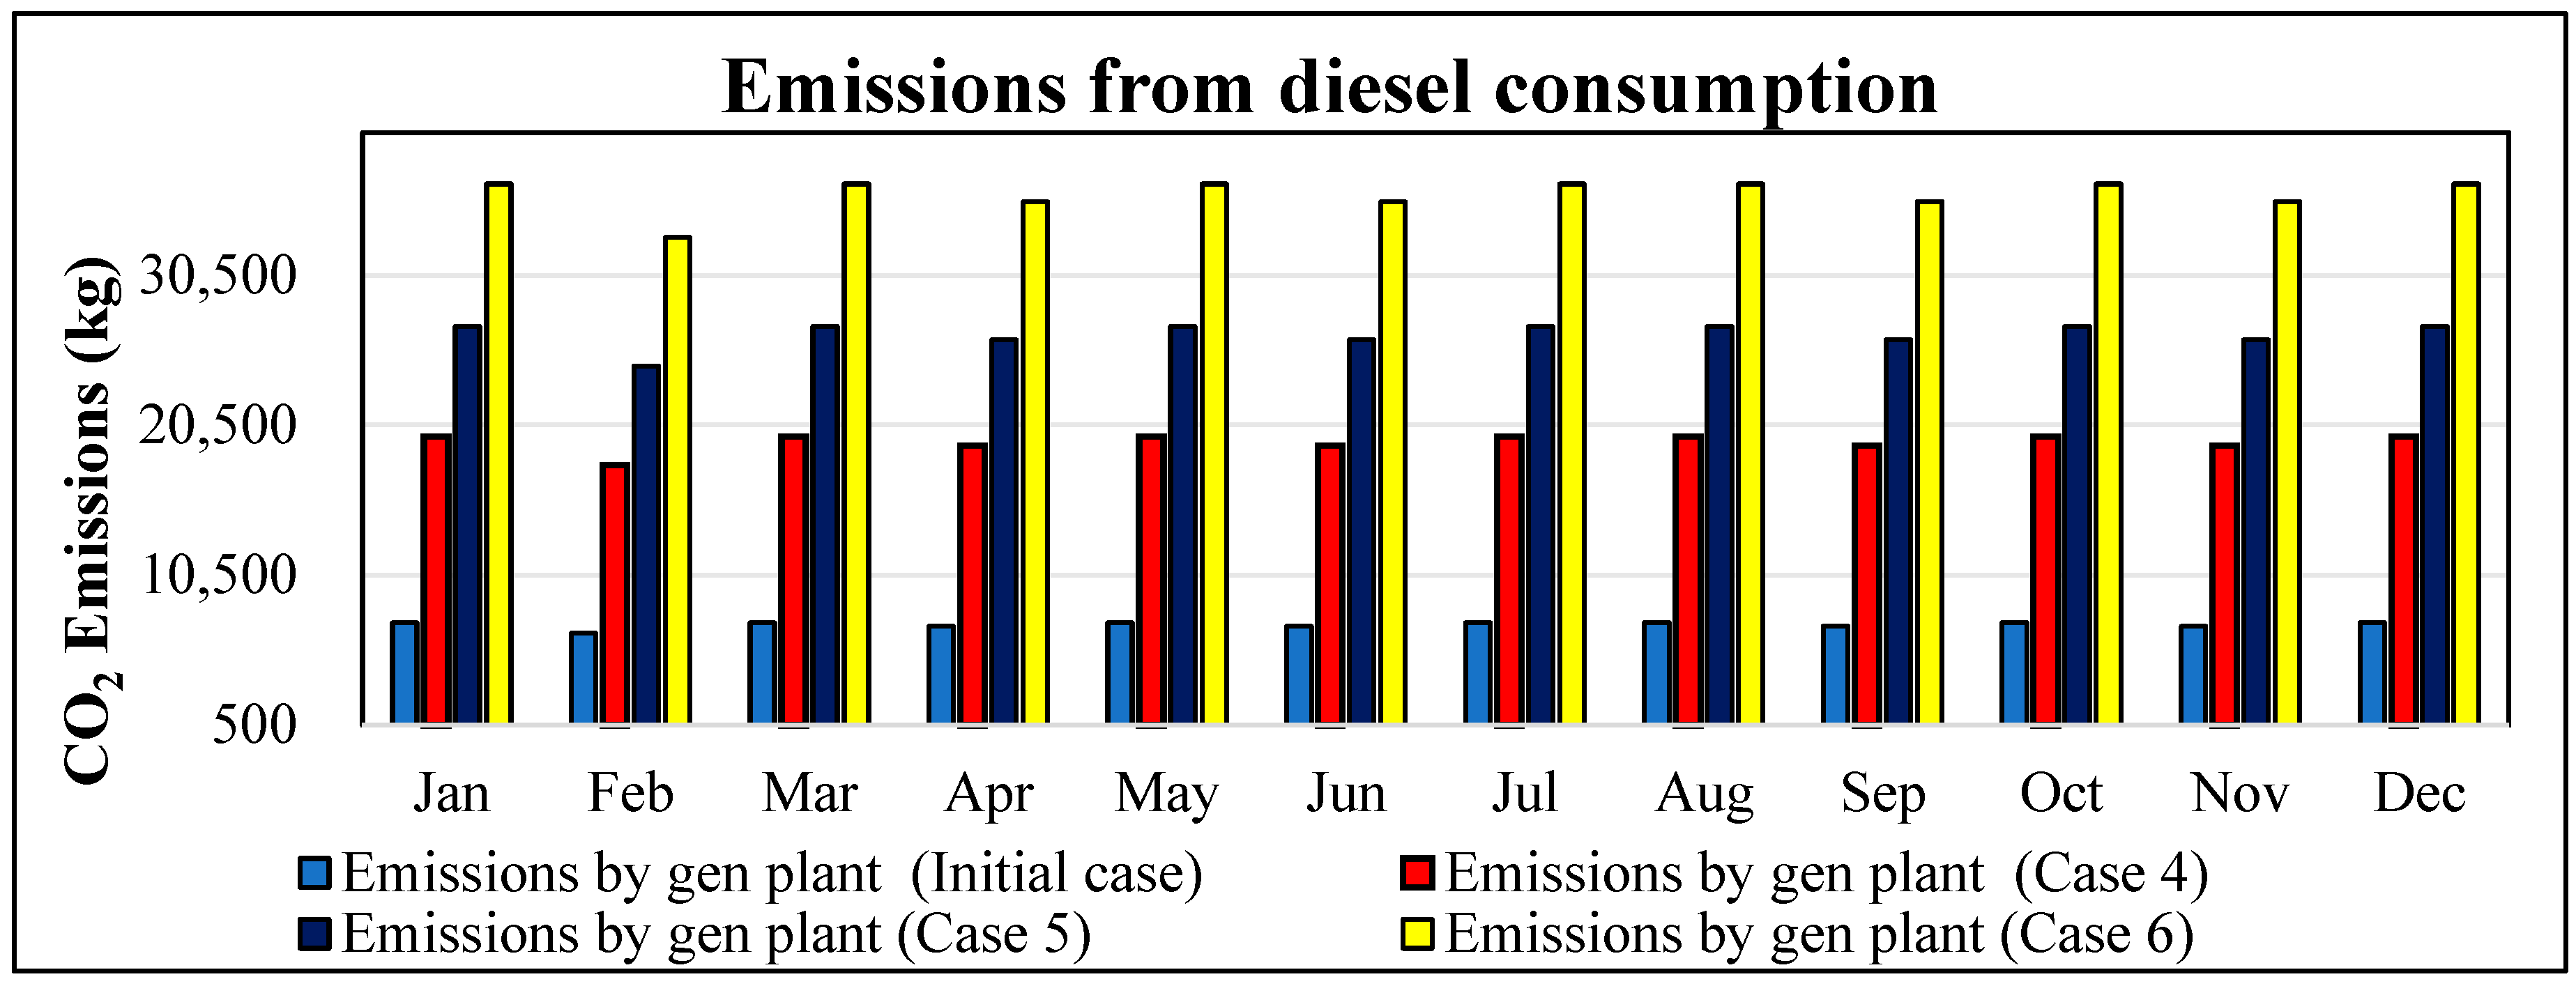
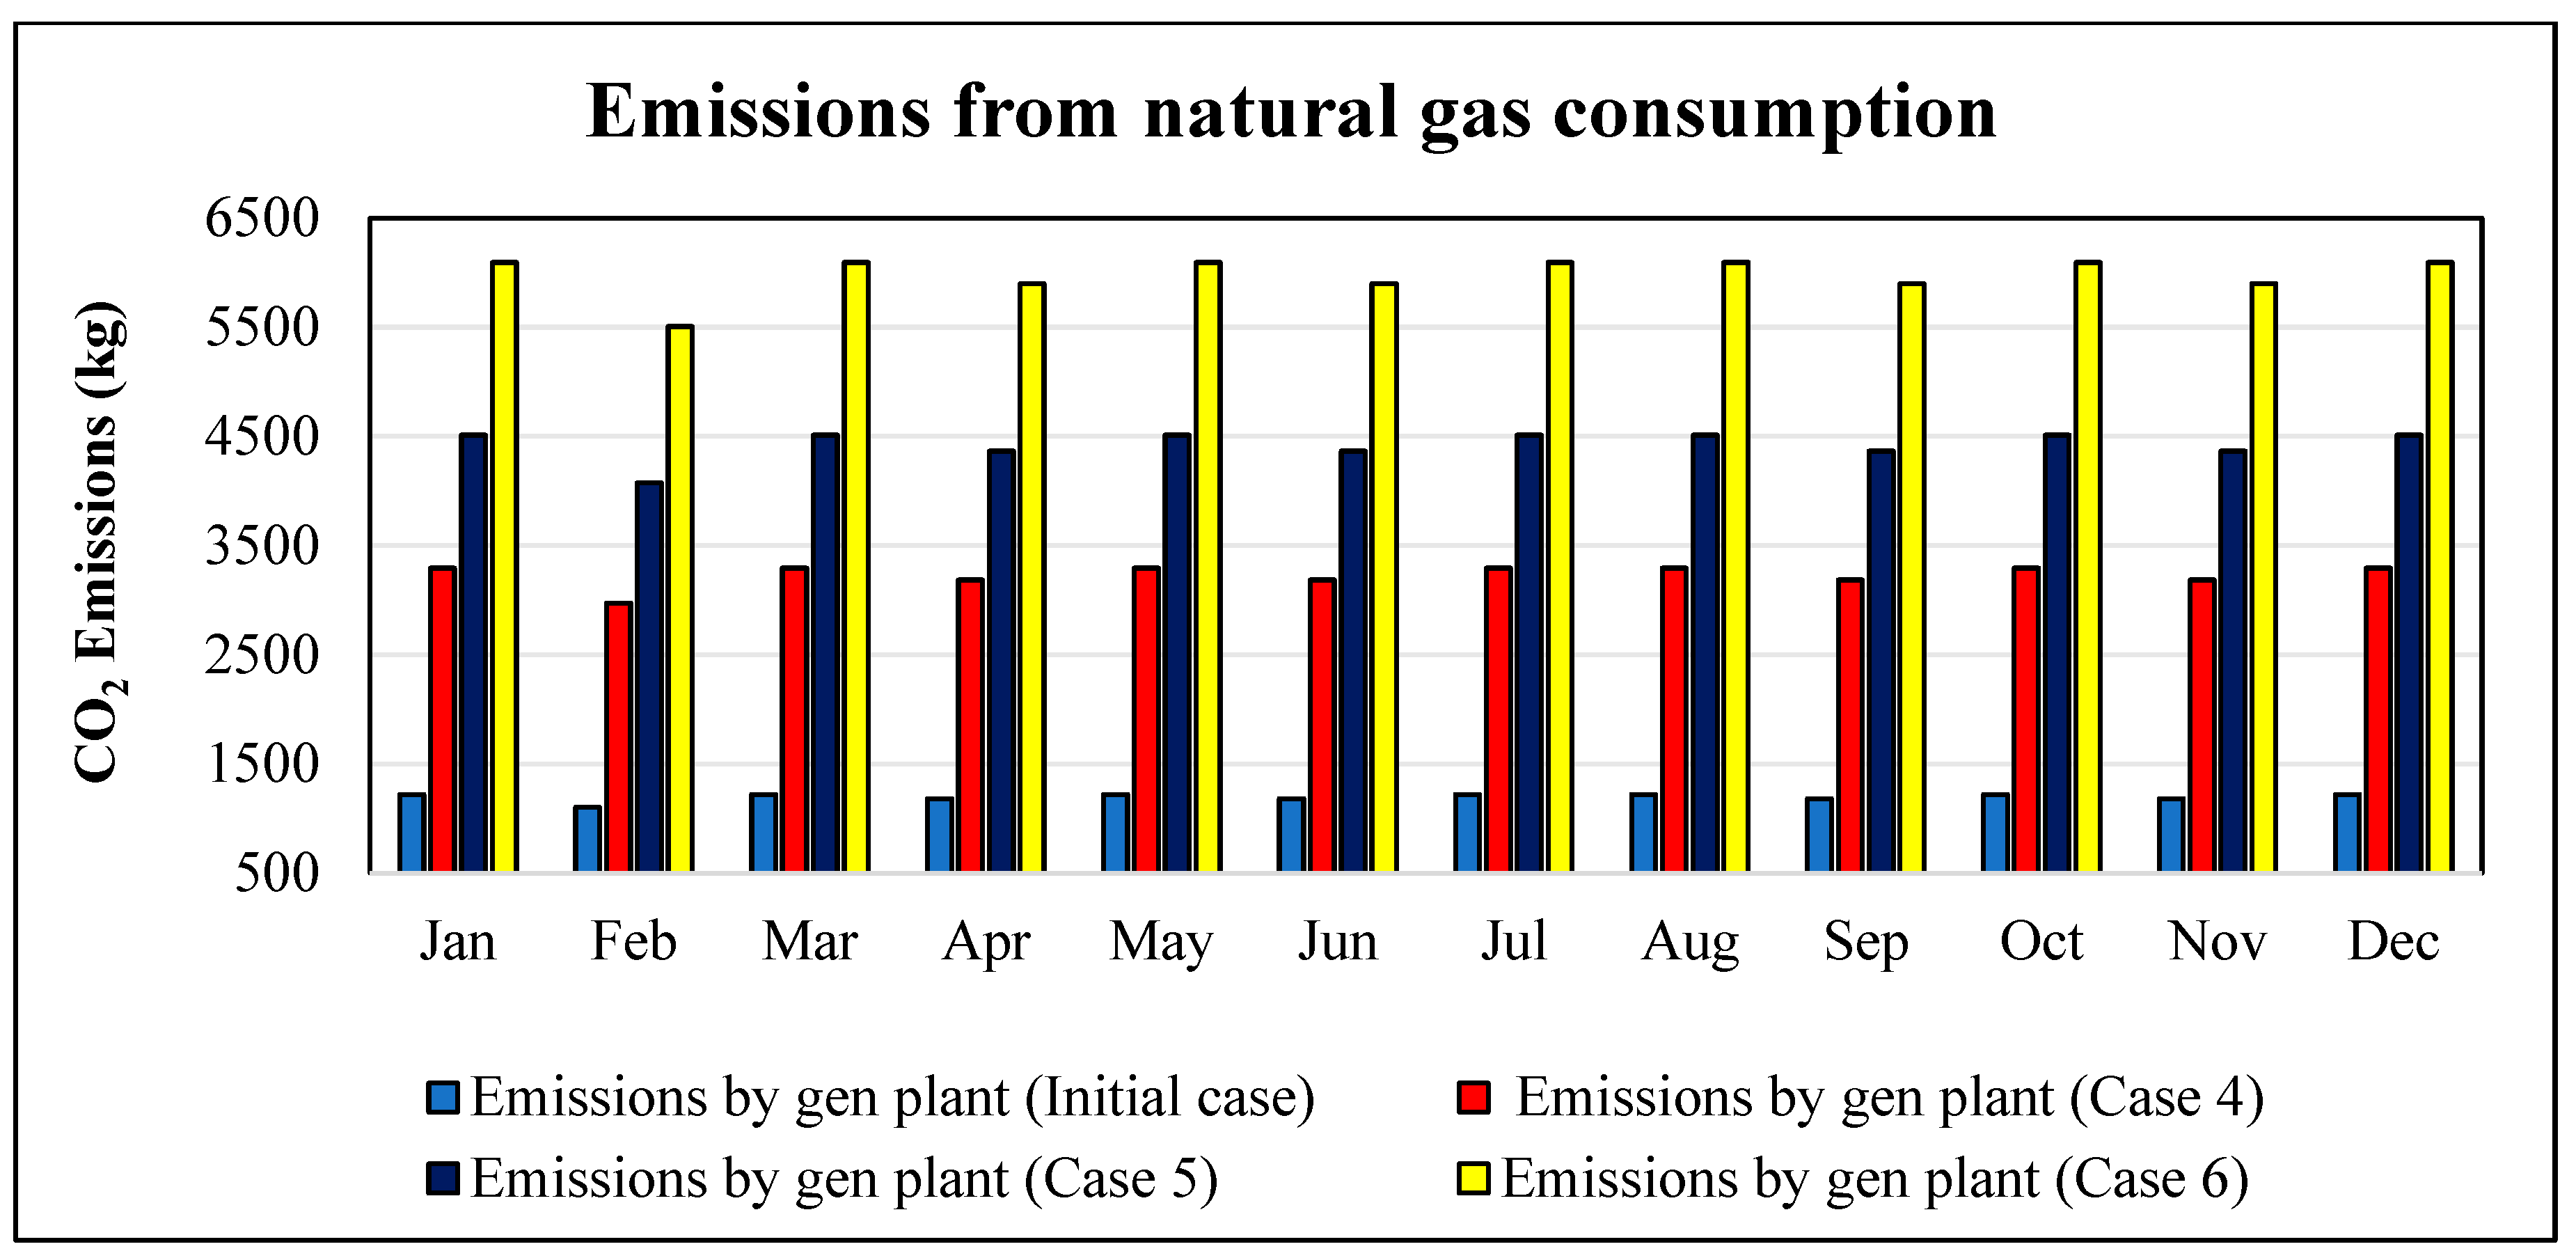
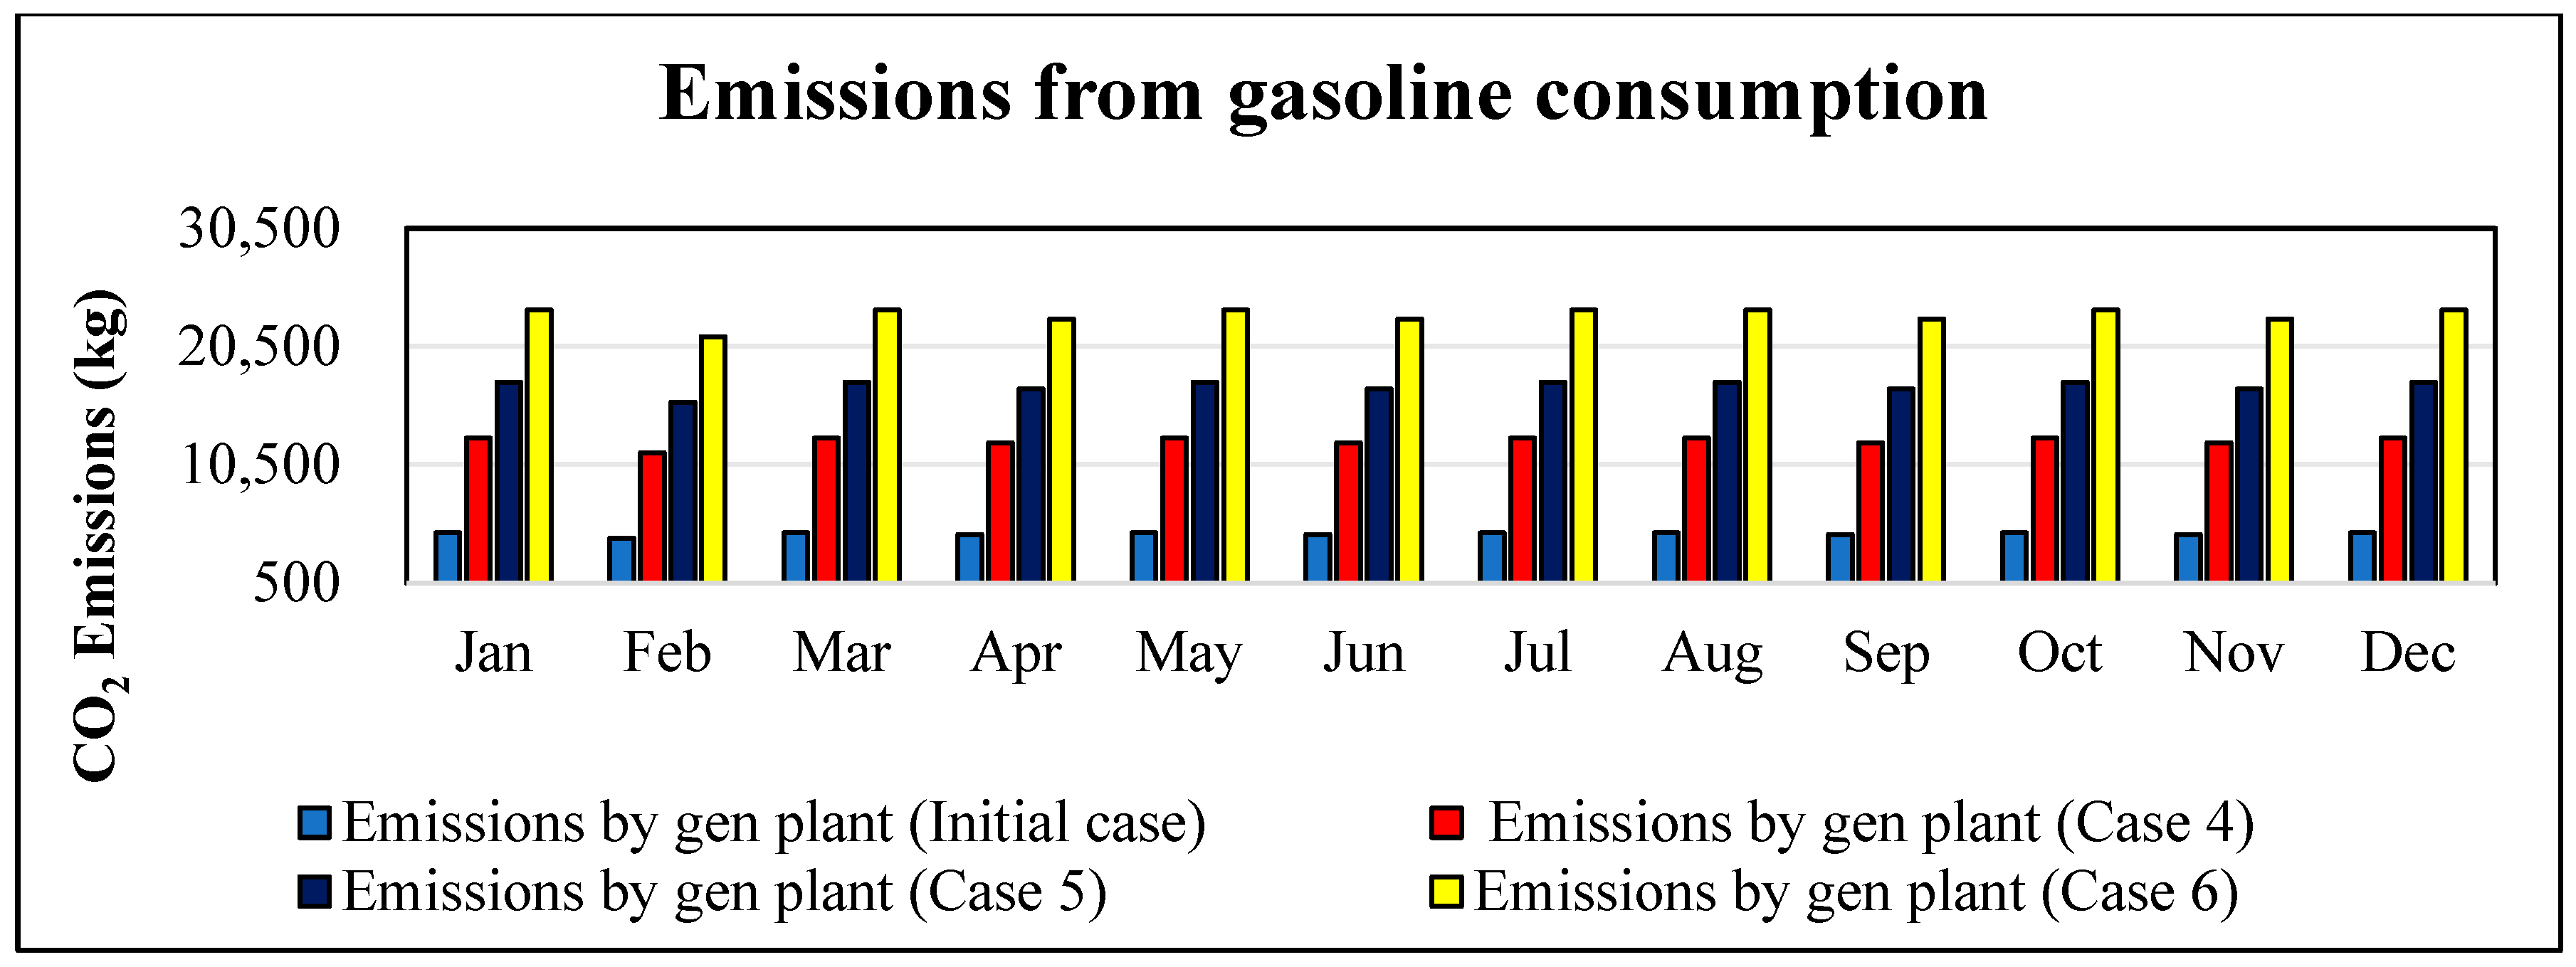
The emission analyses for diesel, natural gas, and gasoline fuels are based on the factors of 2.7 kg CO2 per L of diesel [104], 0.18 kg CO2 per kWh of electricity when natural gas is combusted [111], and 2.3 kg of CO2 per L of gasoline [112]. The emissions generated when diesel fuel is consumed in the Gen plant are reported in Figure 21. The maximum and the minimum values obtained for the initial case, case 4, case 5, and case 6 are 7312 and 6604 kg; 19,743 and 17,832 kg; 27,055 and 24,436 kg; and 36,560 and 33,022 kg. Figure 22 reports the emissions produced by the natural gas in the Gen plant with the maximum and the minimum CO2 values for the cases being 1219 and 1101 kg; 3290 and 2972 kg; 4509 and 4073 kg; and 6093 and 5504 kg. Figure 23 presents the emissions from gasoline with the maximum and the minimum CO2 values for the cases being 4718 and 4262 kg; 12,739 and 11,507 kg; 17,458 and 15,768 kg; and 23,591 and 21,308 kg.
The results demonstrate that diesel produced the highest level of CO2 out of the three fossil fuels (diesel, natural gas, and gasoline), while natural gas produced the lowest carbon emissions; gasoline was between the two fuels in terms of carbon footprint. The ratio of emissions by diesel to emissions by gasoline is about 1.55:1, while the ratio of emissions by diesel to emissions by natural gas is around 6:1.
The model introduced in Figure 1 is an indication of the possibility of using different fuels in the Gen plants. Other fuels such as biogas, biodiesel, biomethane, etc., may also be used for operating the Gen plants in a multi-energy systems case discussed in this paper.

4.2.5. Cost of Fuels Consumed

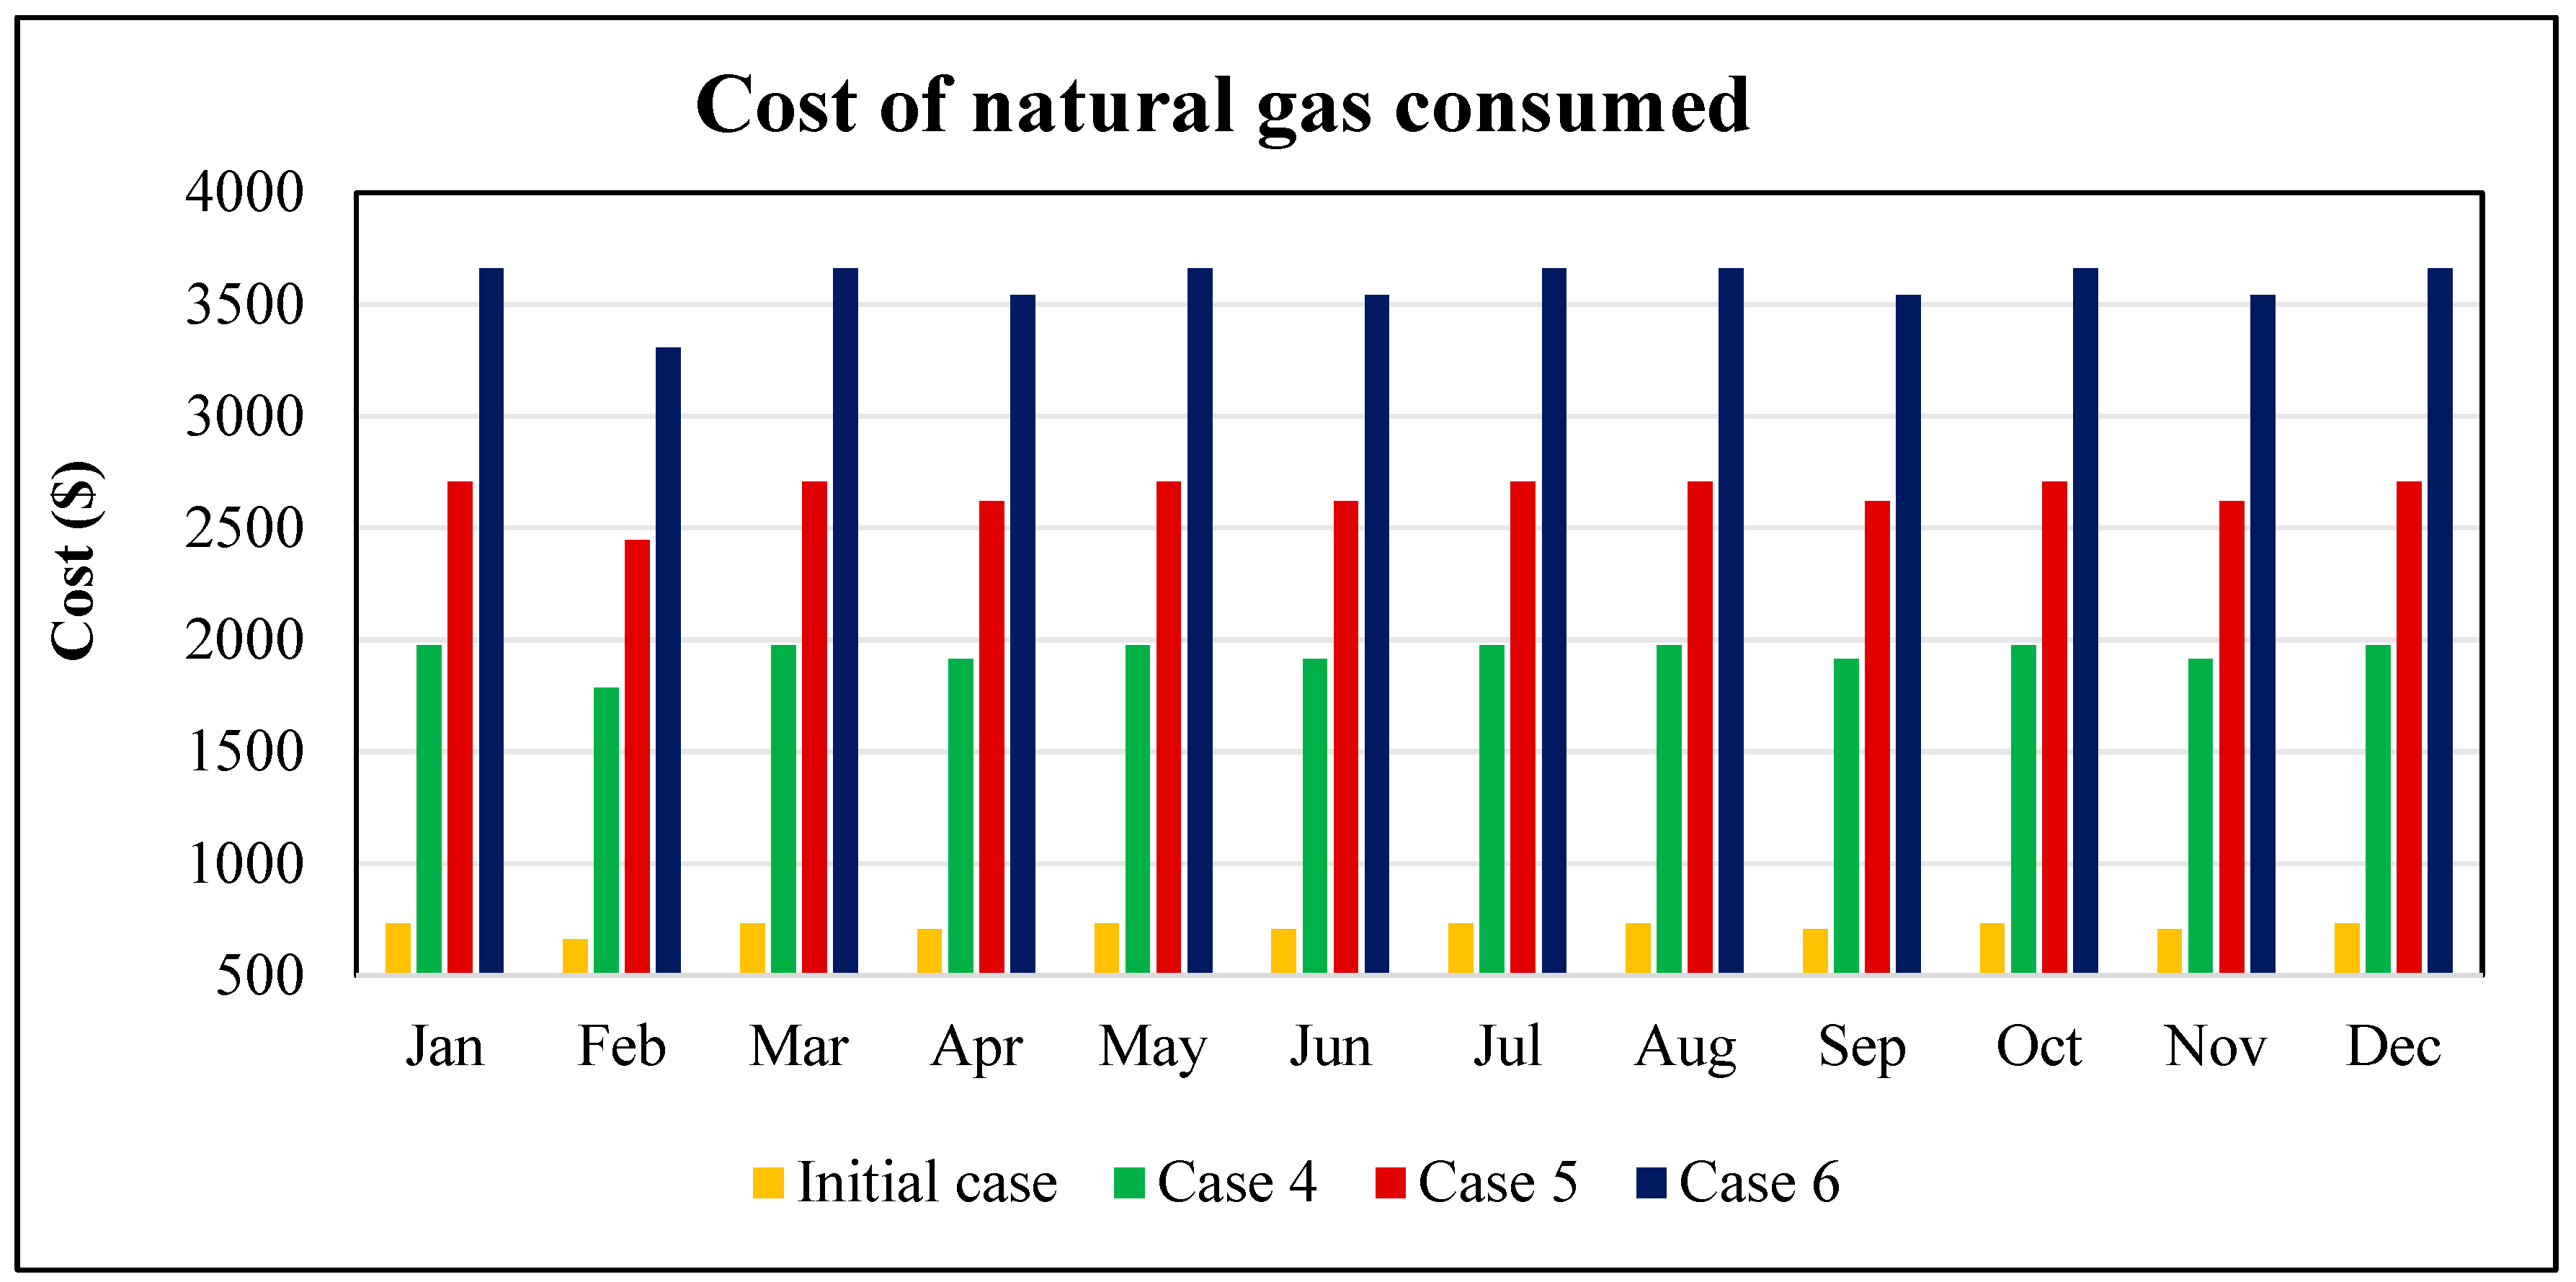
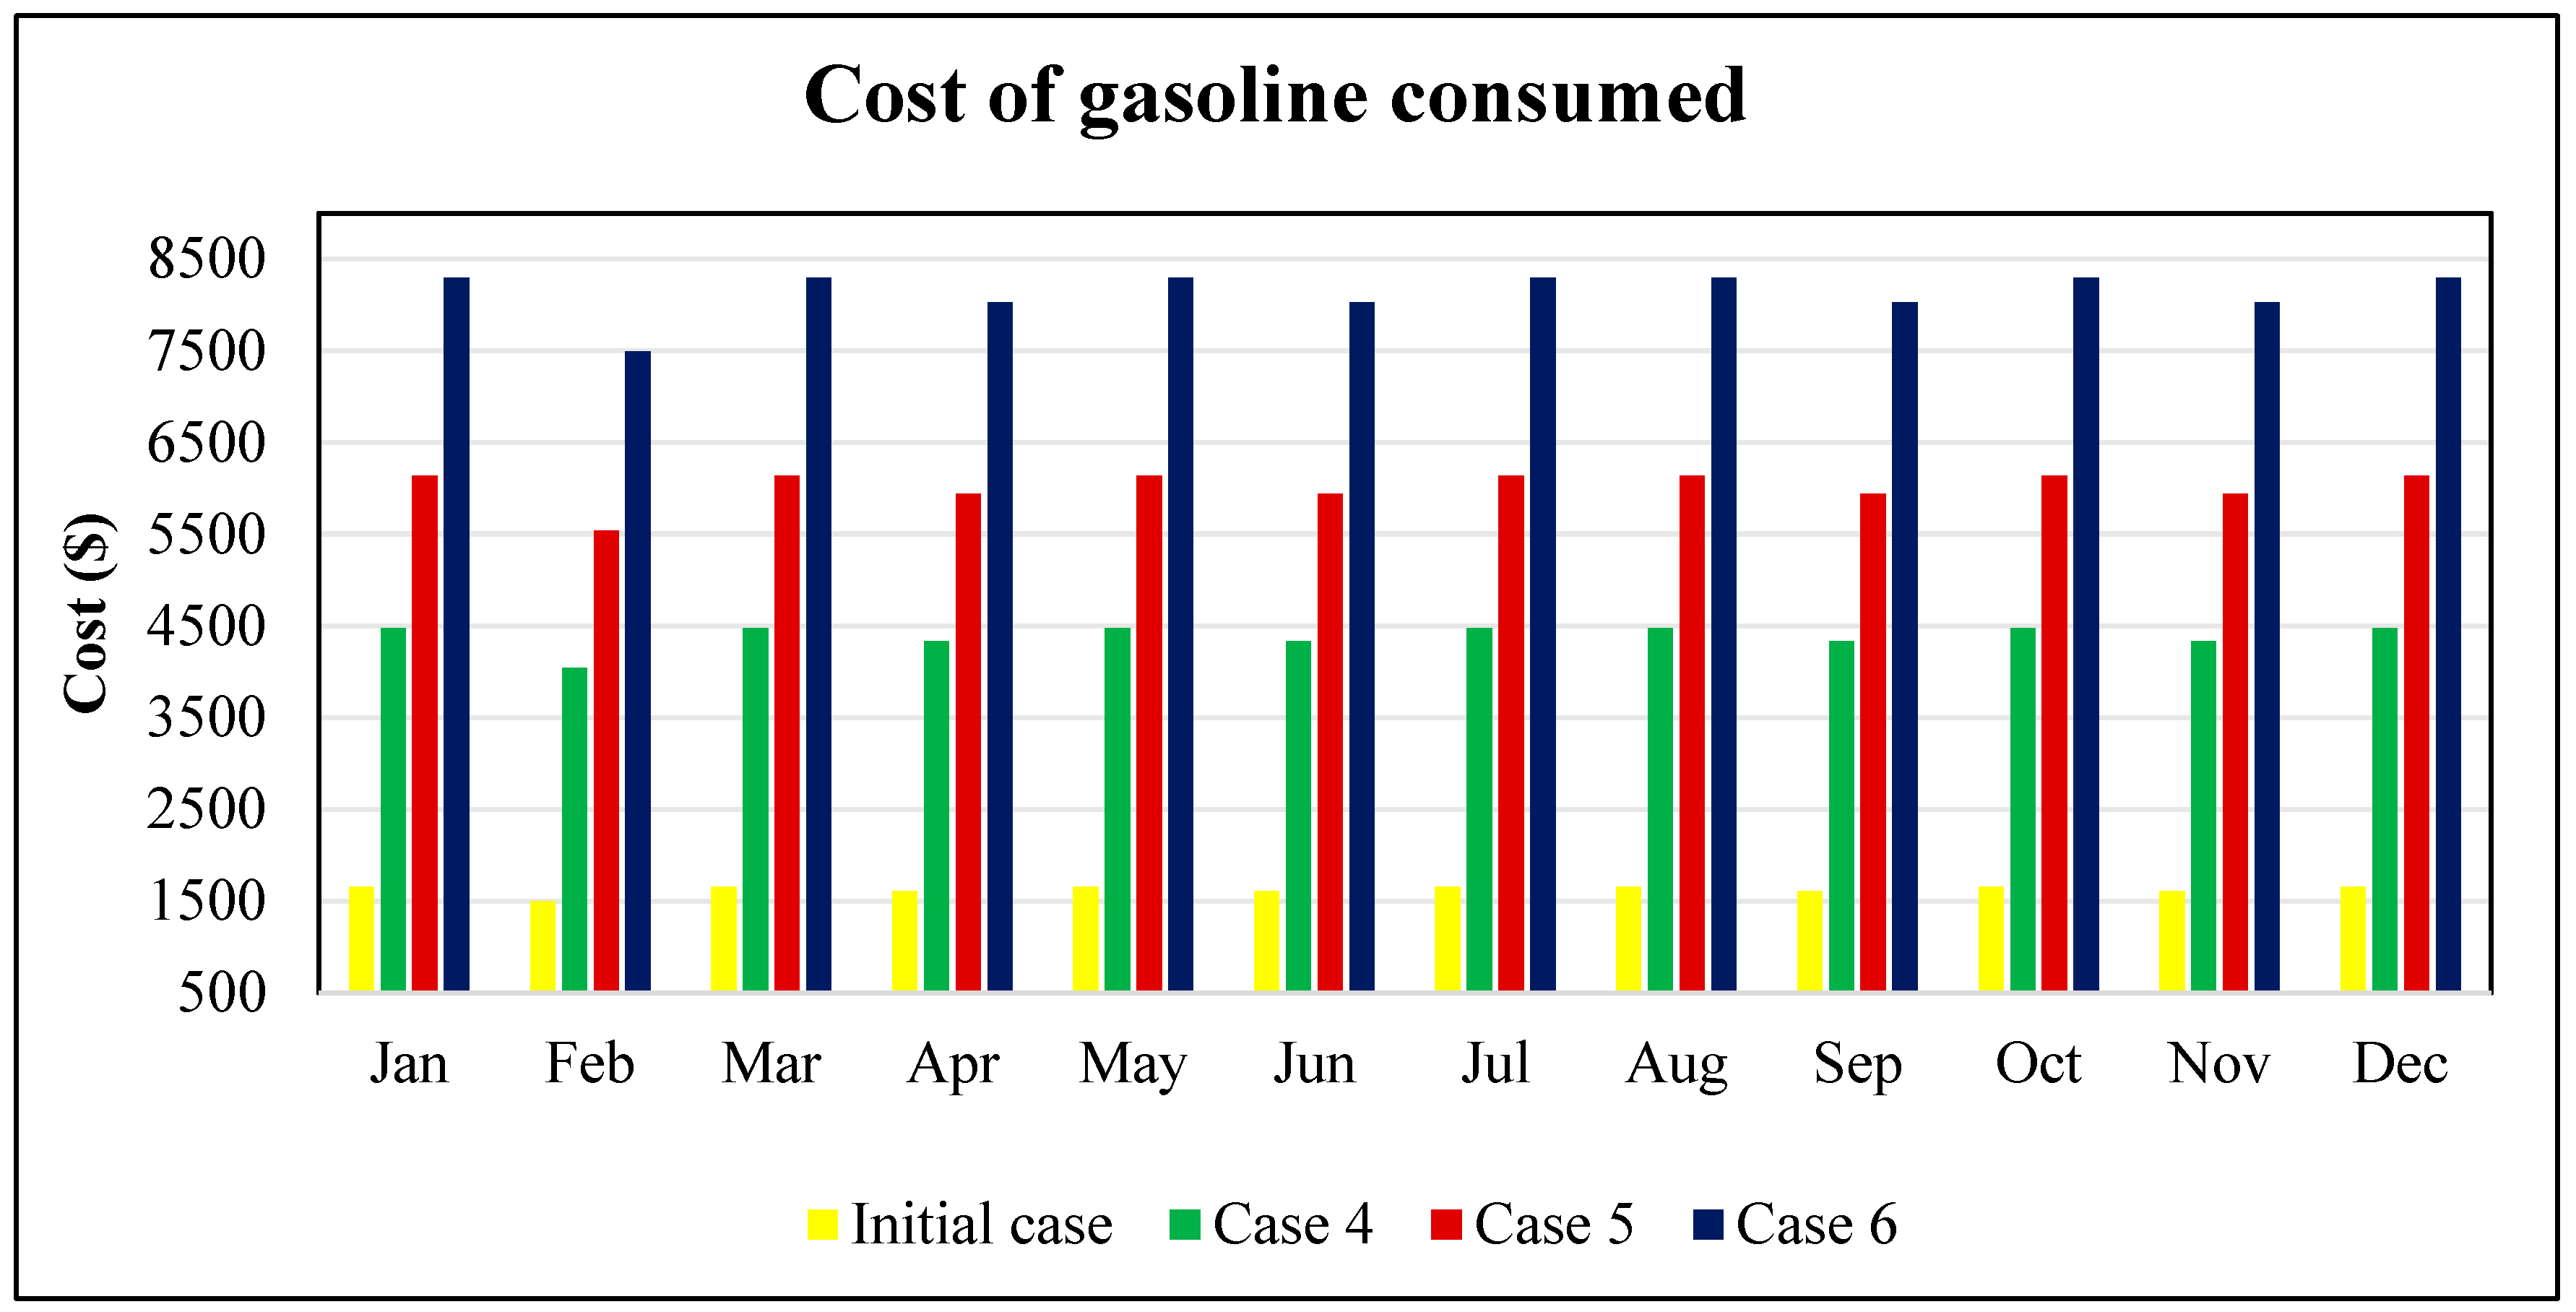
The costs of hydrogen, diesel, natural gas, and gasoline consumed are shown in Figure 24, Figure 25, Figure 26 and Figure 27. The cost ranging from $4.5 to $12 per kg of H2 was reported in [113,114], but $5 per kg of H2 has been used in this study. The value of $3.55 per gallon is used for quantifying diesel consumption (i.e., $0.9379/L); $3.06 per gallon is employed for estimating the gasoline consumption (i.e., $0.80845/L) [115]; and $14.57 per MCf is used for calculating natural gas consumption, translating to $0.51484 per m3 [116]. The maximum and the minimum cost values obtained for the initial case, case 4, case 5, and case 6 for H2 consumption are $248,950 and $103,525; $415,433 and $112,790; $420,365 and $189,124; and $582,860 and $284,951, as shown in Figure 24.
The maximum and the minimum cost values obtained for the initial case, case 4, case 5, and case 6 for diesel consumption are $2540 and $2294; $6858 and $6194; $9398 and $8488; and $12,700 and $11,471, as shown in Figure 25. The maximum and the minimum cost values obtained for the initial case, case 4, case 5, and case 6 for natural gas consumption are $732 and $661; $1976 and $1785; $2708 and $2446; and $3660 and $3306, as shown in Figure 26. The maximum and the minimum cost values obtained for the initial case, case 4, case 5, and case 6 for gasoline consumption are $1658 and $1498; $4478 and $4045; $6136 and $5543; and $8292 and $7490, as shown in Figure 27. The results indicate that natural gas is the cheapest, while hydrogen fuel is the costliest energy resource. The cost of gasoline is also lower than that of diesel resources.
H2 is more expensive than the remaining fuels because of the high costs that are incurred in its generation, storage, and transportation. This is one of the barriers to the utilization of hydrogen FC power. Lee et al. [117] recognized this as the gravest limitation for H2-based FC systems, including its associated lack of infrastructure [118,119].

4.2.6. Direct Capital Costs of Microgrid Subsystem

The direct capital costs of the system are presented in Table 2, Table 3, Table 4, Table 5 and Table 6. Table 2 presents the direct costs of the PV power subsystem. The cost/Wdc of the module and the cost/W of the inverter are based on [120,121], which are $2.74 and $0.18, respectively. The values of 20%, 10%, 5%, and 5% are used for balance of system (BOS) equipment, installation labor, installer margin, and overhead and contingency (fraction of the subtotal), respectively. This study assumes the total direct cost, which represents the total installed cost of the PV subsystem. The results shown in Table 2 combine the costs for all the scenarios considered, i.e., initial case, case 4, case 5, and case 6. This demonstrates a rising trend in the parameter costs from the initial case to case 6, which is consistent with the increase in the users’ load demand as presented earlier in this paper. The cost parameters include the PV array capacity, array cost, inverter cost, BOS cost, installation labor, installer margin, contingency, and the total direct cost. The total direct cost for the cases from the initial to case 6 ranges from the lowest value of $70,421.31 to the highest value of $209,499.4. The total installed cost per capacity for the PV power subsystem for the initial case and case 4 is $4.07/W while the value obtained for cases 5 and 6 is $4.05/W. For the operation and cost (O and M), the values used for the fixed annual operating cost ($/yr), fixed cost by capacity ($/kW-yr), and the inflation/escalation rate (%) in the simulation are 10, 22, and 5, respectively. The direct cost of the wind power subsystem is presented in Table 3, which has been based on NREL’s cost models for wind turbine and BOS capital costs for land-based installation. The results in Table 3 also reveal an increasing trend in costs from the initial to case 6 as the load demand grows. The cost parameters for the wind power system include the wind farm capacity, number of turbines, turbine cost, BOS cost, and the total direct cost. The total direct cost for the cases from the initial to case 6 ranges from the lowest value of $128, 280 to the highest value of $256, 560. The total installed cost per capacity for the wind power subsystem for all the cases is $6.41/W.
The values used for the fixed annual operating cost ($/yr), fixed cost by capacity ($/kW-yr), and the inflation/escalation rate (%) in the simulation are 18, 39, and 5, respectively. Table 4 shows the cost of the fuel cell power system, based on the cost of $1500 per kW of fuel cell stack [122]; the BOS, labor, installer margin, and the contingency have been based on the corresponding values of 20%, 10%, 5%, and 5%. The cost parameters for the wind power system include the fuel cell power capacity, cost of fuel cell stack/kW, total cost of fuel cell stacks, BOS cost, installation labor cost, installer margin, contingency, and the total direct cost. The total direct cost for the cases from the initial to case 6 ranges from the lowest value of $51,281.25 to the highest value of $215, 381.25. The total installed cost per capacity for the fuel cell power subsystem for all the cases is $2.05/W. The values used for the fixed annual operating cost ($/yr), operating cost by capacity ($/kW-yr), hydrogen fuel cost ($/MCf), and the inflation/escalation rate (%) in the simulation are 20, 27, 11. 82, and 5, respectively. The cost of H2 of $11.82 per MCf was obtained from the cost of fuel of $5per kg of hydrogen, presented earlier, since 1 kg of H2 is about 423 cubic feet of H2 (i.e., 1 kg of H2 equals 0.423 MCf of H2); dividing $5 by 0.423 then gives $11.82.
Table 5 presents the direct cost of the battery storage subsystem. These include the cost of the battery pack, battery power, battery cost per capacity, battery cost for the system’s capacity, 5% contingency, and the total direct cost. The total direct cost for the cases from the initial to case 6 ranges from the lowest value of $284,708.46 to the highest value of $1,139,593.67. The other costs also follow an increasing trend, and the total installed cost per capacity for the battery subsystem is $2.85 per W. For the operation and cost (O and M), the values used for the fixed annual cost ($/yr), fixed cost by capacity ($/kWac), replacement cost ($/kWac), and the inflation/escalation rate (%) for the simulation are 20, 5.25, 280, and 5, respectively.
Table 6 shows the cost of the generic (custom generation) power plant subsystem, based on a generator cost of $4500 per 10 kW [123]. The cost parameters for the generic plant subsystem include the nameplate capacity, generating plant cost, plant cost per capacity, BOS and other costs, contingency, and the total direct cost. The total direct cost for the cases from the initial to case 6 ranges from the lowest value of $11,130 to the highest value of $55,650. The total installed cost per capacity for the generic plant subsystem for all the cases is $1.11/W. The values for the fixed annual operating cost ($/yr), fixed cost by capacity ($/kWac), fossil fuel cost ($/MMBtu), and the inflation/escalation rate (%) for the simulation are 50, 43, 48.28 (diesel)/14.55, (natural gas)/24.94 (gasoline), and 5, respectively. The converter factors from million British thermal units (MMBtu) to liters for diesel and gasoline, and from MMBtu to m3 for natural gas, are obtained from [123,124,125,126]. From this information, 1 MMBtu is found to be equivalent to the following: 51.5 L of diesel; 28.2 m3 of natural gas; and 30.85 L of gasoline. Since 1 L of diesel fuel is $0.9375, then the cost is $48.28 per MMBtu for diesel; 1 L of natural gas fuel is $0.51484, yielding the cost of $14.55 per MMBtu for natural gas; and 1 L of gasoline fuel is $0,8045, leading to the cost of $24.94 per MMBtu for gasoline [124,125,126,127].
The project cost metrics for the multi-energy m-grid system (i.e., hybrid system) is presented in Table 7a,b. The cost parameters include the levelized costs of energy (LCOE) and the hybrid total installed cost. The corresponding values of the nominal LCOE, real LCOE, and the hybrid total installed cost for the initial case when diesel, gasoline, and the natural gas fuels are interchangeably used by the generic plant are 58.82 cents, 47.75 cents, and $ 545, 821.02; 45.97 cents, 37.32 cents, and $ 545, 821.02; 40.25 cents, 32.67 cents, $ 584, 059, and $ 545,821.02. For case 4, the corresponding values of the nominal LCOE, real LCOE, and the hybrid total installed for the usage of diesel, gasoline, and the natural gas fuels by the generic plant are 62.96 cents, 50.97 cents, and $ 992; 157.10; 46.02 cents, 37.25 cents, and $ 992,157.10; and 38.48 cents, 31.15 cents, and $ 992,157.10, respectively. The values obtained for case 5 are 63.53 cents, 52.36 cents, and $ 1,464,641.71; 48.37 cents, 39.86 cents, and $ 1,464,641.71; and 41.62 cents, 34.30 cents, and $ 1,464,641.71. The project metrics for case 6 are 66.65 cents, 54.25 cents, and $ 1,876,684.34; 49.30 cents, 40.13 cents, and $ 1,876,684; and 41.57 cents, 33.84 cents, and $ 1,876,684.34.
The costs shown in Table 7a,b for all the cases clearly show a decreasing trend from when diesel is used to when natural gas fuel is used to run the generic power plant. The highest and the lowest LCOE values are obtained for m-grid with PV, WT, FC, and a generic plant running on diesel, and m-grid with PV, WT, FC, and a generic plant running on natural gas. The project cost metrics also take an increasing trend from the initial case to case 6 because of the increased load demand by the consumers. This confirms the fact that the costs of m-grids are directly proportional to the power capacity to be served, which is a function of the load requirements. The results also clearly indicate that the cost of fuel has a significant effect on the overall system’s cost. The NPVs, equity, and the size of debt are also reported in Table 7a,b. The value of the host NPV increases, while that of the developer NPV decreases, for the different fuel arrangements. In the same manner, the equity increases while the debt reduces. It is observed, however, that the NPV for the developer is positive, while that of the host is negative.
As established earlier, a positive NPV represents an economically feasible project, while a negative NPV indicates an economically infeasible project. This study then takes some steps forward to examine the results. It is important to note that several financial models exist in the SAM simulation tool, and the type of results that will be obtained will be determined by these models and the financial parameters employed. This study is based on the TPO-Host Developer Financial model. Furthermore, some strategies are emphasized in the tool’s library for increasing or improving a project’s NPV, which include the reduction in installation and/or operating costs, increase in the level of incentives, increase in discount rate, increase in revenue (i.e., increase in PPA price, PPA price escalation, or decrease in IRR target) for PPA projects, e.g., PPA, merchant plant, third-party ownership, community solar PV system, and increase in savings (i.e., adjust retail electricity rate or load) for distributed projects, e.g., residential and commercial) [95].
Based on the foregoing, it is necessary to evaluate the NPV performance alongside other indices, including internal rate of return (IRR), power purchase agreement (PPA) price, payback period, size of debt, capacity factor, etc. [93,107]. The IRR in this represents the developer internal rate of return according to the methodology specified in SAM. The financial parameters in the SAM tool’s settings that generated the results presented in Table 7a,b are based on the IRR target of 11%; IRR target year of 20; PPA price escalation of 1%; host real discount rate of 6.4%; host nominal discount rate of 9.06%; project developer real discount rate of 6.4%; project developer nominal discount rate of 9.06%; analysis period of 25 years; and investment tax credit (ITC) of 30%. Table 8a,b presents new cost results based on changes on some of the financial parameters such as IRR target of 11%; IRR target year of 10; PPA price escalation of 15%; host real discount rate of 15%; host nominal discount rate of 17.87%; project developer real discount rate of 6.4%; project developer nominal discount rate of 9.06%; analysis period of 25 years; and investment tax credit (ITC) of 40%.
Results in Table 8a,b demonstrate appreciable improvement in the NPV to a level consistent with a project evaluation period of 25 years compared to those reported in Table 7a,b. The results show a reducing trend in the NPV, equity, debt, and the LCOE for the different fuels considered, with the microgrid operating the generic plant on diesel having the highest cost, while the one operating on natural gas has the lowest cost. The project costs of Table 8a,b are relatively low; this is due to the fact that certain financial parameters need to be appropriately used to achieve a viable economic evaluation, as presented in this study. This cost analysis gives an indication that the methodology and simulation may be replicated for any specific locations around the world. However, what is important is supplying the intended financial parameters into the appropriate financial model in the SAM environment.
Similar studies also exist in the literature that reported a negative NPC, such as those presented by Saddari et al. [128] and Zaidi et al. [129]. The authors also attributed the reason for such development to the high installation cost and low revenue that the project is likely to generate over its useful life. A rigorous economic and business model of the multi-energy m-grid system will provide a detailed cost evaluation; this is planned for future research works by the authors to advance the knowledge provided in this current paper.

4.3. Proposed Policy Framework for the Multi-Energy-Based Microgrid

The adoption and implementation of these recent technologies for decarbonizing power generation sectors will have far-reaching benefits in creating an atmosphere that supports the realization of some of the United Nations Sustainable Development Goals, such as SDGs 7, 9, 11, and 13, respectively. In view of these benefits, there must be an enabling policy as pathways defining the roles that academia, governments, utilities, non-governmental organizations, and funders should play to sustain emission cutdown and promote supply reliability and affordability in pursuance of global objectives of mitigation of climate change. A policy framework is proposed in Figure 28, which shows the interactive roles that each identified stakeholder must perform in policy pathways supporting the adoption and implementation of these emerging low-carbon technologies. In the proposed policy framework architecture, the major stakeholders are funders/non-governmental organizations, government, utility, and academia. These stakeholders are central and are meant to perform several distinctive roles towards achieving a global society where net-zero emissions take over the hard-to-decarbonize sectors like power generation.
The government is expected to enact polices that support free and fair community consent purposefully to facilitate informed consultation and make provisions for resolving issues that concern revenue sharing or tariff discounts for host communities. This will encourage friendliness from the host community towards the expatriates who may be deployed to implement these technologies in the host community. Also, the tariff control board is another major function expected of the government, and the essential areas of interest are export credits, non-wires alternatives, and ancillary services.
The export credits are expected to emphasize net billing or feed-in rates indexed to avoided cost, the non-wire alternative is expected to consider paying microgrids for deferral of grid upgrades, while the ancillary services are expected to open up local markets for their adoption. Also, another key concern of the government is the social and environmental safeguards, which must emphasize do-no-harm screens with a sustainable plan for e-waste management, recycling mandates, and end-of-life bonds as they may apply. The implementation and adoption of these emerging low-carbon technologies cannot be adequately transferred to developing countries without the active engagement of the university community. The university community is the research hub and academia is the nerve center that supports the transformation of intuitive ideas into research outputs, leading to the development of local content products through prototyping.
Also, the deployment of these technologies is data-driven; hence, policies supporting data security and privacy are of utmost importance. Consequently, academia is expected to take the lead position in cybersecurity protocol so as to boost system resilience in the face of these emerging low-carbon technologies. In addition, a closer examination of the proposed policy architecture showed that the utility is another major stakeholder, and they have core roles to play in achieving net-zero emissions. In this way, the utility is expected to take the lead position in the area of modern market design, m-grid legal status, and development of interconnections and technical codes. For instance, the modern market design comprises time-of-use and real-time pricing, thus enabling locational pricing or equivalent signals for distributed energy resources (DERs) and microgrids.
Also, m-grid legal status seeks to define what a m-grid is, who may own/operate, and rights to island/reconnect alongside standardized interconnection agreements and dispute windows. Furthermore, the utility is expected to address the issue of interconnection and technical codes, which should be aimed at adopting and enforcing DER standards such as inverter ride-through, anti-islanding, protection coordination, and data-sharing requirements with the distribution system operator or transmission system operation. Funders, donors, and non-governmental organizations are the major stakeholders in the deployment of these low-carbon technologies. They help to achieve the global objective of net-zero emissions through the provision of funds to aid the government, utility, and academia in research and/or development of tangible products that can facilitate the realization of SDGs 7, 9, 11, and 13, respectively.

4.4. Limitations of the Analysis and Future Work

As a limitation, some parameters are based on default values in SAM for the simulation and analysis of the proposed multi-energy m-grid system. Some of these input parameters include losses, capacity factor, inflation, developer discount rate, cost per capacity of wind turbine, fixed operating cost per capacity, IRR, etc. In addition, the values used for environmental (i.e., emission factor) and economic (cost per fuel consumption) analyses are based on the values reported in the literature. The paper has been presented for the purpose of analysis to showcase the comparison of clean fuel like hydrogen, which is an important energy vector in decarbonization strategy, with conventional fuels such as diesel, gasoline, and natural gas. Therefore, location-specific solutions by other researchers will require specific data and the local conditions and situations, which will include the emission factor and economic situations. For this reason, the simulation and analysis presented in this paper may be replicated for any location of interest around the world, depending on the parameters used and the data provided by the designer. It is expected that the multi-energy simulation approach and analysis presented in this paper can be useful for a deeper understanding of the potential of clean microgrids compared to those operated by conventional energy systems.
Future work will consider field work where the load model will be informed by the assessments of the users’ appliances on the site, with detailed considerations for the local conditions. A cradle-to-grave (life cycle) analysis technique will be employed for the environmental aspects, including the utilization of biodiesel fuel in the energy mix of the microgrid [130]. Further gLE studies will also consider social–technical–economic–environmental–policy (STEEP) multi-criteria analysis, including technology diffusion and adoption, energy transitions, and circular economy [131,132,133].

5. Conclusions

This paper has presented the recent progress in the green and low-carbon role of green and low-carbon energy resources for clean energy generation and supply. In addition, the study identified the growing application and utilization of solar, wind, hydro, geothermal, and biomass energy resources, with the existence of low-carbon energy resources such as power-to-X, power-to-fuel, power-to-gas, e-fuel, waste-to-energy, etc., which have huge potential for delivering sustainable energy. The research study discussed the concept of carbon capture, sequestration, and a carbon-neutral/net-zero economy. In particular, the study discussed the global developments in green and low-carbon energy technologies in terms of their deployments for different applications in different sectors of the economy—residential, commercial, business, communication, etc.
One of the main contributions of the paper is the introduction of different conceptual technical models and configurations of energy systems showcasing the potential of multi-energy generation in a microgrid (m-grd) fueled by green and low-carbon energy resources. Another contribution of this work is that it presented the simulation and analysis of m-grd using the System Advisor Model (SAM) software based on solar, wind, fuel cells, and conventional resources such as diesel, natural gas, and gasoline resources for servicing a commercial load. The quantity of carbon emissions avoided by the m-grd was evaluated, and the study found that natural gas emits the lowest CO2, while diesel generates the highest amount of CO2. The study found that H2 is more expensive than the fossil fuels diesel, gasoline, and natural gas because of the high costs that are incurred in their generation, storage, and transportation. The results also show that diesel produced the highest level of CO2 out of the three fossil fuels, while natural gas produced the lowest carbon emissions; gasoline fuel is found to be in between the carbon footprints. The paper demonstrated that m-grid with PV, WT, FC, and diesel has the highest LCOE and NPV, while the lowest cost was obtained for m-grid with PV, WT, FC, and natural gas fuel. The carbon capture and storage and carbon sequestration technologies were also discussed, which are among the key systems for realizing decarbonization. The paper provides deeper insights into the understanding of clean and unconventional energy resources.

Author Contributions

Conceptualization, D.A. and O.O.; methodology, D.A.; software, O.O.; validation, O.O.; formal analysis, O.O.; investigation, D.A.; resources, O.O.; data curation, D.A.; writing—original draft preparation, O.O.; writing—review and editing, D.A.; visualization, D.A.; supervision, O.O.; project administration. All authors have read and agreed to the published version of the manuscript.

Funding

This research received no external funding.

Data Availability Statement

The datasets generated during and/or analyzed during the current study are available from the corresponding author on reasonable request.

Acknowledgments

The authors acknowledge the Management of Olusegun Agagu University of Science and Technology, Okitipupa, Ondo State, Nigeria and Achievers University, Owo, Ondo State, Nigeria for providing a research-driven and conducive academic environment for conducting this research.

Conflicts of Interest

The authors declare no conflicts of interest.

Abbreviations

The following abbreviations are used in this manuscript:
FCsFuel Cells
gEGreen Energy
GHGsGreenhouse Gases
gLEGreen Low-Carbon Energy
GRPCGlobal Renewable Power Capacity
LELow-Carbon Energy
LOESPLoss of Energy Supply Probability
m-grdMicrogrid
NRELNational Renewable Energy Laboratory
R and DResearch and Development
SAMSystem Advisor Model
SaVSystem Availability

References

  1. Rozina Emmanuel, O.; Ahmad, M.; Duduyemi, A.; Ahmad, S.; Khan, A.; Esiaba, R.; Elekwachi, C. Valorization of waste seed oil from Cupressus macrocarpa L. for biodiesel production via green-synthesized iron oxide nanoparticles: A sustainable approach toward decarbonization. Next Energy 2025, 7, 100218. [Google Scholar] [CrossRef]
  2. Raman, A.; Altalbawy, F.M.A.; Ali, A.; Vora, T.; Alkhayyat, A.; Yogi, K.S.; Sapev, I.B.; Dhaliwal, A.S.; Singh, A.; Shafieezadeh, M.M. Enhancing net zero decarbonization strategies: A comparative analysis with the analytic hierarchy process. Int. J. Low-Carbon Technol. 2025, 20, 508–518. [Google Scholar] [CrossRef]
  3. Xu, X.; Wang, C.; Zhou, P. GVRP considered oil-gas recovery in refined oil distribution: Form an environmental perspective. Int. J. Prod. Econ. 2021, 235, 108078. [Google Scholar] [CrossRef]
  4. Gong, Q.; Wu, J.; Jiang, Z.; Hu, M.; Chen, J.; Cao, Z. An integrated design method for remanufacturing scheme considering carbon emission and customer demands. J. Clean. Prod. 2024, 476, 143681. [Google Scholar] [CrossRef]
  5. Xu, A.; Wang, W.; Zhu, Y. Does smart city pilot policy reduce CO2 emissions from industrial firms? Insights from China. J. Innov. Knowl. 2023, 8, 100367. [Google Scholar] [CrossRef]
  6. Wang, Z.; Sun, Y.; Kong, H. In-depth review of key technologies and pathways to carbon neutrality: Classification and assessment of decarbonization technologies. Carbon Neutrality 2025, 4, 15. [Google Scholar] [CrossRef]
  7. Davarpanah, A. Comparative evaluation of carbon capture, utilization, ans storage (CCUS) technologies using multi-criteria decision-making approaches. ACS Sustain. Chem. Eng. 2024, 12, 9498–9510. [Google Scholar] [CrossRef]
  8. Chen, Y.; Li, Q.; Liu, J. Innovating sustainability: VQA-based AI for carbon neutrality challenges. J. Organ. End User Comput. 2024, 36, 1–22. [Google Scholar] [CrossRef]
  9. Li, T.; Yu, L.; Ma, Y.; Duan, T.; Huang, W.; Zhou, Y.; Jin, D.; Li, Y.; Jiang, T. Carbon emissions of 5G mobile networks in China. Nat. Sustain. 2023, 6, 1620–1631. [Google Scholar] [CrossRef]
  10. Al Khaffaf, I.; Tamimi, A.; Ahmed, V. Pathways to carbon neutrality: A review of strategies and technologies across sectors. Energies 2024, 17, 6129. [Google Scholar] [CrossRef]
  11. Wang, F.; Harindintwali, J.D.; Yuan, Z.; Wang, M.; Wang, F.; Li, S.; Yin, Z.; Huang, L.; Fu, Y.; Li, L.; et al. Technologies and perspectives for achieving carbon neutrality. Innovation 2021, 2, 100180. [Google Scholar] [CrossRef]
  12. Sharma, V.K.; Monteleone, G.; Braccio, G.; Anyanwu, C.N.; Aneke, N.N. A comprehensive review of green energy technologies: Towards sustainable clean energy transition and global net-zero carbon emissions. Processses 2024, 13, 69. [Google Scholar] [CrossRef]
  13. Ullah, M.; Gutierrez-Rojas, D.; Inkeri, E.; Tynjala, T.; Nardelli, P.H.J. Operation of power-to-X-related processes based on advanced data-driven methods: A comprehensive review. Energies 2022, 15, 8118. [Google Scholar] [CrossRef]
  14. Palys, M.J.; Daoutidis, P. Power-to-X: A review and perspective. Comput. Chem. Eng. 2022, 165, 107948. [Google Scholar] [CrossRef]
  15. Skaaret, A. Power-to-X: Challenges and Possibilities in Project Development. Available online: https://www.southernlights.io/industry/what-is-power-to-x/ (accessed on 12 July 2025).
  16. Ognonnaya, C.; Abeykoon, C.; Damo, U.M.; Turan, A. The current and emerging renewable energy technologies for power generation in Nigeria: A review. Therm. Sci. Eng. Process 2019, 13, 100390. [Google Scholar] [CrossRef]
  17. Ang, Z.; Salem, M.; Kamarol, M.; Das, H.S.; Nazari, M.A.; Prabaharan, N. A comprehensive study of renewable energy sources: Classifications, challenges and suggestions. Energy Strategy Rev. 2022, 43, 100939. [Google Scholar] [CrossRef]
  18. Maheshwar, S.; Manglam, M.K.; Sinha, R.K. Advancements in renewable energy harvesting technologies for sustainable power generation. Tuijin Jishu J. Propuls. Technol. 2023, 44, 1371–1377. [Google Scholar]
  19. Esan, O.C.; Anthony, E.; Obaseki, O. Utilization of renewable energy for improved power generation in Nigeria. J. Phys. Conf. Ser. 2019, 1299, 012026. [Google Scholar] [CrossRef]
  20. Kiehbadroudinezhad, M.; Hosseinzadeh-Bandbafha, H.; Rosen, M.A.; Kumar, V. The role of energy security and resilience in the sustainability of green microgrids: Paving the way to sustainable and clean production. Sustain. Energy Technol. Assess. 2023, 60, 103485. [Google Scholar] [CrossRef]
  21. Tatar, M.; Akulker, H.; Sildir, H.; Aydin, E. Optimal design and operation of integrated microgrids under intermittent renewable energy sources coupled with green hydrogen and demand scenarios. Int. J. Hydrogen Energy 2022, 47, 27848–27865. [Google Scholar] [CrossRef]
  22. Mewafy, A.; Ismael, I.; Kaddah, S.S.; Hu, W.; Chen, Z.; Abulanwar, S. Optimal design of multiuse hybrid microgrids power by green hydrogen–ammonia. Renew. Sustain. Energy Rev. 2024, 192, 114174. [Google Scholar] [CrossRef]
  23. Ram, K.; Chand, S.S.; Prasad, R.; Mohammadi, A.; Cirrincione, M. Microgrids for green hydrogen production for fuel cell buses—A techno-economic analysis for Fiji. Energy Convers. Manag. 2024, 300, 117928. [Google Scholar] [CrossRef]
  24. Zhai, Y.; He, Y.; Shao, J.; Zhang, W.; Tong, X.; Wang, Z.; Weng, W. Review of hydrogen-driven power-to-X technology and application status in China. Processes 2024, 12, 1518. [Google Scholar] [CrossRef]
  25. Marvin, M.K.; Sarkinbaka, Z.M. A review of power-to-X and its prospects for integration in Nigeria’s energy transition plan. Sustain. Energy Res. 2024, 11, 34. [Google Scholar] [CrossRef]
  26. Kilic, H. Improving the performance of microgrid-based Power-to-X systems through optimization of renewable hydrogen generation. Int. J. Hydrogen Energy 2024, 75, 106–120. [Google Scholar] [CrossRef]
  27. Quizhpe, K.; Arevalo, P.; Ochoa-Correa, D.; Villa-Avila, E. Optimizing microgrid planning for renewable integration in power systems: A comprehensive review. Electronics 2024, 13, 3620. [Google Scholar] [CrossRef]
  28. Daiyan, R.; MacGill, I.; Amal, R. Opportunities and challenges of renewable power-to-X. ACS Energy Lett. 2020, 5, 3843–3847. [Google Scholar] [CrossRef]
  29. REN 21 Global Reneable Energy Status 2025. Available online: https://www.ren21.net/wp-content/uploads/2019/05/25-1395_GO_2025_Full_Report_13opt.pdf (accessed on 2 August 2025).
  30. Hassan, Q.; Viktor, P.; Al-Musawi, T.J.; Ai, B.M.; Algburi, S.; Alzoubi, H.M.; Al-Jiboory, A.K.; Sameen, A.Z.; Salman, H.M.; Jaszczur, M. The renewable energy role in the global energy transformations. Renew. Energy Focus 2024, 48, 100545. [Google Scholar] [CrossRef]
  31. Henrysson, M.; Swain, R.B.; Swain, A.; Nerini, F.F. Sustainable development goals and wellbeing for resilient societies: Shocks and recovery. Humanit. Soc. Sci. Commun. 2024, 11, 1513. [Google Scholar] [CrossRef]
  32. Jaysawal, R.K.; Chakraborty, S.; Elangovan, D.; Padmanaban, S. Concept of net zero energy buildings (NZEB)—A literature review. Clean. Eng. Technol. 2022, 11, 100582. [Google Scholar] [CrossRef]
  33. IEA. Net Zero by 2050: A Roadmap for the Global Energy Sector. Available online: https://www.iea.org/reports/net-zero-by-2050#overview (accessed on 26 June 2025).
  34. Lou, H.; Hsieh, S. Towards zero: A review on strategies in achieving net-zero-energy and net-zero-carbon buildings. Sustainability 2024, 16, 4735. [Google Scholar] [CrossRef]
  35. Zheng, X.; Streimikiene, D.; Balezentis, T.; Mardani, A.; Cavallaro, F.; Liao, H. A review of greenhouse gas emission profiles, dynamics, and climate change mitigation efforts across the key climate change players. J. Clean. Prod. 2019, 234, 1113–1133. [Google Scholar] [CrossRef]
  36. Cholewa, T.; Semmel, M.; Mantei, F.; Güttel, R.; Salem, Q. Process intensification strategies for power-to-x technologies. Chem. Eng. 2022, 6, 13. [Google Scholar] [CrossRef]
  37. Candelaresi, D.; Spazzafumo, G. The power-to-fuel concept. In Power to Fuel; Academic Press: Cambridge, MA, USA, 2021; pp. 1–15. [Google Scholar]
  38. Sterner, M.; Specht, M. Power-to-gas and power-to-x—The history and results of developing a new storage concept. Energies 2021, 14, 6594. [Google Scholar] [CrossRef]
  39. Davidson, F.T.; Nagasawa, K.; Webber, M.E. Electrofuel. Mech. Eng. 2017, 139, 30–35. [Google Scholar] [CrossRef]
  40. Cigolotti, V.; Genovese, M.; Fragiacomo, P. Comprehensive review on fuel cell technology for stationary applicationsas sustainable and efficient poly-generation energy systems. Energies 2021, 14, 4963. [Google Scholar] [CrossRef]
  41. Hank, C.; Sternberg, A.; Köppel, N.; Holst, M.; Smolinka, T.; Schaadt, A.; Hebling, C.; Henning, H.M. Energy efficiency and economic assessment of imported energy carriers based on renewable electricity. Sustain. Energy Fuels 2020, 4, 2256–2273. [Google Scholar] [CrossRef]
  42. Raji, A.A.; Adejumobi, I.A.; Orimolade, J.F.; Amusa, K.A.; Olabode, O.E. Effect of training overhead on the performance of millimeter wave channel estimation models. Univ. Pitesti Sci. Bull. Electron. Comput. Sci. 2024, 24, 1–10. [Google Scholar]
  43. Akinyele, D.O.; Rayudu, R.K. Review of energy storage technologies for sustainable power networks. Sustain. Energy Technol. Assess. 2014, 8, 74–91. [Google Scholar] [CrossRef]
  44. Akinyele, D.O.; Olabode, O.E.; Opeyemi, D.A. Modelling and simulation of microgrid system with photovoltaic and biogas co-fired power generating sources for commercial application. In Photovoltaic Materials: Synthesis, Characterizations, and Applications; CRC Press, Taylor and Francis: Boca Raton, FL, USA, 2025; In Press. [Google Scholar]
  45. Panchawadkar, D. Review of Opportunities to Valorise the Oxygen Generated from Water Electrolysis. Master’s Thesis, KTH Royal Institute of Technology, Stockholm, Sweden, 2024; pp. 1–58. [Google Scholar]
  46. Assessment of Green Hydrogen for Industrial Heat. 2023. Available online: https://www.renewablethermal.org/wp-content/uploads/2018/06/Assessment-of-Green-Hydrogen-for-Industrial-Heat.pdf (accessed on 7 July 2024).
  47. Power-to-X: Transforming Renewable Energy for a Sustainable Future. Available online: https://www.greengoenergy.com/power-to-x (accessed on 8 July 2025).
  48. Power-to-X: Bridging the Gap for a Sustainable Energy Future. Available online: https://www.powerpartners-awi.com/power-to-x-bridging-the-gap-for-a-sustainable-energy-future/ (accessed on 8 July 2025).
  49. Budt, M.; Wolf, D.; Span, R.; Yan, J. A review on compressed air energy storage: Basic principles, past milestones and recent developments. Appl. Energy 2016, 170, 250–268. [Google Scholar] [CrossRef]
  50. Mosca, L.; Palo, E.; Colozzi, M.; Iaquaniello, G.; Salladini, A.; Taraschi, S. Hydrogen in chemical and petrochemical industry. In Current Trends and Future Developments on (Bio-) Membranes; Elsevier: Amsterdam, The Netherlands, 2020; pp. 387–410. [Google Scholar]
  51. Olabode, O.E.; Ayantunji, O.D.; Nwagbara, V.U. Performance evaluation of reactive power compensation of tcsc and svc on voltage profile enhancement and power system loss minimization using firefly algorithm. Int. J. Sci. Eng. Res. 2017, 8, 1514–1519. [Google Scholar]
  52. Dahiru, A.R.; Vuokila, A.; Huuhtanen, M. Recent development in power-to-x: Part I—A review on techno-economic analysis. J. Energy Storage 2020, 56, 105861. [Google Scholar] [CrossRef]
  53. Glenk, G.; Reichelstein, S. Economics of converting renewable power to hydrogen. Nat. Energy 2019, 4, 216–222. [Google Scholar] [CrossRef]
  54. Li, Y.; Guan, B.; Guo, J.; Chen, Y.; Ma, Z.; Zhuang, Z.; Zhu, C.; Dang, H.; Chen, L.; Shu, K.; et al. Renewable synthetic fuels: Research progress and development trends. J. Clean. Prod. 2024, 450, 141849. [Google Scholar] [CrossRef]
  55. Doğan, A.; Yüksel, G.; Uğur, A.; Boy, M.; Kayabaş, E.; Demirsöz, R. Synthetic fuels as a cornerstone of net-zero emissions: A review of production methods and future prospects. DCE Doğa Bilimleri Dergisi 2025, 5, 113–131. [Google Scholar]
  56. Li, S.; Jin, H.; Gao, L.; Zhang, X.; Ji, X. Techno-economic performance and cost reduction potential for the substitute/synthetic natural gas and power cogeneration plant with CO2 capture. Energy Convers. Manag. 2014, 85, 875–887. [Google Scholar] [CrossRef]
  57. Audi E-Gas Project, Germany. Available online: https://www.power-technology.com/marketdata/audi-e-gas-project-germany/ (accessed on 29 July 2025).
  58. Norsk E-Fuel; Project Scaling Production to Make Aviation Sustainable. Available online: https://www.norsk-e-fuel.com/projects (accessed on 29 July 2025).
  59. Carlsson, I.Y. World’s First Commercial-Scale E-Methanol Plant Opens in Denmark. 2025. Available online: https://www.reuters.com/sustainability/climate-energy/worlds-first-commercial-scale-e-methanol-plant-opens-denmark-2025-05-13/ (accessed on 29 July 2025).
  60. Advances in Renewable Energy and the Rise of Green Hydrogen in Spain. Available online: https://www.moeveglobal.com/en/planet-energy/green-energy/spain-renewable-energy-transition-green-hydrogen (accessed on 29 July 2025).
  61. World’s First Commercial CO2 to Methanol Plant. Available online: https://repository.gatech.edu/entities/publication/57082baa-0389-433c-ad95-e2402d0f450e (accessed on 29 July 2025).
  62. Valluri, S.; Claremboux, V.; Kawatra, S. Opportunities and challenges in CO2 utilization. J. Environ. Sci. 2022, 113, 322–344. [Google Scholar] [CrossRef]
  63. Bridge, G.; Özkaynak, B.; Turhan, E. Energy infrastructure and the fate of the nation: Introduction to special issue. Energy Res. Soc. Sci. 2018, 41, 1–11. [Google Scholar] [CrossRef]
  64. Segovia-Hernández, J.G. Advancing E-fuels production through process intensification: Overcoming challenges and seizing opportunities for a sustainable energy future—A critical review. Chem. Eng. Process.-Process Intensif. 2025, 208, 110107. [Google Scholar] [CrossRef]
  65. Prajapati, S.K.; Choudhary, S.; Kumar, V.; Dayal, P.; Srivastava, R.; Gairola, A.; Borate, R.B. Carbon sequestration: A key strategy for climate change mitigation towards a sustainable future. Emerg. Trends Clim. Change 2023, 2, 1–14. [Google Scholar]
  66. Lønborg, C.; Carreira, C.; Jickells, T.; Álvarez-Salgado, X.A. Impacts of global change on ocean dissolved organic carbon (DOC)cycling. Front. Mar. Sci. 2020, 7, 466. [Google Scholar] [CrossRef]
  67. Ma, T.; Wang, T.; Yang, D.; Yang, S. Impacts of vegetation restoration on water resources and carbon sequestration in the mountainous area of Haihe Riverbasin, China. Sci. Total Environ. 2023, 869, 161724. [Google Scholar] [CrossRef]
  68. Zhang, Z.; Wan, X.; Sheng, K.; Sun, H.; Jia, L.; Peng, J. Impact of carbon sequestration by terrestrial vegetation on economic growth: Evidence from Chinese country satellite data. Sustainability 2023, 15, 1369. [Google Scholar] [CrossRef]
  69. Bai, Y.; Cotrufo, M.F. Grassland soil carbon sequestration: Current understanding, challenges, and solutions. Science 2022, 377, 603–608. [Google Scholar] [CrossRef]
  70. Jung, S.; Park, Y.; Kwon, E.E. Strategic use of biochar for CO2 capture and sequestration. J. CO2 Util. 2019, 32, 128–139. [Google Scholar] [CrossRef]
  71. Saraf, S.; Bera, A. Carbon dioxide injection for enhanced oil recovery and underground storage to reduce greenhouse gas. In Green Sustainable Process for Chemical and Environmental Engineering and Science; Elsevier: Amsterdam, The Netherlands, 2023; pp. 149–176. [Google Scholar]
  72. Raza, A.; Glatz, G.; Gholami, R.; Mahmoud, M.; Alafnan, S. Carbon mineralization and geological storage of CO2 in basalt: Mechanisms and technical challenges. Earth-Sci. Rev. 2022, 229, 104036. [Google Scholar] [CrossRef]
  73. Biochar: Essential in Carbon Dioxide Removal Portfolios. Available online: https://www.weforum.org/stories/2023/11/biochar-carbon-removals-jack-of-all-trades-for-immediate-climate-action/ (accessed on 29 July 2025).
  74. Sodiq, A.; Abdullatif, Y.; Aissa, B.; Ostovar, A.; Nassar, N.; El-Naas, M.; Amhamed, A. A review on progress made in direct air capture of CO2. Environ. Technol. Innov. 2023, 29, 102991. [Google Scholar] [CrossRef]
  75. Carbon Capture and Storage in the United States. Available online: https://www.cbo.gov (accessed on 30 July 2025).
  76. Australia’s Carbon Sequestration Potential. Available online: https://research.csiro.au/tnz/australias-carbon-sequestration-potential/ (accessed on 30 July 2025).
  77. Ababneh, H.; Hameed, B.H. Electrofuels as emerging new green alternative fuel: A review of recent literature. Energy Convers. Manag. 2022, 254, 115213. [Google Scholar] [CrossRef]
  78. Nemmour, A.; Inayat, A.; Janajreh, I.; Ghenai, C. Green hydrogen-based e-fuels (E-methane, E-methanol, E-ammonia) to support clean energy transition: A literature review. Int. J. Hydrogen Energy 2023, 48, 29011–29033. [Google Scholar] [CrossRef]
  79. E-Methanol: A Game Changer for Decarbonising Heavy Transport and Industry. Available online: https://europeanenergy.com/wp-content/uploads/2025/02/e-methanol-a-game-changer-for-decarbonising-heavy-transport-and-industry-2.pdf (accessed on 31 July 2025).
  80. Souissi, N. E-Diesel in the Shipping Sector: Prospects and Challenges. Master’s Thesis, Oxford Institute for Energy Studies, Oxford, UK, 2024; pp. 1–28. [Google Scholar]
  81. Okelola, M.O.; Olabode, O.E. Application of root mean square and adaptive neuro-fuzzy inference system for power quality events classification using electrical and electronics home appliances as case study. IOSR J. Electr. Electron. Eng. 2018, 13, 15–23. [Google Scholar]
  82. Ellis, T.; Gerrish, R.; Michel, G. E-fuels: A challenging journey to a low-carbon future. Available online: https://www.spglobal.com/ratings/en (accessed on 15 July 2024).
  83. Olabode, O.E.; Arowolo, O.A.; Arowolo, M.P. A comparative application of shunt capacitor and load tap—Changing transformer (LTCT) to the optimal economic dispatch of generation on Nigerian 330kV, 24-bus grid system. Int. J. Sci. Eng. Res. 2017, 8, 1017–1023. [Google Scholar]
  84. Winton, N. Germany Wins European E-Fuels Concession; Nothing Much Changes. 2023. Available online: https://www.forbes.com/sites/neilwinton/2023/03/30/germany-wins-european-e-fuels-concession-nothing-much-changes/ (accessed on 31 July 2025).
  85. E-Fuel Alliance: First Steps: German Government and EU Commission Agreed on eFuels for New Vehicles. Available online: https://www.efuel-alliance.eu/fileadmin/Downloads/Pressemitteilungen_2023/20230325_PM_eFuel_COM_Agreement_final_EN_JW.pdf (accessed on 31 July 2025).
  86. Driving the Transition to Renewable Aviation. Available online: https://www.norsk-e-fuel.com/ (accessed on 31 July 2025).
  87. Norwegian Becomes Co-Owner of Norsk E-Fuel. Available online: https://media.uk.norwegian.com/pressreleases/norwegian-becomes-co-owner-of-norsk-e-fuel-3297613 (accessed on 31 July 2025).
  88. eFuels Pilot Plant in Chile Officially Opened. Available online: https://newsroom.porsche.com/en/2022/company/porsche-highly-innovative-fuels-hif-opening-efuels-pilot-plant-haru-oni-chile-synthetic-fuels-30732.html (accessed on 31 July 2025).
  89. Japan’s Road Map for Fuel Ammonia. Available online: https://ammoniaenergy.org/articles/japans-road-map-for-fuel-ammonia/ (accessed on 31 July 2025).
  90. Jameel, M.K.; Mustafa, M.A.; Ahmed, A.S.; Mohammed, A.J.; Ghazy, H.; Shakir, M.N.; Lawas, A.M.; Mohammed, S.K.; Idan, A.H.; Mahmoud, Z.H.; et al. Biogas: Production, properties, applications, economic and challenges: A review. Results Chem. 2024, 7, 101549. [Google Scholar] [CrossRef]
  91. Silva, J.; Gonclaves, J.C.; Rocha, C.; Vilaca, J.; Madeira, L.M. Biometane production from biogas obtained in wastewater treatment plants: Process optimization and economic analysis. Renew. Energy 2024, 220, 119469. [Google Scholar] [CrossRef]
  92. Man Energy. Power-to-X Solutions. Available online: https://www.man-es.com (accessed on 30 June 2025).
  93. System Advisor Model. Available online: https://sam.nrel.gov/ (accessed on 24 June 2025).
  94. Dobos, A.P. PVWAtts Version 5 Manual; Technical Report: NREL/TP-6A20-62641; National Renewable Energy Laboratory: Golden, CO, USA, 2014. Available online: www.nrel.gov/publications (accessed on 30 November 2024).
  95. Fuentes, M.K. A Simplified Thermal Model for Flat-Plate Photovoltaic Arrays; SAND85-0330; Sandia National Laboraties: Albuquerque, NM, USA, 1987. [Google Scholar]
  96. Deshmukh, M.K.; Deshmukh, S.S. Modeling of hybrid renewable energy systems. Renew. Sustain. Energy Rev. 2008, 23, 5–249. [Google Scholar] [CrossRef]
  97. Diaf, S.; Belhamel, M.; Haddadi, M.; Louche, A. Technical and economic assessment of hybrid photovoltaic/wind system with battery storage in Corsica island. Energy Policy 2008, 36, 754. [Google Scholar] [CrossRef]
  98. Kaabeche, A.; Belhamel, M.; Ibtiouen, R. Techno-economic valuation and optimization of integrated photovoltaic/wind energy conversion system. Sol. Energy 2011, 85, 2407–2420. [Google Scholar] [CrossRef]
  99. Akinyele, D. Techno-economic design and performance analysis of nanogrid systems for households in energy-poor villages. Sustain. Cities Soc. 2017, 34, 335–357. [Google Scholar] [CrossRef]
  100. Freeman, J.; Gilman, P.; Jorgenson, J.; Ferguson, T. Reference Manual for the System Advisor Model’s Wind Performance Model; NREL/TP-6A20-60570; National Renewable Energy Laboratory: Golden, CO, USA, 2014. [Google Scholar]
  101. Ghenai, C.; Salameh, T.; Merabet, A. Techno-economic analysis of off-grid solar PV/fuel cell energy system for residential community in desert region. Int. J. Hydrogen Energy 2020, 45, 11460–11470. [Google Scholar] [CrossRef]
  102. Yuksel, O.; Blanco-Davis, E.; Spiteri, A.; Hitchmough, D.; Shagar, V.; Di Piazza, M.C.; Pucci, M.; Tsoulakos, N.; Armin, M.; Wang, J. Optimising the design of a hybrid fuel cell/battery and waste heat recovery system for retrofitting ship power generation. Energies 2025, 18, 288. [Google Scholar] [CrossRef]
  103. Akinyele, D.O.; Rayudu, R.K.; Nair, N.K.C. Grid-independent renewable energy solutions for residential use: The case of an off-grid house in wellington, New Zealand. In Proceedings of the IEEE PES Asia-Pacific Power and Energy Engineering Conference (APPEEC), Brisbane, QLD, Australia, 15–18 November 2015; pp. 1–5. [Google Scholar]
  104. Khatib, T.; Mohamed, A.; Sopina, K.; Mahmoud, M. A new approach for optimal sizing of stand-alone photovoltaic systems. Int. J. Photoenergy 2012, 2012, 391213. [Google Scholar] [CrossRef]
  105. Posadillo, R.; Lopez Luque, R. A sizing method for stand-alone PV installations with variable demand. Renew. Energy 2008, 33, 1049–1055. [Google Scholar] [CrossRef]
  106. Shen, W.X. Optimally sizing of solar array and battery in a stand-alone photovoltaic system in Malaysia. Renew. Energy 2009, 34, 348–352. [Google Scholar] [CrossRef]
  107. Short, W.; Packey, D.J.; Holt, T. Manual for the Economic Evalaution of Energy Efficiency and Renewable Energy Technologies; NREL/TP-462-5173; National Renewable Energy Laboratory: Golden, CO, USA, 1995; pp. 39–42. Available online: http://www.nrel.gov/docs/legosti/old/5173.pdf (accessed on 28 August 2025).
  108. Energy Education. Diesel Generator. Available online: https://energyeducation.ca/encyclopedia/Diesel_generator#:~:text=This%20mechanical%20energy%20then%20rotates,gasoline%2C%20wood%20gas%20and%20diesel (accessed on 29 June 2025).
  109. Paul, U.; Hasan, M.M.; Labib, L.; Roy, N.K. Optimal design of hybrid microgrids for readymade garments industry of Bangladesh: A case study. In Proceedings of the 3rd International Conference on Electrical Information and Communication Technology (EICT), Khulna, Bangladesh, 7–9 December 2017. [Google Scholar]
  110. EIA. How Much Coal, Natural Gas, or Petroleum Is Used to Generate a Kilowatthour of Electricity? Available online: https://eia.gov/tools/faqs/faq.php?id=667&t=6 (accessed on 2 July 2025).
  111. Emission Factor for Fuels. Available online: https://cultureforclimate.scot/services/environmental-reporting/guidance-for-reporting-organisations/emission-factors (accessed on 3 July 2025).
  112. Natural Resources Canada. Learn the Facts: Fuel Consumption and CO2. Available online: https://natural-resources.canada.ca (accessed on 3 July 2025).
  113. Green H2 to Undercut Gray Sibling by End of Decade. Available online: https://about.bnef.com/insights/clean-energy/green-hydrogen-to-undercut-gray-sibling-by-end-of-decade/ (accessed on 4 July 2025).
  114. DOE Sets Eyes on Cutting Clean Hydrogen Cost, $/kg by 2030. Available online: https://carboncredits.com/doe-sets-eyes-on-cutting-clean-hydrogen-cost-1-kilo-by-2031/ (accessed on 4 July 2025).
  115. Alternative Fuels Data, US DOE, Office of Energy Efficiency and Renewable Energy. Available online: https://afdc.energy.gov/fuels/prices.html (accessed on 4 July 2025).
  116. How Much Does Natural Gas Cost? Available online: https://www.chooseenergy.com/data-center/natural-gas-rates-by-state/ (accessed on 4 July 2025).
  117. Lee, Y.; Lee, M.C.; Kim, Y.J. Barriers and strategies of hydrogen fuel cell power generation based on expert survey in South Korea. Int. J. Hydrogen Energy 2022, 47, 5709–5719. [Google Scholar] [CrossRef]
  118. Castillo, O.; Alvarez, R.; Domingo, R. Opportunities and barriers of hydrogen-electric hybrid power-n-train vans: A systematic literature review. Processes 2020, 8, 1261. [Google Scholar] [CrossRef]
  119. Kumar, P.; Britter, R.; Gupta, N. Hydrogen fuel: Opportunities and barriers. J. Electrochem. Energy Convers. Storage 2009, 6, 021009. [Google Scholar] [CrossRef]
  120. US DOE. Cost of Solar Module. Available online: https://www.tesla.com/learn/solar-panel-cost-breakdown (accessed on 26 August 2025).
  121. Solar Inverter Cost. Available online: https://www.solarharmonics.com/solar-inverters-how-much-do-solar-inverters-cost/ (accessed on 26 August 2025).
  122. Fuel Cell Cost. Available online: https://www.horizoneducational.com (accessed on 26 August 2025).
  123. Generator Cost. Available online: https://www.absolutegenerators.com/american-built/watts/10-kw-15-kw?srsltid=AfmBOoq8X5utaxUn-9plwZBt4c0Drco2JDD3_z0CBmS_EYY8AwtTkGKu (accessed on 26 August 2025).
  124. Enspire Energy Conversion Calculator. Available online: https://www.enspireenergy.com (accessed on 27 August 2025).
  125. USEIA Btu. Available online: https://www.eia.gov (accessed on 27 August 2025).
  126. Gasoline Converter. MMBtu to Gasoline Liter. Available online: https://hextobinary.com (accessed on 27 August 2025).
  127. MMBtu Trade Remedies Service. Available online: https://www.trade-remedies.service.gov.uk (accessed on 29 August 2025).
  128. Saddari, N.; Derkyi, N.S.A.; Peprah, F.; Gyamfi, S.; Donkor, G.K. Techno-economic and environmental assessment of grid and solar photovoltaic microgrid supply options for isolated off-grid rural communities toward sustainable and affordable electricity in Nkoranza South, Bono East, Ghana. Results Eng. 2025, 25, 103915. [Google Scholar] [CrossRef]
  129. Zaidi, S.S.; Zaidi, S.S.H.; Khan, B.M.; Moin, L. Optimal designing of grid-connected microgrid systems for residential and commercial applications in Pakistan. Helyon 2023, 9, e17990. [Google Scholar] [CrossRef]
  130. Savas, A.; Sener, R.; Uslu, S.; Der, O. Experimental study on performance and emission optimization of MgO nanoparticle-enriched 2nd generation biodiesel: A method for employing nanoparticles to improve cleaner diesel combustion. J. Energy Inst. 2025, 120, 102024. [Google Scholar] [CrossRef]
  131. Aikhuele, D.O.; Ighravwe, D.E.; Akinyele, D. Evaluation of renewable energy technology based on reliability attributes using hybrid fuzzy dynamic decision-making model. Technol. Econ. Smart Grids Sustain. Energy 2019, 4, 16. [Google Scholar] [CrossRef]
  132. Monyei, C.G.; Viriri, S.; Adewumi, A.; Davidson, I.; Akinyele, D. A smart grid framework for optimally integrating supply-side, demand-side and transmission line management systems. Energies 2018, 11, 1038. [Google Scholar] [CrossRef]
  133. Aikhuele, D.O.; Ighravwe, D.E.; Akinyele, D.O. Hybrid fuzzy dynamic model for the evaluation of energy aggregation strategy. Process Integr. Optim. Sustain. 2022, 6, 931–941. [Google Scholar] [CrossRef]
Figure 1. Block diagram of power-to-X from feedstock to end-use.
Processes 13 03028 g001
Figure 2. Block diagram of power-to-fuel to produce synthetic fuels.
Processes 13 03028 g002
Figure 3. Conceptual microgrid system with multi-energy resources. (a) Hybrid system with PV/WT/FC and Gen plant with hydrogen, (b) PV/WT/FC and Gen plant with hydrogen, biogas, and biomethane resources.
Processes 13 03028 g003aProcesses 13 03028 g003b
Figure 4. (a) Daily average load profile. (b) Monthly energy consumption of the commercial building.
Processes 13 03028 g004
Figure 5. Electric load data input in the SAM environment.
Processes 13 03028 g005
Figure 6. The average solar irradiance data for the study.
Processes 13 03028 g006
Figure 7. Wind speed data for the study.
Processes 13 03028 g007
Figure 8. Power-speed characteristics of the Evoco 10 kW wind turbine.
Processes 13 03028 g008
Figure 9. The energy mix in the microgrid based on PV, wind, fuel cells, and a generic plant.
Processes 13 03028 g009
Figure 10. PV capacity with system losses.
Processes 13 03028 g010
Figure 11. (a) Hybrid energy system capacity in the SAM environment. (b) Energy demand and the total energy generation by the microgrid.
Processes 13 03028 g011
Figure 12. Different energy demand levels for sensitivity analysis.
Processes 13 03028 g012
Figure 13. (a) Energy demand and the total energy generation by the microgrid for case 1. (b) Energy demand and the total energy generation by the microgrid for case 2. (c) Energy demand and the total energy generation by the microgrid for case 3.
Processes 13 03028 g013aProcesses 13 03028 g013b
Figure 14. Capacities of the different energy technologies in the microgrid for different cases.
Processes 13 03028 g014
Figure 15. (a) Energy demand and the new energy generation by the microgrid to address the reliability issue in case 1. (b) Energy demand and the new energy generation by the microgrid to address the reliability issue in case 2. (c) Energy demand and the new energy generation by the microgrid to address the reliability issue in case 3.
Processes 13 03028 g015
Figure 16. (a) The energy mix in the microgrid based on PV, wind, fuel cells, and generic plant for case 4. (b) The energy mix in the microgrid based on PV, wind, fuel cells, and generic plant for case 5. (c) The energy mix in the microgrid based on PV, wind, fuel cells, and generic plant for case 6.
Processes 13 03028 g016
Figure 17. Hydrogen gas consumed by the fuel cells.
Processes 13 03028 g017
Figure 18. Diesel fuel consumed by the generic power plant.
Processes 13 03028 g018
Figure 19. Natural gas consumed by the generic power plant.
Processes 13 03028 g019
Figure 20. Gasoline consumed by the generic power plant.
Processes 13 03028 g020
Figure 21. Emissions by the generic power plant when operating on diesel.
Processes 13 03028 g021
Figure 22. Emissions by the generic power plant when operating on natural gas.
Processes 13 03028 g022
Figure 23. Emissions by the generic power plant when operating on gasoline.
Processes 13 03028 g023
Figure 24. Cost of hydrogen gas consumed.
Processes 13 03028 g024
Figure 25. Cost of diesel consumed.
Processes 13 03028 g025
Figure 26. Cost of natural gas consumed.
Processes 13 03028 g026
Figure 27. Cost of gasoline consumed.
Processes 13 03028 g027
Figure 28. Proposed multi-energy-based microgrid policy framework.
Processes 13 03028 g028
Table 1. Comparison of different forms of power-to-X technology.
S/No.Forms of Power-to-X TechnologyPrinciple InvolvedBy-ProductsAreas of ApplicationRoles in Power Transition and Environmental Sustainability
1.Power-to-GasElectrolysis of water powered by renewable energy to produce hydrogen.Methane,
syngas
Carbon-neutral fuel for transportation(i). Clean energy transition
(ii). Industrial heating applications
2.Power-to-LiquidsProduction of green hydrogen via electrolysis.
Production of carbon feedstock from captured and stored CO2,
synthesis of green hydrogen to produce liquid fuels.
E-diesel,
e-kerosene, methanol
Aviation, shipping, and heavy transportAlternative fuel to decarbonize transportation industries
3.Power-to-HeatRenewable energy resources such as solar and wind are employed to generate heat from water.Heat energy (i). Decarbonization of the industrial heating process
(ii). Energy transition
4.Power-to-ChemicalsThe green hydrogen produced during electrolysis is synthesized with captured CO2, which is consequently fed into the chemical process.Fertilizers, plastics(i). Production of ammonia for fertilizer development
(ii). Ammonia salt for industrial processes
(i). Expanded use of renewable energy
(ii). Industrial application
Table 2. Direct cost of PV power subsystem.
S/No.Parameter Initial CaseCase 4Case 5Case 6
1PV capacity (kWdc)17.326.439.151.8
2Array cost ($)47,374.6072,473107,134141,795
3Inverter cost ($)3112.20476161208100
4Balance of system equipment cost ($)9474.9244,494.6021,426.828,359
5Installation labor cost ($)4737.467247.3010,713.4014,179.5
6Installer margin and overhead cost ($)2368.733623.655356.707089.75
7Subtotal ($)67,067.91102,599.55150,750.90199,523.25
8Contingency ($)3353.465129.987537.559976.16
9Total direct cost ($)70,421.31107,729.53158,288.45209,499.41
10Total installed cost of PV power subsystem ($)70,421.31107,729.53158,288.45209,499.41
11Total installed cost per capacity ($/Wdc)4.074.05
S/No.O and M Cost ParametersInitial CaseCase 4Case 5Case 6
1Fixed annual cost ($/yr)10
2Fixed cost by capacity ($/kW-yr)22
3Inflation/escalation rate (%)5
Table 3. Direct cost of wind power subsystem.
S/No.Direct Cost Parameters Initial CaseCase 4Case 5Case 6
1Wind farm power capacity (kW)20304040
2Number of turbines in the farm2344
3Turbine cost ($/kW)2781278127812781
4Balance of system cost ($/kW)3633363336333633
5Total turbine cost ($)55,62083,430111,240111,240
6Total balance of system cost ($)72,660108,990145,320145,320
7Total direct cost ($)128,280192,420256,560256,560
8Total installed cost of wind power subsystem ($)128,280192,420256,560256,560
9Total installed cost per capacity ($/W)6.41
S/No.O and M Cost ParametersInitial CaseCase 4Case 5Case 6
1Fixed annual cost ($/yr)18
2.Fixed cost by capacity ($/kW-yr)39
3Inflation/escalation rate (%)5
Table 4. Direct cost of fuel cell power subsystem.
S/No.Direct Cost Parameters Initial CaseCase 4Case 5Case 6
1Fuel cell power capacity (kW)254575105
2Fuel cell stack cost ($/kWac)1500150015001500
3Total cost of fuel cell stacks ($)37,50067, 500112, 500157,500
3Balance of system cost ($/kW)750013,50022,50031,500
4Installation labor cost ($)3750675011,25015,750
5Installer margin and overhead cost ($)1875337556257875
6Subtotal ($)50,62591,125151,875212,625
7Contingency ($)656.251181.251968.752756.25
8Total direct cost ($)51,281.2592,306. 25153,843.75215,381.25
9Total installed cost of wind power subsystem ($)51,281.2592,306.25153,843.75215,381.25
10Total installed cost per capacity ($/Wac)2.05
S/No.O and M Cost ParametersInitial CaseCase 4Case 5Case 6
1Fixed annual cost ($/yr)20
2Operating cost by capacity ($/kW-yr)27
3Fuel cost ($/MCf)11.82
4Inflation/escalation rate 5
Table 5. Direct cost of battery storage subsystem.
S/No.Direct Cost ParametersInitial CaseCase 4Case 5Case 6
1Battery pack capacity (kWh)1096.72193.53291.34338.1
2Battery power (kW)104208.3312.5416.7
3Battery cost/capacity ($/kWdc)184184184184
4Battery cost/kW ($/kWdc)667667667667
5Battery direct cost ($)271,150.92542,524.12814,065.251,085,327.31
6Contingency ($)13,557.5527,126.240,703.2654,266.37
8Total direct cost ($)284,708.46569,650.32854,768.511,139,593.67
9Total installed cost of battery storage subsystem ($)284,708.46569,650.32854,768.511,139,593.67
10Total installed cost per capacity ($/Wac)2.85
S/No.O and M Cost ParametersInitial CaseCase 4Case 5Case 6
1Fixed annual cost ($/yr)20
2Fixed cost by capacity ($/kWac)5.25
3Replacement cost ($/kWac)280
4Inflation/escalation rate 5
Table 6. Direct cost of generic/custom generating power subsystem.
S/No.Direct Cost Parameters Initial CaseCase 4Case 5Case 6
1Nameplate capacity (kW)10273750
2Generating plant cost ($)450012, 15016, 65022,500
3BOS and other costs ($)157543205827.57875
4Plant cost per capacity ($/Wac)0.610.610.610.61
5Direct plant cost ($)610016, 47022,57030,500
6Contingency ($)530143119612650
8Total direct cost ($)11,13030,05141,18155,650
9Total installed cost of generic power subsystem ($)11,13030,05141,18155,650
10Total installed cost per capacity ($/Wac)1.111.111.111.11
S/No.O and M Cost ParametersInitial CaseCase 4Case 5Case 6
1Fixed operating cost ($/yr)50
2Fixed cost by capacity ($/kWac)43
3Fossil fuel cost ($/MMBtu)48.28 (Diesel), 14.55 (Natural gas), 24.94 (Gasoline)
4Inflation/escalation rate 5
Table 7. (a) Overall project cost metrics for initial case and case 4. (b) Overall project cost metrics for case 5 and case 6.
(a)
S/No.Parameters (Initial Case)PV, WT, FC, and Gen Running on DieselPV, WT, FC, and Gen Running on GasolinePV, WT, FC, and Gen Running on Natural Gas
1LCOE (nominal) (cents/kWh)58.8245.9740.25
2LCOE (real) (cents/kWh)47.7537.3232.67
3Hybrid total installed cost ($)545,821.02545,821.02545,821.02
4Developer NPV ($)22,59525,65327,014
5Host NPV ($)−833,575−597,702−492,701
6Equity ($)259,349263,670265,593
7Size of debt ($)338,711324,703318,467
8Debt (%)56.6355.1954.53
S/No.Parameters (Case 4)PV, WT, FC, and Gen Running on DieselPV, WT, FC, and Gen Running on GasolinePV, WT, FC, and Gen Running on Natural Gas
1LCOE (nominal) (cents/kWh)62.9646.0238.48
2LCOE (real) (cents/kWh)50.9737.2531.15
3Hybrid total installed cost ($)992,157.10992,157.10992,157.10
4Developer NPV ($)38,85646,38549,737
5Host NPV ($)−1,863,092−1,226,850−943,621
6Equity ($)466,968477,864482,715
7Size of debt ($)636,658599,625583,140
8Debt (%)57.6955.6554.71
(b)
S/No.Parameters (Case 5)PV, WT, FC, and Gen Running on DieselPV, WT, FC, and Gen Running on GasolinePV, WT, FC, and Gen Running on Natural Gas
1LCOE (nominal) (cents/kWh)63.5348.3741.62
2LCOE (real) (cents/kWh)52.3639.8634.30
3Hybrid total installed cost ($)1,464,641.711,464,641.711,464,641.71
4Developer NPV ($)31,19847,18754,304
5Host NPV ($)−3,001,516−2,121,294−1,729,455
6Equity ($)655,127677,383687,290
7Size of debt ($)981,532923,252897,308
8Debt (%)59.9757.6856.63
S/No.Parameters (Case 6)PV, WT, FC, and Gen Running on DieselPV, WT, FC, and Gen Running on GasolinePV, WT, FC, and Gen Running on Natural Gas
1LCOE (nominal) (cents/kWh)66.6549.3041.57
2LCOE (real) (cents/kWh)54.2540.1333.84
3Hybrid total installed cost ($)1,876,684.341,876,684.341,876,684.34
4Developer NPV ($)63,10079,59986,943
5Host NPV ($)−3,714,372−2,533,170−2,007,348
6Equity ($)870,494893,679904,000
7Size of debt ($)1,219,4361,147,7661,115,862
8Debt (%)58.3556.2255.24
Table 8. (a) New overall project cost metrics for initial case and case 4. (b) New overall project cost metrics for case 5 and case 6.
(a)
S/No.Parameters (New Initial Case)PV, WT, FC, and Gen Running on DieselPV, WT, FC, and Gen Running on GasolinePV, WT, FC, and Gen Running on Natural Gas
1LCOE (nominal) (cents/kWh)49.4636.4430.65
2LCOE (real) (cents/kWh)40.1429.5824.88
3Hybrid total installed cost ($)545,821.02545,821.02545,821.02
4Developer NPV ($)319,838246,732214,188
5Host NPV ($)−335,883−221,496−170,575
6Equity ($)436,018432,036430,263
7Size of debt ($)157,047151,575149,139
8Debt (%)26.4825.9725.74
S/No.Parameters (New Case 4)PV, WT, FC, and Gen Running on DieselPV, WT, FC, and Gen Running on GasolinePV, WT, FC, and Gen Running on Natural Gas
1LCOE (nominal) (cents/kWh)61.5044.3236.67
2LCOE (real) (cents/kWh)49.7935.8829.69
3Hybrid total installed cost ($)992,157.20992,157.10992,157.10
4Developer NPV ($)824,664624,987536,099
5Host NPV ($)−823,879−516,442−379,584
6Equity ($)603,665592,595587,667
7Size of debt ($)496,095481,650475,220
8Debt (%)45.1144.8444.71
(b)
S/No.Parameters (New Case 5)PV, WT, FC, and Gen Running on DieselPV, WT, FC, and Gen Running on GasolinePV, WT, FC, and Gen Running on Natural Gas
1LCOE (nominal) (cents/kWh)61.5046.2839.50
2LCOE (real) (cents/kWh)50.6938.1432.55
3Hybrid total installed cost ($)1,464,641.711,464,641.711,464,641.71
4Developer NPV ($)1,205,193946,570831,442
5Host NPV ($)−1,377,642−941,146−746,836
6Equity ($)881,104868,992863,601
7Size of debt ($)749,165726,225716,013
8Debt (%)45.9545.5345.33
S/No.Parameters (New Case 6)PV, WT, FC, and Gen Running on DieselPV, WT, FC, and Gen Running on GasolinePV, WT, FC, and Gen Running on Natural Gas
1LCOE (nominal) (cents/kWh)64.9247.3839.57
2LCOE (real) (cents/kWh)52.8538.5632.21
3Hybrid total installed cost ($)1,876,684.341,876,684.341,876,684.34
4Developer NPV ($)1,549,8011,187,0821,025,615
5Host NPV ($)−1,661,779−1,086,422−830,297
6Equity ($)1,137,6521,118,4201,109,858
7Size of debt ($)944,724916,671904,183
8Debt (%)45.3745.04%44.89%
Disclaimer/Publisher’s Note: The statements, opinions and data contained in all publications are solely those of the individual author(s) and contributor(s) and not of MDPI and/or the editor(s). MDPI and/or the editor(s) disclaim responsibility for any injury to people or property resulting from any ideas, methods, instructions or products referred to in the content.