1. Introduction
Driven by the global strategy of “carbon neutrality”, carbon pricing mechanisms have become a central policy tool for countries to achieve their emission reduction targets. Common carbon pricing mechanisms include carbon taxes and carbon trading [
1]. As the world’s largest carbon emitter, China’s carbon trading policy has evolved through three distinct stages. The first stage, known as the pilot exploration phase (2011–2016), involved the launch of seven regional carbon trading pilots in cities such as Beijing, Shanghai, and Guangdong. The second stage, the institutional development phase (2017–2020), focused on gradually establishing a regulatory framework for carbon market governance. The third stage, beginning in 2021, marks the construction of a unified national carbon market, characterized by the initiation of national emissions trading and the continuous expansion of sectoral coverage. As of July 2024, the national carbon market focuses on key emitters in the power generation industry, covering about 5.1 billion tons of carbon emissions, accounting for more than 40% of total national emissions [
2].
Despite initial success, the carbon market still faces challenges such as limited trading entities, low market liquidity, and insufficient sectoral coverage. On 9 September 2024, the Ministry of Ecology and Environment issued a draft plan to expand coverage to cement, iron and steel, and electrolytic aluminum industries [
3], signaling the gradual inclusion of high-emission sectors and diversification of market participants. The inclusion of carbon-intensive industries, like steel and cement, is vital to China’s low-carbon transition. These sectors have low energy efficiency and high carbon emissions, placing considerable pressure on the environment. Additionally, carbon prices and electricity prices interact through a cost transmission mechanism, forming a dynamic feedback loop between power and carbon markets. Therefore, understanding the interplay between these markets under the expansion policy is critical for effective climate governance.
Although the interaction between carbon markets and associated markets has attracted extensive attention from academics, existing studies still have significant limitations. Most of the current studies focus on single industry market studies, such as steel and cement [
4,
5], or the impact of electricity–carbon market interconnections [
6,
7]. There is a relative lack of systematic research focusing on the interactions between various subjects in multiple markets and industries under the carbon expansion policy. It is difficult to analyze the dynamic correlation and feedback mechanism of multi-market and multi-industry in a comprehensive and in-depth way under the traditional research framework. System dynamics offers a holistic tool for modeling complex market interactions and policy effects. It enables simulation of feedback loops and dynamic evolution under different policy scenarios, making it suitable for analyzing cross-market responses to carbon market expansion. Recent work has shown its applicability to macro-level energy and environmental policy analysis [
8].
In summary, a systematic, dynamic study of the interaction between multiple subjects in the electric carbon market under the carbon expansion policy is necessary. This study should clarify the impact of the policy on power enterprises and 74 construct a coupled system dynamics model of China’s power and carbon markets under the carbon expansion policy. The model simulates how key variables—carbon price, electricity price, and carbon cost—respond to different policy scenarios. It aims to clarify the differentiated impacts on power companies and high-emission enterprises, offering strategic insights for policymakers and industries. Additionally, it will help enterprises anticipate market changes, adjust production strategies and investment plans accordingly, and provide useful references for the low-carbon transformation of key emitting industries.
The remainder of this paper is organized as follows.
Section 2 presents the literature review.
Section 3 describes the model and methodology, including model design, model analysis, and scenario design with parameter settings.
Section 4 provides a results analysis under various policy scenarios, focusing on the impacts on the carbon emission trading market, electricity enterprises, and high-emission enterprises and further analyzes the allowance tightening, renewable energy integration, and integrated policy incentive scenarios.
Section 5 discusses the findings and concludes the study.
2. Literature Review
Currently, literature research on carbon expansion policies mainly focuses on exploring the comprehensive impact of such policies on macrosystems, such as the overall economy and energy environment. Jiang et al. [
8] used a computable general equilibrium model to predict the impact of expanding the carbon market industry on China’s socio-economy and energy environment. The results show that including only the power sector has a significant negative impact on China’s GDP and residents’ welfare, but expanding the carbon market industry can mitigate the negative impact on the macroeconomy to a certain extent, increase the share of renewable energy, and raise the electrification rate.
Tang et al. [
9] used scenario forecasts to demonstrate that including more industry sectors in the carbon market would lower the carbon price and effectively reduce the marginal emission reduction cost of the overall market. Jiang et al. [
4] found that when the carbon market covers all energy-intensive industries, total oil consumption and external dependence can be significantly reduced. Existing research focuses on assessing the impact of carbon expansion policies on macrosystems but fails to specifically analyze the impact of carbon expansion policy implementation on high-energy-consuming industries and the power industry.
Regarding the participation of high-energy-consuming industries in the carbon market, existing studies have primarily focused on specific indicators for individual high-energy-consuming industries within China’s pilot carbon market. For example, Liu et al. analyzed and summarized the emission categories, compliance boundaries, quota allocation methods, and quota issuance methods for the steel industry in the pilot carbon market, providing valuable insights for the inclusion of the steel industry in the national carbon market [
10]. Wu et al. [
11] investigated the impact of China’s pilot carbon market trading mechanism on carbon dioxide emission efficiency in the steel industry. The results indicated that under the influence of the carbon market trading mechanism, carbon dioxide emission efficiency in the steel industry of the pilot regions improved. Liu et al. [
12] studied the carbon emission cost pass-through rate in the cement industry in pilot regions based on the pilot carbon market for the cement industry. They found that under the carbon market mechanism, the cement industry passes on the opportunity cost of carbon emissions to consumers, and the carbon emission cost pass-through rate in all pilot regions is higher than 60%. Existing studies have not thoroughly examined the interactive effects of multiple industry participants in the carbon market and have not fully revealed the linkage effects between energy-intensive industries and the power industry.
The system dynamics model, as a comprehensive simulation tool, treats the object of study as a series of subsystems and conducts an in-depth analysis of the interactions between various elements within the system. It has been widely applied to the analysis and evaluation of the long-term effects of policy implementation [
13,
14]. Chang et al. [
15] analyzed the policy coupling effects of carbon markets and green certificate markets under market-based electricity conditions by constructing an interactive system dynamics model. Wu et al. [
16] used a system dynamics model to study the policy implications of the synergy between electricity, energy rights, and carbon markets for power generation companies. Zhang et al. used a system dynamics model to predict the extent of the impact of carbon emissions trading, energy consumption trading, and fiscal subsidies policies on carbon emissions reduction in China [
17]. The above research provides a reference for constructing a system dynamics model in this paper.
Existing studies have not adequately addressed the impact of carbon expansion policies on specific industries, nor have they considered the interactive effects when multiple industrial entities participate in the carbon market simultaneously. To address this gap, this study develops a coupled model in which high-emission industries and the power sector jointly participate in both the electricity market and the carbon market. This model enables the analysis of key parameter changes in energy-intensive industries and the power sector under carbon expansion policies and clarifies the interrelationships between these sectors.
3. Model and Methodology
First, this study theoretically analyzes the mechanism-based relationships among various actors in the electricity market and the carbon trading market in the context of carbon cap expansion. Second, with the aid of Vensim PLE x64 software, it conducts a causal analysis of the system composed of market participants. The data sources include authoritative publications, such as the China Statistical Yearbook, China Electric Power Yearbook, and China Iron and Steel Industry Yearbook, as well as official platforms, such as the National Bureau of Statistics and the China Electricity Council. Finally, a baseline scenario and three policy-oriented scenarios are established to systematically examine the coupling effects of different policy directions on key sectors, including electricity, steel, and cement.
3.1. Model Design
This model centers on two pivotal markets—the electricity market and the carbon trading market—and incorporates three key stakeholder groups: thermal power generators, renewable energy generators, and electricity consumers. This model provides a systematic framework for capturing the dynamic evolution of China’s power sector and major energy-intensive industries under the influence of carbon market mechanisms. The structural interactions among market participants are illustrated in
Figure 1.
In the electricity market, this study accounts for two categories of electricity suppliers: thermal power generators and renewable energy generators. The main electricity consumers are enterprises in the steel industry and the cement industry, both of which are major energy-intensive industries characterized by substantial electricity consumption in their production processes. With the progressive implementation of the Renewable Consumption Obligation policy, a growing demand for renewable electricity has emerged from these industries. Electricity prices—including the feed-in tariffs for thermal power and renewable energy—are determined by market supply and demand dynamics, thereby shaping the electricity cost structure of steel and cement enterprises. The feed-in tariffs refer to the measured price at the point where the power grid purchases electricity and quantity from the power generation enterprise and connects to the main grid.
In the carbon trading market, this study distinguishes the roles of steel, cement, and thermal power enterprises as purchasers or sellers. Carbon allowances in China are allocated based on sector-specific benchmark values. Enterprises with high carbon emission intensity during production that exceed their benchmark are likely to face allowance shortages. To meet compliance requirements, these enterprises must purchase additional carbon allowances through the carbon trading market, resulting in carbon trading costs. In contrast, enterprises with low emission intensity and surplus allowances can sell the excess in the carbon market to generate additional income. Renewable energy generators that produce green electricity and emit no carbon during the generation process are excluded from the carbon trading market and do not participate in carbon transactions.
The coupling effect between the electricity market and the carbon market is reflected in the transmission of carbon prices. The on-grid electricity price of thermal power will gradually be included in the carbon cost [
18]. Under policy promotion, the cost of carbon emissions may be directly included in the electricity price, affecting the economic viability of thermal power enterprises. This also leads to thermal power companies not only considering the supply and demand of the electricity market but also controlling carbon costs when adjusting their power generation output.
The interactions among the above market participants constitute a complex dynamic feedback system, providing a theoretical foundation for analyzing the effects of carbon market expansion policies and the evolution of the energy structure.
To ensure scientific rigor in system dynamics modeling, the following assumptions are made:
The offset rate of CCER in the national carbon market is limited to 5%. Not only that, the domestic policy mechanism for CCER is still in the development stage, the price of CCER fluctuates greatly, and the issuance is unstable, so the model does not set a separate CCER subsystem.
This model primarily examines the impact of carbon market expansion on major energy-intensive industries, focusing on market trends rather than process optimization. Due to the inherently high energy efficiency and low-emission nature of waste heat power generation, the model does not account for its carbon emissions.
The model constructs a unified carbon allowance trading market for high-emission sectors such as thermal power, steel, and cement. Since the expansion of the national carbon market, power, steel, cement and other industries all compete in the same national carbon market, and the trading volume of carbon quotas is completely determined by the relationship between supply and demand; therefore, this study established a shared cross-industry carbon quota pool, which is more in line with the actual situation. When the total supply of carbon allowances falls short of aggregate demand, the final allocation is dynamically adjusted based on each sector’s actual emissions and its initial allowance share. This mechanism ensures that the proportional allowance shortfall is balanced across all sectors.
In this study, the grid feed-in tariff for renewable energy, the grid feed-in tariff for thermal power, the carbon price, and the carbon trading costs for cement and steel enterprises are all obtained based on the relationship between supply and demand, which is in line with the actual situation of the national carbon market expansion. The specific formulas are as follows:
- (1)
Grid Feed-in Tariff for Renewable Energy = INTEG (Excess Demand of Renewable Energy) + Initial Grid Feed-in Tariff For Renewable Energy;
- (2)
Grid Feed-in Tariff for Thermal Power = INTEG (Excess Demand of Thermal Power) + Initial Grid Feed-in Tariff for Thermal Power + Carbon Cost Per kWh;
- (3)
Carbon price = INTEG (Excess Demand of CEA) + Initial Value of Carbon Price;
- (4)
Carbon Trading Costs for Cement Enterprises = CEA Trading Volume of Cement Enterprises * Carbon price;
- (5)
Carbon Trading Costs for Steel Enterprises = CEA Trading Volume of Steel Enterprises * Carbon price.
3.2. Model Analysis
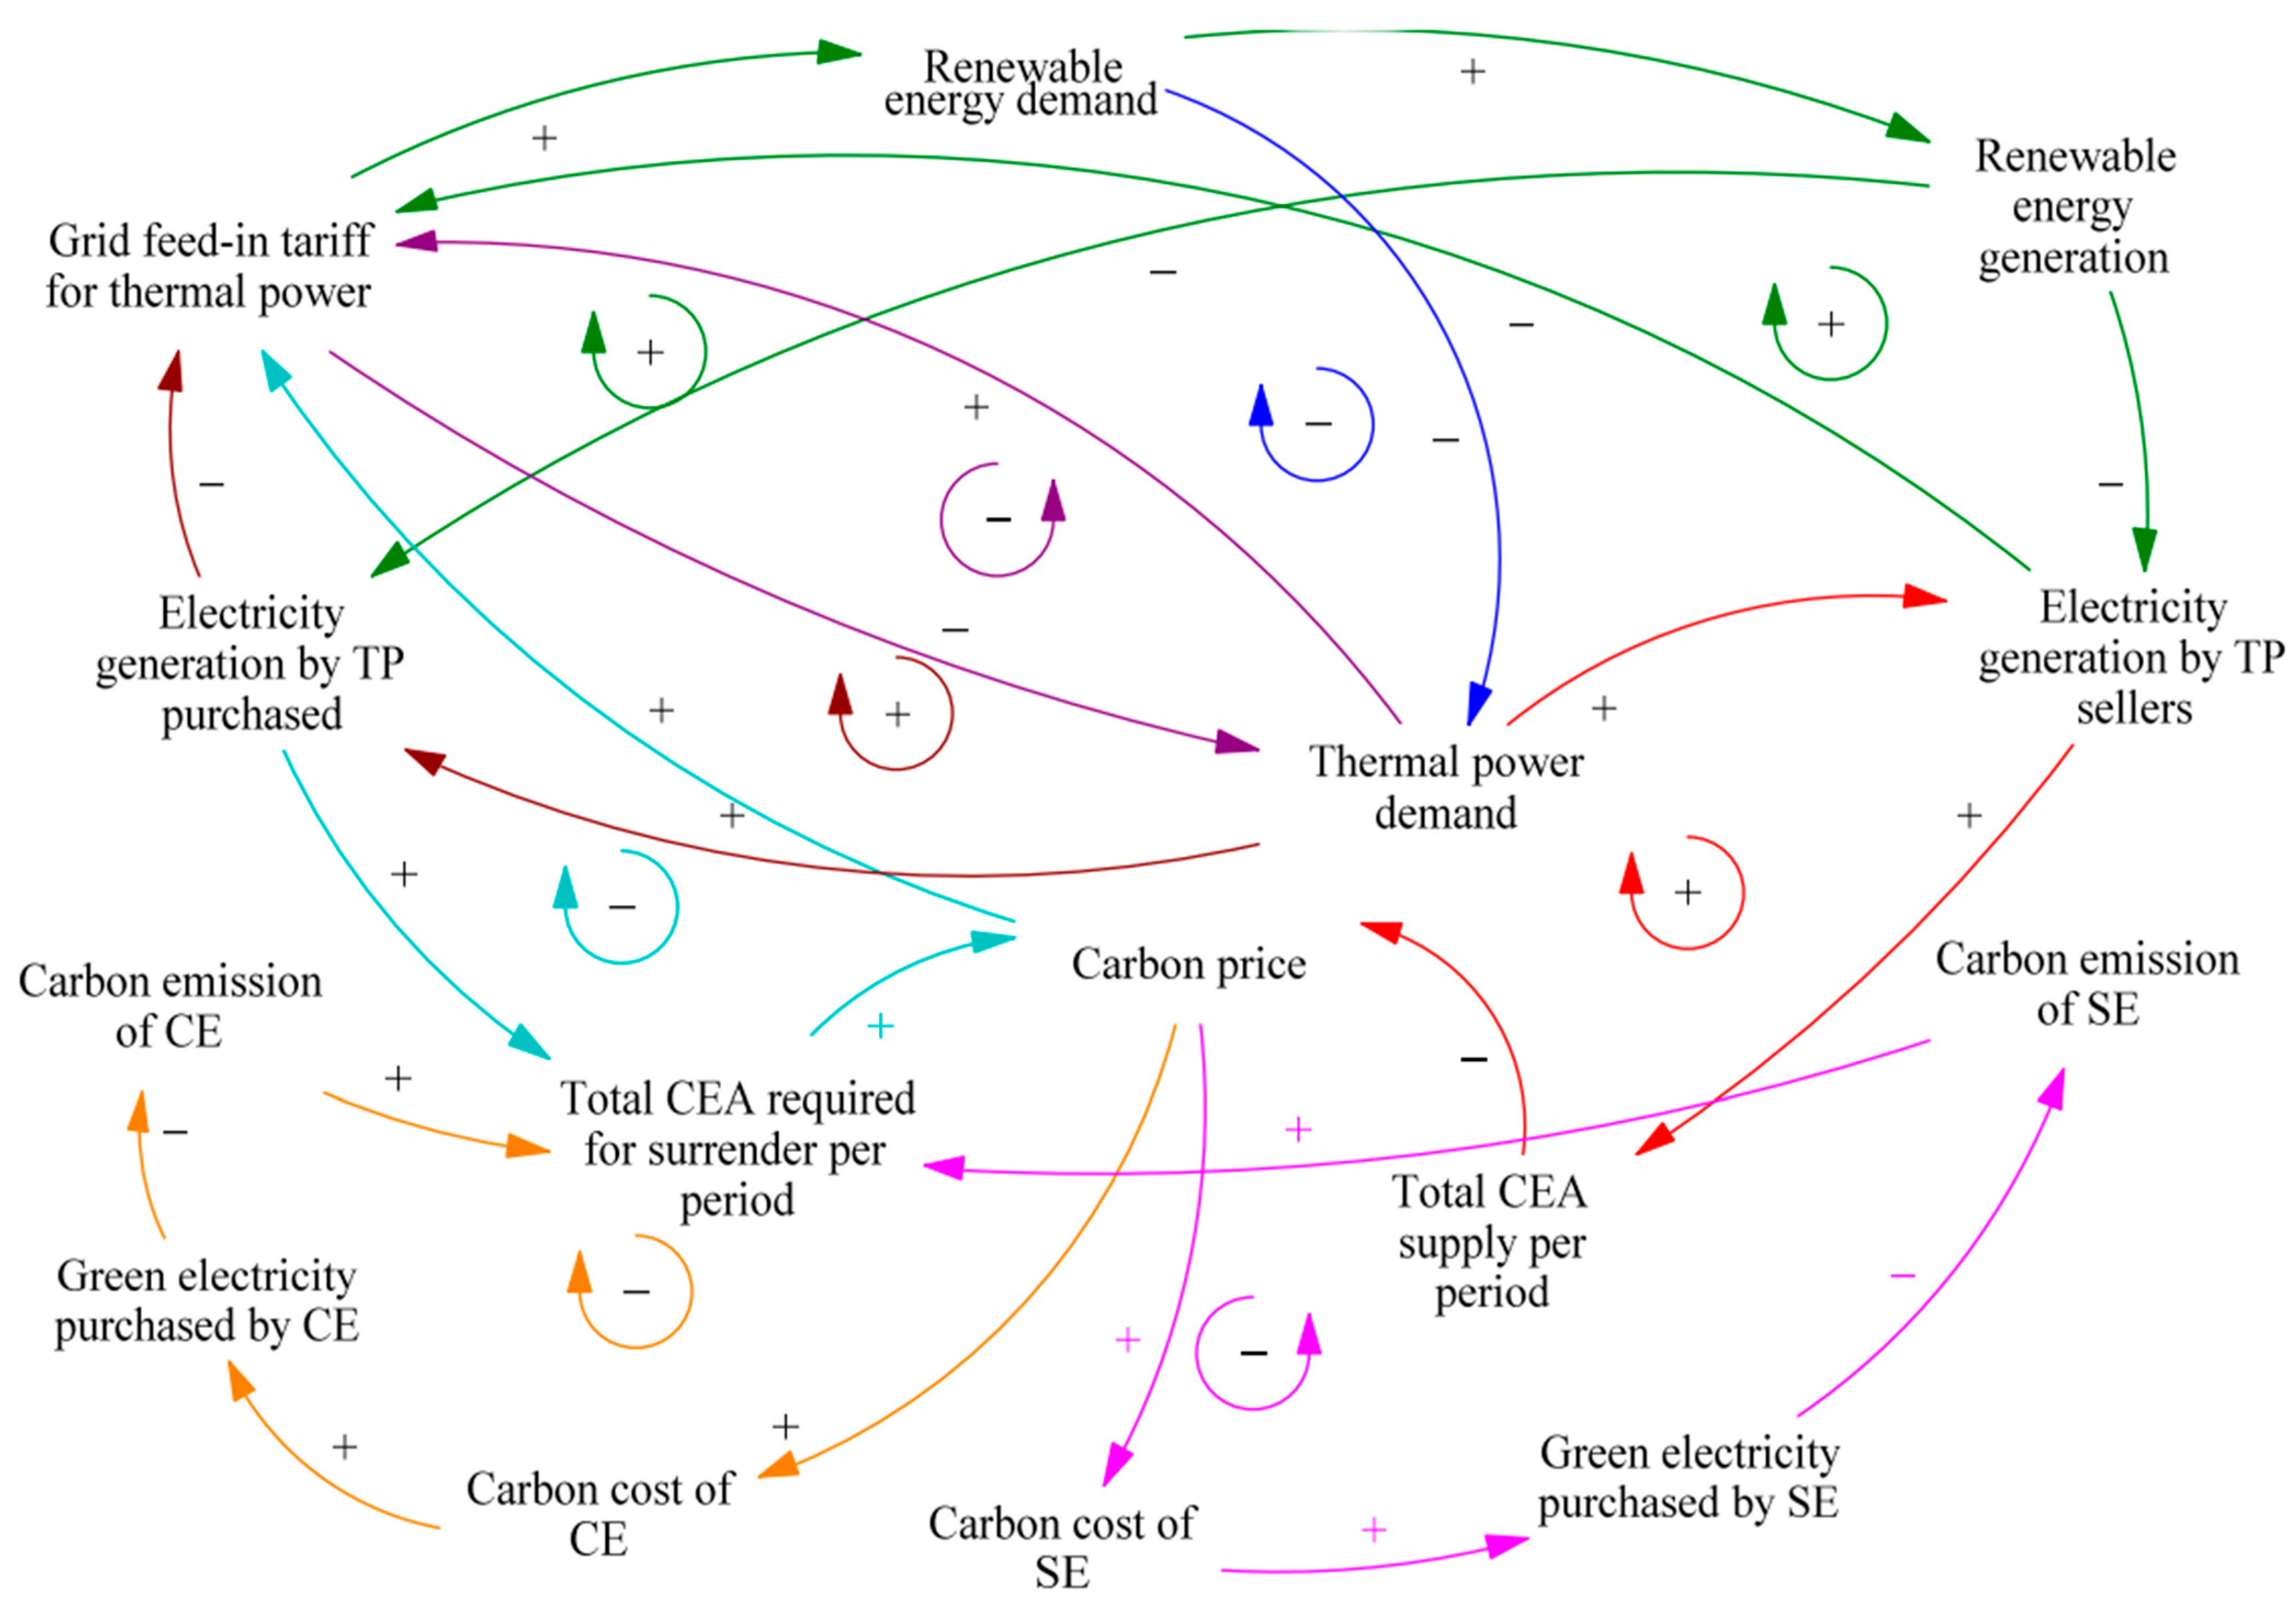
Following the analysis of market mechanisms and the formulation of model assumptions, this study constructs a causal loop diagram for the system dynamics model, as shown in
Figure 2. In this diagram, arrows indicate the causal relationships between variables, forming causal chains. Multiple interconnected causal chains form closed loops of mutual interaction, known as feedback loops. The diagram developed in this study includes four positive feedback loops and five negative feedback loops. Among them, the key feedback mechanisms are represented by the following four loops.
3.2.1. Positive Feedback Loop
As the carbon price rises, it raises the grid feed-in tariff for thermal power through the electricity–carbon transmission mechanism. This suppresses the demand for thermal power and enhances the relative competitiveness of renewable energy. Consequently, the electricity generation of thermal power sellers declines, leading to a reduction in the total supply of CEAs, which in turn drives the carbon price even higher.
1. Carbon price→ + grid feed-in tariff for thermal power→ − thermal power demand→ + electricity generation by TP seller→ + total CEA supply per period→ − carbon price.
2. Carbon price→ + grid feed-in tariff for thermal power→ + renewable energy demand→ + renewable energy generation→ − electricity generation by TP seller→ + total CEA supply per period→ − carbon price.
3.2.2. Negative Feedback Loop
As the carbon price rises, the carbon costs for cement and steel enterprises increase. To reduce their carbon emissions, these enterprises tend to increase the proportion of electricity purchased from the grid. A higher share of purchased electricity helps lower their carbon emissions, thereby reducing the demand for CEAs and exerting downward pressure on the carbon price.
1. Carbon price→ + carbon cost of SE→ + green electricity purchased by SE→ − carbon emission of SE→ + total CEA required for surrender per period→ + carbon price.
2. Carbon price→ + carbon cost of CE→ + green electricity purchased by CE→ − carbon emission of CE→ + total CEA required for surrender per period→ + carbon price.
3.3. Scenario Design and Parameter Settings
To ensure that the model closely reflects real market operations, the minimum simulation time step is set to one month, with a total simulation duration of 100 months. This is because China’s medium-term energy transformation goal requires that the carbon peak be reached in 2030, and the 100-month time setting can show the changing trend around 2030. The initial time is assumed to be January 2024, and the simulation ends in April 2032. One baseline scenario and three policy-oriented scenarios are defined. Based on the analysis of carbon market expansion policies’ impact on the electricity market and the steel and cement industries, this study further explores how different policy approaches influence the coupled dynamics among these sectors.
The baseline scenario simulates the current state of development in the carbon trading market and the electricity market. Initial values of key parameters are shown in
Table 1. According to national policies and data disclosed by power companies, the initial grid feed-in tariffs for thermal power and renewable energy are set at 0.4320 RMB/kWh and 0.4367 RMB/kWh, respectively. The initial growth rate of the Renewable Energy Consumption Obligation is set at 0.00285, based on values reported in related studies. In addition, the initial benchmark carbon emission intensities for thermal power generators, the steel industry, and the cement industry are set at 0.000791 tCO
2/kWh, 1.8 tCO
2/kWh, and 0.8675 tCO
2/kWh, respectively, in accordance with relevant national policies and prior research. The Initial value of the carbon price is set to 73.25 RMB/t, which is from the Shanghai Energy and Environment Exchange. The electric elastic coefficient is set to 1.027 and is achieved by converting the growth rate of electricity consumption and GDP in China. The initial annual output of cement is set to 1.825 billion tons, which is from the China cement network. The initial annual output of steel is set to 1.005 billion tons, which comes from the seventh meeting of the sixth general meeting of the China Iron and Steel Association. The rest of the data, including renewable energy power generation hours, thermal power generation hours, transmission and distribution price, initial installed capacity of renewable energy, initial installed capacity of thermal power, and initial value of estimated power demand are all from the National Development and Reform Commission, the National Energy Administration, the National Bureau of Statistics. In the baseline scenario, sectoral benchmarks and the renewable energy obligation remain unchanged and serve as reference points for the comparative analysis of alternative scenarios.
Scenario 1: Allowance Tightening Scenario
This scenario considers an accelerated reduction in carbon allowance allocation. The current average monthly reduction rate of the emission benchmark is 0.106%, derived from the change in benchmark carbon emission intensity for conventional coal-fired power units above 300 MW—declining from 0.8218 tCO2/MWh in 2021 to 0.7910 tCO2/MWh in 2024. Based on this rate, the study defines three sub-scenarios representing low, medium, and high reduction speeds.
Scenario 2: Renewable Energy Integration Promotion Scenario
This scenario considers the policy context of accelerating energy transition and enhancing the integration of renewable energy. The current monthly growth rate of the Renewable Energy Consumption Obligation is 0.285%, calculated based on the increase from the national obligation of 29.4% in 2021 to the target of 40% by 2030. Building on this rate, the study defines three sub-scenarios representing low, medium, and high growth trajectories.
Scenario 3: Integrated Policy Incentive Scenario
This scenario represents a combined policy approach, in which both sectoral carbon allowances are tightened and the Renewable Energy Consumption Obligation is increased. This scenario includes three sub-scenarios corresponding to low, medium, and high levels of policy reinforcement.
The specific parameter settings are presented in
Table 2.
4. Results Analysis
4.1. Analysis of Baseline Scenario Analysis
4.1.1. Impact on Carbon Emission Trading Market
As shown in
Figure 3, under the baseline scenario, the carbon price exhibits a trend of initial decline followed by a sustained increase. During the initial phase of carbon market expansion, the carbon price gradually decreased from 67.39 RMB/t in January 2025 to its lowest point of 58.60 RMB/t in February 2026. In the subsequent deepening phase of expansion, which begins after 2027, the carbon price begins to rise steadily, reaching 275.33 RMB/t by April 2032. This represents a 369.85% increase from the lowest point.
During the initial stage of carbon market expansion, 2024 serves as the first compliance year, with allowances allocated based on verified historical emissions on a one-to-one basis. In 2025 and 2026, allocation shifts to an intensity-based control approach. As a result, the market experiences a temporary surplus of allowances, and newly included industries face limited compliance pressure. This leads to low market activity and relatively depressed carbon prices. After 2027, the carbon market expansion enters a deepening stage, and the total volume of allowances is gradually tightened in a moderate manner. As compliance pressure increases, demand for carbon allowances rises accordingly, driving up the carbon price.
4.1.2. Impact on Electricity Enterprises
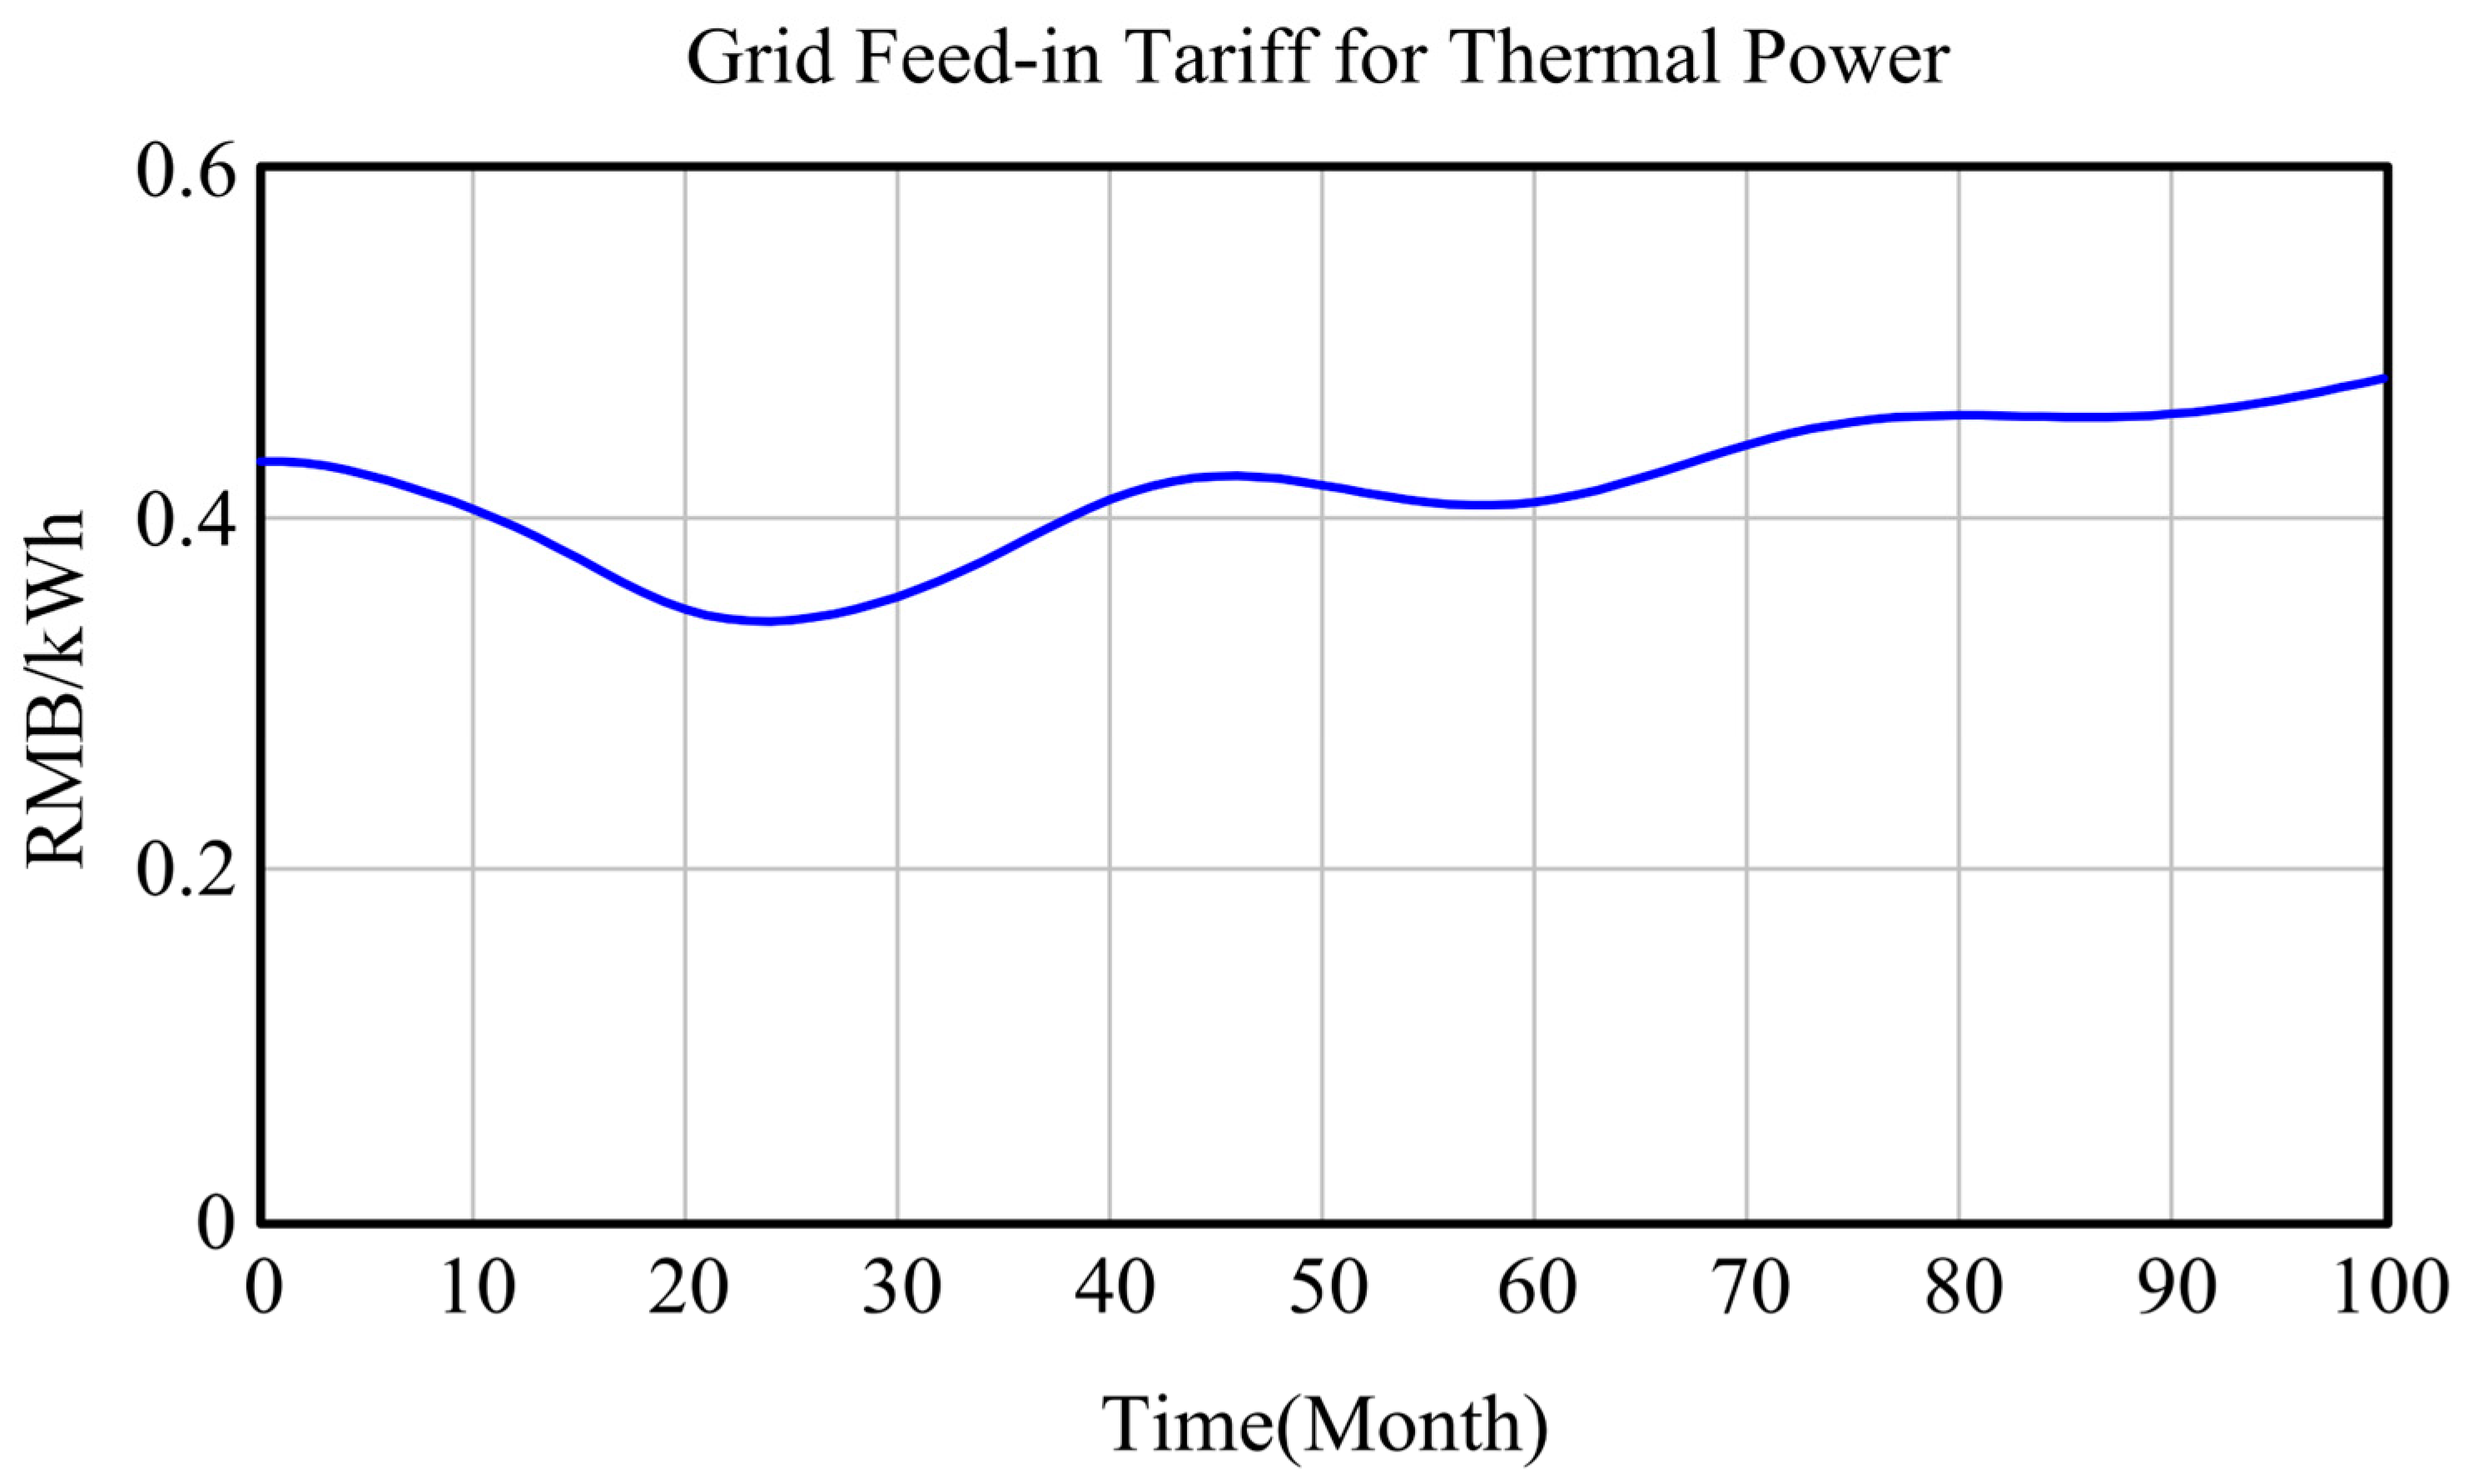
As shown in
Figure 4 and
Figure 5, the grid feed-in tariffs for thermal power and renewable energy under the baseline scenario exhibit distinct trends. The grid feed-in tariff for thermal power initially follows a “decline-then-rise” pattern before stabilizing. During the initial phase of carbon market expansion, the tariff gradually decreases from 0.3947 RMB/kWh in January 2025 to its lowest point of 0.3409 RMB/kWh in January 2026. It then begins to rebound. In the deepening phase after 2027, the thermal power tariff increases with some fluctuations, reaching 0.4794 RMB/kWh by April 2032—an overall increase of 40.63%. In contrast, the grid feed-in tariff for renewable energy shows a steady upward trend. From 0.4496 RMB/kWh in January 2025, it rises continuously to 0.5712 RMB/kWh by April 2032, marking a 27.05% increase. This pattern primarily reflects the “electricity-carbon transmission mechanism” [
19]. Under the carbon market framework, thermal power generators incur direct carbon trading costs due to their emissions, which are passed through to electricity prices. At the same time, with the continuous increase in the Renewable Energy Consumption Obligation and large-scale development of wind and solar power, renewable energy generators transfer more of their construction and integration costs to the user side through higher electricity prices. Given renewable energy environmental attributes [
20], the feed-in tariff for renewable energy consistently remains slightly higher than that of thermal power. This study compares the historical statistical data in 2024 with the simulated data and calculates the error. It is found that the simulated average grid feed-in tariff for thermal power in 2024 is RMB 0.417/kWh, which is 3.99% fitting deviation compared with the actual average grid feed-in tariff for thermal power in China in 2024. The simulated average grid feed-in tariff for renewable energy in 2024 is RMB 0.442/kWh, which is 0.27% fitting deviation compared with the actual average grid feed-in tariff for renewable energy in China in 2024. It indicates that the fitting effect of this model is very good.
4.1.3. Impact on High-Emission Enterprises
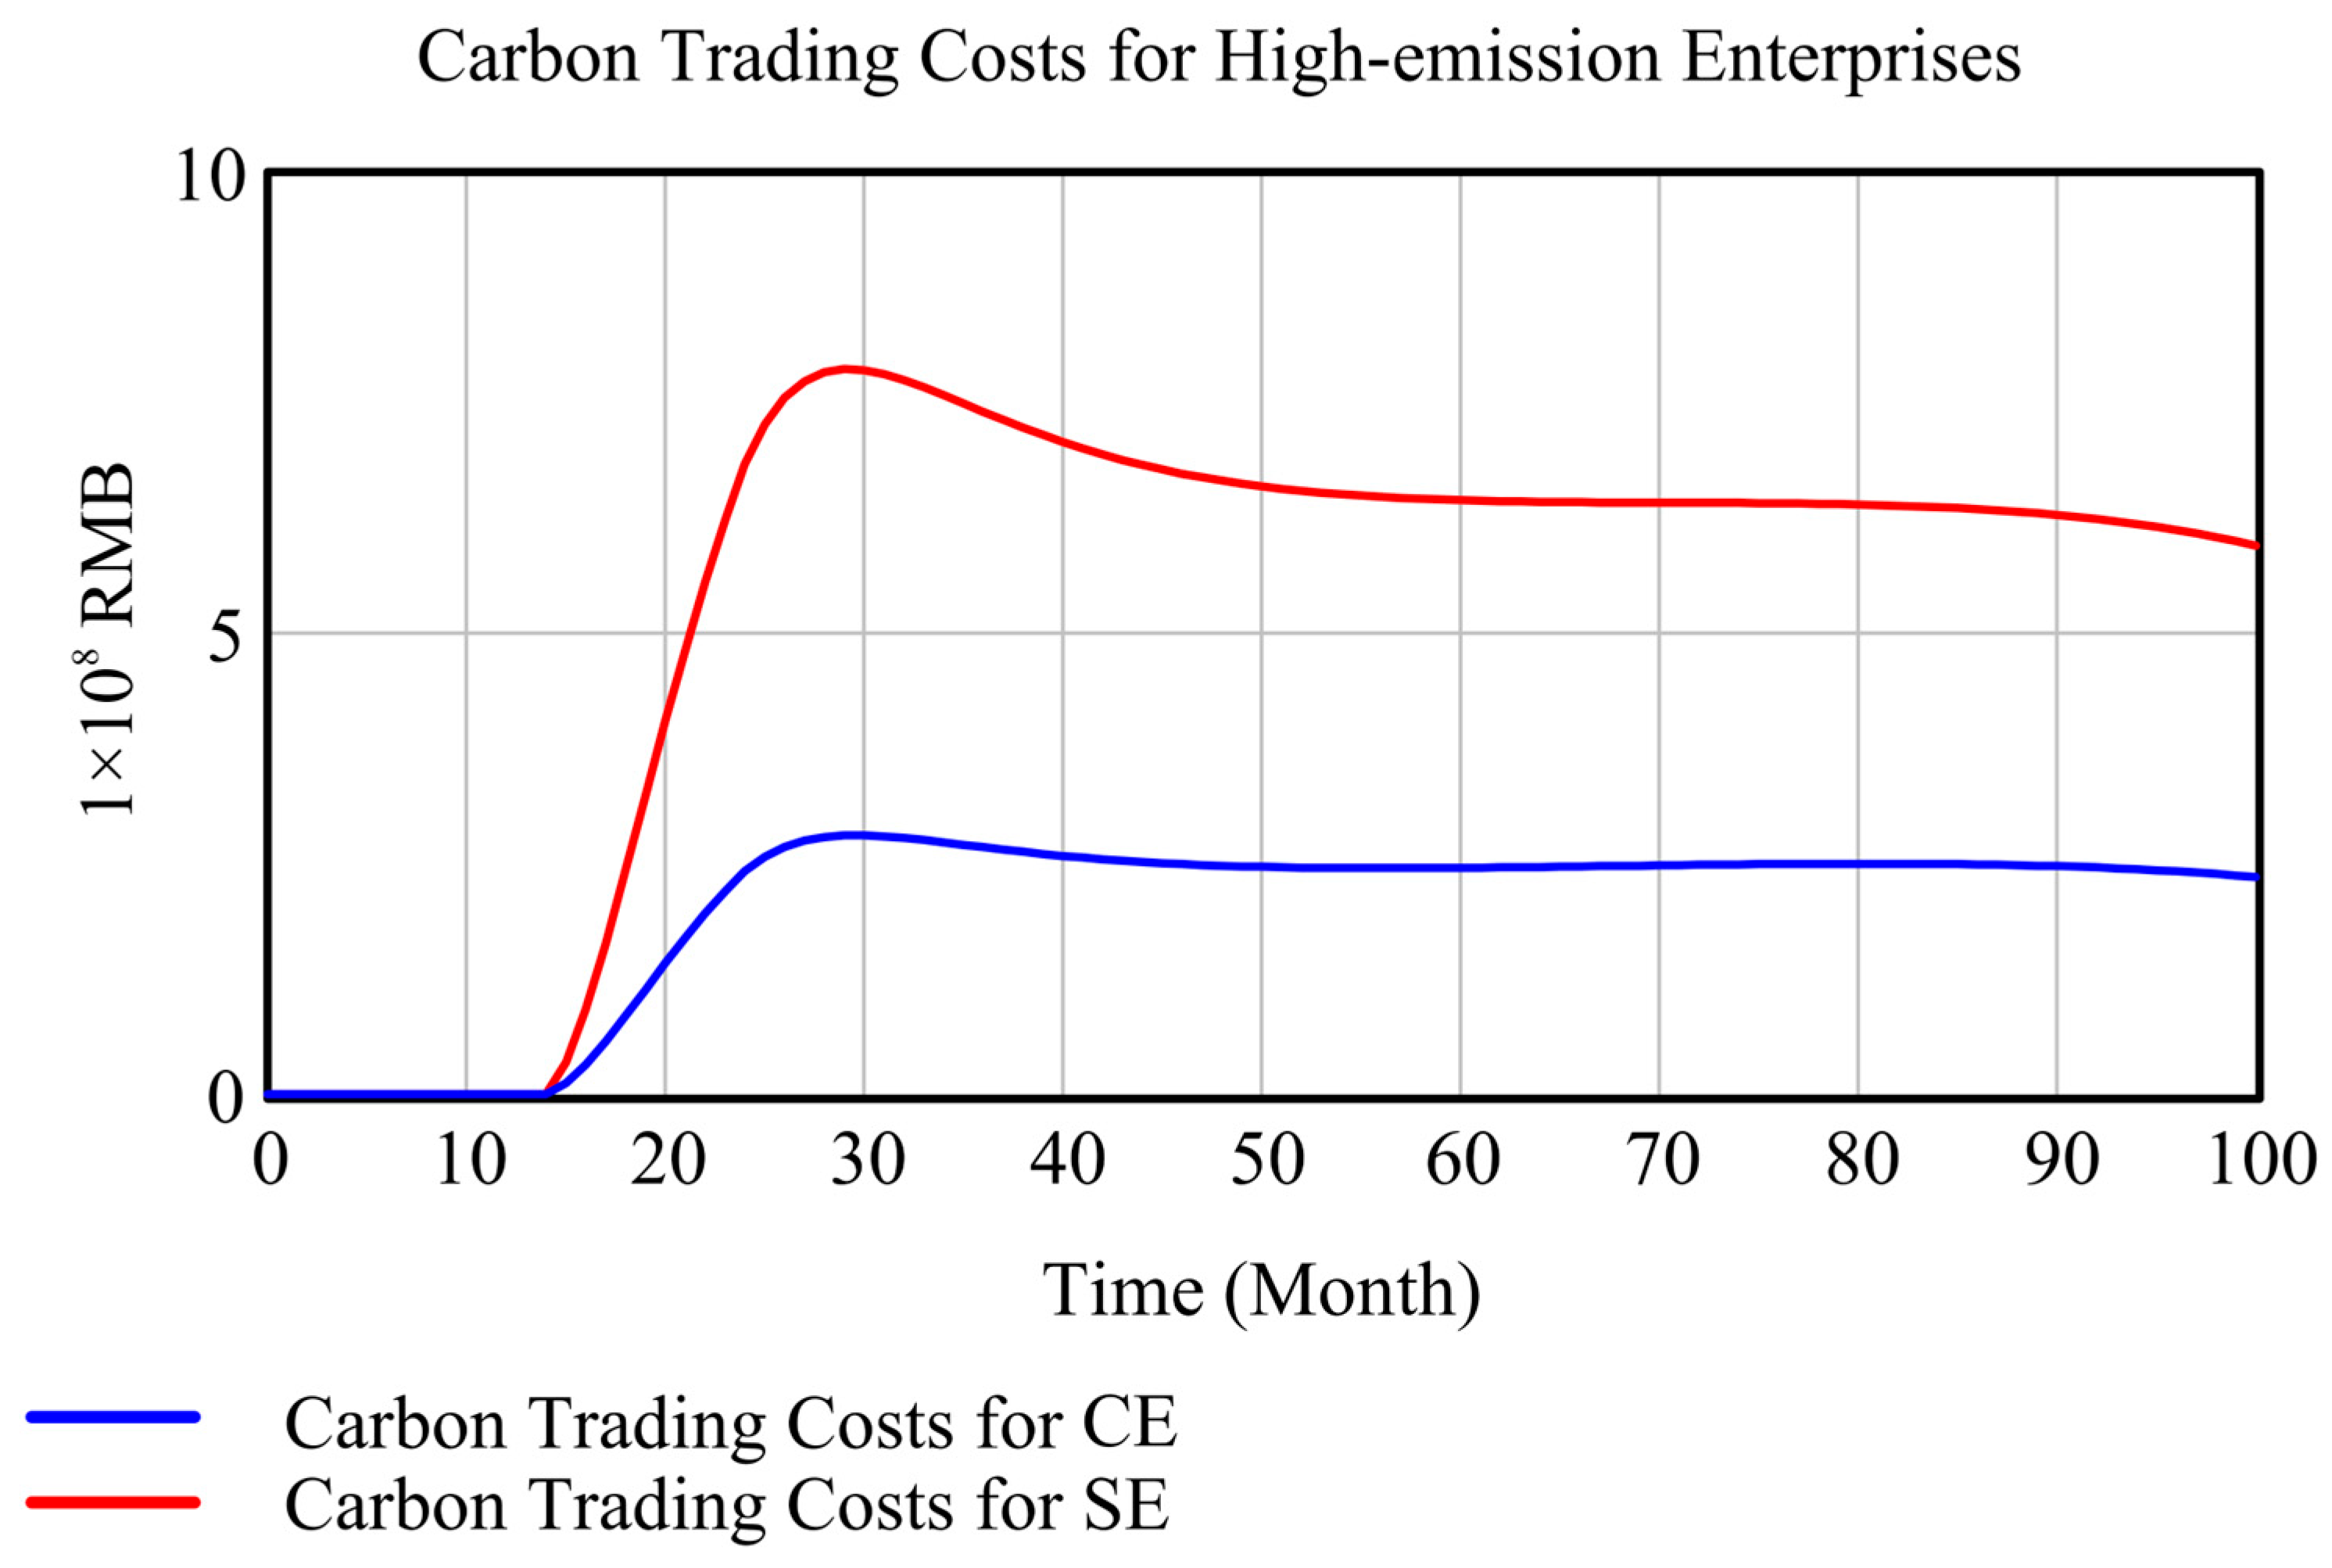
As shown in
Figure 6, under the baseline scenario, the carbon trading costs of high-emission enterprises exhibit distinct phased characteristics. According to the “Work Plan for Covering the Steel, Cement, and Aluminum Smelting Industries in the National Carbon Emission Trading Market”, during the initial phase of carbon expansion, cement and steel enterprises will receive their 2024 allowances based on their verified actual carbon emissions, meaning they will receive their full quotas free of charge and, therefore, incur zero carbon trading costs. Starting in 2025, the allowance allocation method will shift to a carbon emission intensity control approach, requiring enterprises to purchase allowances on the market for part of their carbon emissions, which will cause carbon trading costs to rise rapidly. In 2025, the total carbon allowance costs for the cement and steel industries will be RMB 1.27 billion and RMB 3.605 billion, respectively. In 2026, they will be RMB 3.262 billion and RMB 9.124 billion, respectively. In the deepening phase after 2027, carbon trading costs for steel and cement companies will begin to decline and gradually stabilize. By 2031, the total carbon trading costs for cement and steel companies will be RMB 2.967 billion and RMB 7.536 billion, respectively. Overall, the carbon trading costs for the steel industry are significantly higher than those for the cement industry.
4.2. Analysis of Allowance Tightening Scenario
In the context of restrictions on allowance, this analysis provides insights into the effects of lowering baseline values, the dynamics of carbon prices in the carbon market, and the variations in the carbon costs of various parties.
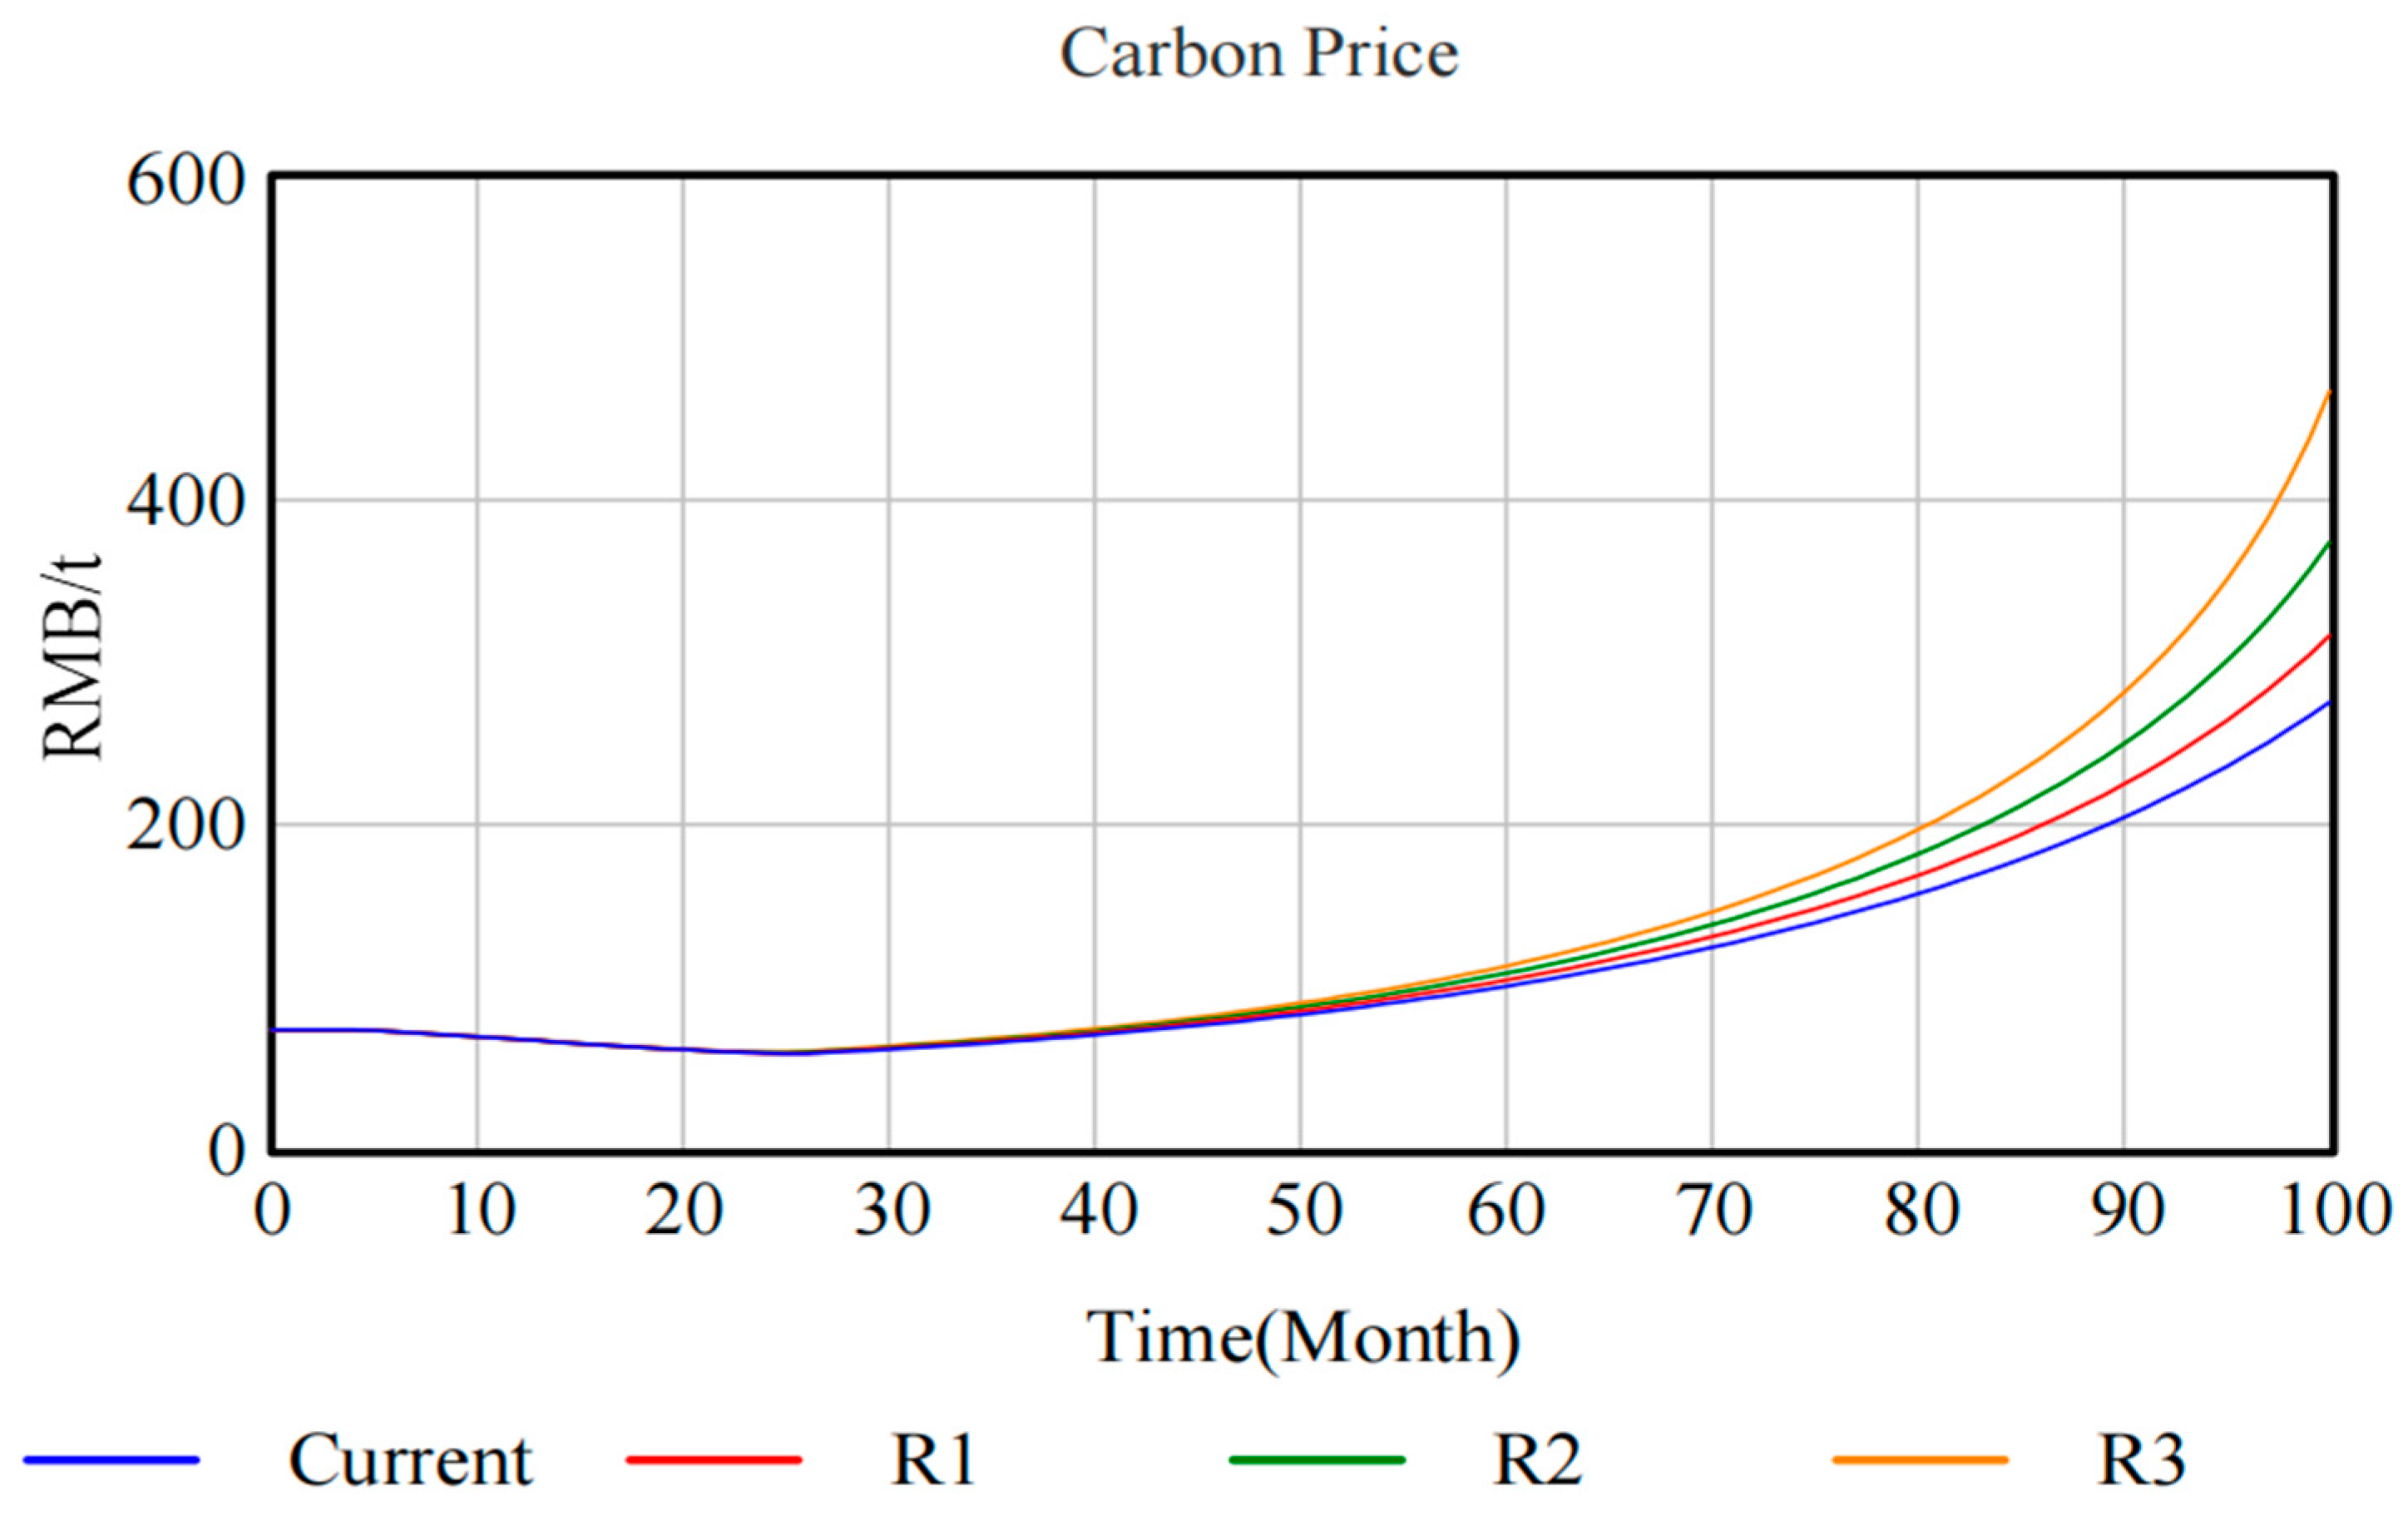
As illustrated in
Figure 7, under a scenario of constrained carbon quotas, the trend of carbon quota prices exhibits a similar pattern to that of the trend of carbon prices under the baseline scenario. Similarly, during the initiation phase (June 2024–2026), the carbon quota prices remain stable and show a slight downward trend. In the subsequent period (2027 onwards), the carbon prices begin to rise, with the R3 scenario showing a rapid increase in carbon prices. The rate of change is the fastest, indicating a significant impact of the rapid decline in the baseline value on the carbon market. By April 2032, the R3 scenario reaches its peak of 467. The price was 125 RMB per ton. The prices of the other three scenarios also continued to rise, with an increase in the growth rate from R3 to R2 to R1 to the baseline scenario. The growth rate of R3 was 69.7% higher than that of the baseline scenario. The trend of the carbon price was significantly influenced by the rate of decrease in the baseline value over the entire period. The decrease in the baseline value allocated to the trading parties resulted in a shortage of carbon, leading to an increase in the carbon price.
As illustrated in
Figure 8, in a scenario of restricted quotas, the overall trend in the carbon quota cost for high-emitting enterprises remains consistent with the baseline scenario. However, a notable disparity emerges in the carbon transaction cost for steel and cement enterprises. Specifically, the carbon transaction cost for steel enterprises is approximately two times that of cement enterprises. The ratio increased by 5.4 times. Despite the fact that the rate of increase in the carbon emissions of the steel and cement industries was different, the reason for the increase in the cost base being higher in the steel industry than in the cement industry was that the free carbon quota allocation decreased. Consequently, from the 2027 stage onwards, the carbon quota cost of both the steel and cement industries began to decrease at a slower rate.
4.3. Analysis of Renewable Energy Integration Promotion Scenario
Based on the growth in demand for renewable energy in the baseline scenario and current policy trends, the study sets up a scenario to promote renewable energy consumption and further analyzes the carbon price in the carbon market and the changes in the cost of carbon for various parties under this scenario.
As can be seen in
Figure 9, the promotion of the renewable energy consumption scenario basically does not affect the carbon price change, and the overall trend of the carbon price change is the same as the baseline scenario because the baseline scenario also exists in the case of increasing the weight of the responsibility of renewable energy consumption.
As can be seen in
Figure 10, under the scenario of promoting renewable energy consumption, the renewable energy feed-in tariffs of the three scenarios are basically the same before December 2025, and the renewable energy tariffs from January 2026 onwards are S3 > S2 > S1 > baseline scenario, with the S3 scenario being slightly higher than the baseline scenario by about 7.7%. This is due to the increase in the promotion of renewable energy. The enterprise demand for renewable energy will also gradually increase, and the supply is less than the demand, so the renewable energy feed-in tariffs will gradually rise. In the deepening stage, the market demand for renewable energy gradually stabilizes and slowly rises, so the renewable energy feed-in tariffs will also gradually maintain a slow rise and tend to stabilize.
As can be seen in
Figure 11, the overall trend of changes in the costs of carbon allowances for high-emitting enterprises under the scenario of Promoting Renewable Energy Consumption is basically similar to that under the baseline scenario. As the weighting of the responsibility for renewable energy consumption increases at a faster rate, the demand for thermal power from high emitters decreases, which in turn leads to a decrease in the supply of carbon allowances, and, therefore, fewer carbon allowances are available for trading by high emitters. Unlike the tightening scenario, the change curves of carbon costs for steel and cement companies in the start-up phase almost coincide in all scenarios. It is not until after 2027 in the deepening phase that the changes in the carbon costs of steel and cement under the different scenarios begin to diverge, with the carbon costs of steel and cement for the baseline scenario > S1 > S2 > S3, where the carbon transaction costs for steel firms are 2.8 times higher than those for cement firms. The reason for this change is that in the deepening stage, high-emission enterprises will take measures against the rising carbon costs, and as the weighting of the responsibility to promote renewable energy consumption increases, steel and cement enterprises will choose renewable energy and reduce the use of traditional energy sources to reduce the demand for carbon allowances, which reduces the cost of carbon allowances for enterprises.
4.4. Analysis of Integrated Policy Incentive Scenario
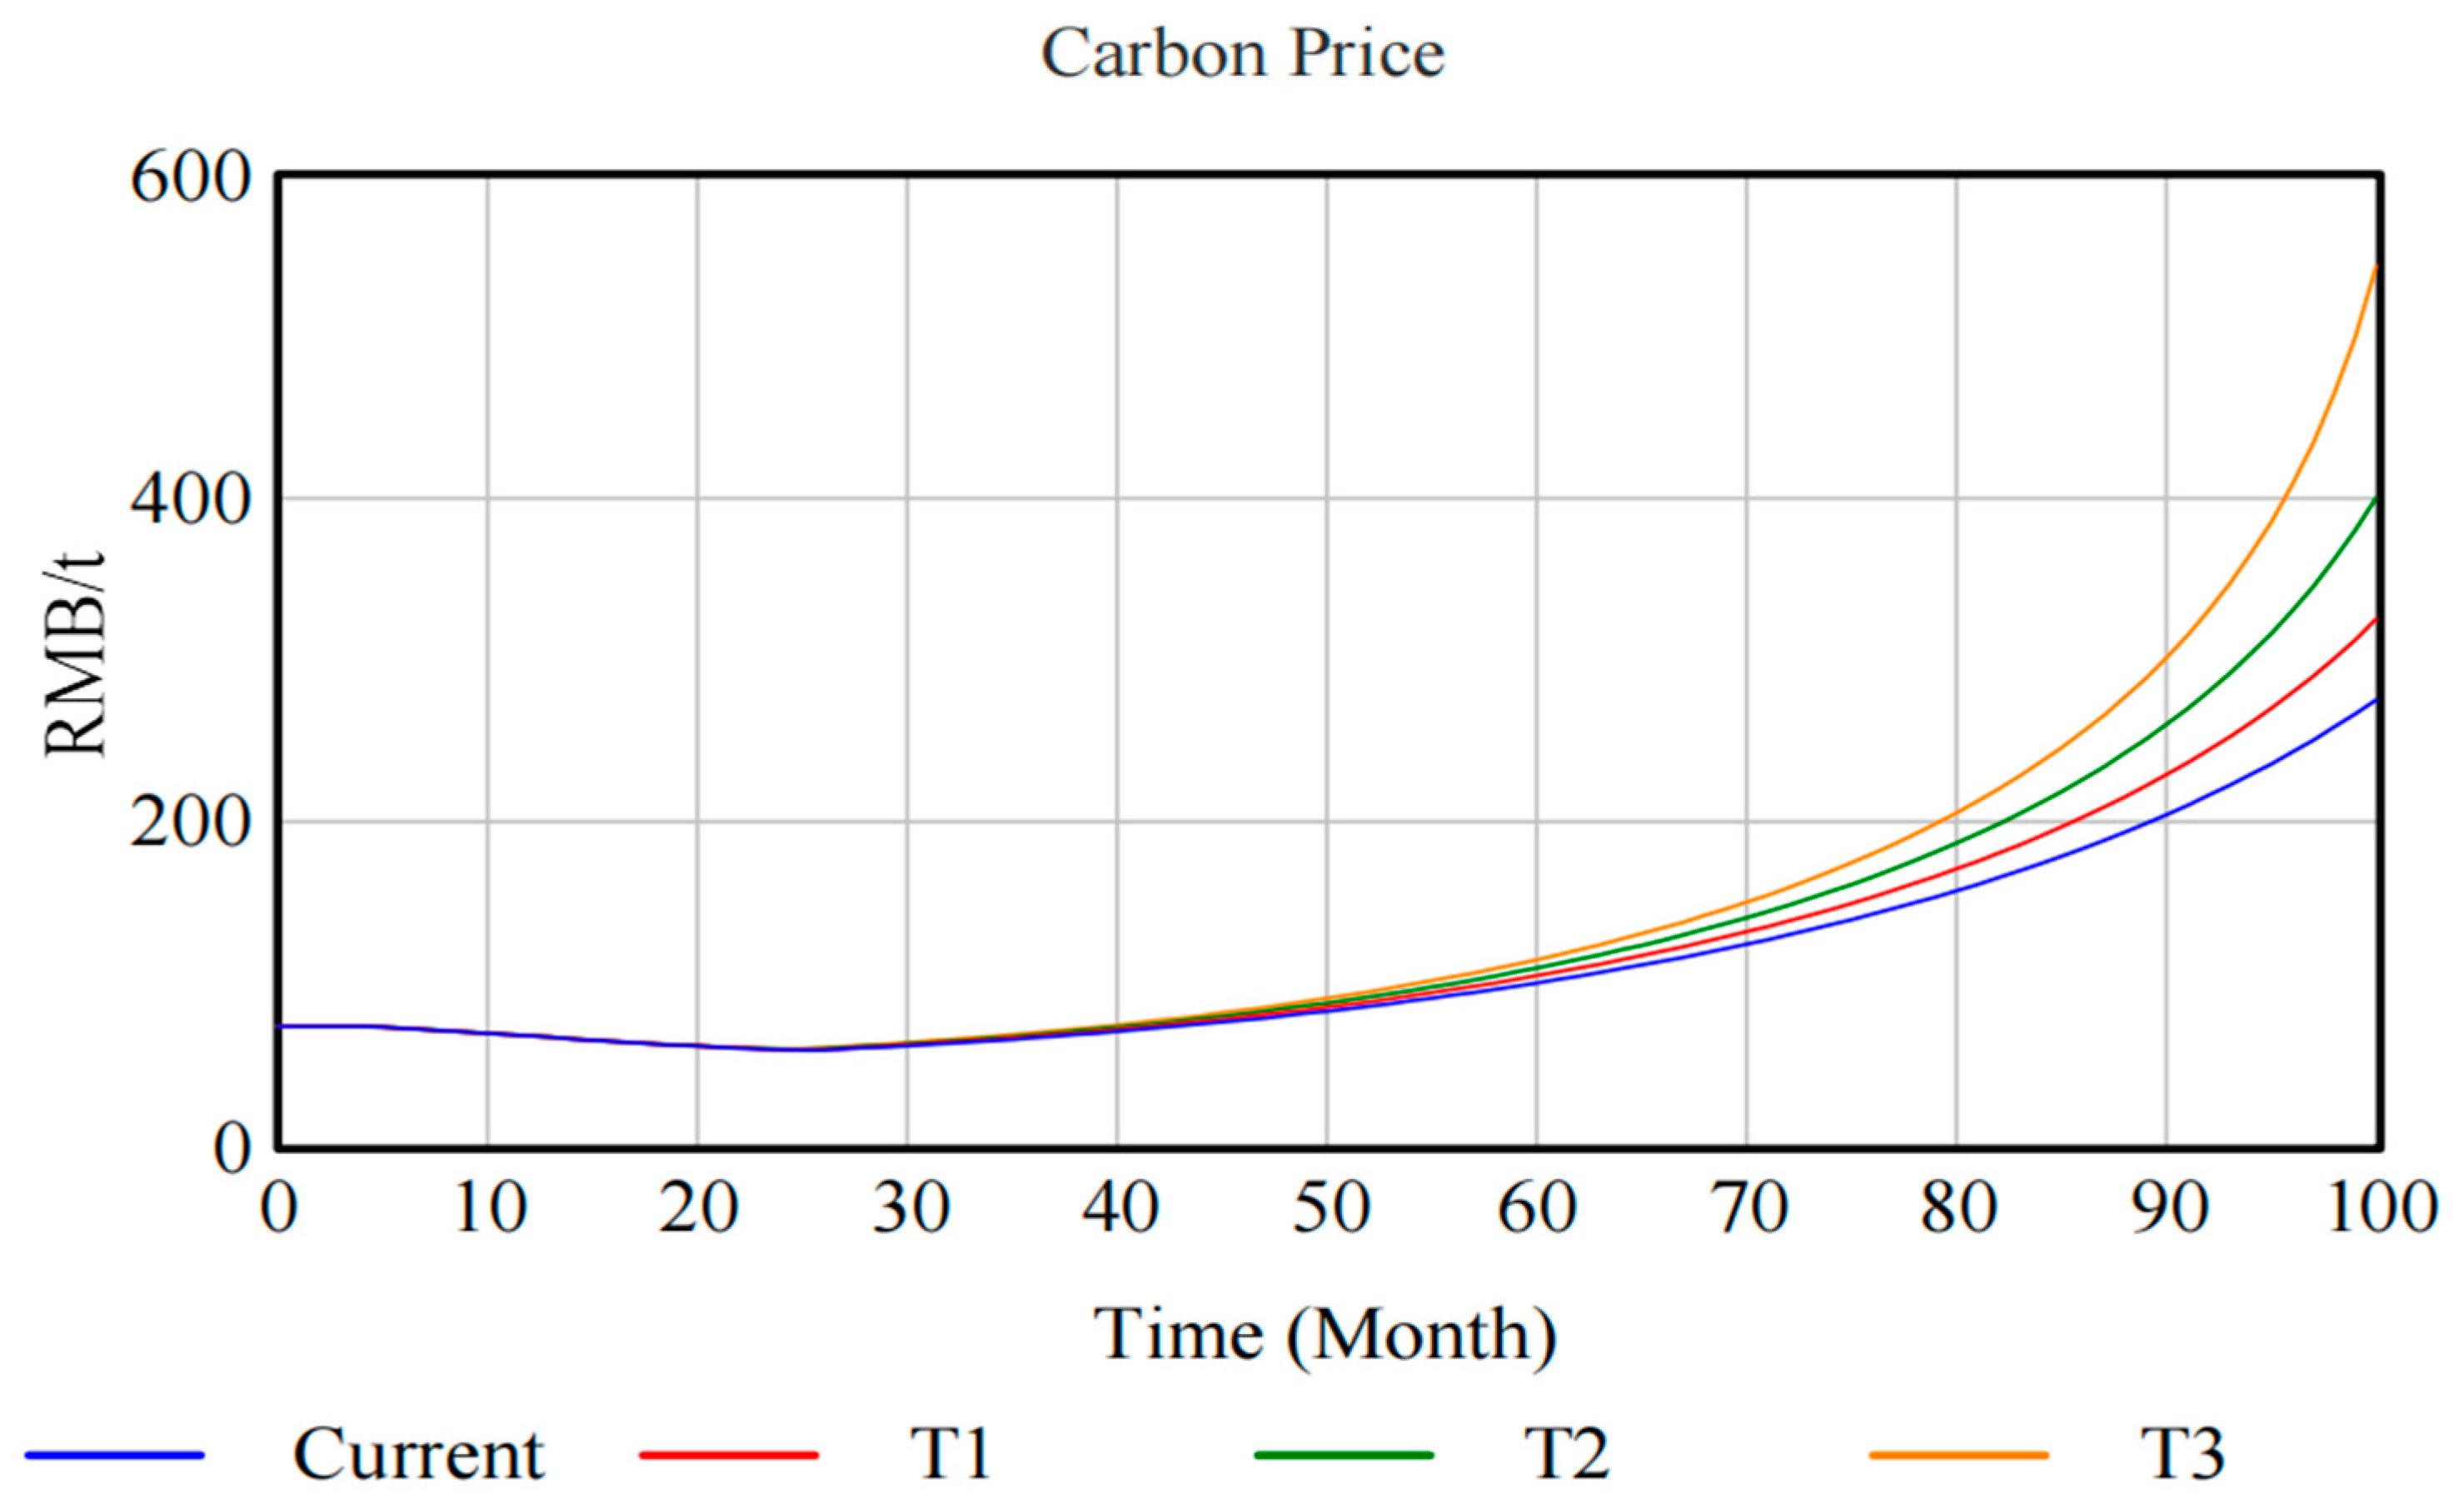
As can be seen in
Figure 12, the trend change in carbon quota price under the integrated policy incentives scenario is similar to the trend of carbon price change under the baseline scenario, but the final peak is larger than the peak of carbon price under the baseline scenario. In the deepening stage after February 2027, the carbon price starts to rise gradually, and under the T3 scenario, the carbon price continues to rise sharply, and the speed of change remains the fastest, eventually reaching RMB 543.404/ton, with a growth rate of T3 > T2 > T1 > benchmark scenario, and T3 is 97% higher than this benchmark scenario. This scenario follows the same trend of change as the quota tightening scenario, but there is a difference in the final peak, which is 16.3 per cent higher in the T3 scenario than in the quota tightening scenario. This is due to the fact that the carbon market is significantly affected by a combination of policy incentives rather than just the tightening of carbon allowances throughout the time period, with carbon prices rising to promote renewable energy.
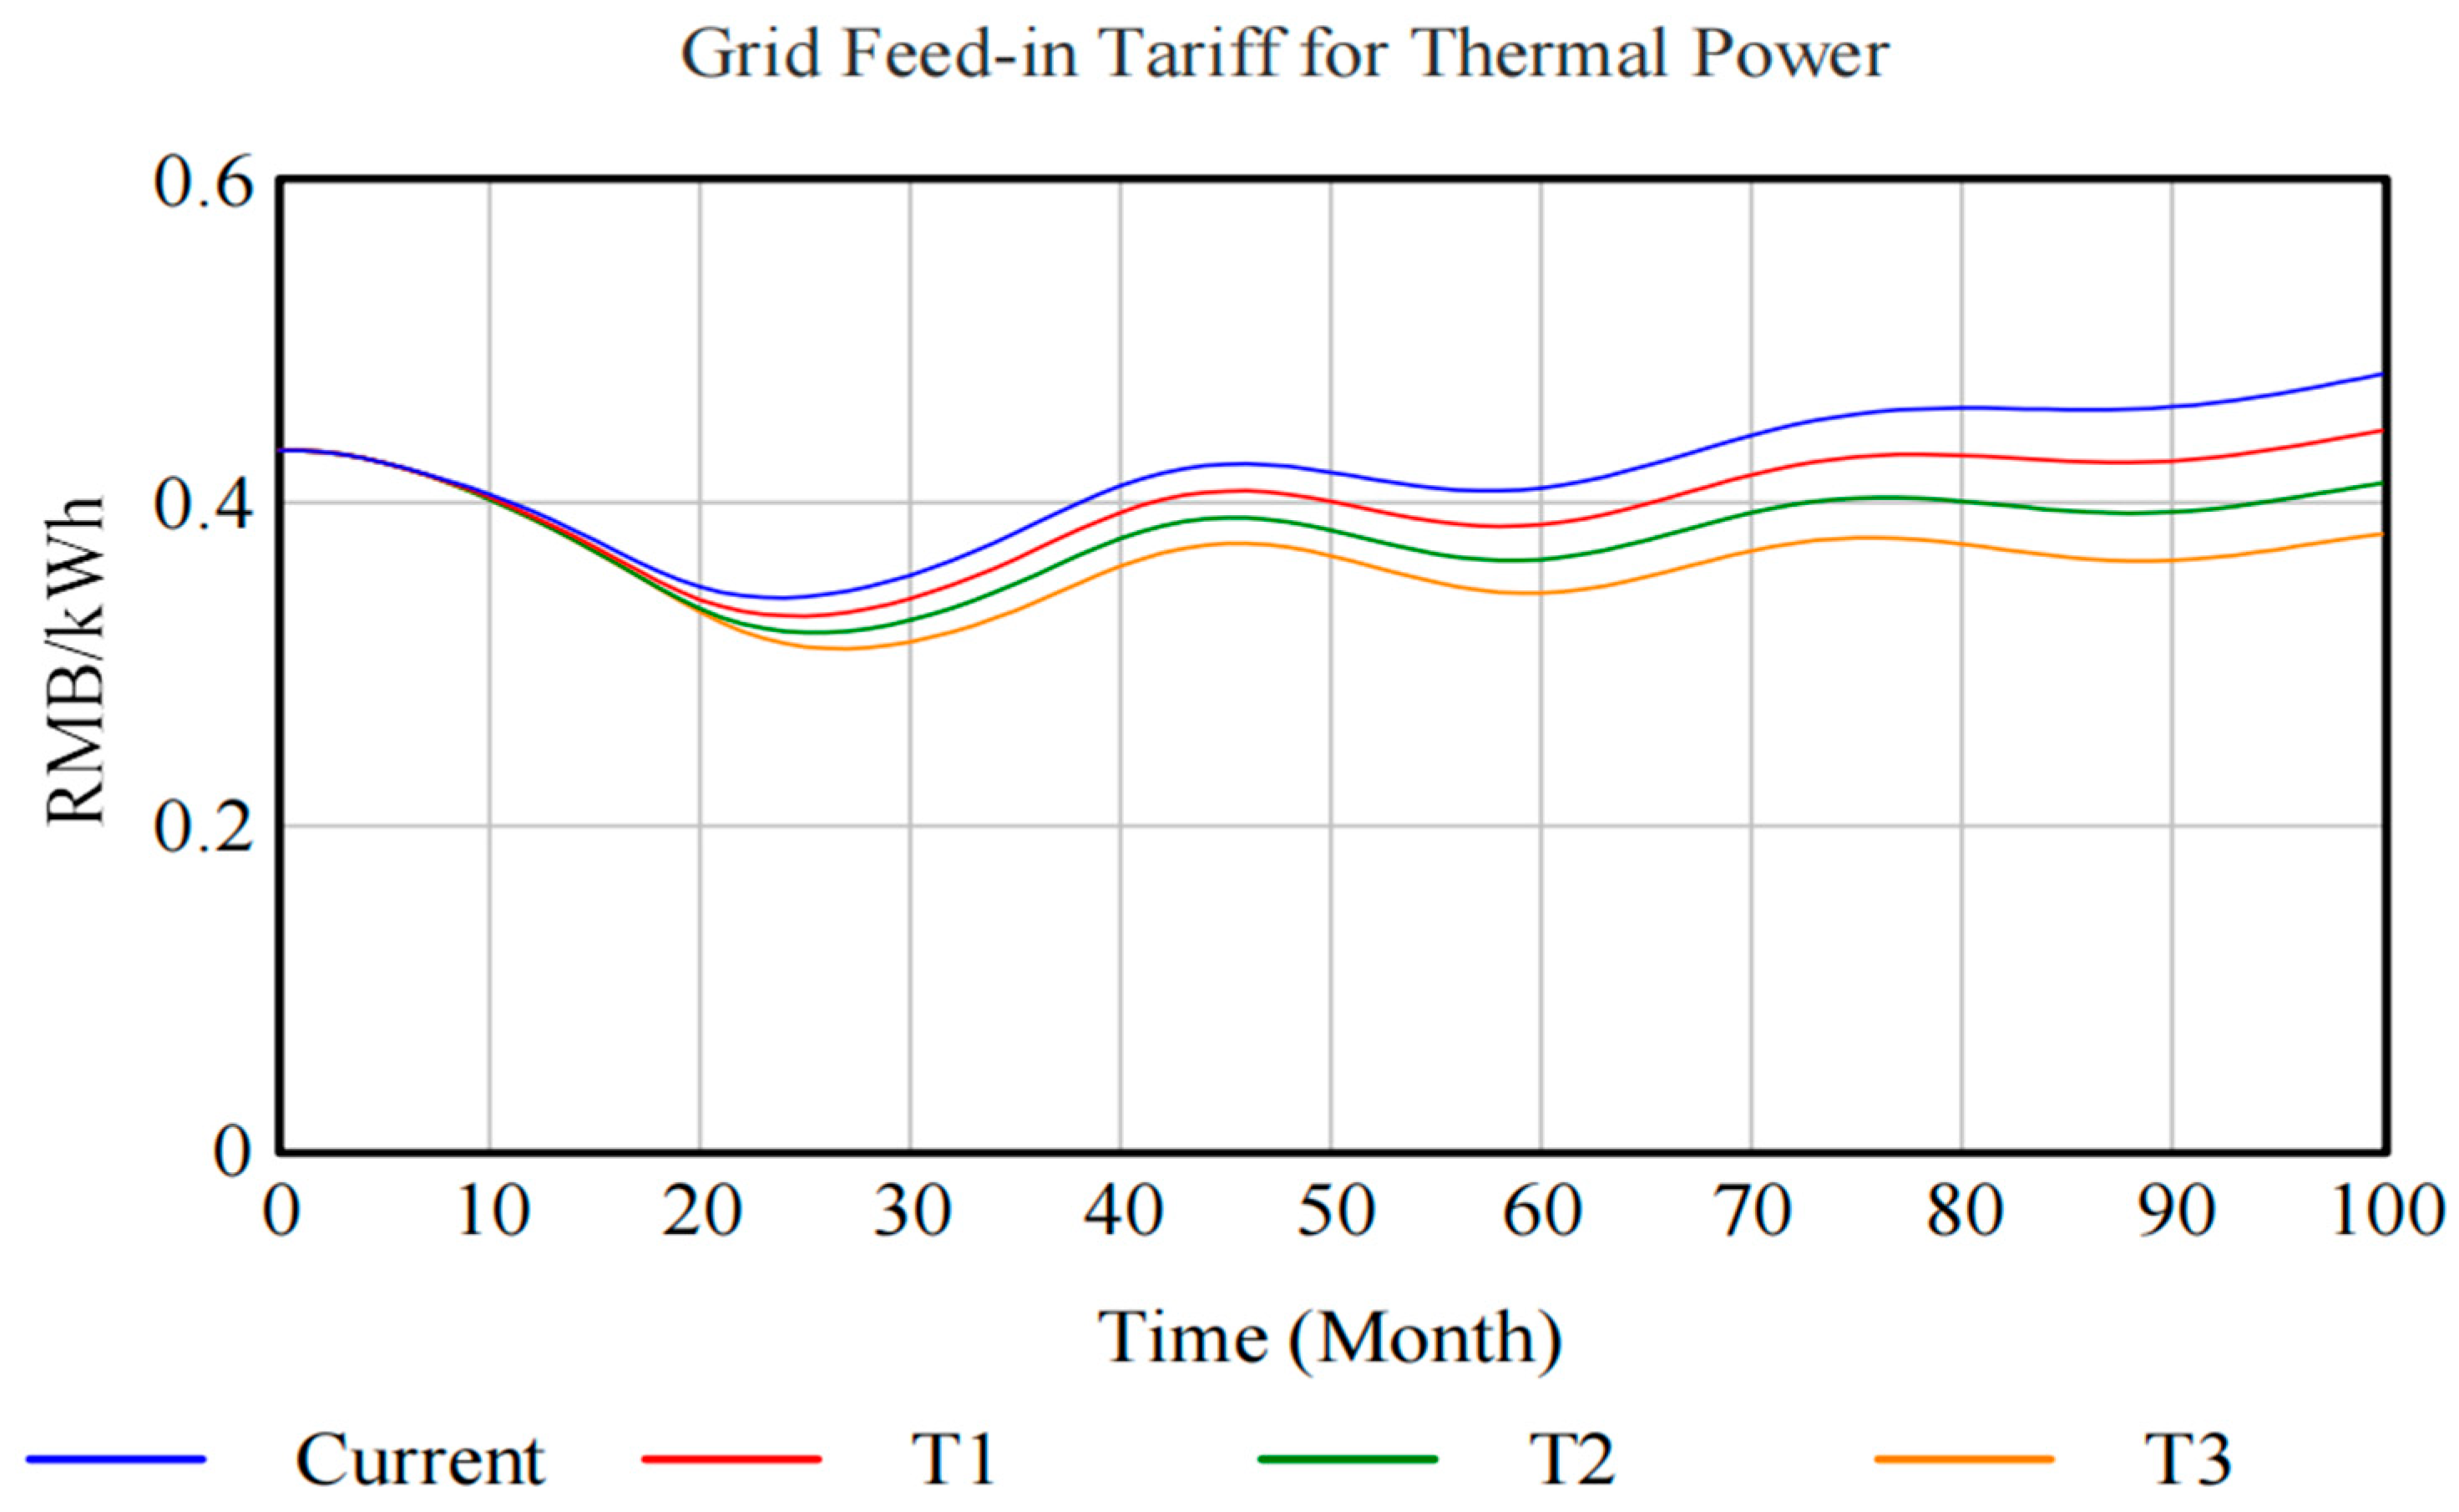
As can be seen in
Figure 13, under the integrated policy incentives scenario, thermal power feed-in tariffs have been on a downward trend from January 2024 to November 2025 in the start-up phase and begin to rise gradually in January 2026 at the end of the start-up phase. In the deepening phase, thermal power tariffs increase annually after February 2027, with a sharp increase in thermal power prices at the beginning of the deepening phase, followed by a lower rate of price increase, and ultimately remaining relatively stable with slight fluctuations. The thermal feed-in tariffs under each scenario are baseline > T1 > T2 > T3, with the T3 scenario declining by 20.6 per cent compared to the baseline scenario. This is due to the fact that under the incentives of various policies, enterprises begin to switch to renewable energy and reduce the use of traditional energy sources, resulting in the thermal power market supply exceeds demand, and in this process, under the carbon market supply and demand mechanism, the carbon price shows a faster upward trend, and the feed-in tariff of thermal power has wavy ups and downs, which reveals the transmission effect of the carbon price on the adjustment of the electric power structure.
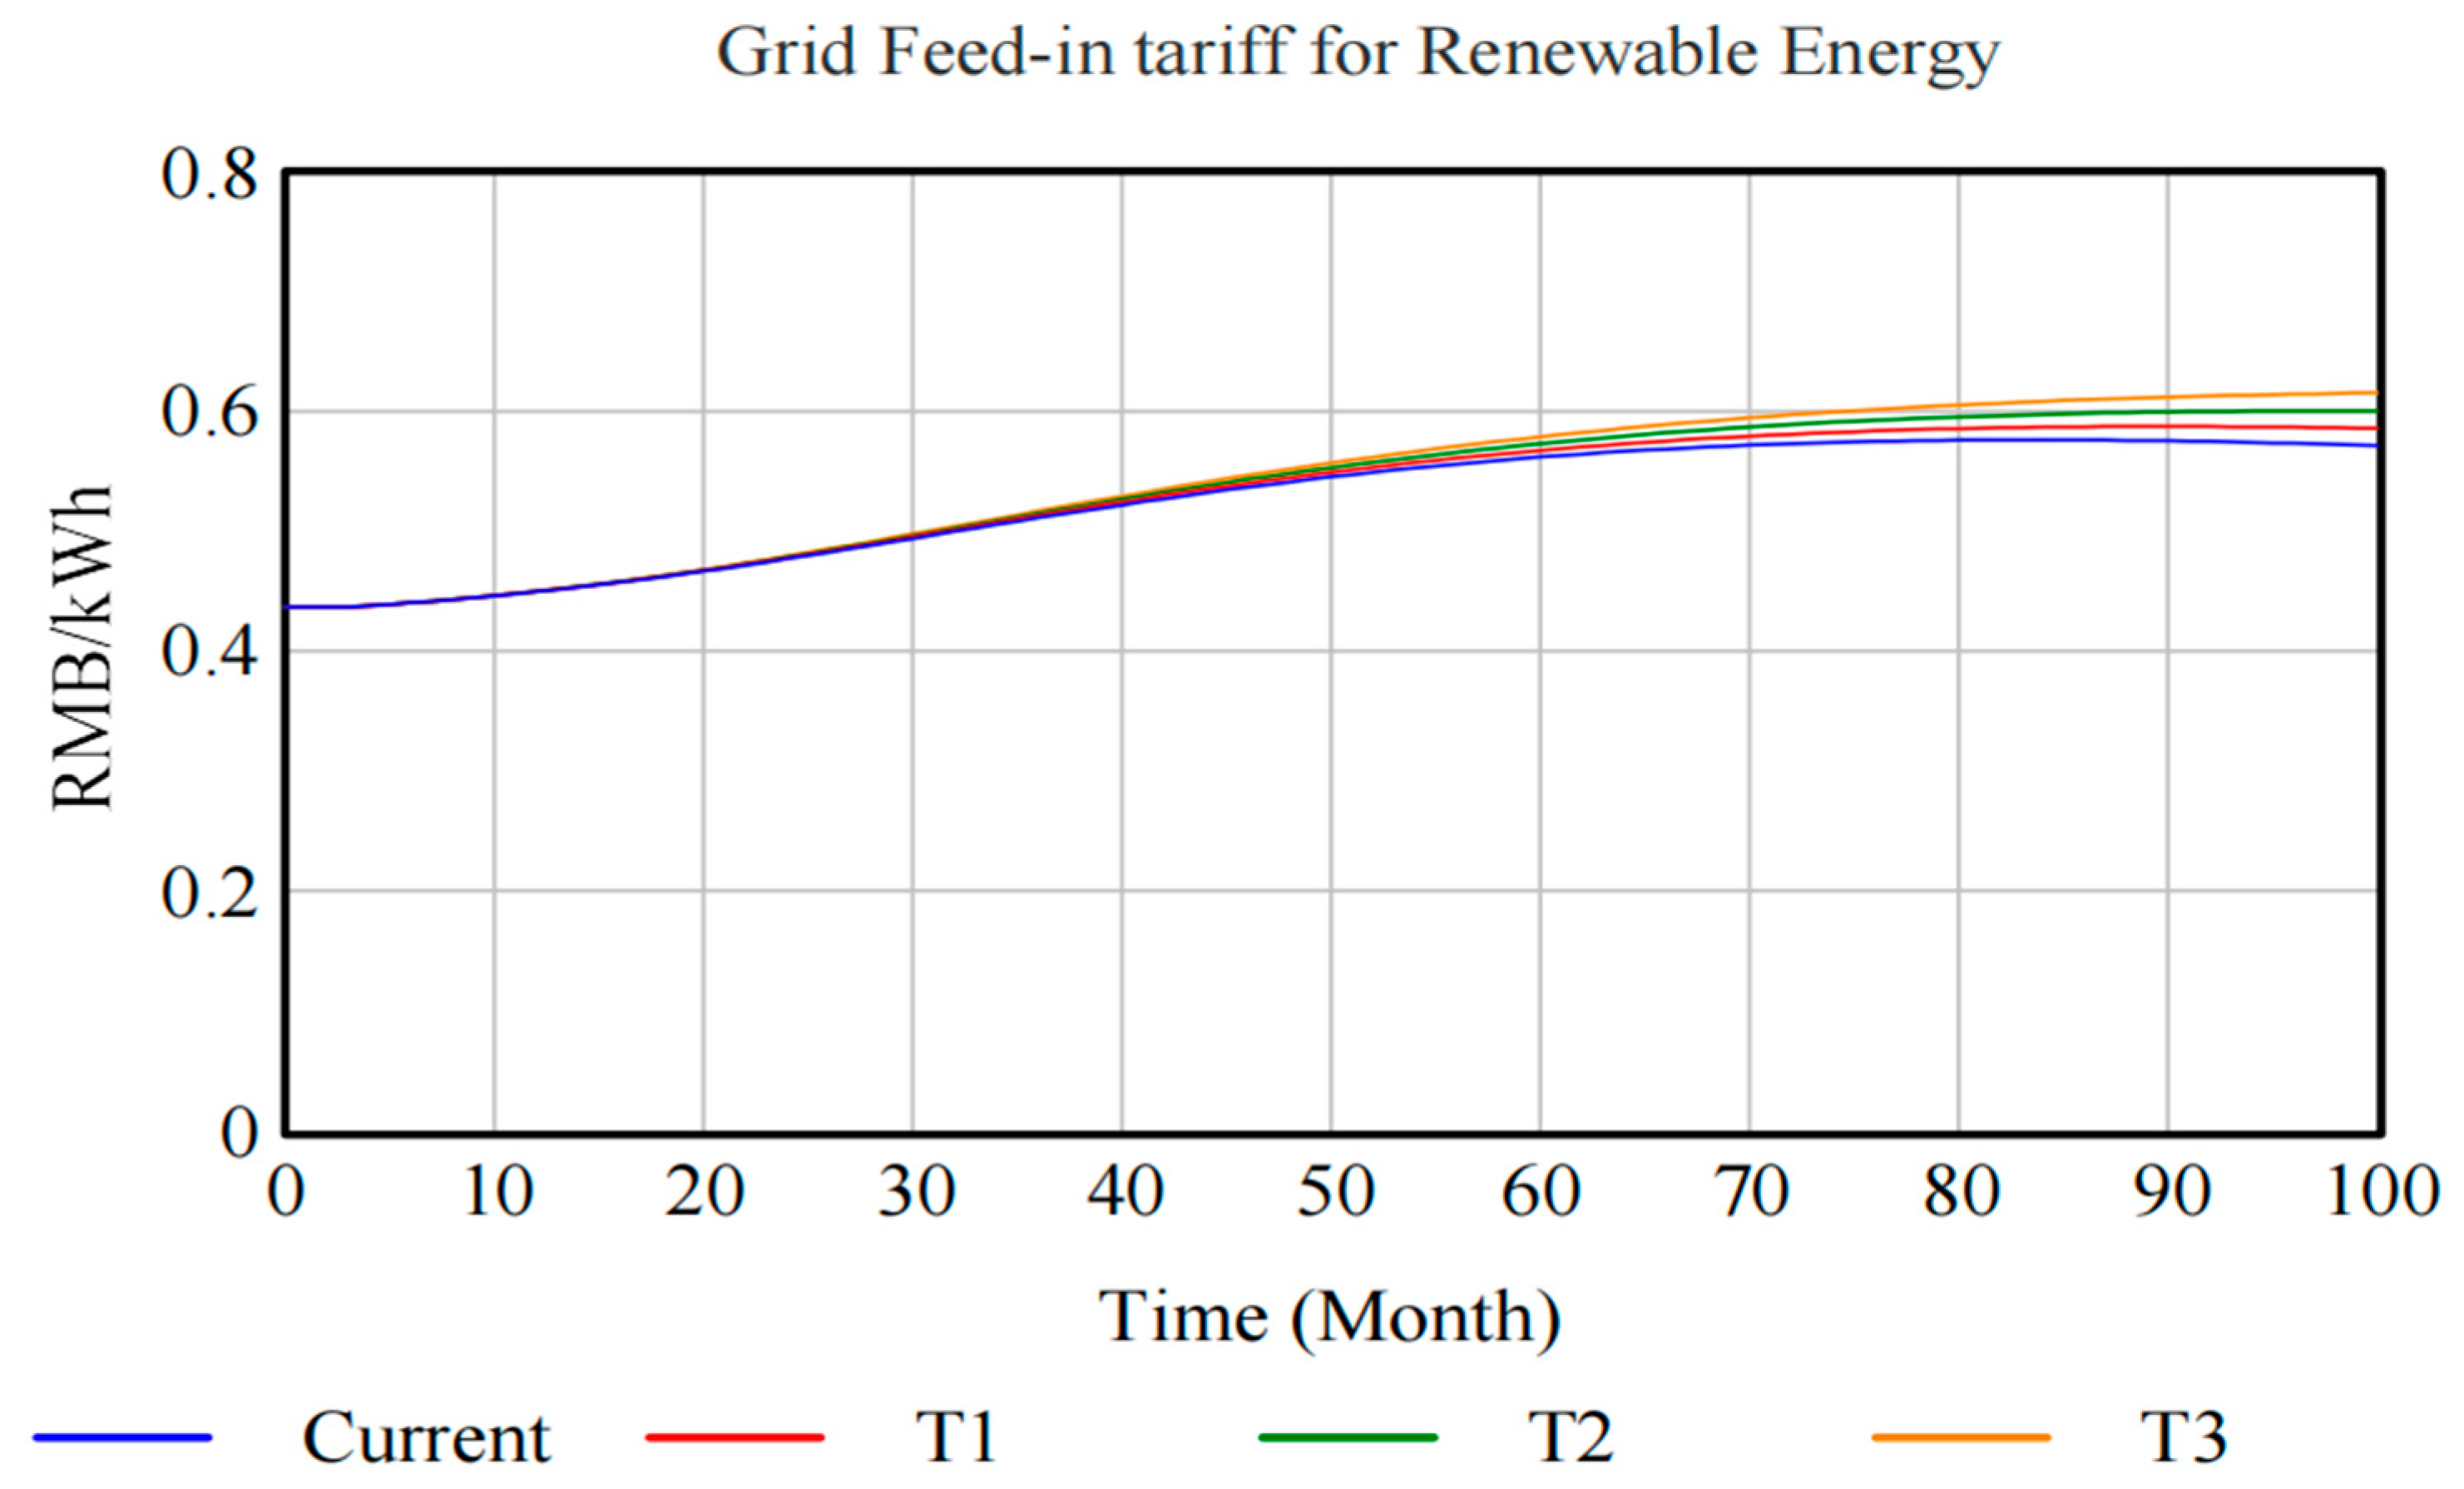
As can be seen in
Figure 14, under the integrated policy incentives scenario, renewable energy feed-in tariffs in the start-up phase from January 2024 to December 2026, the renewable energy feed-in tariffs in all scenarios maintain a steady increase. After 2027, in the deepening phase, the rate of increase in renewable energy feed-in tariffs begins to decline, showing a slow upward trend. Changes in the renewable feed-in tariffs under this scenario are in line with the changes in the scenario for promoting renewable energy consumption, with the T3 scenario rising by about 7.7 per cent compared to the baseline scenario. This is due to the fact that under the situation of continuous incentives from comprehensive policies and rising carbon prices, enterprises will increase their demand for renewable energy in order to improve their own economic value accordingly, and the feed-in tariffs for renewable energy will gradually rise as the market supply is less than demand; while in the deepening stage, the market demand for renewable energy is gradually stabilizing and slowly rising, and, therefore, the feed-in tariffs for renewable energy are also gradually maintaining a slow rise and tending to stabilize.
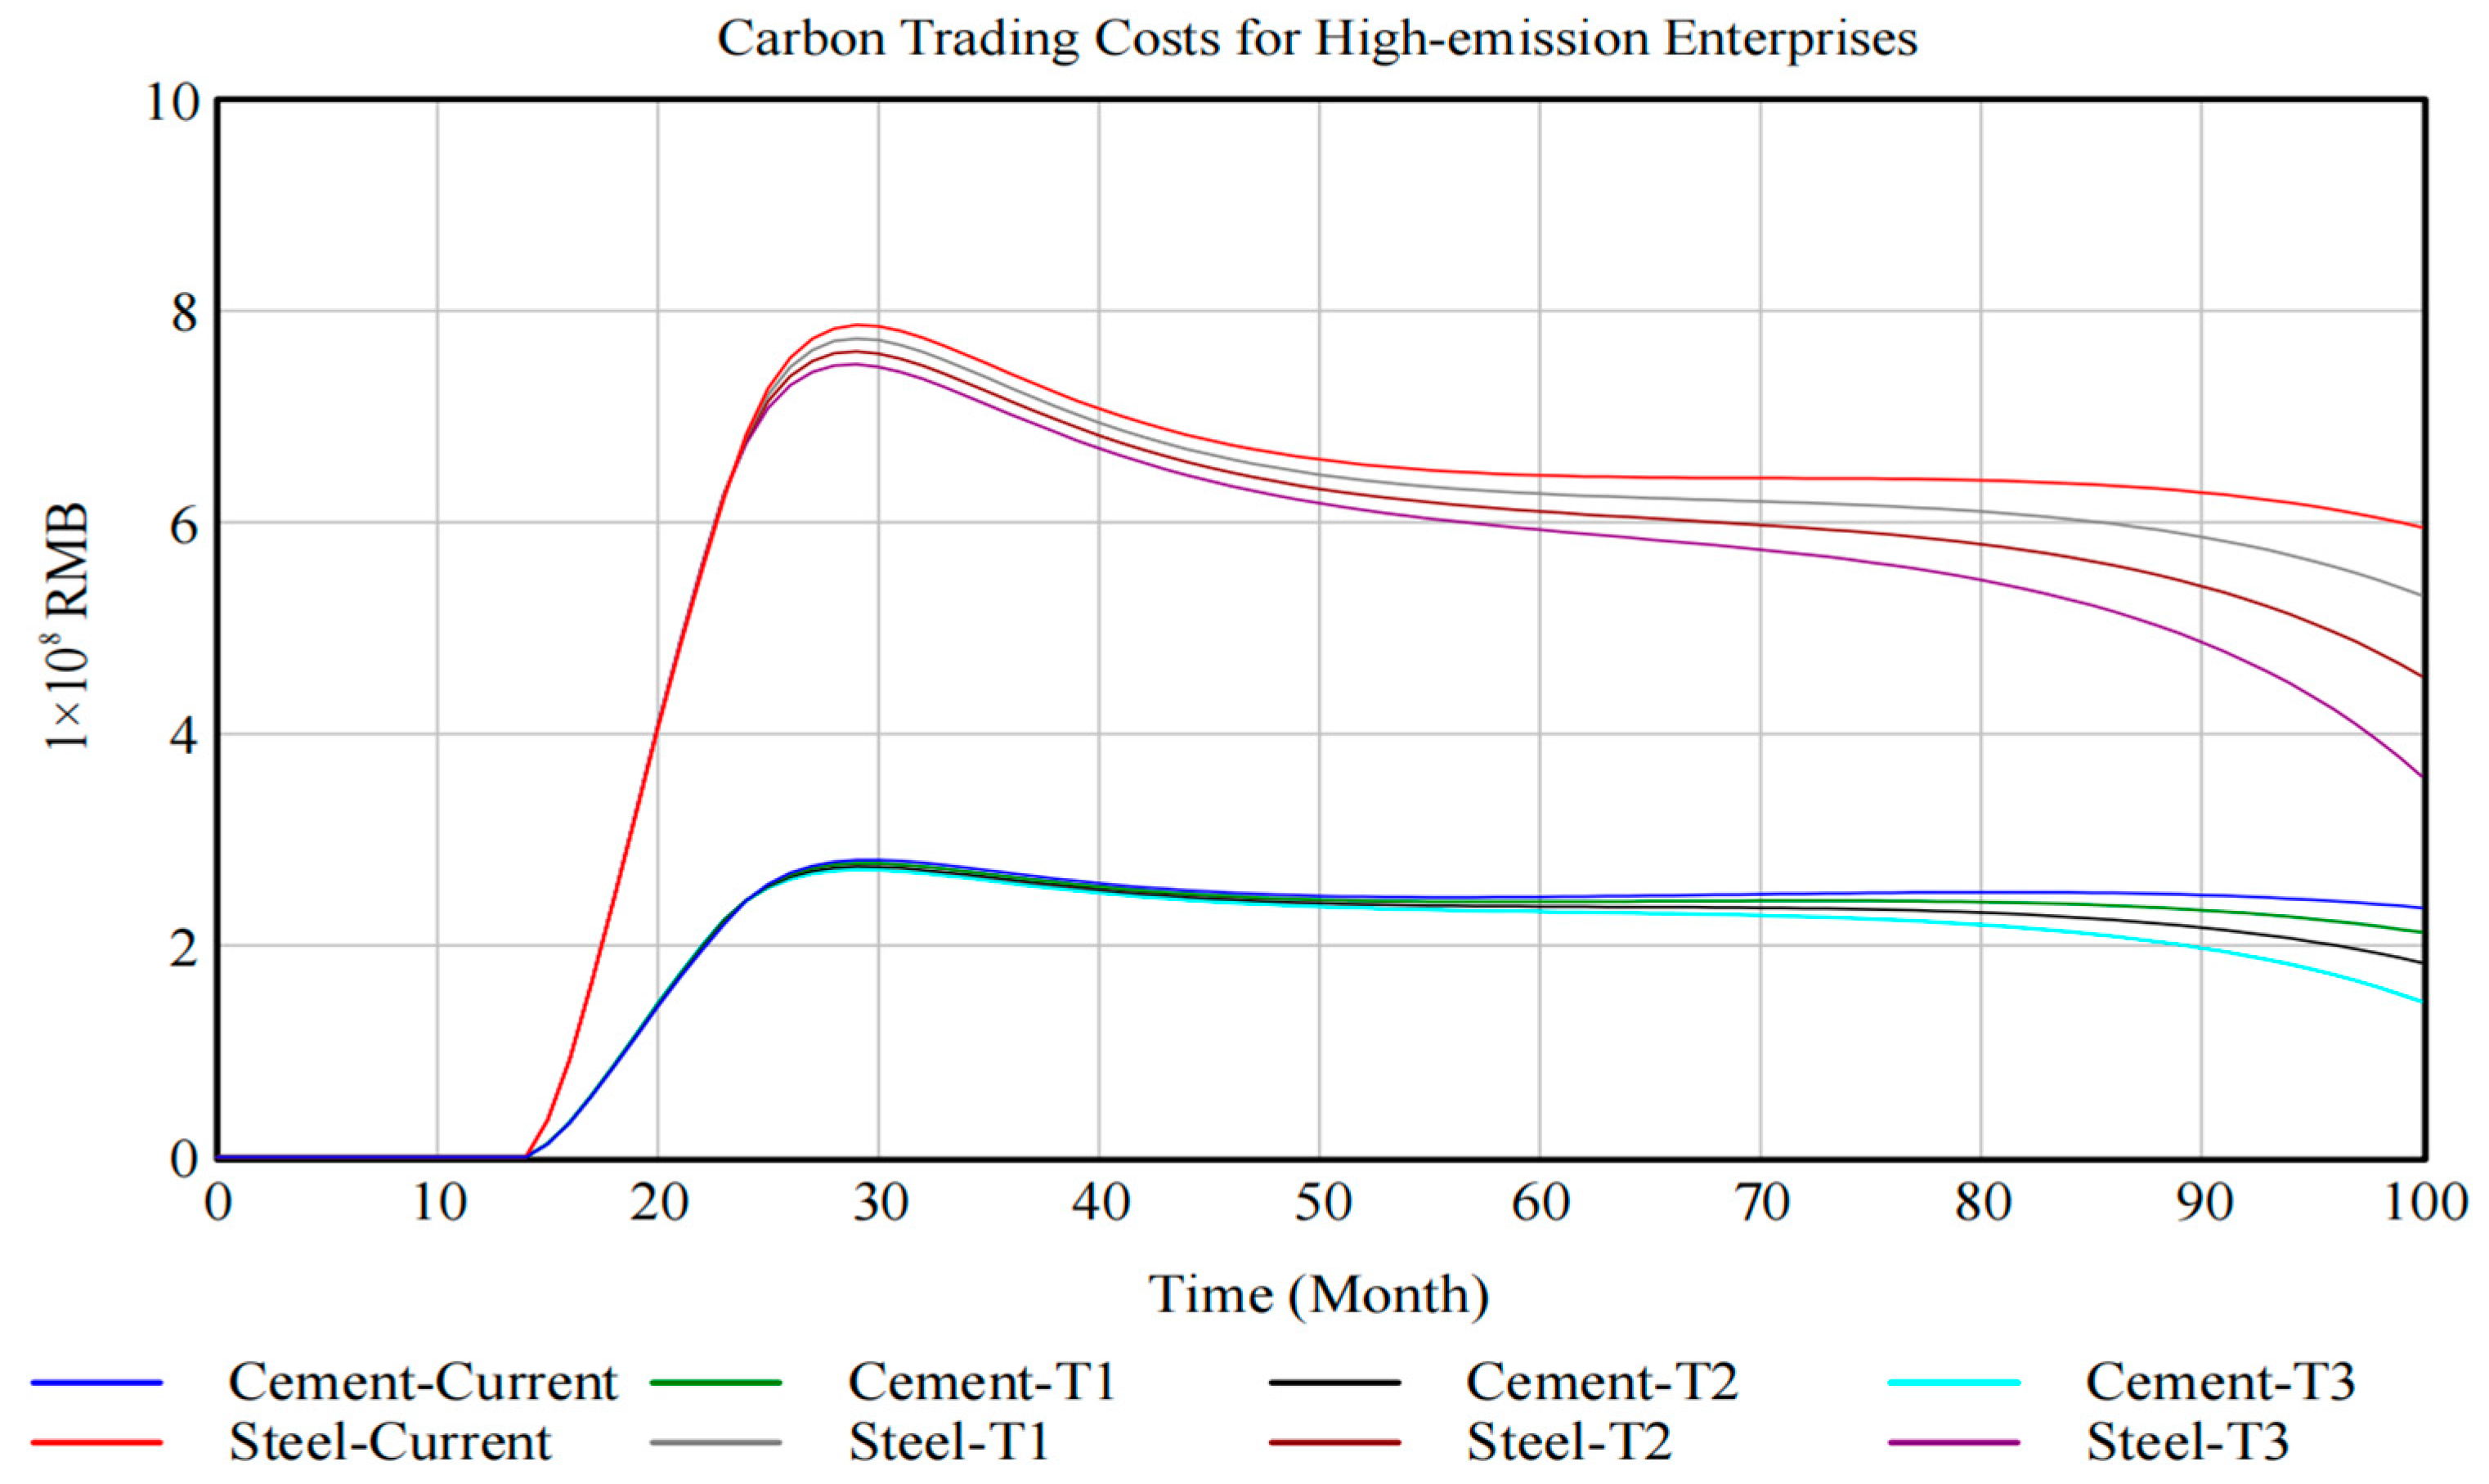
As can be seen in
Figure 15, under the integrated policy incentive scenario, the cost of carbon allowances for high-emission enterprises starts to rise gradually in the start-up phase from January 2025 to March 2026 and reaches the peak at the end of the start-up phase, with the difference that the carbon trading costs of high-emission enterprises under the T3 scenario peak first, followed by T2 and T1, and the baseline scenario peaks last, although the four scenarios peak at different times for steel and cement companies. In the deepening phase after 2027, the carbon trading costs of both steel and cement companies start to decline slowly, reaching a minimum at the end of 2028 and starting to maintain a slow rise. With the incentives of the comprehensive policy, the carbon costs of steel and cement companies begin to change, and the carbon costs become the baseline scenario > T1 > T2 > T3, which is 2.8 times higher than the carbon costs of cement companies. This shows that with the increase in the incentive effect of the policy, the high-emission enterprises will actively respond to the policy to reduce their own carbon emissions so as to reduce their own carbon trading costs.
5. Discussion and Conclusions
This study has established a system dynamics model of the power market and carbon market under the carbon expansion policy, involving multiple stakeholders. Through the simulation analysis of the coupled system, the following conclusions were obtained.
The impact of carbon market expansion on various stakeholders in the power market and carbon market shows distinct phased characteristics. In the initial stage of expansion, due to the lenient allocation of carbon quotas and the unfamiliarity of newly included industries with the trading mechanism, market activity was low, the overall carbon price declined, and the carbon trading costs of thermal power enterprises remained stable, with no significant impact on electricity prices. High-emission enterprises enjoyed full free quotas in the first year, with zero carbon trading costs. In the second year, after the shift to an emission intensity control quota policy, the carbon trading costs of steel enterprises were already significantly higher than those of cement enterprises. Entering the deepening stage, as the quota policy tightened, the carbon price rose rapidly, and the carbon trading costs of thermal power, steel, and cement enterprises all increased. At the same time, the continuous increase in the proportion of renewable energy consumption responsibility weights promoted the growth of green electricity demand, and the on-grid electricity price of renewable energy rose steadily.
Scenario analysis further reveals the dynamic correlation between policies and the market. In the scenario of tightened quotas, the carbon price rose significantly, reaching a peak of RMB 467.125 per ton in April 2032 under the R3 scenario, imposing severe cost pressure on high-emission enterprises, especially steel enterprises, highlighting the urgency for them to reduce carbon emissions through technological innovation and optimize quota management to control costs. In the scenario of promoting renewable energy consumption, while the price of green electricity rose, the energy and power demand was about 7.7% higher than the baseline scenario, and the carbon trading costs of high-emission enterprises decreased, confirming the role of increasing green electricity usage in optimizing the energy structure and enhancing sustainability. In the comprehensive policy incentive scenario, the carbon price rose sharply to RMB 543.404 per ton, and the on-grid electricity price of thermal power fluctuated in a wave-like pattern. The demand for renewable energy increased by 8.9% compared to the baseline scenario, clearly guiding power enterprises to increase the proportion of green electricity, while the changes in the carbon trading costs of high-emission enterprises highlighted the need for them to accelerate low-carbon transformation through energy conservation, emission reduction, and the application of green electricity. These dynamics indicate that policies shape market signals through paths such as quota tightness and green electricity incentives, pushing enterprises to optimize their decisions amid cost pressure and transformation opportunities and accelerating the transition to a low-carbon model.
In summary, high-emission enterprises and power companies should be more sensitive to policies, and different stakeholders should actively respond to the opportunities and challenges brought by carbon expansion by combining their own characteristics. Through reasonable planning and effective responses, different stakeholders can prepare in advance, enhancing their competitiveness and market adaptability. Additionally, the conclusions of this study not only provide theoretical support for enterprise strategic decision-making but also provide policymakers with valuable references when formulating and adjusting carbon policies.
Author Contributions
Conceptualization, G.X.; methodology, G.X.; software, G.X. and W.N.; validation, G.X., W.N. and Z.X.; formal analysis, G.X.; investigation, X.Z.; resources, G.X.; data curation, Y.W.; writing—original draft preparation, G.X.; writing—review and editing, G.X. and W.N.; visualization, C.C.; supervision, G.X.; project administration, G.X.; funding acquisition, G.X. All authors have read and agreed to the published version of the manuscript.
Funding
The authors declare that financial support was received for the research, authorship, and/or publication of this article. This paper is supported by the following research project: carbon emission reduction paths of key industries and coping strategies of power grid companies under the background of national carbon market expansion in 2025 by the State Grid Jiangsu Economic and Technological Research Institute Co., Ltd. (SGJSJY00GHJS2500026).
Data Availability Statement
The original contributions presented in this study are included in the article. Further inquiries can be directed to the corresponding authors.
Conflicts of Interest
All authors are employed by the State Grid Jiangsu Economic and Technological Research Institute Co., Ltd.
Abbreviations
The following abbreviations are used in this manuscript:
| CETM | China’s Carbon Emission Trading Market |
| CCER | China Certified Emission Reduction |
| RES | Renewable Energy Source |
| TP | Thermal Power Plant |
| CEA | Chinese Emission Allowance |
| PV | Purchase Volume |
| SV | Sales Volume |
| LCOE | Levelized Cost of Energy |
| SE | Steel Enterprise |
| CE | Cement Enterprise |
References
- Zhang, Y.J.; Wang, X. The impact of carbon emissions trading scheme on sustainable economic welfare in China. Syst. Eng.-Theory Pract. 2023, 43, 309–320. [Google Scholar]
- Guangming Daily. Opening a New Situation of the Rule of Law in Carbon Emission Rights Market Trading. Available online: https://www.gov.cn/zhengce/202402/content_6934526.htm (accessed on 2 March 2025).
- Ministry of Ecology and Environment of the People’s Republic of China. National Carbon Emission Trading Market Coverage of Cement, Iron and Steel, and Electrolytic Aluminum Sectors Working Program (Draft for Comments). Available online: https://www.mee.gov.cn/xxgk2018/xxgk/xxgk06/202409/t20240909_1085452.html (accessed on 30 May 2025).
- Jiang, H.D.; Liu, L.J.; Dong, K.; Fu, Y.W. How will sectoral coverage in the carbon trading system affect the total oil consumption in China? A CGE-based analysis. Energy Econ. 2022, 110, 105996. [Google Scholar] [CrossRef]
- Cui, Z.F.; Shangguan, F.Q.; Ma, W.L.; Li, X.; Liu, Z.D.; Yin, R.Y. Discussion on the future development trend of China’s iron and steel industry under the background of double carbon. J. Eng. Sci. 2025, 47, 862–874. [Google Scholar]
- Wang, H.R.; Feng, T.T.; Li, Y.; Kong, J.J. Synergistic optimization of trading decision and market mechanism in the “electricity-carbon-certificate” market. China Popul. Resour. Environ. 2024, 34, 18–29. [Google Scholar]
- Wang, H.R.; Feng, T.T.; Kong, J.J.; Cui, M.L.; Zha, D.S. China’s provincial net-zero emissions effort: High-quality choices behind up-bottom quota schemes. Resour. Conserv. Recycl. 2025, 215, 108–118. [Google Scholar] [CrossRef]
- Jiang, H.D.; Zhang, S.X.; Yan, S.Y.; Teng, Q.; Liang, Q.M. Economy-wide impacts of industry coverage in China’s carbontrading system under the context of power marketization reform. Syst. Eng.—Theory Pract. 2025, 7, 1–19. [Google Scholar] [CrossRef]
- Tang, B.J.; Ji, C.Q. Research on the Economic and Emission Impacts of the Expansion Strategy of the National Carbon Market. J. Beijing Inst. Technol. (Soc. Sci. Ed.) 2022, 24, 129–139. [Google Scholar] [CrossRef]
- Liu, H.; Xia, L.; Tao, N.N.; Chen, X.L.; Deng, Y.H.; Zhao, L.Y.; Wang, K. Comparative study on steel industry allowance allocationamong regional carbon market and its implications for national carbon market. Environ. Ecol. 2025, 7, 175–182. [Google Scholar] [CrossRef]
- Wu, R.X.; Tan, Z.Z.; Lin, B.Q. Does carbon emission trading scheme really improve the CO2 emission efficiency? Evidence from China’s iron and steel industry. Energy 2023, 277, 127743. [Google Scholar] [CrossRef]
- Liu, S.Y.; Wang, M.; Zhou, P. Carbon pass-through in Chinese cement industry. Energy Econ. 2025, 144, 108413. [Google Scholar] [CrossRef]
- Yue, T.; Wang, H.; Li, C.; Hu, Y. Optimization strategies for green power and certificate trading in China considering seasonality: An evolutionary game-based system dynamics. Energy 2024, 311, 133355. [Google Scholar] [CrossRef]
- Meng, X.; Yu, Y. Can renewable energy portfolio standards and carbon tax policies promote carbon emission reduction in China’s power industry? Energy Policy 2023, 174, 113461. [Google Scholar] [CrossRef]
- Chang, X.; Wu, Z.Y.; Wang, J.T.; Zhang, X.Y.; Zhou, M.; Yu, T. The coupling effect of carbon emission trading and tradable green certificates under electricity marketization in China. Renew. Sustain. Energy Rev. 2023, 187, 113750. [Google Scholar] [CrossRef]
- Wu, R.G.H.X.G.; Yang, C.; Ma, Y.Z.; Yu, T.; Zhao, H.R. Analysis of Synergistic Effects of Electricity-Energy-Carbon Market Based on System Dynamics. Sci. Technol. Manag. Res. 2024, 44, 211–222. [Google Scholar] [CrossRef]
- Zhang, Y.; Zhao, X.G.; Zhou, Y.; Wang, H. Impact of combined environmental policies on carbon emission reduction: A system dynamics analysis. Util. Policy 2025, 94, 10912. [Google Scholar] [CrossRef]
- Xiao, P.; Chen, Z.F. Analysis of Power Market, Electricity-carbon Coordination and Power System Economy. China Power Enterp. Manag. 2025, 64–65. [Google Scholar]
- Yu, H.B.; Yuan, X.C.; Tang, L.; Jiang, Y.L.; Shen, J. Bidding Strategy and Price Transmission Mechanism of Virtual Power Plants Participating in the Electricity Carbon Joint Market Under the New Power System. Power Syst. Big Data 2024, 27, 1–15. [Google Scholar]
- National Development and Reform Commission. Notice of the National Development and Reform Commission on Improving the Benchmark Electricity Price Policy for On-Grid Wind and Photovoltaic Power Generation. Available online: https://www.ndrc.gov.cn/xxgk/zcfb/tz/201512/t20151224_963536.html (accessed on 24 December 2015).
| Disclaimer/Publisher’s Note: The statements, opinions and data contained in all publications are solely those of the individual author(s) and contributor(s) and not of MDPI and/or the editor(s). MDPI and/or the editor(s) disclaim responsibility for any injury to people or property resulting from any ideas, methods, instructions or products referred to in the content. |
© 2025 by the authors. Licensee MDPI, Basel, Switzerland. This article is an open access article distributed under the terms and conditions of the Creative Commons Attribution (CC BY) license (https://creativecommons.org/licenses/by/4.0/).

