Abstract
This study aimed to optimize the extraction of total phenolic compounds (TPC) from Tunisian walnut bark using microwave treatment. Initially, a preliminary investigation was conducted to establish optimal levels for ethanol concentration, liquid–solid ratio, temperature, and time, which were then applied in subsequent conventional solvent extraction (CSE) experiments. To enhance the extraction yield, multi-stage microwave-assisted extraction (MS MAE) was evaluated using three microwave power settings: 100, 200, and 300 W. The results showed a statistically significant (p < 0.05) effect of microwave irradiation combined with multiple solvent extraction stages. The optimized MS MAE protocol, employing 300 W power, six stages of 10 min each, and a liquid–solid ratio of 10 mL/g, achieved an 86% recovery of TPC. In contrast, extraction involving 10 stages of 30 min each without microwave irradiation recovered only 79% of TPC. UHPLC–MS analysis revealed that the phenolic profile of the extracts was dominated by gallic acid, vanillic acid, and quercetin, and that microwave treatment did not significantly alter the qualitative or quantitative composition of these major phenolic compounds compared to conventional extraction. These findings demonstrate that MS MAE is a time-saving, energy-saving, solvent-reducing, and highly efficient extraction technology for producing bioactive extracts from walnut bark.
1. Introduction
The Juglans regia L. (Juglandaceae), commonly known as walnut, is a globally significant deciduous tree species with a wide distribution across temperate regions [1]. In Tunisia, walnut populations are primarily concentrated in northern regions.
Tunisian walnut tissues, including bark, husk, pellicle, and buds, are recognized as rich sources of phenolic compounds, notably naphthoquinones (such as juglone and hydrojuglone), hydroxybenzoic acids (e.g., gallic acid), hydroxycinnamic acids, and a diverse array of flavonoids (including quercetin, catechin, and their glycosides) [2,3]. Comprehensive phytochemical analyses have identified more than 80 individual phenolics in various walnut tissues, with bark containing significant amounts of naphthoquinones, flavanols, flavonols, and hydroxybenzoic acids [3,4]. These compounds contribute to the strong antioxidant, antimicrobial, and bioactive properties attributed to walnut extracts [2,3,4]. This phenolic diversity underlines the potential of Tunisian walnut by-products as valuable sources of bioactive molecules for food, pharmaceutical, and cosmetic applications [2,3,4,5].
Walnut bark (Juglans regia L.) is recognized as a rich source of phenolic compounds [2,3,4,5,6,7,8]. The extraction of phenolic compounds from walnut bark has garnered increasing scientific interest due to the high antioxidant and antimicrobial potential of these secondary metabolites [3,4,5,6,7,8,9]. Traditionally, aqueous ethanol and acetone have been the solvents of choice for extracting phenolics from walnut bark, with studies demonstrating that a solvent-to-bark ratio of 20/1 and moderate agitation can yield up to 20.6 mg gallic acid equivalents (GAE) per gram of dry bark [10]. The addition of salts such as ammonium sulfate to aqueous ethanol has also been shown to enhance extraction efficiency by improving phase separation and phenolic solubility [10]. The reliance of these conventional extraction methods on organic solvents, the prolonged processing times, and the high-energy demands—coupled with co-extraction of impurities—limit their efficiency and sustainability [9,10,11].
The phenolic profile of walnut bark includes naphthoquinones, gallic acid, catechins, and quercetin derivatives, all of which contribute to its strong antioxidant activity, as evidenced by high ferric reducing antioxidant power (FRAP) values [12,13]. Antibacterial assays have shown that walnut bark extracts, particularly those rich in caffeic acid and hydroquinone, exhibit inhibitory effects against Escherichia coli and Staphylococcus aureus comparable to standard antibiotics [14]. Despite these promising results, the high lignin content of walnut bark poses a challenge for efficient extraction, necessitating pretreatments such as milling and sonication [15]. Emerging green solvents, like aqueous eutectic solvents, are being explored for their selectivity and environmental benefits, although their application to walnut bark remains limited [16].
Emerging technologies such as microwave-assisted extraction (MAE) offer promising alternatives by leveraging electromagnetic waves to induce ionic conduction and dipole rotation, which disrupt plant matrices and enhance mass–heat transfer synergistically. MAE has demonstrated superior efficiency in recovering total phenolic content (TPC) compared to traditional methods, reducing solvent use and operational time while minimizing thermal degradation risks through optimized multi-stage protocols (MS MAE) [17,18,19,20,21,22,23,24,25,26]. Recent studies underscore the efficacy of multi-stage microwave-assisted extraction (MS-MAE) in enhancing bioactive compound recovery through sequential extraction cycles with solvent replenishment [27,28], as demonstrated by Chen et al. [29], who optimized triterpenoid saponin yields using dual 5 min MAE phases, and Yan et al., who implemented a triphasic 15 min protocol for astragaloside isolation [20].
Walnut bark’s lignocellulosic structure requires higher microwave power and long treatment duration to overcome mass transfer limitations. In this line, the investigation of multi-stage microwave-assisted extraction (MAE) for recovering phenolic compounds from walnut bark is of particular interest, as this approach—yet to be explored for this matrix—could sequentially optimize extraction parameters (such as solvent type, microwave power, and duration) to overcome the rigid lignocellulosic structure of the bark, thereby enhancing phenolic yields and extraction efficiency while reducing energy consumption and mitigating thermal degradation through fractionated energy input compared to conventional single-stage methods. To the best of our knowledge, this is the first investigation applying multi-stage microwave-assisted extraction (MS MAE) specifically to walnut bark for the recovery of phenolic compounds. While MS MAE has been well studied for other plant matrices, its application to walnut bark, a lignocellulosic biomass with unique extraction challenges, has not been previously reported. In this context, this study aims to (1) systematically evaluate MAE’s efficacy in TPC recovery from walnut bark and (2) optimize MS MAE parameters (cycle count, duration, power) to balance yield, energy efficiency, and process kinetics. Diffusion coefficient modeling will further elucidate mass transfer mechanisms, addressing gaps in current phytochemical extraction frameworks. Our approach differs from earlier studies by focusing on sequential optimization of extraction parameters tailored to the rigid structure of walnut bark, aiming to enhance phenolic yield and extraction efficiency compared to conventional and single-stage MAE methods. By integrating microwave pretreatment with multi-stage solvent cycling, the protocol seeks to establish a scalable, eco-friendly alternative to conventional methods, aligning with industrial demands for high-value functional ingredients.
2. Materials and Methods
2.1. Plant Material
Walnut bark (Juglans regia L.) material used in this study was sourced from Makthar, Siliana Governorate, Tunisia, with a dry matter content of 86.9–87.7% measured via infrared moisture analysis (SCALTEC Instruments GmbH, Heilbad Heiligenstadt, Germany) at 105 °C. To evaluate particle size effects on extraction efficiency, bark samples were mechanically processed into cuboidal particles (5 × 5 × 2 mm) to maximize surface area-to-volume ratios while mitigating cavitation inefficiencies in ultrasmall fractions.
2.2. Experimental Methodology
Two extraction processes were investigated in this study: multi-stage conventional solvent extraction (CSE) (process 1) and multi-stage microwave-assisted extraction (MS MAE) (process 2). These processes are schematically illustrated by the accompanying flow chart (Figure 1).
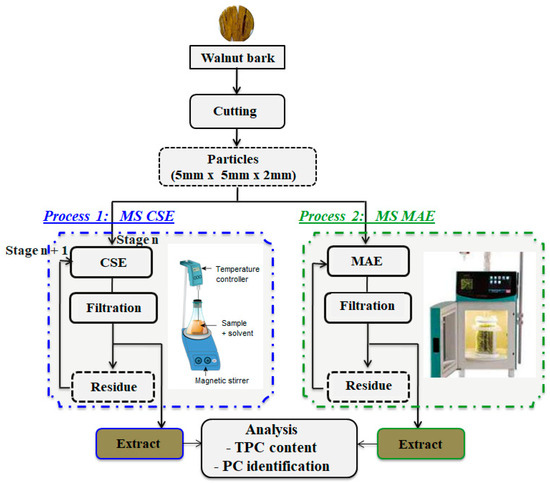
Figure 1.
Experimental setup and flow chart. Conventional and alternative processes for phenolic compound recovery from walnut bark. Process 1: multi-stage conventional solvent extraction (MS CSE); process 2: multi-stage microwave-assisted extraction (MS MAE).
2.2.1. Multi-Stage Conventional Solvent Extraction (MS CSE)
A preliminary study was conducted to determine the optimal extraction conditions for total phenolic compounds (TPC) from Juglans regia bark, focusing on ethanol concentration, liquid–solid ratio, temperature, time, and the number of extraction stages. The experiments involved mixing dry walnut bark with solvent in 500 mL baffled Erlenmeyer flasks, initially filled with 200 mL of solvent preheated to the desired temperature using a magnetic stirrer plate equipped with digital thermoregulation (VWR, Radnor, PA, USA). The stirring rate was maintained at 300 rpm to ensure uniform dispersion of the bark in the liquid phase, and all experiments were conducted in closed flasks to prevent evaporation. Initially, single-stage extractions lasting 60 min were performed to optimize parameters such as ethanol in water concentration (0%, 25%, 50%, 75%, and 100%), liquid–solid ratios (5, 10, 20, and 50 mL/g), and temperatures (25 °C, 40 °C, and 60 °C). Following the identification of optimal conditions for the extraction of total phenolic compounds (TPC) from Juglans regia bark, a sequential extraction process was developed and applied to enhance the extraction yield. In this method, the walnut bark was first mixed with solvent and allowed to be extracted for a set period. At the end of each extraction stage, the used solvent, now containing dissolved phenolics, was completely removed and replaced with fresh solvent, and the extraction process was repeated using the same bark sample. The extraction cycle was conducted in ten successive stages, each lasting 30 min, at controlled temperatures of 25 °C and 60 °C. Continuous renewal of the solvent maintained a strong concentration gradient, thereby facilitating the exhaustive transfer of phenolic compounds from the bark into the solvent. This stepwise approach ensured that even phenolics that were more difficult to extract could be efficiently recovered, providing a comprehensive assessment of the bark’s phenolic content and serving as a benchmark for evaluating the effectiveness of microwave-assisted extraction.
2.2.2. Multi-Stage Microwave-Assisted Extraction (MS MAE)
A systematic optimization of multi-stage microwave-assisted extraction (MS MAE) for total phenolic compounds (TPC) from Juglans regia bark was conducted using a Milestone NEOS-GR microwave system (230 V-50 Hz) at atmospheric pressure (Milestone, Rueil-Malmaison, France). The study evaluated microwave power (100, 200, and 300 W) and extraction stages (1–6) to determine optimal conditions. Experiments utilized 20 g of walnut bark particles suspended in 200 mL of 50% ethanol solution (liquid–solid ratio 10 mL/g), aligning with preliminary conventional solvent extraction findings. The MS MAE protocol incorporated intermediate cooling between stages to mitigate thermal degradation of phenolic compounds. After each extraction stage, the mixture was cooled to room temperature, filtered through Whatman paper using a Büchner funnel, and only the solvent was replenished for subsequent stages. TPC quantification occurred at predetermined intervals throughout the process. This methodical approach aimed to elucidate the kinetics of phenolic extraction under microwave irradiation, with a focus on optimizing yield while minimizing processing time and energy consumption. The experimental design facilitated a comparative analysis against conventional extraction methods, providing insights into the efficacy of MS MAE for sustainable valorization of walnut bark bioactives.
2.3. Analysis
2.3.1. TPC Content
The total phenolic content (TPC) in walnut bark extracts was quantified using the Folin–Ciocalteu assay, a widely recognized method based on the redox reaction between phenolic compounds and the Folin–Ciocalteu reagent [30]. This reaction produces a blue chromophore measurable at 750 nm, with the intensity proportional to the phenolic concentration. The extract was filtered prior to analysis using Whatman No. 1 filter paper to remove solid residues. For the assay, 200 µL of diluted extract was mixed with 1000 µL of Folin–Ciocalteu reagent (Sigma–Aldrich, St Quentin Fallavier, France) and allowed to react for 5 min. Subsequently, 800 µL of Na2CO3 solution (75 g/L) was added, and the mixture was incubated at 50 °C for 10 min before cooling to room temperature. Absorbance was measured using a UV/Vis spectrophotometer (Libra S32, Biochrom, France), and TPC results were expressed as gallic acid equivalents (g GAE/100 g dry matter). A calibration curve prepared with gallic acid served as the reference standard. All analyses were performed in duplicate, and average deviations were calculated. The TPC in raw walnut bark material was determined using a previously established method [31]. Walnut bark samples were ground in liquid nitrogen and sieved through a 630 µm mesh. A 10 mg aliquot of the powdered sample was placed in a screw-capped tube with a ceramic bead, followed by the addition of 1 mL of 80% methanol/water (v/v) and 5 µL of Tween 20. The mixture was homogenized for 10 min at 6500 cpm using a Precellys 24 homogenizer/grinder (Ozyme) with intermittent pauses. The homogenized samples were sonicated for 10 min at 400 W using an UP400s sonicator, vortexed for 30 s, and centrifuged at 10,000 rpm for 5 min to separate phases. The upper phase containing extracted phenolics was collected and stored at −20 °C until analysis. This extraction process was repeated five times to ensure complete exhaustion of phenolic compounds from the residue [31]. The extracted phenolics were quantified using the Folin–Ciocalteu assay as described earlier.
TPC extraction yield Y was calculated using Equation (1)
2.3.2. Phenolic Compound Identification and Quantification
For the identification and quantification of individual phenolic compounds, extracts were analyzed by ultra-high-performance liquid chromatography coupled with mass spectrometry (UHPLC–MS). Separation was achieved on a C18 column, with detection by diode array at 280 nm and 350 nm, and mass spectra were acquired in negative ion mode. Compounds were identified by comparing their retention times, UV spectra, and mass fragmentation patterns with those of authentic standards and literature data. Quantification was performed using external calibration curves, and all analyses were conducted in triplicate to ensure accuracy and reproducibility.
2.4. Diffusion Coefficient Calculation
Kinetics of TPC extraction can be described by Fick’s second law [32] (Equation (2))
where C is the solute concentration (g/L), t is the time (s), x is the spatial coordinate along the principal axis of diffusion (m), and Deff is the effective diffusion coefficient (m2/s).
Fick’s second law for slabs of uniform thickness h in a stirred solution of limited volume can be solved according to the equation of Crank [33] (Equation (3)):
where Ct and C∞ are the solute concentrations (g/L) at time t (s) and at equilibrium after infinite time of extraction, respectively. Coefficient α is the liquid–solid ratio (v/v), e (≈1 mm) is the half-thickness of particles, and qn refers to strictly positive roots of the equation. The solvent volume was =200 mL, and the volume of particles was determined from the density ρ ≈ 0.863.
In this study, α was set to 4.965 (LS = 5 mL/g), 9.9291 (LS = 10 mL/g), 19.858 (LS = 20 mL/g), and 49.646 (LS = 50 mL/g). Six members of the infinite series in Equation (3) were taken into account (up to i = 6).
2.5. Statistical Analysis
Each extraction trial and all the analyses were conducted in duplicate, and all the values have been reported as means ± standard deviation. Results were statistically assessed by ANOVA with a 95% confidence level using SPSS 20 software (SPSS Inc., Chicago, IL, USA).
3. Results and Discussion
The total phenolic content (TPC) of walnut bark was determined to be 86.31 ± 4.07 mg gallic acid equivalents (GAE) per gram of dry weight (DM). This value is notably higher than the TPC found in several pine species, which range from 11.3 to 76.0 mg GAE/g bark. The elevated TPC in walnut bark can be attributed to two primary factors: the accumulation of phenolic compounds over time as plants mature and the protective function of bark, which serves as a defensive barrier for the tree [34]. The high TPC value observed in Tunisian walnut bark underscores its potential as a valuable source for phenolic compound extraction, particularly when compared to other plants known for their antioxidant properties. This finding suggests that walnut bark could be a more efficient source of these beneficial compounds, making it a promising candidate for further research and potential applications in industries such as pharmaceuticals, cosmetics, and functional foods, where high concentrations of phenolic compounds are desirable.
3.1. Conventional Solvent Extraction (CSE)
A preliminary experimental series was conducted to systematically investigate the influence of four critical extraction parameters: ethanol concentration (S) in hydroethanolic mixtures, liquid-to-solid ratio (LS), temperature (T), and extraction duration (t) on the kinetics of total phenolic compound (TPC) recovery. The temporal profiles of TPC extraction efficiency were analyzed under varying operational conditions, including different solvent compositions spanning from 0% (water) to 100% ethanol (Figure 2A), discrete liquid–solid ratios of 5, 10, 20, and 50 mL/g (Figure 2B), and distinct temperature setpoints of 25 °C, 40 °C, and 60 °C (Figure 2C).
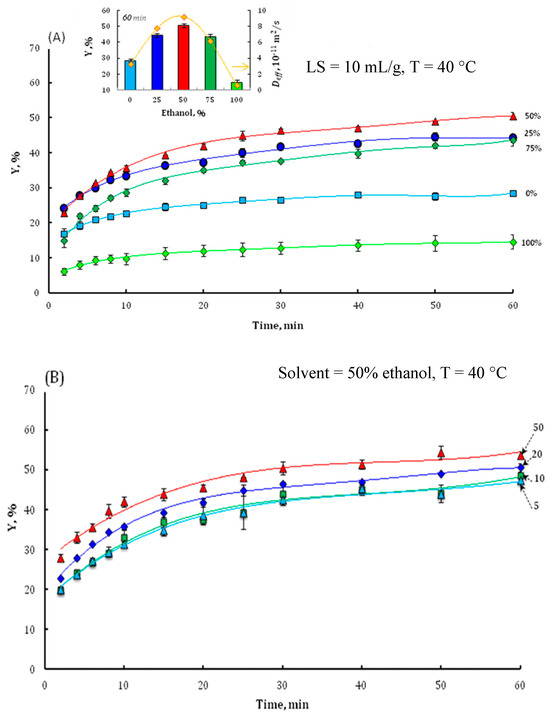
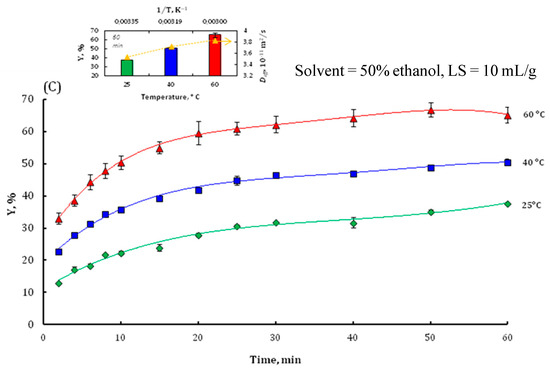
Figure 2.
The effect of ethanol concentration (A), liquid–solid ratio (B), and temperature (C) on the TPC extraction yield of walnut bark. Inserts in (A,C) show the values of final TPC yield and effective diffusion coefficient Deff. Insert (C) also shows the Arrhenius plot for solute diffusivity.
3.1.1. Effect of Ethanol Concentration on Phenolic Extraction Efficiency
As demonstrated in Figure 2A, ethanol concentration exerted a significant (p < 0.05) influence on total phenolic compound (TPC) extraction efficiency, with yields peaking at 50% ethanol (50.5% yield, ≈43 mg GAE/g DM) before declining sharply in pure ethanol (10% yield). Intermediate ethanol concentrations (25–75%) exhibited comparable yields after 60 min extraction, aligning with established literature, demonstrating the superiority of binary solvent systems over mono-solvent approaches (water or ethanol alone) due to optimized polarity modulation [35,36,37]. For example, Chew et al. (2011) [35] investigated the extraction of phenolics from Orthosiphon stamineus and found that ethanol concentration significantly influenced phenolic yield. The highest TPC (total phenolic content) was obtained with 60% ethanol at 60 °C, yielding 30.5 mg GAE/g dry weight [35]. Fernández-Agulló et al. (2013) examined walnut green husk and found that 50% ethanol provided the highest TPC (38.1 mg GAE/g DM), highlighting the importance of solvent polarity in maximizing extraction efficiency [36]. Similarly, Thoo et al. (2010) reported that a binary solvent system (ethanol and water) at 60 °C for 60 min resulted in optimal recovery of phenolics from Morinda citrifolia, with yields up to 18.2 mg GAE/g [37]. This phenomenon arises from the ethanol–water mixture’s capacity to balance solvent polarity, enhancing solubilization and the extraction of both polar and moderately polar compounds. Additionally, ethanol enhances cell membrane permeability by interacting with the phospholipid bilayer, further promoting phenolic compound extraction [38,39]. However, high ethanol concentrations may cause protein denaturation, leading to agglomeration and reduced phenol dissolution. The impact of solvent composition on phenolic compound diffusivity was confirmed by the effective diffusion coefficient (Deff) values, as shown in the insert of Figure 2A. Deff increased from 2.8 × 10⁻¹¹ m2/s in water to 9.23 × 10⁻¹¹ m2/s in 50% ethanol, before decreasing to 0.60 × 10⁻¹¹ m2/s in pure ethanol. Based on these results, the 50:50 ethanol–water mixture was selected as the optimal solvent for subsequent extraction parameter optimization.
3.1.2. Influence of Liquid–Solid Ratio on Extraction Efficacy
To elucidate the impact of the liquid (solvent) to solid (walnut bark) ratio on the extraction efficiency, a series of experiments were conducted utilizing varying liquid–solid (LS) ratios (5, 10, 20, and 50 mL/g) (Figure 2B). Statistical analysis of the results indicated no significant difference (p > 0.05) in the yield of phenolic compounds across the range of LS ratios from 5 to 50 mL/g. However, it was observed that at the lowest LS ratio of 5 mL/g, the solid–liquid mixture exhibited incomplete homogeneity. Consequently, subsequent experimental protocols were standardized using an LS ratio of 10 mL/g. These findings align with those of Rajha et al. [39] and Pinelo et al. [40], who found that decreasing the solvent-to-solid (liquid–solid) ratio generally increases the concentration of phenolic compounds in the extract. Pinelo et al. observed the highest phenolic concentration and antiradical activity at lower solvent-to-solid ratios, with an industrial optimum around 5 mL/g and a laboratory optimum at 3 mL/g. This is attributed to a higher concentration gradient, which enhances mass transfer from the solid matrix to the solvent. Rajha et al. further confirmed that a lower solid–liquid ratio is economically favorable, reducing solvent use without compromising yield. Their optimization identified 3 mL/g as optimal for grape pomace, with higher ratios not providing significant additional benefit. Chew et al. [35] and Thoo et al. [37] also reported that an increase in the liquid–solid ratio up to an optimal point improves phenolic extraction from plant materials, but excessive solvent volumes can dilute the extract and are not always justified by yield gains. In conclusion, although increasing the liquid–solid ratio can initially enhance phenolic extraction, there is a threshold beyond which further increases do not significantly improve yield. The optimal ratio is dependent on the specific plant matrix but generally falls within the range of 3–20 mL/g. This highlights the importance of carefully optimizing the solvent volume in relation to substrate mass to achieve efficient extraction of bioactive compounds while maintaining practical and economical operational conditions.
3.1.3. Influence of Temperature
Following the optimization of ethanol concentration (50%) and liquid–solid ratio (10 mL/g), the extraction of phenolic compounds was conducted at three distinct temperatures: 25, 40, and 60 °C. A significant positive correlation was observed between temperature and total phenolic content (TPC) recovery, corroborating the findings of a previous study. In fact, several studies have shown that increasing extraction temperature generally enhances the recovery of phenolic compounds from various plant materials. Chew et al. (2011) and Thoo et al. (2010) demonstrated that raising the temperature up to 60 °C plays a crucial role in maximizing phenolic yield, with optimal results achieved at elevated temperatures that remain below the degradation threshold for phenolic compounds [35,37]. Fernández-Agulló et al. (2013, 2015) further confirmed that moderate heating in the range of 60–80 °C using ethanol–water systems effectively increases phenolic recovery from walnut green husk and eucalyptus wood waste without causing significant degradation of sensitive compounds [36,41]. Additionally, Rajha et al. (2014) reported that optimizing extraction at 94 °C for grape by-products led to high yields in significantly improved phenolic extraction from Orthosiphon stamineus and Morinda citrifolia, respectively, as higher temperatures increase both solubility and diffusion rates [39]. Similarly, Pinelo et al. (2005) confirmed the effect of temperature, along with the solvent-to-solid ratio, and a short time, although care must be taken at higher temperatures to prevent thermal degradation of phenolics [40]. This thermal enhancement of polyphenol extraction efficiency can be attributed to several physicochemical phenomena. Elevated temperatures reduce solvent viscosity and augment solute diffusivity, while temperatures approaching 60 °C induce cellular disruption, facilitating molecular diffusion [42]. Statistical analysis (p < 0.05) revealed a significant increase in phenolic compound extraction yield with increasing temperature (Figure 2C). The maximal yield (65.26%) was achieved at 60 °C, compared to 50.53% at 40 °C and 37.74% at 25 °C. This temperature-dependent yield enhancement is consistent with the principle that elevated temperatures increase the diffusion coefficient. Given the superior efficacy of the 60 °C condition for TPC extraction, this temperature was selected for subsequent experimental procedures. The relationship between the effective diffusion coefficient (Deff) and temperature was modeled using the Arrhenius equation (Equation (4)):
where Ea (kJ/mol) represents the activation energy, Deff,0 (m2/s) is the limiting diffusion coefficient, R = 8.314 J/K mol is the universal gas constant, and Ta (K) denotes the absolute temperature.
The Arrhenius plot for Deff of walnut bark samples subjected to simple diffusion with 50% ethanol at a liquid–solid ratio of 10 mL/g is presented in the insert of Figure 2C. The Deff values ranged from 3.82 × 10⁻¹¹ to 19.29 × 10⁻¹¹ m2/s across the temperature range of 25 to 60 °C, with higher Deff values corresponding to elevated temperatures. This analytical approach yielded an estimated activation energy of Ea ≈ 38 ± 2.4 kJ/mol. This result aligns with previous investigations by Boussetta et al. [43] and Brianceau et al. [42], who reported Ea values of 46 ± 8 kJ/mol and 31.3 ± 3.7 kJ/mol for fermented grape pomace and grape skins, respectively.
3.1.4. Multiple Extraction Stages
After optimizing the solvent composition, the SL ratio, and the temperature, the study explored the impact of multiple extraction stages on total phenolic content (TPC) recovery, comparing extractions at 60 °C and 25 °C. At 60 °C, the TPC yield increased from 55.23% (Deff = 17.83 × 10⁻¹¹ m2/s) in the first stage to 71.12% after two stages, reaching 75% by the fourth stage (Figure 3). In contrast, at 25 °C, only 37.37% of phenolic compounds were recovered after four stages. These results demonstrate the significant enhancement of TPC extraction efficiency at higher temperatures. The implementation of multiple extraction stages using fresh solvent for each stage effectively increased the overall TPC yield. In a previous study, Rajha et al. [39] and Fernández-Agulló et al. [41] found that sequential extraction stages are effective in thoroughly exhausting the phenolic content from plant residues as each stage sustains a favorable concentration gradient and allows for the recovery of phenolics not extracted in earlier steps. Overall, there is a consensus that multi-stage extraction is especially valuable for maximizing yields when single-stage extraction leaves a considerable portion of phenolics unextracted, which is particularly important in industrial or high-value applications. While this method is known to improve solute recovery, it has the drawback of requiring substantial quantities of solvent, potentially making solvent recycling cost-prohibitive. To address this issue, the study proposes the use of a counter-current continuous extractor as a more efficient alternative to multiple batch extractions. These findings corroborate existing research on the dependence of phenolic compound extraction efficiency on factors such as temperature, solvent type, and extraction duration, highlighting the importance of optimized conditions and multiple extraction stages in maximizing the recovery of phenolic compounds from plant materials.
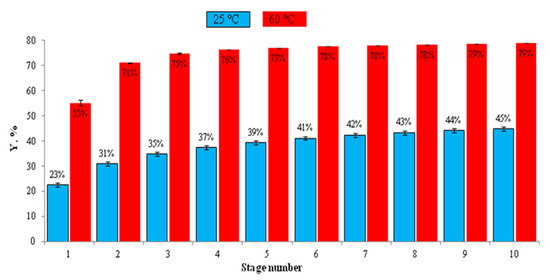
Figure 3.
The effect of conventional solvent extraction (CSE) stages at 25 °C and 60 °C on the TPC extraction yield. Experiments were performed at 10 mg/L using ethanol/water (50/50).
3.2. Microwave-Assisted Extraction
3.2.1. Effect of Microwave Power
The application of microwave power significantly enhanced the extraction kinetics and total phenolic content (TPC) yield compared to non-irradiated methods. As shown in Figure 4, increasing microwave power from 100 W to 300 W elevated TPC yields from 38.47% to 58.66% within 15 min, while the control (0 W) achieved only 6.75% (Figure 4). This improvement correlated with a 67-fold increase in effective diffusion coefficients (0.53 × 10⁻¹¹ m2/s at 0 W vs. 35.47 × 10⁻¹¹ m2/s at 300 W), demonstrating enhanced mass transfer efficiency through microwave-induced structural modifications [44]. The mechanism involves dielectric heating, causing rapid moisture vaporization within plant cells, generating internal pressures that rupture cell walls and improve solvent accessibility [45]. However, excessive power (>200 W) required shorter irradiation durations (7–10 min) to prevent thermal degradation of heat-sensitive compounds as prolonged exposure at elevated temperatures (>80 °C) risks oxidative damage [46]. These findings align with optimization studies showing peak phenolic recovery at 40–50% microwave power (equivalent to 400–500 W in industrial systems) with irradiation times under 10 min [47,48]. The power–time relationship proved critical where higher intensities required precise temporal control to balance extraction efficiency against compound stability [44,47]. Compared to conventional methods, MAE reduced extraction times by 90–99% while achieving superior yields, consistent with observations in olive by-product and eucalyptus leaf extractions [49]. This efficiency stems from microwave-specific dipole rotation and ionic conduction mechanisms that accelerate molecular interactions between solvents and target analytes [46,50,51,52].
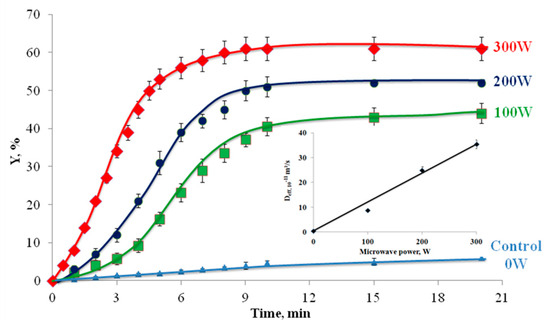
Figure 4.
The extraction kinetics without and with microwave irradiation at different powers. The insert presents the effective diffusion coefficient vs. microwave-applied power.
3.2.2. Microwave Multiple Extraction Stages
The implementation of multi-stage microwave-assisted extraction (MAE) coupled with intermediate filtration and cooling demonstrates significant enhancements in phenolic compound recovery from walnut bark (Figure 5). Under optimized conditions of 50% ethanol (v/v), a solvent–solid ratio of 10 mL/g, and staged microwave power application (300 W per 10 min cycle), the extraction kinetics reveal critical insights into process efficiency and mechanisms. Notably, six MAE cycles (60 min total) achieved an impressive 86% yield (Figure 5A), substantially outperforming both single-stage MAE (58.2% in 10 min) and conventional solvent extraction (CSE: 79.8% over 5 h). This enhanced performance can be attributed to several factors: the selective dielectric heating of the ethanol–water mixture, which exhibits optimal microwave absorption properties, enabling efficient cell wall disruption; the controlled thermal exposure, with temperature profiles plateauing at 80 °C (Figure 5B), mitigating thermal degradation of thermolabile phenolics; and the intermediate filtration, which renews the solvent’s chemical potential gradient, overcoming equilibrium limitations. The multi-stage approach significantly reduces extraction time from 5 h (CSE) to just 1 h. These results underscore the superiority of multi-stage MAE in balancing extraction velocity with compound integrity, particularly for matrices rich in phenolic compounds like walnut bark, offering promising potential for sustainable valorisation of agro-industrial by-products.
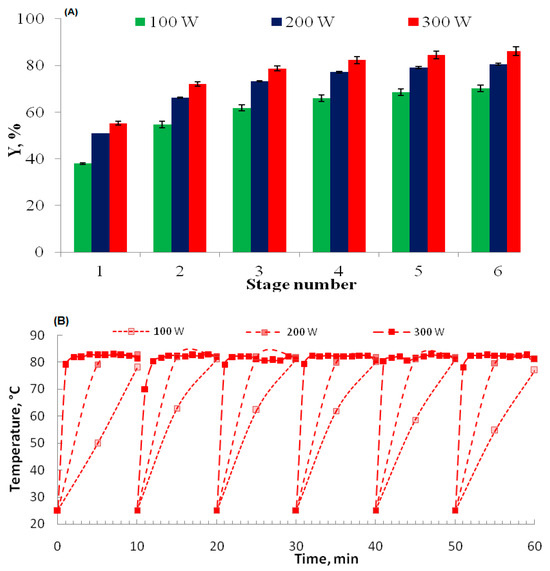
Figure 5.
(A) The effect of microwave power and stage number (stage 1–stage 6) of 10 min each on the total phenolic compound multi-stage microwave-assisted extraction (MS MAE) yield of walnut bark at a liquid–solid ratio of LS = 10 mL/g. (B) Temperature profile.
The UHPLC–MS analysis of Tunisian walnut (Juglans regia L.) bark revealed a rich phenolic profile, with gallic acid (21.6 ± 0.9 mg/100 g DM), vanillic acid (17.2 ± 0.5 mg/100 g DM), and quercetin (8.8 ± 0.4 mg/100 g DM) as the most abundant compounds. Smaller quantities of catechin (4.2 ± 0.3 mg/100 g DM), epicatechin, syringic acid, and juglone were also detected (Table 1 and Figure 6). Interestingly, the application of microwave-assisted extraction did not appear to significantly alter either the qualitative profile or the quantitative content of phenolic compounds in the bark extracts. The major phenolics identified and their respective concentrations were comparable to those obtained using conventional extraction methods, indicating that microwave treatment, under the conditions applied in this study, does not degrade or enhance the extraction of these specific compounds. This observation is consistent with some previous reports, which have found that while microwaves can accelerate extraction and improve yields in certain matrices, it does not always lead to changes in the composition or relative abundance of individual phenolics [52]. Therefore, the use of MAE in this context offers the advantage of process efficiency without compromising the integrity or diversity of the phenolic constituent.

Table 1.
Quantitative LC-MS profiling of phenolic compounds in walnut bark extract prepared by microwave-assisted extraction.
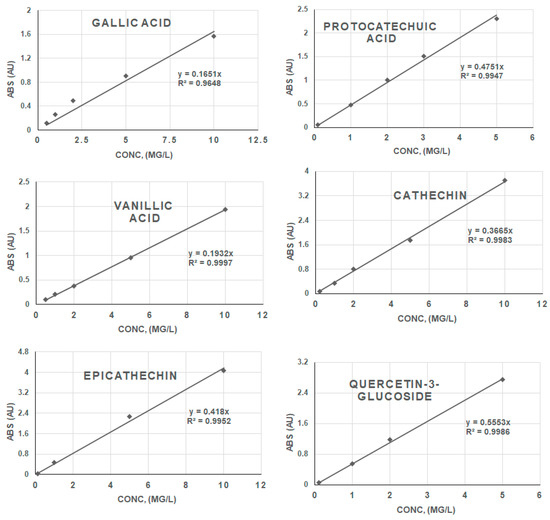
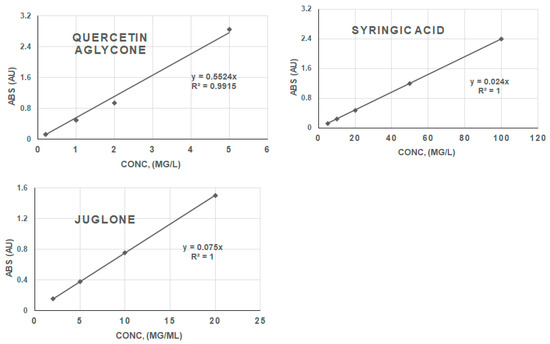
Figure 6.
Calibration curves of phenolic compound standards (absorbance vs. concentration).
When compared to the literature, these findings highlight both similarities and notable distinctions. For instance, Cosmulescu et al. (2010) [53] reported lower concentrations of gallic acid (approximately 11–14 mg/100 g DM) and quercetin (around 2–6 mg/100 g DM) in walnut shoots and leaves, while Ben Sghaier et al. (2016) found gallic acid to be a major phenolic in walnut bark, but at concentrations closer to 15 mg/100 g DM [54]. Our results suggest that the Tunisian walnut bark analyzed in this study contains a higher amount of gallic acid and quercetin than those previously reported for other walnut tissues and even for bark from different regions. Similarly, vanillic acid was found in higher concentrations here (17.2 mg/100 g DM) than approximately 7–9 mg/100 g DM reported in walnut roots and shoots.
The presence of catechin and epicatechin in moderate amounts is consistent with prior studies, though the values observed here for catechin are somewhat higher than those typically reported for walnut bark, which generally range between 2 and 3 mg/100 g DM [55]. Juglone, a characteristic naphthoquinone of Juglans species, was detected as expected, supporting the chemotaxonomic identity of the sample.
The elevated levels of gallic acid, vanillic acid, and quercetin in this study may be attributed to regional, environmental, or genetic factors specific to Tunisian walnut populations as phenolic content is known to vary with geographic origin, climate, and tree age. These higher concentrations enhance the antioxidant potential of the bark, suggesting that Tunisian walnut bark could be a particularly valuable source of bioactive phenolics for nutraceutical or pharmaceutical applications.
4. Conclusions
This study aimed to optimize and intensify the extraction of phenolic compounds from Juglans regia bark, which contains 86.3 mg GAE/g DM. The research compared multi-stage conventional solvent extraction (MS CSE) and multi-stage microwave-assisted extraction (MS MAE) to identify the most cost-effective and efficient extraction method. Results demonstrate the superiority of MS MAE, which achieved an impressive 86% recovery of phenolic compounds in just 60 min compared to 78% recovery with MS CSE over 300 min. This significant reduction in extraction time, coupled with lower solvent consumption, positions MS MAE as a more sustainable and efficient process for phenolic compound extraction from walnut bark. Furthermore, UHPLC–MS analysis confirmed that the major phenolic compounds, such as gallic acid, vanillic acid, and quercetin, were preserved in both qualitative and quantitative terms, indicating that microwave treatment does not compromise the integrity of key bioactive constituents. The study’s outcomes contribute valuable insights to the growing body of research on efficient extraction methods for bioactive compounds from plant matrices, highlighting the potential of MS MAE as a promising technique for sustainable valorization of agricultural by-products.
Author Contributions
Investigation and experimental work, N.B.; writing—original draft preparation, N.B. and H.M.; writing—review and editing, H.M. and N.K.; supervision, H.M. and N.K.; project administration, N.K. All authors have read and agreed to the published version of the manuscript.
Funding
This work was financially supported by the Tunisian Ministry of Higher Education and Scientific Research.
Data Availability Statement
The original contributions presented in this study are included in the article. Further inquiries can be directed to the corresponding author.
Acknowledgments
The authors thank the Tunisian Ministry of Higher Education and Scientific Research for the financial support.
Conflicts of Interest
The authors declare no conflicts of interest.
Abbreviations
CSE, conventional solvent extraction; MS CSE, multi-stage conventional solvent extraction; MAE, microwave-assisted extraction; MS MAE, multi-stage microwave-assisted extraction; TPC, total phenolic compound content; Y, total phenolic compounds extraction yield.
Nomenclature
| TPC | Total phenolic compound content (g GAE/100 g DM) |
| Y | Total phenolic compound extraction yield (%), |
| Ct | Total phenolic compound concentration (g/L), |
| C∞ | Total phenolic compound concentration after infinite time (g/L), |
| Deff | Effective diffusivity coefficient (m2/s) |
| DM | Dry matter |
| Ea | Energy activation (J/mol) |
| GAE | Gallic acid equivalent |
| LS | Liquid-to-solid ratio |
| EC | Ethanol concentration |
| t | Time (s) |
| T | Temperature (°C) |
| Ta | Absolute temperature (K) |
| α | Ratio of volumes of solvent/particles |
| ρ | Density (kg/m3) |
References
- Carvalho, M.; Ferreira, P.J.; Mendes, V.S.; Silva, R.; Pereira, J.A.; Jerónimo, C.; Silva, B.M. Human cancer cell antiproliferative and antioxidant activities of Juglans regia L. Food Chem. Toxicol. 2010, 48, 441–447. [Google Scholar] [CrossRef]
- Noumi, E.; Snoussi, M.; Trabelsi, N.; Ksouri, R.; Hamdani, G.; Bouslama, L.; Bakhrouf, A. Antioxidant activities and RP-HPLC identification of polyphenols in the ethyl acetate extract of Tunisian Juglans regia L treated barks. J. Med. Plants Res. 2012, 6, 1468–1475. [Google Scholar] [CrossRef]
- Noumi, E.; Snoussi, M.; Hajlaoui, H.; Valentin, E.; Bakhrouf, A. Antifungal properties of Salvadora persica and Juglans regia L. extracts against oral Candida strains. Eur. J. Clin. Microbiol. Infect. Dis. 2010, 29, 81–88. [Google Scholar] [CrossRef]
- Medic, A.; Zamljen, T.; Hudina, M.; Veberič, R. Identification and Quantification of Naphthoquinones and Other Phenolic Compounds in Leaves, Petioles, Bark, Roots, and Buds of Juglans regia L., Using HPLC-MS/MS. Horticulturae 2021, 7, 326. [Google Scholar] [CrossRef]
- Colaric, M.; Veberic, R.; Solar, A.; Hudina, M.; Stampar, F. Phenolic acids, syringaldehyde, and juglone in fruits of different cultivars of Juglans regia L. J. Agric. Food Chem. 2005, 53, 6390–6396. [Google Scholar] [CrossRef]
- Medic, A.; Jakopic, J.; Hudina, M.; Solar, A.; Veberic, R. Identification and quantification of the major phenolic constituents in Juglans regia L. peeled kernels and pellicles, using HPLC-MS/MS. Food Chem. 2021, 352, 129404. [Google Scholar] [CrossRef]
- Medic, A.; Jakopic, J.; Solar, A.; Hudina, M.; Veberic, R. Walnut (J. regia) Agro-Residues as a Rich Source of Phenolic Compounds. Biology 2021, 10, 535. [Google Scholar] [CrossRef]
- Vu, D.C.; Vo, P.H.; Coggeshall, M.V.; Lin, C.H. Identification and Characterization of Phenolic Compounds in Black Walnut Kernels. J. Agric. Food Chem. 2018, 66, 4503–4511. [Google Scholar] [CrossRef] [PubMed]
- Jahanban-Esfahlan, A.; Ostadrahimi, A.; Tabibiazar, M.; Amarowicz, R. A Comparative Review on the Extraction, Antioxidant Content and Antioxidant Potential of Different Parts of Walnut (Juglans regia L.) Fruit and Tree. Molecules 2019, 24, 2133. [Google Scholar] [CrossRef] [PubMed]
- Mohammadzadeh, A.; Hosseini, S.M.; Ghorbani, M. Enhanced extraction of phenolic compounds from walnut bark using salt-assisted aqueous ethanol. J. Food Meas. Charact. 2020, 14, 2341–2350. [Google Scholar]
- Zhang, M.; Jia, L.; Li, M.; Peng, H.; Tan, Y.; Arvelli, S.; Huang, Y.; Neves, A.C.; Oh, E.J.; Zhao, J. One-Pot Biomass Pretreatment for Ethanol Production by Engineered Saccharomyces cerevisiae. ACS Sustain. Chem. Eng. 2025, 13, 5201–5209. [Google Scholar] [CrossRef]
- Podsedek, A.; Masek, A.; Latos-Brozio, M.; Chrzescijanska, E. Polyphenolic Profile and Antioxidant Activity of Juglans regia L. Leaves and Husk Extracts. Forests 2019, 10, 988. [Google Scholar] [CrossRef]
- Amaral, J.S.; Seabra, R.M.; Andrade, P.B.; Valentão, P.; Pereira, J.A.; Ferreres, F. Phenolic profile in the quality control of walnut (Juglans regia L.) leaves. Food Chem. 2004, 88, 373–379. [Google Scholar] [CrossRef]
- Ghasemi, K.; Ghasemi, Y.; Ehteshamnia, A.; Nabavi, S.M.; Nabavi, S.F.; Ebrahimzadeh, M.A.; Pourmorad, F. Influence of environmental factors on antioxidant activity, phenol and flavonoid contents of walnut (Juglans regia L.) green husks. J. Med. Plants Res. 2011, 5, 1128–1133. Available online: https://www.researchgate.net/publication/267036465_Influence_of_environmental_factors_on_antioxidant_activity_phenol_and_flavonoids_contents_of_walnut_Juglans_regia_L_green_husks (accessed on 19 July 2025).
- Tabaraki, R.; Rastgoo, S. Comparison between conventional and ultrasound-assisted extractions of natural antioxidants from walnut green husk. Korean J. Chem. Eng. 2014, 31, 676–683. [Google Scholar] [CrossRef]
- Dai, Y.; van Spronsen, J.; Witkamp, G.-J.; Verpoorte, R.; Choi, Y.H. Natural deep eutectic solvents as new potential media for green technology. Anal. Chim. Acta 2013, 766, 61–68. [Google Scholar] [CrossRef] [PubMed]
- Chan, C.-H.; Yusoff, R.; Ngoh, G.-C.; Kung, F.W.-L. Microwave-assisted extractions of active ingredients from plants. J. Chromatogr. A 2011, 1218, 6213–6225. [Google Scholar] [CrossRef]
- Ganesapillai, M.; Mathew, M.; Singh, A.; Simha, P. Influence of Microwave and Ultrasound pretreatment on Solvent Extraction of Bio-components from Walnut (Julgans regia L.) Shells. Period. Polytech. Chem. Eng. 2016, 60, 40–48. [Google Scholar] [CrossRef]
- Ince, A.E.; Sahin, S.; Sumnu, G. Comparison of microwave and ultrasound-assisted extraction techniques for leaching of phenolic compounds from nettle. J. Food Sci. Technol. 2014, 51, 2776–2782. [Google Scholar] [CrossRef]
- Yan, M.-M.; Liu, W.; Fu, Y.-J.; Zu, Y.-G.; Chen, C.-Y.; Luo, M. Optimisation of the microwave-assisted extraction process for four main astragalosides in Radix Astragali. Food Chem. 2010, 119, 1663–1670. [Google Scholar] [CrossRef]
- Chemat, F.; Vian, M.A.; Cravotto, G. Green extraction of natural products: Concept and principles. Int. J. Mol. Sci. 2012, 13, 8615–8627. [Google Scholar] [CrossRef]
- Wang, L.; Weller, C.L. Recent advances in extraction of nutraceuticals from plants. Trends Food Sci. Technol. 2016, 17, 300–312. [Google Scholar] [CrossRef]
- Pérez, L.; Conde, E.; Domínguez, H. Microwave hydrodiffusion and gravity processing of Sargassum muticum. Process Biochem. 2014, 49, 981–988. [Google Scholar] [CrossRef]
- Aspé, E.; Fernández, K. The effect of different extraction techniques on extraction yield, total phenolic, and anti-radical capacity of extracts from Pinus radiata Bark. Ind. Crops Prod. 2011, 34, 838–844. [Google Scholar] [CrossRef]
- Chemat, F.; Abert-Vian, M.; Zill-e-Huma, Y.J. Microwave assisted separations: Green chemistry in action. In Green Chemistry Research Trends; Nova Science Publishers, Inc.: Hauppauge, NY, USA, 2009; pp. 33–62. [Google Scholar]
- Bouras, M.; Chadni, M.; Barba, F.J.; Grimi, N.; Bals, O.; Vorobiev, E. Optimization of microwave-assisted extraction of polyphenols from Quercus bark. Ind. Crops Prod. 2015, 77, 590–601. [Google Scholar] [CrossRef]
- Lee, M.; Kim, M.; Kim, J.; Lee, S.; Kim, Y.; Kim, S.; Park, J. Conditions d’extraction des polyphénols de l’écorce de pin radiata (Pinus radiata). J. Korean Wood Sci. Technol. 2020, 48, 861–873. [Google Scholar] [CrossRef]
- Mandal, V.; Mohan, Y.; Hemalatha, S. Microwave assisted extraction—An innovative and promising extraction tool for medicinal plant research. Pharmacogn. Rev. 2007, 1, 7–18. [Google Scholar]
- Chen, Y.; Xie, M.-Y.; Gong, X.-F. Microwave-assisted extraction used for the isolation of total triterpenoid saponins from Ganoderma atrum. J. Food Eng. 2007, 81, 162–170. [Google Scholar] [CrossRef]
- Singleton, V.L.; Orthofer, R.; Lamuela-Raventos, R.M. Analysis of total phenols and other oxidation substrates and antioxidants by means of Folin-Ciocalteu reagent. Methods Enzymol. 1999, 299, 152–178. [Google Scholar] [CrossRef]
- Koubaa, M.; Mhemdi, H.; Vorobiev, E. Seed oil polyphenols: Rapid and sensitive extraction method and high resolution–mass spectrometry identification. Anal. Biochem. 2015, 476, 91–93. [Google Scholar] [CrossRef]
- Fick, A. On liquid diffusion. Philos. Mag. 1855, 10, 30–39. [Google Scholar] [CrossRef]
- Crank, J. The Mathematics of Diffusion, 2nd ed.; Oxford University Press: Oxford, UK, 1975. [Google Scholar]
- Stevanovic, T.; Diouf, P.N.; Garcia-Perez, M.E. Bioactive polyphenols from healthy diets and forest biomass. Curr. Nutr. Food Sci. 2009, 5, 264–295. [Google Scholar] [CrossRef]
- Chew, K.K.; Khoo, M.Z.; Ng, S.Y.; Thoo, Y.Y.; Wan Aida, W.M.; Ho, C.W. Effect of ethanol concentration, extraction time and extraction temperature on the recovery of phenolic compounds and antioxidant capacity of Orthosiphon stamineus extracts. Int. Food Res. J. 2011, 18, 1427–1435. [Google Scholar]
- Fernández-Agulló, A.; Pereira, E.; Freire, M.S.; Valentão, P.; Andrade, P.B.; González-Álvarez, J.; Pereira, J.A. Influence of solvent on the antioxidant and antimicrobial properties of walnut (Juglans regia L.) green husk extracts. Ind. Crops Prod. 2013, 42, 126–132. [Google Scholar] [CrossRef]
- Thoo, Y.Y.; Ho, S.K.; Liang, J.Y.; Ho, C.W.; Tan, C.P. Effects of binary solvent extraction system, extraction time and extraction temperature on phenolic antioxidants and antioxidant capacity from mengkudu (Morinda citrifolia). Food Chem. 2010, 120, 290–295. [Google Scholar] [CrossRef]
- Goldstein, D.B.; Chin, J.H. Interaction of ethanol with biological membranes. Fed. Proc. 1981, 37, 2073–2076. [Google Scholar]
- Rajha, H.N.; Boussetta, N.; Louka, N.; Maroun, R.G.; Vorobiev, E. A comparative study of physical pretreatments for the extraction of polyphenols and proteins from vine shoots. Food Res. Int. 2014, 65, 462–468. [Google Scholar] [CrossRef]
- Pinelo, M.; Rubilar, M.; Jerez, M.; Sineiro, J.; Núñez, M.J. Effect of solvent, temperature, and solvent-to-solid ratio on the total phenolic content and antiradical activity of extracts from different components of grape pomace. J. Agric. Food Chem. 2005, 53, 2111–2117. [Google Scholar] [CrossRef]
- Fernández-Agulló, A.; Freire, M.S.; González-Álvarez, J. Effect of the extraction technique on the recovery of bioactive compounds from eucalyptus (Eucalyptus globulus) wood industrial wastes. Ind. Crops Prod. 2015, 64, 105–113. [Google Scholar] [CrossRef]
- Brianceau, S.; Turk, M.; Vitrac, X.; Vorobiev, E. Combined densification and pulsed electric field treatment for selective polyphenols recovery from fermented grape pomace. Innov. Food Sci. Emerg. Technol. 2015, 29, 2–8. [Google Scholar] [CrossRef]
- Boussetta, N.; Lebovka, N.; Vorobiev, E.; Adenier, H.; Bedel-Cloutour, C.; Lanoisellé, J.-L. Electrically assisted extraction of soluble matter from chardonnay grape skins for polyphenol recovery. J. Agric. Food Chem. 2009, 57, 1491–1497. [Google Scholar] [CrossRef]
- Gallo, M.; Ferracane, R.; Graziani, G.; Ritieni, A.; Fogliano, V. Microwave assisted extraction of phenolic compounds from four different spices. Molecules 2010, 15, 6365–6374. [Google Scholar] [CrossRef]
- Ismail-Suhaimy, N.W.; Gani, S.S.A.; Zaidan, U.H.; Halmi, M.I.E.; Bawon, P. Optimizing Conditions for Microwave-Assisted Extraction of Polyphenolic Content and Antioxidant Activity of Barleria lupulina Lindl. Plants 2021, 10, 682. [Google Scholar] [CrossRef]
- Lovrić, V.; Putnik, P.; Kovačević, D.B.; Jukić, M.; Dragović-Uzelac, V. Effect of Microwave-Assisted Extraction on the Phenolic Compounds and Antioxidant Capacity of Blackthorn Flowers. Food Technol Biotechnol. 2017, 55, 243–250. [Google Scholar] [CrossRef] [PubMed]
- Sen, K.K.; Chouhan, K.B.; Tandey, R.; Mehta, R.; Mandal, V. Impact of microwaves on the extraction yield of phenolics, flavonoids, and triterpenoids from centella leaves: An approach toward digitized robust botanical extraction. Phcog Mag. 2019, 15, 267–273. Available online: https://phcog.com/article/view/2019/15/64/267-273 (accessed on 19 July 2025).
- Weremfo, A.; Adulley, F.; Adarkwah-Yiadom, M. Simultaneous Optimization of Microwave-Assisted Extraction of Phenolic Compounds and Antioxidant Activity of Avocado (Persea americana Mill.) Seeds Using Response Surface Methodology. J. Anal. Methods Chem. 2020, 17, 7541927. [Google Scholar] [CrossRef]
- Gharekhani, M.; Ghorbani, M.; Rasoulnejad, N. Microwave-assisted extraction of phenolic and flavonoid compounds from Eucalyptus camaldulensis Dehn leaves as compared with ultrasound-assisted extraction. Lat. Am. Appl. Res. 2012, 42, 305–310. Available online: https://www.scielo.org.ar/scielo.php?script=sci_abstract&pid=S0327-07932012000300013 (accessed on 19 July 2025).
- Zhang, H.-F.; Zhang, X.; Yang, X.-H.; Qiu, N.-X.; Wang, Y.; Wang, Z.-Z. Microwave assisted extraction of flavonoids from cultivated Epimedium sagittatum: Extraction yield and mechanism, antioxidant activity and chemical composition. Ind. Crops Prod. 2013, 50, 857–865. [Google Scholar] [CrossRef]
- Zhou, H.Y.; Liu, C.Z. Microwave-assisted extraction of solanesol from tobacco leaves. J. Chromatogr. A 2006, 1129, 135–139. [Google Scholar] [CrossRef] [PubMed]
- Ballard, T.S.; Mallikarjunan, P.; Zhou, K.; O’Keefe, S. Microwave-assisted extraction of phenolic antioxidant compounds from peanut skins. Food Chem. 2010, 120, 1185–1192. [Google Scholar] [CrossRef]
- Cosmulescu, S.; Trandafir, I.; Achim, G. Phenolic acids and flavonoids profiles of walnut (Juglans regia L.) leaves. Sci. Hortic. 2010, 129, 528–533. [Google Scholar] [CrossRef]
- Ben Sghaier, M.; Pagano, A.; Mousslim, M.; Ammari, Y.; Belhamra, M.; Touil, A.; Bouaziz, M. Phenolic profile and biological activities of Juglans regia L. bark extracts. Ind. Crops Prod. 2016, 83, 254–263. [Google Scholar] [CrossRef]
- Pereira, J.A.; Oliveira, I.; Sousa, A.; Ferreira, I.C.F.R.; Bento, A.; Estevinho, L. Bioactive properties and chemical composition of six walnut (Juglans regia L.) cultivars. Food Chem. Toxicol. 2007, 45, 2287–2295. [Google Scholar] [CrossRef] [PubMed]
Disclaimer/Publisher’s Note: The statements, opinions and data contained in all publications are solely those of the individual author(s) and contributor(s) and not of MDPI and/or the editor(s). MDPI and/or the editor(s) disclaim responsibility for any injury to people or property resulting from any ideas, methods, instructions or products referred to in the content. |
© 2025 by the authors. Licensee MDPI, Basel, Switzerland. This article is an open access article distributed under the terms and conditions of the Creative Commons Attribution (CC BY) license (https://creativecommons.org/licenses/by/4.0/).