Article

Fluorescence Spectroscopy Applied to Thermal Conversion of Bitumen

by
Raj Divyajeetsinh
,
Lina M. Yañez Jaramillo
,
Priscila T. H. Nascimento
and
Arno de Klerk
*
Department of Chemical and Materials Engineering, University of Alberta, 9211–116th Street, Edmonton, AB T6G 1H9, Canada
*
Author to whom correspondence should be addressed.
Processes 2025, 13(9), 2901; https://doi.org/10.3390/pr13092901
Submission received: 1 August 2025 / Revised: 17 August 2025 / Accepted: 19 August 2025 / Published: 11 September 2025

Abstract

Phase instability that develops during thermal conversion of heavy oils and bitumen limits the extent of conversion in processes such as visbreaking. It was postulated that aromatic species with conjugated unsaturated systems extending beyond the aromatic rings likely contributed to reactions leading to phase instability, fouling, and coking. Many fluorophores have such conjugated π-electron systems. Three case studies were presented where products from thermal conversion were analyzed by fluorescence spectroscopy: (i) Cold Lake bitumen converted at 150–300 °C; (ii) asphaltenes depleted and enriched Athabasca bitumen converted at 380 °C; and (iii) Athabasca bitumen converted at 400 °C and 0.5–4.0 MPa. It was found that the fluorescence intensity of bitumen increased on thermal conversion. Fluorescence intensity increased in relation to reaction time for conversion at 150–300 °C, but it had a weak relationship with temperature. At 380 and 400 °C, this monotonic relationship was no longer apparent. There was no relationship with refractive index. Despite some overlap in fluorescence intensity values, 400 °C converted products obtained at 2.5–4.0 MPa had lower fluorescence intensity than products obtained at 0.5–2.0 MPa. Tentative explanations were offered for these observations. The change in fluorescence intensity with operating conditions and nature of the feed was consistent with the expected free radical concentration associated with the operating conditions and extent of hydrogen transfer. Although the study did not provide proof for the relationship between the fluorescence intensity and the concentration of aromatic species with conjugated unsaturated systems, the experimental observations were congruent with it.

1. Introduction

In a petroleum refinery or bitumen upgrader facility, tracking the cracking conversion of heavy oil and bitumen is usually accomplished by the analysis of lighter products. The convention employed in heavy oil conversion is to set a threshold boiling point below which material is considered products and material above that threshold boiling point is considered ‘unconverted’ oil. This can be misleading, because the ‘unconverted’ oil contains products from thermal conversion, just not to products with boiling points below the threshold. This may seem like an academic distinction, but changes in the ‘unconverted’ oil can lead to process problems, such as higher sediment formation, and oil incompatibility [1,2]. Phase instability imposes a conversion limitation on processes such as visbreaking and residue hydroconversion, because phase instability that leads to phase separation causes fouling and the formation of solids, like sediments and coke [1,3,4,5].
According to Wiehe [6], species with a low hydrogen content and high molecular mass are more prone to form a separate phase. Vezirov et al. [4] posited that low hydrogen content and high molecular mass species leading to phase instability are a result of “… reactive heavy unsaturated compounds in the visbreaking resid, formed as a result of thermal cracking… which have a tendency toward polymerization and polycondensation to a much greater degree than primary asphaltenes and resins (straight-run).”
The description by Vezirov et al. [4] provided an explanation for the poor relationship that was found between straight run asphaltene content and phase instability in thermally converted products [7]. It also provided a plausible explanation for the lack of a relationship between phase instability and aromatic carbon content [8]. Likewise, it was congruent with the observation that increasing the aromatic content of a visbreaker feed enables a higher severity operation at the same level of product phase stability [9]. Using this background information, the point of departure for this investigation was that phase instability during thermal conversion may be related to the participation of aromatic species with conjugated unsaturated systems extending beyond the aromatic rings.
There was no simple analysis that could be performed on converted heavy oils and bitumen to measure changes in the concentration of large conjugated unsaturated systems (conjugated π-electron systems) extending beyond the aromatic rings of aromatic species. It was suspected that fluorescence spectroscopy might be useful. Lakowicz [10] noted that fluorescence is typically, but not exclusively associated with aromatic molecules. Furthermore, it was noted that many fluorophores have conjugated π-electron systems spanning atoms beyond that of the aromatic rings.
Fluorescence spectroscopy has been employed for the analysis of petroleum [11,12,13]. Several studies attempted to find relationships between fluorescence spectra and petroleum physical and chemical properties [14,15,16,17,18,19]. Moving closer to the intent of the present study, fluorescence spectroscopy was used to evaluate the maturity of petroleum deposits [20,21,22]. Maturity of petroleum is in essence a measure of the severity of thermal conversion of the deposit over geological time. A few studies employed fluorescence spectroscopy to evaluate changes in thermally processed petroleum (and coal liquids) [23,24,25].
In this study, fluorescence spectroscopy was employed to determine if thermal conversion of petroleum resulted in increased fluorescence and if fluorescence spectroscopy could be used to detect the evolution of species related to phase instability and second phase formation. There was the hope that such a relationship could be interpreted in terms of a change in the concentration of aromatic species with conjugated unsaturated systems.
Samples originating from previous studies [26,27,28] that investigated the thermal conversion of bitumen were used. Each probed specific aspects of thermal conversion, namely low-temperature (150–300 °C) thermal conversion [26], the relevance of solubility classes as predictors for phase instability [27], and the impact of an increase in concentration of lighter cracked products in the liquid phase due to the effect of pressure [28]. The reason for selecting each of these sample sets will be explained as the results are introduced.

2. Experimental

2.1. Materials

The bitumen feed materials and thermally converted bitumen samples investigated in this work were taken from previous studies [26,27,28]. In all cases the products from thermal conversion of the bitumen were phase separated in those original studies. In those instances where solids were formed, the solids were removed from the liquid product. The converted products analyzed in this work are therefore the solids-free liquid products from thermal conversion.
For the purpose of reference, characterization data for the feed materials are repeated in Table 1.
The samples were diluted in toluene (99.9%, Fisher Scientific, Waltham, MA, USA) for analysis. The choice of toluene as solvent was based mainly on its ability to dissolve bitumen. The drawback of toluene is that it limited the useful spectral range. Toluene absorbs in the ultraviolet region at around 270 nm, with reported values for the 0 → 0 transition of ground state to first excited state of toluene at 267 nm [29] and 269 nm [30].
The reason so much emphasis was placed on bitumen solubility in the selection of the solvent, as opposed to the wider spectral range offered by other solvents, was the risk of phase separation. The thermally converted bitumen contained about the same or higher asphaltene content than the feed materials (Table 1). The asphaltenes is a solubility class that is defined by insolubility in excess n-alkanes, such as n-pentane and n-heptane, and solubility in aromatics, such as toluene. Considering the high dilution, the conditions for asphaltenes separation would exist during sample preparation and toluene was selected to facilitate complete dissolution of all of the material.

2.2. Experimental Protocol

One of the challenges with the measurement of fluorescence of oilsands bitumen and its thermally converted products is the intensity of its fluorescence. To avoid detector saturation, it was necessary to dilute samples in the order of 104 and samples were measured at around 100 μg/g concentration. This was accomplished by progressive dilution, each step representing 1–2 order of magnitude dilution in toluene. The concentration of the original sample in toluene was recorded gravimetrically, using a Mettler Toledo XS 105 (Greifensee, Switzerland) balance with a maximum capacity of 120 g and readability of 0.1 mg.
Practically, the first dilution was the most difficult due to the high viscosity of some of the samples. This diluted sample was thoroughly mixed at room temperature using a magnetic stirrer to obtain a homogenous-looking sample. Subsequent dilutions were easier. Within a small margin of error, the concentration of prepared samples was the same, which facilitated direct comparison of fluorescence spectra.
No attempt was made to remove dissolved oxygen from the prepared samples. Dissolved oxygen is known to cause collisional quenching of fluorescence [10]. However, it was reasoned that fluorescent quenching would be consistent for all samples and it should not undermine relative comparisons.
Samples that were stored for an extended period before the fluorescence spectra were collected had the risk of being aged during storage [31]. This was the case for studies by Yañez Jaramillo et al. [26,27], but not of Nascimento et al. [28]. In the case of samples where there was a risk of aging, the refractive index was measured before analysis and was compared to the value reported for the sample when it was originally produced and characterized. It was found that despite the tightness of sealing and similarity of storage conditions (ambient temperature in the dark) not all samples were equally well preserved. Based on refractive index measurements, one sample from triplicate samples at each condition the affected studies [26,27] was selected for this work. The refractive index analyses are reported as part of the results.

2.3. Analyses

Fluorescence spectra were measured using a Horiba Aqualog UV 800 C A-TEEM Fluorescence Spectrometer (Kyoto, Japan). The instrument employed a 150W xenon arc lamp for generating the excitation radiation. It contains three detectors: the reference detector, standard absorption signal detector, and fluorescence detector (a charge-couple device detector). Instrument operation was verified by performing analysis of a water standard (Starna Scientific, Essex, UK) to determine the contribution of scattered light, i.e., Rayleigh or Raman scatter. The instrument recommended a minimum signal-to-noise ratio of 20,000. The observed value was higher.
Analyses were performed using 1 cm-path-length quartz cuvettes under air-saturated ambient conditions. Steady state fluorescence spectra were collected over the excitation wavelength range 240–800 nm with an integration time of 0.1 s. Narrower excitation wavelength ranges were selected for specific experiments once the fluorescence spectra over the whole range were collected. Such narrowing of the excitation wavelength range will be noted as part of the results. Although toluene (blank sample) caused fluorescence (Figure 1 left), it did not compromise the investigation, as can be seen from an illustrative example showing the fluorescence of a bitumen-derived sample in toluene (Figure 1 right).
Refractive index at 598 nm (sodium D-line) was measured at 20, 30, and 40 °C using an Anton Paar Abbemat 200 (Graz, Austria). Samples were measured as air-saturated samples and in the same manner as the original measurements were made [26,27]. Although only 20 °C measurements are reported, the other measurements were employed to verify internal consistency. Refractive index changes linearly with temperature over a limited temperature range and linear regression of the data enabled verification that the data was consistent, thereby improving confidence in the values reported.

3. Results

3.1. Cold Lake Bitumen Converted at 150–300 °C

Thermal conversion of heavy oils and bitumen by visbreaking is conventionally performed at coil outlet temperatures above 400 °C [1,7,32,33]. Yet, due to the high persistent free radical content in heavy oils and bitumen [34], it is not necessary for thermal cracking to be initiated by homolytic bond dissociation at high temperature. Keeping this in mind, it should not be surprising that thermal conversion of bitumen leading to a product with lower viscosity than the feed could be performed at lower temperatures, 250–400 °C [26,35,36]. Conversion of bitumen at lower temperatures is relevant to preheat- and distillation sections of processes.
The study by Yañez Jaramillo et al. [26] reported thermal conversion over a wide temperature range, 150–300 °C, at 4 MPa initial pressure and the reaction progression was documented for reaction times from 1 to 8 h. Most of these samples were available, except those for short reaction time at 300 °C. At the time the study using fluorescence spectroscopy was initiated, these samples were in storage for about 8 years.
The original work [26] reported that when the bitumen feed was treated at 150 and 200 °C, the viscosity increased, and the n-pentane insoluble content increased. Carbonaceous solids (coke) formed after around 8 h of reaction time at 150 °C and a minor amount of solids were found in all products at 200 °C conversion. Although the viscosity of the bitumen was decreased after thermal conversion at 250 and 300 °C, the decrease was not monotonous. Formation of solids was observed in all of the products from conversion at 250 and 300 °C. The nature of the solids changed from a congealed liquid-like structure to granular carbonaceous particles as conversion time increased. The impact of free radical addition reactions was evident in all of these reaction products.
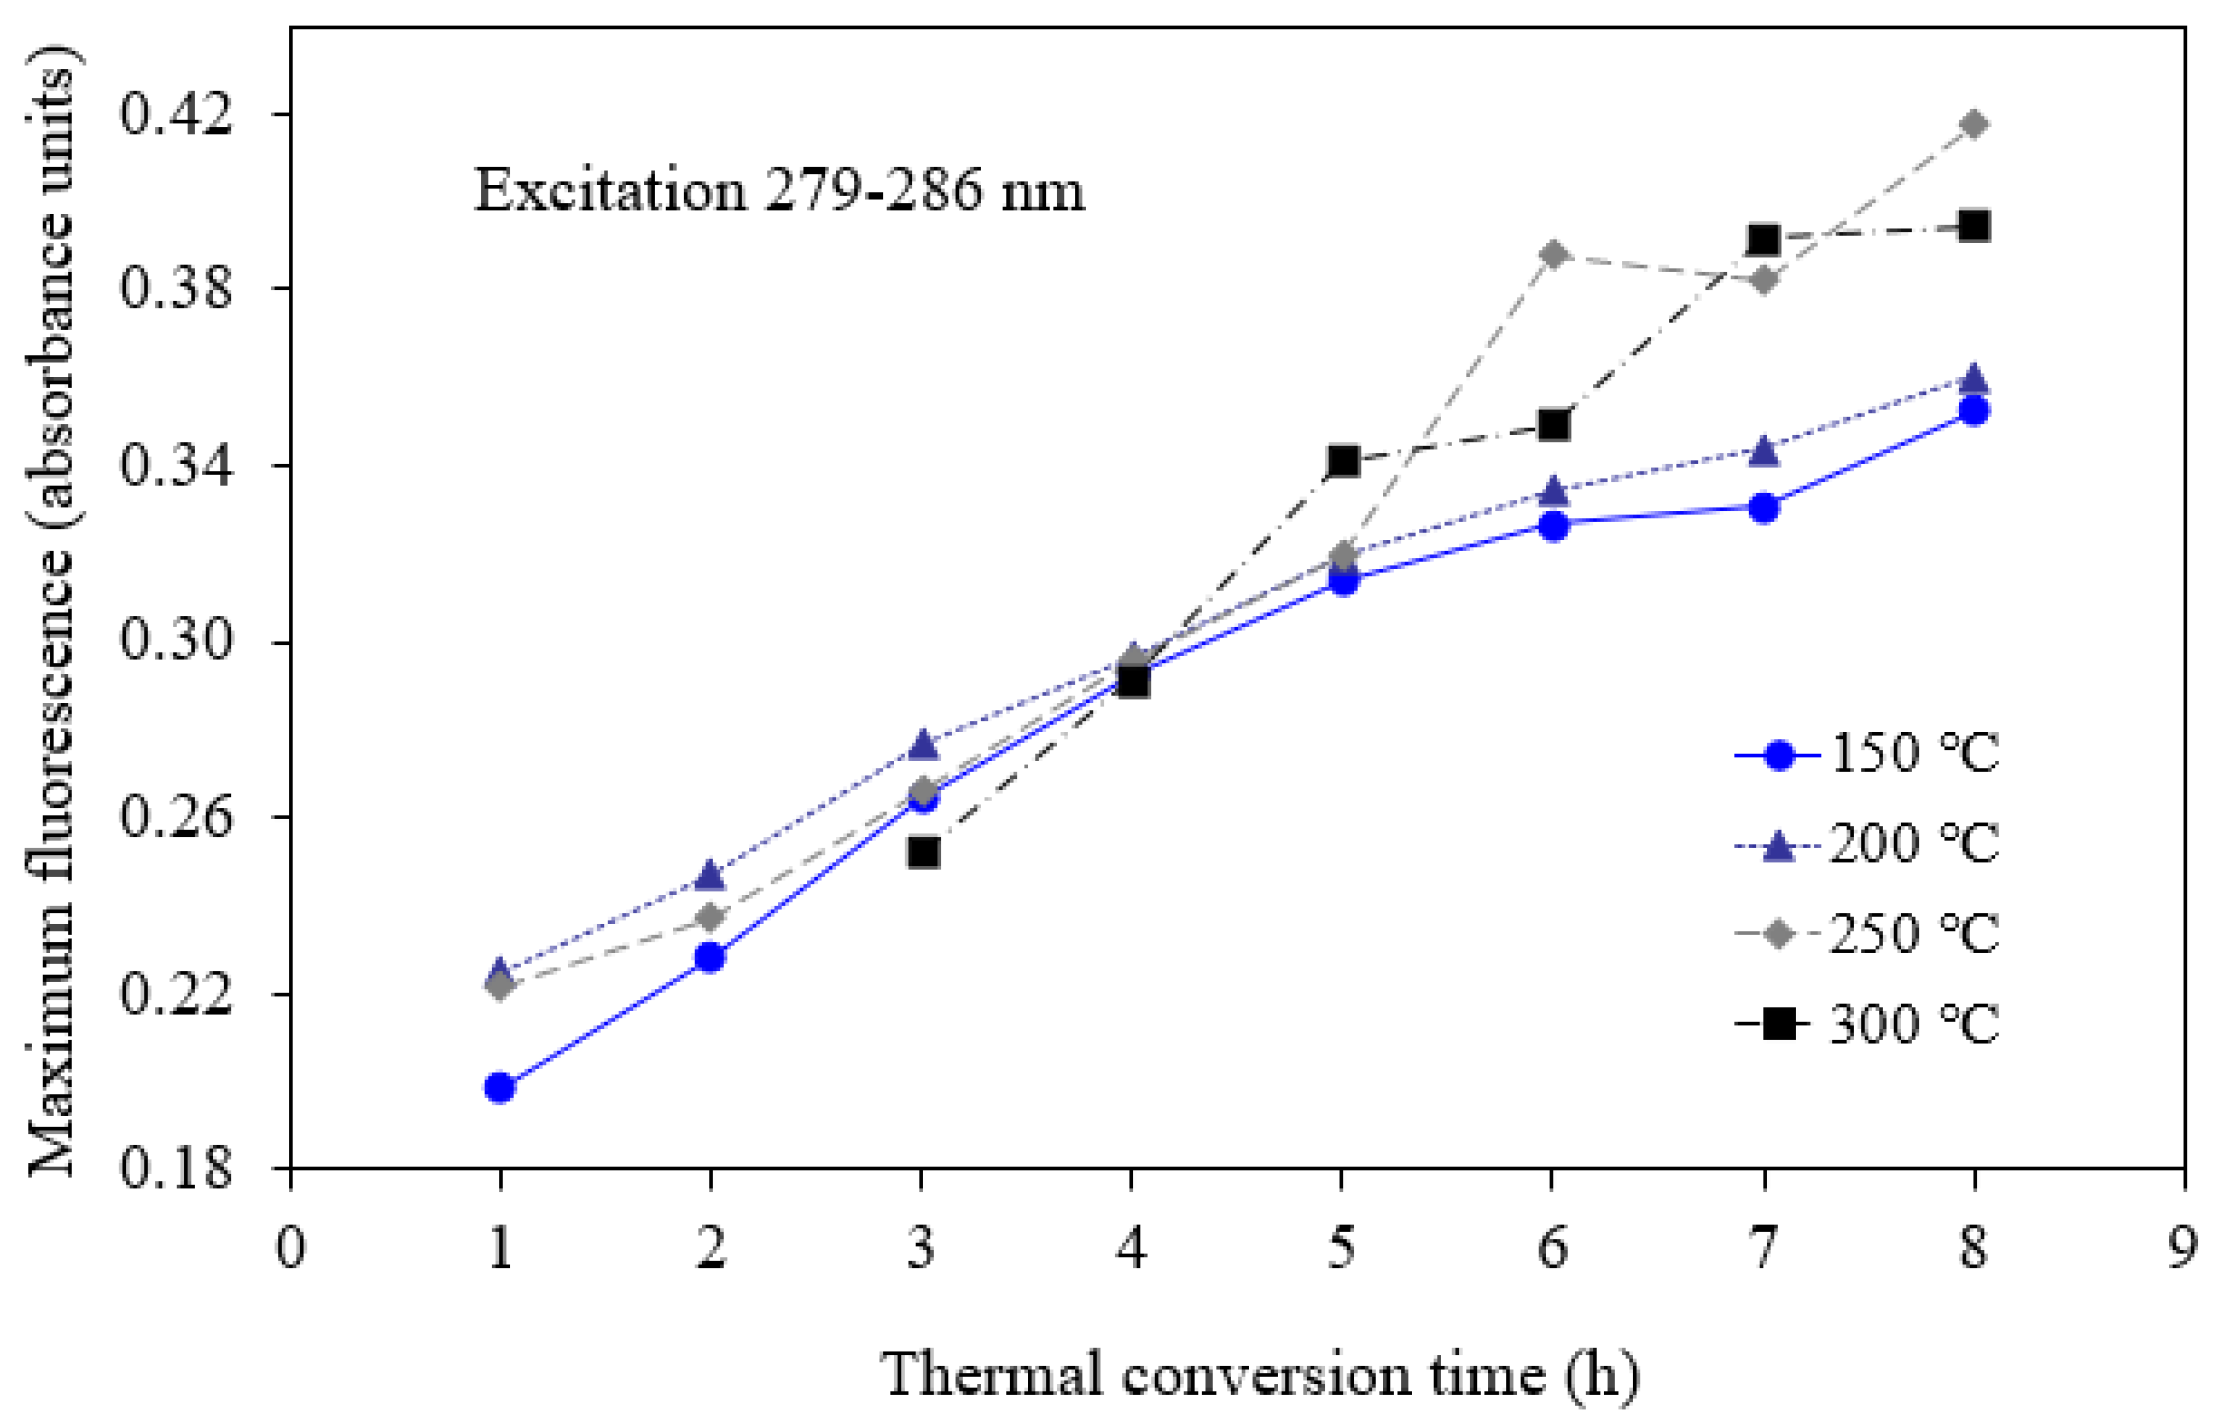
Using contour plots, such as shown in Figure 1, it was found that the best excitation wavelengths for the samples were around 280 nm (279–286 nm). This was at a slightly longer wavelength than the strong absorption of toluene at around 270 nm. The resulting fluorescent emission was most intense in the 350–450 nm region. The maximum fluorescent emission values for the samples in relation to thermal conversion conditions are shown in Figure 2.
The fluorescence intensity mostly increased with an increase in reaction time. Remarkably, the fluorescence intensities of the thermally converted Cold Lake bitumen samples showed little differentiation based on reaction temperature for reaction times up to 4 h. The 250 and 300 °C converted materials exhibited more intense fluorescence only at longer reaction times.
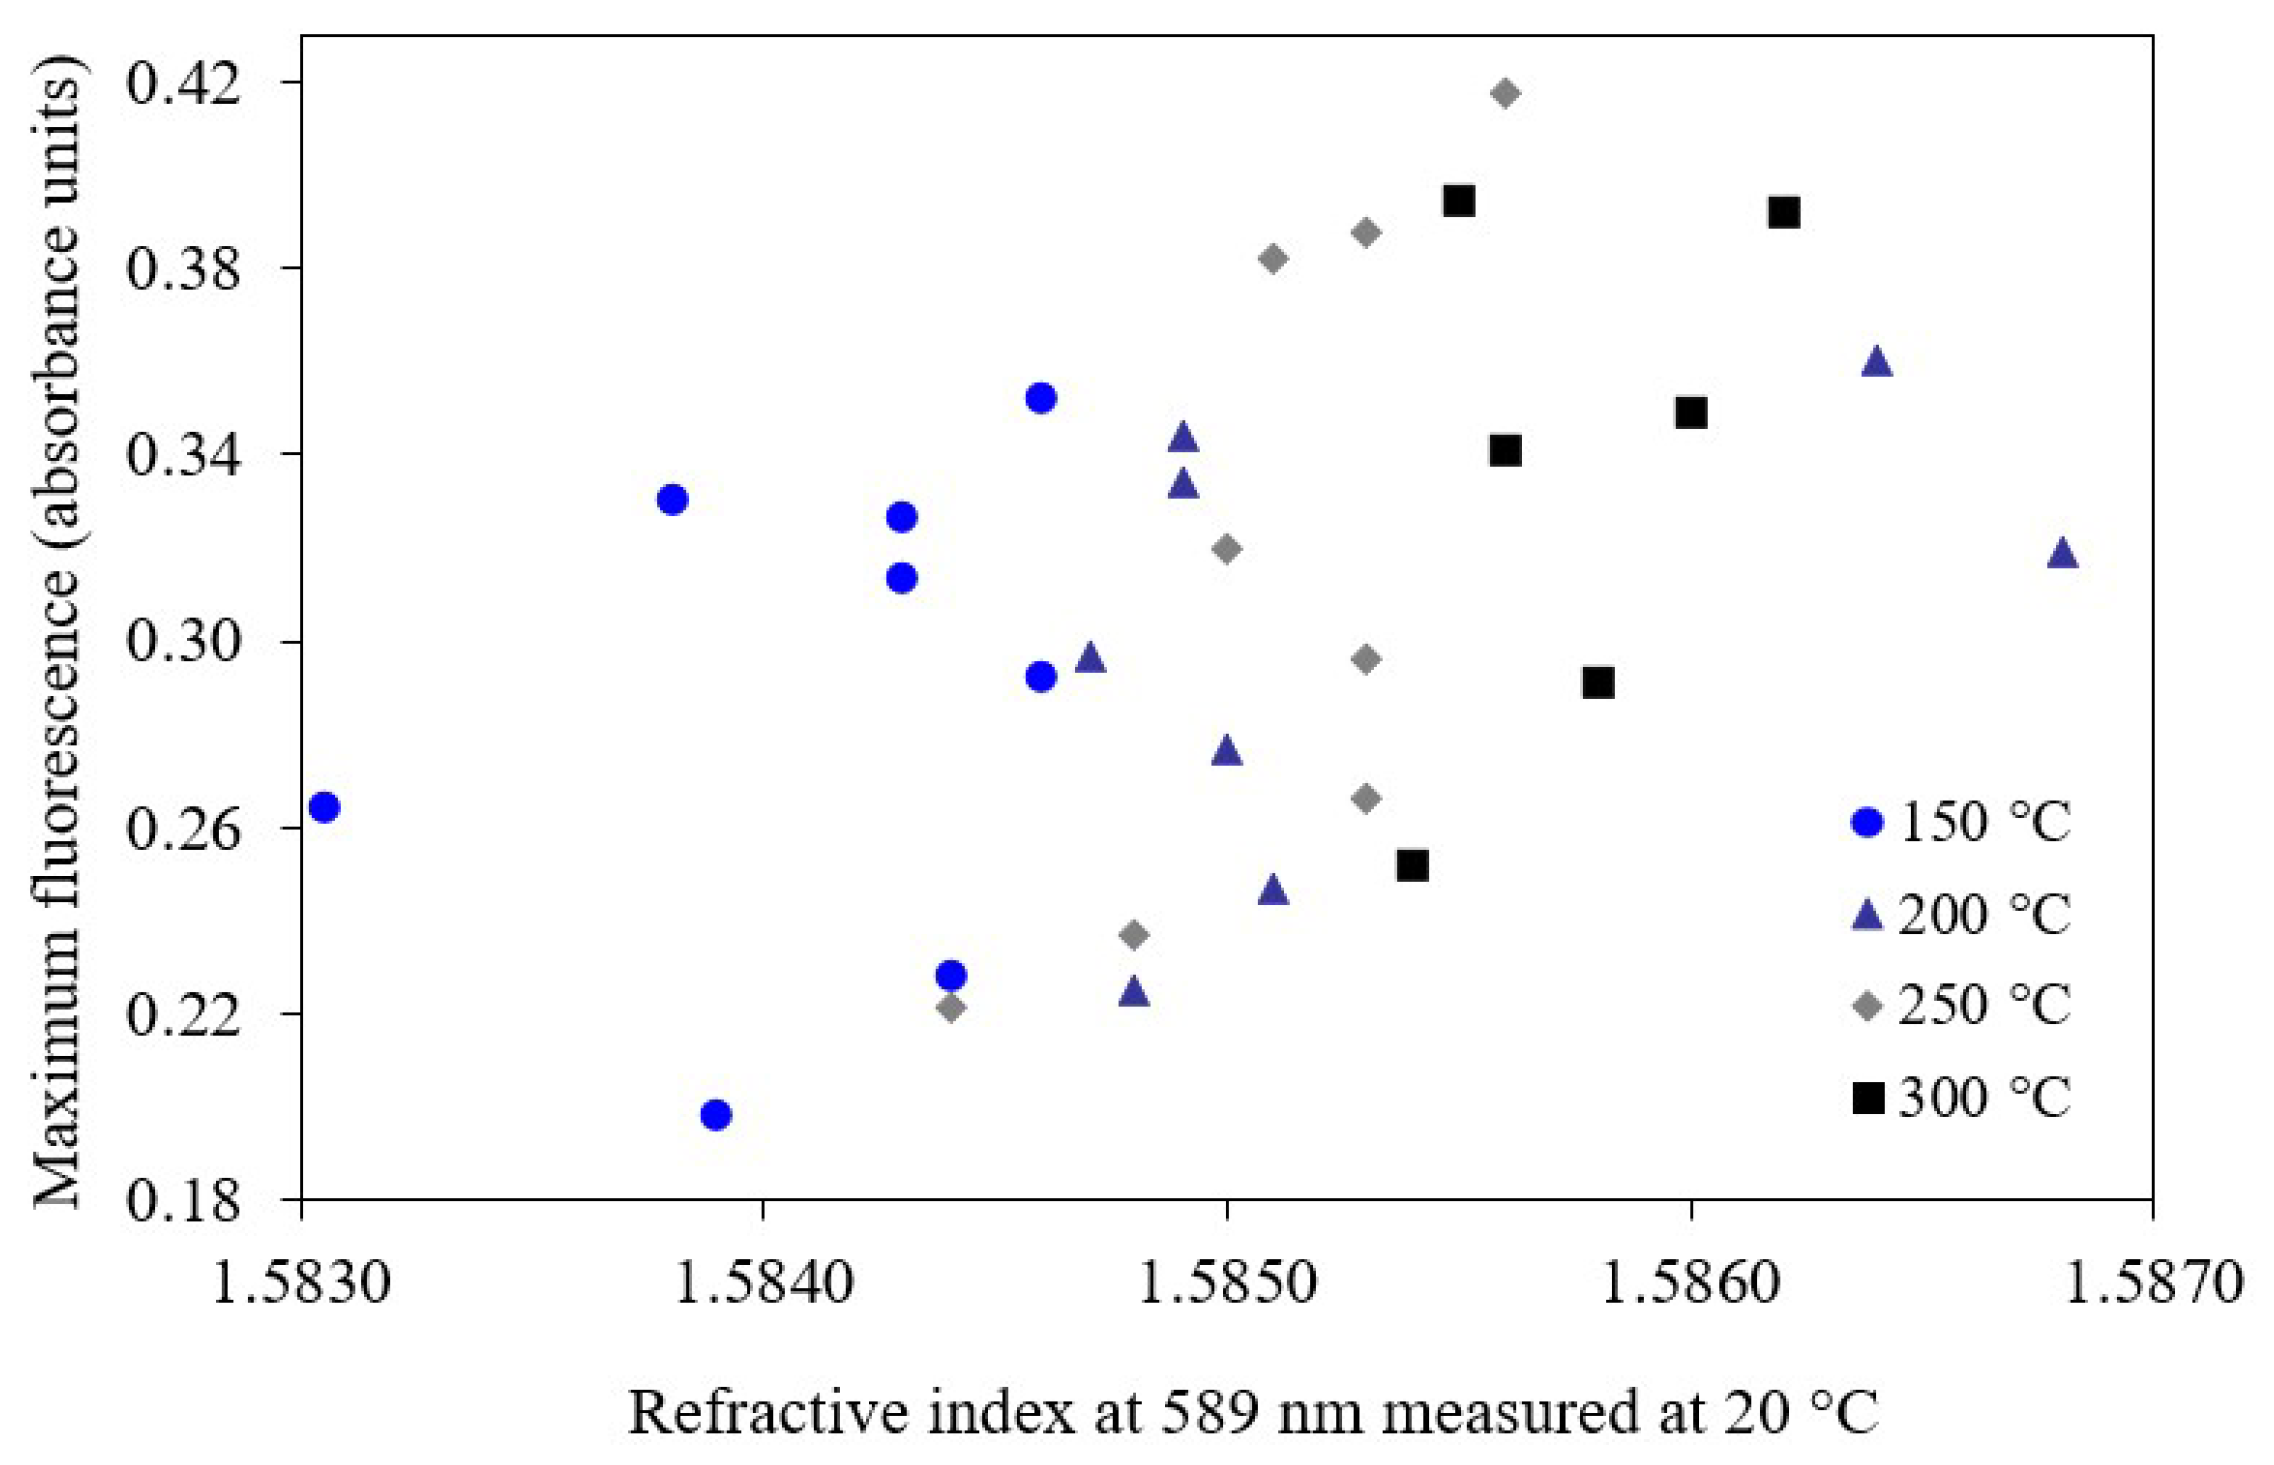
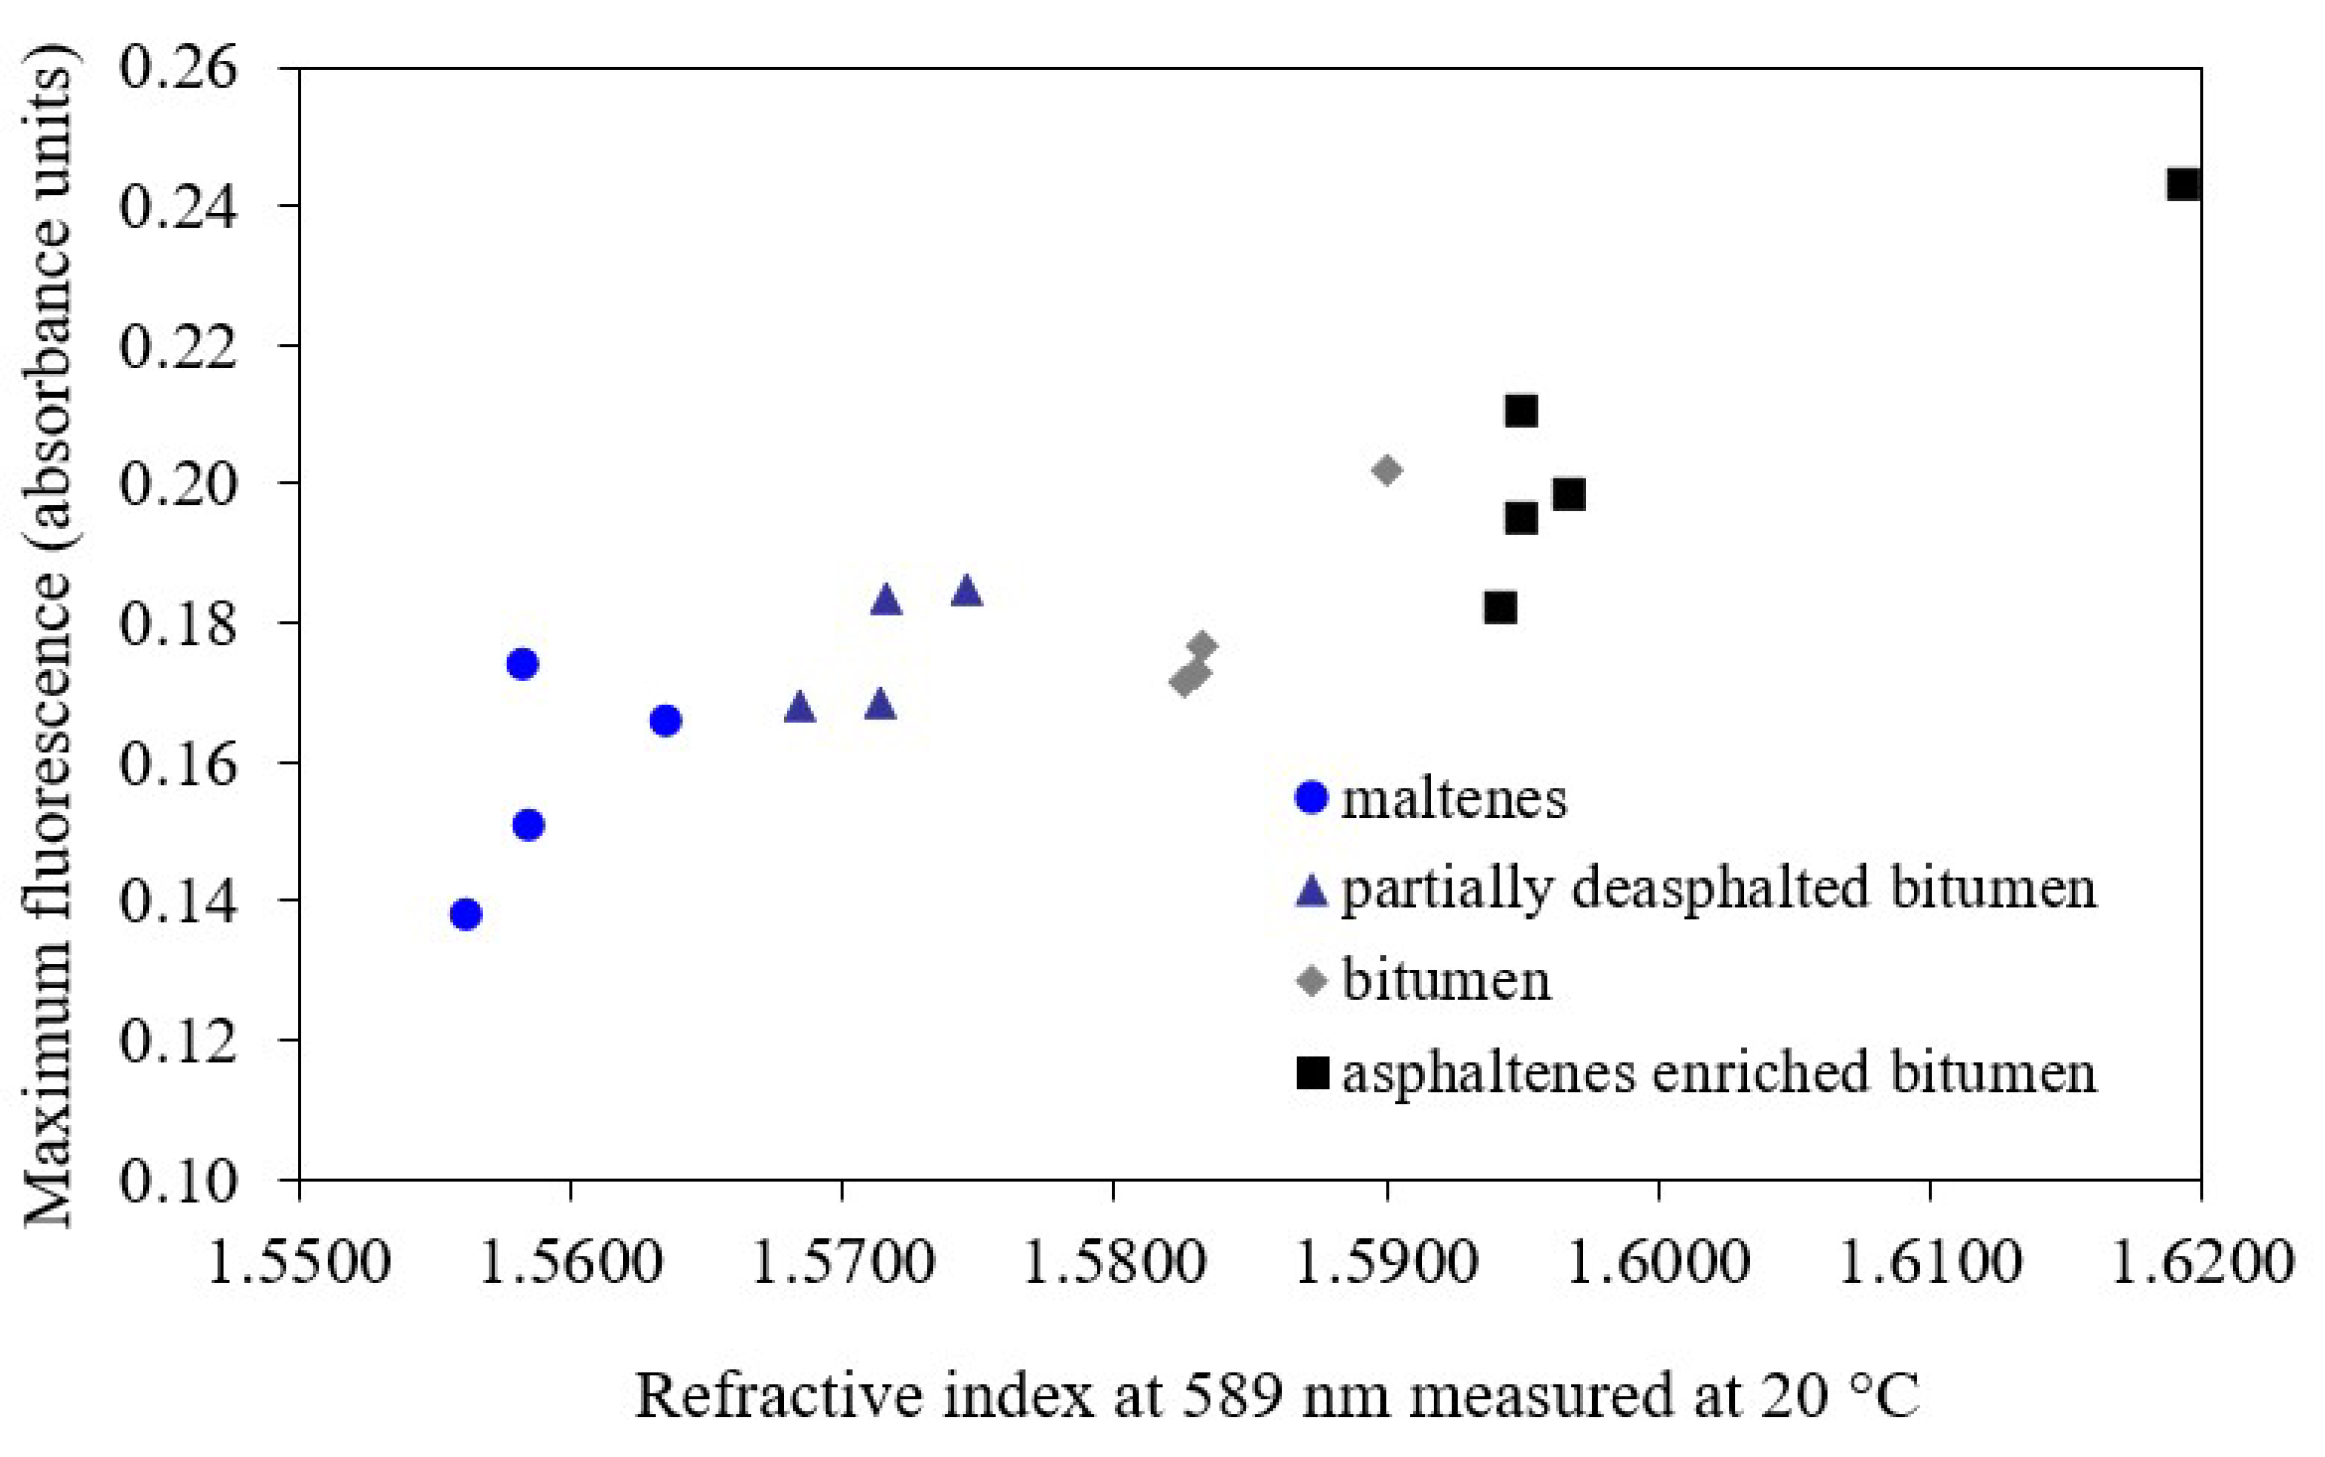
The material from conversion at 250 °C for 7 h was reported to have a lower refractive index than the materials converted for 6 and 8 h [26]. Yet, refractive index itself was poorly correlated to fluorescence intensity. This can be seen from Figure 3, showing the refractive index of the aged samples that was measured shortly before the fluorescence analysis, in relation to the maximum fluorescence emission values.
It is clear from Figure 3 that the intensity of fluorescence was related to a different aspect of the sample composition than the refractive index. Refractive index is an indicator of the onset of asphaltenes phase separation in petroleum [37]. The implication was that the observed increase in fluorescence intensity was unrelated to the product’s proximity to the onset of asphaltenes phase separation.
The samples analyzed in this study and for which the results were presented in Figure 2 and Figure 3, aged during storage. In several samples slight positive pressure developed in the sample container over the storage period, resulting in an audible ‘pop’ when the container was opened. The evolution of gas from unconverted Cold Lake bitumen at low temperature was reported to be mostly hydrocarbon in nature [38]. Presumably the same was true for the thermally converted Cold Lake bitumen samples.
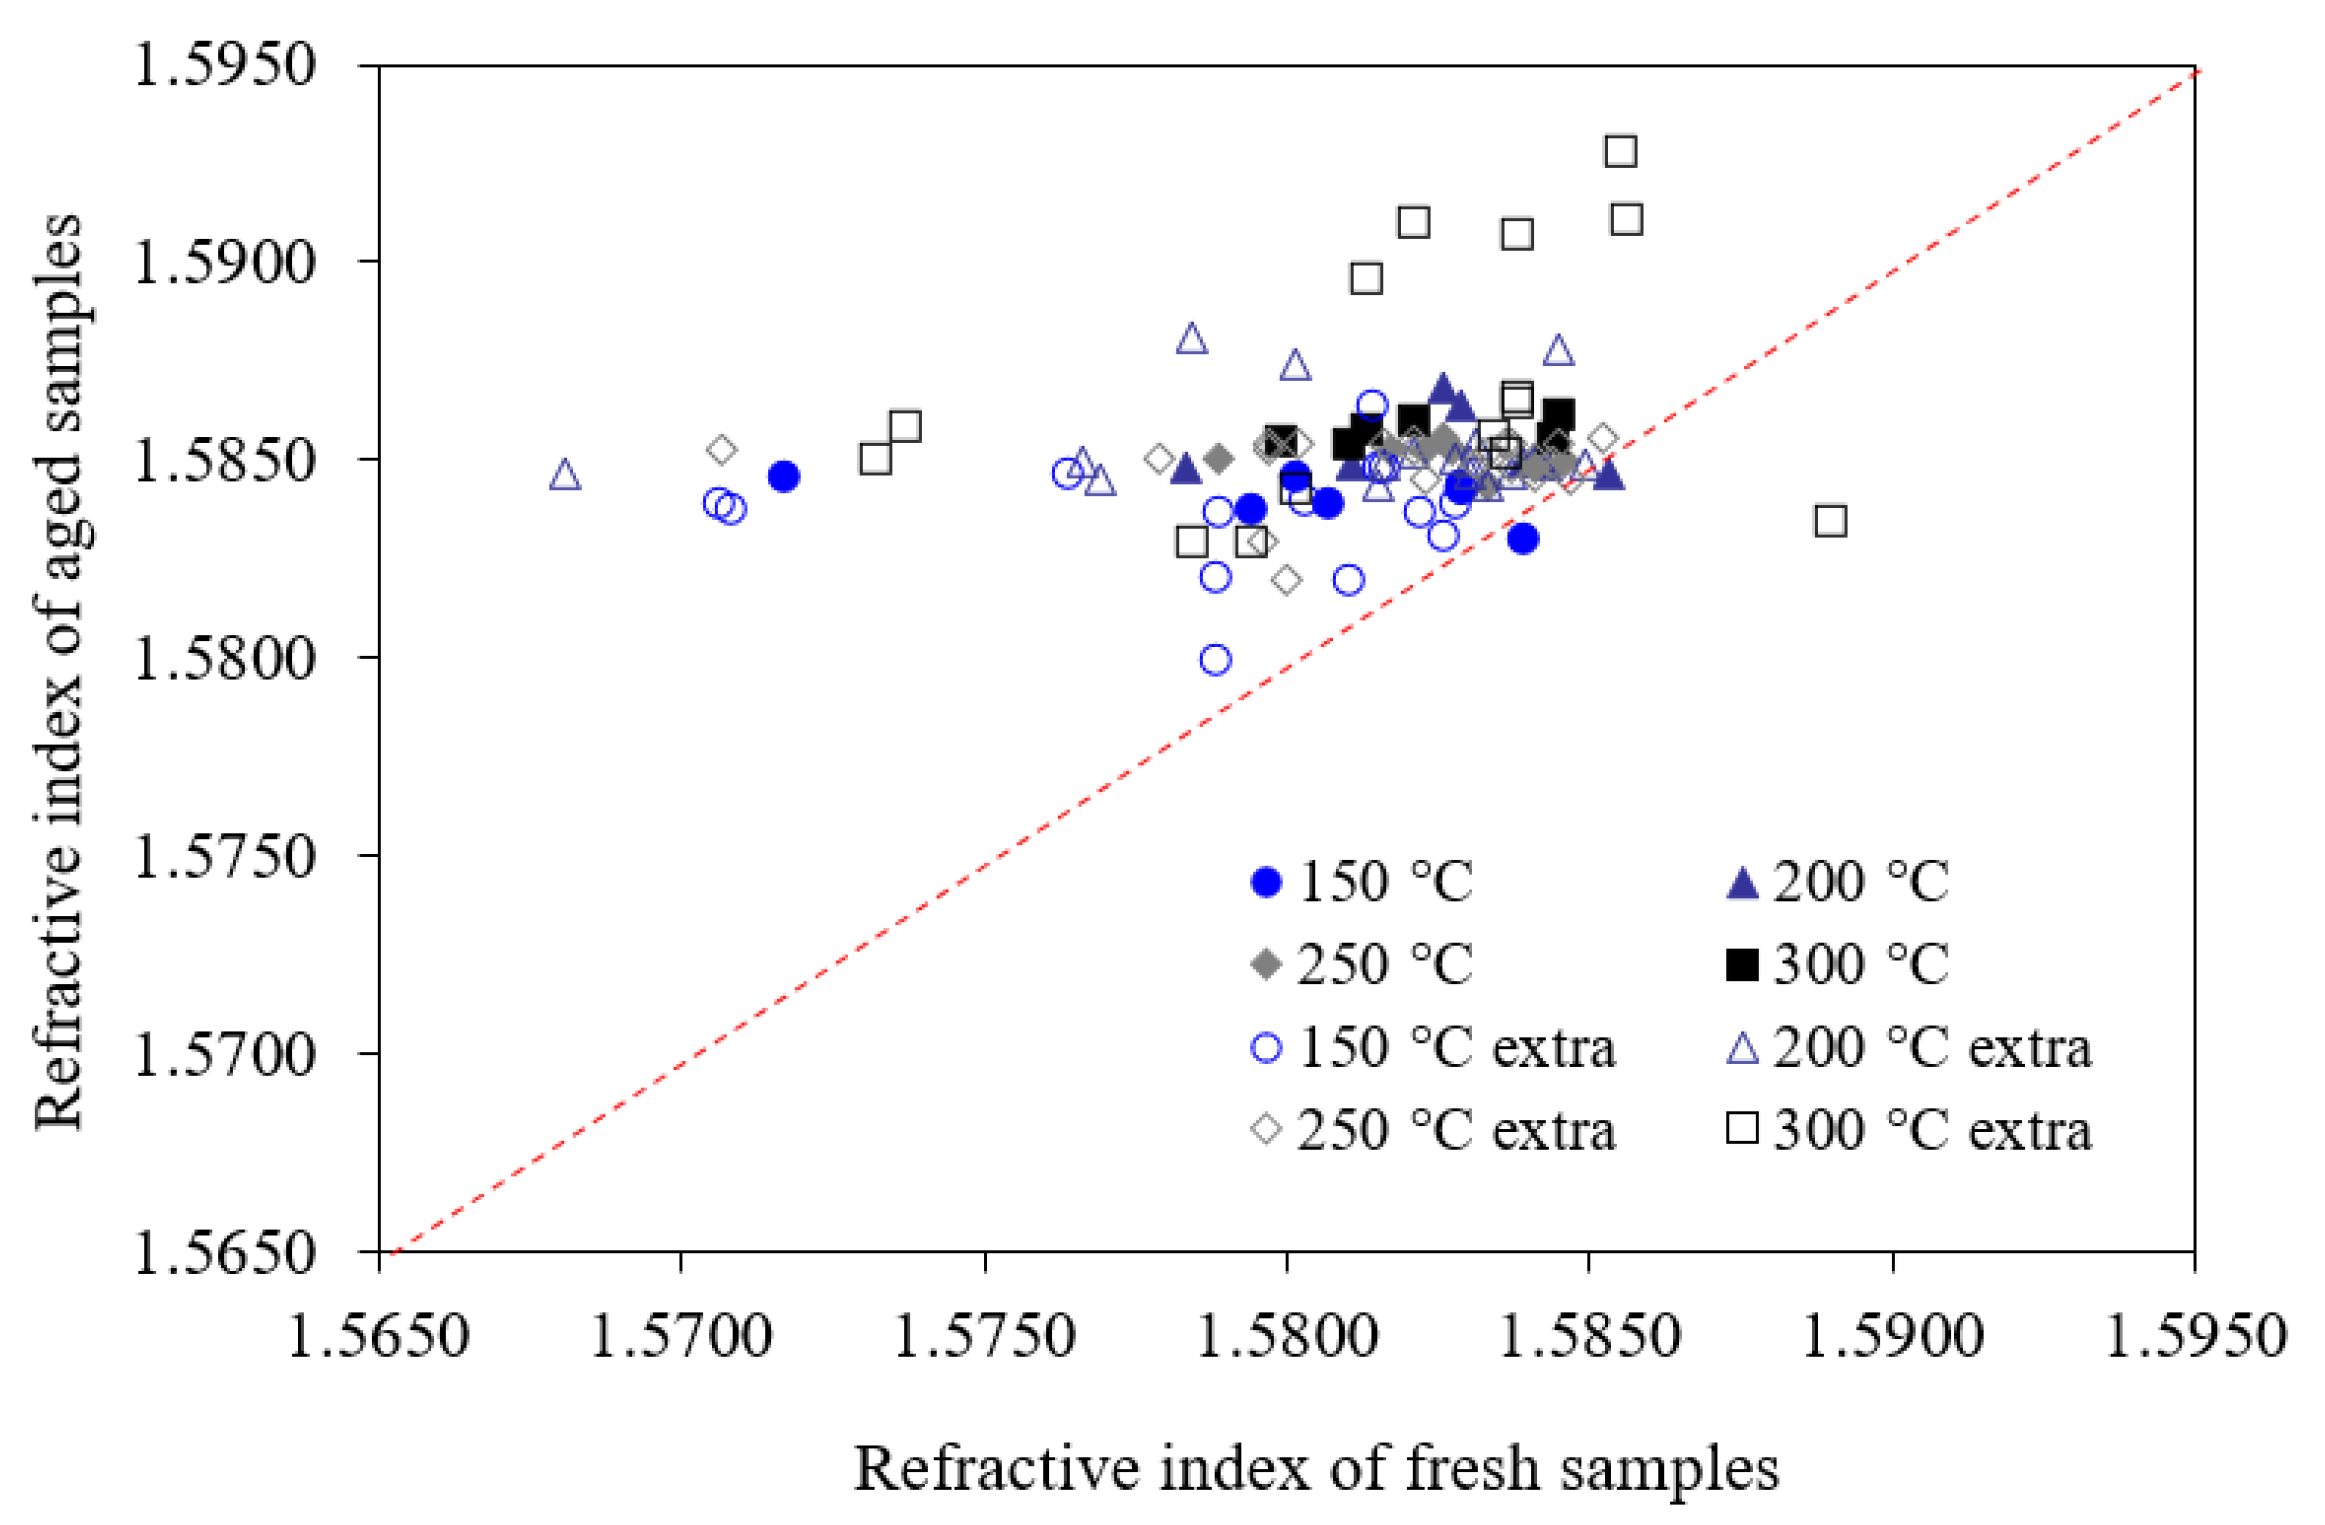
Comparison of the refractive index measurements performed on the fresh samples produced by thermal conversion [26], and the refractive index measurements performed on the aged samples, provided a measure of the extent of aging. A parity plot is shown in Figure 4, which not only shows the samples used for the fluorescence study, but also the extra samples not used.
The reason for showing all of the refractive index measurements was to show that the nature of the aging of the samples was comparable and not limited to the samples used for the fluorescence study. It was surprising to find that most (>90%) of the aged samples had refractive index values in the range 1.5820–15875, whereas the fresh samples had refractive index values spanning the range 1.5645–1.5890. This was even more intriguing when considering that the Cold Lake bitumen feed had a refractive index of 1.5844 (Table 1).
There is an unavoidable assumption related to the results presented in Figure 2. The fluorescence data presented reflected the fluorescence of the aged samples. The assumption is made that the changes caused by thermal conversion at the conditions reported in the original study [26] to produce species that are fluorophores, are still retained in the aged samples, despite Figure 4.

3.2. Athabasca Bitumen Derived Materials Converted at 380 °C

Considering that fouling and coking is related to phase instability and formation of a second phase, it is understandable that asphaltenes (a solubility class defined by insolubility in light n-alkanes) is considered a potential source of fouling and coking. This is seen in thermal cracking models where coke-formation proceeds via asphaltenes [39,40,41]. On the other hand there is evidence that onset of coking in thermal conversion is poorly correlated with the asphaltene content of the straight run feed material [7,27].
For bitumen that is separated in saturate-aromatic-resin-asphaltene (SARA) fractions, most of the species that fluoresce are found in the aromatic-fraction, for which the fluorescence intensity is about two orders of magnitude higher than the other fractions [42]. At the same time it is noteworthy that fluorescence is not well correlated with the aromatic content (the compound class, not the SARA-fraction) in petroleum [18].
The fluorescence spectra of sub-fractions within each SARA-fraction were very similar [42]. In a different study, sub-fractionation of the asphaltenes-fraction by gel permeation chromatography also revealed similar fluorescence spectra for all sub-fractions [43]. Of relevance to the present study, irrespective of molecular mass, the species in the asphaltenes-fraction had similar sub-structures that were responsible for fluorescence.
In another study by Yañez Jaramillo et al. [27], the 380 °C thermal conversion at 2 MPa initial pressure of Athabasca bitumen derived feed materials with different asphaltene concentrations was reported at reaction times up to around 3 h. The asphaltene concentration of the bitumen was adjusted by solvent deasphalting with n-heptane, and the addition of the n-heptane insoluble material to the bitumen. In this way bitumen-derived feed materials were prepared with no asphaltenes (i.e., only maltenes), partially deasphalted bitumen, bitumen, and asphaltenes enriched bitumen. Most of these samples were still available and when the fluorescence spectroscopy study was started, the samples were in storage for about 2 years.
At 380 °C the progression of thermal conversion was as one would expect form a visbreaking process, despite the somewhat lower coil outlet temperature than encountered in industrial operation. The temperature was more representative of conversion in the soaker of a coil-and-soaker visbreaker, although one would also expect a section of the coil to be around this temperature.
The study [27] defined carbonaceous products as CS2 insoluble material. The bitumen-derived feed materials all contained some CS2 insoluble material, ranging from 0.2 ± 0.2 wt% in the maltenes to 1.9 ± 0.9 wt% in the asphaltenes. Keeping the measurement uncertainty in mind, thermal conversion of maltenes did not result in the formation of additional CS2 insoluble material even at the longest reaction time (189 min). At about 40 min reaction time there was evidence of a minor increase in CS2 insoluble material in thermally converted products from partially deasphalted bitumen, bitumen and asphaltenes enriched bitumen. The highest concentration of CS2 insoluble material was 3.8 wt% found in the thermally converted products from the asphaltenes enriched bitumen after 1 h reaction time.
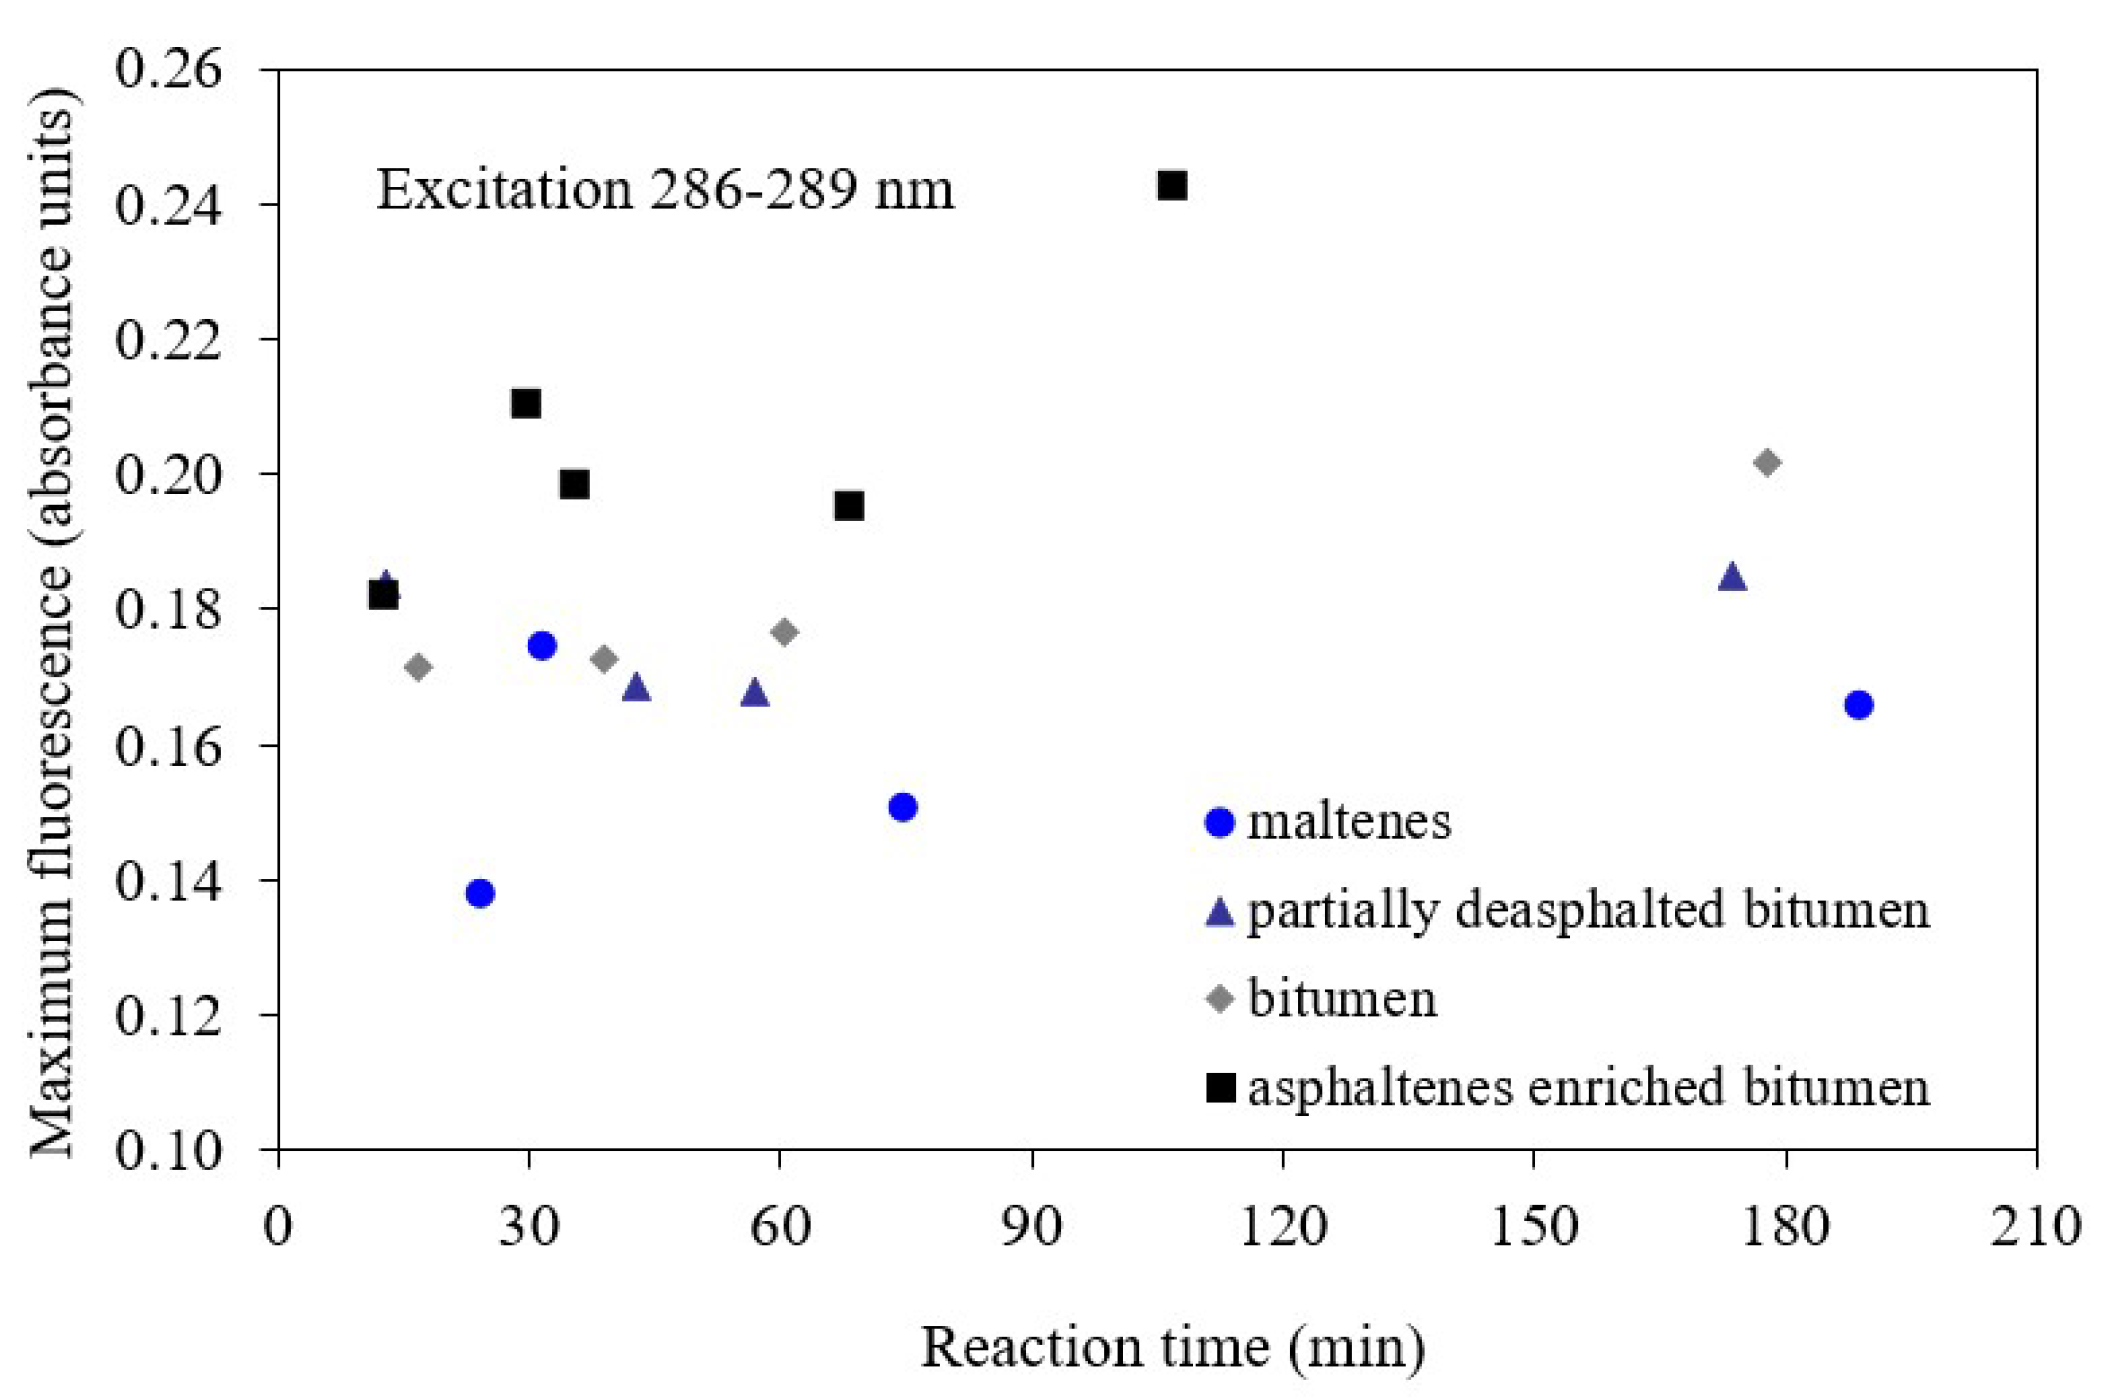
The excitation wavelengths resulting in the most intense fluorescence were at 286–289 nm. The maximum emission values for the thermally converted samples are shown in Figure 5.
Only the thermally converted products from Athabasca bitumen resulted in a monotonic increase in fluorescence intensity with increase in reaction time (Figure 5). The response of fluorescence intensity in relation to reaction time was not regular for the other feed materials. At the same time the maximum fluorescence intensity of the 380 °C converted products (Figure 5) were comparable with the 150–300 °C converted products (Figure 2) the same reaction time.
The refractive index of samples measured when produced [27], was compared to the refractive index of the aged samples. For the refractive index measured at 20 °C the difference was 0.0010 ± 0.0006, with the largest difference being 0.0018. Thus, although there was evidence of aging, the difference was little compared to impact of aging shown in Figure 4.
There appeared to be a relationship between the refractive index of the aged products from thermal conversion at 380 °C and the maximum fluorescence intensity (Figure 6).
Considering what was observed in Figure 3, such a relationship was not expected. On closer inspection it can be seen that there is only, broadly speaking, a relationship between refractive index and fluorescence intensity, but when each series of reaction products are considered separately, the same kind of scatter observed in Figure 3 is evident in Figure 6.

3.3. Athabasca Bitumen Converted at 400 °C and 0.5–4.0 MPa

Visbreaking of heavy oils and bitumen takes place by thermal conversion mostly in the liquid phase, which is insensitive to pressure. However, visbreaking pressure has an impact on vapor–liquid equilibrium, which is why several coil-and-soaker visbreaking models consider this aspect [44,45].
Pressure affects the extent to which lighter cracked products remain in the liquid phase, as opposed to being in the vapor phase. Increasing the concentration of lighter products in the liquid phase may have an impact on the way in which thermal conversion progresses. There is benefit to having lighter products with hydrogen-donor properties present in the liquid phase during visbreaking [46]. It was also found that dilution of bitumen with lighter material causes a suppression of the onset of coking, even if it does not have hydrogen donor properties [47]. The reason for this has not been established. It may be due to a solubility effect, a modification of reaction probability, shuttling of hydrogen, or something else. The impact of pressure at 400 °C is particularly relevant to soaker operation in a coil-and-soaker visbreaker.
The study by Nascimento et al. [28] explored the impact of pressure on thermal conversion of Athabasca bitumen with vacuum residue conversion sufficiently high to cause onset of coking. Based on reaction progression and the nature of the products, thermal conversion was divided into two pressure ranges, 0.5–2.0 MPa and 2.5–4.0 MPa. It was found that the onset of coking was suppressed in the 2.5–4.0 MPa pressure range, which was also accompanied by other property related changes. The initial study [28] did not employ fluorescence spectroscopy, the fluorescence spectra of the thermally converted products were subsequently collected to better explain the observations.
Rather than focus on maximum fluorescence intensity, the excitation wavelength selected for this work was 340 nm. Fluorescence peaks were observed at 389, 407 and 435 nm. Fluorescence intensities adjusted for sample concentration in toluene are reported in Table 2.
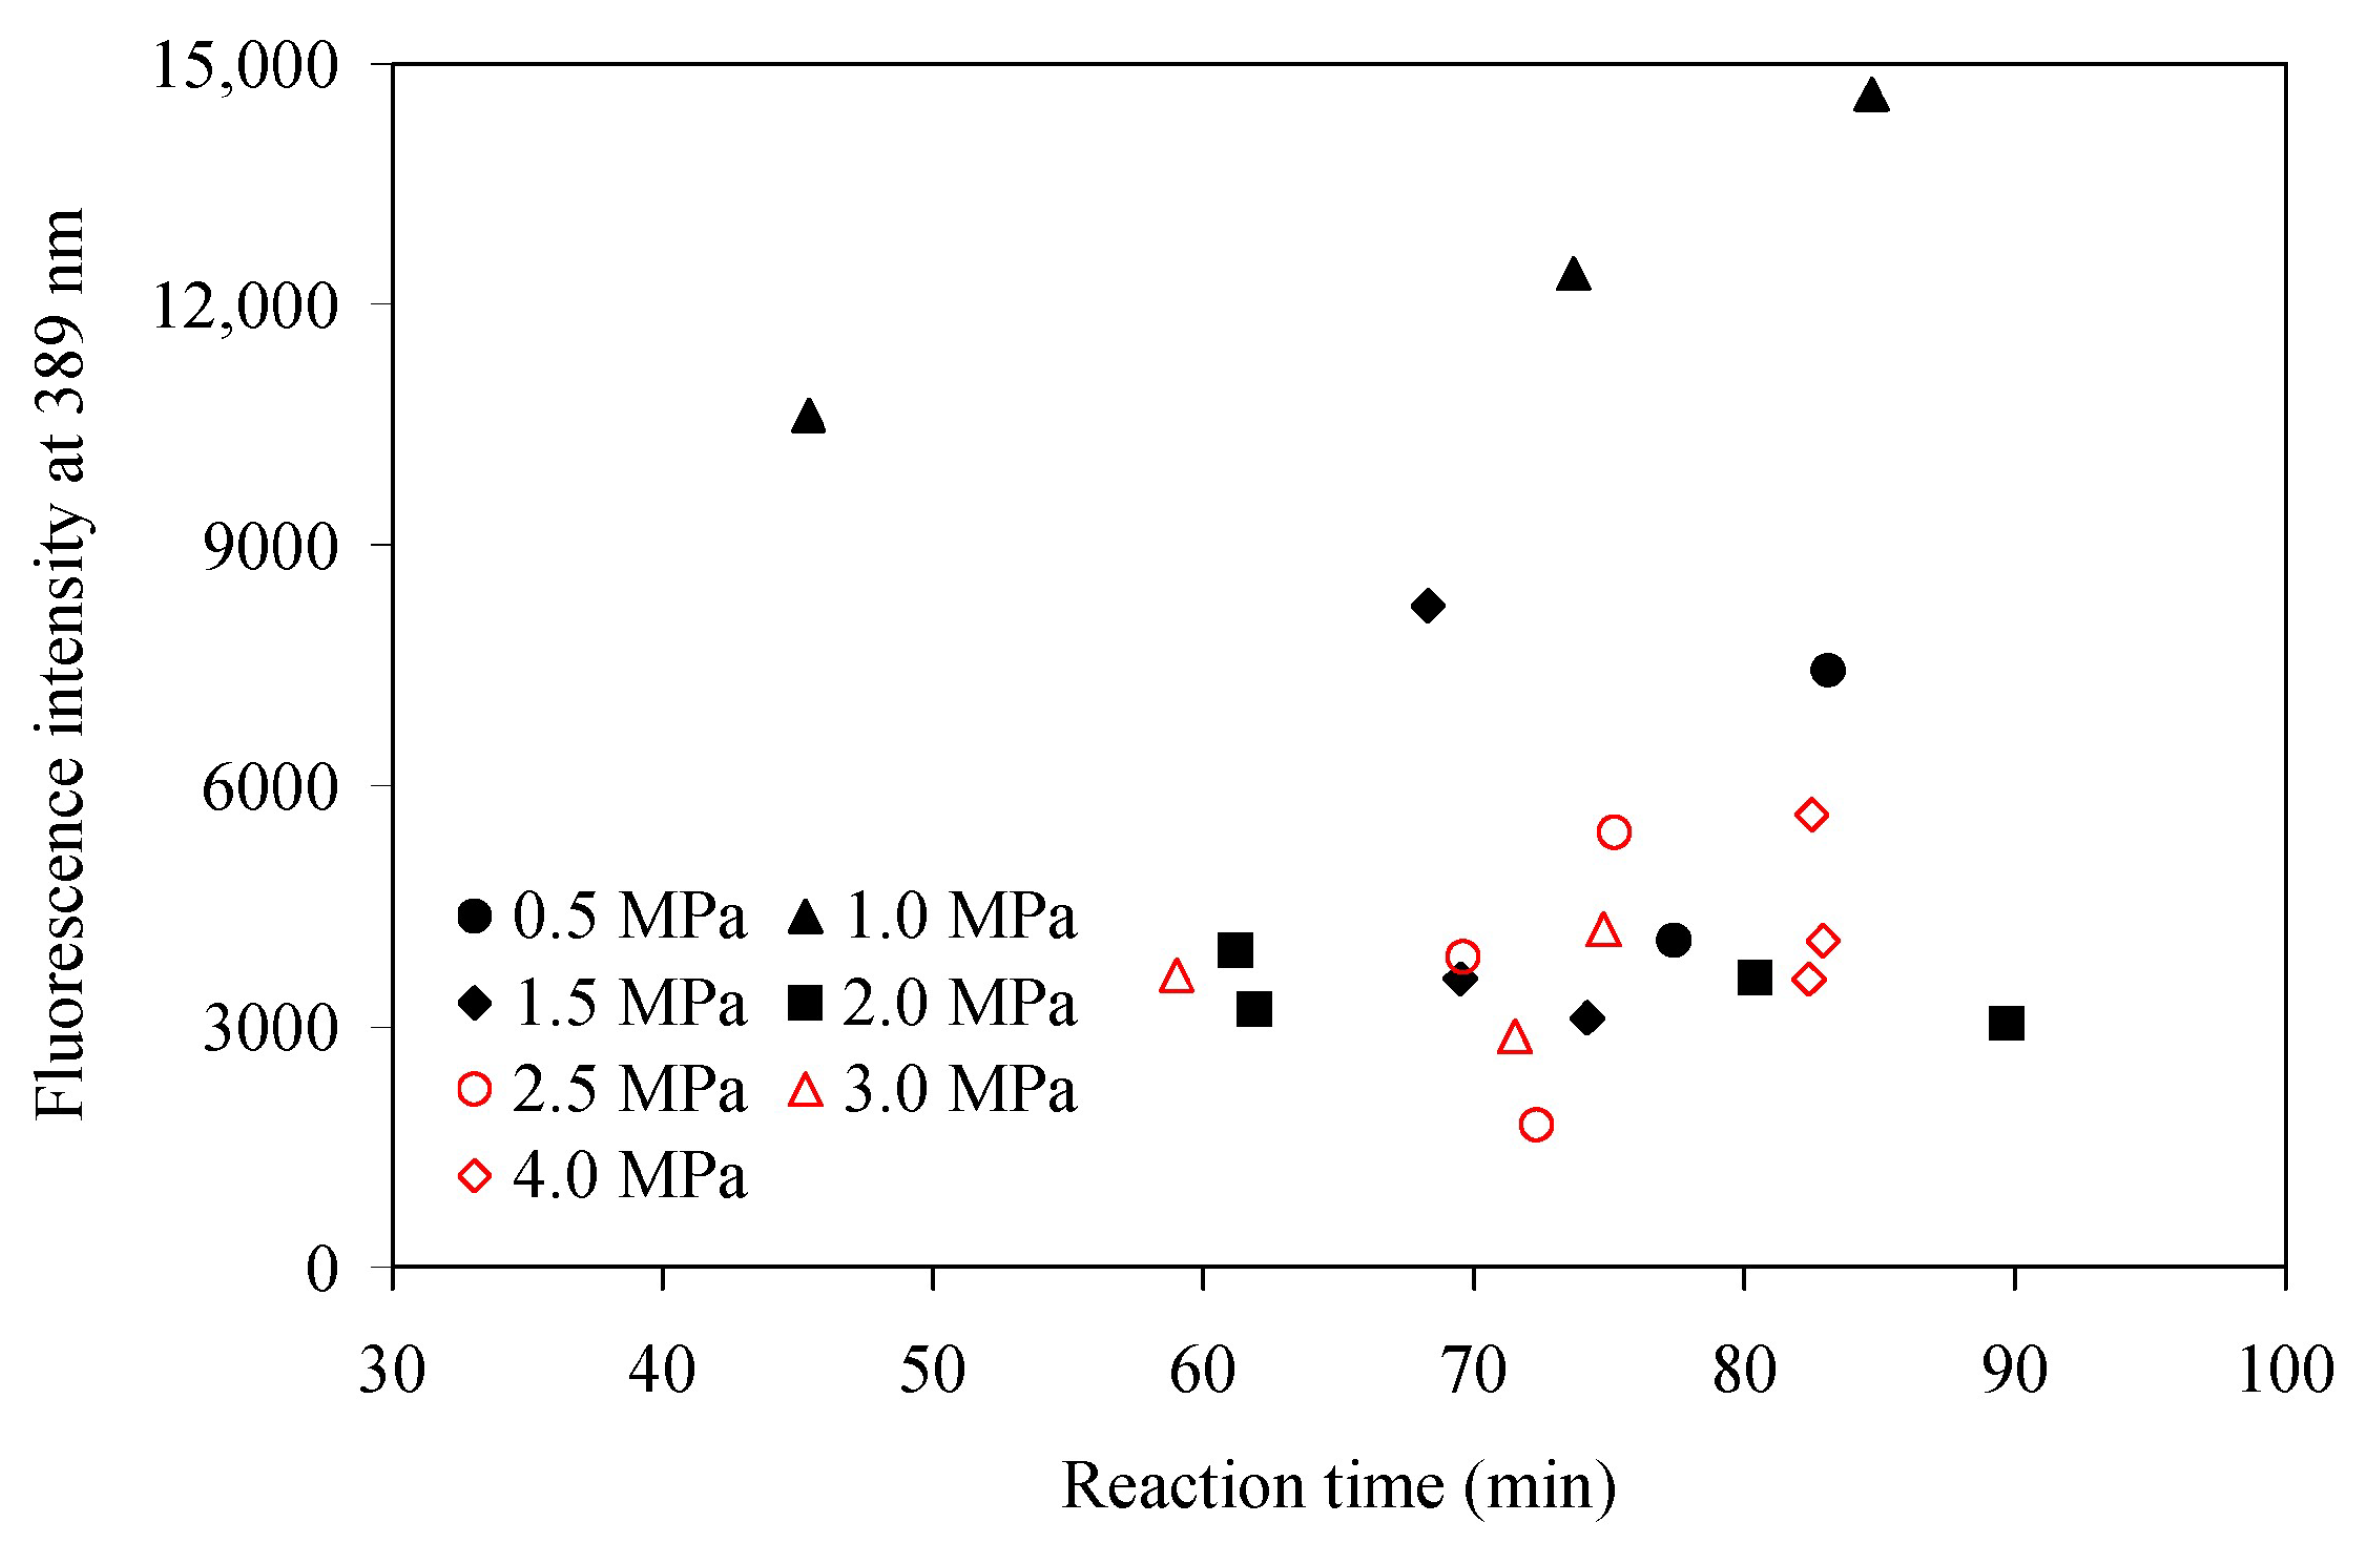
The fluorescence intensities of the thermally converted products were several times higher than that of the Athabasca bitumen feed (Table 2). The 389-to-407 and 407–435 nm intensity ratios varied to a minor extent, 1.09 ± 0.04 and 1.21 ± 0.03, respectively. There were no obvious relationships. Yet, from Figure 7 it can be seen that products converted at higher pressures generally displayed lower fluorescence intensity. This reflected the observations made by Nascimento et al. [28] for properties such as coke yield, which decreased with higher operating pressure at otherwise comparable conditions.

4. Discussion

The use of fluorescence spectroscopy to investigate thermally converted bitumen was justified based on the premise that many fluorophores have conjugated π-electron systems spanning atoms beyond that of the aromatic rings. Hence, fluorescence spectroscopy would be able to provide an indication of the concentration of aromatic species with conjugated unsaturated systems extending beyond the aromatic rings. These species were suspected to be responsible for reactions leading to the formation of products that could cause phase instability, fouling, and coking.
It is worthwhile looking at the experimental evidence in isolation first, before considering it in the context of the hypothesis that was outlined. By doing so, insights gained from the results are not dependent on the validity of the hypothesis.
(a) The fluorescence intensity of bitumen was several times lower than the fluorescence intensity of products obtained from thermal conversion of the bitumen (Table 2).
(b) The fluorescence intensity of products converted at 150–300 °C increase with an increase in reaction time (Figure 2). Considering that the product properties at each operating temperature was quite different from each other [26], as summarized in Section 3.1, the increase in fluorescence was not related to thermal conversion severity. Instead, it appeared that the increase in fluorescence intensity with thermal conversion at 150–300 °C was more dependent on time than on temperature. This comment is made under the assumption that the conditions of conversion can be related to the fluorescence, despite the impact of aging.
(c) For excitation at 279–289 nm, the maximum fluorescence intensity as function of reaction time was comparable for products from thermal conversion at 150–300 °C (Figure 2) and those from thermal conversion at 380 °C (Figure 5). At the same time, the intensity of the fluorescence at the same sample concentration was mostly higher for the products from conversion at 150–300 °C compared to the products from conversion at 380 °C.
(d) Fluorescence intensity of products from thermal conversion at 380 and 400 °C did not have the same near linear time-dependence (Figure 5 and Figure 7) as observed at 150–300 °C (Figure 2). Thermal conversion of bitumen at 380 °C (Figure 5) was the exception and displayed a monotonic increase in fluorescence intensity with increase in time of conversion.
(e) The fluorescence intensity in thermally converted products of feed materials with higher asphaltene content (Figure 5) was mostly higher than that of feed materials with lower asphaltene content, such as the maltenes. The is the opposite to what is reported of fluorescence intensity of feed materials, with maltenes having more intense fluorescence than asphaltenes [42].
(f) Despite some overlap in fluorescence intensity values, the 400 °C converted products obtained at 0.5–2.0 MPa generally had a higher fluorescence intensity than the products obtained at 2.5–4.0 MPa (Figure 7).
(g) There was no systematic relationship between refractive index and fluorescence intensity (Figure 3 and Figure 6).
The time-dependent increase in fluorescence intensity with thermal conversion that was only weakly dependent on the temperature (Figure 2), could be related to an observation by Yokono et al. [48]. It was reported that the free radical content of heavy oil changed little over the temperature range 150–350 °C. The free radical content of products was not reported in the original study [26].
The exponential increase in free radical content due to free radical formation by thermolysis, which can be described by an Arrhenius relationship, is only observed at >380 °C [49]. Free radical propagation reactions, such as hydrogen transfer, are not energetically demanding. For example, activation energies for hydrogen transfer in the range 30–80 kJ/mol have been reported for C–H bonds in different molecules [50], which in all cases is a fraction of the homolytic bond dissociation energy, which is of the order 400 kJ/mol.
It is expected that the extent of hydrogen transfer would increase with conversion time, but that it would be weakly dependent on temperature when the temperature is <380 °C, as was the case for the products from conversion at 150–300 °C. It is also less likely that conjugated unsaturated molecules that were formed during thermal conversion at lower temperatures would be subject to hydrogen transfer due to the lower free radical concentration as noted by Yokono et al. [48], compared to products obtained when thermolysis becomes significant. Although this offers a plausible explanation for the results in Figure 2, it remains speculative.
At 380 °C (Figure 5) the free radical concentration becomes more dependent on thermolysis. The asphaltenes fraction from Athabasca bitumen is reactive to thermal conversion, with an apparent activation energy of 176 kJ/mol [51], which is lower than the typical average activation energy of 209.5 kJ/mol used for visbreaking equivalent residence time calculations [52]. A faster increase in fluorescence intensity in the asphaltenes enriched bitumen feed, with a slower development of fluorescence intensity in the maltenes feed, is consistent with fluorescence intensity being related to the extent of free radical reactions taking place. This is also congruent with the observation that fluorescence intensity in thermally converted products from bitumen are higher than in the bitumen feed (Table 2).
The extent of free radical reactions taking place is not the same as vacuum residue conversion, because vacuum residue conversion does not account for reactions taking place in the vacuum residue that do not result in cracking to lighter products. The statement relates to the actual extent of reactions and not those limited by the definition of conversion in terms of decrease in vacuum residue content.
At this point it is useful to return to the hypothesis that fluorescence intensity is related to the concentration of aromatic species with conjugated unsaturated systems extending beyond the aromatic rings. Hydrogen transfer can produce such species. Furthermore, radicals that are resonance stabilized are of lower energy than radicals without resonance stabilization and can be more easily formed at lower temperatures. An explanation based on the persistent free radical concentration of bitumen and hydrogen transfer is therefore congruent with a description linking an increase in fluorescence intensity with an increase in concentration of aromatic species with conjugated unsaturated systems.
Under the assumption that the hypothesis is valid, an interpretation of the results in Figure 7 can be offered. The fluorescence intensity of products produced by thermal conversion at 2.5–4.0 MPa (Figure 7) was on average less than that of products produced by lower pressure thermal conversion. Suppression of products that would be prone to coke formation through the use of pressure could be related to suppression of the formation of aromatic species with conjugated unsaturated systems, which would in turn explain the lower fluorescence intensity. It is speculated that the effect of pressure is to increase the concentration of lighter species in the liquid phase, which has the same dilution-effect suppression of coke formation as reported by Zachariah et al. [47]. As mentioned before, the fundamental reason for coke suppression has not been established, although it appears to be related to suppression of radical-olefin addition reactions by dilution. If correct, it also implies that it is more likely that the products from such radical-olefin addition reactions are fluorophores.
The species that are formed during thermal conversion that are more prone to reactions leading to phase instability and the onset of phase instability are two different things, albeit causally related. In this study the hypothesis is that fluorescence spectroscopy would be able to reveal an increase in the formation of aromatic species with conjugated unsaturated systems. It is these species that are thought to be responsible for the reactions leading to products that cause phase instability [4], rather than being the species that are causing phase instability. It was shown that there is not necessarily a relationship between fluorescence intensity and refractive index (Figure 3), yet, refractive index was reported to be a reliable indicator for the onset of phase instability and phase separation in petroleum [37]. Fluorescence spectroscopy appears to be useful as indicator of the formation of species that may lead to phase instability, but not as an indicator of the proximity to phase instability.
To conclude, the use of fluorescence spectroscopy was useful in the study of thermally converted products. Although this work did not provide proof for the relationship between fluorescence intensity and concentration of aromatic species with conjugated unsaturated systems, the observations presented in this work were congruent with it.

5. Conclusions

The use of fluorescence spectroscopy to study thermally converted products was justified based on the observation than many fluorophores have conjugated π-electron systems and the hypothesis that aromatic species with conjugated unsaturated systems extending beyond the aromatic rings could form products leading to phase instability, fouling and coking. The following observations are independent of the hypothesis, but congruent with it.
(a) The fluorescent intensity of bitumen increases when it is thermally converted.
(b) Fluorescence intensity increased with an increase in reaction time for conversion at 150–300 °C, but at the same time it had a weak relationship with temperature. This relationship could still be observed for bitumen conversion at 380 °C, but was no longer monotonic for other bitumen derived feed materials. The relationship was not apparent for bitumen converted at 400 °C.
(c) There was no relationship between fluorescence intensity and refractive index.
(d) Bitumen converted at 400 °C and 0.5–2.0 MPa generally had a higher fluorescence intensity than bitumen converted at 400 °C and 2.5–4.0 MPa.
The experimental observations, as well as their relationship to the stated hypothesis, could be explained in terms of the expected condition-dependent changes in free radical concentration during thermal conversion and the associated extent of hydrogen transfer.

Author Contributions

Conceptualization, A.d.K.; data curation, A.d.K.; formal analysis, R.D., L.M.Y.J., P.T.H.N. and A.d.K.; funding acquisition, A.d.K.; investigation, R.D., L.M.Y.J. and P.T.H.N.; methodology, R.D., P.T.H.N. and A.d.K.; project administration, A.d.K.; resources, A.d.K.; supervision, A.d.K.; validation, A.d.K.; visualization, A.d.K.; writing—original draft, A.d.K.; writing—review and editing, A.d.K. All authors have read and agreed to the published version of the manuscript.

Funding

Funding for this work was received from the Natural Sciences and Engineering Research Council of Canada (NSERC).

Data Availability Statement

The original contributions presented in this study are included in the article. Further inquiries can be directed to the corresponding author.

Conflicts of Interest

The authors declare no conflict of interest.

References

  1. Mitkova, M.; Stratiev, D.; Shishkova, I.; Dobrev, D. Thermal and Thermo-Catalytic Processes for Heavy Oil Conversion (Bulgarian Academic Monograph 13); Bulgarian Academy of Sciences: Sofia, Bulgaria, 2017; ISBN 978-954-322-892-8. Available online: https://scholar.google.com/scholar_lookup?title=Thermal+and+Thermo-Catalytic+Processes+for+Heavy+Oil+Conversion&author=Mitkova,+M.&author=Stratiev,+D.&author=Shishkova,+I.&author=Dobrev,+D.&publication_year=2017 (accessed on 1 July 2025).
  2. Wiehe, I.A. Self-incompatible crude oils and converted petroleum resids. J. Dispers. Sci. Technol. 2004, 25, 333–339. [Google Scholar] [CrossRef]
  3. Storm, D.A.; Decanio, S.J.; Edwards, J.C.; Sheu, E.Y. Sediment formation during heavy oil upgrading. Petrol. Sci. Technol. 1997, 15, 77–102. [Google Scholar] [CrossRef]
  4. Vezirov, R.R.; Gareev, R.G.; Obukhova, S.A.; Vezirova, N.R.; Khalikov, D.E. Problems in resid-feedstock heat exchange in visbreaking units. Chem. Technol. Fuels Oils 2010, 46, 37–42. [Google Scholar] [CrossRef]
  5. Wiehe, I.A. A phase-separation kinetic model for coke formation. Ind. Eng. Chem. Res. 1993, 32, 2447–2454. [Google Scholar] [CrossRef]
  6. Wiehe, I.A. A solvent-resid phase diagram for tracking resid conversion. Ind. Eng. Chem. Res. 1992, 31, 530–536. [Google Scholar] [CrossRef]
  7. Brauch, R.; Fainberg, V.; Kalchouck, H.; Hetsroni, G. Correlations between properties of various feedstocks and products of visbreaking. Fuel Sci. Technol. Int. 1996, 14, 753–765. [Google Scholar] [CrossRef]
  8. Rahimi, P.M.; Teclemariam, A.; Taylor, E.; De Bruijn, T.; Wiehe, I.A. Thermal processing limits of Athabasca bitumen during visbreaking using solubility parameters. ACS Symp. Ser. 2005, 895, 183–196. [Google Scholar] [CrossRef]
  9. Stratiev, D.; Kirilov, K.; Belchev, Z.; Petkov, P. How do feedstocks affect visbreaker operations? Hydrocarb. Process. 2008, 87, 105–112. Available online: https://www.researchgate.net/publication/274511312 (accessed on 1 July 2025).
  10. Lakowicz, J.R. Principles of Fluorescence Spectroscopy, 3rd ed.; Springer: New York, NY, USA, 2006. [Google Scholar] [CrossRef]
  11. Geng, T.; Wang, Y.; Yin, X.-L.; Chen, W.; Gu, H.-W. A comprehensive review on the excitation-emission matrix fluorescence spectroscopic characterization of petroleum-containing substances: Principles, methods, and applications. Crit. Rev. Anal. Chem. 2024, 54, 2827–2849. [Google Scholar] [CrossRef]
  12. Ryder, A.G. Analysis of crude petroleum oils using fluorescence spectroscopy. In Reviews in Fluorescence 2005; Geddes, C.D., Lakowicz, J.R., Eds.; Springer: New York, NY, USA, 2005; pp. 169–198. [Google Scholar] [CrossRef]
  13. Ellingsen, G.; Fery-Forgues, S. Application de la spectroscopie de fluorescence à l’étude du pétrole: Le défi de la complexité (Engl. Transl. “Application of fluorescence spectroscopy to the study of petroleum: Challenging complexity”). Rev. IFP 1998, 53, 201–216. [Google Scholar] [CrossRef]
  14. Nandakumar, V.; Jayanthi, J.L. Hydrocarbon fluid inclusions, API gravity of oil, signature fluorescence emissions and emission ratios: An example from Mumbai offshore, India. Energy Fuels 2016, 30, 3776–3782. [Google Scholar] [CrossRef]
  15. El Hussein, A.; Marzouk, A. Characterization of petroleum crude oils using laser induced fluorescence. J. Petrol. Environ. Biotechnol. 2015, 6, 1000240. [Google Scholar] [CrossRef]
  16. Owens, P.; Ryder, A.G. Low temperature fluorescence studies of crude petroleum oils. Energy Fuels 2011, 25, 5022–5032. [Google Scholar] [CrossRef]
  17. Owens, P.; Ryder, A.G.; Blamey, N.J.F. Frequency domain fluorescence lifetime study of crude petroleum oils. J. Fluoresc. 2008, 18, 997–1006. [Google Scholar] [CrossRef] [PubMed]
  18. Ryder, A.G. Time-resolved fluorescence spectroscopic study of crude petroleum oils: Influence of chemical composition. Appl. Spectrosc. 2004, 58, 613–623. Available online: https://opg.optica.org/as/abstract.cfm?URI=as-58-5-613 (accessed on 1 July 2025). [CrossRef] [PubMed]
  19. Ryder, A.G. Quantitative analysis of crude oils by fluorescence lifetime and steady state measurements using 380-nm excitation. Appl. Spectrosc. 2002, 56, 107–116. [Google Scholar] [CrossRef]
  20. Cheng, P.; Ren, Y.; Yu, S. Determination of light and condensate oil categories in a complex petroleum system by fluorescence parameters: A case study on the Northern Tazhong uplift, Tarim basin, China. ACS Earth Space Chem. 2024, 8, 1997–2011. [Google Scholar] [CrossRef]
  21. Ryder, A.G. Assessing the maturity of crude petroleum oils using total synchronous fluorescence scan spectra. J. Fluoresc. 2004, 14, 99–104. [Google Scholar] [CrossRef]
  22. Ryder, A.G.; Glynn, T.J.; Feely, M.; Barwise, A.J.G. Characterization of crude oils using fluorescence lifetime data. Spectrochim. Acta A 2002, 58, 1025–1037. [Google Scholar] [CrossRef]
  23. Cheng, P.; Tian, H.; Xiao, X.; Gai, H.; Zhou, Q.; Zhou, L. Influence of thermal maturity on the time-resolved emission spectrum (TRES) fluorescence lifetime characteristics of crude oils: A preliminary study based on a thermal simulation experiment of crude oils. Energy Fuels 2023, 27, 5165–5178. [Google Scholar] [CrossRef]
  24. Cheng, P.; Liu, B.; Tian, H.; Xiao, X.; Gai, H.; Zhou, Q.; Li, T.; Liu, D. Fluorescence lifetime evolution of crude oils during thermal cracking: Implications from pyrolysis experiments in a closed system. Org. Geochem. 2021, 159, 104273. [Google Scholar] [CrossRef]
  25. Kershaw, J.R.; Fetzer, J.C. The room temperature fluorescence analysis of polycyclic aromatic compounds in petroleum and related materials. Polycylic Aromat. Compd. 1995, 7, 253–268. [Google Scholar] [CrossRef]
  26. Yañez Jaramillo, L.M.; De Klerk, A. Partial upgrading of bitumen by thermal conversion at 150–300 °C. Energy Fuels 2018, 32, 3299–3311. [Google Scholar] [CrossRef]
  27. Yañez Jaramillo, L.M.; De Klerk, A. Is solubility classification a meaningful measure in thermal conversion? Energy Fuels 2022, 36, 8649–8662. [Google Scholar] [CrossRef]
  28. Nascimento, P.T.H.; De Klerk, A. Effect of pressure on visbreaking product composition and properties. Energy Fuels 2024, 38, 12632–12644. [Google Scholar] [CrossRef]
  29. Jaffé, H.H.; Orchin, M. Theory and Applications of Ultraviolet Spectroscopy; John Wiley and Sons: New York, NY, USA, 1962; p. 253, LC: 62015181. [Google Scholar]
  30. Taylor, T.A.; Patterson, H.H. Excitation resolved synchronous fluorescence analysis of aromatic compounds and fuel oil. Anal. Chem. 1987, 59, 2180–2187. [Google Scholar] [CrossRef]
  31. Yan, Y.; Prado, G.H.C.; De Klerk, A. Storage stability of products from visbreaking of oilsands bitumen. Energy Fuels 2020, 34, 9585–9598. [Google Scholar] [CrossRef]
  32. Leprince, P. Visbreaking of residues. In Petroleum Refining. Vol. 3. Conversion Processes; Leprince, P., Ed.; Editions Technip: Paris, France, 2001; pp. 365–379. ISBN 2710807793. [Google Scholar]
  33. Raseev, S. Thermal and Catalytic Processes in Petroleum Refining; Marcel Dekker: New York, NY, USA, 2003. [Google Scholar] [CrossRef]
  34. Yañez Jaramillo, L.M.; Tannous, J.H.; De Klerk, A. Persistent free radicals in petroleum. Processes 2023, 11, 2067. [Google Scholar] [CrossRef]
  35. Wang, L.; Zachariah, A.; Yang, S.; Prasad, V.; De Klerk, A. Visbreaking oilsands-derived bitumen in the temperature range of 340–400 °C. Energy Fuels 2014, 28, 5014–5022. [Google Scholar] [CrossRef]
  36. Castillo, J.; De Klerk, A. Visbreaking of deasphalted oil from bitumen at 280–400 °C. Energy Fuels 2019, 33, 159–175. [Google Scholar] [CrossRef]
  37. Buckley, J.S. Predicting the onset of asphaltene precipitation from refractive index measurements. Energy Fuels 1999, 13, 328–332. [Google Scholar] [CrossRef]
  38. Jha, K.N.; Montgomery, D.S.; Strausz, O.P. Chemical composition of gases in Alberta bitumens and in low-temperature thermolysis of oil sand asphaltenes and maltenes. In Oil Sand and Oil Shale Chemistry; Strausz, O.P., Lown, E.M., Eds.; Verlag Chemie: New York, NY, USA, 1978; pp. 33–54. ISBN 0895731029. [Google Scholar]
  39. Singh, J.; Kumar, S.; Garg, M.O. Kinetic modelling of thermal cracking of petroleum residues: A critique. Fuel Process. Technol. 2012, 94, 131–144. [Google Scholar] [CrossRef]
  40. Kapadia, P.R.; Kallos, M.S.; Gates, I.D. A new kinetic model for pyrolysis of Athabasca bitumen. Can. J. Chem. Eng. 2013, 91, 889–901. [Google Scholar] [CrossRef]
  41. Cabrales-Navarro, F.A.; Pereira-Almao, P. Reactivity and comprehensive kinetic modeling of deasphalted vacuum residue thermal cracking. Energy Fuels 2017, 31, 4318–4332. [Google Scholar] [CrossRef]
  42. Handle, F.; Füssl, J.; Neudl, S.; Grossegger, D.; Eberhardsteiner, L.; Hofko, B.; Hospodka, M.; Blab, R.; Grothe, H. The bitumen microstructure: A fluorescent approach. Mater. Struct. 2016, 49, 167–180. [Google Scholar] [CrossRef]
  43. Yokota, T.; Striven, F.; Montgomery, D.S.; Strausz, O.P. Absorption and emission spectra of Athabasca asphaltene in the visible and near ultraviolet regions. Fuel 1985, 65, 1142–1149. [Google Scholar] [CrossRef]
  44. Aguilar, R.A.; Ancheyta, J. Modeling coil and soaker reactors for visbreaking. Ind. Eng. Chem. Res. 2016, 55, 912–924. [Google Scholar] [CrossRef]
  45. Guerra, A.; Symonds, R.; Bryson, S.; Kirney, C.; Di Bacco, B.; Macchi, A.; Hughes, R. Five-lump mild thermal cracking reaction model of crude oils and bitumen with VLE calculations. Ind. Eng. Chem. Res. 2019, 58, 16417–16430. [Google Scholar] [CrossRef]
  46. Alemán-Vázquez, L.O.; Torres-Mancera, P.; Ancheyta, J.; Ramírez-Salgado, J. Use of hydrogen donors for partial upgrading of heavy petroleum. Energy Fuels 2016, 30, 9050–9060. [Google Scholar] [CrossRef]
  47. Zachariah, A.; Wang, L.; Yang, S.; Prasad, V.; De Klerk, A. Suppression of coke formation during bitumen pyrolysis. Energy Fuels 2013, 27, 3061–3070. [Google Scholar] [CrossRef]
  48. Yokono, T.; Obara, T.; Sanada, Y.; Shimomura, S.; Imamura, T. Characterization of carbonization reaction of petroleum residues by means of high-temperature ESR and transferable hydrogen. Carbon 1986, 24, 29–32. [Google Scholar] [CrossRef]
  49. De Klerk, A. Thermal conversion modeling of visbreaking at temperatures below 400 °C. Energy Fuels 2020, 34, 15285–15298. [Google Scholar] [CrossRef]
  50. Poutsma, M.L. Atom-transfer and substitution reactions. In Free Radicals. Vol. II; Kochi, J.K., Ed.; Wiley-Interscience: New York, NY, USA, 1973; pp. 113–158. ISBN 9780471497028. [Google Scholar]
  51. Zhao, Y.; Gray, M.R.; Chung, K.H. Molar kinetics and selectivity in cracking of Athabasca asphaltenes. Energy Fuels 2001, 15, 751–755. [Google Scholar] [CrossRef]
  52. Yan, T.Y. Characterization of visbreaker feeds. Fuel 1990, 69, 1062–1064. [Google Scholar] [CrossRef]
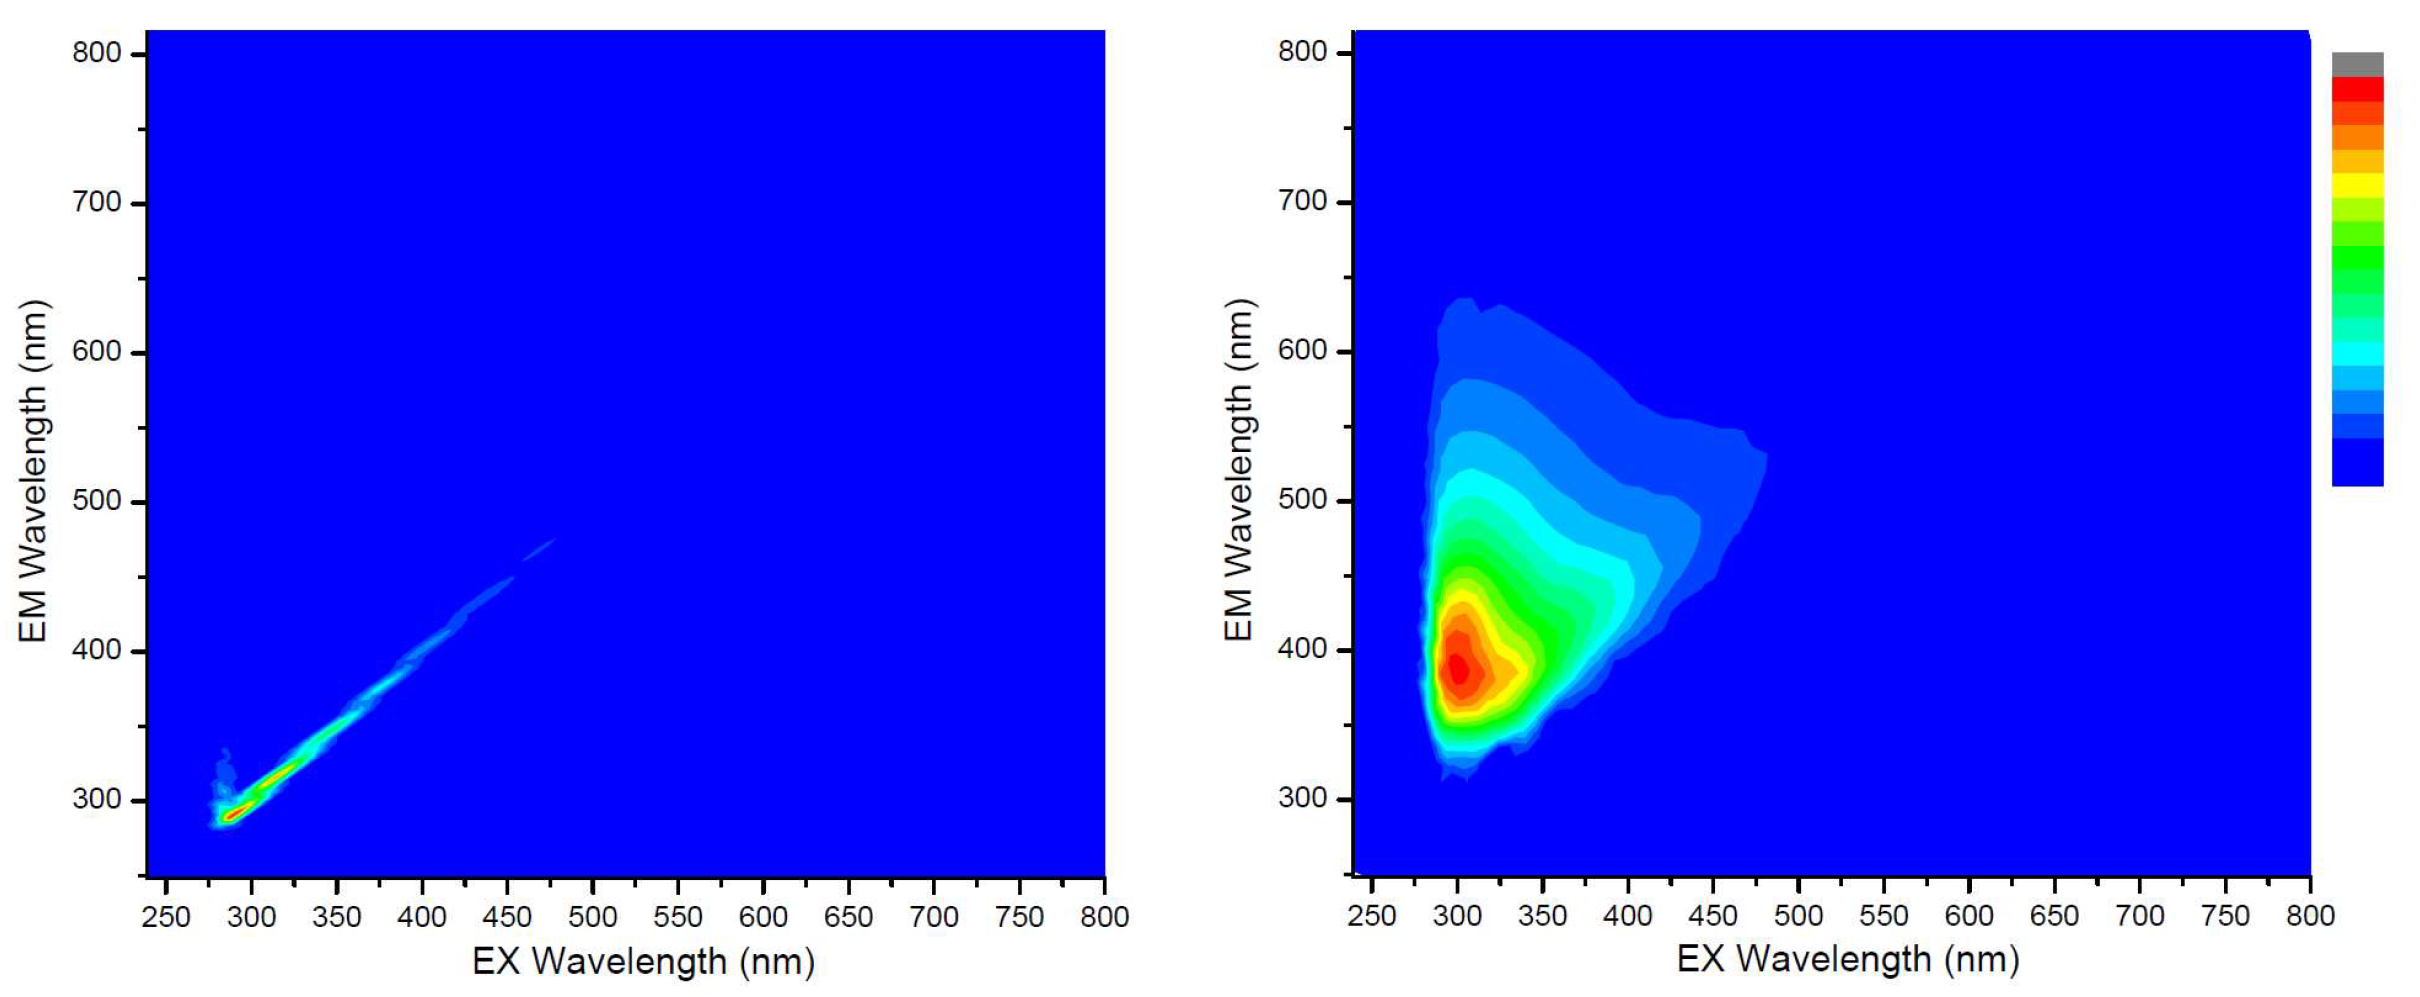
Figure 1. Contour plots of the fluorescent emission (EM) versus excitation (EX) wavelength for toluene on the (left) and thermally converted bitumen (380 °C, 5 min) dissolved in toluene on the (right). These examples are shown for illustrative purpose only.
Processes 13 02901 g001
Figure 2. Maximum fluorescent intensity values of products obtained from Cold Lake bitumen that were thermally converted at different temperatures and reaction times. Lines are only to improve readability and not to denote a trend.
Processes 13 02901 g002
Figure 3. Maximum fluorescent intensity of the products from thermal conversion of Cold Lake bitumen in relation to their 589 nm refractive index at 20 °C.
Processes 13 02901 g003
Figure 4. Comparison of 589 nm refractive index at 20 °C of fresh and aged samples. Extra samples are those for which refractive index were measured, but that were excluded from the fluorescence study.
Processes 13 02901 g004
Figure 5. Maximum fluorescent intensity values of products obtained from Athabasca bitumen and bitumen-derived materials that were thermally converted at 380 °C.
Processes 13 02901 g005
Figure 6. Maximum fluorescent intensity of the products from thermal conversion at 380 °C of Athabasca bitumen and bitumen-derived materials in relation to their 589 nm refractive index at 20 °C.
Processes 13 02901 g006
Figure 7. Fluorescence values at 389 nm of products obtained from Athabasca bitumen that were thermally converted at 400 °C.
Processes 13 02901 g007
Table 1. Characterization of Canadian oilsand bitumen feed materials.
PropertyOilsands Bitumen Characterization
Ref. [26]Ref. [27]Ref. [28]
region of originCold LakeAthabascaAthabasca
elemental analysis (wt%)
carbon82.6 ± 0.183.0 ± 0.183.4 ± 0.1
hydrogen10.3 ± 0.110.3 ± <0.110.4 ± 0.1
nitrogen0.6 ± 0.10.5 ± <0.10.5 ± <0.1
sulfur4.7 ± 0.15.3 ± 0.34.9 ± 0.1
asphaltene content (wt%)16.5 a11.5 b,c15.4 a,d
density (kg/m3)
20 °C1024.0 ± 1.21014.2 ± 2.11008.3 ± 1.8
40 °C1011.3 ± 1.41001.6 ± 2.2995.8 ± 1.7
dρ/dT (kg/m3.K)−0.629−0.643−0.626
refractive index at 598 nm
20 °C1.5844 ± 0.00081.5791 ± 0.00011.5748 ± 0.0002
40 °C1.5768 ± 0.00071.5716 ± 0.00021.5673 ± 0.0001
dn/dT (1/K)−3.80 × 10−4−3.74 × 10⁻⁴−3.76 × 10⁻⁴
viscosity (Pa.s)
20 °C1655 ± 22461 ± 26-
40 °C88 ± <0.1-36.3 ± 0.2
a Asphaltene fraction reported as n-pentane insoluble fraction. b Asphaltene fraction reported as n-heptane insoluble fraction. c Corrected value; details in cited reference. d This value was not reported as part of the cited study.
Table 2. Intensity of fluorescence peaks of 400 °C converted Athabasca bitumen obtained at different pressures and 340 nm excitation wavelength.
Pressure (MPa)Reaction Time (min)Fluorescence Intensity Per µg/g Sample Concentration
389 nm407 nm435 nm
Athabasca bitumen feed882767618
0.577407540543600
0.583743972896185
1.07412,38511,3889297
1.04510,62095057874
1.08514,62413,09110,593
1.574311129212443
1.570359833432741
1.568824277376695
2.062322129342425
2.061394836743101
2.080360732352637
2.090304726982199
2.575542449524063
2.572177316311333
2.570386636113051
3.072288526022087
3.075421338103089
3.059364333112674
4.083563849504152
4.083407035832924
4.082359032092558
Disclaimer/Publisher’s Note: The statements, opinions and data contained in all publications are solely those of the individual author(s) and contributor(s) and not of MDPI and/or the editor(s). MDPI and/or the editor(s) disclaim responsibility for any injury to people or property resulting from any ideas, methods, instructions or products referred to in the content.