Article

Effect of Acid Treatment on the Structure of Natural Zeolite from the Shankhanai Deposit

by
Sandugash Tanirbergenova
*,
Dildara Tugelbayeva
,
Nurzhamal Zhylybayeva
,
Aizat Aitugan
*,
Kairat Tazhu
,
Gulya Moldazhanova
and
Zulkhair Mansurov
The Institute of Combustion Problems, Almaty 050000, Kazakhstan
*
Authors to whom correspondence should be addressed.
Processes 2025, 13(9), 2896; https://doi.org/10.3390/pr13092896
Submission received: 5 August 2025 / Revised: 8 September 2025 / Accepted: 8 September 2025 / Published: 10 September 2025
(This article belongs to the Section Chemical Processes and Systems)

Abstract

Natural clinoptilolite from the Shankhanai deposit (Kazakhstan) was modified via acid and thermal treatments to improve its physicochemical and catalytic properties. The zeolite was activated using 10% nitric acid alone, nitric acid followed by thermal treatment (600 °C), and a mixed acid solution (10% HNO3 + 5% CH3COOH) followed by mild thermal treatment (280 °C). Structural, textural, and thermal changes were characterized by XRD, FTIR, BET, TGA, SEM, and EDX. Nitric acid treatment increased the BET surface area from 4.95 to 59.9 m2/g but reduced crystallinity, whereas the dual-acid approach enhanced porosity and acidity while preserving framework integrity. Preliminary catalytic testing in thiophene hydrodesulfurization (HDS) revealed improved conversion (up to 20.7%) in the absence of active metals, confirming the potential of modified clinoptilolite as a catalyst support. The dual-acid method presents a promising, eco-friendly pathway for producing thermally stable and catalytically active zeolitic materials, suitable for selective hydrodesulfurization of thiophene.

Graphical Abstract

1. Introduction

Sulfur-containing compounds in petroleum fractions, such as thiophene and its derivatives, present significant environmental and technological challenges. Upon combustion, they form sulfur oxides (SOx), which contribute to acid rain and air pollution. Additionally, sulfur deactivates catalysts in downstream refining and deteriorates fuel quality. Therefore, the development of efficient hydrodesulfurization (HDS) technologies remains a priority in petroleum refining, driven by stringent international regulations, including the EU Directive 2009/30/EC (≤10 ppm sulfur in fuels) and IMO 2020 (≤0.5% sulfur in marine fuels) [1,2]. Among sulfur heterocycles, thiophene is particularly resistant to conventional HDS due to its chemical stability, necessitating advanced catalytic systems capable of operating under mild conditions. Catalyst supports play a critical role in such systems by affecting the dispersion, stability, and activity of the active phase. Various materials have been explored as HDS supports, including γ-Al2O3, SiO2, TiO2, activated carbons, and zeolites, which have gained significant attention due to their tunable porosity and acidity [3,4,5,6,7,8]. Recently, natural zeolites have gained increasing attention owing to their unique structural and surface properties—high surface area, tunable acidity, ion-exchange capacity, and thermal stability. In contrast to synthetic materials, they are also cost-effective and readily available, especially in regions with natural deposits.
Zeolites are natural or synthetic crystalline aluminosilicates with a microporous structure. Their framework consists of TO4 tetrahedra (where T = Si or Al) linked into a three-dimensional network. These materials possess ion-exchange, adsorption, and catalytic properties. They also exhibit high thermal and chemical stability. These characteristics make zeolites promising for use in petrochemistry, environmental engineering, and clean fuel production [9,10]. One of the main natural zeolite deposits in Central Asia is the Shankhanai deposit, located in the Kerbulak district of Almaty region, Kazakhstan. Its reserves are estimated at 4.3 million tons. The dominant zeolite phase in this deposit is heulandite–clinoptilolite. It has a monoclinic structure (a = 17.64 Å; b = 17.88 Å; c = 7.40 Å; β = 116.30°) and the chemical formula [KNa2Ca2(Si29Al7)O72·32H2O]. The main difference between heulandite and clinoptilolite is the Si/Al ratio. For heulandite, it is around 2.9–3.0, while for clinoptilolite, it is 5.0 or higher [11,12].
Clinoptilolite is the main zeolite in this deposit. It is an aluminosilicate matrix with well-developed microporosity (BET surface area ~5 m2/g, DR micropore area ~6 m2/g). It can selectively adsorb molecules and participate in ion exchange due to its well-defined pore architecture, including eight-membered rings. Its natural analogs, such as faujasite, mordenite, and synthetic HZSM-5, are widely used as catalysts. These catalysts are applied in cracking, isomerization, alkylation, alcohol dehydration, and hydrocracking of hydrocarbons [13,14]. However, natural zeolites, including clinoptilolite, have limited catalytic activity due to their relatively low acidity and small pore size. Acid modification can improve their catalytic performance. During acid treatment, aluminum can be partially removed from the framework (dealumination), which increases the Si/Al ratio. In addition, acid leaching may remove exchangeable species and amorphous silica impurities, leading to enhanced porosity and surface area [15,16,17]. However, this process also generates framework defects and partially detached aluminum species (Lewis acid sites), which can influence stability and reactivity. Thus, although the overall zeolite structure is largely preserved, some degree of framework distortion occurs [18].
Acid treatment is a simple and scalable method to improve the textural and catalytic properties of zeolites. It promotes the formation of mesopores and macropores, improving diffusion and access to active sites [19]. Acid treatment also increases surface acidity, including the formation of Brønsted and Lewis acid sites, confirmed by pyridine-FTIR and NH3-TPD methods [20]. Zeolites from the Shankhanai deposit are of special interest due to their eight-membered ring architecture and high Si/Al ratio, which provide thermal stability and surface acidity. To enhance the sorption and catalytic properties of natural zeolites, acid activation is commonly used. This method removes exchangeable cations (Na+, K+, Ca2+) and partially leaches aluminum from the framework. As a result, acid sites are formed and porosity is increased [21].
Comparative analysis of acids shows that hydrochloric acid (HCl) effectively removes cations and partially desilicates the framework, increasing surface area, although high concentrations may induce partial amorphization [22,23]. Sulfuric acid (H2SO4) may cause sulfate precipitation that blocks pores and reduces access to active sites. Acetic acid (CH3COOH) allows gentle modification without destroying the structure but does not significantly enhance acidity or porosity. Nitric acid with strong oxidizing and protolytic properties, efficiently removes cations and promotes formation of both Brønsted and Lewis acid sites [24,25].
Clinoptilolite from the Shankhanai deposit has high thermal stability, maintaining its structure up to ~500 °C. It also shows good mechanical strength and acid resistance in granulated form, making it suitable for gas purification and low-carbon technologies. Due to its well-defined pore architecture, clinoptilolite can exhibit molecular sieving effects in gas separation processes, in addition to its inherent ion-exchange properties [26]. It is resistant to catalyst poisons and can be regenerated during use, making it a low-cost and accessible natural catalyst for eco-friendly hydrocarbon processing [27,28]. Thermal post-treatment was used to increase the stability and porosity of the acid-treated zeolite. This step removed residual moisture and improved structural order, preventing further degradation of the framework. The use of argon ensures the absence of oxidative processes during heating. Such thermal stabilization is known to promote the development of mesoporosity and improve the availability of active sites in modified clinoptilolite [29]. Previous studies have shown that clinoptilolite remains thermally stable up to ~800 °C, although framework dehydroxylation and partial loss of adsorption capacity can occur above ~600 °C [30,31]. Zeolites from the Shankhanai deposit are of particular interest due to their eight-membered ring channels, high Si/Al ratio, and associated thermal stability and surface acidity [32,33]. However, despite these promising features, natural zeolites from this deposit remain poorly studied, particularly with respect to their acid modification and the resulting changes in microporosity and acidity [34,35,36]. While acid treatment of natural zeolites has been widely investigated for other deposits worldwide, no systematic study has yet addressed the structural evolution of Shankhanai zeolite under acid activation. The present work fills this gap by providing a comprehensive characterization of the phase, textural, and catalytic properties of acid-activated Shankhanai zeolite.
This study focuses on a natural zeolite from the Shankhanai deposit, Kazakhstan, which represents a locally sourced, abundant, and underutilized resource. The goal is to evaluate the effect of acid treatment on the crystalline structure, as well as the textural and acidic properties. The following techniques were used: FTIR, XRD, SEM, BET, NH3-TPD, and pyridine-FTIR. This analysis helps identify new aspects of zeolite activity as a catalyst support for thiophene hydrodesulfurization and demonstrates the scientific novelty of the research. To the best of our knowledge, dual-acid activation of clinoptilolite has not been reported in the literature, highlighting the novelty of the present study.

2. Materials and Methods

2.1. Acid Activation of Natural Zeolite

Natural zeolite (clinoptilolite) from the Shankhanai deposit (Taza Su, Almaty, Kazakhstan) was subjected to acid activation using two different treatments. In the first case, 400 g of the ground zeolite was treated with 600 mL of 10 wt.% nitric acid (chemically pure, GOST 4461-77, manufacturer JSC Lenreaktiv, Saint Petersburg, Russian Federation) solution; in the second case, 400 g of zeolite was treated with 700 mL of 10 wt.% nitric acid combined with thermal treatment; and in the third case, a mixed solution of 600 mL of 10 wt.% HNO3 and 200 mL of 5 wt.% acetic acid (70%, manufacturer JSC Base of Chemical Reactants, Saint Petersburg, Russian Federation) was used.
The acid treatments were carried out in round-bottom flasks under continuous stirring using a magnetic stirrer C-Mag HS (IKA, Königswinter, Germany) at 400 rpm. The suspensions were maintained at elevated temperatures close to reflux (~100 °C for 10 wt.% HNO3 and 101–105 °C for the mixed-acid solution), but without reaching full boiling, therefore a condenser was not required. The activation time in both cases was 1 h. The acid concentrations and treatment times were selected based on preliminary experiments, as discussed in the Results and Discussion Section 3, and all concentrations are expressed in wt.%.
After the reaction, the zeolite solution was cooled and filtered. The solid phase was washed repeatedly with deionized water until a neutral pH (6–7) was reached, measured using a calibrated pH meter ITAN (LLC “NPP Tomanalit”, Tomsk, Russian Federation). The washed zeolite was then dried at 120 °C for 24 h in a convection oven, where the material was evenly distributed in a thin layer to ensure complete removal of moisture.

2.2. Thermal Treatment of Activated Zeolite

Thermal treatment was performed after acid activation to enable further investigation of structural modifications. The zeolite activated with 10% nitric acid was subjected to thermal treatment at 600 °C for 1 h in an argon atmosphere (inert gas environment) using a tubular furnace (Nabertherm, Lilienthal, Germany). In the second case, the zeolite activated with a mixed solution of 10% nitric acid and 5% acetic acid (CH3COOH) was also heated to 600 °C for 1 h under argon (Kazstandard, Karaganda, Kazakhstan), followed by controlled cooling. During the cooling stage, when the furnace temperature reached 280 °C, the sample was additionally held for 15 min in an argon atmosphere before being cooled to room temperature. This additional step was introduced to promote controlled removal of volatile residues while preserving framework stability and to enhance the development of porosity. The heating rate in both cases was controlled at 10 °C/min. After thermal treatment, the samples were allowed to cool to room temperature under argon flow and stored in sealed containers for further analysis. The zeolite samples were then labeled as follows: Natural Zeolite (NZ), 10% nitric acid-treated zeolite (Z–HNO3), 10% nitric acid and thermal treatment (Z–HNO3-600), treated with mix solution of 10% nitric acid and 5% acetic acid zeolite (Z–MIX280).

2.3. Characterization Techniques

Fourier Transform Infrared Spectroscopy (FTIR): Infrared spectra were recorded using a Bruker ALPHA II FTIR spectrometer in the range of 500–4000 cm−1. Samples were prepared by mixing 1 mg of zeolite with 200 mg KBr and pressing under vacuum, ensuring homogeneous, artifact-free FTIR spectra. The characteristic absorption bands were analyzed to monitor structural changes in the zeolite framework.
X-ray Diffraction (XRD): X-ray diffraction patterns were obtained using a DW-XRD-27MINI diffractometer with CuKα radiation (λ = 1.5418 Å), operating in Bragg–Brentano (θ–2θ) geometry. The current and voltage of the X-ray tube were set at 30 mA and 40 kV, respectively. Samples were ground, pressed into holders, and measured with continuous rotation at 60 rpm. Phase identification was performed using the Bruker DIFFRAC.EVA software (version 5.1, Bruker AXS, Karlsruhe, Germany) with the ICDD PDF-4+ database, based on comparison of experimental d-values with reference data. Semi-quantitative phase composition was evaluated using the semi-quantitative analysis (SQA) module of Bruker EVA, which applies the Reference Intensity Ratio (RIR) method to approximate relative phase abundances. The estimated uncertainty of phase quantification is ±3 wt.%.
Elemental composition and surface morphology of the zeolite samples were examined using a Phenom ProX SEM (Thermo Fisher Scientific, Waltham, MA, USA) equipped with an EDX detector. Prior to SEM analysis, all zeolite samples were ground in an agate mortar to ensure comparable particle size reduction and to minimize preparation-induced differences. The powders were then mounted on carbon tape using both dry deposition and suspension methods. Measurements were conducted under vacuum in backscattered electron mode.
Nitrogen adsorption–desorption isotherms were obtained using a BSD-660S A3 Physical Adsorption Analyzer (BSD INSTRUMENT, Beijing, China) at 77.3 K, employing high-purity nitrogen as the adsorbate. Prior to measurements, samples were degassed in situ under vacuum at 300 °C for 180 min to eliminate moisture and volatile impurities. The specific surface area was calculated using the Brunauer–Emmett–Teller (BET) method within the relative pressure (P/P0) range of 0.03–0.25. Pore volume and pore size distribution were derived from the desorption branch using the Barrett–Joyner–Halenda (BJH) method. Micropore characteristics were additionally analyzed using the Dubinin–Radushkevich (DR), Dubinin–Astakhov (DA), and t-plot methods. All measurements and data processing were carried out using the instrument’s proprietary analysis software, EVA, version 4.2.
Thermal behavior and stability of the natural and acid-treated zeolite samples were analyzed using a TGA/DSC instrument (Mettler Toledo, Switzerland). Approximately 10–15 mg of each powdered sample was placed in an open alumina crucible and subjected to heating from room temperature to 900 °C at a constant heating rate of 10 °C/min under a nitrogen atmosphere (flow rate ~50 mL/min). The TGA curves were used to evaluate mass loss associated with the desorption of physically adsorbed water, removal of surface groups, and potential framework degradation. Simultaneously recorded DSC curves provided insights into endothermic and exothermic events related to structural transformations and decomposition processes.

2.4. Catalytic Activity

The catalytic activity of natural zeolite was tested in thiophene hydrodesulfurization in a n-heptane stream as a model reaction in the fixed-bed stainless steel reactor under hydrogen flow at 180–380 °C and 0.1–3.0 MPa. The modified zeolite (14 mL, particle size 0.63–1 mm) was pre-reduced in hydrogen and then contacted with a model feedstock. The thiophene feed rate was 9 mL/min, hydrogen flow rate was 3 mL/min, and the reaction was carried out for 25 min. The system included a condenser and two-stage gas–liquid separation for product collection. Reaction products were analyzed by gas chromatography to evaluate sulfur removal efficiency.

3. Results

3.1. Selection of Acid Concentrations and Thermal Treatment Conditions

The acid concentrations used in this study were selected based on preliminary experiments. It was observed that increasing the HNO3 concentration above 10 wt.% (15–20 wt.%) did not lead to significant improvement in the removal of exchangeable cations compared to 10 wt.% HNO3, while lower concentrations resulted in insufficient activation. For the mixed-acid treatment, the addition of 5 wt.% CH3COOH to 10 wt.% HNO3 provided the best balance between ion exchange efficiency and structural preservation. Lower CH3COOH concentrations (<5 wt.%) produced only a weak synergistic effect, whereas higher concentrations (>5 wt.%) caused partial loss of crystallinity and, in some cases, formation of amorphous deposits that blocked pores. Therefore, the conditions of 10 wt.% HNO3 and 10 wt.% HNO3 + 5 wt.% CH3COOH were considered optimal and applied for further investigation. In both treatments, the activation was carried out at the respective boiling temperatures of the acid solutions (~100 °C for 10 wt.% HNO3 and 101–102 °C for 10 wt.% HNO3 + 5 wt.% CH3COOH) under reflux. Performing the process at boiling provides a stable and reproducible thermal environment that promotes efficient ion exchange and removal of exchangeable cations, while avoiding overheating and preserving the crystalline structure of the zeolite. The schematic of the acid activation process is shown in Figure 1, where a portion of the exchangeable cations (Na+, K+, Ca2+) and pore water is removed, while the Si–O–Al tetrahedral framework largely remains intact.
In preliminary trials, thermal treatment of HNO3-activated zeolite was tested across 500–700 °C. Conditions below 550 °C did not fully eliminate nitrate residues, while treatments above 650–700 °C initiated partial collapse of the framework and a reduction in crystallinity. Therefore, 600 °C was selected as the optimal compromise, consistent with TGA/DSC findings and literature data confirming clinoptilolite stability up to ~800 °C.

3.1.1. X-Ray Diffraction (XRD)

The XRD patterns of the natural and acid-modified zeolite samples revealed significant differences in crystallinity.
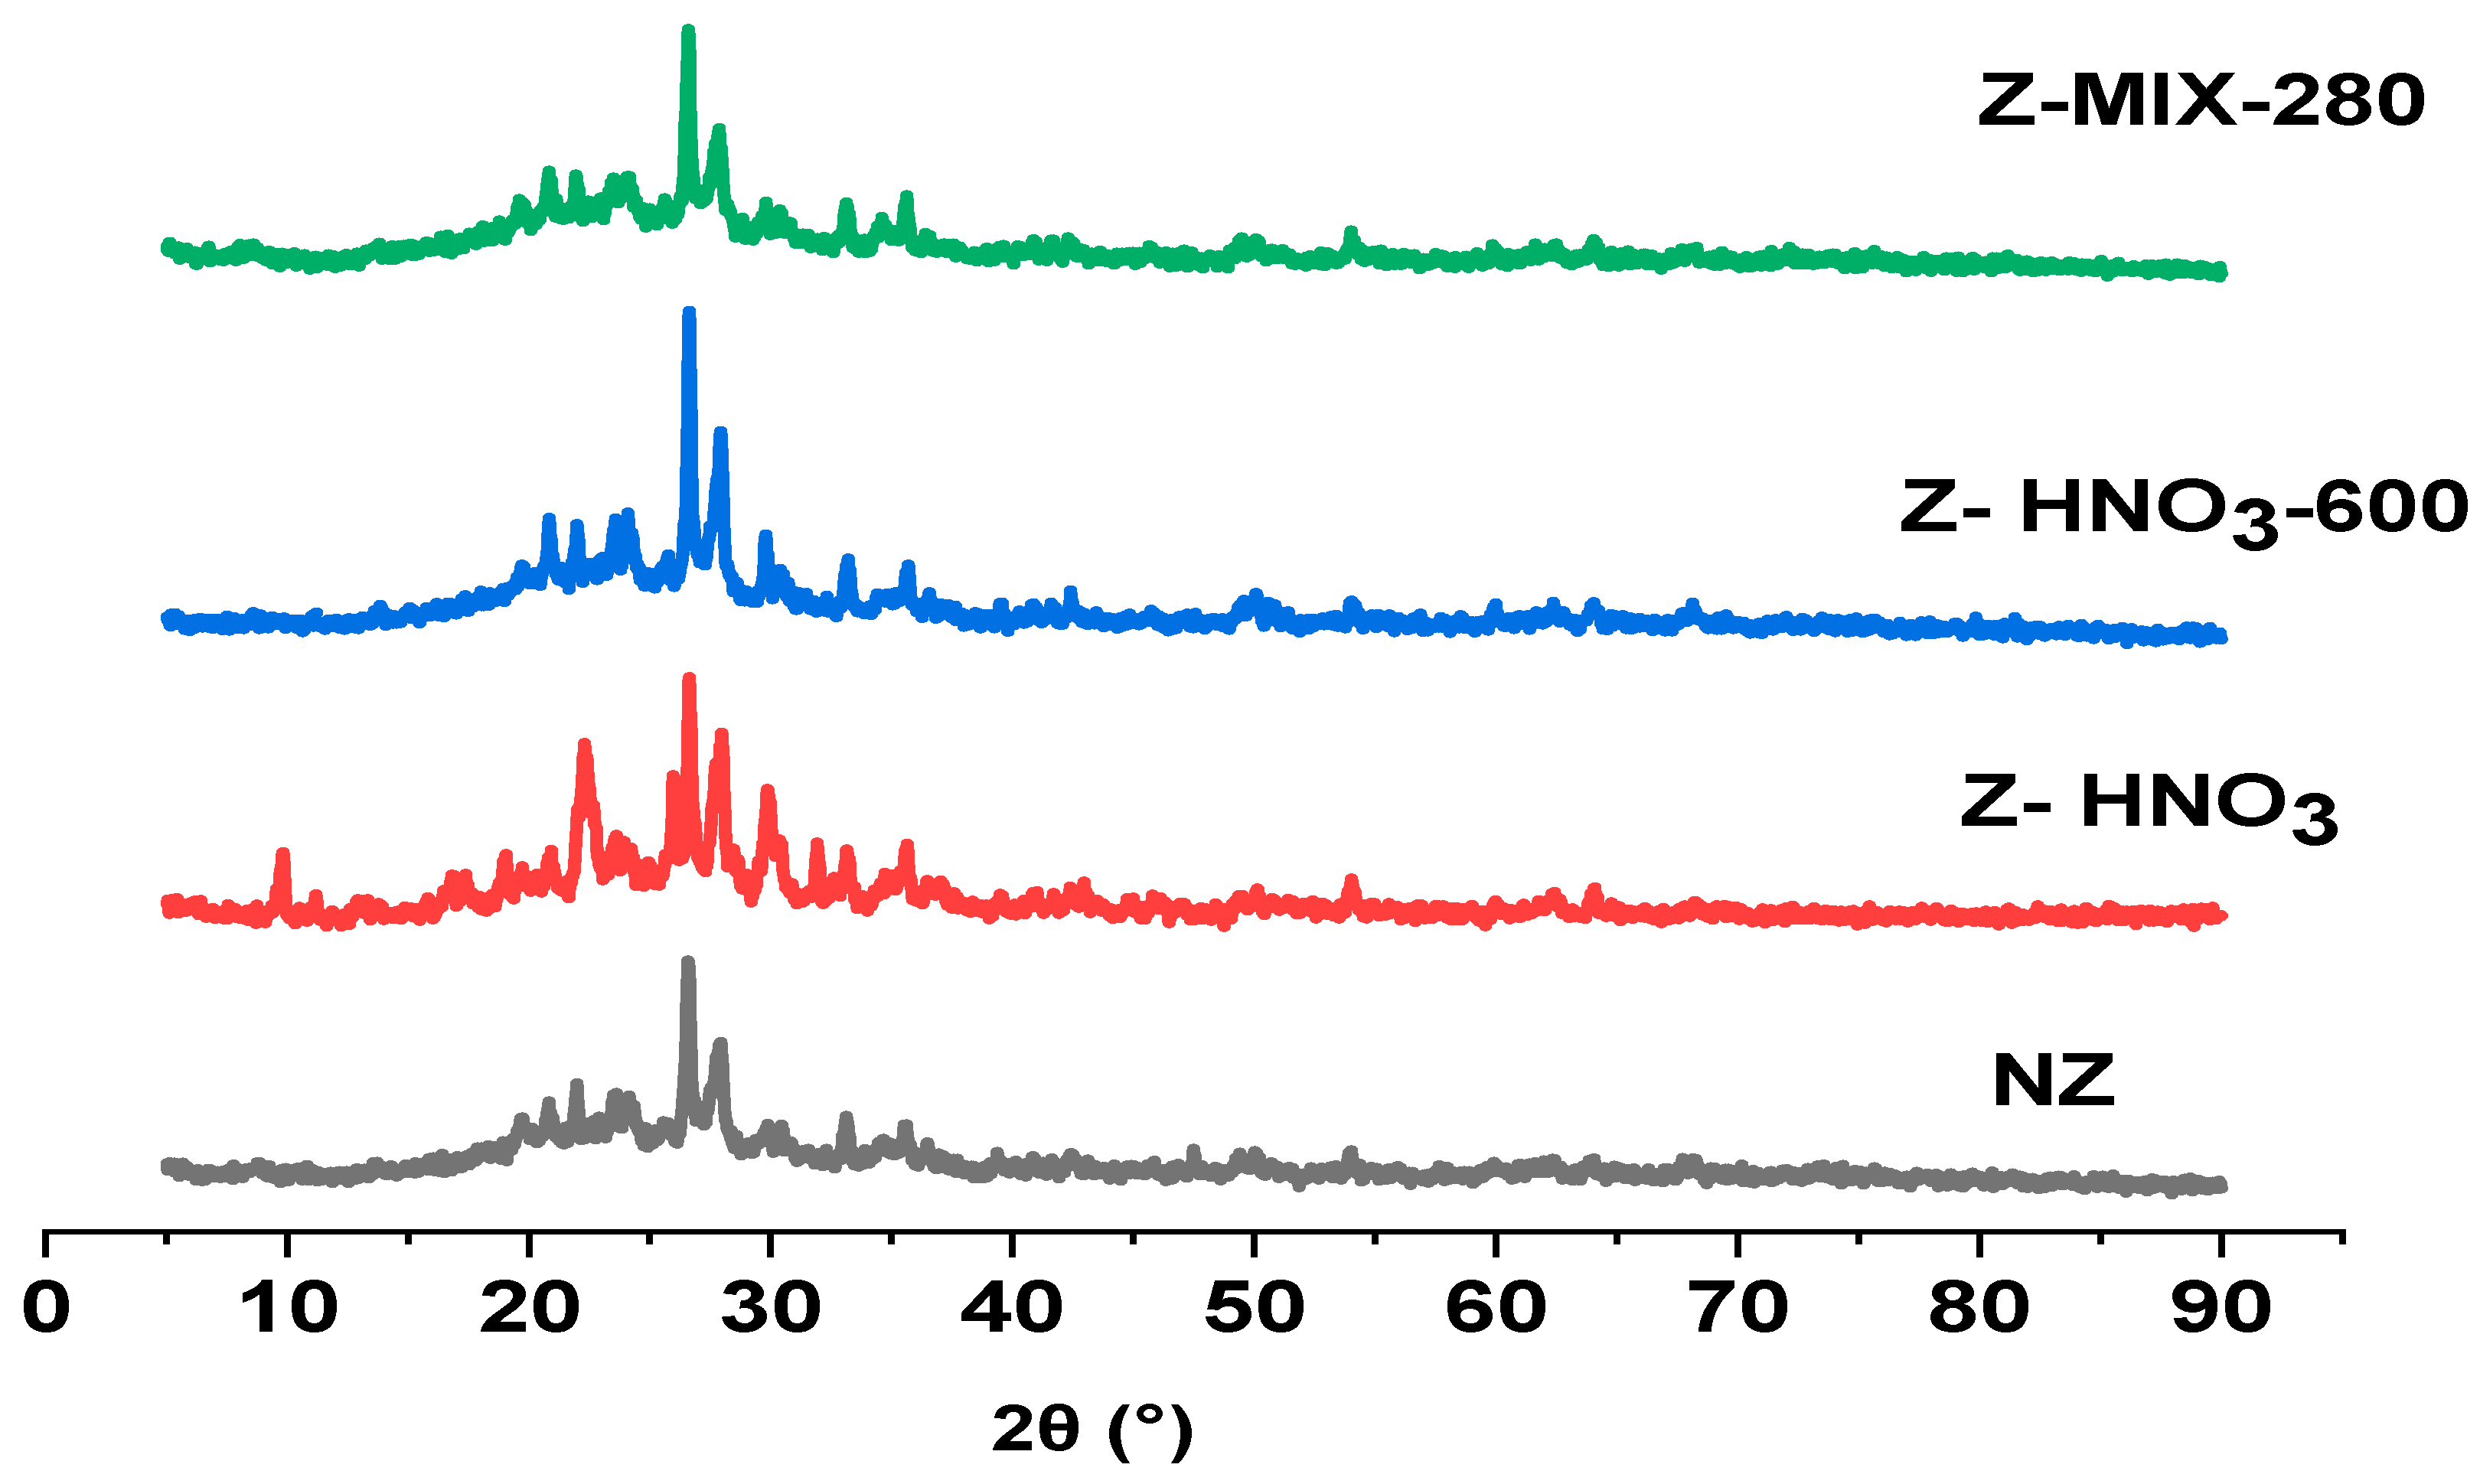
The XRD pattern of the natural zeolite (NZ) in Figure 2 confirms clinoptilolite as the dominant crystalline phase, with sharp peaks between 19° and 50° 2θ. The most intense reflection at 2θ = 26.59° corresponds to a d-spacing of 3.34 Å, indicating high crystallinity and preferred orientation. Other peaks at 2θ = 19.7°, 21.96°, 23.55°, 24.11°, 27.90°, and 29.82° correspond to d-spacings of 4.49, 4.04, 3.77, 3.68, 3.19, and 3.00 Å, respectively, in agreement with JCPDS PDF #39-1383. Less intensive peaks suggest the presence of non-zeolitic phases; all crystalline phases were identified by comparison of d-values with the ICDD PDF-4+ database, confirming clinoptilolite (ICDD 00-034-1381) as the dominant phase in all samples. Semi-quantitative phase composition indicates albite (35.8%), quartz (23.9%), potassium feldspar (19.1%), iron-rich silicate (15.6%), and hematite (5.6%), confirming a feldspar- and quartz-containing natural tuff matrix (Table 1).
After treatment with 10% nitric acid (Z–HNO3), the XRD pattern shows structural transformation, with heulandite emerging as the main phase. The most intense peak at 2θ = 26.63° corresponds to a d-spacing of 3.34 Å, with additional reflections at 23.60°, 25.98°, 27.75°, 29.89°, and 33.15°, corresponding to d-spacings of 3.77, 3.42, 3.21, 2.99, and 2.69 Å. Broadened peaks at low angles (9.79°, 11.18°, 12.98°) and a weak amorphous halo indicate partial dealumination and framework degradation. Phase analysis reveals heulandite (43%), quartz (20%), albite (14%), boron-containing impurity (16%), and hematite (6%) (Table 1). While nitric acid enhances surface acidity by removing non-zeolitic phases, its aggressive action compromises crystallinity. Therefore, a milder activation strategy is considered. Acid treatment with HNO3 resulted in partial dealumination of the clinoptilolite structure, accompanied by an increase in the Si/Al ratio. This process promotes the formation of secondary silica and aluminosilicate phases, explaining the appearance of a new phase in the activated samples.
The XRD pattern of the zeolite sample treated with 10% nitric acid and subsequently thermally activated at 600 °C (Z–HNO3-600), in argon reveals enhanced crystallinity compared to the sample treated with acid alone. The most intense peak at 2θ = 26.62° corresponds to a d-spacing of 3.34 Å, with additional reflections at 23.57°, 24.10°, 27.91°, 29.81°, and 33.17° corresponding to d-spacings of 3.78, 3.69, 3.19, 2.99, and 2.70 Å. Sharper peaks and a reduced amorphous background suggest improved structural order. Broader low-angle reflections (13.86°, 19.72°) indicate partial dealumination with residual channel ordering. Semi-quantitative phase composition indicates dominating by albite (48%), quartz (22%), potassium feldspar (24%), Na-rich feldspar (18%), and hematite (6%) (Table 1). Despite some framework modification, the crystalline phases remain well-defined, confirming that thermal post-treatment acts as a stabilizing step, enhancing porosity and structural retention following acid exposure. Combined treatment with 10% nitric acid and 5% acetic acid, followed by mild thermal activation at 280 °C for 15 min (Z–MIX-280), preserves the clinoptilolite framework. The strongest peak at 2θ = 26.57° corresponds to a d-spacing of 3.35 Å, and other reflections at 19.77°, 21.97°, 23.50°, 24.09°, 27.85°, 29.81°, and 33.12° correspond to d-spacings of 4.49, 4.05, 3.78, 3.68, 3.20, 2.99, and 2.70 Å, with no amorphous background. The gentler acid environment, due to acetic acid buffering, minimizes dealumination while enhancing acidity. Phase composition indicates albite (53%), K-feldspar (23%), iron-rich silicate (11%), quartz (9%), and hematite (4%) [(Table 1)], which collectively influence the overall crystallinity and stability of the zeolite framework. Albite and K-feldspar contribute to high crystallinity and structural stability, while iron-rich silicate slightly reduces ideal order. Quartz enhances thermal stability, and hematite has minor local effects on framework ordering. This dual-acid, low-temperature strategy maintains crystallinity while introducing acid sites, making it suitable for catalytic applications.
The diffraction patterns of NZ, Z–HNO3, Z–HNO3-600, and Z–MIX-280 were compared with the standard clinoptilolite reference (JCPDS #39-1383). The main characteristic peaks of clinoptilolite were preserved in all cases, particularly the strong reflections at ~22.4°, 26.6°, and 27.9°, confirming that the zeolitic framework was not destroyed by acid or thermal treatments (Table 2). After HNO3 treatment, an increase in relative intensity of the 22.4° and 27.9° peaks was observed, suggesting improved ordering and removal of exchangeable cations. The Z–HNO3-600 sample showed a moderate reduction in the intensities of 19.7° and 22.4°, which can be attributed to partial dealumination, while still maintaining all characteristic reflections of clinoptilolite. The mixed-acid-treated zeolite (Z–MIX-280) exhibited similar diffraction features to NZ, but with slight sharpening of the 26.6° and 29.8° peaks, indicating a balance between ion exchange and structural preservation. Importantly, no secondary phases (e.g., amorphous silica or alumina) were detected, confirming the retention of crystallinity in all modified samples.
In summary, XRD analysis demonstrates that acid and thermal treatments significantly influence the phase composition and crystallinity of natural clinoptilolite-based zeolite. Strong acid treatment with HNO3 leads to partial framework degradation and phase transformation toward heulandite, while thermal post-treatment helps restore order and stabilize the structure. The combined use of nitric and acetic acids, followed by mild thermal activation, effectively preserves the clinoptilolite framework, indicating a balanced approach to modifying acidity without compromising crystallinity. Following the structural insights obtained from XRD analysis, which highlighted changes in crystallinity and phase composition upon acid and thermal treatments, further investigation was conducted using Fourier-transform infrared (FTIR) spectroscopy.

3.1.2. FTIR Analysis

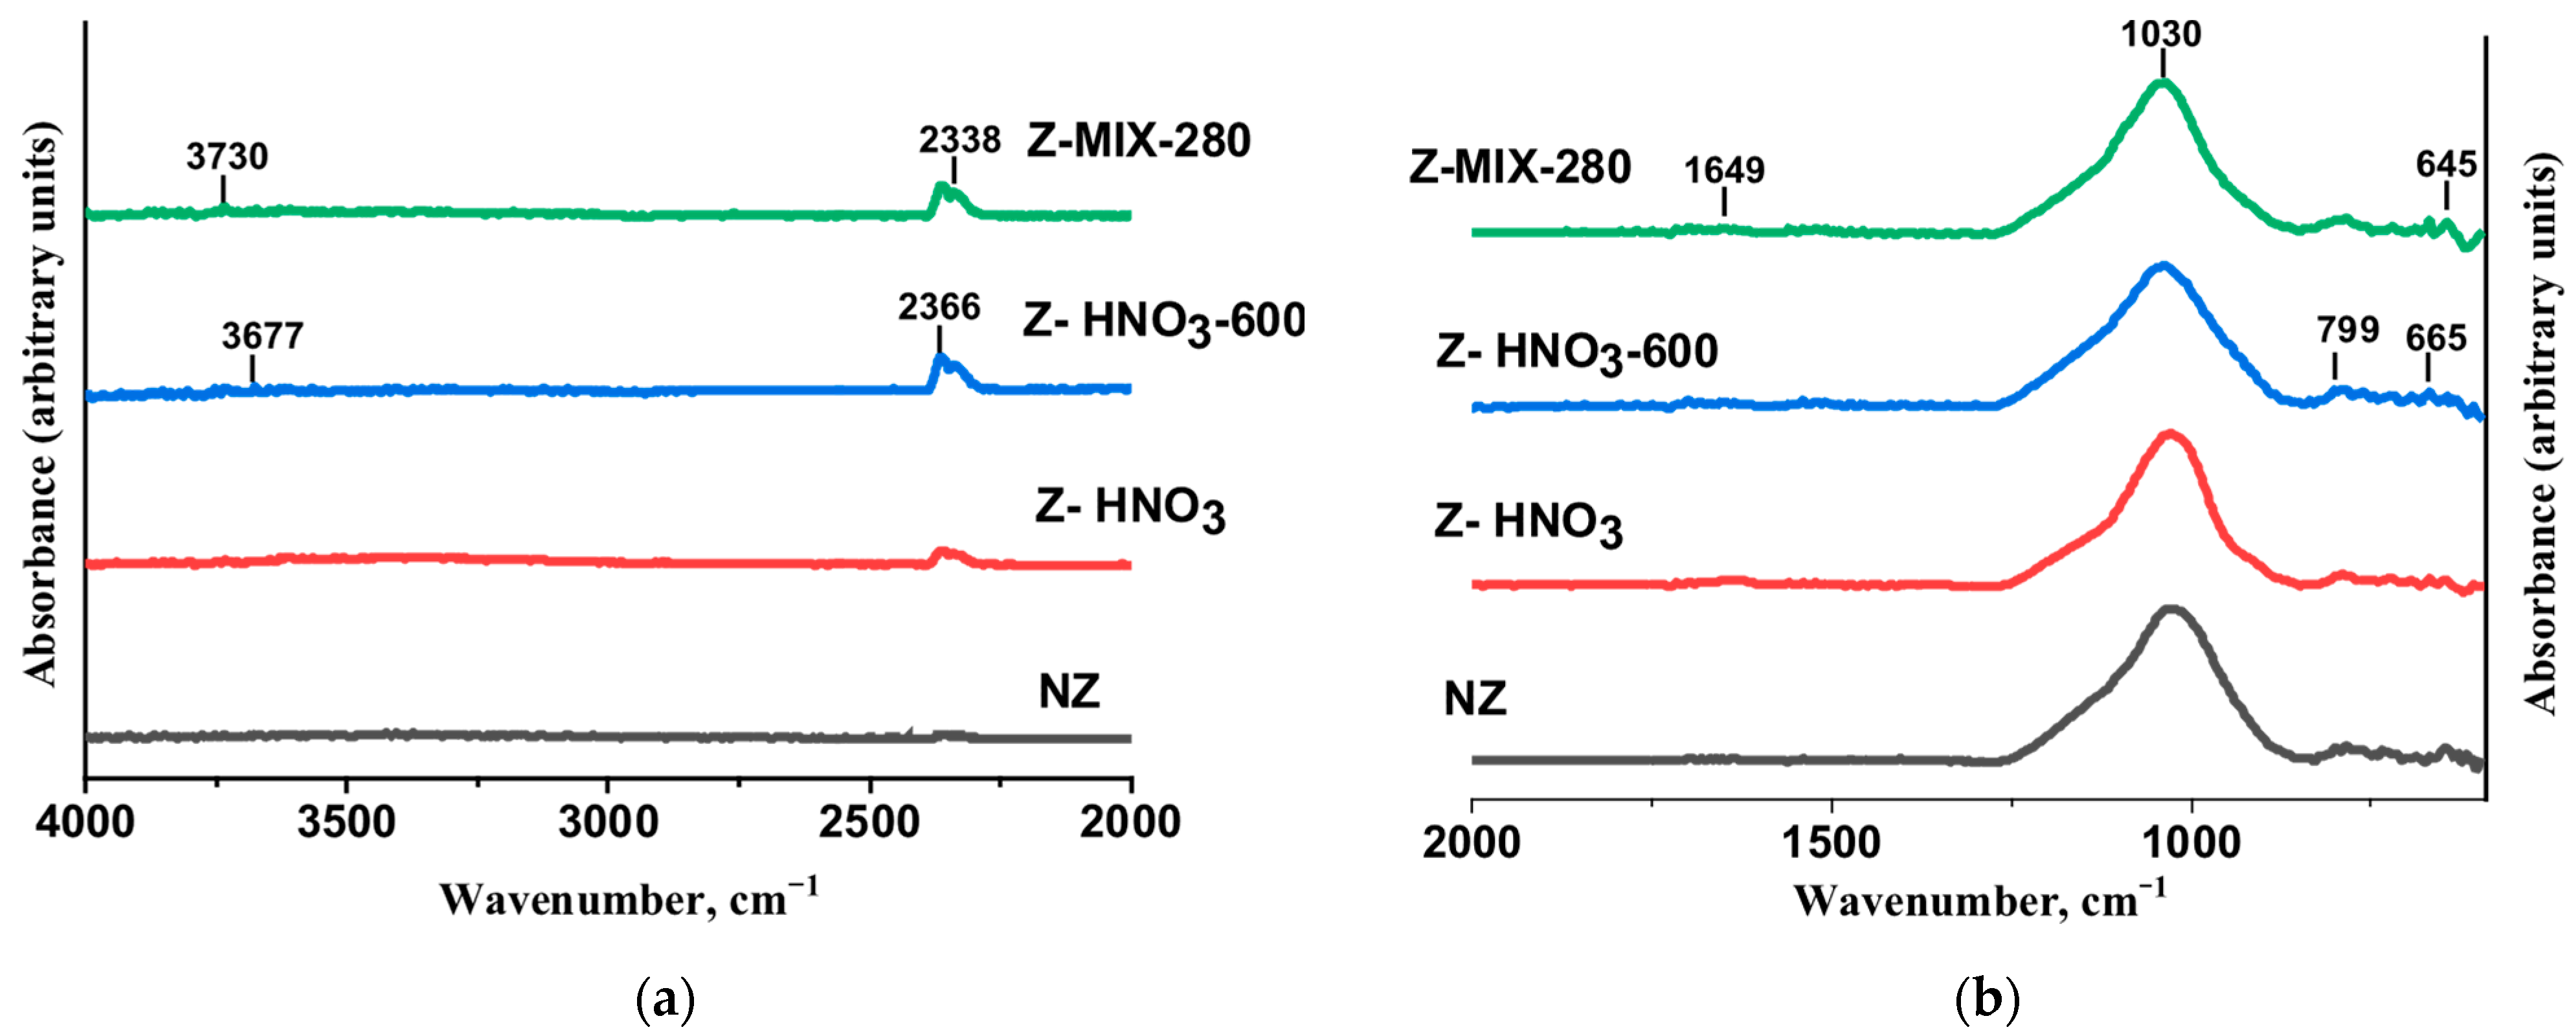
FTIR spectra of the natural and modified zeolite samples (Figure 3) were recorded in two regions: (a) 2000–4500 cm−1 and (b) 500–2000 cm−1 to provide a complete overview of structural and surface functional groups.
For the natural zeolite (NZ), characteristic bands are observed at ~1030 cm−1 and 799–787 cm−1 (Figure 3b), corresponding to the asymmetric stretching vibrations of Si–O–Si and/or Si–O–Al linkages and the symmetric stretching of internal tetrahedral units, respectively. Additional bands in the 600–650 cm−1 region (645, 633, 616 cm−1) are attributed to framework bending vibrations, typical for clinoptilolite. The broad absorption between 3800 and 3300 cm−1 (Figure 3a) is associated with O–H stretching vibrations of adsorbed water and structural hydroxyl groups. Upon treatment with nitric acid (Z–HNO3), a notable band at ~1649 cm−1 emerges, corresponding to the bending vibration of water molecules, indicating increased hydrophilicity due to dealumination and the formation of new Brønsted acid sites. Slight shifts in the Si–O–T (T = Si, Al) vibrations also suggest partial framework disturbance. Weak and broad signals in the 2400–2300 cm−1 region are assigned to atmospheric CO2 background and are not considered intrinsic to the zeolite structure. Further thermal treatment of the nitric acid-modified zeolite at 600 °C (Z–HNO3-600) results in a reduction in the intensity of the 1640 cm−1 band and a sharpening of the 1030 cm−1 feature. These changes indicate removal of physisorbed water and improved stabilization of acid-modified sites. Thermal activation thus aids in cleaning the pore structure and enhances thermal resistance, making the material more suitable for catalytic applications.
The zeolite treated with a mixture of acetic and nitric acids followed by thermal treatment (Z–MIX-280) exhibits features of both acid modification and thermal stabilization. In particular, the Si–O–T stretching band at ~1032 cm−1 remains strong and well defined, indicating preservation of the zeolite framework. The dual-acid treatment results in a higher density of acidic sites while maintaining structural integrity compared to nitric acid treatment. Summary of the main FTIR bands, their assignments, and occurrence across the samples is provided in Table 3.
Overall, the FTIR analysis confirms that nitric acid increases surface acidity but may compromise structural stability, while subsequent thermal treatment and mixed acid approaches enhance acid site density and preserve the zeolite framework—key requirements for catalytic applications.

3.1.3. N2 Adsorption–Desorption Isotherms (BET)

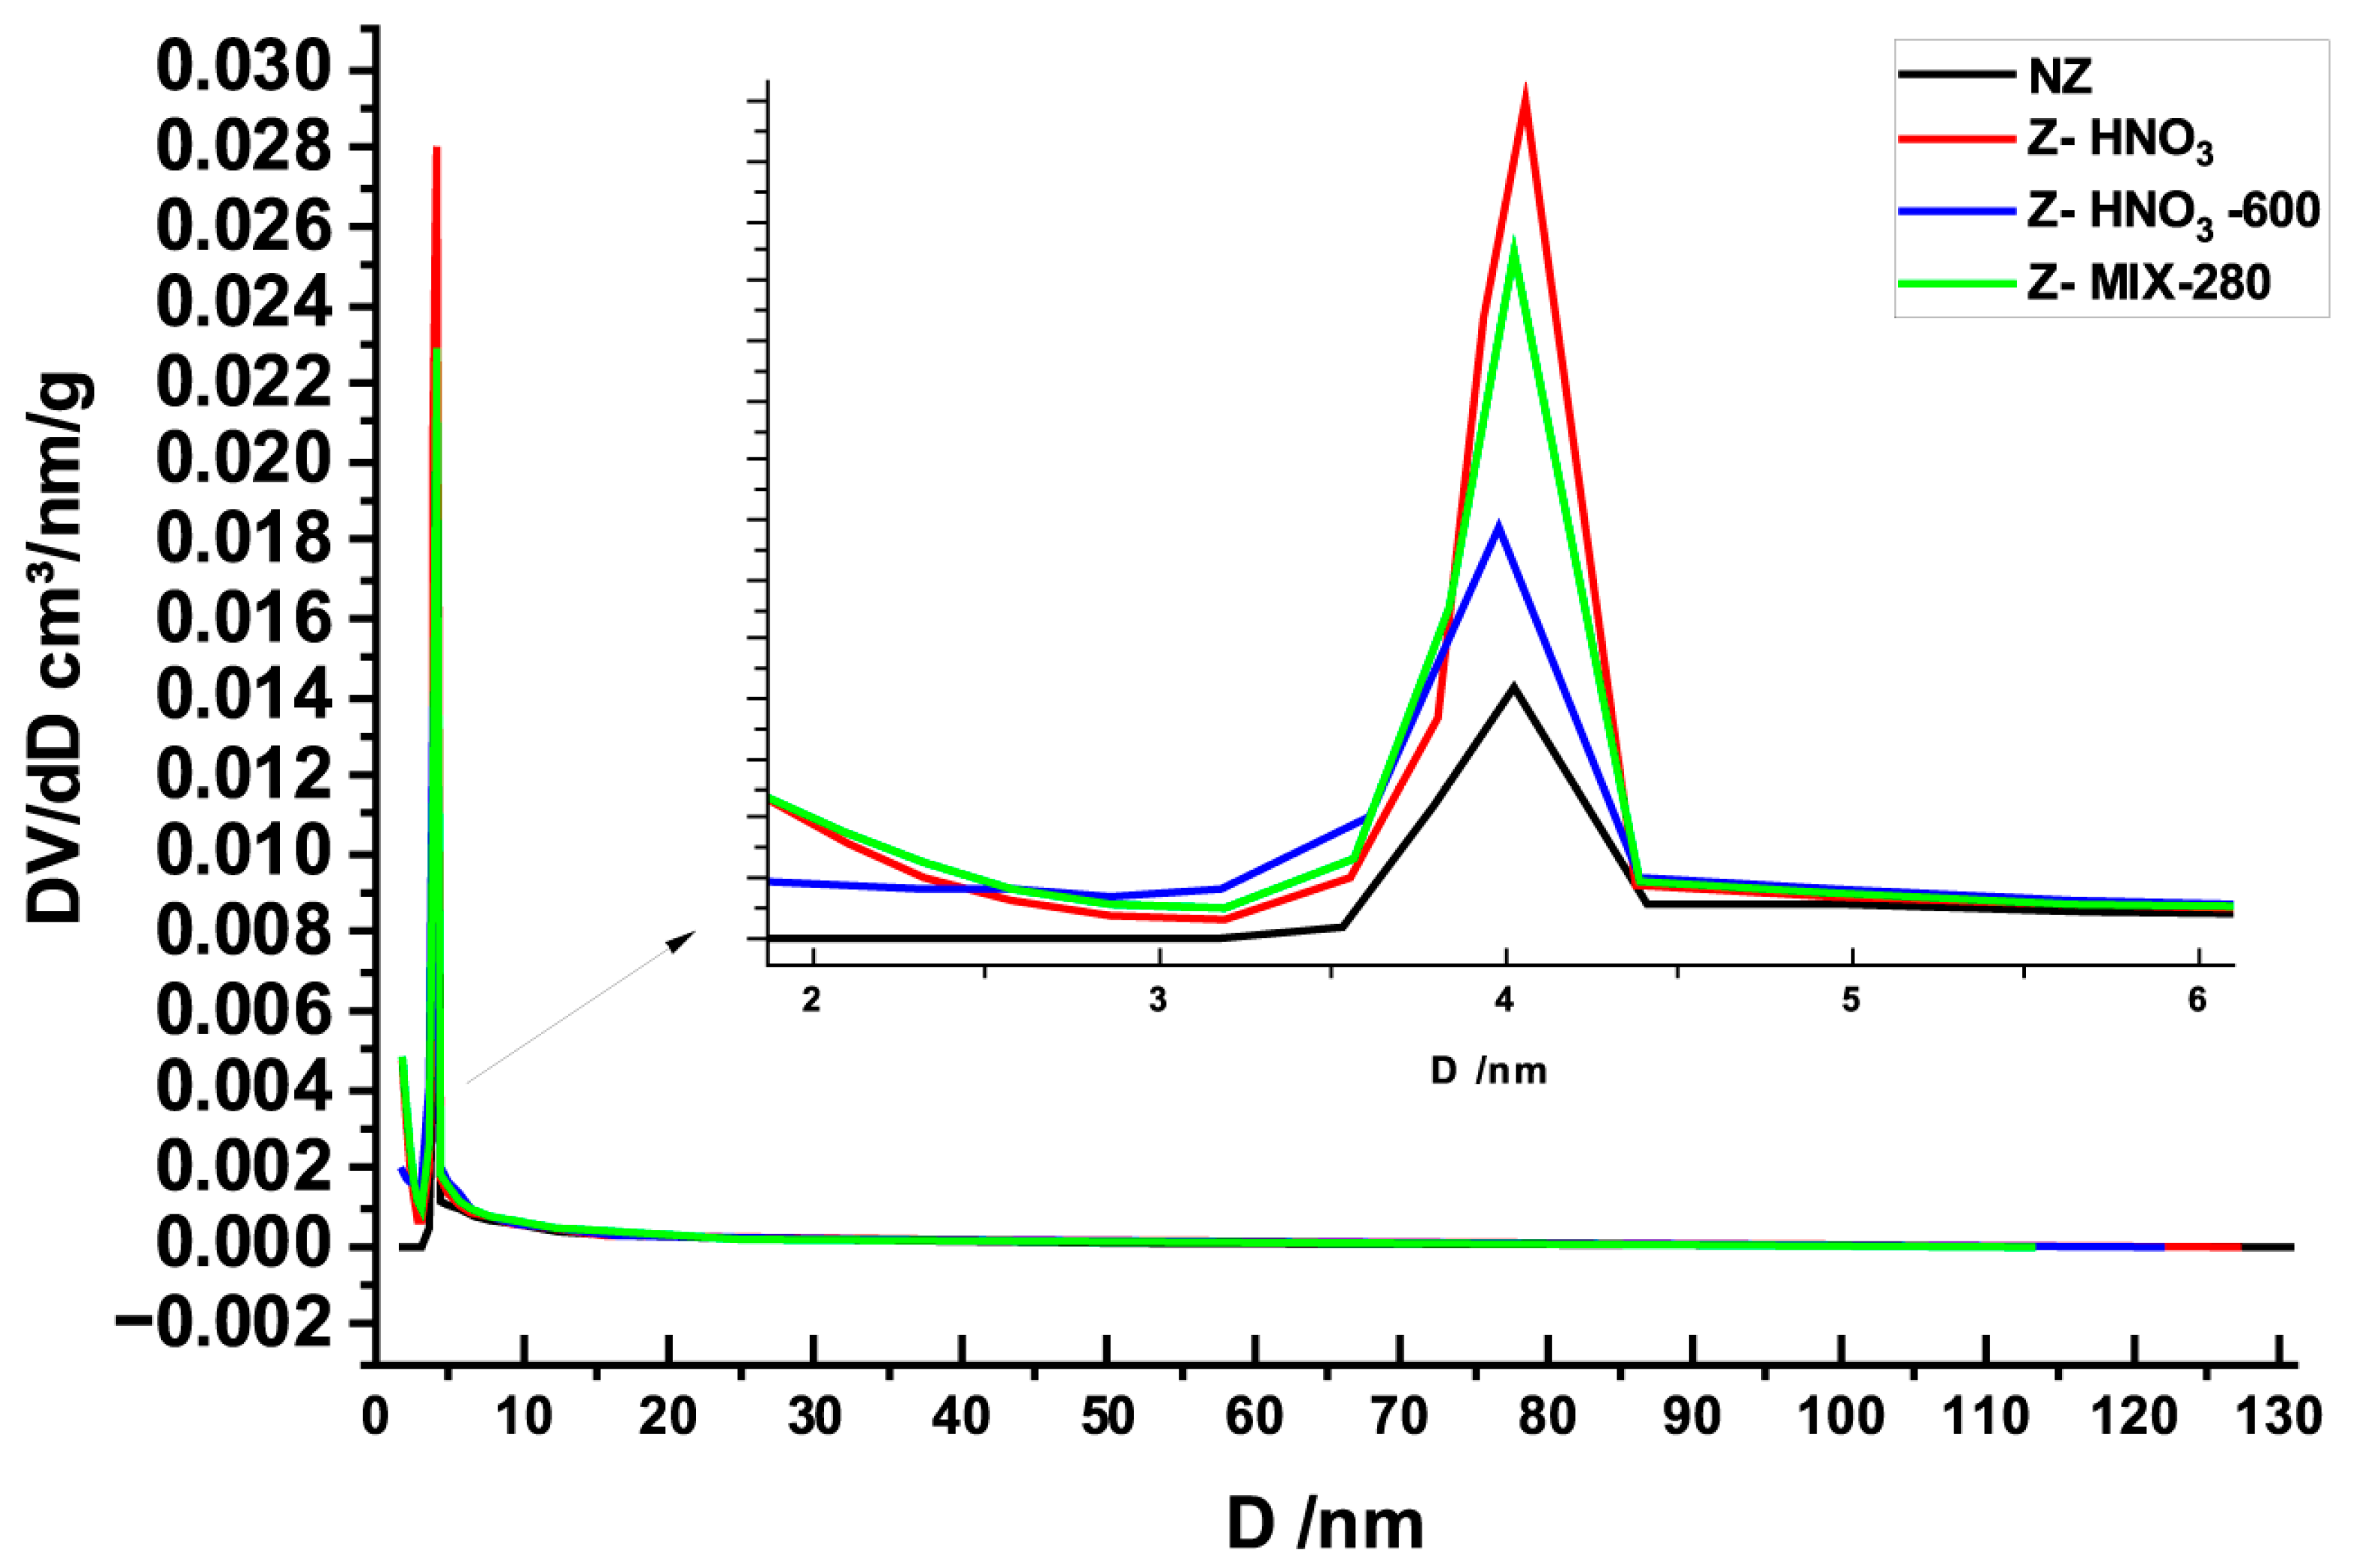
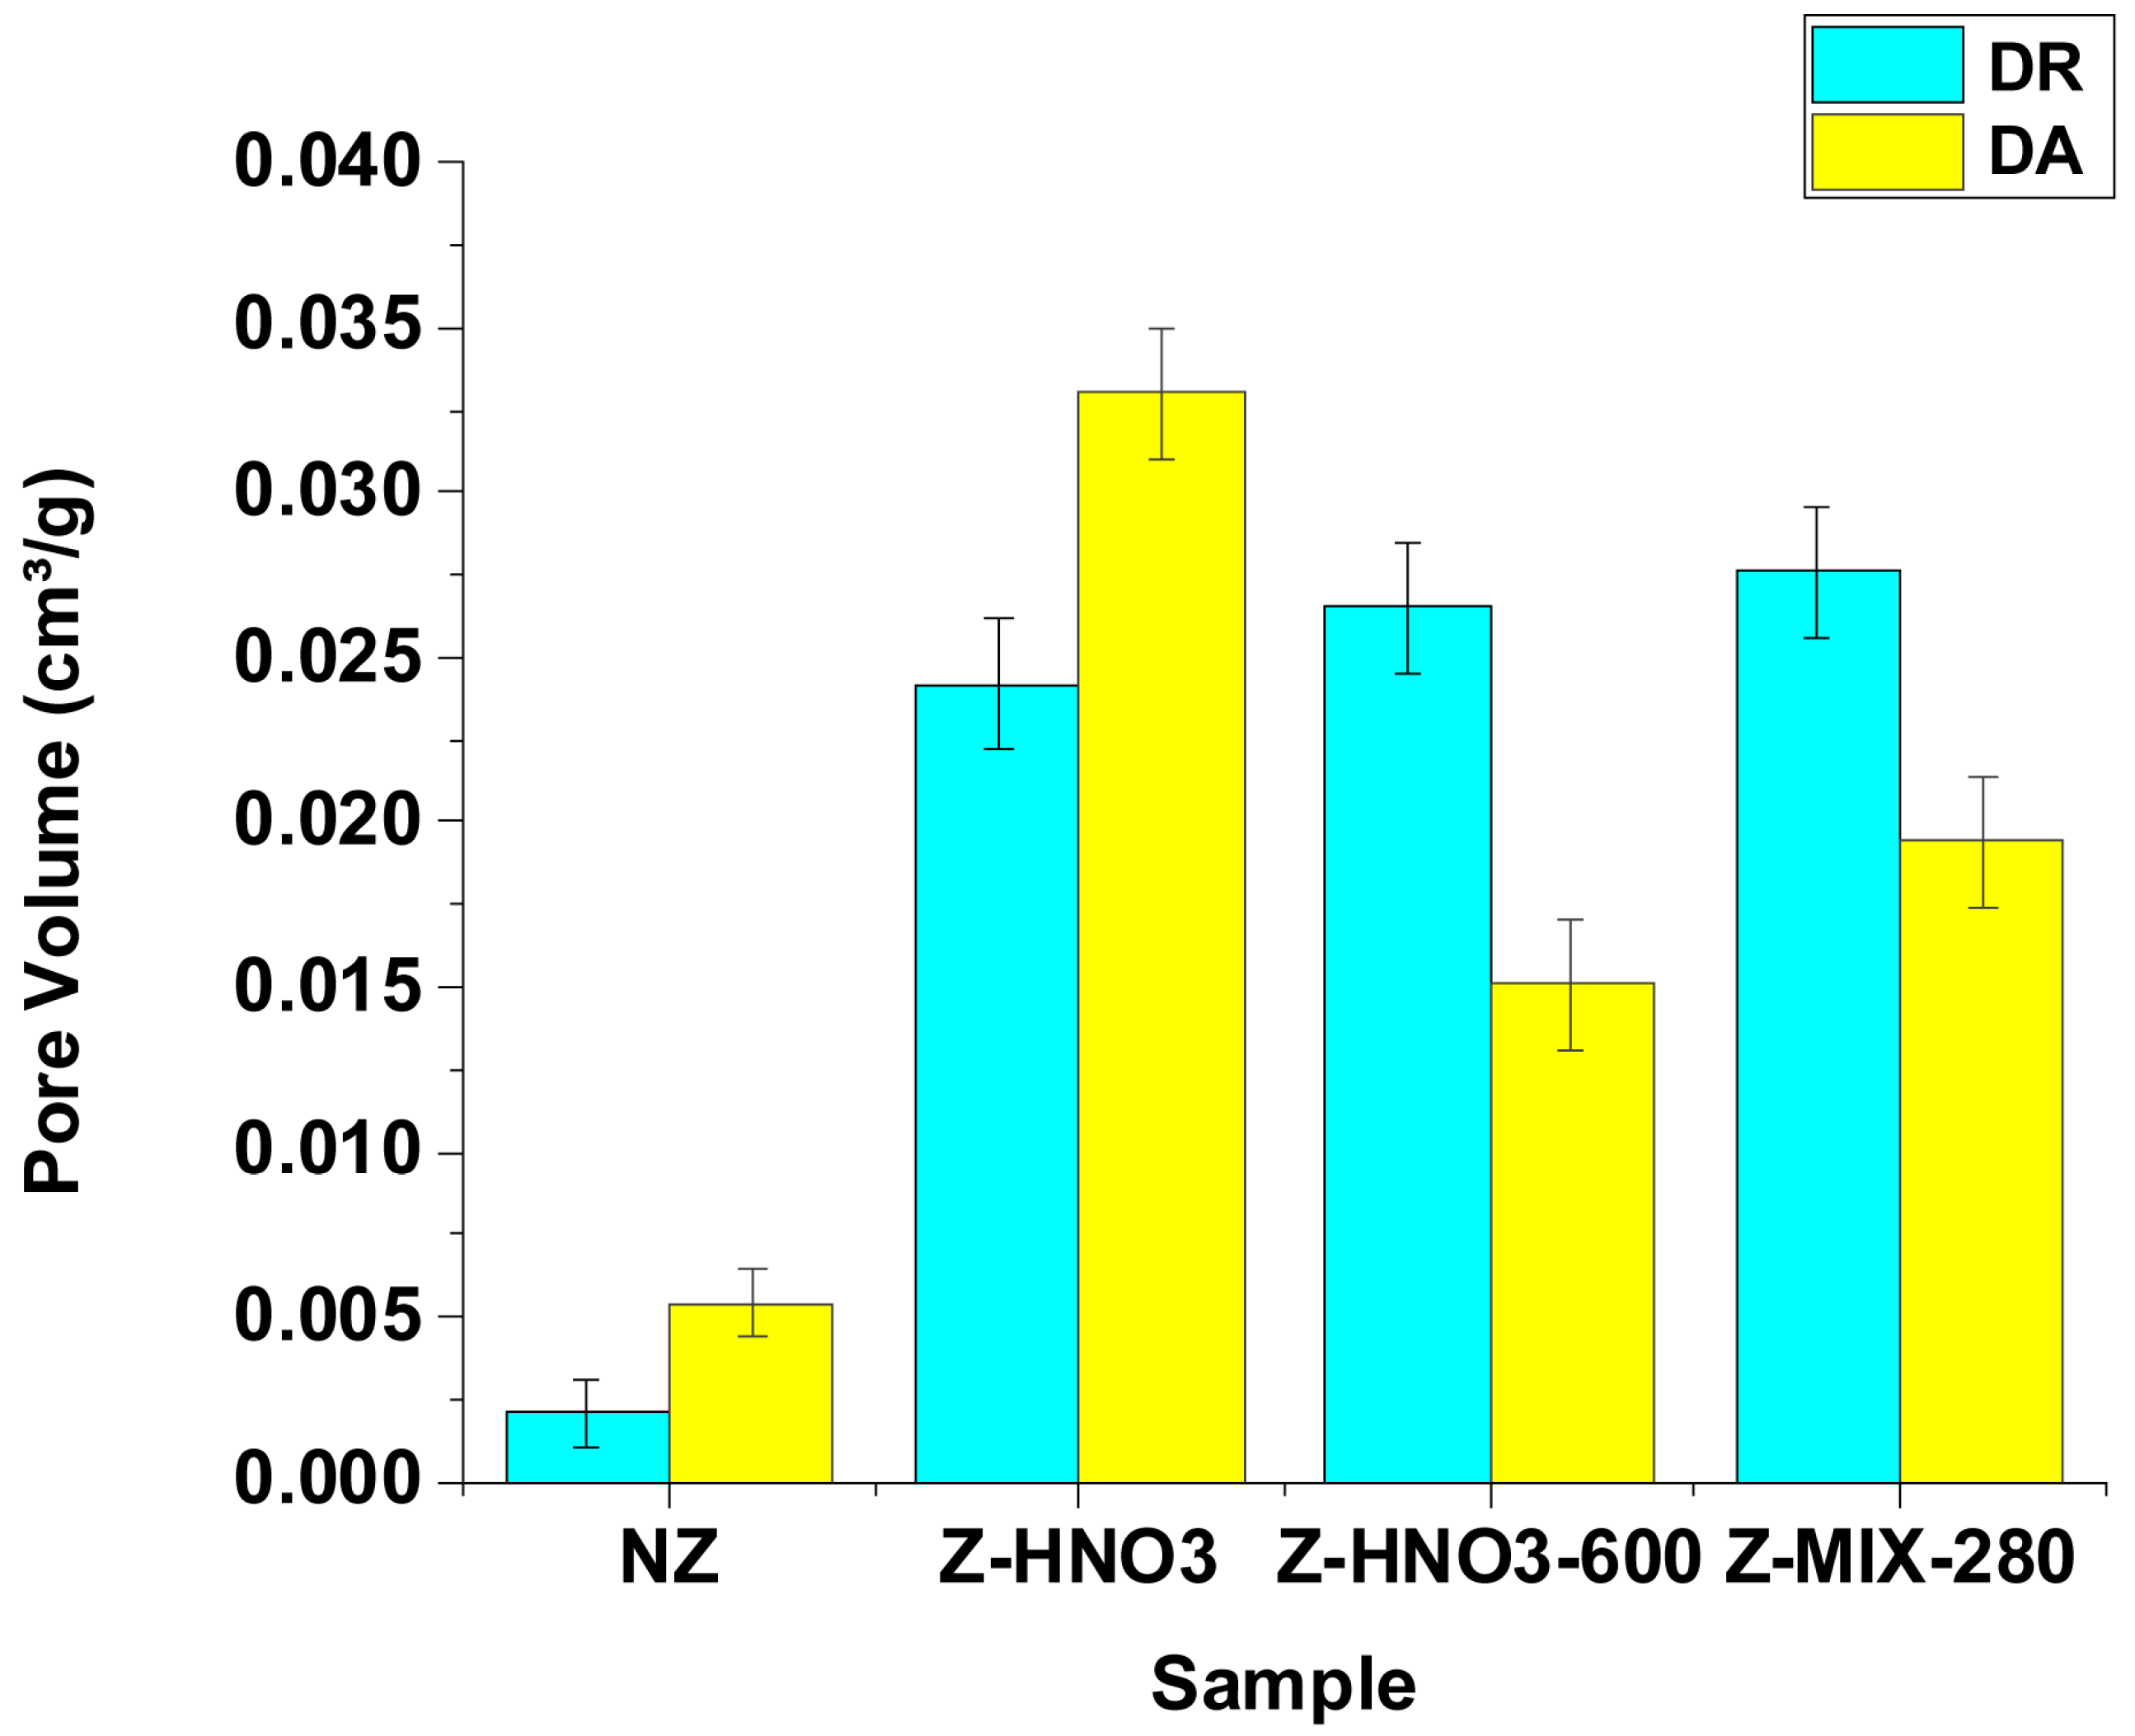
The textural properties of the natural and modified zeolite samples were investigated using nitrogen adsorption–desorption at 77 K. The isotherms and corresponding BET data are shown in Figure 4 and Table 4, while the micropore volumes determined by DR and DA methods are presented in Figure 5. All BET and micropore parameters are reported as mean values from three independent measurements, with standard deviations not exceeding 5%.
The BET and DR/DA analysis results (Table 4) clearly demonstrate the influence of acid activation and subsequent thermal treatment on the textural properties of the zeolite samples. The natural zeolite (NZ) exhibited a low specific surface area (BET: 4.95 m2/g), minimal micropore volume (0.0054 cm3/g), and a relatively large average pore diameter (~16 nm), which is typical for untreated clinoptilolite with blocked or partially collapsed micropores. Upon treatment with 10% nitric acid (Z–HNO3), a significant increase in specific surface area (up to 59.86 m2/g BET; 67.98 m2/g DR) and micropore volume (0.0330 cm3/g DR, 0.024 cm3/g DA) was observed, accompanied by a decrease in average pore diameter (to ~3.26 nm). These changes reflect efficient dealumination, removal of exchangeable cations (Na+, K+, Ca2+), and partial unblocking or formation of new micropores, enhancing the adsorption capacity and acid site accessibility.
The sample subjected to thermal treatment at 600 °C after nitric acid activation (Z–HNO3-600) exhibited a moderate decrease in surface area (BET: 19.39 m2/g), but retained improved porosity compared to the natural zeolite. The partial collapse of some newly formed micropores at elevated temperatures is likely compensated by the stabilization of remaining structural features. The increased average pore diameter (6.21 nm) indicates structural rearrangement and possible mesopore formation. In contrast, the sample treated with a mixture of 10% nitric acid and 5% acetic acid followed by thermal activation at 280 °C (Z–MIX-280) demonstrated a favorable balance between surface area (BET: 48.07 m2/g), micropore volume (0.0276 cm3/g DR, 0.0194 cm3/g DA), and pore size distribution. The combination of oxidizing (HNO3) and mild organic (CH3COOH) acids provided both surface activation and framework preservation, preventing excessive dealumination or collapse. As a result, the material maintained enhanced microporosity and moderate pore size (3.84 nm), optimal for catalytic applications requiring both accessibility and structural stability.
Figure 4 shows the BJH (Desorption) Pore Volume and Pore Size Distribution of the natural and treated zeolite samples. The inset presents a magnified view of the small mesopore region (2–6 nm). The natural zeolite exhibits a relatively low pore volume with a broad distribution in the mesopore region (3–15 nm). HNO3-treated samples show a shift toward narrower mesopores (~3.5–5 nm) and significantly increased pore volume, indicating acid-induced framework opening. Thermal treatment after HNO3 activation (Z–HNO3-600) results in slight pore shrinkage and structural reordering. In contrast, the dual-acid-treated sample (Z–MIX-280) demonstrates the highest pore volume and sharper mesopore distribution, suggesting enhanced pore accessibility and surface development. These findings highlight the role of acid and thermal treatments in tailoring zeolite porosity for catalytic applications. Figure 5 presents the micropore volumes of the natural and modified zeolite samples determined by DR and DA methods, with a legend indicating each method. The average micropore diameter (~1.5 nm, 15 Å) indicates that these materials fall outside the typical microporous zeolite range, reflecting partial unblocking and framework modification induced by acid and thermal treatments.
Overall, the N2 sorption data show that acid treatment with a mixture of nitric and acetic acid, especially when combined with thermal activation, significantly improves the textural characteristics of clinoptilolite, increasing its specific surface area and improving access to active sites—properties favorable for adsorption and catalytic applications.

3.1.4. Thermogravimetric Analysis (TGA)

The thermogravimetric analysis (TGA) of the natural clinoptilolite sample (NZ) demonstrates a nearly linear mass loss in the initial heating stage, with a slight decrease up to ~265 °C (Figure 6a). This weight reduction is primarily associated with the partial desorption of physically adsorbed water and loosely bound hydroxyl groups, including high-temperature hydroxyl condensation, from the zeolitic framework. A subsequent plateau in the TGA curve (~270–660 °C) indicates thermal stability with no significant disruption of the Si–O–Al framework in this temperature range. A minor additional mass loss (~670–700 °C) can be attributed to removal of more strongly bound water or cation-associated species, not framework collapse. Overall, the total weight loss is limited to 3–4 wt%, confirming that the zeolite framework largely remains intact and thermally robust up to at least 800 °C.
The acid-treated zeolite (Z–MIX-280) exhibits thermal behavior indicative of surface modifications (Figure 6b). The first observable weight change occurs below 300 °C, associated with partial desorption of adsorbed water, loosely bound hydroxyl groups, and residual acetic acid or nitrate species. Subsequent minor weight changes at higher temperatures (353–441 °C) correspond to the removal of residual surface functionalities and bound species, reflecting water and functional group removal rather than framework collapse. The cumulative weight loss reaches approximately 4 wt%, indicating that the framework remains largely intact.
Based on these thermogravimetric observations, 600 °C was chosen as the thermal treatment temperature for the HNO3-activated zeolite, since the TGA curve of the raw material (NZ) indicated the onset of significant weight loss and framework changes near this point, ensuring efficient removal of nitrate residues while maintaining overall crystallinity. For the mixed-acid-activated zeolite (Z–MIX-280), the most pronounced weight changes occurred below 300 °C, associated with the release of adsorbed water and acetic acid species. Therefore, 280 °C was selected as the optimal treatment temperature, as higher calcination temperatures led to partial loss of crystallinity and undesired structural transformations. The heating rate of 10 °C/min was applied consistently in both cases to ensure controlled decomposition of volatile species and to avoid abrupt thermal stress on the framework.
The DSC curves recorded simultaneously with the TGA provide complementary insight into the thermal events. For the natural zeolite (NZ), a broad endothermic effect in the range of 80–150 °C corresponds to desorption of physically adsorbed water, in agreement with the initial TGA weight loss. A weaker exothermic feature observed above ~450 °C can be attributed to high-temperature hydroxyl condensation and minor framework rearrangements, consistent with partial water and hydroxyl group removal.
In the case of the acid-treated zeolite (Z–MIX-280), the DSC curve exhibits distinct endothermic peaks near 350 °C and 440 °C, consistent with the decomposition of surface functionalities and removal of nitrate/acetate residues. These observations confirm that the DSC signals correlate well with the TGA weight loss steps, reflecting removal of different water species and surface groups rather than structural collapse.

3.1.5. SEM and EDX Analysis

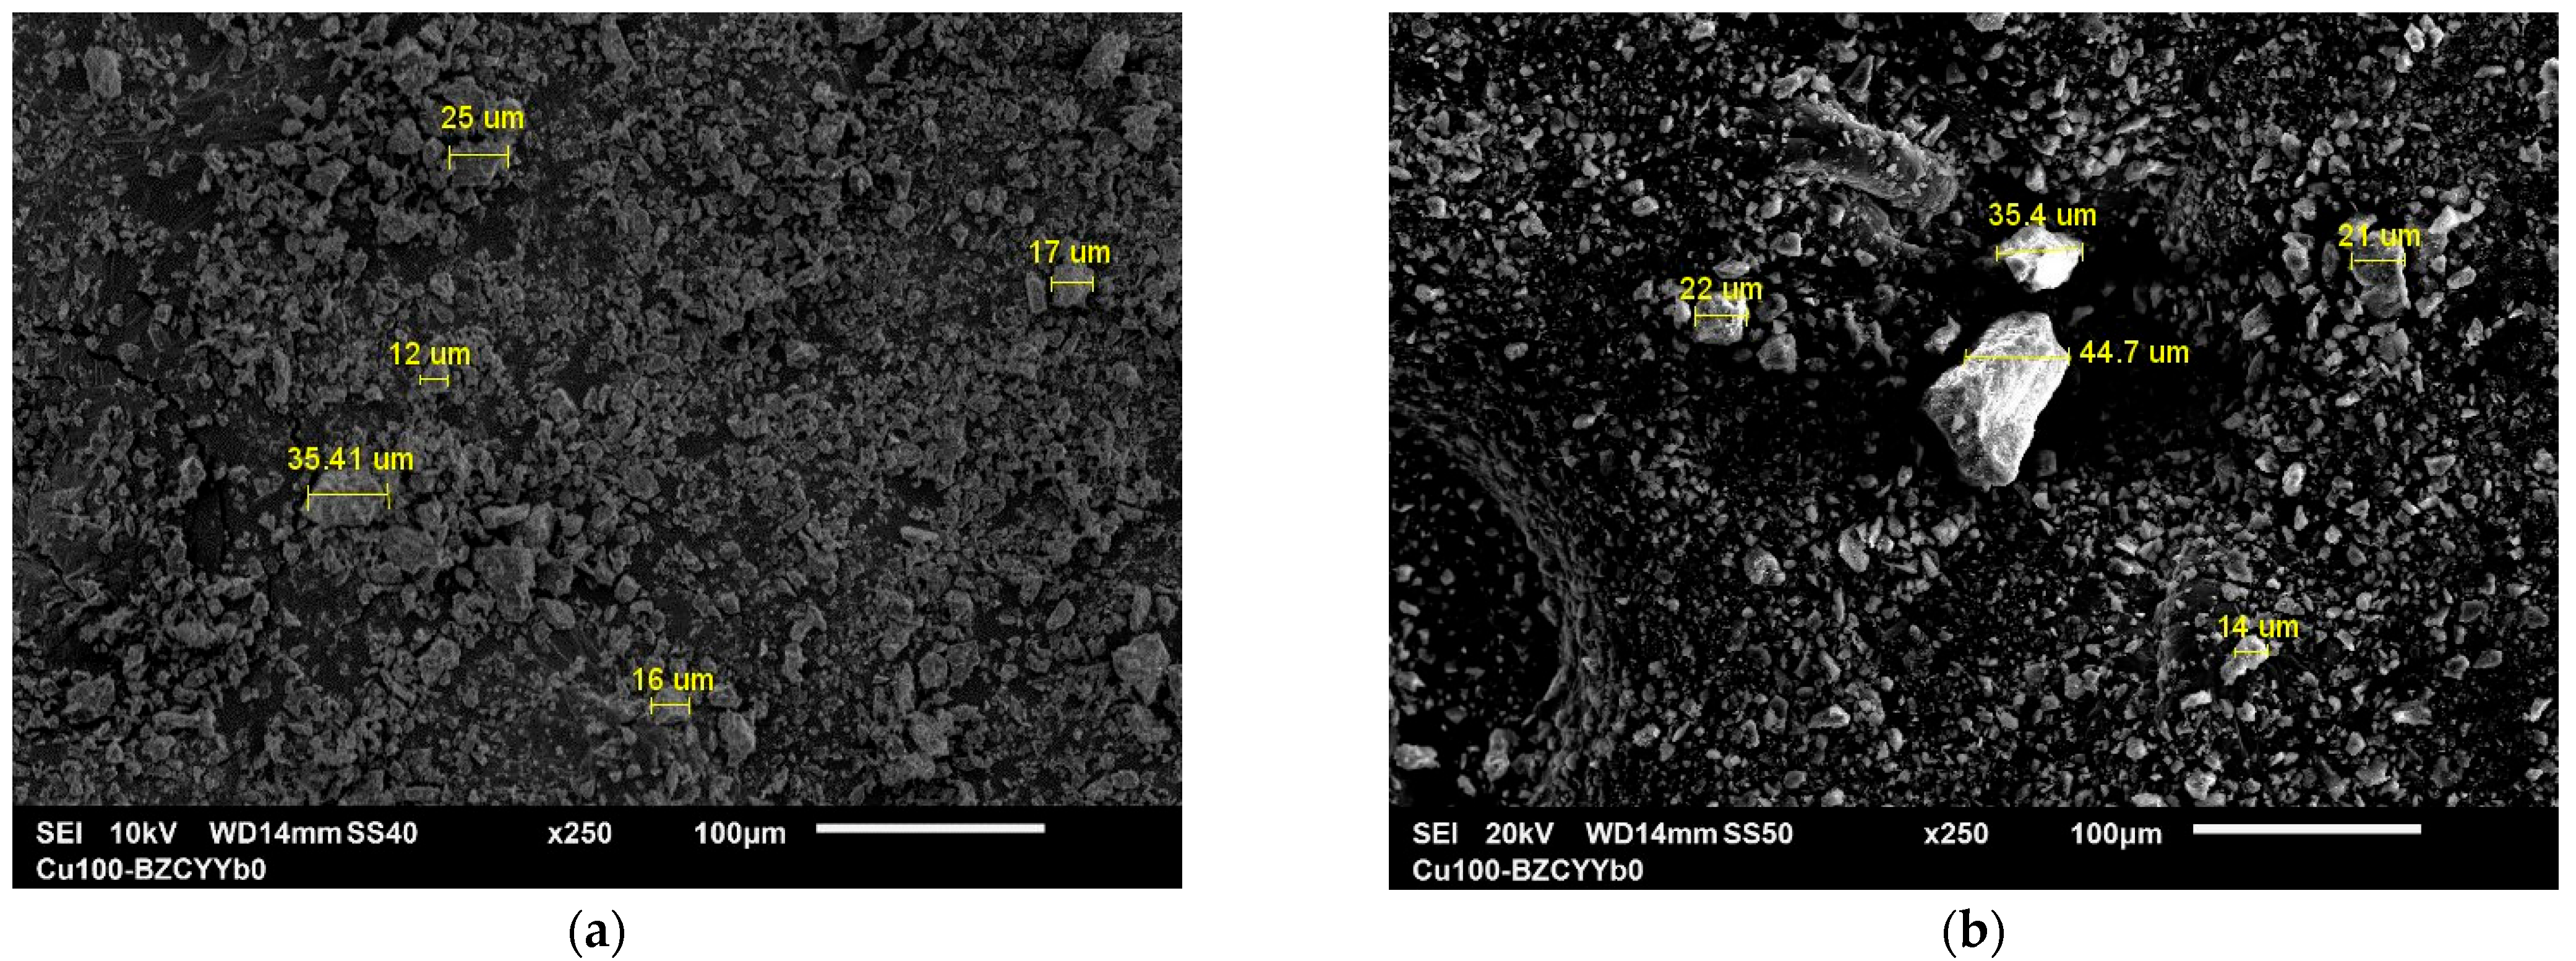
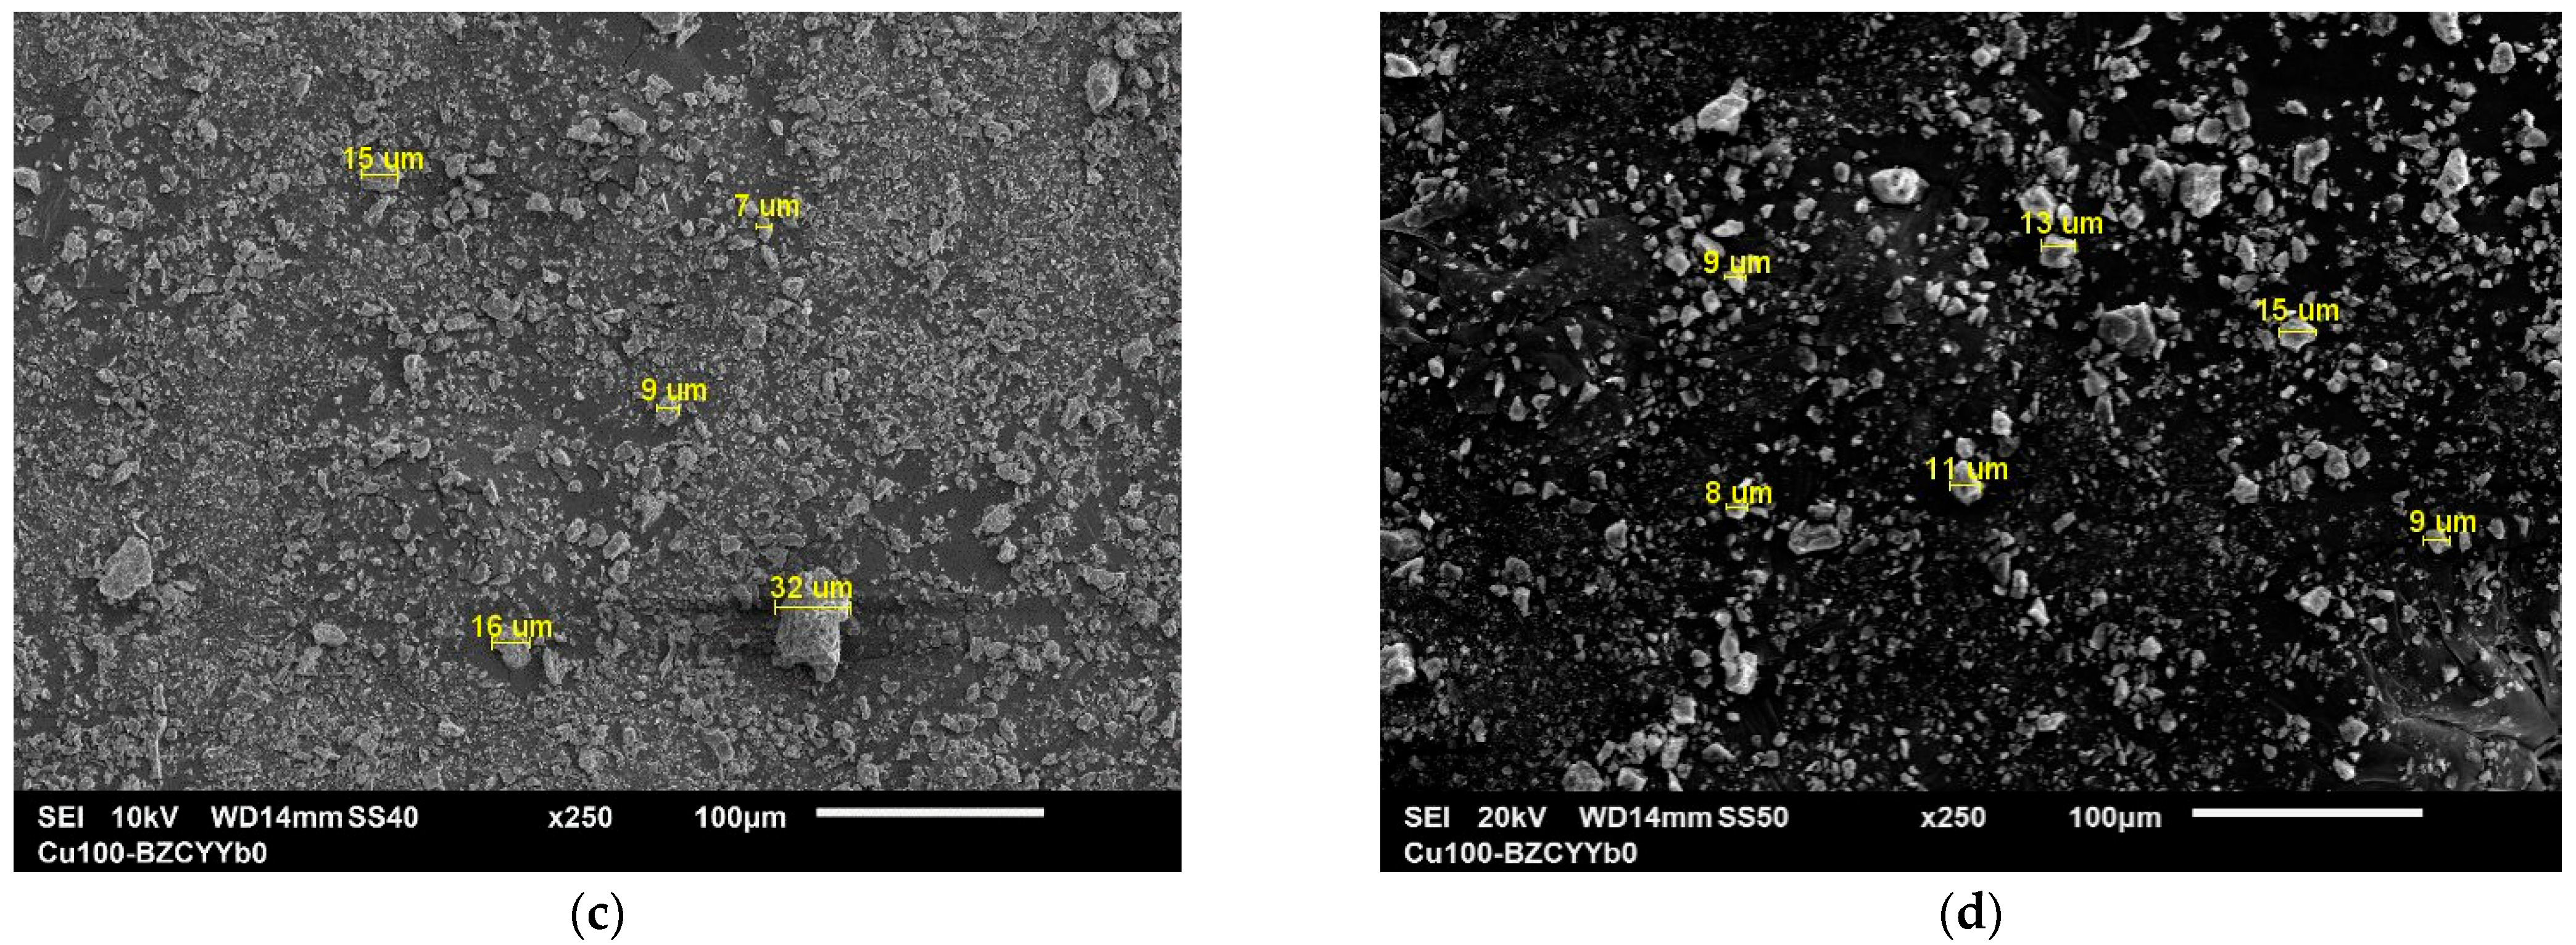
The treatment with acids does not cause significant changes in the external morphology of the zeolite particles, as observed in the SEM images (Figure 7). The background visible in the micrographs corresponds to the carbon tape used for sample mounting. However, the surface becomes more textured, and internal pores are more clearly opened, which may enhance the catalytic performance of the samples. In the untreated natural zeolite (Figure 7a), the particle size ranges from approximately 12 to 35.41 μm, with a mixture of small, medium, and large particles. The surface structure appears relatively compact with limited surface roughness.
The particles remain in the medium size range (approximately 14–44.7 μm) (Figure 7b), but the regular morphology is partially disrupted and the framework shows signs of structural degradation, indicating partial dealumination caused by aggressive acid treatment in sample Z–HNO3. This suggests partial damage to the zeolitic framework due to aggressive acid treatment. In contrast, the sample Z–HNO3-600 (Figure 7c) shows a narrower particle size distribution (7–32 μm) and a more preserved morphology. The pore openings appear more defined, indicating that thermal treatment can improve pore accessibility without excessive damage to the structure. Finally, the sample Z–MIX-280 (Figure 7d) contains particles range from 6 to 15 µm, which are among the smallest observed across all treatments. The reduced particle size suggests an increase in external surface area, while the morphological features indicate effective modification of the surface texture with preserved structural integrity. This indicates that the mixed-acid treatment can effectively tailor the surface texture while preserving structural integrity, offering potential advantages for catalytic applications and further exploration as a nanostructured material. In general, the acid treatments promote partial dealumination and modification of the surface texture, while the combined acid–thermal treatment allows for controlled restructuring. These morphological changes are expected to influence the textural properties and catalytic behavior of the zeolite. Importantly, SEM provides only qualitative information regarding porosity: the rough particle surfaces with visible microcavities suggest the presence of pores, but the quantitative pore size distribution was obtained from independent N2 adsorption–desorption measurements (BET/DR/DA analysis, Section 3.1.3, Table 4). Thus, SEM images complement adsorption results by illustrating the morphological surface roughness and supporting the observed textural modifications after acid treatment.
Acid treatment of the natural zeolite led to a slight increase in the SiO2/Al2O3 ratio (calculated from wt.% values: NZ—62.2/15.1 ≈ 4.12; Z–HNO3—71.4/16.7 ≈ 4.28; Z–HNO3-600—73.5/18.2 ≈ 4.04; Z–MIX-280—76.04/20.2 ≈ 3.76), indicating that while partial dealumination may have occurred, the main effect of acid treatment was the removal of exchangeable and loosely bound impurities (Table 5). A progressive reduction in Fe2O3, CaO, Na2O, and MgO contents after acid washing and thermal treatment confirms effective purification of the samples. Overall, the combination of impurity removal and improved textural properties increases the suitability of the treated zeolites for catalytic applications. The observed enhancement in textural properties, as evidenced by BET and DR analyses (Table 4), further supports the catalytic potential of the modified zeolites. Acid treatment markedly increased the specific surface area and micropore volume, with Z–HNO3 and Z–MIX-280 exhibiting the highest BET surface areas (59.86 and 48.07 m2/g, respectively) compared to the natural zeolite (4.95 m2/g). Thermal treatment partially reduced the surface area (Z–HNO3-600), indicating some structural densification, yet microporosity was preserved. The combination of increased porosity and the effective removal of impurities such as Fe, Ca, and Mg likely contributes to enhanced catalytic efficiency, providing more accessible active sites and minimizing potential metal-catalyzed side reactions. Overall, these structural and compositional modifications synergistically improve the suitability of the treated zeolites for catalytic applications, highlighting the importance of both acid and thermal post-treatments.

3.2. Catalytic Activity of Zeolite

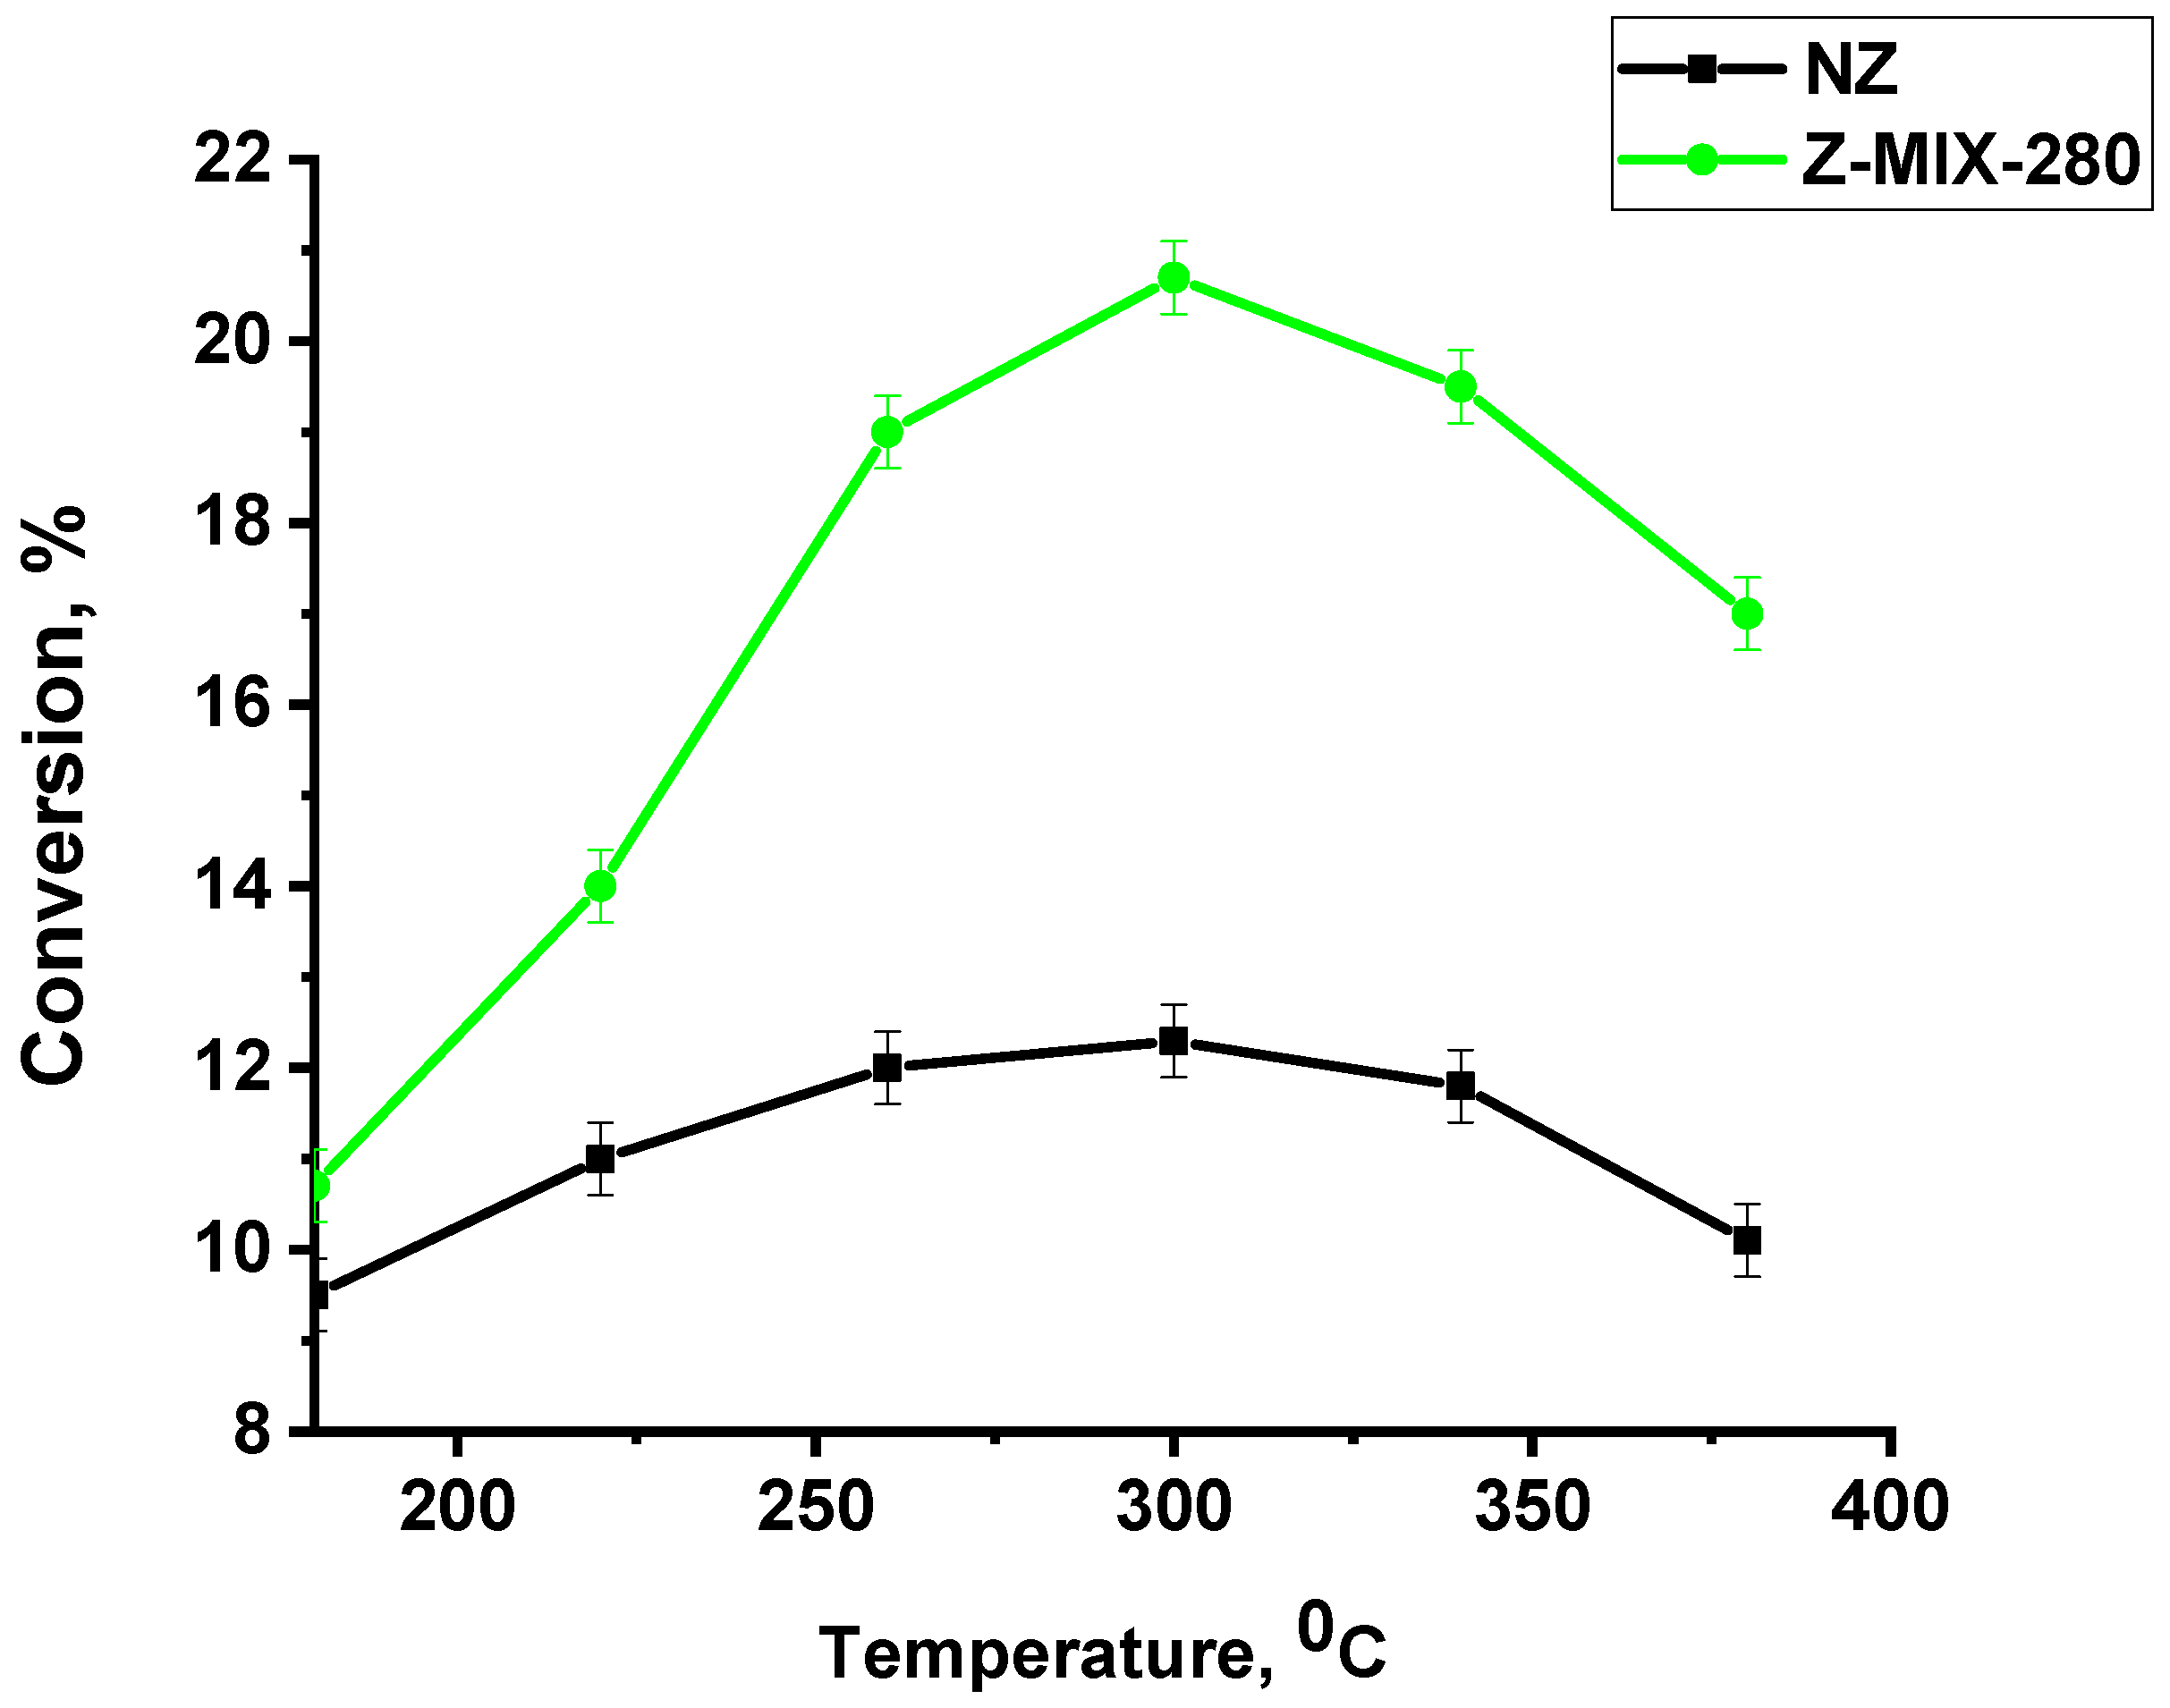
Preliminary tests on thiophene hydrodesulfurization were conducted using both natural and acid-modified clinoptilolite as catalyst supports. The results of these tests are summarized in Figure 8, showing thiophene conversion at different reaction temperatures (180–380 °C) under a constant hydrogen flow of 3 mL/min, thiophene feed of 9 mL/min, and pressure of 25 atm. The natural zeolite (NZ) exhibited gradually increasing conversion with temperature, reaching a maximum of 12.3% at 300 °C, whereas the modified sample (Z–MIX-280) showed higher conversions across the temperature range, with a maximum of 20.7% at 300 °C. At temperatures above 300 °C, the conversion slightly decreased, likely due to reduced thiophene residence time and possible changes in adsorption–desorption dynamics.
The chosen temperature range (180–380 °C) covers the onset of thiophene hydrogenation up to the point where thermal effects might influence reaction kinetics without compromising zeolite stability. The pressure of 25 atm was selected to ensure sufficient hydrogen availability while maintaining safe operating conditions and promoting effective C–S bond cleavage. This set of conditions allows evaluation of the catalytic potential of the zeolite supports and comparison of their performance across relevant HDS reaction conditions.
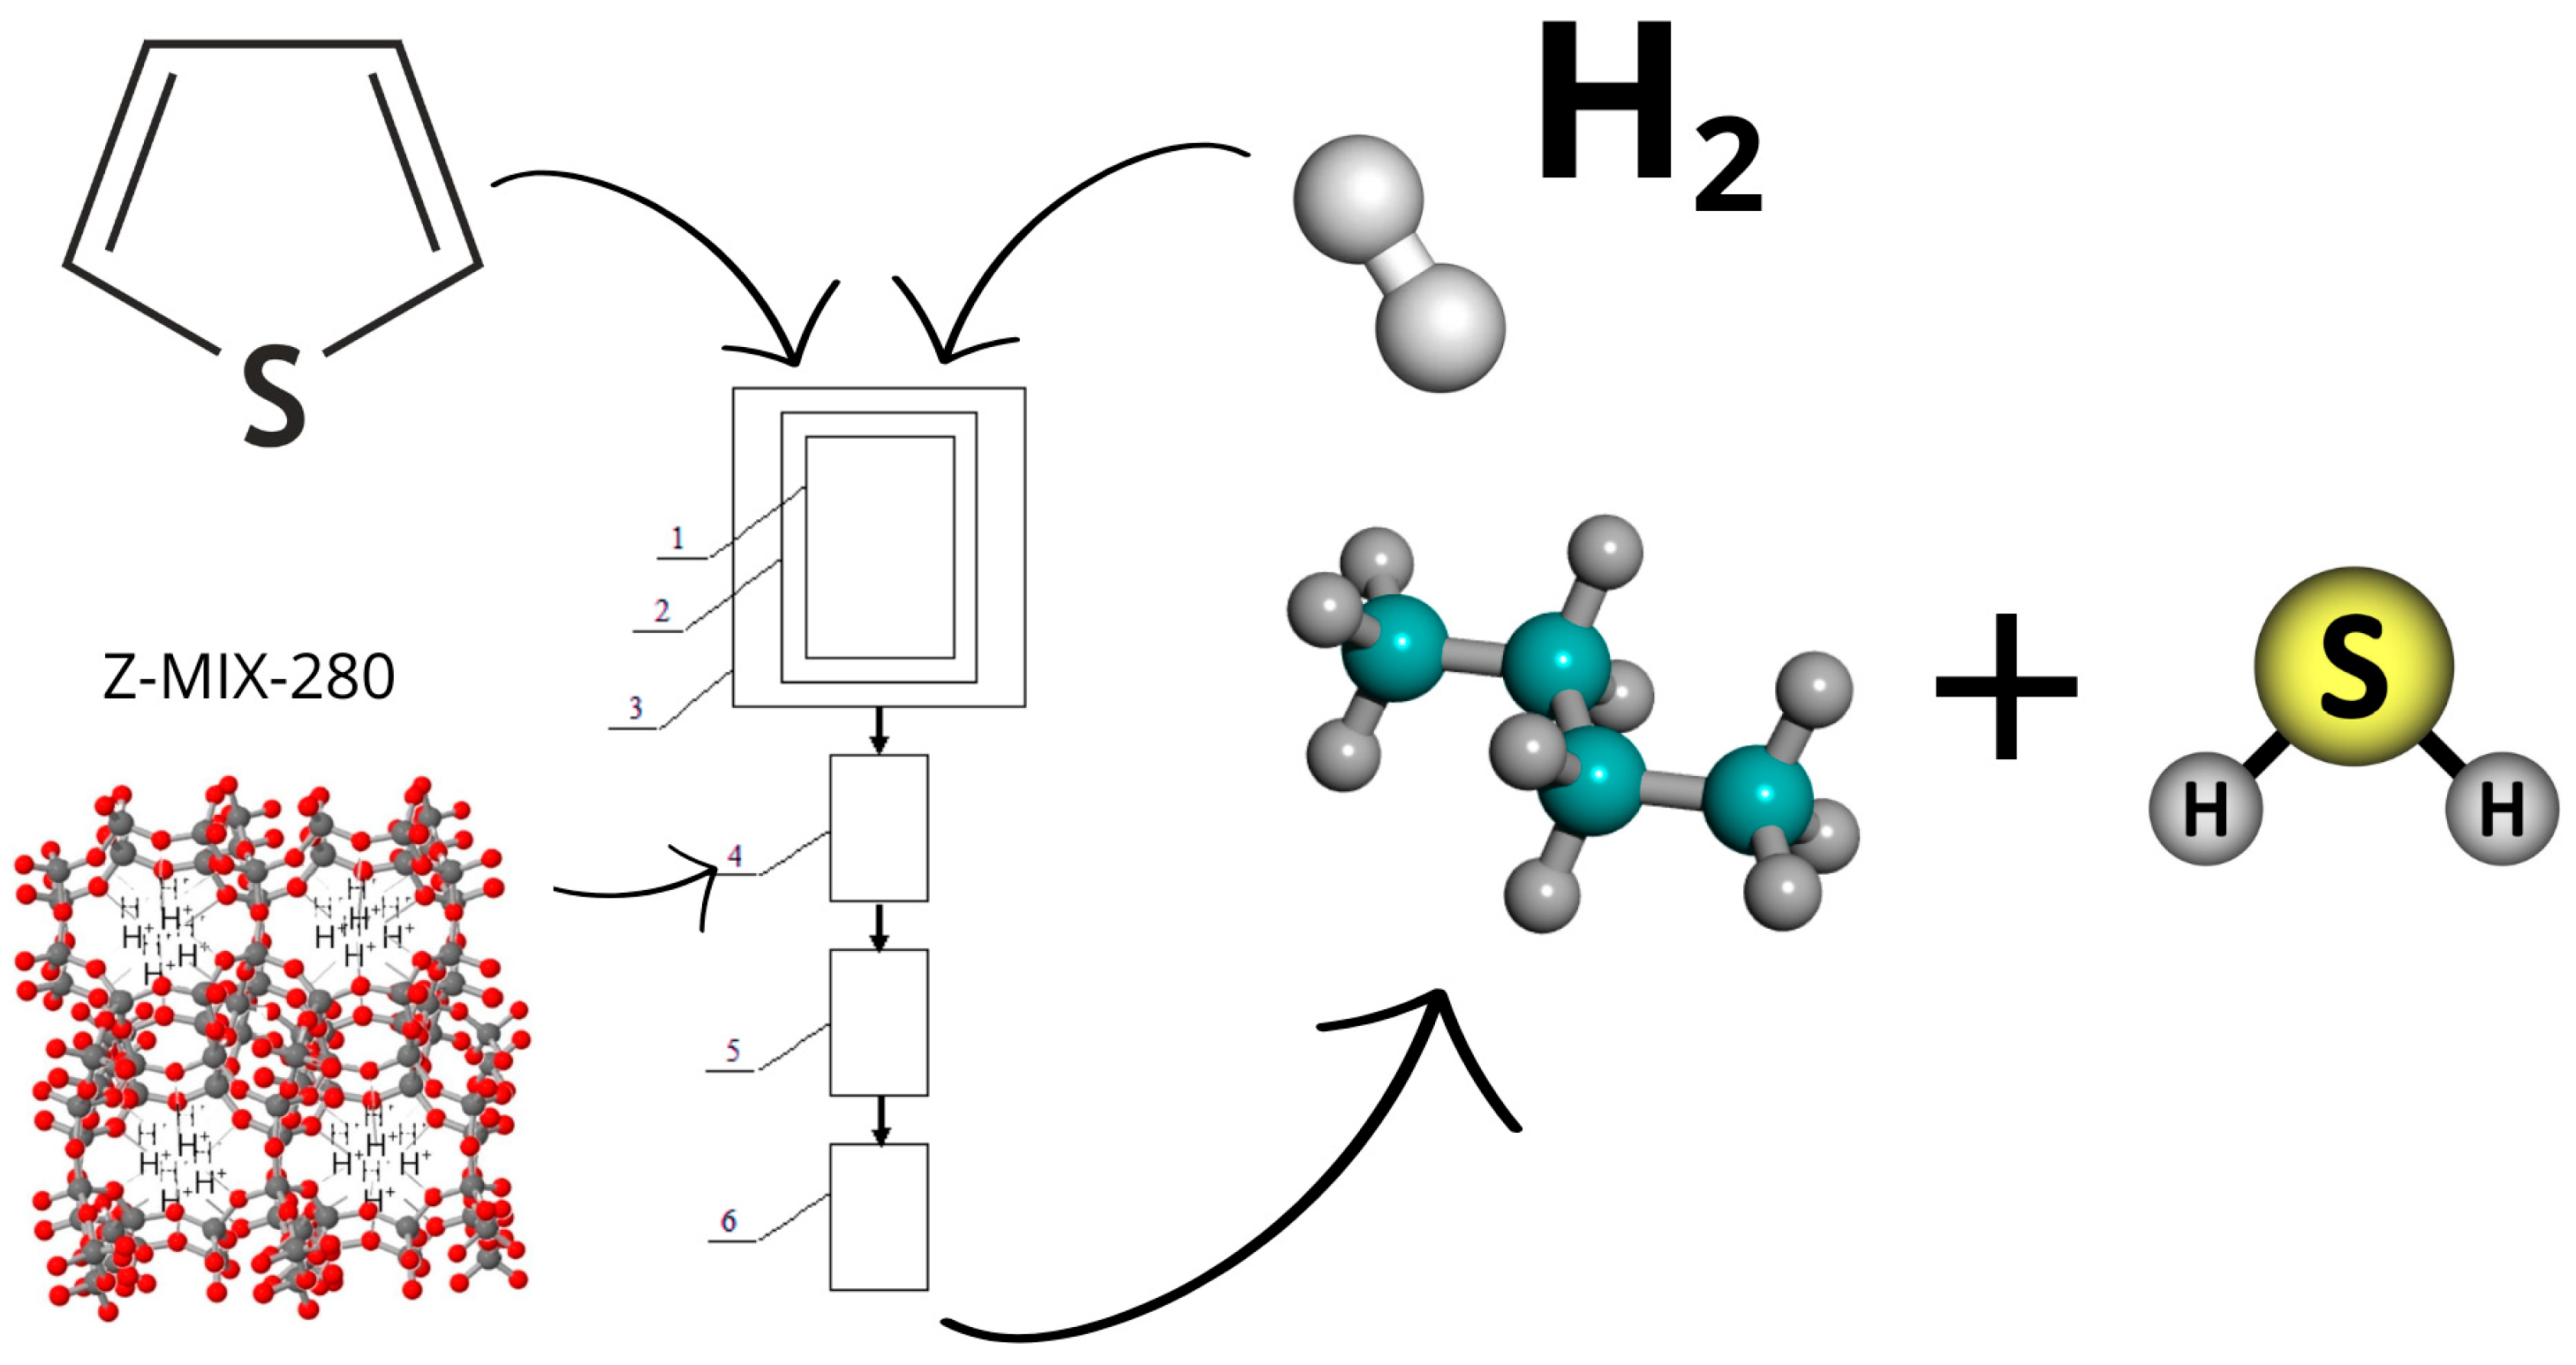
The hydrodesulfurization (HDS) of thiophene typically proceeds via hydrogenation of the aromatic ring followed by C–S bond cleavage (Figure 9), producing butane and hydrogen sulfide (H2S). At elevated temperatures, minor amounts of butenes may also appear due to hydrogen deficiency and secondary dehydrogenation reactions.
Although this study focuses on metal-free zeolite modification, the enhanced acidity and porosity obtained here are expected to favor dispersion of active metal phases and facilitate thiophene adsorption and activation. Previous reports on Co–Mo and Ni–Mo sulfides supported on zeolites or zeolite-containing composites demonstrate improved hydrodesulfurization (HDS) activity compared to unsupported systems [37,38], while metal-exchanged y-type zeolites have been shown to enhance selective thiophene adsorption relative to the parent material [39,40]. These findings suggest that the textural and acidic improvements achieved in the present work provide a strong basis for further development. Future studies will therefore focus on the preparation of metal-loaded zeolite catalysts by ion-exchange or impregnation, followed by evaluation of their performance in thiophene adsorption and HDS model tests. While the present study focused on dual-acid treatment of Shankhanai clinoptilolite, it is recognized that other zeolite types (e.g., mordenite, faujasite) may respond differently due to their unique framework, pore sizes, and chemical composition. Comparative studies on these materials represent an important direction for future work.

4. Conclusions

This study demonstrates that acid activation significantly enhances the physicochemical properties of natural clinoptilolite from the Shankhanai deposit, making it a viable candidate for catalytic applications. XRD, FTIR, BET, TGA, SEM, and EDX analyses confirmed that 10% nitric acid increases surface area and porosity but partially degrades the framework. Treatment with 10% nitric acid increased the BET surface area from 4.95 to 59.9 m2/g. In contrast, the combination of 10% nitric acid and 5% acetic acid followed by mild thermal treatment effectively preserved crystallinity while improving microporosity and acidity. This dual-acid method proved to be a more balanced and environmentally friendly strategy for zeolite modification. Preliminary catalytic tests on thiophene hydrodesulfurization showed increased conversion (from 12.3% to 20.7%) after modification, despite the absence of active metal species. The optimal conditions for HDS were 300 °C, 25 atm, and 25 min reaction time, with feed rates of 9 mL/min thiophene and 3 mL/min hydrogen. Reactions were studied within the range of 180–380 °C and 0.1–3.0 MPa. The dual-acid strategy provides a green and effective route to thermally stable and catalytically active zeolitic materials, particularly suitable for selective hydrodesulfurization of thiophene. These findings highlight that tailoring acidity and porosity through controlled acid combinations provides a pathway to design efficient and thermally stable supports without compromising structural integrity. Future work will focus on the incorporation of active metals and evaluation of long-term catalytic stability under industrially relevant HDS conditions.

Author Contributions

S.T. and A.A. contributed to the conceptualization and design of the study. S.T. developed the methodology and software. Validation was performed by S.T., D.T. and N.Z. Formal analysis was conducted by S.T. and A.A. The investigation was carried out by S.T. and D.T. Resources were provided by G.M. Data curation was handled by S.T. S.T. prepared the original draft of the manuscript, while D.T., N.Z., K.T. and G.M. contributed to writing—review and editing. Visualization was carried out by A.A. Supervision was provided by S.T. and Z.M. Project administration was undertaken by S.T. Funding acquisition was the responsibility of Z.M. All authors have read and agreed to the published version of the manuscript.

Funding

This research was funded by the Science Committee of the Ministry of Science and Higher Education of the Republic of Kazakhstan, Grant No. BR24992915.

Data Availability Statement

The original contributions presented in this study are included in the article. Further inquiries can be directed to the corresponding authors.

Conflicts of Interest

The authors declare no conflicts of interest.

Abbreviations

The following abbreviations are used in this manuscript:
FTIRFourier Transform Infrared Spectroscopy
XRDX-ray Diffraction
EDAXEnergy Dispersive X-ray Analysis
EDTAEthylenediaminetetraacetic Acid
SEMScanning Electron Microscopy
DADubinin–Astakhov method
DRDubinin–Radushkevich method
BJHBarrett–Joyner–Halenda method
TGAThermogravimetric Analysis
DSCDifferential Scanning Calorimetry

References

  1. European Parliament and Council. Directive 2009/30/EC amending Directive 98/70/EC as Regards the Specification of Petrol, Diesel and Gas-Oil and Introducing a Mechanism to Monitor and Reduce Greenhouse Gas Emissions; Official Journal of the European Union: Brussels, Belgium, 2009. [Google Scholar]
  2. International Maritime Organization (IMO). IMO 2020—Reducing Sulphur Oxide Emissions. London, UK. Available online: https://www.imo.org/en/mediacentre/hottopics/pages/sulphur-2020.aspx (accessed on 7 September 2025).
  3. Shafiq, I.; Shafique, S.; Akhter, P.; Yang, W.; Murid, H. Recent Developments in Alumina-Supported Hydrodesulfurization Catalysts. Catal. Rev. 2020, 62, 96–164. [Google Scholar] [CrossRef]
  4. Wei, W.; Zhang, X.; Liu, X.; Guo, R.; Meng, B.; Li, G.; Ren, S.; Guo, Q.; Shen, B. Tuning effect of the zeolite Brønsted acidity on the FeZn bimetallic hydrodesulfurization catalyst. Energy Fuels 2021, 36, 527–538. [Google Scholar] [CrossRef]
  5. Mustapha, U.; Ismail, A.; Abdulkadir, T.; Khalid, A. Modification of ZSM-5 mesoporosity and application as catalyst support in hydrodesulfurization of dibenzothiophene: Experimental and DFT studies. J. Environ. Chem. Eng. 2021, 9, 106738. [Google Scholar] [CrossRef]
  6. Jiang, K.; Li, Z.; Zheng, Z.; Li, J.; Qi, X.; Zhou, J.; Wei, H.; He, Y.; Xue, M.; Chu, H. Enhanced adsorption performance for aromatic sulfur compounds over a hierarchical structured AgX zeolite. Environ. Sci. Atmos. 2021, 1, 569–576. [Google Scholar] [CrossRef]
  7. Song, Z.; Bi, M.; Li, J.; Guo, Y.; Xu, Q.; He, Y.; Zhao, N.; Chen, L.; Ren, D. Synthesis of TiO2-Modified Y Zeolite and Its Adsorption-Catalytic Oxidative Desulfurization Performance. Silicon 2024, 16, 4159–4172. [Google Scholar] [CrossRef]
  8. Molina-Pérez, R.I.; Cruces-Lira, J.; Klimova, T.E. Upgrading titania and alumina supports for NiMo hydrodesulfurization catalysts by the incorporation of 2D graphene oxide. MRS Adv. 2025, 10, 654–659. [Google Scholar] [CrossRef]
  9. Chen, L.-H.; Sun, M.-H.; Wang, Z.; Yang, W.; Xie, Z.; Su, B.-L. Hierarchically Structured Zeolites: From Design to Application. Chem. Rev. 2020, 120, 11194–11294. [Google Scholar] [CrossRef] [PubMed]
  10. Antosik, A.K.; Musik, M.; Miądlicki, P.; Weisbrodt, M.; Wilpiszewska, K. Influence of Acid-Modified Clinoptilolite on the Self-Adhesive Properties of Silicone Pressure-Sensitive Adhesives. Polymers 2023, 15, 707. [Google Scholar] [CrossRef]
  11. Vasilina, G.K.; Moisa, R.M.; Abildin, T.S.; Yesemaliyeva, A.S.; Kuanyshova, S.D. Influence of the structure of natural zeolites on their acidic characteristics. Izv. NAN RK. Ser. Khimii i Tekhnologii 2017, 6, 81–85. (In Russian) [Google Scholar]
  12. Mambetova, M.; Yergaziyeva, G.Y.; Zhoketayeva, A.B. Physicochemical characteristics and carbon dioxide sorption properties of natural zeolites. Gorenie i Plazmokhimiya 2022, 21, 81–87. (In Russian) [Google Scholar]
  13. Fatemeh, B.; Ahad, G. Modification and functionalization of zeolites to improve the efficiency of CO2 adsorption: A review. Case Stud. Chem. Environ. Eng. 2024, 9, 100564. [Google Scholar] [CrossRef]
  14. Khamzina, Z.B.; Belopukhov, S.L. Efficiency of using the Kazakhstan zeolites for the purification of water from iron ions. IOP Conf. Ser. Earth Environ. Sci. 2022, 965, 012010. [Google Scholar] [CrossRef]
  15. Akhalbedashvili, L.G. Catalytic and Ion-Exchange Properties of Modified Zeolites and Superconducting Cuprates. Ph.D. Thesis, Ivane Javakhishvili Tbilisi State University, Tbilisi, Georgia, 2006. (In Russian). [Google Scholar]
  16. Zhu, D.; Wang, L.; Cui, W.; Tan, J.; Tian, P.; Liu, Z. High-Silica Zeolite Y: Seed-Assisted Synthesis, Characterization and Catalytic Properties. Inorg. Chem. Front. 2022, 9, 2213–2220. [Google Scholar] [CrossRef]
  17. Çakıcıoğlu-Özkan, F.; Becer, M. Effect of the acid type on the natural zeolite structure. JOTCSB 2019, 2, 69–74. [Google Scholar]
  18. Fani, K.; Lycourghiotis, S.; Bourikas, K.; Kordouli, E. Influence of Natural Mordenite Activation Mode on Its Efficiency as Support of Nickel Catalysts for Biodiesel Upgrading to Renewable Diesel. Nanomaterials 2023, 13, 1603. [Google Scholar] [CrossRef] [PubMed]
  19. Lu, X.; Wei, C.; Zhao, L.; Gao, J.; Xu, C. Modification of the Acidic and Textural Properties of HY Zeolite by AHFS Treatment and Its Coke Formation Performance in the Catalytic Cracking Reaction of N-Butene. Catalysts 2022, 12, 640. [Google Scholar] [CrossRef]
  20. Benaliouche, F.; Boucheffa, Y.; Ayrault, P.; Mignard, S.; Magnoux, P. NH3-TPD and FTIR Spectroscopy of Pyridine Adsorption Studies for Characterization of Ag- and Cu-exchanged X Zeolites. Microporous Mesoporous Mater. 2008, 111, 80–88. [Google Scholar] [CrossRef]
  21. Chizallet, C.; Bouchy, C.; Larmier, K.; Pirngruber, G. Molecular views on mechanisms of Brønsted acid catalyzed reactions in zeolites. Chem. Rev. 2023, 123, 6107–6196. [Google Scholar] [CrossRef]
  22. Zhang, J.; Li, S.; Li, H.; Wu, Q.; Xi, X.; Li, Z. Preparation of Al–Si composite from high-alumina coal fly ash by mechanical–chemical synergistic activation. Ceram. Int. 2017, 43, 6532–6541. [Google Scholar] [CrossRef]
  23. Huntley, G.M.; Luck, R.L.; Mullins, M.E.; Newberry, N.K. Hydrochloric Acid Modification and Lead Removal Studies on Naturally Occurring Zeolites from Nevada, New Mexico, and Arizona. Processes 2021, 9, 1238. [Google Scholar] [CrossRef]
  24. Wang, T.; Yu, H.; Bian, B.; Liu, Y.; Liu, S.; Yu, S.; Wang, Z. One-Pot Synthesis of Anthraquinone Catalyzed by Microwave Acetic Acid Modified Hβ Zeolite. Catal. Lett. 2020, 150, 3007–3016. [Google Scholar] [CrossRef]
  25. Yi, F.; Xing, M.; Cao, J.-P.; Guo, S.; Yang, Y. Comparison of Brønsted Acidic Silanol Nests and Lewis Acidic Metal Sites in Ti-Beta Zeolites for Conversion of Butenes. Catalysts 2024, 14, 749. [Google Scholar] [CrossRef]
  26. Qi, K.; Gao, L.; Li, X.; He, F. Research Progress in Gas Separation and Purification Based on Zeolitic Materials. Catalysts 2023, 13, 855. [Google Scholar] [CrossRef]
  27. Tanirbergenova, S.; Tagayeva, A.; Rossi, C.O.; Porto, M.; Caputo, P.; Kanzharkan, E.; Tugelbayeva, D.; Zhylybayeva, N.; Tazhu, K.; Tileuberdi, Y. Studying the Characteristics of Tank Oil Sludge. Processes 2024, 12, 2007. [Google Scholar] [CrossRef]
  28. Sadenova, M.A.; Abdulina, S.A.; Tungatarova, S.A. The use of natural Kazakhstan zeolites for the development of gas purification catalysts. Clean Technol. Environ. Policy 2016, 18, 449–459. [Google Scholar] [CrossRef]
  29. Aitugan, A.N.; Tanirbergenova, S.K.; Tileuberdi, Y.; Yucel, O.; Tugelbayeva, D.; Mansurov, Z.; Ongarbayev, Y.K. A carbonised cobalt catalyst supported by acid-activated clay for the selective hydrogenation of acetylene. React. Kinet. Mech. Catal. 2021, 133, 277–292. [Google Scholar] [CrossRef]
  30. Król, M.; Dechnik, J.; Szymczak, P.; Handke, B.; Szumera, M.; Stoch, P. Thermal Behavior of Clinoptilolite. Crystals 2024, 14, 646. [Google Scholar] [CrossRef]
  31. Cadar, O.; Senila, M.; Hoaghia, M.-A.; Scurtu, D.; Miu, I.; Levei, E.A. Effects of Thermal Treatment on Natural Clinoptilolite-Rich Zeolite Behavior in Simulated Biological Fluids. Molecules 2020, 25, 2570. [Google Scholar] [CrossRef] [PubMed]
  32. Li, J.; Gao, M.; Yan, W.; Yu, J. Regulation of the Si/Al ratios and Al distributions of zeolites and their impact on properties. Chem. Sci. 2023, 14, 1935–1959. [Google Scholar] [CrossRef]
  33. Alhassan, A.M.; Tanimu, A.; Yusuf, B.O.; Siddiqui, M.A.B.; Aitani, A.; Alhooshani, K.R.; Ganiyu, S.A. Insights into Si/Al ratios for enhanced performance of β-zeolites in thermocatalytic cracking of crude oil to light olefins. J. Energy Inst. 2024, 117, 101792. [Google Scholar] [CrossRef]
  34. Zahid, M.; Doszhanov, Y.; Saurykova, K.; Ahmadi, N.; Bolatova, D.; Kurmanbayeva, M.; Aydarbek, A.; Ihsas, R.; Seitzhanova, M.; Akhmetzhanova, D.; et al. Modification and Application of Natural Clinoptilolite and Mordenite from Almaty Region for Drinking Water Purification. Molecules 2025, 30, 2021. [Google Scholar] [CrossRef]
  35. Kuldeyev, E.I.; Orynbekov, Y.S.; Mansurov, Z.A.; Nurlybayev, R.E.; Zhumadilova, Z.O.; Murzagulova, A.A. Applicability of Zeolite from the Daubabinsk and Chankanai Deposits as a Sorbent for Natural Waters. Water 2023, 15, 2231. [Google Scholar] [CrossRef]
  36. Tsitsishvili, V.; Dolaberidze, N.; Mirdzveli, N.; Nijaradze, M.; Dzhakipbekova, N.; Harutyunyan, L.; Amiridze, Z.; Khutsishvili, B. Acid treatment of Georgian, Kazakhstani and Armenian natural heulandite-clinoptilolites II. Adsorption and porous structure. In Proceedings of the 6th ISPC «International Scientific Discussion: Problems, Tasks and Prospects», Brighton, UK, 19–20 March 2023. [Google Scholar] [CrossRef]
  37. Cui, T.-Y.; Rajendran, A.; Fan, H.X.; Feng, J.; Li, W.Y. Review on Hydrodesulfurization over Zeolite-Based Catalysts. Ind. Eng. Chem. Res. 2021, 60, 3295–3323. [Google Scholar] [CrossRef]
  38. Khare, R.; Weindl, R.; Kim, S.; Kovarik, L.; Jentys, A.; Reuter, K.; Lercher, J.A. Hydrogen Activation on Zeolite Stabilized Ni–Mo Sulfide Clusters. JACS Au 2025, 5, 890–901. [Google Scholar] [CrossRef] [PubMed]
  39. Wei, F.; Guo, X.; Bao, W.; Chang, L.; Liao, J. Metal Modified NaY Zeolite as Sorbent for the Ultra-Deep Removal of Thiophene in Simulated Coke Oven Gas. Energies 2022, 15, 2620. [Google Scholar] [CrossRef]
  40. Boukoberine, Y.; Boudjema, H. Thiophene hydrodesulfurization over CoMo/Al2O3-CuY catalysts: Temperature effect study. Arab. J. Chem. 2011, 9, S522–S527. [Google Scholar] [CrossRef]
Figure 1. Schematic of acid-activated zeolite: removal of exchangeable cations (Na+, K+, Ca2+).
Processes 13 02896 g001
Figure 2. X-ray Diffractograms of the Natural and Modified Treated Zeolite Samples. Spectra are normalized and vertically offset for clarity.
Processes 13 02896 g002
Figure 3. FTIR Spectra of the Natural and Treated Zeolite Samples: (a) spectra in the 4500–2000 cm−1 region; (b) spectra in the 2000–500 cm−1 region.
Processes 13 02896 g003
Figure 4. BJH (Desorption) Pore Volume and pore size distribution of the Natural and Treated Zeolite Samples. Inset shows magnified view of the small mesopore region (2–6 nm).
Processes 13 02896 g004
Figure 5. Micropore volume of natural and treated zeolite samples determined by DR and DA methods.
Processes 13 02896 g005
Figure 6. TGA/DSC analysis of the Natural and Treated Zeolite Samples: (a) NZ; (b) Z–MIX-280.
Processes 13 02896 g006aProcesses 13 02896 g006b
Figure 7. Micrographs of the natural and treated zeolite samples: (a)—NZ; (b)—Z–HNO3; (c)—Z–HNO3-600; (d)—Z–MIX-280.
Processes 13 02896 g007aProcesses 13 02896 g007b
Figure 8. Thiophene conversion (%) over NZ and Z–MIX-280 at different temperatures (180–380 °C) under H2 (3 mL/min) and thiophene feed (9 mL/min, 25 atm, 25 min).
Processes 13 02896 g008
Figure 9. Schematic representation of the HDS experimental reactor setup.
Processes 13 02896 g009
Table 1. Semi-quantitative phase composition of natural and acid-activated zeolites (XRD analysis).
SamplePhases IdentifiedSemi-Quantitative Composition (wt.%)
NZ (Natural zeolite)NaAlSi3O8, SiO2, KAlSi3O8, Na0.3Fe2Si4O10(OH)2·4H2O, Fe2O335.8, 23.9, 19.1, 15.6, 5.6
Z–HNO3(Ca,Na)23Al3(Al,Si)2Si13O36·12H2O (heulandite), SiO2, NaAlSi3O8, B-containing phase, Fe2O343, 20, 14, 16, 6
Z–HNO3-600(Na,Ca)Al(Si,Al)3O8, SiO2, KAlSi3O8, NaAlSi3O8, Fe2O348, 22, 24, 18, 6
Z–MIX-280NaAlSi3O8, KAlSi3O8, Na0.3Fe2Si4O10(OH)2·4H2O, SiO2, Fe2O353, 23, 11, 9, 4
Note: All crystalline phases were identified by comparison of d-values with the ICDD PDF-4+ database, confirming clinoptilolite (ICDD 00-034-1381) as the dominant phase in all samples. The error margin for the semi-quantitative evaluation is estimated at ±3 wt.%.
Table 2. Comparison of experimental XRD data of natural and modified zeolites with reference clinoptilolite (JCPDS #39-1383).
2θ (°) JCPDShklRel. Int. JCPDS (%)2θ (°) NZRel. Int. NZ (%)2θ (°) Z–HNO3Rel. Int. Z–HNO3 (%)2θ (°) Z–HNO3-600Rel. Int. (%) Z–HNO3-6002θ (°) Z–MIX-280Rel. Int. (%) Z–MIX-280
9.8(020)100 9.7944
11.2(110)20 11.1828
19.7(111)3519.74119.733819.723319.7741
22.4(400)6021.965222.327921.994221.9750
26.6(402)4026.5910026.6310026.6210026.57100
27.9(511)3527.96927.968327.917027.8565
29.9(222)3029.823829.896529.814029.8141
33.1(440)2533.134233.154433.173533.1341
36.5(600)1536.53236.482836.532536.4530
Table 3. Main FTIR bands of natural and modified zeolite samples.
Wavenumber (cm−1)AssignmentSamples Observed
3800–3300O–H stretching (water, hydroxyl groups)All (more intense in modified samples)
~1640H–O–H bending (adsorbed water)Stronger in Z–HNO3, reduced after heating
1030–1032Asymmetric Si–O–Si/Si–O–Al stretchingAll samples
799–787Symmetric stretching of tetrahedral unitsAll samples
645–616Framework bending vibrationsAll samples
2400–2300CO2 background interference (not structural)All spectra (artifact)
Table 4. Textural properties of the natural and modified zeolite samples.
SampleBET
SSA (m2/g)
DR Micropore
SSA (m2/g)
DR Micropore
Volume (cm3/g)
DA Micropore
Volume (cm3/g)
DR Avg.
Pore Diameter (nm)
Average
Pore Diameter (4V/A, nm)
NZ4.95 ± 0.255.91 ± 0.300.002 ± 0.0010.005 ± 0.0012.09 ± 0.1015.99 ± 0.80
Z–HNO359.86 ± 2.9967.98 ± 3.400.024 ± 0.0010.033 ± 0.0011.36 ± 0.073.26 ± 0.16
Z–HNO3-60019.39 ± 0.9721.09 ± 1.050.026 ± 0.0010.015 ± 0.0011.75 ± 0.096.21 ± 0.31
Z–MIX-28048.07 ± 2.4054.50 ± 2.730.027 ± 0.0010.019 ± 0.0011.52 ± 0.083.84 ± 0.19
Note. All values are reported as mean ± standard deviation (n = 3). For example, the BET SSA of sample Z–HNO3 is 59.86 ± 1.79 m2/g, where the absolute error equals the standard deviation (Δx = 1.79 m2/g), and the relative error is calculated as δx = (1.79/59.86) × 100% ≈ 2.99%.
Table 5. Elemental composition (wt.%) of natural and treated zeolite samples.
SamplePhase Composition, wt.%
Al2O3SiO2Fe2O3MgONa2OK2OCaOTiO2H2OTotal
NZ15.162.25.83.65.82.14.10.70.6100.0
Z–HNO316.771.42.92.282.61.52.10.020.5100.0
Z–HNO3-60018.273.52.11.92.21.11.90.010.09100.0
Z–MIX-28020.276.040.60.80.70.70.90.010.05100.0
Notes: Analytical uncertainties for all measured oxides are within standard limits ±0.1–0.5 wt.% for oxides.
Disclaimer/Publisher’s Note: The statements, opinions and data contained in all publications are solely those of the individual author(s) and contributor(s) and not of MDPI and/or the editor(s). MDPI and/or the editor(s) disclaim responsibility for any injury to people or property resulting from any ideas, methods, instructions or products referred to in the content.