1. Introduction
In petroleum and natural gas engineering, the wellbore serves as the critical flow conduit connecting subsurface reservoirs to surface production systems. The flow behavior of fluids within the wellbore fundamentally governs key production dynamics (e.g., production rates, pressure profiles, and water cut) of oil and gas wells. The production characteristics of the well, the efficacy of production strategies, and the overall production potential of the well system are directly controlled by the multiphase flow behavior in the wellbore.
Engineers rely on in-depth understanding of multiphase flow physics to establish mathematical models for simulation, aiming to elucidate inherent flow mechanisms and guide optimal production parameter adjustments and scientifically sound production strategies. Consequently, the accurate characterization and profound comprehension of multiphase flow behavior in wellbores constitute the essential scientific foundation and decisive factors for the effectiveness of production optimization and real-time control strategies in oil and gas wells.
Currently, conventional wellbore flow simulation methods in the petroleum industry are predominantly based on traditional multiphase flow theoretical models. While these approaches can achieve reasonable accuracy within specific scenarios, their reliance on static empirical correlations or correction coefficients inherently limits their applicability. Static parameter systems inherently fail to capture dynamic nonlinearities. Consequently, when production conditions exceed their applicable ranges (e.g., as the abrupt gas–liquid ratio increases during late-stage gas production, fluid composition shifts due to intermittent sand production in offshore wells or flow rate step-changes induced by intelligent completion devices), significant deviations arise between calculated results and actual production processes. This severely compromises the reliability of critical decisions including liquid loading warnings and artificial lift optimization.
Digital twin technology offers a promising solution to these challenges. By integrating downhole sensor networks with real-time data assimilation, it creates a dynamic model of wellbore flow conditions. This approach continuously adjusts the simulation results based on measured data from downhole monitoring points during production.
The core of this technology lies in establishing a closed-loop “measurement-calibration-optimization” feedback system. A fitting model with advanced algorithms continuously ingests real-time pressure, temperature, and flow rate data streams from downhole sensors, then dynamically calibrates and updates key model parameters, enhancing computational accuracy.
This dynamic fitting process represents an evolutionary advancement over static multiphase flow models, transcending limitations of fixed empirical formulas or single correction coefficients [
1,
2]. It enables real-time adaptation to complex, time-varying downhole conditions, ensuring a closer alignment between simulations and actual behavior. The concept of dynamic model fitting and optimization based on real-time data has been extensively researched and validated in petroleum engineering.
In 2010, Zheng and Xu investigated anomalous bottomhole pressure increases during pressure transient tests in high water-cut oilfields. After excluding the production rate and interference effects, they focused on multiphase flow impacts, deriving a new equation from Darcy’s law to improve fitting accuracy [
3]. In 2011, Torres-Verdín et al. applied three dimensional (3D) multiphase flow methods to field data, evaluating uncertainties in the permeability estimation caused by wellbore deviation, oil-based mud (OBM) filtrate viscosity, and invasion radius [
4].
In 2012 Wang analyzed the accuracy of different computational models in PIPEPHASE software and used a nonlinear solver to fit the Beggs & Brill-Moody (BBM) model, significantly reducing errors compared to measured data [
5]. In 2014, Solvang et al. use history-matched actual cleanout data from a long horizontal well in the Oseberg Field, revealing that conventional modeling often underestimates cleanout time due to overly conservative pressure estimating [
6]. Liu and Chen developed correction formulas for gas wells in the Daniudi Field by fitting flowing models in PIPESIM software [
7].
In 2017, Trzeciak et al. compared power-law, logarithmic, and Prony series methods for fitting shale creep data, demonstrating Prony’s superior accuracy [
8]. In 2019, Gao et al. proposed a fluid–solid interaction method with unified shape matching [
9]. In 2022, Wang et al. introduced the two dimensional general purpose simulator-powered network model (GPSNet-2D) surrogate model for rapid steam flood optimization [
10].
In 2024, Ren et al. applied a novel physics-based, data-driven surrogate model to manage waterflooding in a 1000+ well field [
11]. Johansson et al. improved multiphase models using real condensate data from Norwegian fields [
12]. Lin et al. developed Random Sampling Consensus–Maximum Projection (RANSAC-MP) for robust fracture plane fitting in noisy microseismical data [
13].
However, existing dynamic fitting methods continue to face technical bottlenecks, primarily characterized by high-frequency data dependency and coarse parameter updating strategies. Traditional static fitting methods inherently lack timeliness [
6,
14,
15]. Data-driven dynamic fitting models typically require hourly or even minute-/second-level update frequencies. Yet, in practical oilfield operations, constrained by testing costs and data transmission bandwidth, key parameters are typically collected at intervals ranging from several hours to days [
16]. Most current physics-based dynamic fitting approaches employ a full-parameter update strategy. This method struggles to achieve effective fitting when data frequency is insufficient to meet requirements or when recent measured data is absent due to interruptions. Furthermore, under conditions of data anomalies, the strategy’s failure to account for the continuity of historical states leads to overfitting and prediction oscillations.
Against this backdrop, there is an urgent need to develop a dynamic fitting method that integrates physical mechanisms with adaptability to low-frequency, real-time data. This study proposes an approach that incorporates an exponentially weighted dynamic parameter updating mechanism to address the imbalance issue between stability and accuracy that arises when traditional, commonly used fitting models are applied to data with noise. By dynamically integrating historical information with the most recent data, the method achieves fitting results that balance high accuracy with strong stability.
2. Wellbore Multiphase Flow Theoretical Model
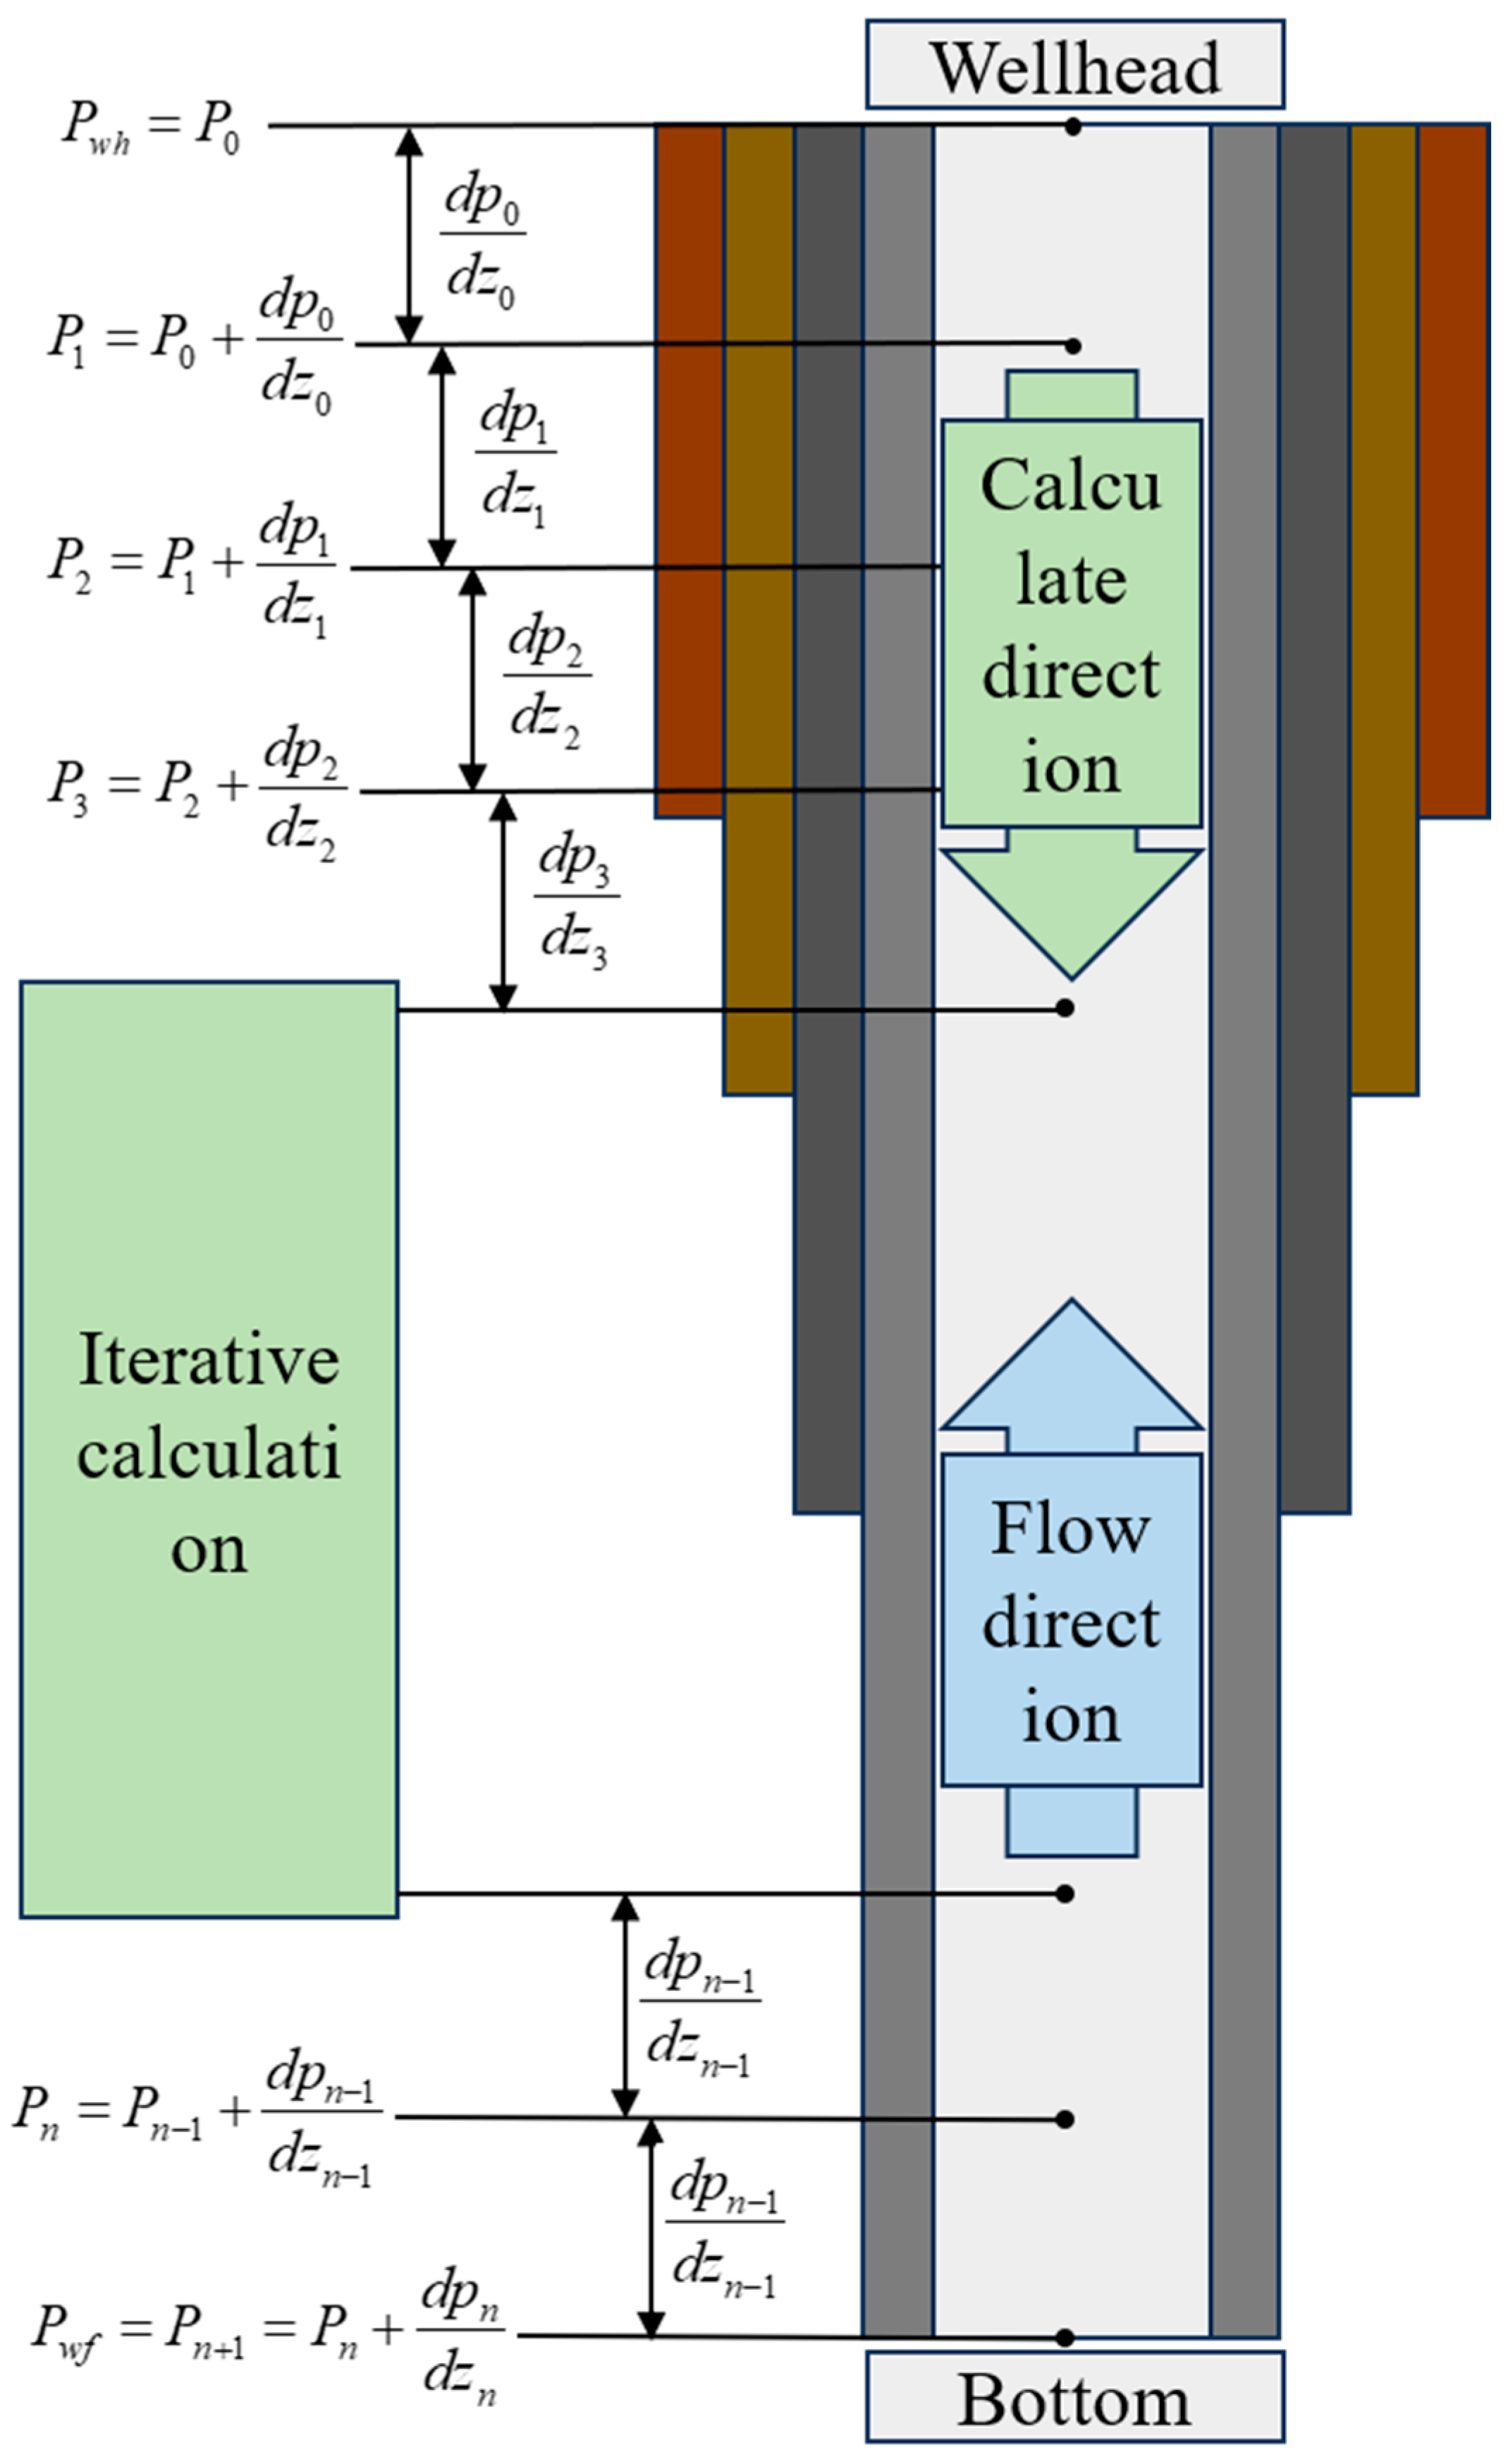
Wellbore multiphase flow dynamics form the computational foundation governing oil and gas production systems. The mathematical model integrates mass–momentum–energy conservation equations to characterize gas–liquid multiphase behavior in wells. Current industry-standard design methodologies predominantly employ semi-empirical approaches. These derive theoretical frameworks from laboratory-calibrated correlations of critical parameters, establishing experimentally grounded models engineered for production design applications. These methods calculate the flow profile of the wellbore by means of discretization.
As
Figure 1, the computational process involves calculating the pressure gradient for each segment. Iterative computations yield the pressure at the opposite endpoint and the complete pressure profile along the wellbore.
2.1. Multiphase Flow Theoretical Framework
Conventional multiphase flow models consider the oil–gas–water three-phase flow in inclined pipes. The fundamental governing equations are expressed as follows:
Momentum equation:
where
are the density, volume fraction (holdup), and velocity vector of phase
(oil, gas, and water), respectively;
is the interphase mass exchange source term; and
are viscous drag and interphase force terms.
In industrial applications, transient terms (
) and acceleration terms (
) are often neglected, simplifying the system to a steady-state pressure gradient equation. The total pressure gradient is formulated as follows:
In the calculation of pressure drop, temperature influences fluid properties. A theoretical model for the temperature gradient calculation is synchronously constructed. For a steady-state flow, the energy balance can be expressed as follows [
17,
18]:
where
is total heat transfer coefficient per unit length of wellbore, W/(m·°C),
= 13.654 W/(m·K), and the thermal conductivity of the mixture is 0.19 W/(m·K);
is ambient temperature, °C;
is the temperature of fluid in the wellbore, °C;
is the specific heat capacity of fluid at constant pressure, J/(kg·K),
= 2300 J/(kg·K);
is the mixed fluid mass flow rate, kg/s; and
is the angle between the wellbore and the horizontal direction, °.
This gradient decomposes into three components: gravitational, frictional, and acceleration terms. These elements directly determine segmental pressure calculations and consequently govern the wellbore pressure profile. Most multiphase flow models build upon this foundational framework.
Widely adopted models include the Beggs & Brill Model [
19], Duns & Ros Model [
20], Hagedorn & Brown Model [
21], Orkiszewski Model [
22], Aziz–Govier–Fogarasi Model [
23], Ansari Model [
24], and so on.
2.2. Foundation Theoretical Model Construction
The dynamic fitting methodology proposed in this study is built upon theoretical models for wellbore multiphase flow calculations.
The theoretical model is established based on conventional general black-oil models. Black-oil models simplify complex hydrocarbon systems into three pseudo-components: oil, gas, and water, and assume a simple dissolution and exsolution relationship between the oil and gas phases while neglecting detailed compositional phase behavior changes.
In the calculation of the wellbore multiphase flow pressure drop, bottomhole pressure fluctuations will have significant impact in the computational process [
25]; it is crucial to account for the impact. The wellbore multiphase flow model developed in this study is based on a steady-state approach, which assumes that bottomhole fluctuations stabilize around a fixed value. Compared to transient models, the steady-state model maintains sufficient accuracy while significantly reducing computational time, thereby providing a responsive foundation for the dynamic fitting framework.
Within this framework, taking the Beggs–Brill model as an example to establish the basic theoretical model, owing to its well-established maturity and broad acceptance in calculating pressure gradients in wellbores. The Beggs–Brill model is capable of effectively adapting to various well types discussed in this paper, including both flowing wells and artificial lift wells such as those equipped with electrical submersible pumps.
In the Beggs–Brill model, the wellbore flow is divided into four different flow patterns (
Table 1).
Where boundary parameters
are determined empirically:
The no-slip liquid holdup
is defined as follows:
The Froude number
is given by
where
is the gravitational acceleration, 9.8 m/s
2;
is the pipe diameter, m; and
denote mixture, liquid, and gas velocities, m/s. The mixed-flow velocity values for each well are different. In the study, the range of
is between 0.194 and 0.633 m/s.
The steady-state pressure gradient calculation is
where
is the pressure, Pa;
is the flow path length, m.
Gravitational pressure gradient:
With liquid density:
where
is the dimensionless liquid holdup factor, determined by
Table 2;
is the water cut of liquid; and
are mixture, liquid, gas, and water densities, kg/m
3. The density values differ for each well: The oil density falls within the range of 0.84 × 10
3 to 0.96 × 10
3 kg/m
3, the water density is 1 × 10
3 to 1.02 × 10
3 kg/m
3, the gas density is 0.64 × 10
3 to 0.95 × 10
3 kg/m
3, and the viscosity range of the mixture is 12.5 to 205.3 mPa·s. The water cut varies from 0% to 40.74%.
Frictional pressure gradient:
where
is the two-phase friction factor (dimensionless).
Acceleration pressure gradient:
As this theoretical model serves solely as the fitting foundation, detailed derivations of internal components are omitted.
3. Dynamic Fitting Methodology
3.1. Determination of Fitting Target Parameters
The foundational theoretical model identifies target parameters for fitting to correct the total pressure gradient. The fitted pressure drop
is expressed as follows:
This iterative curve-fitting process is illustrated in
Figure 2. During fitting, the pressure drops (
) for the segment following the current pressure point
are corrected. The corrected pressure drop enables the calculation of the subsequent pressure point
.
Directly fitting the total pressure gradient exhibits inherent opacity and may lead to non-convergence when measurement points are sparse or erroneous [
15]. To address this, we decompose the total pressure gradient into constituent terms. The fitted theoretical equation becomes
The fitted theoretical equation uses
to represent any parameter in the original formula;
represents the parameter
with the fitted coefficient added:
The formula can be further simplified as follows:
based on inversion fitting using field production datasets from Block XX in a Southern China oilfield and employing Sobol global sensitivity analysis.
The Sobol method decomposes the variance of the model output into contributions from individual parameters and their interactions. The model output
is defined as
where
is the model output;
is the i-th input parameter. The first-order sensitivity index
for parameter
is defined as
where
is the total variance of
;
is the variance of the conditional expectation of
given
, representing the independent contribution of
. The total-order index
, which includes all interaction effects involving
, is given by
where
is the expectation of the conditional variance of
given
;
denotes all parameters except
.
The contribution rate of each parameter to the total pressure gradient was evaluated, considering both impact and modifiability. The result of the sensitivity analysis is shown in
Figure 3.
Sensitivity analysis revealed that
(friction factor) and
(mixture density) are significantly more suitable as fitting targets than other parameters.
is determined by
Therefore,
and
are selected as the target parameters, establishing the fitting theoretical model:
Given that the acceleration term has a negligible impact on the overall pressure gradient calculation, it can be simplified as follows:
3.2. Optimization Method of Fitting
The multiphase flow fitting is fundamentally a nonlinear optimization problem, aiming to minimize the discrepancy between model-calculated values and measured pressure data:
where
is the number of measurement points;
and
are the measured and calculated pressures at the i-th measurement point, respectively.
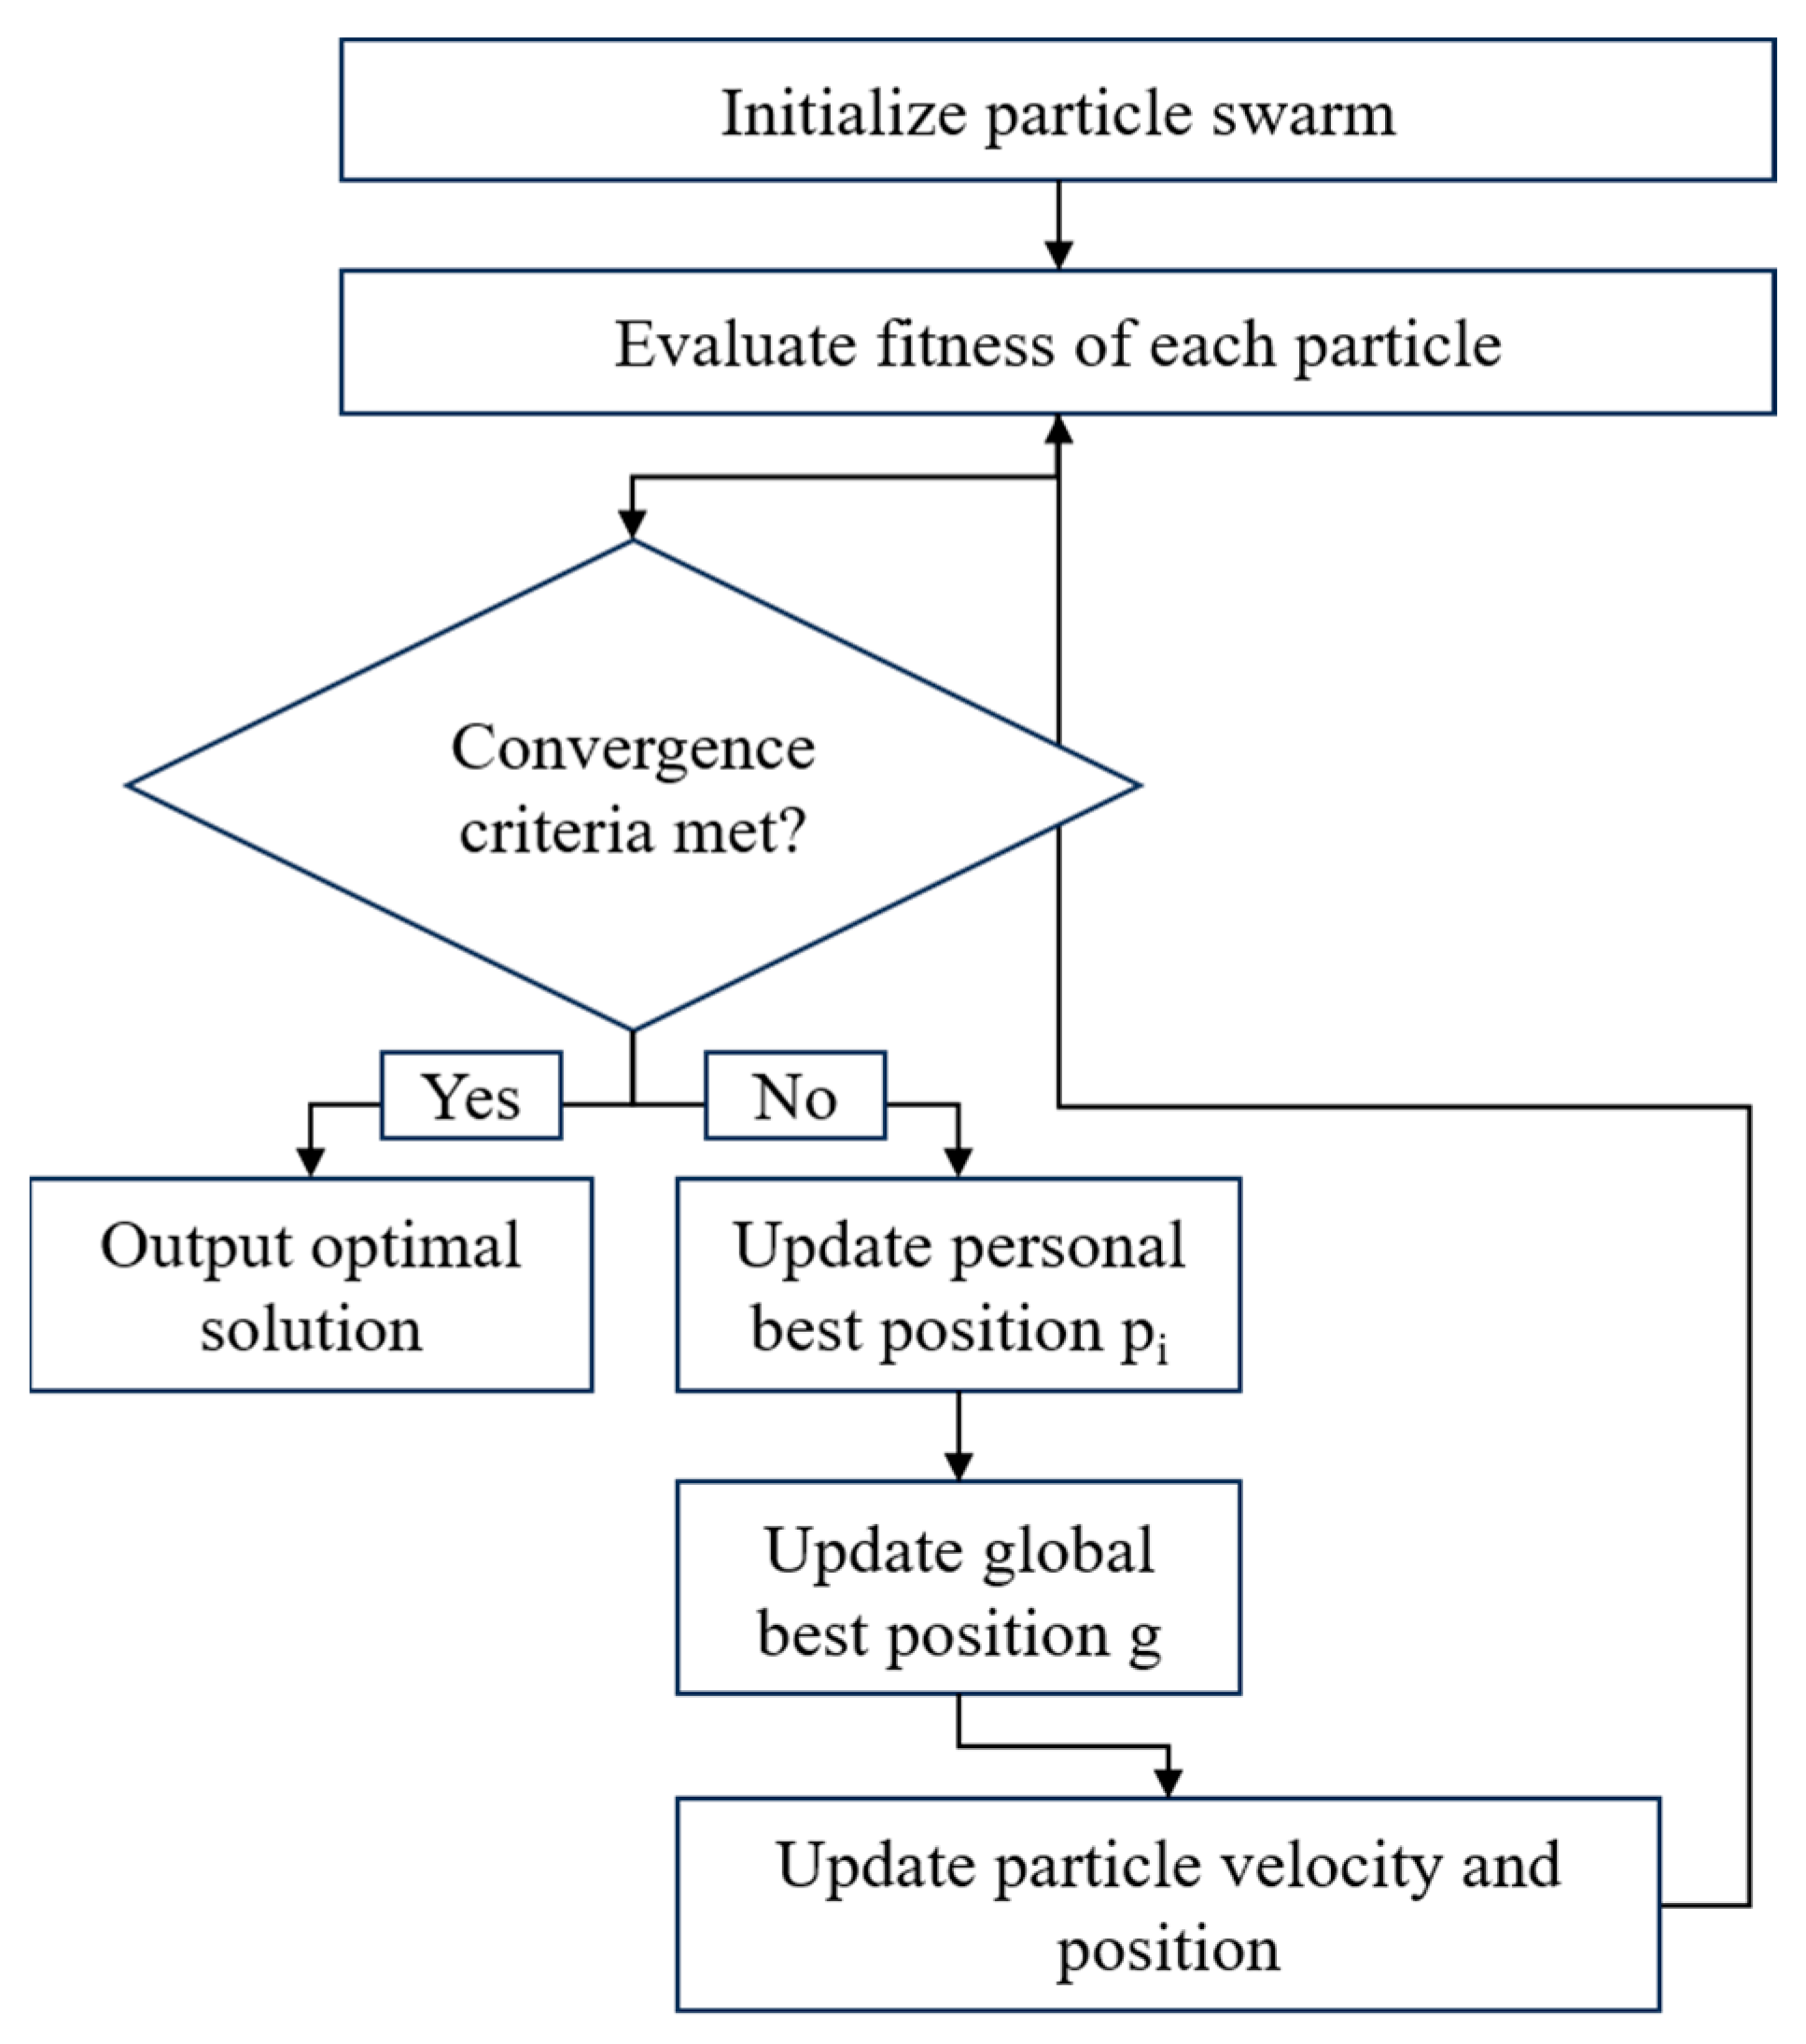
This study employs Particle Swarm Optimization (PSO) as the optimization algorithm within the fitting process. Particle Swarm Optimization is a global optimization technique based on swarm intelligence, efficiently searching for optimal solutions within the parameter space by simulating the information-sharing mechanism observed in bird flock foraging behavior. For the wellbore multiphase flow parameter fitting problem, the PSO algorithm achieves the precise fitting of key parameters
and
through swarm intelligence mechanisms:
where
are the position and velocity of particle
at iteration
;
is the historical best position of particle
;
is the global best position found by the swarm;
is the inertia weight;
are learning factors (cognitive and social coefficients); and
are random numbers.
The PSO-based fitting approach demonstrates a better adaptive adjustment of search strategies during the dynamic fitting of the wellbore multiphase flow, enabling the timely capture of parameter evolution trends. The implementation flowchart of the PSO algorithm is shown in
Figure 4:
Comparative analysis of the PSO algorithm against traditional fitting optimization algorithms using field production datasets from Block XX in a Southern China oilfield, with evaluation metrics including Time per Fit, Mean Absolute Percentage Error (MAPE), and Root Mean Square Error (RMSE) yielded the results shown in
Table 3.
Among the compared methods, the PSO algorithm demonstrated superior performance in both fitting speed and accuracy. Compared to other optimization methods, its swarm intelligence optimization mechanism effectively overcomes the limitations of traditional methods in dynamic scenarios, exhibiting a higher computational efficiency and stronger global search capability. This enables it to find the global optimum solution with fewer iterations.
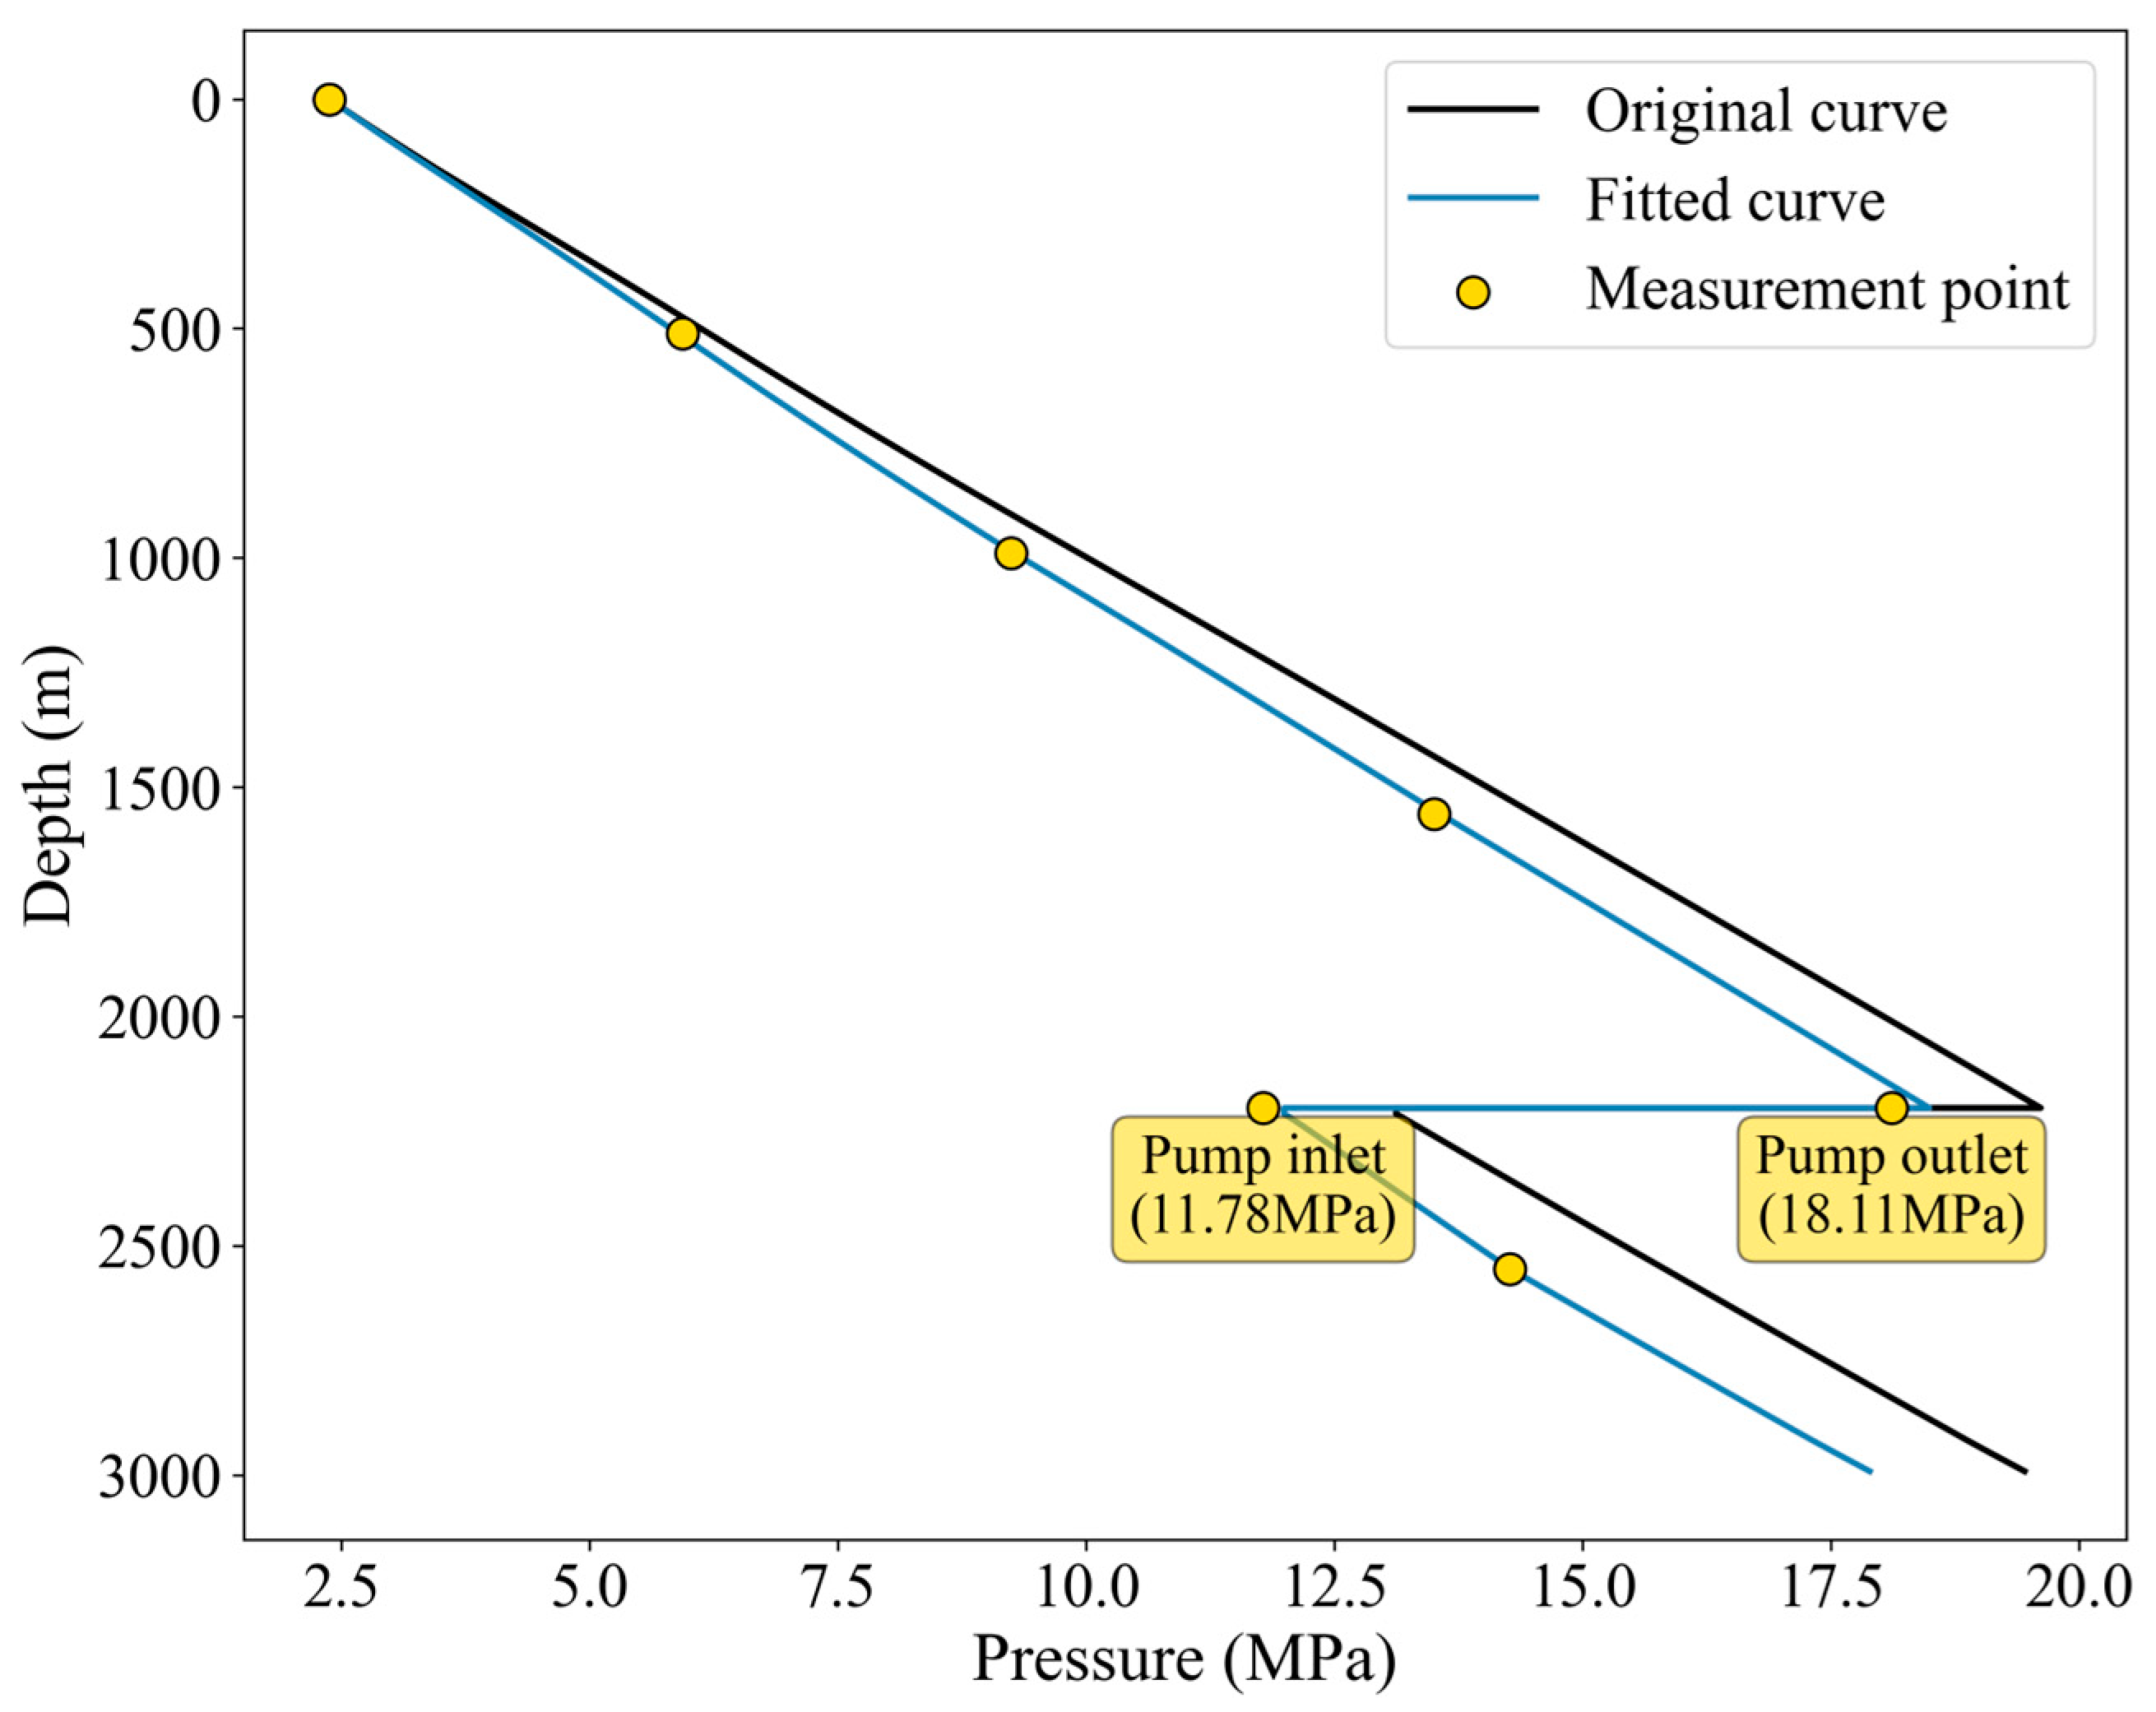
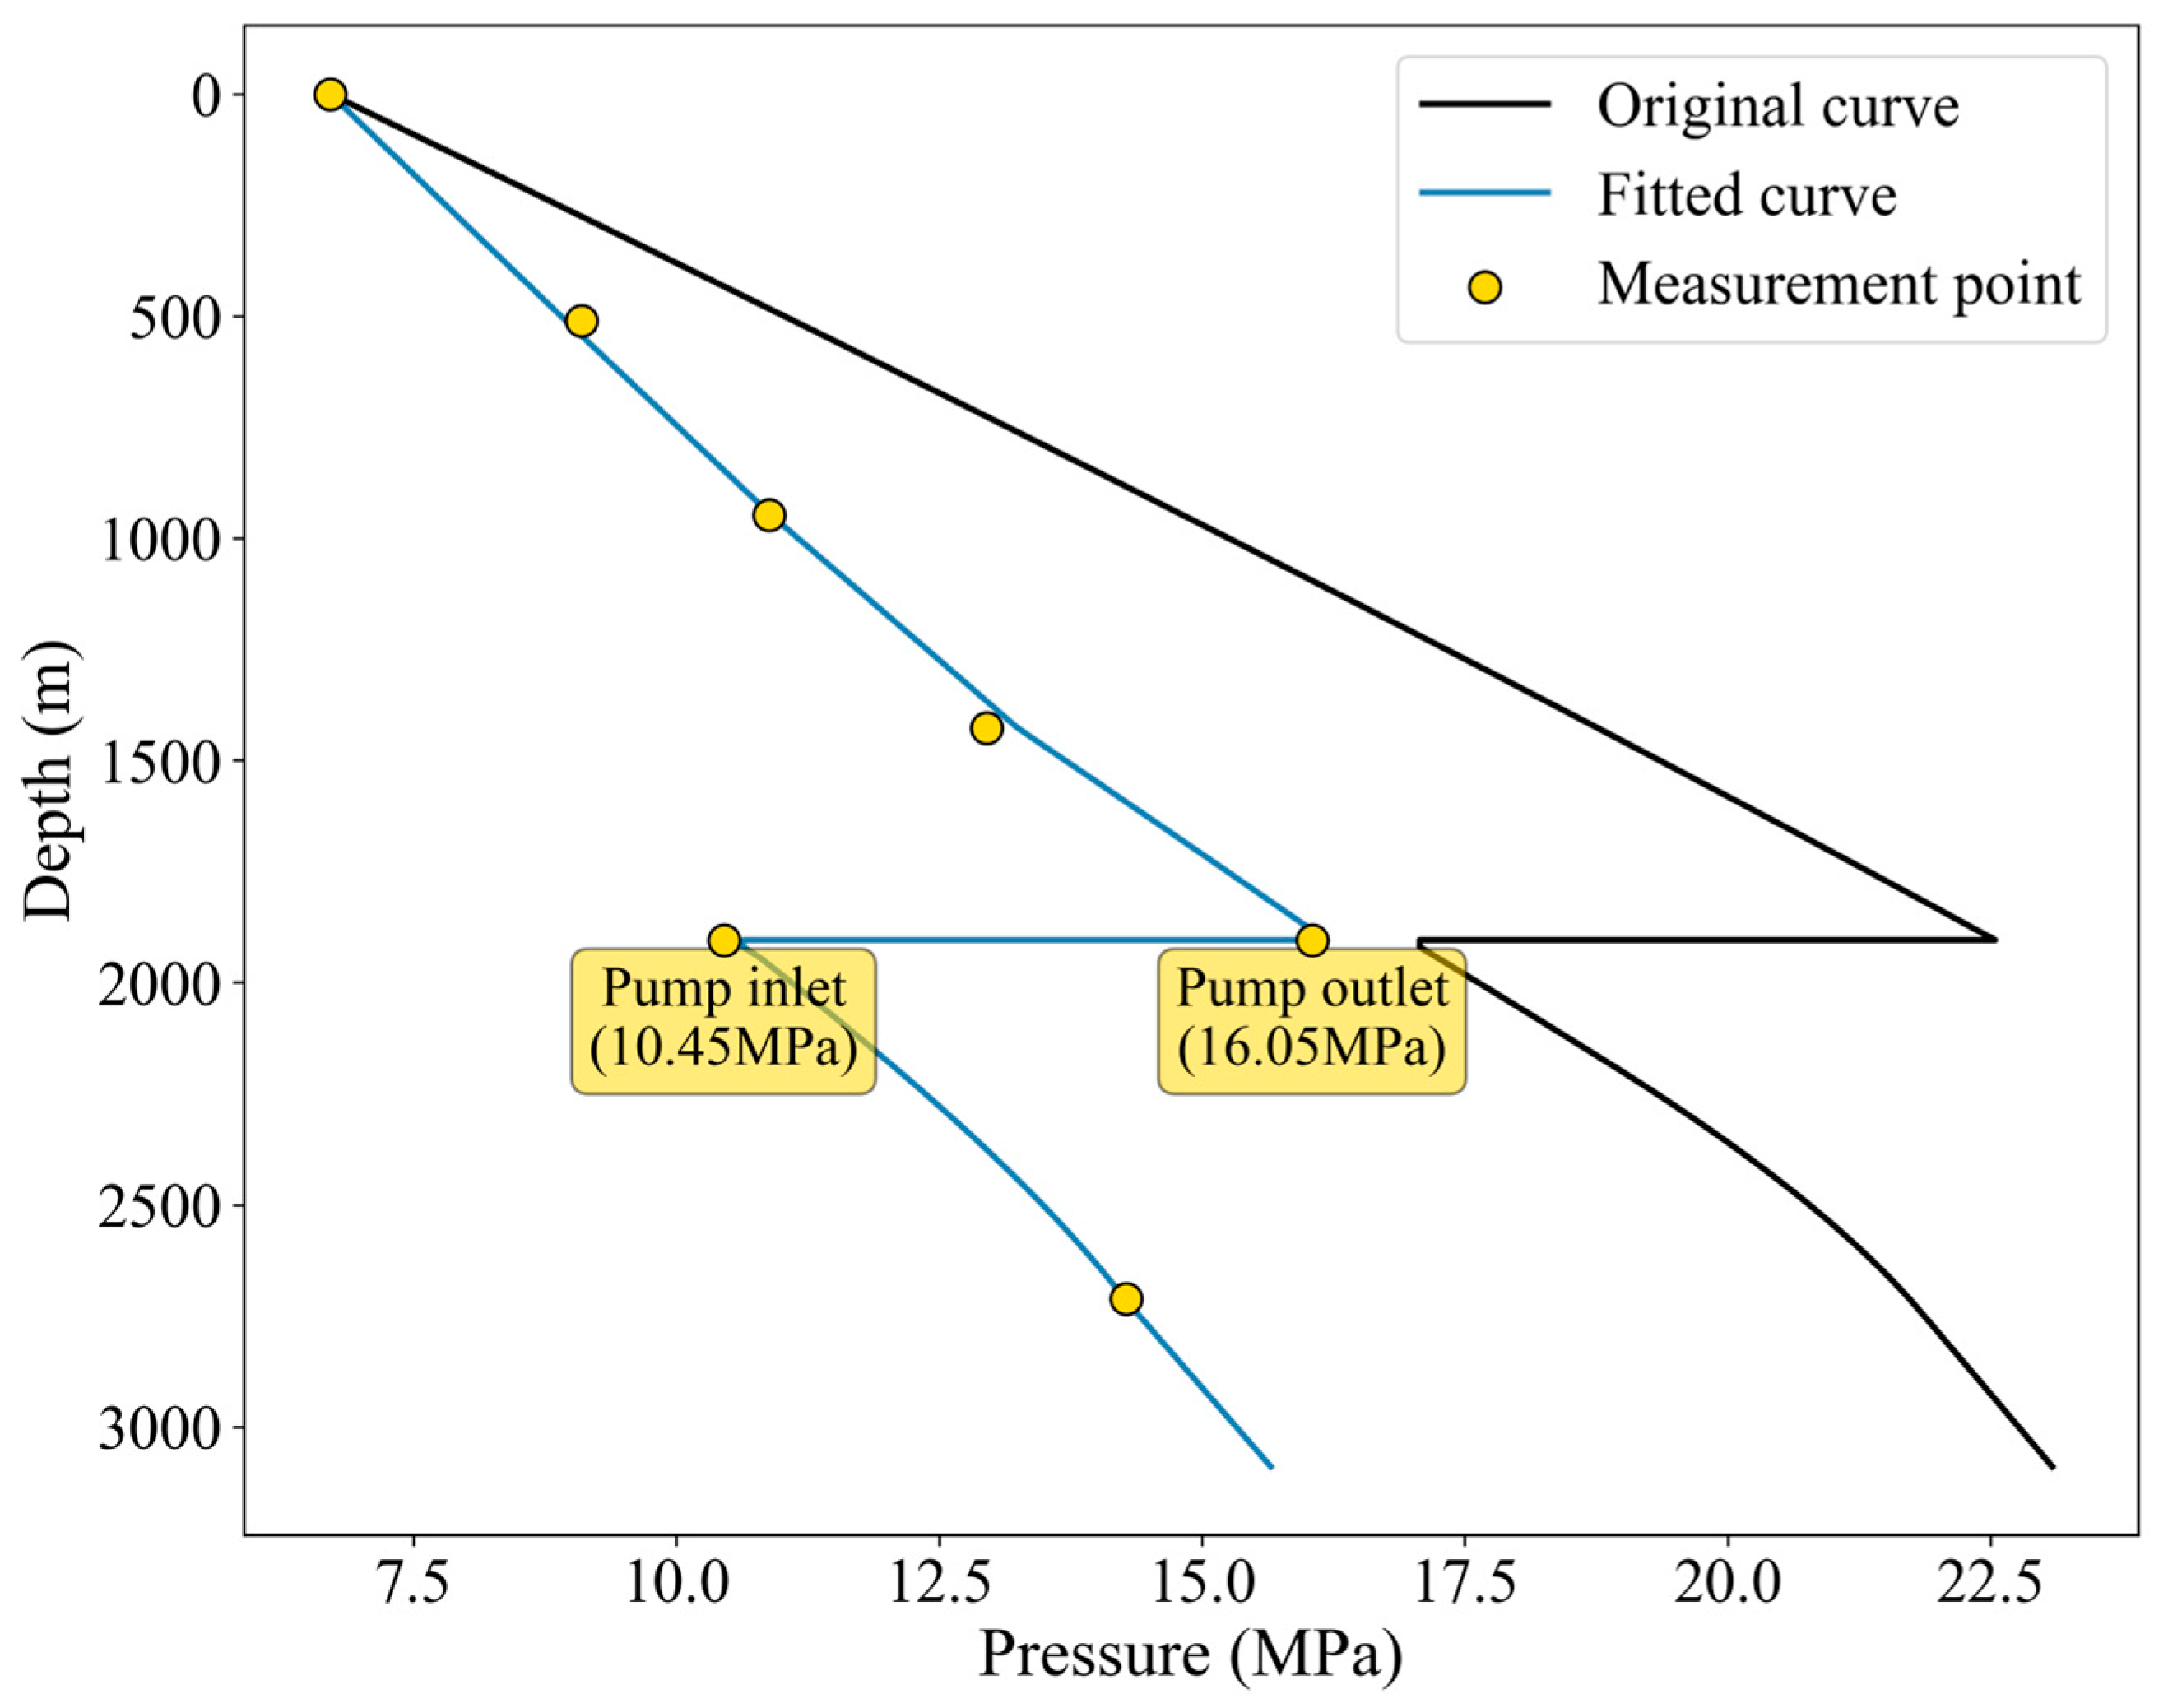
Applying the established fitting model to the data of two flowing well and two electrical submersible pump (ESP) wells in the production dataset of the XX Block in a southern oilfield in China were fitted. The measured depths of these wells vary from 2995.18 m to 3336.1 m, and the maximum inclination angles range from 0 rad to 1.153 rad—a range that covers most measured depths and maximum inclination angles found in wells throughout the XX Block. The fitting results for the flow profiles in flowing wells are shown in
Figure 5,
Figure 6,
Figure 7 and
Figure 8.
The fitting results for the flow profiles in ESP wells are shown in
Figure 7 and
Figure 8.
Figure 7.
Fitting result of pressure profile for ESP well XX25-6.
Figure 7.
Fitting result of pressure profile for ESP well XX25-6.
Figure 8.
Fitting result of pressure profile for ESP well XX23-5.
Figure 8.
Fitting result of pressure profile for ESP well XX23-5.
The fitted curves exhibit good agreement with the measurement points; the fitting method based on the PSO algorithm demonstrates good fitting capabilities in the fitting process of a single time step.
Moreover, the proposed methodology demonstrates strong generalizability across various well types and flow modeling frameworks. This broad applicability arises because the fitting process is essentially based on matching the computed wellbore pressure profile against measured data through the dynamic adjustment of target parameters, namely liquid holdup and the friction factor. As a result, the core fitting mechanism functions independently of the specific well type or flow modeling frameworks, maintaining robustness and universal applicability across diverse modeling conditions.
3.3. Dynamic Fitting Strategy
To cope with the challenges such as discontinuous data acquisition and the robustness of parameter updating in the dynamic fitting of wellbore multiphase flow, the dynamic fitting method employs an adaptive parameter updating mechanism based on the Exponentially Weighted Moving Average (EWMA).
The core objective of this strategy is to enhance model stability under typical disturbance scenarios while maintaining fitting accuracy, achieved by leveraging the historical state memory to weight incoming measurements. When data acquisition is interrupted due to transmission delays or extended testing intervals, traditional fitting methods fail to maintain a stable fitting performance, thus disrupting output continuity. During sensor noise interference or step-change transients, anomalous measurements induce non-physical parameter jumps that amplify prediction errors through the magnitude amplification of the fitted coefficient’s error. The EWMA-based dynamic fitting mechanism systematically mitigates these response lag and instability issues by integrating historical profiles with current measurements via exponential smoothing.
Define the dynamic fitting parameter set
as follows:
The parameter
update formula is
In the equation, denote the functional values of parameters at time , respectively; denotes the current parameter value obtained through real-time fitting; and is the smoothed value from the previous iteration. The coefficient is the smoothing factor.
The smoothing factor governs the weighting distribution between newly acquired data and historical data. As , the model operation exhibits increasing reliance on historical data dependency. Conversely, as , the smoothing process degenerates into a Full-Parameter Update strategy where historical states are disregarded. In the absence of new data arrivals, the model maintains operation using the persistent value .
3.4. Evaluation Metrics for Fitting Performance
To comprehensively evaluate the performance of the multiphase flow dynamics fitting method for wellbores, a dual evaluation system that takes into account both accuracy and robustness needs to be established. This paper defines the following two types of indicators: fitting accuracy evaluation metrics (MAPE, RMSE) and the fitting stability evaluation metric (MRCP of the fitting coefficients at the previous and subsequent time points).
Mean Absolute Percentage Error (MAPE):
Root Mean Square Error (RMSE):
Mean Relative Change Percentage of Fit Coefficient (MRCP-FC):
The MRCP-FC is used to calculate the average relative change in the fitted coefficients during dynamic fitting, aiming to evaluate the ability of different methods to remain stable during jumps induced by data interruptions or noise.
3.5. Parameter Settings for the Dynamic Fitting Model
The parameter configuration of the Particle Swarm Optimization (PSO) algorithm and the Exponentially Weighted Moving Average (EWMA) mechanism needs to strike a balance between algorithmic efficiency and engineering robustness. This section presents recommended parameter combinations through fitting based on the production dataset. Through cross-validation and historical data back testing, the recommended parameter combination is presented in
Table 4.
The smoothing factor is the core parameter of the EWMA mechanism. Its value needs to respond to data frequency and stability. The sampling interval in the dataset used in this study is 24 h, a frequency achievable by most oilfields in routine production operations. At this sampling frequency, leveraging the complete 180-Day dataset, an analysis was performed to evaluate the impact of different smoothing factors on both fitting accuracy and stability, with the results illustrated in
Figure 9.
As the smoothing factor α increases, the model’s MAPE and RMSE decrease, indicating a general improvement in fitting accuracy. Conversely, the MRCP-FC increases, reflecting a gradual reduction in stability due to a greater sensitivity to recent data fluctuations. The results demonstrate that a smoothing factor within the range of 0.3–0.5 strikes a balance between accuracy and stability for regular test data, with an optimal compromise achieved at = 0.4 for the current dataset. Therefore, a value of = 0.4 is adopted in the present study.
For high-quality and high-frequency (e.g., sampling interval < 1 h) data scenarios with a high signal-to-noise ratio, it is recommended to suitably increase the value of the smoothing factor (within the range of 0.6–0.8) to enhance the model’s sensitivity and confidence in the most recent data and improve fitting accuracy while maintaining stability. Conversely, for low-quality and high-noise data scenarios with a low signal-to-noise ratio, reducing the value of the smoothing factor (within the range of 0.1–0.2) can decrease sensitivity to recent anomalous data, thereby enhancing stability.
Table 5 proposes a scenario-based parameter adjustment strategy. The specific value of the smoothing factor should be tailored to the actual data characteristics to maintain an optimal balance between accuracy and stability.
4. Fitting Results and Evaluation
4.1. Comparative Analysis of Fitting Results
To rigorously benchmark the proposed exponentially weighted dynamic fitting method (Method C), we conducted systematic comparisons against two conventional strategies:
Static Single Fitting (Method A): Parameters were calibrated once via PSO using the initial measurement averages of the first 90 Days’ data, then fixed throughout subsequent computations. This emulates traditional static models dependent on historical correlations without online updating capacity.
Full-Parameter Update Fitting (Method B): Parameters were globally refitted with PSO upon acquiring new measurements; this strategy represents dynamic methods that pursue instantaneous optimal fitting but ignore historical state continuity.
The experimental dataset comprised historical production data from Block XX in an oilfield in Southern China, covering diverse artificial lift methods and production scenarios. A representative flowing well (XX23-5) was selected to analyze the temporal evolution of the fitting performance.
In the early stage (Day 45,
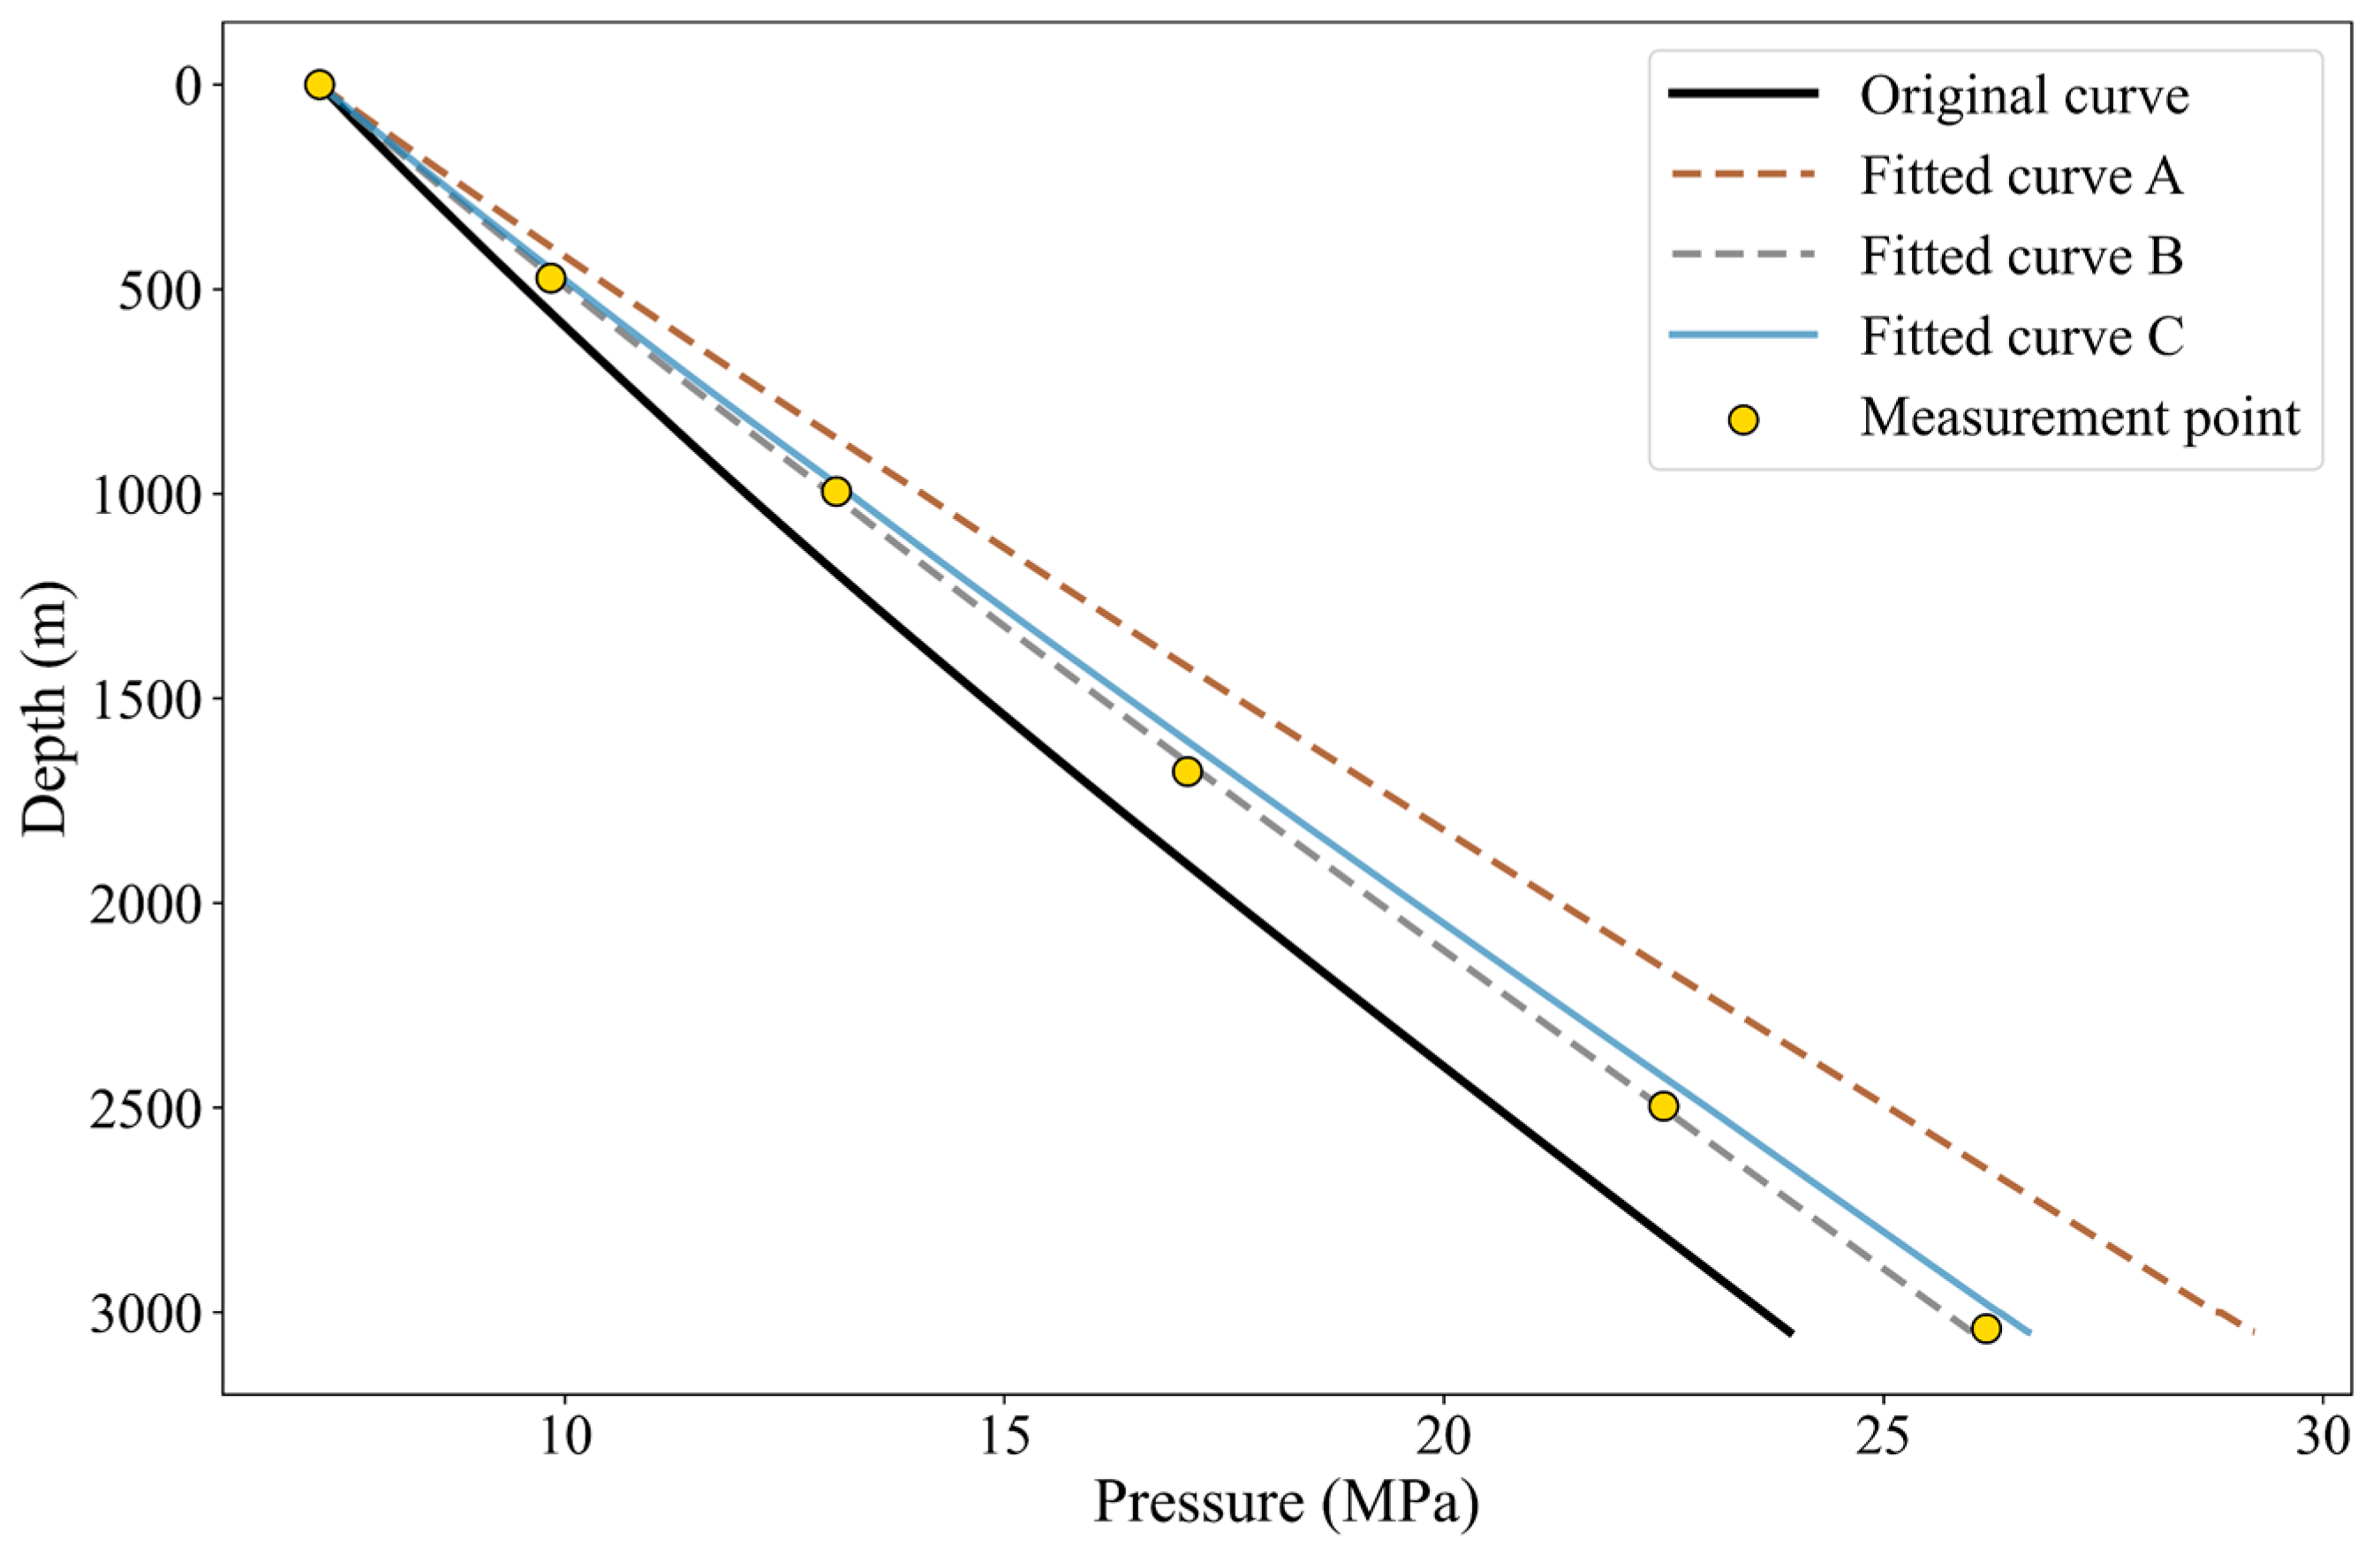
Figure 10), Method A exhibited minor deviations due to stable conditions near the initial fitting period. Method B achieved the highest instantaneous accuracy by using the current measurement point. Method C demonstrated comparable accuracy to Method B. As time went by, production moved on to the next stage (Day 90,
Figure 11); Method A showed systematic deviations, and the inflexibility of fixed parameters begins to become apparent. Method B maintained optimal instantaneous fitting. Method C also maintains a high level of accuracy. After a period of production that lasted for a long time (Days 135–180,
Figure 12 and
Figure 13), Method A’s deviations intensified significantly. Method B continued to deliver optimal instantaneous fits. Method C slightly lagged in pointwise accuracy but effectively tracked overall trends while preserving smoothness and continuity.
To comprehensively assess the performance of the three fitting methods when confronted with missing measured data, the fitting results under simulated data interruption conditions are examined.
Figure 14 illustrates the fitting performance of the three strategies at a time point lacking measured data. Fitted Curve B, reliant on the latest data point as input for its update, cannot perform a parameter update due to the absence of current data, resulting in no valid fitting output at this time point. In contrast, Fitted Curves A and C are less affected. Method A maintains its historical parameter set and outputs a fitting curve unaffected by the current data gap. Method C’s EWMA mechanism continues operation using its existing smoothed parameters when no new data is available.
Figure 15 includes measured data from a subsequent time point. The results demonstrate that the predictions from Method C during the data interruption period align more closely with the subsequent actual measurement point compared to Method A. This indicates that Method C, leveraging its historical memory, maintained a relatively higher predictive accuracy during the data gap.
Abnormal data is used to investigate the fitting performance of the three methods when they encounter obvious abnormal data points caused by sensor noise, transient interference or recording errors.
Figure 16 shows results under abnormal data conditions; the fitting curve generated by Method B displays a pronounced error result due to its susceptibility to the outlier data. Conversely, the other two strategies, by incorporating historical data, effectively mitigated the influence of the abnormal points.
4.2. Evaluation of Fitting Results
Based on the evaluation metrics, this study conducted a quantitative analysis of the performance of the three fitting methods.
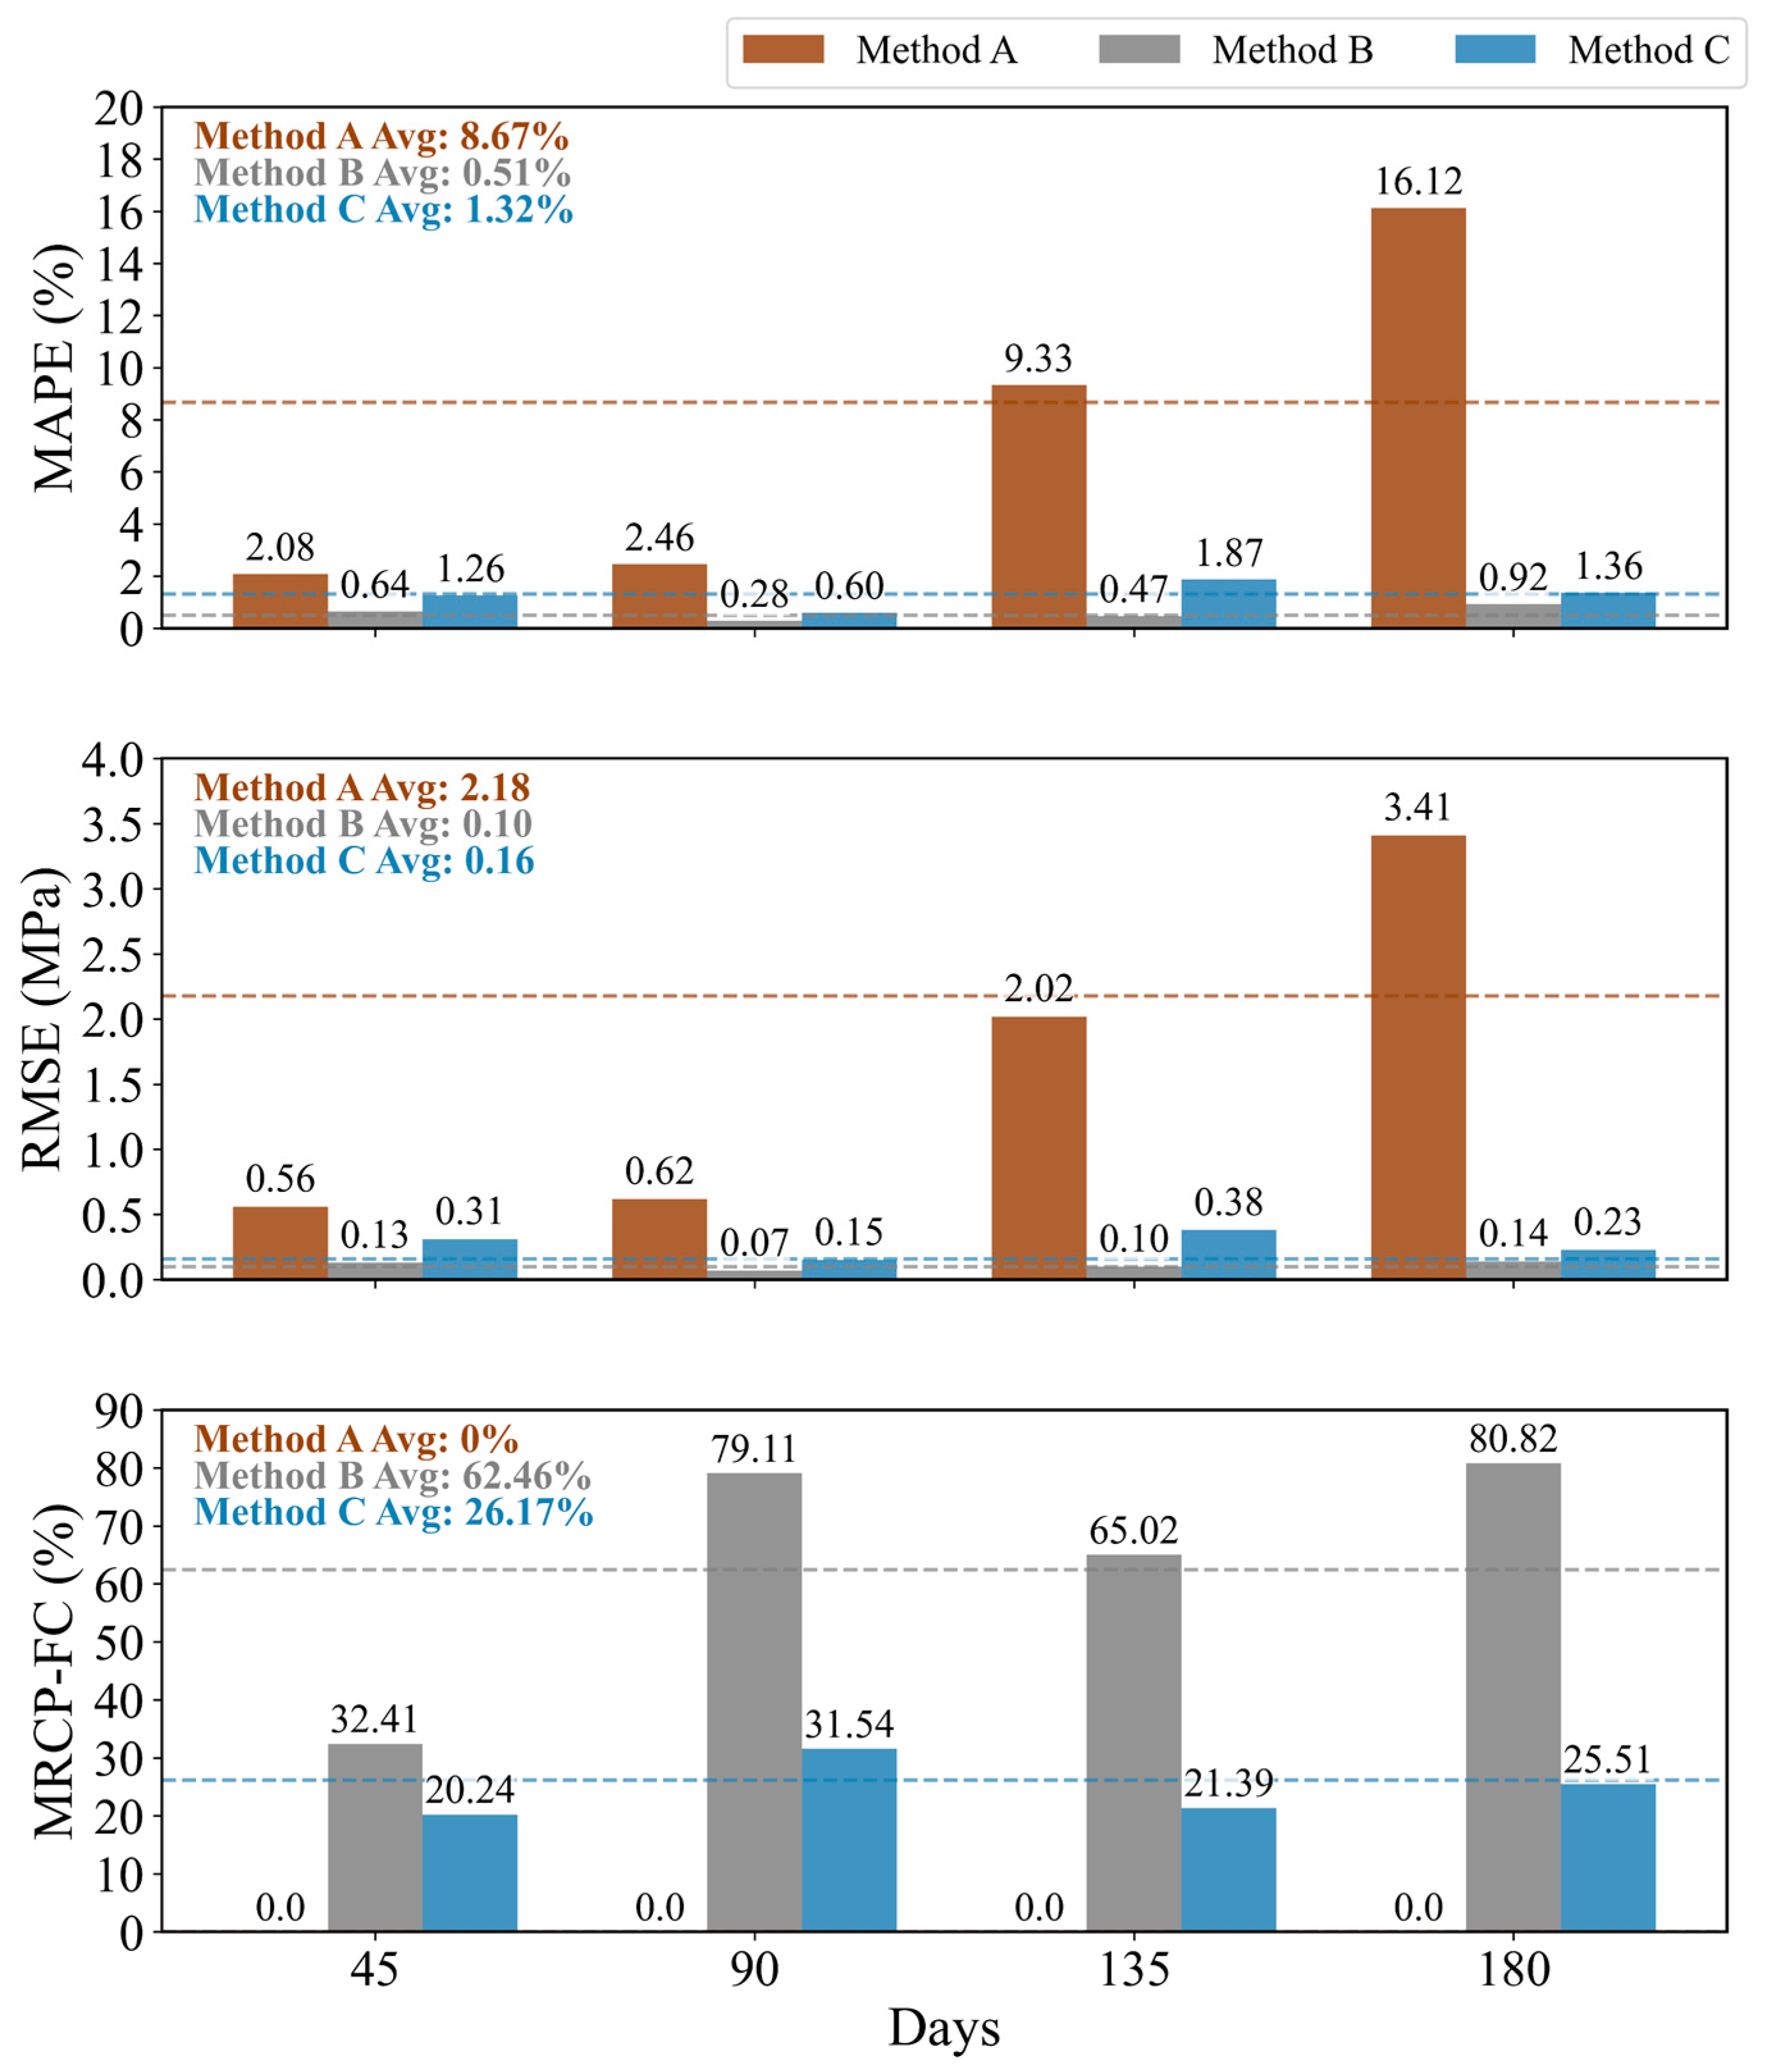
Figure 17 and
Table 6 present the temporal evolution trends of accuracy (MAPE, RMSE) and stability (MRCP-FC) for each strategy.
Table 6 further presents the detailed numerical results comparing the evaluation of accuracy and stability of the three fitting methods.
Regarding accuracy, the exponentially weighted dynamic fitting method (Method C) achieved an average MAPE of 1.32% and RMSE of 0.16 MPa. While slightly higher than Method B, these values are significantly lower than Method A and remain stable throughout the evaluation period. This validates the effectiveness of the EWMA mechanism under low-frequency, real-time data conditions. Regarding stability, Method C exhibited an average MRCP-FC of 26%, representing a substantial reduction compared to the 62% average of Method B (Full-Parameter Update).
The wellbore multiphase flow dynamic fitting method based on exponentially weighted parameter updating achieves a significant enhancement in robustness under discontinuous data conditions at the cost of a controlled and acceptable loss in accuracy. This strategy demonstrates balanced parameter responsiveness and historical memory retention, outperforming the two traditional approaches in typical oilfield scenarios characterized by medium-to-low frequency data acquisition.
