Pathway Evolution Modeling of Provincial Power Systems Under Multi-Scenario Carbon Constraints: An Empirical Analysis of Guangdong, China
Abstract
1. Introduction
2. Carbon-Constrained GTSEP Model
2.1. Model Structure
- Current power system status, which includes the existing development of generation–transmission–storage (GTS) infrastructure—such as network topology, installed capacities of various generation technologies, and energy storage systems. Additionally, it incorporates Guangdong’s regional resource endowments, with a particular emphasis on the spatial distribution and technical potential of VRE across different regions.
- Development projections, covering electricity demand in terms of both annual energy consumption and peak load, as well as the techno-economic characteristics of major system components, including generation technologies, storage, and transmission infrastructure. These projections are shaped by expected technological advancements, resource development levels, and overall economic growth.
- Development goals, incorporating both national mandates and provincial-level planning objectives, such as carbon emission reduction commitments, VRE deployment targets, and broader energy transition strategies formulated by Guangdong Province.
- Power system evolution pathways of Guangdong Province, detailing the temporal sequencing and spatial configuration of generation, transmission, and storage deployments. It provides insights into the evolutionary trajectory of the power system under various decarbonization scenarios.
- Scenario-specific planning metrics, including full-cycle cost breakdowns, carbon emission trajectories, VRE penetration levels, and curtailment rates, allowing for a comprehensive comparison across different planning strategies.
- Dispatch schedules, which illustrate the system’s hourly operational state under specific scenarios. These include generation outputs by technology, storage operations, and nodal power flows, enabling evaluation of intra-day system flexibility and operational feasibility under each scenario.
2.2. Model Settings
2.3. Model Assumptions
- The model employs the NC-RCUC (Network-Constrained Relaxed Clustered Unit Commitment) [34] approach to aggregate thermal generating units with similar operational and start-up characteristics into representative clusters. This clustering methodology enables the linearization of the unit commitment problem, thereby achieving computational acceleration in the spatial dimension while maintaining modeling fidelity.
- The model adopts a time-series aggregation approach for long-term planning horizons, utilizing the K-medoids clustering algorithm to select seven representative days within each season of every planning year as planning scenarios [32]. This temporal dimension reduction strategy enables computationally efficient solution of the multi-year expansion problem while preserving the essential characteristics of seasonal and daily operational patterns.
2.4. Objective Function and Constraints
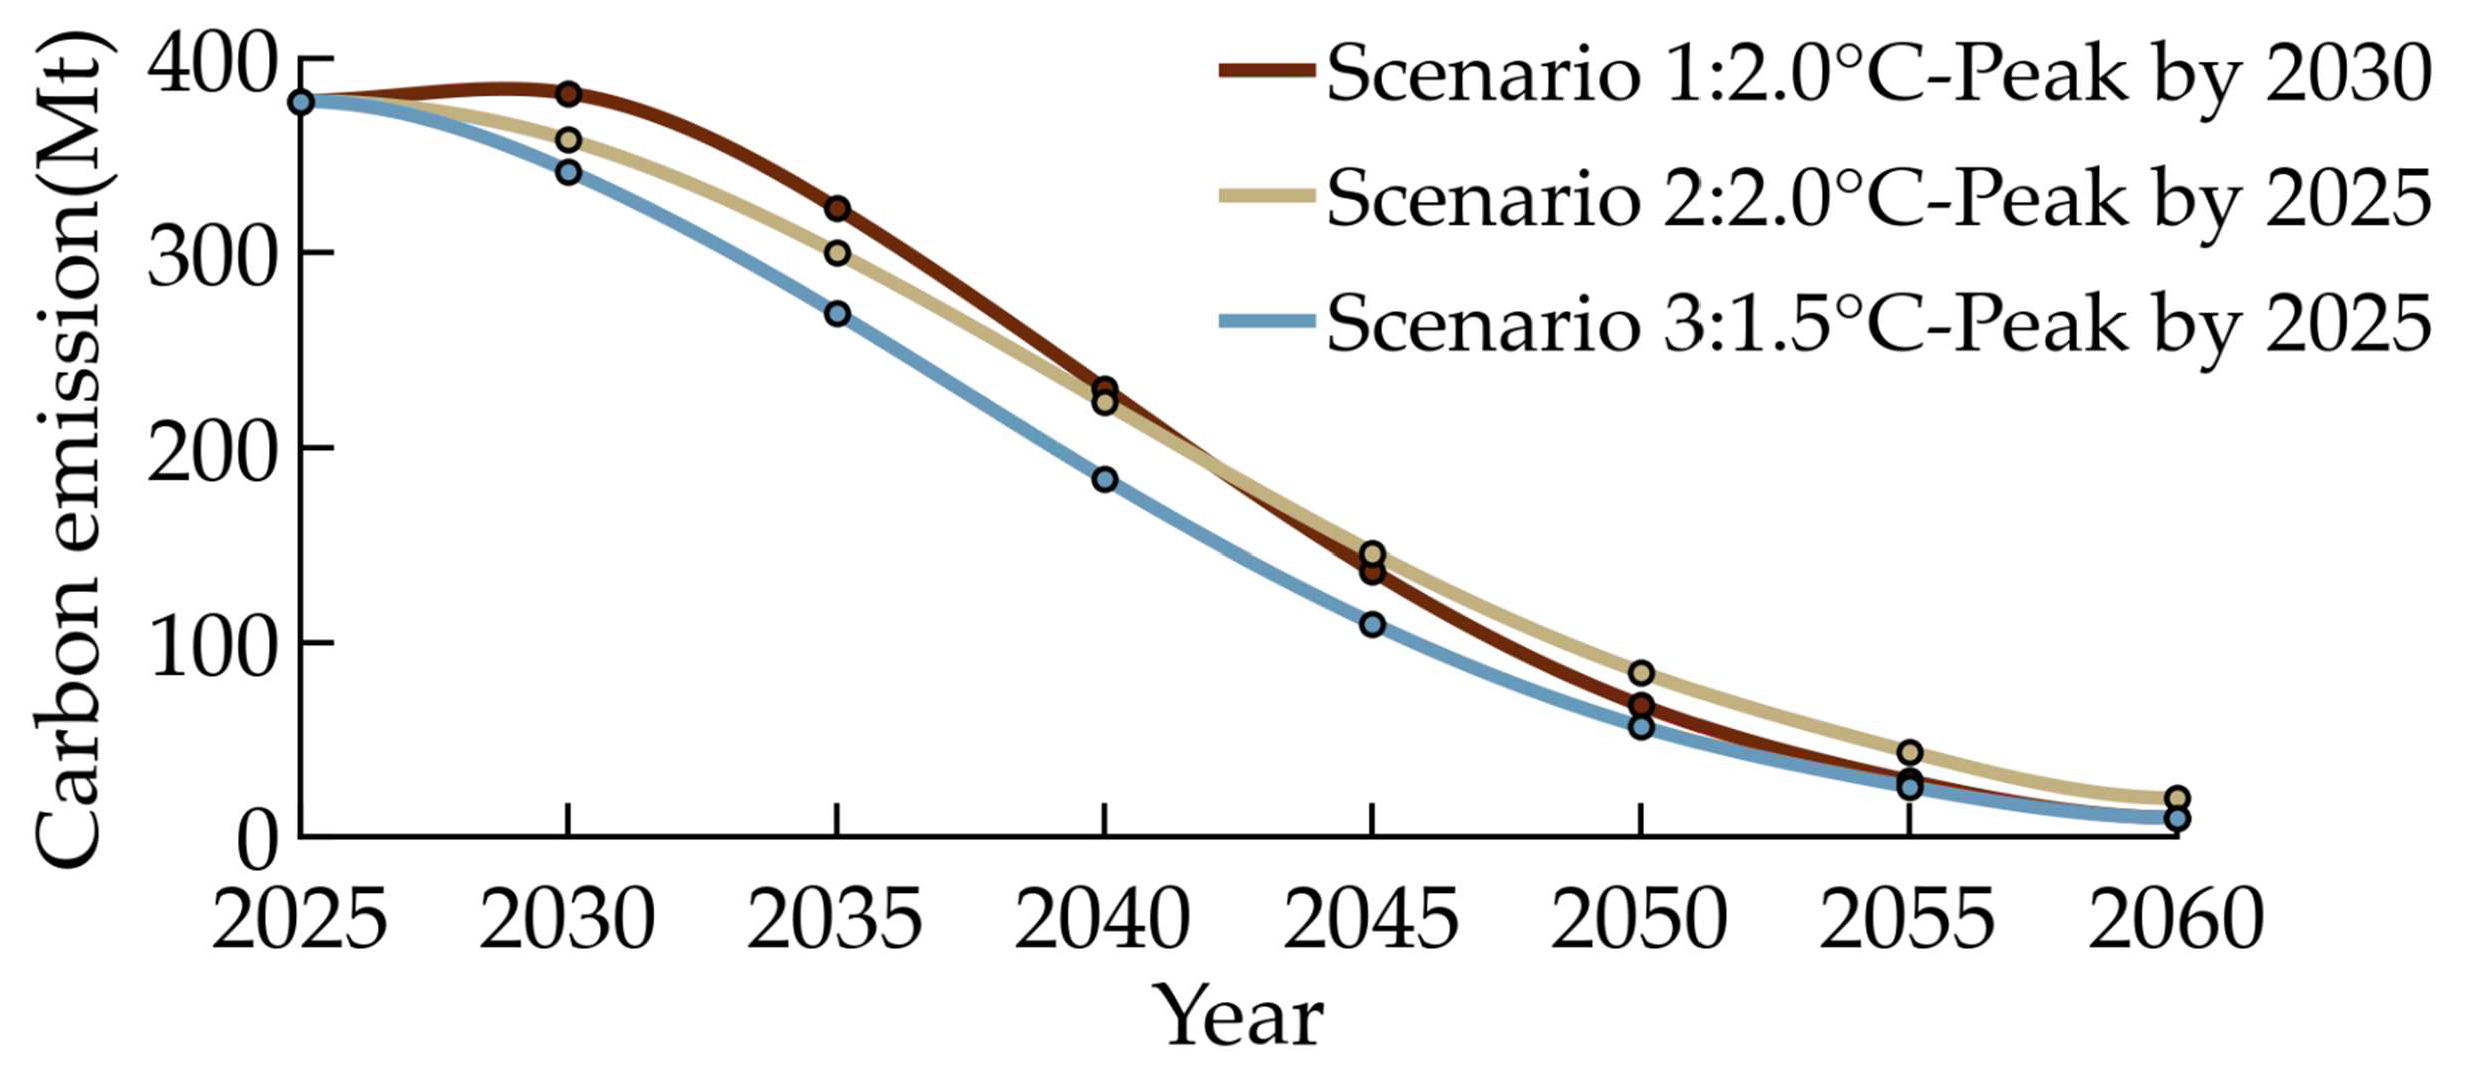
- Carbon emission trajectory: In each planning year, the carbon emissions generated by system operation must be less than the carbon emissions specified by the carbon emission trajectory curve. The system’s carbon sources encompass direct carbon emissions from coal-fired and gas-fired generation within the geographical scope of provincial power systems, as well as indirect emissions from imported electricity [35].
- VRE penetration requirements: Provincial energy development plans stipulate requirements for the development of both the installed capacity share and the electricity generation share of VRE.
- External power import commitments: For certain transmission corridors with pre-signed power purchase agreements, the agreed-upon performance must be fulfilled according to contractual requirements.
- Construction limits: Capacity expansion boundaries for VRE technologies are sourced from the GREAN database, while thermal generation and transmission are constrained by energy policy. Electrochemical storage is exempt from these limits.
- Utilization hour: Constraints are imposed on the minimum and maximum utilization hours for coal-fired, gas-fired, biomass, nuclear, hydro, BES, PHS, and certain transmission lines, taking into account local resource endowments and historical maintenance schedules.
- Output profiles: Hydropower generation is modeled with a three-segment output structure (minimum technical, dispatchable, and expected output), while wind and PV generation must remain within GREAN-provided output profiles.
- Reserve requirements: After accounting for VRE output forecast errors, the total output of various types of units and storage must exceed the electricity demand, which includes a required load reserve.
- VRE curtailment limits: When system flexibility is insufficient, limited wind and solar curtailment is allowed at a penalty cost. Furthermore, the rates of wind and solar curtailment cannot exceed a specified proportion.
- Inter-year capacity linkage: For any asset, newly added and retired capacities are considered each planning year; for non-retired assets, capacity must be no less than in the previous planning year.
- Nodal power balance: At any operational time step, every node in the system must satisfy real-time balance between power generation and power consumption.
- Capacity limit: At any operational time step, power output of generation units and energy storage, as well as power flows through transmission lines, shall not exceed their respective rated capacities.
- Thermal unit commitments: Coal-fired, gas-fired and nuclear units must satisfy minimum up/down times, minimum output ratios and incur start-up/shut-down costs for each transition.
- Ramp rate limits: All generation and storage technologies are required to satisfy both ramp-up and ramp-down constraints.
- Energy storage operation: BES is modeled to complete charging and discharging cycles daily with equal start/end states of charge (SOC), without considering battery degradation. PHS follows annual energy balance.
- Transmission line modeling: Transmission between different regions follows a transportation model [36], with a fixed line loss rate of 2.5%.
- Units with CCS operational constraints: Coal-fired CCS and gas-fired CCS units have a carbon capture rate of 90%. The capture system reduces net power injected at the bus below gross generation [37].
3. Case Studies
3.1. Carbon Emission Reduction Scenario Settings and Regional Characteristics
3.2. Power System Transition Pathway Analysis for Scenario 1
3.3. Impact of Different Carbon Emission Trajectories on Power System Transition Pathways
4. Conclusions
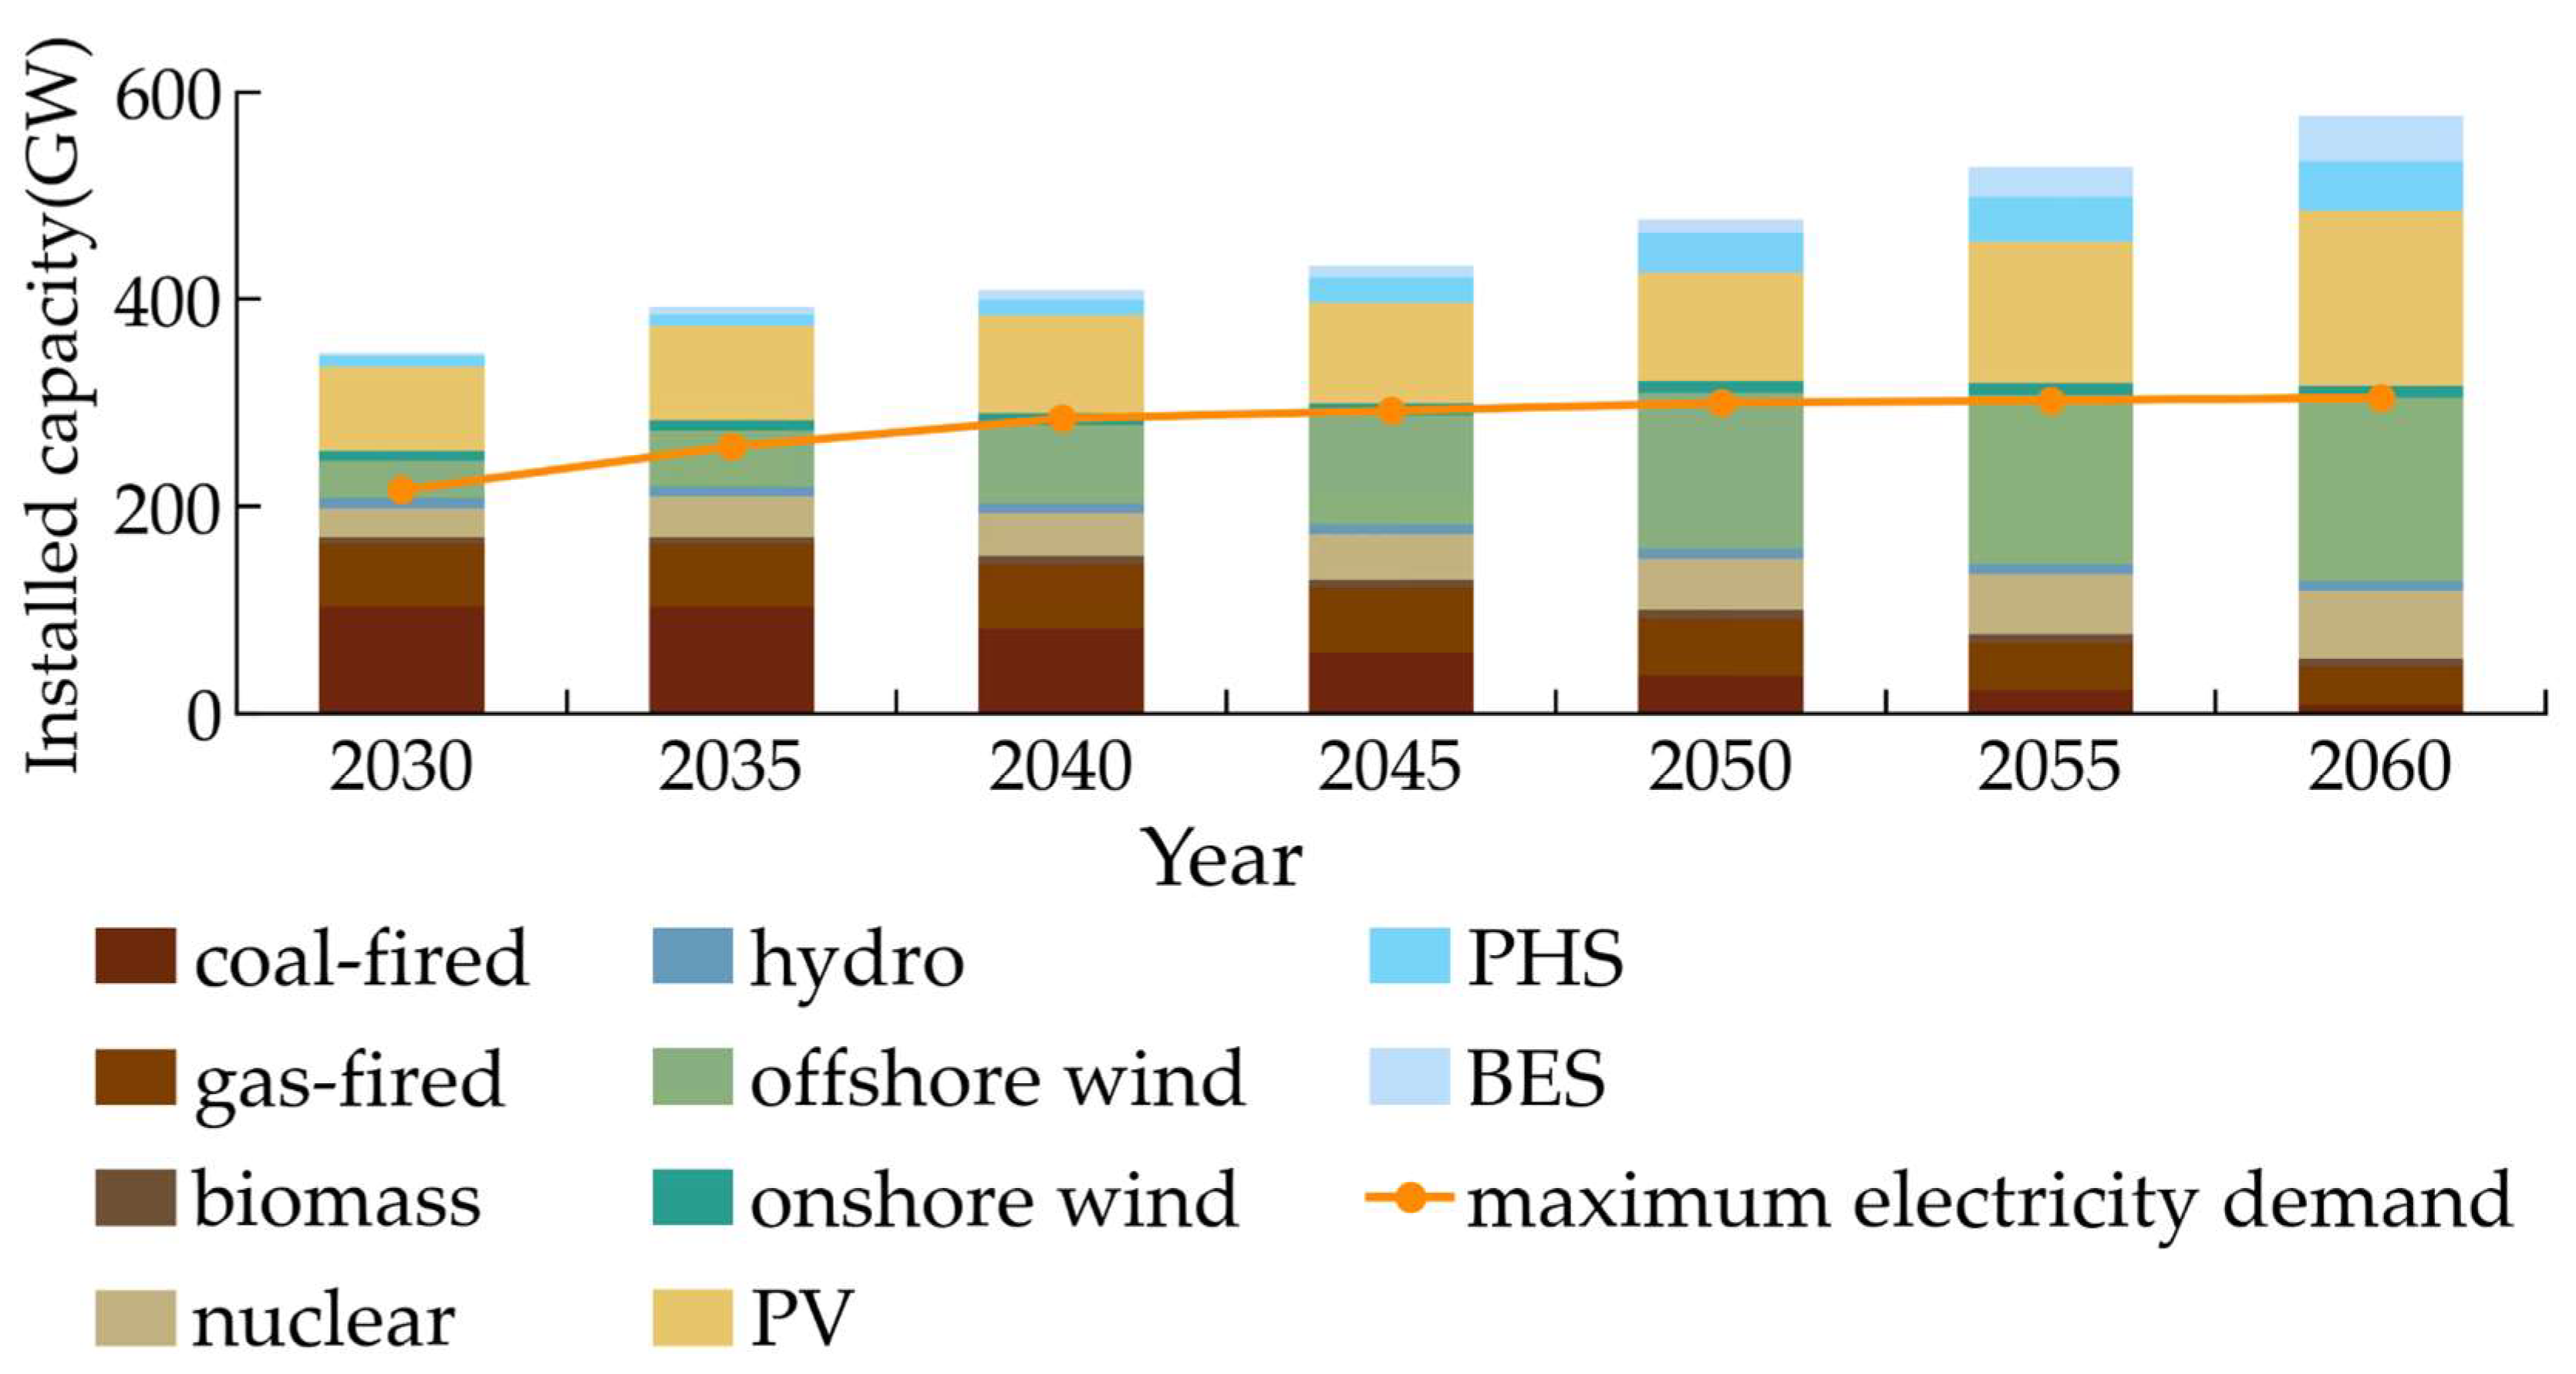
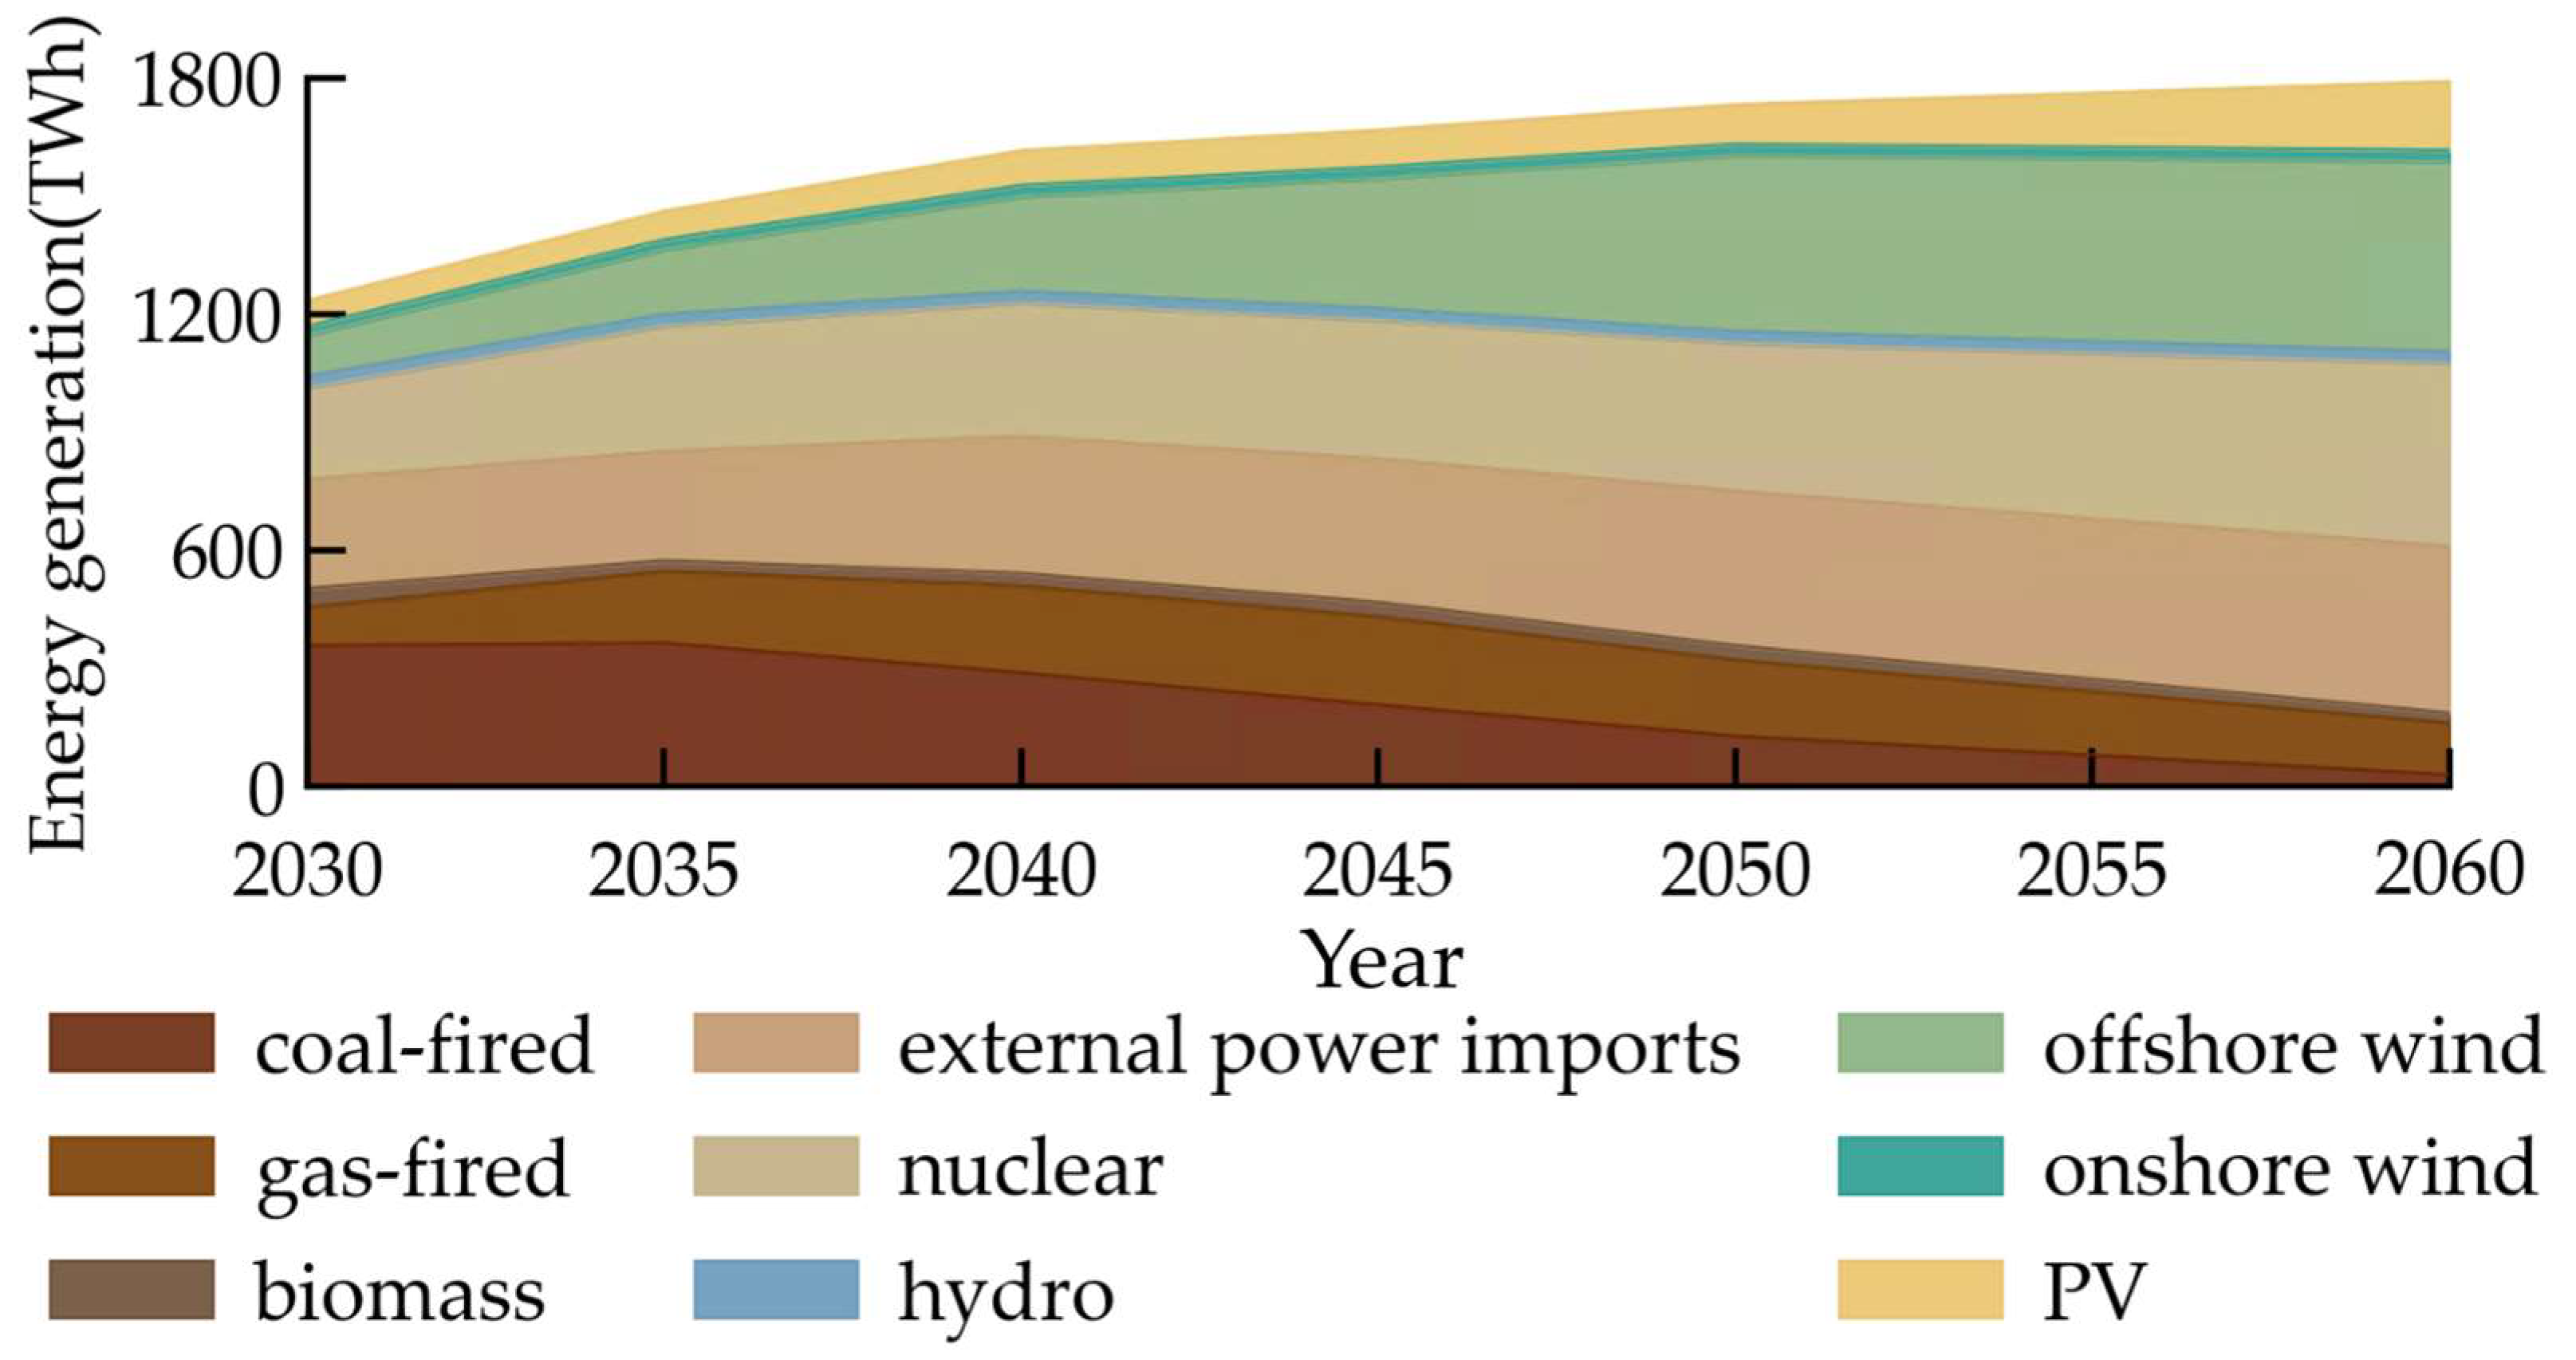
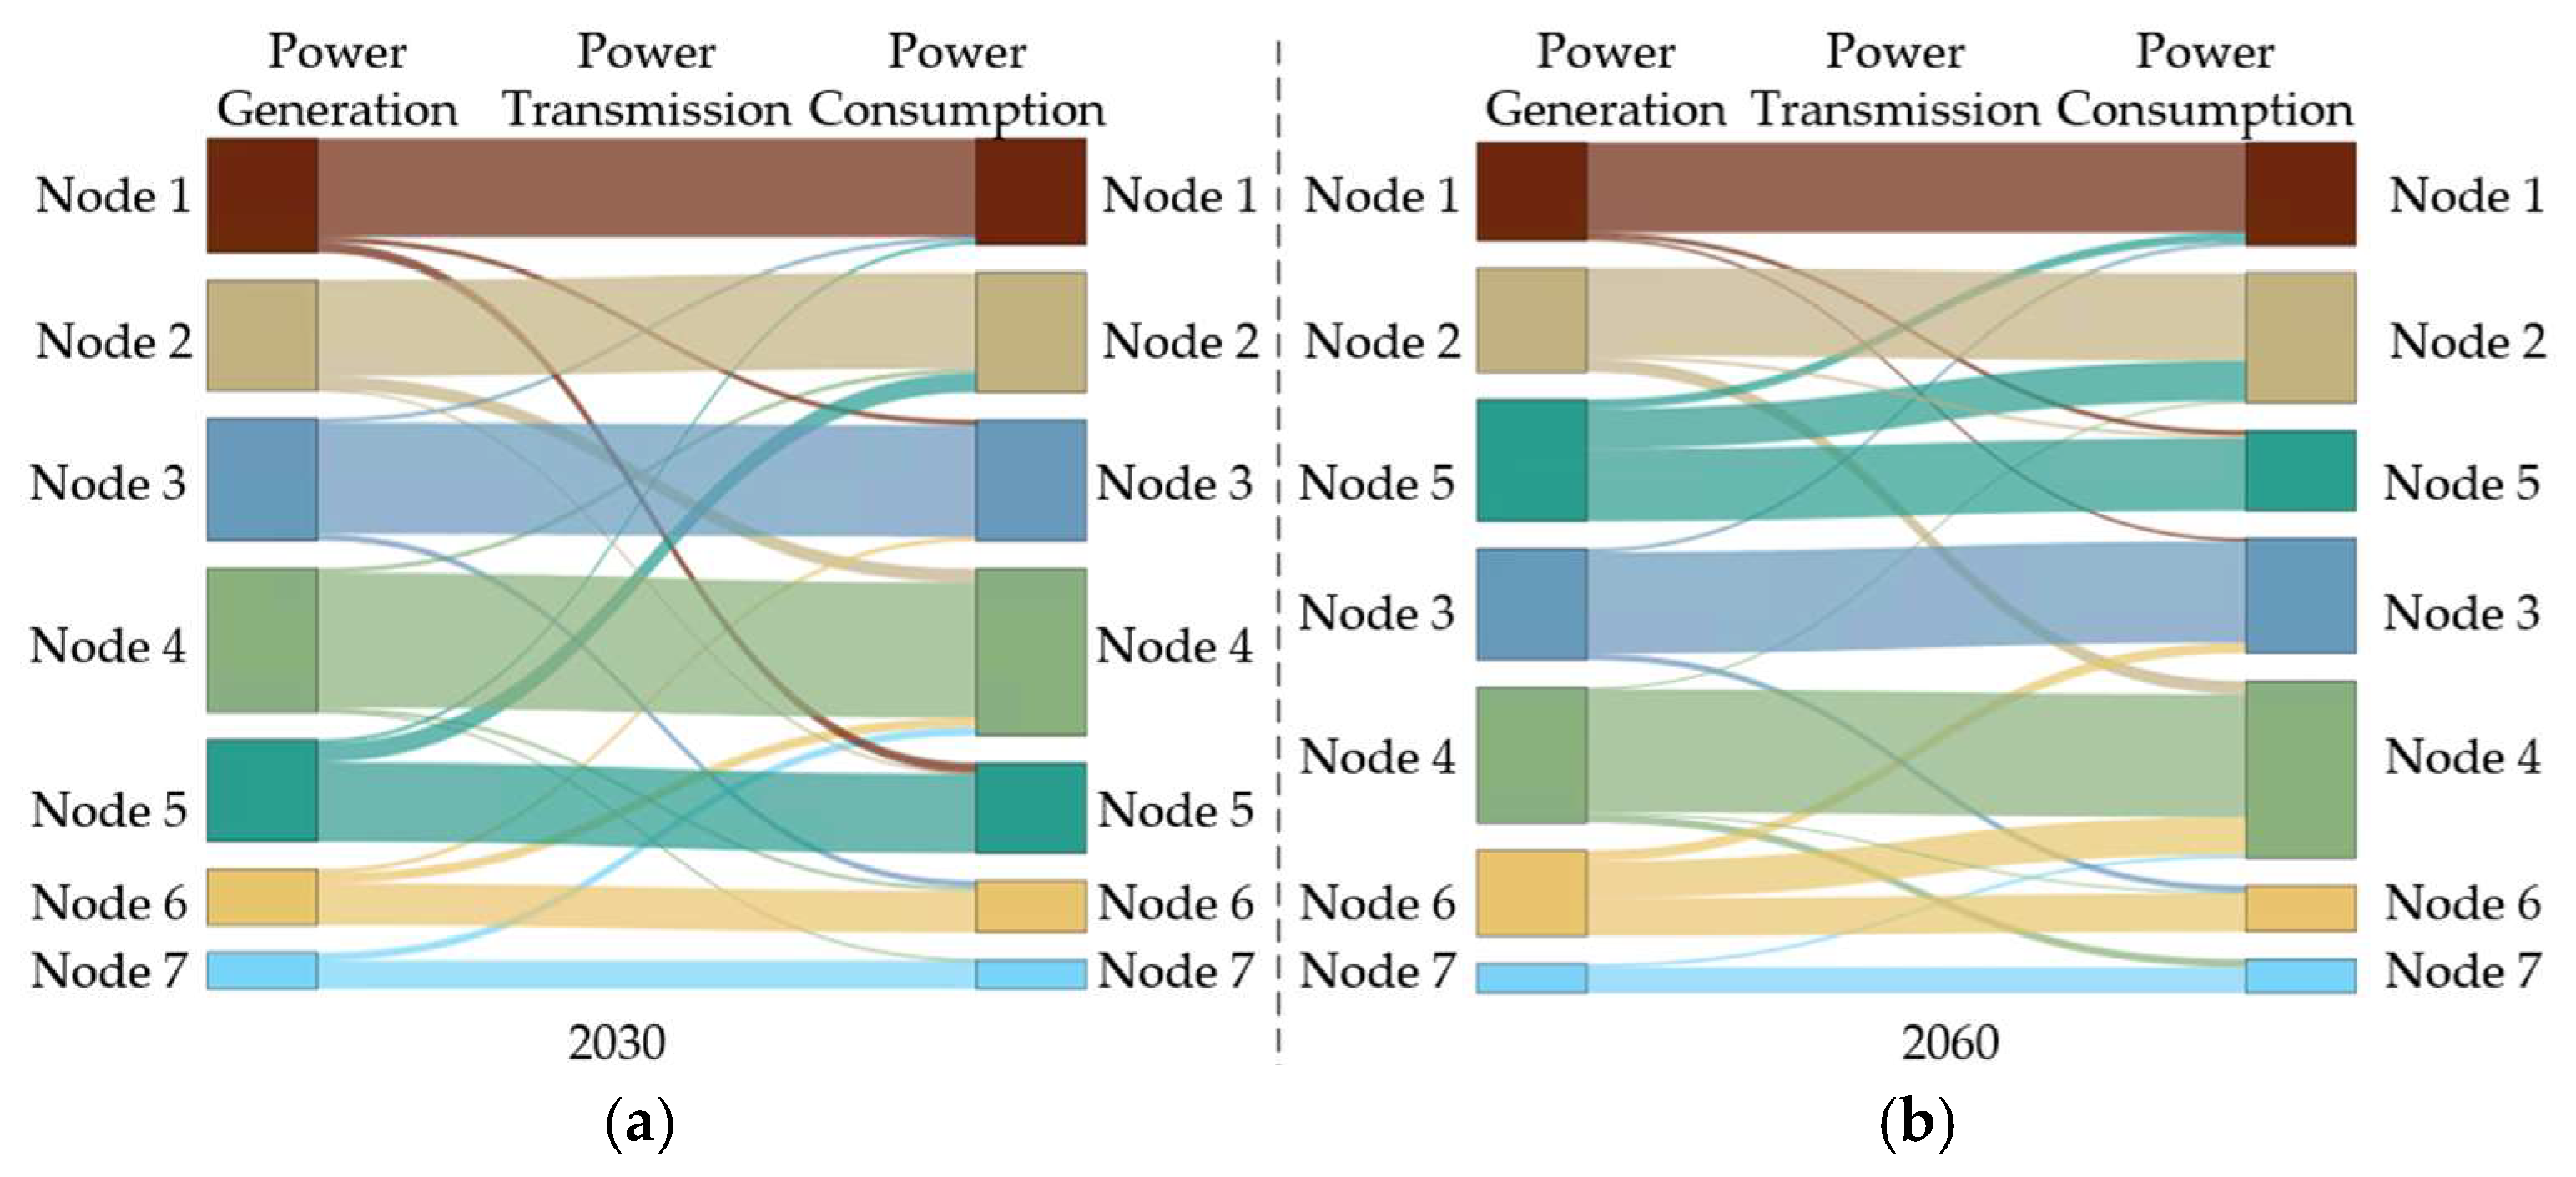
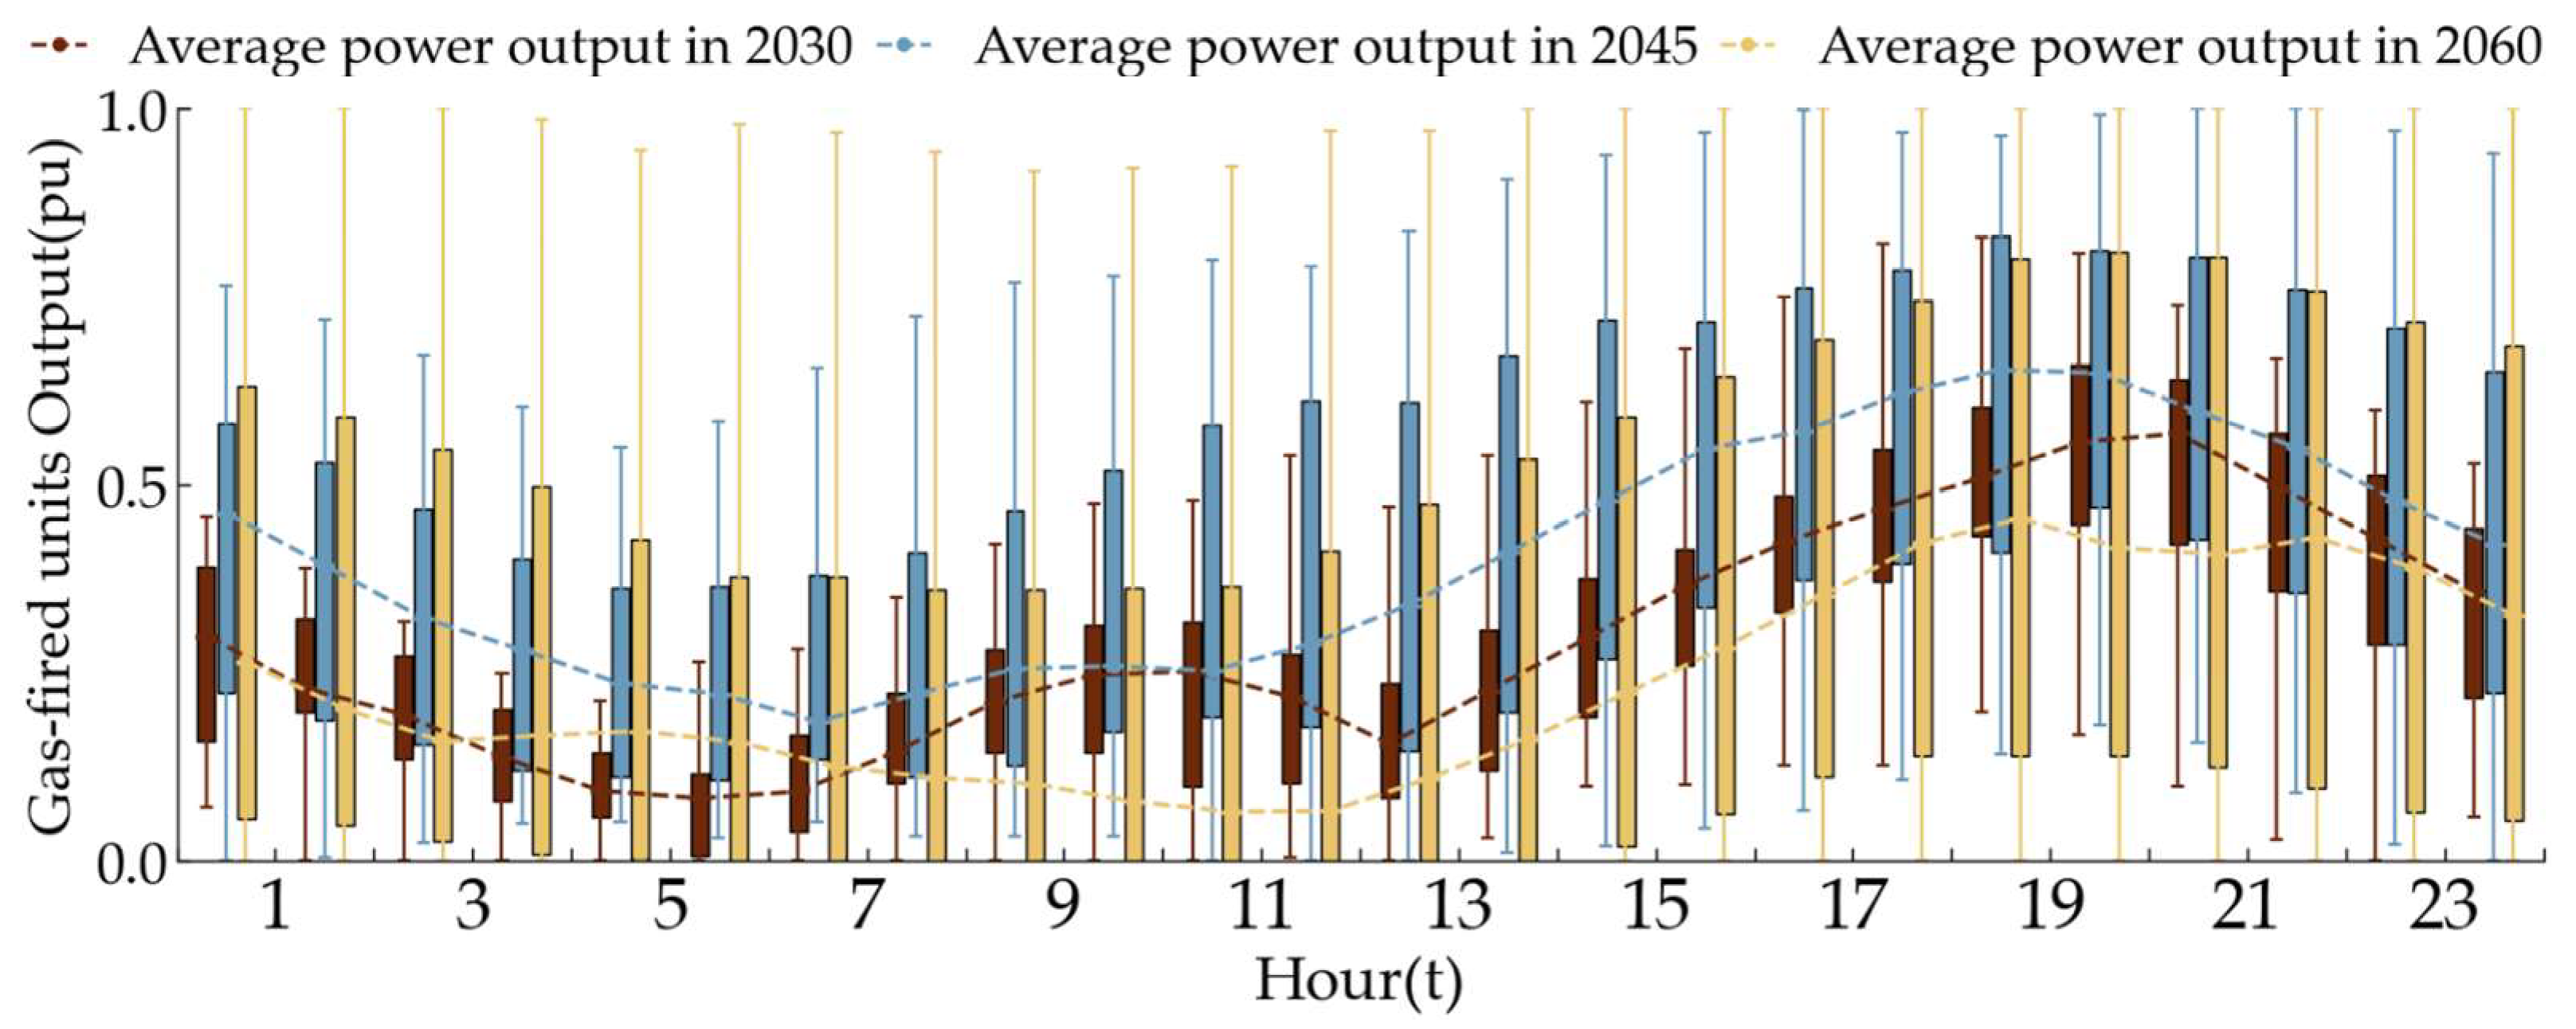
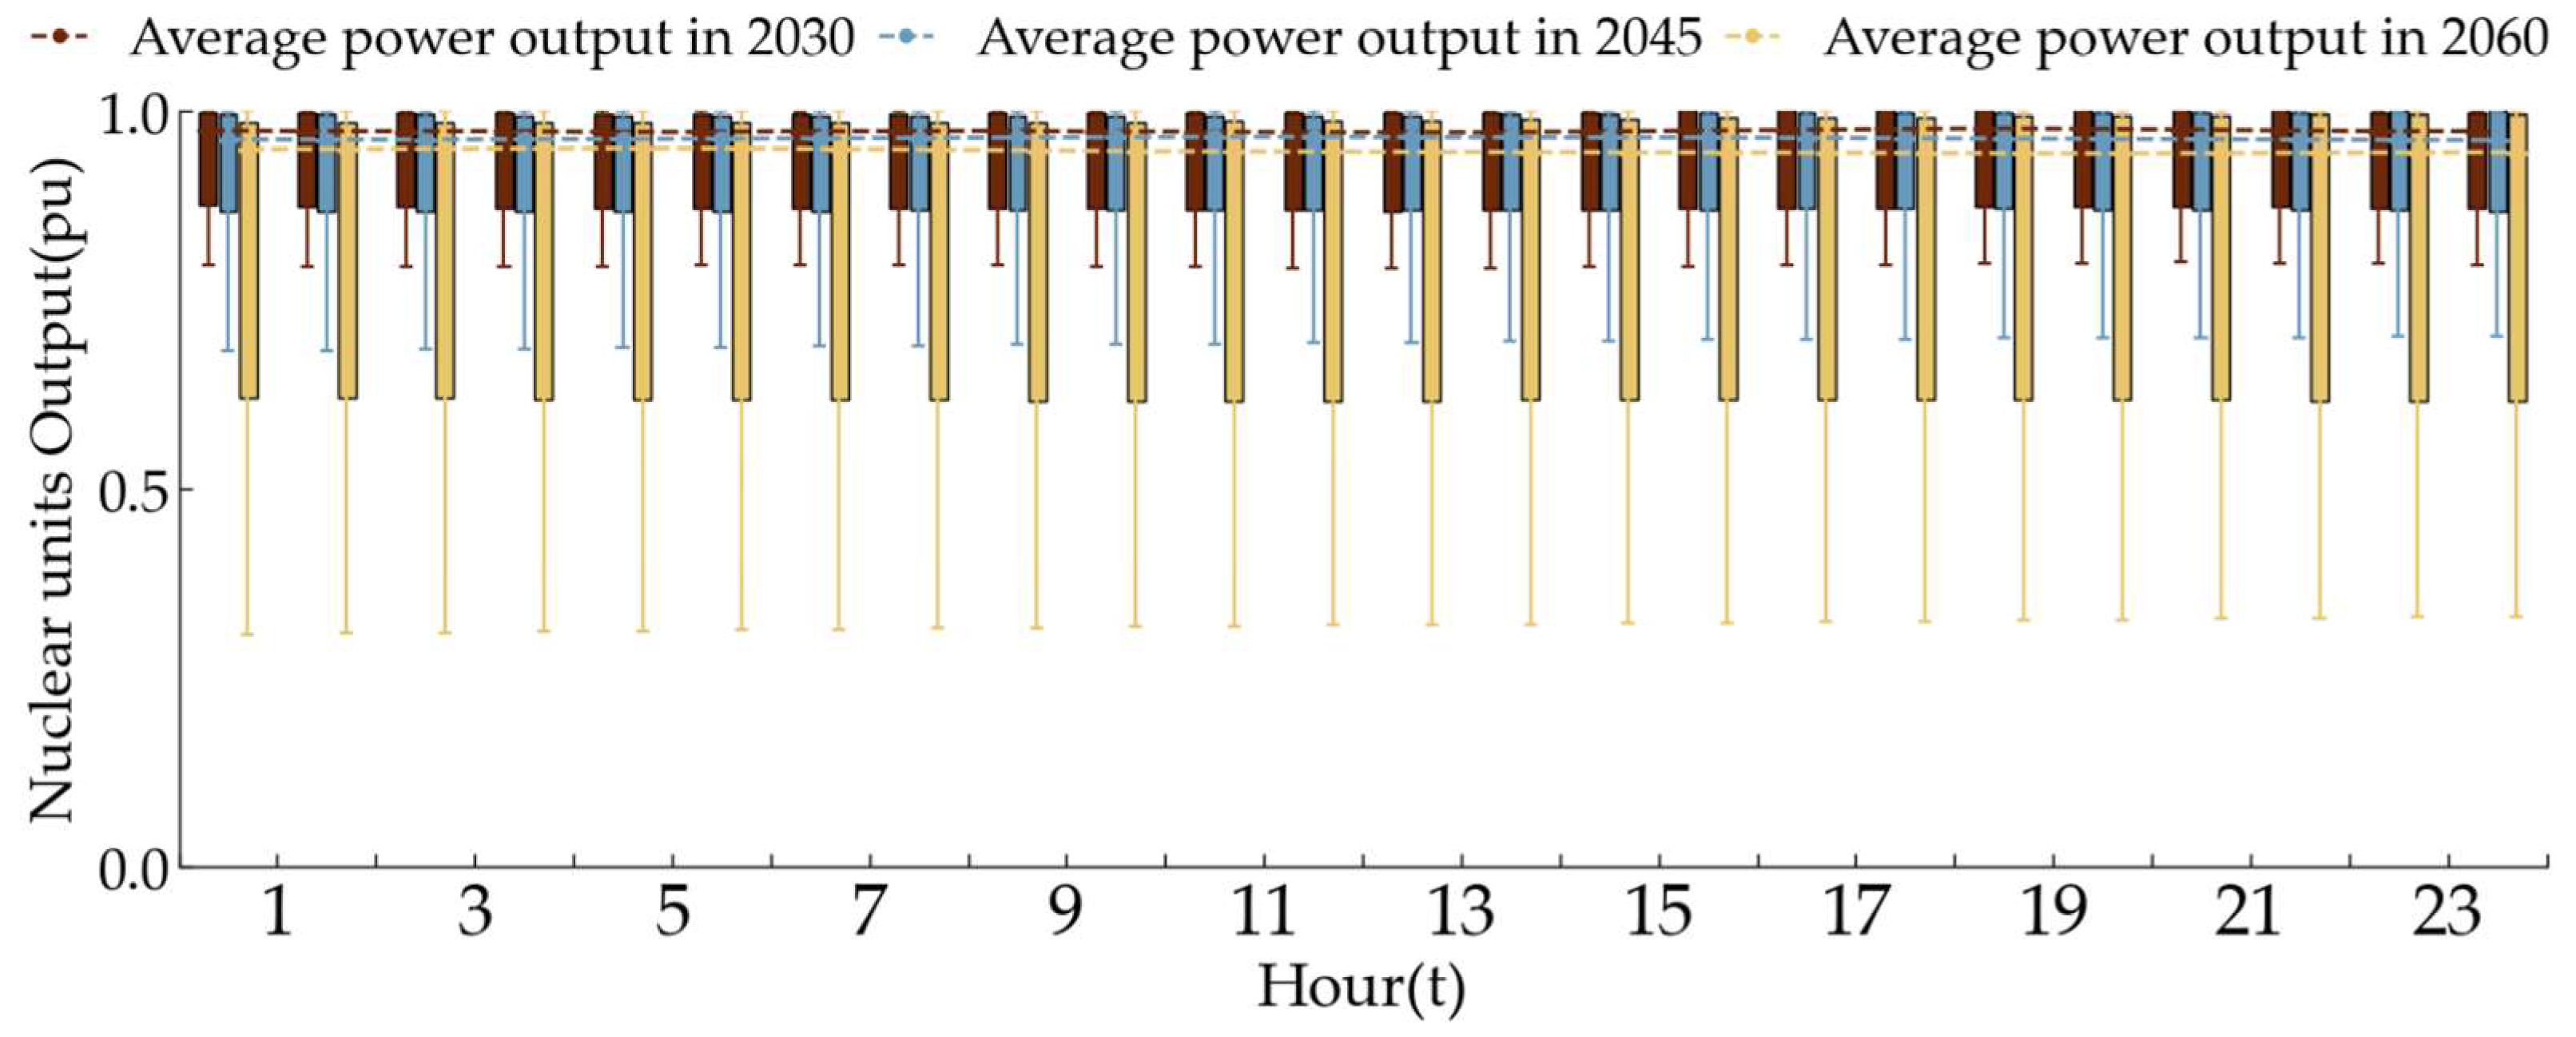
- Under the 2.0 °C global warming scenario, Guangdong is expected to establish a clean energy system primarily supported by external power imports, nuclear power, and VRE, with diversified flexibility resources like gas-fired power, flexible coal-fired power, PHS, and BES providing regulation capacity. By 2060, the total electricity generation share of external power imports, nuclear power, and VRE will reach 87%, with nuclear and VRE comprising 70% of total installed capacity. Rising VRE penetration and the spatiotemporal mismatch between demand and generation will drive inter-regional transmission within Guangdong to 463 TWh, or 27.4% of total electricity consumption. The combined uncertainties in load and VRE generation will require gas-fired units to provide substantially greater flexibility services; by 2060, their output regulation range will be twice that of 2030, with high VRE shares compressing their operation to predominantly low-output levels. Nuclear power will also expand its operational range while maintaining annual utilization hours.
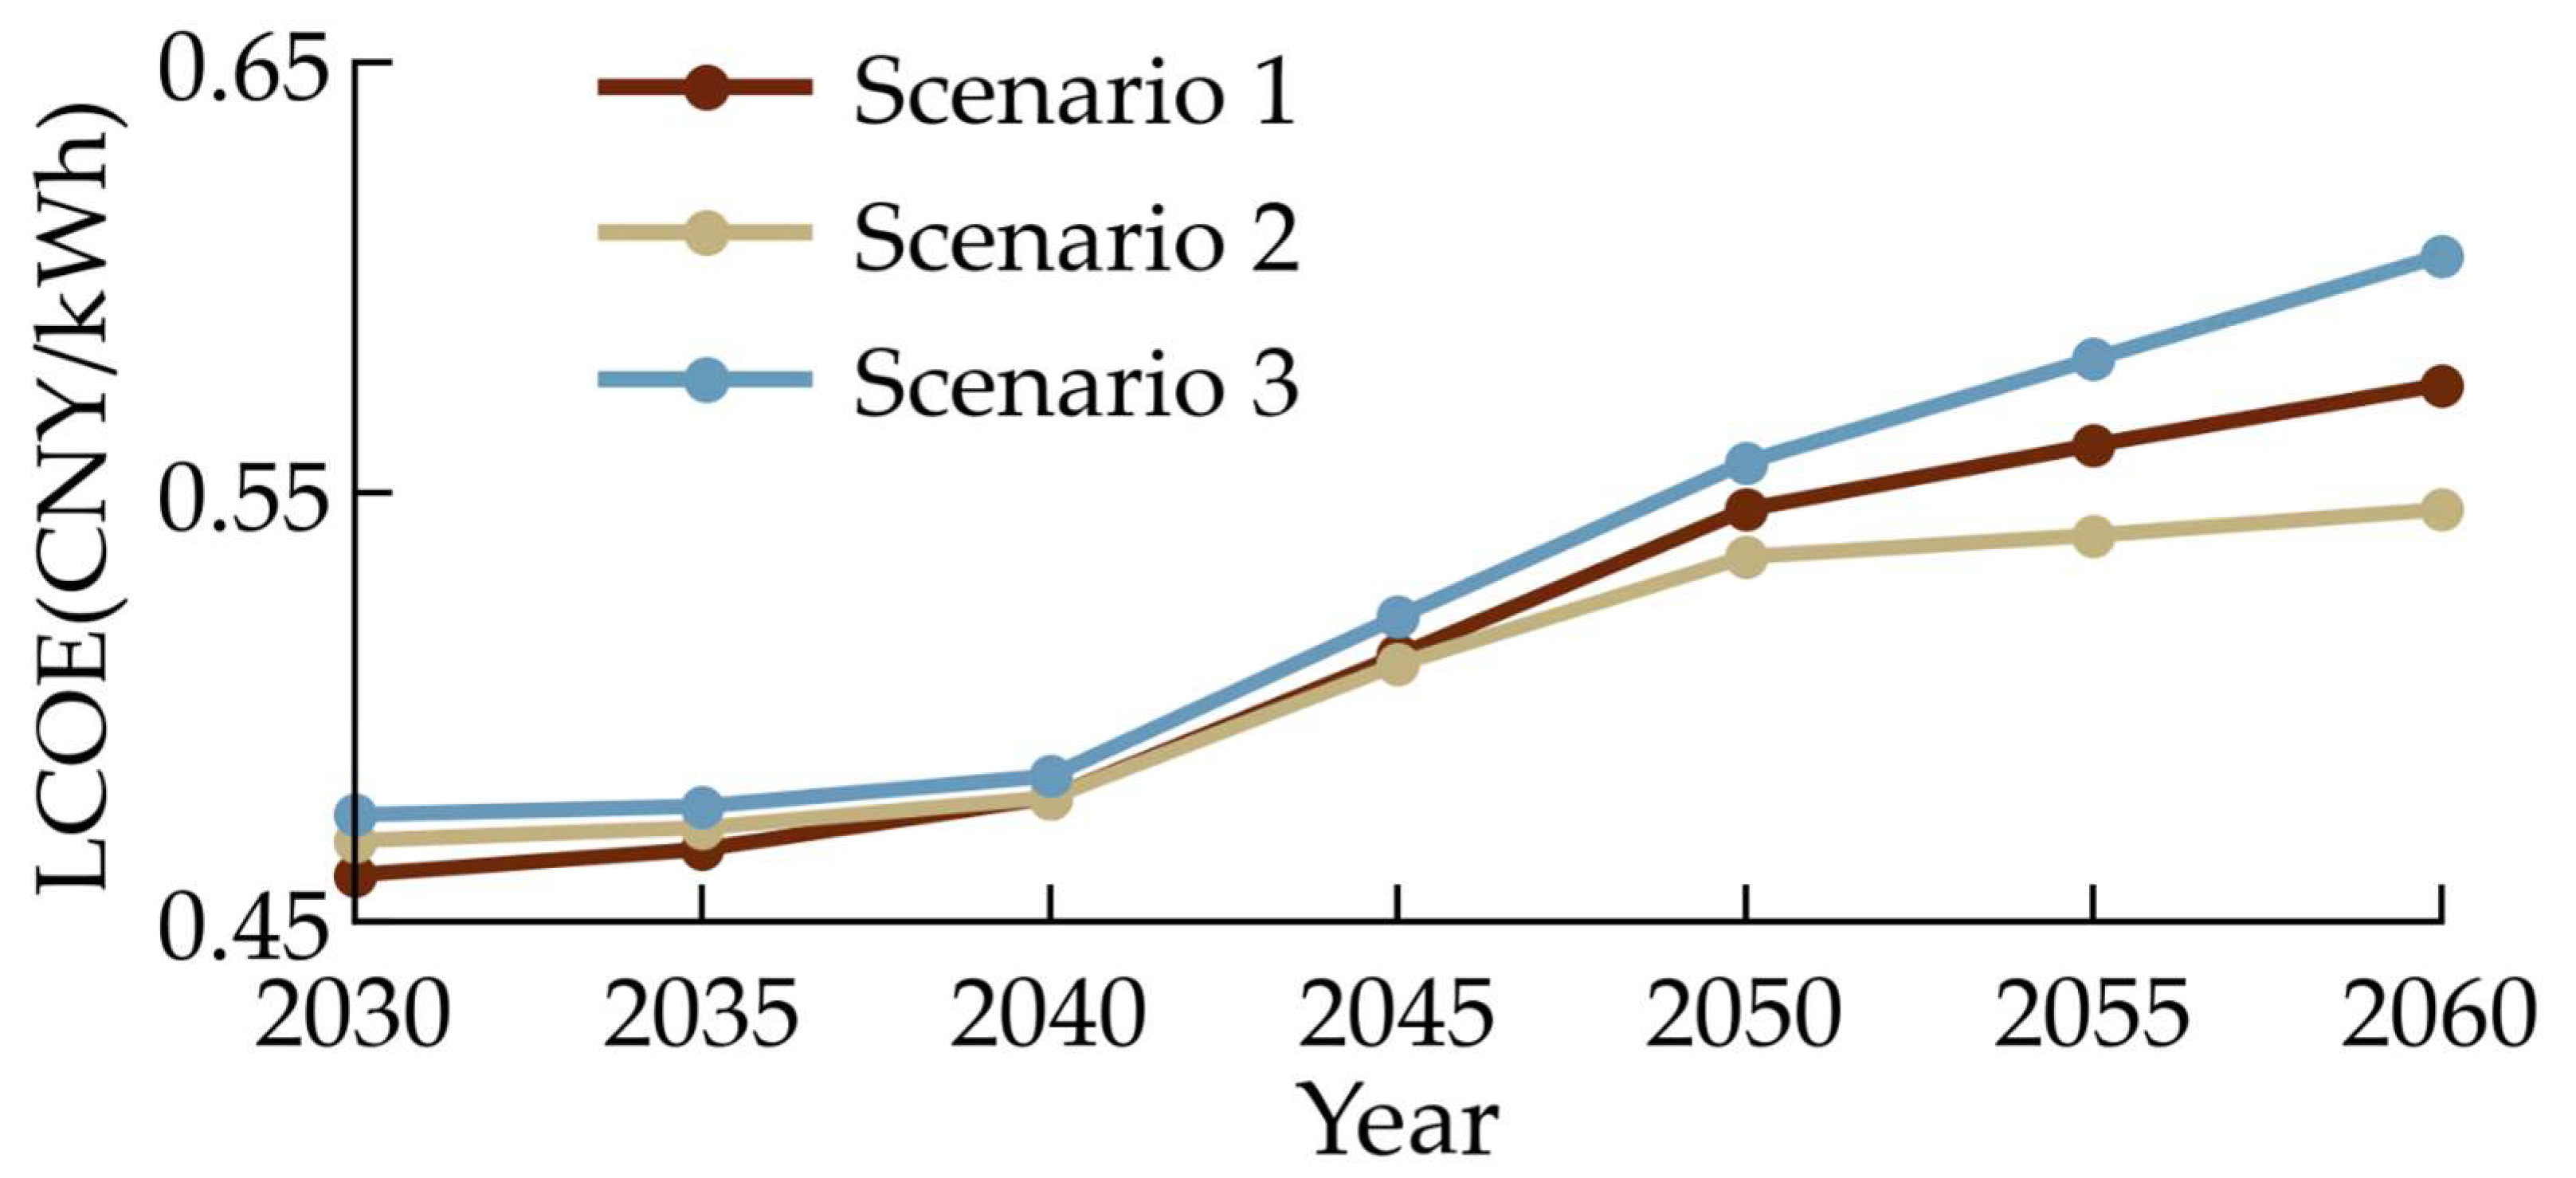
- Achieving an earlier carbon emissions peak can trade smaller short-term operational cost increases for larger long-term cost savings, given the nonlinear marginal growth of decarbonization expenses. Between 2030 and 2045, each 0.1 kg CO2/kWh reduction in the carbon emission factor increases the LCOE by 0.022 CNY/kWh, while from 2045 to 2060, the same reduction raises LCOE by 0.081 CNY/kWh. Therefore, adjusting generation structure early and reducing coal-fired power output can achieve early peaking, providing more buffer time for retirement and flexibility retrofit of thermal units like coal-fired and gas-fired power, thereby reducing transition costs. With the same carbon budget, achieving peak in 2025 compared to 2030 can save CNY 53.7 billion in total costs over the planning horizon, and reduce LCOE by 5.2% by 2060.
Author Contributions
Funding
Data Availability Statement
Conflicts of Interest
Appendix A. Carbon-Constrained GTSEP Model
Appendix A.1. Objective Function
Appendix A.2. Constraints
References
- Notice of the General Office of the State Council on Issuing the “Work Plan for Accelerating the Development of a Dual Control System for Carbon Emissions”. Available online: https://www.mee.gov.cn/zcwj/gwywj/202408/t20240806_1083433.shtml (accessed on 2 July 2025).
- Guo, J.; Wang, T.; Luo, K.; Qin, X.; Jing, Y.; Zhao, B.; Ma, S. Development of new power systems: Challenges and solutions. New Type Power Syst. 2023, 1, 32–43. [Google Scholar]
- Zhao, Y.-R.; Liu, H.-M.; Li, W.; Gong, L.-D. Research on the low-carbon transition policies of power sector under the “Double Carbon” goal. Adv. Clim. Change Res. 2023, 19, 634. [Google Scholar]
- Chen, J. An empirical study on China’s energy supply-and-demand model considering carbon emission peak constraints in 2030. Engineering 2017, 3, 512–517. [Google Scholar] [CrossRef]
- Xiao, J.; Li, G.; Xie, L.; Wang, S.; Yu, L. Decarbonizing China’s power sector by 2030 with consideration of technological progress and cross-regional power transmission. Energy Policy 2021, 150, 112150. [Google Scholar] [CrossRef]
- Kang, C.; Du, E.; Guo, H.; Li, Y.; Fang, Y.; Zhang, Y.; Zhong, H. Primary exploration of six essential factors in new power system. Power Syst. Technol. 2023, 47, 1741–1750. [Google Scholar] [CrossRef]
- Cheng, Q.; Li, F.; Luo, S.; Wu, W.; Zhang, N.; Kang, C. Research on the Planning Methodology Framework and Key Supporting Technologies for New Power Systems. Power Syst. Technol. 2025, 49, 2219–2231. [Google Scholar] [CrossRef]
- He, L.; Li, X.; Cui, Q.; Guan, B.; Li, M.; Chen, H. Decarbonization pathways to subregional carbon neutrality in China based on the top-down multi-regional CGE model: A study of Guangxi. Energy 2024, 294, 130846. [Google Scholar] [CrossRef]
- Sun, L.L.; Cui, H.J.; Ge, Q.S. Will China achieve its 2060 carbon neutral commitment from the provincial perspective? Adv. Clim. Change Res. 2022, 13, 169–178. [Google Scholar] [CrossRef]
- Li, N.; Chen, W.; Zhang, Q. Development of China TIMES-30P model and its application to model China’s provincial low carbon transformation. Energy Econ. 2020, 92, 104955. [Google Scholar] [CrossRef]
- Shu, Y.; Zhang, L.; Zhang, Y.; Wang, Y.; Lu, G.; Yuan, B.; Xia, P. Carbon peak and carbon neutrality path for China’s power industry. Strateg. Study Chin. Acad. Eng. 2021, 23, 1–14. [Google Scholar] [CrossRef]
- Zhuo, Z.; Du, E.; Zhang, N.; Nielsen, C.P.; Lu, X.; Xiao, J.; Wu, J.; Kang, C. Cost increase in the electricity supply to achieve carbon neutrality in China. Nat. Commun. 2022, 13, 3172. [Google Scholar] [CrossRef]
- Meng, Q.; Xu, J.; Luo, F.; Jin, X.; Xu, L.; Yao, W.; Jin, S. Collaborative and effective scheduling of integrated energy systems with consideration of carbon restrictions. IET Gener. Transm. Distrib. 2023, 17, 4134–4145. [Google Scholar] [CrossRef]
- Li, G.; Luo, Z.; Liao, C. Power capacity optimization and long-term planning for a multi-energy complementary base towards carbon neutrality. Energy 2025, 334, 137644. [Google Scholar] [CrossRef]
- Li, Y.; Wu, W.; Yang, H.; Gong, G.; Zhang, Y.; Luo, S.; Zhou, S.; Wang, P. Dynamic Carbon Emission Factors in Source–Network–Storage Power System Planning: A Focus on Inverse Modelling. Energies 2024, 17, 6346. [Google Scholar] [CrossRef]
- Wang, Z.; Liu, Y.; Wang, R.; Hu, Y. Cost–Benefit Analysis of Cross-Regional Transmission of Renewable Electricity: A Chinese Case Study. Sustainability 2024, 16, 10538. [Google Scholar] [CrossRef]
- Huang, W.; Zhang, N.; Kang, C.; Li, M.; Huo, M. From demand response to integrated demand response: Review and prospect of research and application. Prot. Control Mod. Power Syst. 2019, 4, 1–13. [Google Scholar] [CrossRef]
- Fu, X.; Wu, X.; Zhang, C.; Fan, S.; Liu, N. Planning of distributed renewable energy systems under uncertainty based on statistical machine learning. Prot. Control Mod. Power Syst. 2022, 7, 1–27. [Google Scholar] [CrossRef]
- Tang, H.; Zhang, S.; Chen, W. Assessing representative CCUS layouts for China’s power sector toward carbon neutrality. Environ. Sci. Technol. 2021, 55, 11225–11235. [Google Scholar] [CrossRef]
- Wang, H.; Zhang, J.; Wang, P.; Zhang, N. The role of demand-side flexibilities on low-carbon transition in power system: A case study of West Inner Mongolia, China. Renew. Energy 2025, 242, 122478. [Google Scholar] [CrossRef]
- Zhang, Q.; Chen, W. Modeling China’s interprovincial electricity transmission under low carbon transition. Appl. Energy 2020, 279, 115571. [Google Scholar] [CrossRef]
- Li, W.; Wang, J.; Du, E.; Wang, P.; Zhang, N.; Kang, C. Planning Coal Power Generation Transition Considering Multiple Alternatives With a Full Life Cycle Perspective. IEEE Trans. Power Syst. 2025, 1–13. [Google Scholar] [CrossRef]
- Zhang, B.; Niu, N.; Li, H.; Wang, Z. Assessing the efforts of coal phaseout for carbon neutrality in China. Appl. Energy 2023, 352, 121924. [Google Scholar] [CrossRef]
- Ren, D.; Xiao, J.; Hou, J.; Du, E.; Jin, C.; Liu, Y. Construction and evolution of China’s new power system under dual carbon goal. Power Syst. Technol. 2022, 46, 3831–3839. [Google Scholar]
- Li, Z.; Chen, S.; Dong, W.; Liu, P.; Du, E.; Ma, L.; He, J. Low carbon transition pathway of power sector under carbon emission constraints. Proc. CSEE 2021, 41, 3987–4001. [Google Scholar]
- Wang, T.; Jin, Y.; Li, Y. Optimization Scheduling of Carbon Capture Power Systems Considering Energy Storage Coordination and Dynamic Carbon Constraints. Processes 2025, 13, 1758. [Google Scholar] [CrossRef]
- Ma, Y.; Li, Y.P.; Huang, G.H. Planning China’s non-deterministic energy system (2021–2060) to achieve carbon neutrality. Appl. Energy 2023, 334, 120673. [Google Scholar] [CrossRef]
- Cheng, R.; Xu, Z.; Liu, P.; Wang, Z.; Li, Z.; Jones, I. A multi-region optimization planning model for China’s power sector. Appl. Energy 2015, 137, 413–426. [Google Scholar] [CrossRef]
- Deng, X.; Lv, T. Power system planning with increasing variable renewable energy: A review of optimization models. J. Clean. Prod. 2020, 246, 118962. [Google Scholar] [CrossRef]
- Collins, S.; Deane, J.P.; Poncelet, K.; Panos, E.; Pietzcker, R.C.; Delarue, E.; Gallachóir, B.P.Ó. Integrating short term variations of the power system into integrated energy system models: A methodological review. Renew. Sustain. Energy Rev. 2017, 76, 839–856. [Google Scholar] [CrossRef]
- Lopion, P.; Markewitz, P.; Robinius, M.; Stolten, D. A review of current challenges and trends in energy systems modeling. Renew. Sustain. Energy Rev. 2018, 96, 156–166. [Google Scholar] [CrossRef]
- Zhang, N.; Jiang, H.; Du, E.; Zhuo, Z.; Wang, P.; Wang, Z.; Zhang, Y. An efficient power system planning model considering year-round hourly operation simulation. IEEE Trans. Power Syst. 2022, 37, 4925–4935. [Google Scholar] [CrossRef]
- Global Energy Interconnection Development and Cooperation Organization. Research on Global Renewable Energy Development and Investment; China Electric Power Press: Beijing, China, 2020. [Google Scholar]
- Du, E.; Zhang, N.; Kang, C.; Xia, Q. A high-efficiency network-constrained clustered unit commitment model for power system planning studies. IEEE Trans. Power Syst. 2018, 34, 2498–2508. [Google Scholar] [CrossRef]
- Ministry of Ecology and Environment, National Bureau of Statistics. Announcement on the Release of the 2021 Electricity CO2 Emission Factors. Available online: https://www.mee.gov.cn/xxgk2018/xxgk/xxgk01/202404/t20240412_1070565.html (accessed on 8 July 2025).
- Haffner, S.; Monticelli, A.; Garcia, A.; Mantovani, J.; Romero, R. Branch and bound algorithm for transmission system expansion planning using a transportation model. IEE Proc. Gener. Transm. Distrib. 2000, 147, 149–156. [Google Scholar] [CrossRef]
- Zhang, Y.L.; Kang, J.N.; Liu, L.C.; Wei, Y.M. Unveiling the evolution and future prospects: A comprehensive review of low-carbon transition in the coal power industry. Appl. Energy 2024, 371, 123649. [Google Scholar] [CrossRef]
- Born, K. Exploring the Spatial Dynamics of Circular Economy Transitions: Insights and Lessons from Chile’s Mining Territories. Prog. Econ. Geogr. 2025, 3, 100041. [Google Scholar] [CrossRef]
- Ma, L.; Ghorbani, Y.; Kongar-Syuryun, C.B.; Khayrutdinov, M.M.; Klyuev, R.V.; Petenko, A.; Brigida, V. Dynamics of backfill compressive strength obtained from enrichment tails for the circular waste management. Resour. Conserv. Recycl. Adv. 2024, 23, 200224. [Google Scholar] [CrossRef]
- Wei, H.Y.; Zhuo, Z.Y.; Zhang, N.; Du, E.S.; Xiao, J.Y.; Wang, P.; Kang, C.Q. Transition path optimization and influencing factor analysis of carbon emission peak and carbon neutrality for power system of China. Autom. Electr. Power Syst. 2022, 46, 1–12. [Google Scholar]
- Notice of the State Council on Issuing the Action Plan for Carbon Dioxide Peaking Before 2030. Available online: https://www.gov.cn/zhengce/content/2021-10/26/content_5644984.htm (accessed on 25 August 2025).
- The 14th Five-Year Plan for Energy Development in Guangdong Province. Available online: https://www.gd.gov.cn/attachment/0/486/486725/3909371.pdf (accessed on 25 August 2025).


| Scenario | Description of Carbon Reduction Pathways |
|---|---|
| 2.0 °C-Peak by 2030 (Scenario 1) | Carbon emissions peak in 2030, with a peak annual emission of 382 Mt and a cumulative carbon budget 1 of 6.8 Gt. |
| 2.0 °C-Peak by 2025 (Scenario 2) | Carbon emissions peak in 2025, with a peak annual emission of 378 Mt and a cumulative carbon budget of 6.8 Gt. |
| 1.5 °C-Peak by 2025 (Scenario 3) | Carbon emissions peak in 2025, with a peak annual emission of 378 Mt and a cumulative carbon budget of 6.0 Gt. |
| Metric/Region | Region 1 | Region 2 | Region 3 | Region 4 | Region 5 | Region 6 | Region 7 |
|---|---|---|---|---|---|---|---|
| Node load proportion (%) | 16.7 | 16.3 | 18.9 | 22.9 | 13.4 | 7.1 | 4.7 |
| Existing thermal power capacity (GW) | 33.2 | 27.1 | 44.9 | 28.5 | 31.2 | 12.5 | 9.1 |
| VRE capacity installation potential (GW) | 28.1 | 35 | 64.6 | 59 | 180.3 | 75.2 | 53.4 |
| Year | Scenario | Carbon Emission (Mt) | Installed Capacity (GW) | Power Transmission (TWh) | Total Annualized Cost (billion CNY) | LCOE (CNY/kWh) |
|---|---|---|---|---|---|---|
| 2030 | Scenario 1 | 382 | 348.2 | 196.8 | 565.75 | 0.461 |
| Scenario 2 | 358 | 348.8 | 191.8 | 575.34 | 0.469 | |
| Scenario 3 | 342 | 348.6 | 188.6 | 581.95 | 0.475 | |
| 2045 | Scenario 1 | 137 | 432.2 | 232.2 | 837.28 | 0.512 |
| Scenario 2 | 146 | 433.8 | 220.1 | 834.05 | 0.510 | |
| Scenario 3 | 110 | 427.6 | 256.8 | 851.00 | 0.521 | |
| 2060 | Scenario 1 | 10 | 577.4 | 463.2 | 975.03 | 0.575 |
| Scenario 2 | 20 | 556.5 | 446.9 | 924.66 | 0.546 | |
| Scenario 3 | 10 | 601.9 | 467.4 | 1025.40 | 0.605 |
Disclaimer/Publisher’s Note: The statements, opinions and data contained in all publications are solely those of the individual author(s) and contributor(s) and not of MDPI and/or the editor(s). MDPI and/or the editor(s) disclaim responsibility for any injury to people or property resulting from any ideas, methods, instructions or products referred to in the content. |
© 2025 by the authors. Licensee MDPI, Basel, Switzerland. This article is an open access article distributed under the terms and conditions of the Creative Commons Attribution (CC BY) license (https://creativecommons.org/licenses/by/4.0/).
Share and Cite
Gong, G.; Wu, W.; Luo, S.; Li, Y.; Zhou, S.; Yang, H.; Gu, J.; Wang, P. Pathway Evolution Modeling of Provincial Power Systems Under Multi-Scenario Carbon Constraints: An Empirical Analysis of Guangdong, China. Processes 2025, 13, 2893. https://doi.org/10.3390/pr13092893
Gong G, Wu W, Luo S, Li Y, Zhou S, Yang H, Gu J, Wang P. Pathway Evolution Modeling of Provincial Power Systems Under Multi-Scenario Carbon Constraints: An Empirical Analysis of Guangdong, China. Processes. 2025; 13(9):2893. https://doi.org/10.3390/pr13092893
Chicago/Turabian StyleGong, Guoxian, Weijie Wu, Shuxin Luo, Yixin Li, Shucan Zhou, Haotian Yang, Jianlin Gu, and Peng Wang. 2025. "Pathway Evolution Modeling of Provincial Power Systems Under Multi-Scenario Carbon Constraints: An Empirical Analysis of Guangdong, China" Processes 13, no. 9: 2893. https://doi.org/10.3390/pr13092893
APA StyleGong, G., Wu, W., Luo, S., Li, Y., Zhou, S., Yang, H., Gu, J., & Wang, P. (2025). Pathway Evolution Modeling of Provincial Power Systems Under Multi-Scenario Carbon Constraints: An Empirical Analysis of Guangdong, China. Processes, 13(9), 2893. https://doi.org/10.3390/pr13092893


