Article

Pathway Evolution Modeling of Provincial Power Systems Under Multi-Scenario Carbon Constraints: An Empirical Analysis of Guangdong, China

1
Sichuan Energy Internet Research Institute, Tsinghua University, Chengdu 610213, China
2
Grid Planning and Research Center, Guangdong Power Grid Corporation, Guangzhou 510220, China
*
Author to whom correspondence should be addressed.
Processes 2025, 13(9), 2893; https://doi.org/10.3390/pr13092893
Submission received: 11 August 2025 / Revised: 2 September 2025 / Accepted: 4 September 2025 / Published: 10 September 2025
(This article belongs to the Special Issue Modeling, Operation and Control in Renewable Energy Systems)

Abstract

China’s energy system is transitioning from a state of coal-dependent, low-electrification to a low-carbon, high-electrification paradigm. Carbon emissions have become a central constraint that directly influences generation expansion and transmission investment decisions. This study develops a bottom-up optimization framework integrating dynamic carbon trajectories into a coupled generation–transmission–storage expansion model. Distinct carbon emission trajectories are established on the basis of Guangdong’s allocated carbon budget, and the analysis evaluates the resulting power system structures and transition pathways under each scenario. Results show that Guangdong’s clean energy transition relies on external power imports, nuclear power, and variable renewable energy (VRE), collectively accounting for 87% of generation by 2060. Flexibility requirements expand substantially, with storage capacity rising from 10% of installed VRE in 2030 to 26% in 2060. Critically, under identical cumulative carbon budgets, an accelerated decarbonization pathway achieving earlier peak emissions demonstrates a pivotal economic trade-off: it imposes modestly higher near-term operation costs but delivers significant long-term savings by avoiding prohibitively expensive end-of-period abatement measures. Specifically, advancing the emissions peak from 2030 to 2025 reduces cumulative system costs over the planning horizon by CNY 53.7 billion and lowers the 2060 levelized cost of electricity by 5.2%.

1. Introduction

Driven by China’s “Dual Carbon” goals, the national energy regulation framework is undergoing a fundamental transition from dual controls on energy consumption to dual controls on carbon emissions [1]. Within this transition, the power sector emerges as both the primary battlefield for carbon mitigation and the central engine for achieving carbon neutrality. In 2020, electricity accounted for 26% of final energy consumption, while the power sector contributed over 40% of national carbon emissions, ranking as the single largest emitting sector. By 2060, high-carbon energy sources, such as coal and oil, are projected to be substantially replaced by zero-carbon energy sources, such as wind and solar, positioning the power system as the backbone of China’s energy transition. It is anticipated that the national electrification rate will exceed 60% [2], and the share of wind and solar power generation will surpass 70%. This transformation marks a shift from a fossil fuel-dominated energy model with limited electrification toward a low-carbon, electricity-centered system capable of supporting deep decarbonization. Only by achieving coordinated breakthroughs in both electrification of energy consumption and decarbonization of electricity supply can the deep decarbonization transformation of the energy system materialize [3].
China has entered a critical period for achieving peak carbon emissions in the power sector [4]. In 2024, clean energy sources—including wind, solar, hydro, and nuclear—contributed 82% of the electricity supply increment, a substantial rise from 56% in 2020. As the incremental growth of clean electricity surpasses the growth in electricity demand, the carbon emissions from China’s power system are expected to officially peak, marking the beginning of a new phase in the low-carbon transition [5]. Simultaneously, the power sector infrastructure—marked by pronounced carbon lock-in, protracted construction timelines, and substantial capital intensity—poses two principal challenges in the low-carbon transition: balancing short-term economic costs against long-term environmental liabilities, and coordinating the temporal deployment of generation, transmission, and storage infrastructure to meet stringent carbon reduction targets [6].
Under the directional constraints of China’s “Dual Carbon” goals, alongside multiple imperatives for power supply security and economic efficiency, integrating the dynamic evolution characteristics of carbon emission trajectories into the long-term power system planning framework to achieve deep synergy between generation, transmission, and storage expansion planning and carbon mitigation pathways has emerged as a pivotal research direction in the low-carbon transition of the power system [7].
Numerous studies have employed top-down computable general equilibrium (CGE) models to examine the evolution of installed capacity and electricity generation under various carbon constraints from an energy system perspective [8,9]. However, these models are limited in their ability to capture the techno-economic characteristics of specific system components—including generation units, transmission lines, and storage technologies—and struggle to accurately represent the operational challenges associated with high shares of variable renewable energy (VRE).
To overcome these limitations, reference [10] developed China TIMES-30P, a technology-rich optimization model for provincial energy systems, adopting a bottom-up approach to simulate transition pathways under carbon emission budgets. Results reveal that under a climate scenario consistent with the 2 °C target, provincial carbon emission intensities in 2050 will decrease by 85% to 100% relative to 2015 levels. Reference [11] constructed three types of power system transition scenarios: deep decarbonization, zero-carbon, and net-negative emissions, and employed the GESP-V modeling platform developed by the State Grid Energy Research Institute to quantify the evolution of power generation mix, carbon emissions, and power supply costs of each scenario. Reference [12] developed a power system expansion model to comprehensively evaluate electricity supply cost trajectories under diverse carbon emission scenarios in China. Results demonstrate that achieving carbon neutrality in the power sector by 2050 is technically feasible. However, increased investments in VRE, flexible generation resources, and transmission infrastructure are projected to increase the electricity supply costs by approximately 20%.
Meanwhile, recent studies have begun to emphasize the necessity of explicit carbon strategies within both operational and planning stages of energy systems. Reference [13] proposed a source–grid–load–storage cooperative optimal dispatch model considering carbon constraint to address the real-time power supply–demand balancing challenges caused by unpredictable output fluctuations of renewable energy sources, and the results demonstrate that considering carbon emission trading can significantly reduce overall system costs and carbon emissions, and guide integrated energy systems to achieve low-carbon transition more rationally. Reference [14] developed a methodology for optimizing the long-term capacity configuration of large-scale multi-energy complementary bases, by synthesizing the objectives of cost, carbon emissions, and electric source–load deviation, and the results demonstrate that integrating Carbon Capture, Utilization, and Storage (CCUS) technology into large multi-energy complementary bases will help enhance the economic efficiency and low-carbon performance of the system.
Collectively, these studies indicate that carbon emissions have transitioned from an external outcome of power system planning and operations to an endogenous driver that critically shapes generation portfolios, transmission investments, and operational strategies [15]. Building on this paradigm shift, growing research efforts are now adopting a macro-techno-economic perspective to quantify the impacts of specific technologies—such as energy storage, transmission expansion, demand response [16,17], and diverse low-carbon power technologies [18]—on power system configuration evolution and electricity supply costs [19].
For instance, Reference [20] incorporated flexibility resources—including demand response and electric vehicles—into a generation–transmission expansion planning (GTEP) model. The study quantified the critical role of load-side flexibility in enabling low-carbon transitions for the Inner Mongolia West power system. Results demonstrate that enhancing load-side regulation capabilities significantly reduces investment requirements for energy storage infrastructure. Reference [21] developed the TIMES-30PE model, which incorporates inter-provincial transmission lines across multiple voltage levels for 30 provinces in China. The study examined cross-provincial electricity transmission and infrastructure planning under various carbon reduction targets. The results show that, compared with a scenario without carbon constraints, imposing a carbon constraint consistent with the 2 °C warming limit leads to a 58% increase in interregional power transmission by 2050, with the demand for ultra-high-voltage (UHV) transmission lines doubling. Reference [22] developed a multi-stage generation–transmission–load–storage planning model incorporating coal power transition strategies. This framework analyzed six transformation pathways for coal power under a net-zero carbon target, including natural retirement, early retirement, flexibility retrofitting, and carbon capture and storage (CCS). The results show that by 2060, total coal power capacity will decline to 423 GW, with its main role shifting to providing system flexibility and emergency reserves.
In summary, extensive research has employed either top-down [23] or bottom-up [24] modeling approaches to investigate low-carbon transition pathways in the power sector, focusing mainly on national-scale scenarios. These studies have explored the evolution of generation capacity and electricity mix under various decarbonization scenarios, often over planning horizons of 5 to 40 years [25]. They also quantitatively assessed the contributions of different low-carbon technologies in supporting system transformation [26,27]. However, regional heterogeneity in resource endowments and economic development leads to divergent energy consumption patterns and carbon mitigation responsibilities [28]. Few studies have incorporated provincial-level resource conditions and decarbonization requirements into long-term power system transition pathway analyses. Consequently, there remains a scarcity of studies conducting long-term power system transition pathway analyses that specifically incorporate a provincial-level resource endowment and carbon mitigation requirements. Furthermore, existing research requires enhanced focus on both inter-stage coordination throughout the power system’s low-carbon transition and the associated short-term operational constraints. As emphasized in [29], increasing attention must be paid to operational aspects such as unit flexibility, cross-regional power transmission, and demand response when developing electricity–carbon coupled long-term planning models [30].
Building upon existing research, this study develops a bottom-up optimization framework to explore the long-term transformation pathways of Guangdong Province’s power system under an electricity-carbon coupled planning paradigm. First, the intertemporal accumulation effect of carbon emissions is incorporated by constructing decarbonization trajectories under multiple scenarios, based on the carbon budget allocated to Guangdong’s power sector. Second, taking into account the province’s resource endowments and economic development stage, boundaries for the development of generation, transmission, and storage technologies are defined, along with long-term infrastructure goals. Third, a Carbon-Constrained Generation–Transmission–Storage Expansion Planning (GTSEP) model is developed to analyze the evolution of system structure and transition pathways under different decarbonization scenarios. Finally, a comparative analysis is conducted to evaluate the impacts of alternative carbon budgets and carbon peaking timelines on Guangdong’s power system structure, levelized cost of electricity (LCOE), and other critical performance indicators.

2. Carbon-Constrained GTSEP Model

2.1. Model Structure

The structure of the proposed Carbon-Constrained GTSEP Model is shown in Figure 1, which consists of three main components: model inputs, model constraints and objective function, and model outputs.
The model inputs consist of three major components:
  • Current power system status, which includes the existing development of generation–transmission–storage (GTS) infrastructure—such as network topology, installed capacities of various generation technologies, and energy storage systems. Additionally, it incorporates Guangdong’s regional resource endowments, with a particular emphasis on the spatial distribution and technical potential of VRE across different regions.
  • Development projections, covering electricity demand in terms of both annual energy consumption and peak load, as well as the techno-economic characteristics of major system components, including generation technologies, storage, and transmission infrastructure. These projections are shaped by expected technological advancements, resource development levels, and overall economic growth.
  • Development goals, incorporating both national mandates and provincial-level planning objectives, such as carbon emission reduction commitments, VRE deployment targets, and broader energy transition strategies formulated by Guangdong Province.
The objective function of the model is to minimize the total system cost over the planning horizon, which comprises capital investment, operating and maintenance costs, as well as penalty costs associated with wind and solar curtailment and load shedding. The model incorporates multiple constraints, including environment and policy constraints such as carbon reduction targets, resource boundary constraints of upper limits on various resource development and operational limits such as maximum available hours, system development goals constraints for reserve capacity and renewable integration to accommodate variable generation and maintain reliability, and operating security constraints ensuring the secure and reliable performance of generation, transmission, and storage components. Fundamentally, this model is formulated from a long-term evolutionary perspective, aiming to identify cost-optimal development pathways for the power system under low-carbon targets, while strictly adhering to technical, operational, and policy constraints. It is designed to reflect the temporal and spatial dynamics of system evolution over multi-decade planning horizons.
The model outputs comprise three key components:
  • Power system evolution pathways of Guangdong Province, detailing the temporal sequencing and spatial configuration of generation, transmission, and storage deployments. It provides insights into the evolutionary trajectory of the power system under various decarbonization scenarios.
  • Scenario-specific planning metrics, including full-cycle cost breakdowns, carbon emission trajectories, VRE penetration levels, and curtailment rates, allowing for a comprehensive comparison across different planning strategies.
  • Dispatch schedules, which illustrate the system’s hourly operational state under specific scenarios. These include generation outputs by technology, storage operations, and nodal power flows, enabling evaluation of intra-day system flexibility and operational feasibility under each scenario.

2.2. Model Settings

The increasing complexity of power systems planning models—driven by the proliferation of generation, transmission, demand, storage, and carbon emission elements [31] —along with longer planning horizons and higher spatial-temporal resolution, enables more scientifically grounded planning of power system transition pathways from a global perspective. However, these advancements also result in exponentially growing model solution times. To ensure the feasibility and accuracy of the planning outcomes, the model developed in this study is formulated based on the following assumptions.
Modeling units and spatial resolution: The provincial power system is partitioned into seven aggregated regions based on its developmental status and resource endowment. Each region is modeled as a distinct node, encompassing twelve aggregated generation and storage devices: coal-fired units, gas-fired units, biomass units, nuclear units, coal-fired with CCS units, gas-fired with CCS units, hydro units, onshore wind units, offshore wind units, photovoltaic (PV) units, battery energy storage (BES), and pumped hydro storage (PHS). Units of the same type are aggregated into a single representative plant within each node. For inter-regional power transmission, a pipeline model is employed, where electricity transfer between different regions is primarily constrained by the transmission line capacity, which assumes a fixed line loss rate of 2.5%. For specific transmission lines with predetermined power or energy transfer limits, contractual constraints on maximum/minimum power or energy transfers over given periods are imposed. Furthermore, external power imports to a specific node are modeled as an equivalent generation unit, where the transmitted power can either be pre-specified or optimized freely within certain predefined constraints. This unitized modeling approach significantly reduces the model complexity while retaining the operational characteristics of individual technologies and the critical inter-regional exchange and support capabilities.
Scenario design and temporal resolution: The model employs an hourly time resolution, starting from the 2025 construction status of the provincial power system, with five-year planning intervals to optimize the evolution of generation–transmission–storage configurations under different carbon emission trajectory constraints for 2030–2060. Considering the full 8760 h per year for each planning horizon would be computationally prohibitive. To address this, each 24 h period is defined as one operational scenario. Subsequently, the K-medoids algorithm is utilized to select seven typical days for each season within every planning year, resulting in a total of 28 scenarios per planning year. Furthermore, to capture the multi-timescale power balance characteristics of different storage types, the full annual time series is reconstructed and cross-day coupling constraints are implemented [32]. Hourly resolution enhances the model’s ability to capture the stochastic nature of VRE output and the corresponding flexibility requirements. Crucially, this approach overcomes the limitation of conventional representative days in accurately depicting the cross-day regulation capability of seasonal storage resources.
System boundaries and techno-economic parameters: All investment-related expenditures in the model are converted into equivalent annual values, and all costs in each planning year are discounted to 2025 using a 6% discount rate. The limits on VRE development, generation profiles, and cost curves for low-carbon power technologies are sourced from the Global Renewable-Energy Exploitation Analysis (GREAN) database developed by the Global Energy Interconnection Development Cooperation Organization [33].

2.3. Model Assumptions

Based on the aforementioned modeling framework and settings, the Carbon-Constrained GTSEP Model is developed under the following two key assumptions:
  • The model employs the NC-RCUC (Network-Constrained Relaxed Clustered Unit Commitment) [34] approach to aggregate thermal generating units with similar operational and start-up characteristics into representative clusters. This clustering methodology enables the linearization of the unit commitment problem, thereby achieving computational acceleration in the spatial dimension while maintaining modeling fidelity.
  • The model adopts a time-series aggregation approach for long-term planning horizons, utilizing the K-medoids clustering algorithm to select seven representative days within each season of every planning year as planning scenarios [32]. This temporal dimension reduction strategy enables computationally efficient solution of the multi-year expansion problem while preserving the essential characteristics of seasonal and daily operational patterns.

2.4. Objective Function and Constraints

The model’s objective function is to minimize the total cost discounted to 2025, which includes investment, operation, maintenance, and penalty costs for the provincial power system across planning years from 2030 to 2060, as shown in Appendix A. Investment costs comprise the annualized cost of one-time capital expenditures for generation units, transmission lines, energy storage systems, and other equipment. Operating costs include marginal fuel costs for coal-fired and gas-fired power units, as well as start-up and shut-down costs for various types of generating units. Maintenance costs represent the expenses required to maintain normal operation such as offshore wind farms, energy storage systems, transmission lines, and other units and equipment. Penalty costs are associated with wind and solar curtailment and load shedding.
The constraints can be categorized into environmental and policy constraints, re-source boundary constraints, operating security constraints, and system development goals constraints.
Environmental and policy constraints include:
  • Carbon emission trajectory: In each planning year, the carbon emissions generated by system operation must be less than the carbon emissions specified by the carbon emission trajectory curve. The system’s carbon sources encompass direct carbon emissions from coal-fired and gas-fired generation within the geographical scope of provincial power systems, as well as indirect emissions from imported electricity [35].
  • VRE penetration requirements: Provincial energy development plans stipulate requirements for the development of both the installed capacity share and the electricity generation share of VRE.
  • External power import commitments: For certain transmission corridors with pre-signed power purchase agreements, the agreed-upon performance must be fulfilled according to contractual requirements.
Resource boundary constraints include:
  • Construction limits: Capacity expansion boundaries for VRE technologies are sourced from the GREAN database, while thermal generation and transmission are constrained by energy policy. Electrochemical storage is exempt from these limits.
  • Utilization hour: Constraints are imposed on the minimum and maximum utilization hours for coal-fired, gas-fired, biomass, nuclear, hydro, BES, PHS, and certain transmission lines, taking into account local resource endowments and historical maintenance schedules.
  • Output profiles: Hydropower generation is modeled with a three-segment output structure (minimum technical, dispatchable, and expected output), while wind and PV generation must remain within GREAN-provided output profiles.
System development goals constraints include:
  • Reserve requirements: After accounting for VRE output forecast errors, the total output of various types of units and storage must exceed the electricity demand, which includes a required load reserve.
  • VRE curtailment limits: When system flexibility is insufficient, limited wind and solar curtailment is allowed at a penalty cost. Furthermore, the rates of wind and solar curtailment cannot exceed a specified proportion.
  • Inter-year capacity linkage: For any asset, newly added and retired capacities are considered each planning year; for non-retired assets, capacity must be no less than in the previous planning year.
Operating security constraints include:
  • Nodal power balance: At any operational time step, every node in the system must satisfy real-time balance between power generation and power consumption.
  • Capacity limit: At any operational time step, power output of generation units and energy storage, as well as power flows through transmission lines, shall not exceed their respective rated capacities.
  • Thermal unit commitments: Coal-fired, gas-fired and nuclear units must satisfy minimum up/down times, minimum output ratios and incur start-up/shut-down costs for each transition.
  • Ramp rate limits: All generation and storage technologies are required to satisfy both ramp-up and ramp-down constraints.
  • Energy storage operation: BES is modeled to complete charging and discharging cycles daily with equal start/end states of charge (SOC), without considering battery degradation. PHS follows annual energy balance.
  • Transmission line modeling: Transmission between different regions follows a transportation model [36], with a fixed line loss rate of 2.5%.
  • Units with CCS operational constraints: Coal-fired CCS and gas-fired CCS units have a carbon capture rate of 90%. The capture system reduces net power injected at the bus below gross generation [37].
Notably, the proposed planning model in this paper is essentially a large-scale linear programming framework in the field of power system planning, demonstrating broad applicability across various planning contexts including generation capacity expansion, transmission network expansion, energy storage deployment, and long-term power system evolution pathway studies. While the model accounts for key techno-economic drivers—such as resource availability, technology costs, and hourly operational constraints—it inevitably abstracts from certain real-world complexities. These include short-term disturbances such as extreme weather events, delays arising from political or regulatory processes, challenges related to social acceptance, and the volatility of real-time market prices.
Moreover, the planning model employed in this paper exhibits high extensibility, allowing for the incorporation of additional constraints as needed. This extensibility provides opportunities to integrate perspectives from the circular economy [38] and waste management [39] into decarbonization modeling, which are critical components of the energy transition. Embedding such cross-sectoral linkages into power system planning would enrich the robustness of decarbonization pathways and broaden the sustainability dimensions of the energy transition.

3. Case Studies

3.1. Carbon Emission Reduction Scenario Settings and Regional Characteristics

Based on reference [40], this paper defines three carbon emission reduction pathways for Guangdong Province’s power system [41,42]: (1) a 2.0 °C warming target with peaking in 2030 (Scenario 1); (2) a 2.0 °C warming target with peaking in 2025 (Scenario 2); and (3) a 1.5 °C warming target with peaking in 2025 (Scenario 3). The defining characteristics of each scenario are summarized in Table 1.
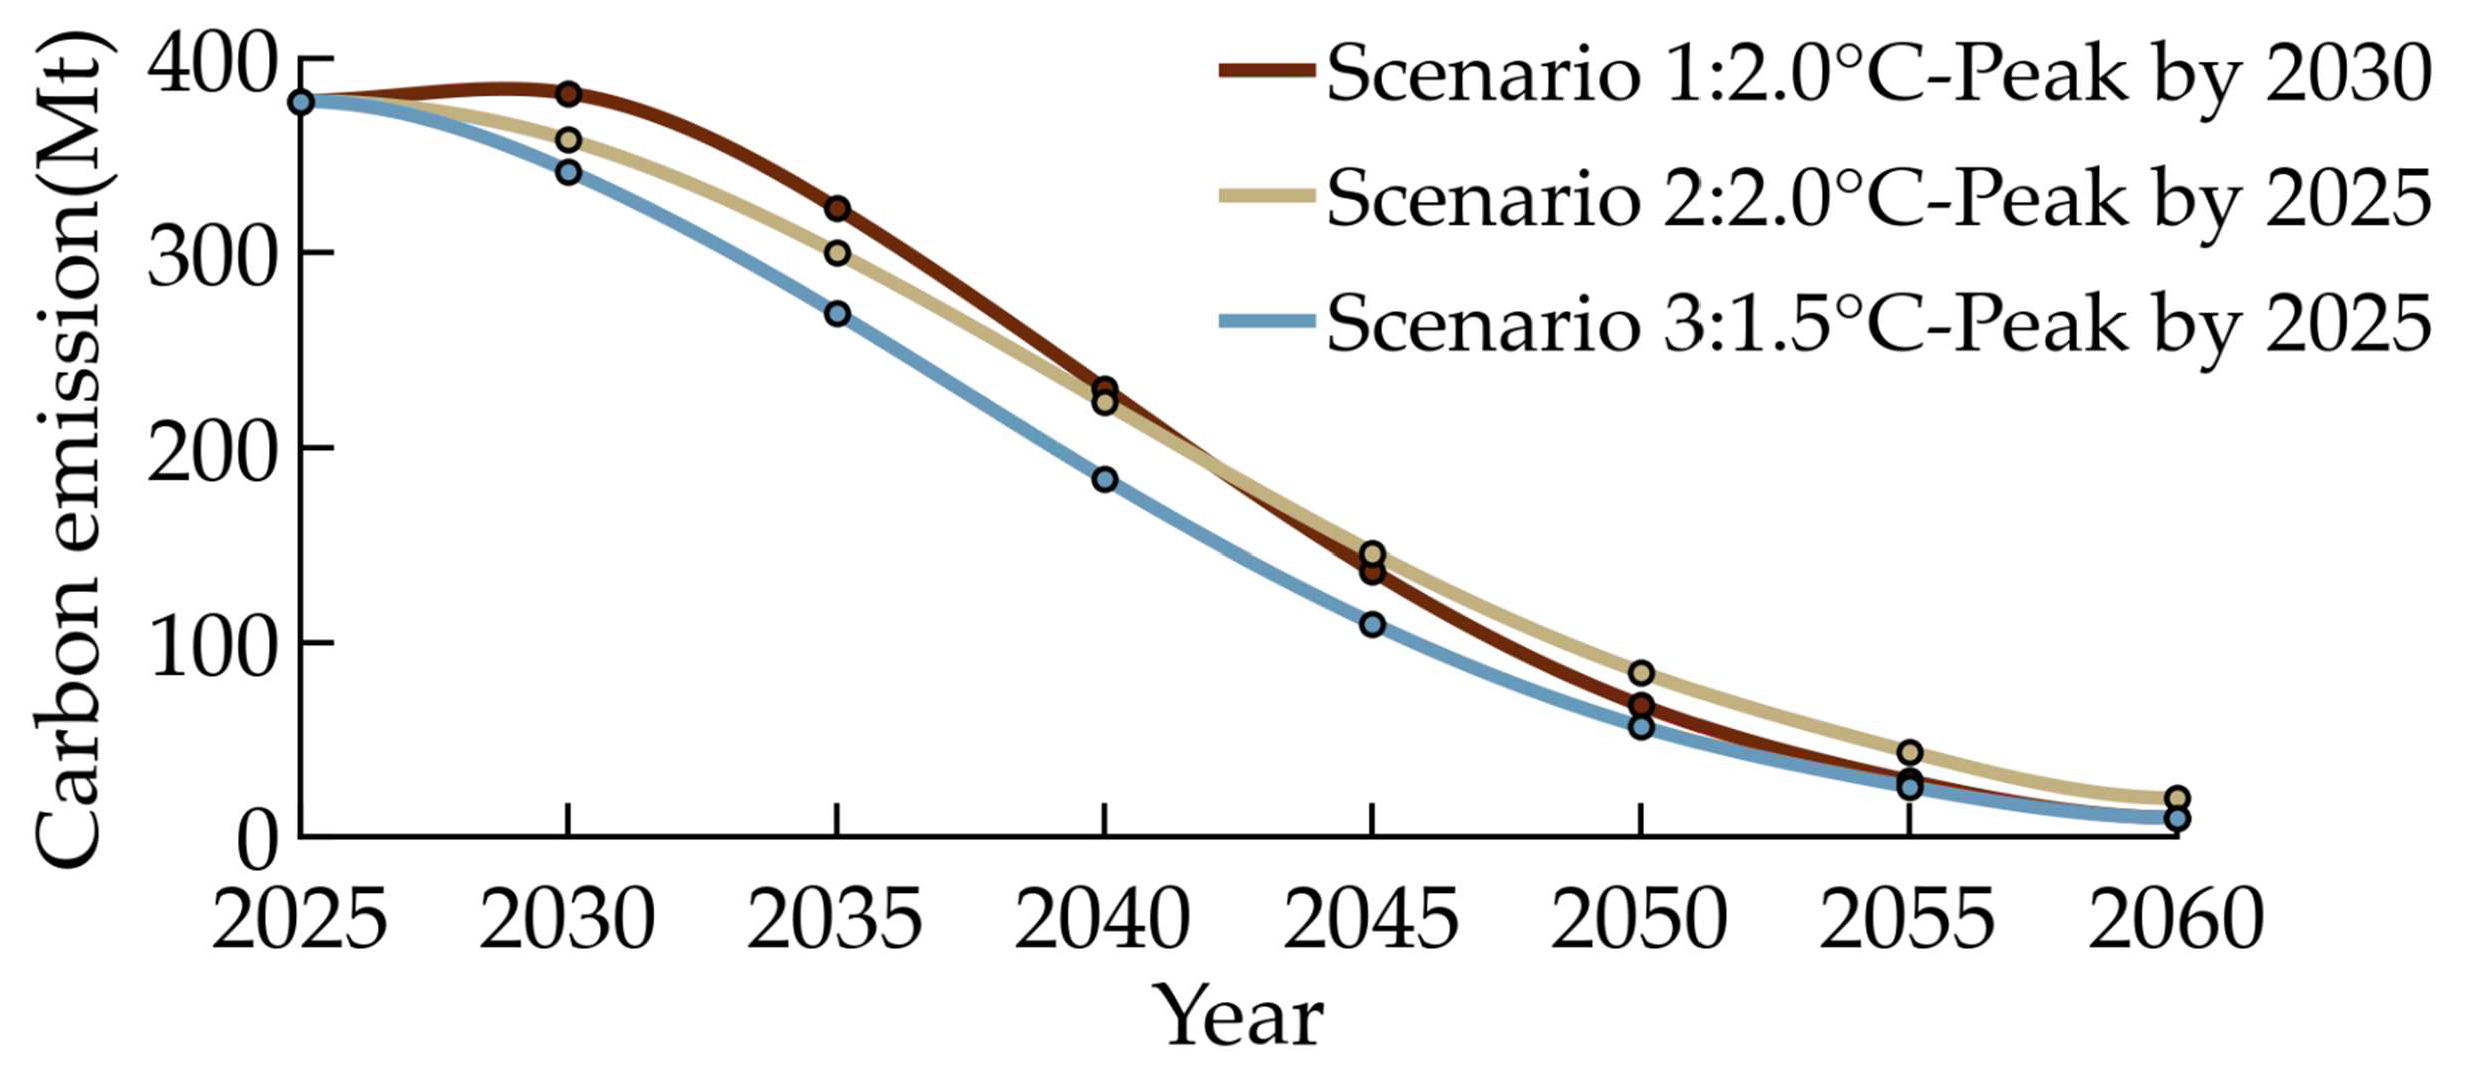
Under the 1.5 °C and 2.0 °C global warming targets, the national power-sector carbon budgets for 2025–2060 are 76.7 Gt and 85.0 Gt, respectively, correspondingly, the provincial budgets for Guangdong are 6.0 Gt and 6.8 Gt. Scenario 1 serves as the baseline scenario, featuring a plateau in carbon emissions from 2025 to 2030, with a definitive peak of 382 Mt in 2030, followed by a decarbonization period from 2030 to 2060. Under the same cumulative carbon budget, Scenario 2 brings the peak forward to 2025, with a peak year emission of 378 Mt and a subsequent decarbonization period from 2025 to 2060.
On the basis of the 2025 peaking target, Scenario 3 further tightens the cumulative carbon budget to 6.0 Gt, representing a more aggressive emission reduction requirement. In summary, under identical temperature control targets, adjusting the peaking year shapes the reduction pathway, while tightening the temperature target further contracts the budget and necessitates a more accelerated energy structure transformation.
Furthermore, a comparative analysis of the carbon emissions trajectories and mitigation rates across different scenarios reveals that achieving an earlier peak can effectively alleviate future emission reduction pressures. Under the same carbon budget, Scenario 1’s decarbonization period (2030–2060) requires an average annual reduction rate of 12.9%, whereas Scenario 2’s decarbonization period (2025–2060) requires an average annual reduction rate of 8.8%. A five-year delay in achieving the carbon peak necessitates a 46.6% increase in the average annual reduction rate.
As illustrated in Figure 2, an earlier peak can prevent a steep reduction curve in later stages, thereby mitigating systemic transition risks. Notably, although Scenario 3’s cumulative carbon budget is 11.8% lower than that of Scenario 1, its average annual reduction rate during the decarbonization period is 15.3% lower—a consequence of earlier peaking followed by a more gradual decline.
Table 2 presents the load distribution, existing thermal power capacity distribution, and future VRE development potential across seven regions in Guangdong Province. As shown in Table 2, Regions 1–4 constitute the primary load centers of Guangdong Province, accounting for 75% of the total annual electricity consumption. Meanwhile, Regions 1, 3, and 5 serve as the core areas of existing thermal power capacity, with nearly 60% of the total installed thermal power located in these three regions. Furthermore, Regions 1–4 account for roughly 72% of the existing thermal power installations, which aligns relatively closely with their proportion of electricity load. However, the future developable VRE is primarily concentrated in Regions 5 to 7, where the VRE capacity potential accounts for approximately 62% of the province’s total VRE installation potential. This spatiotemporal mismatch between load demand and VRE resources poses significant challenges to the planning, construction, and operation of the power system in Guangdong Province.
Finally, the proposed Carbon-Constrained GTSEP model is implemented in Python 3.12.7 using the Pyomo 6.9.4 package and solved by IBM ILOG CPLEX 12.10, with the server configured with an Intel i5-1240P 1.70 GHz CPU and 16 GB RAM (Intel, Santa Clara, CA, USA).

3.2. Power System Transition Pathway Analysis for Scenario 1

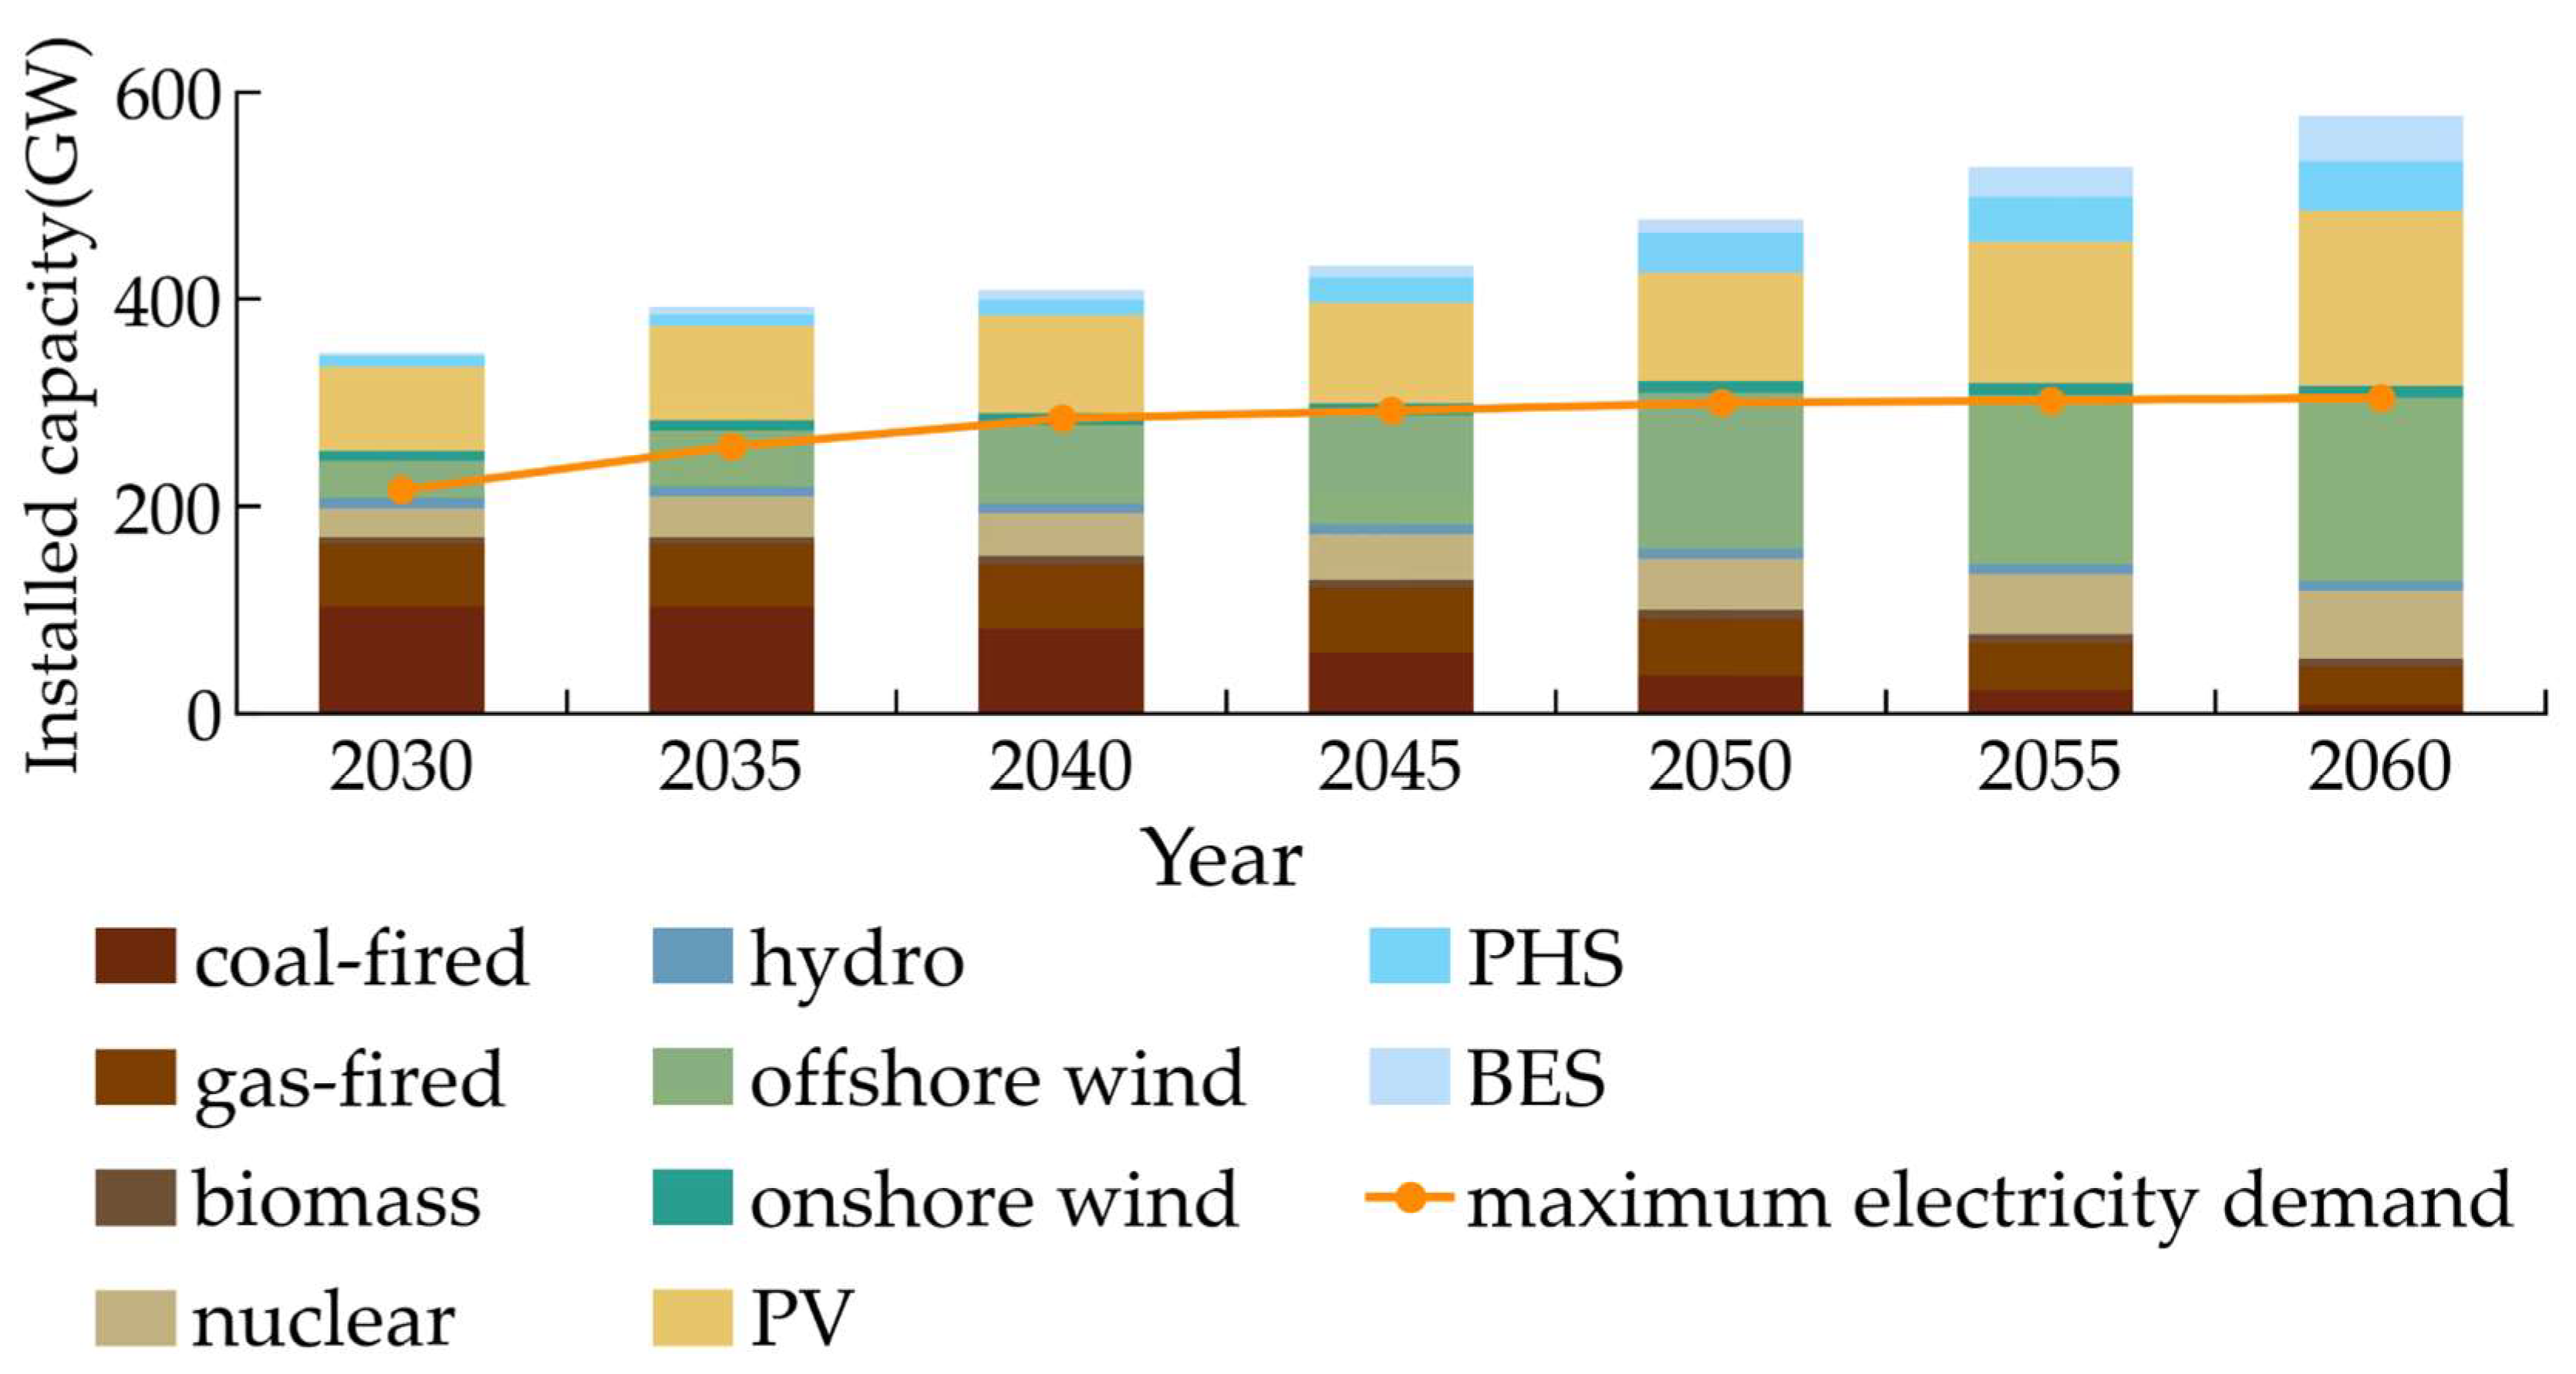
Under the carbon trajectory aligned with 2.0 °C global warming targets and carbon peaking in 2030, the Guangdong power system exhibits a significant structural shift in its installed capacity mix, as shown in Figure 3. Driven by both sustained load growth and the onset of emissions reduction, coal-fired and gas-fired generation undergo structural transformation and gradual phase-out, while VRE becomes the system’s primary backbone resource.
Thermal capacity peaks at 170 GW in 2035 and is subsequently managed through staged retirements and CCS retrofits. This shift signifies a transition from carbon-constrained capacity expansion toward carbon reduction of existing assets. By 2060, over 90% of coal-fired units are anticipated to be formally phased out, with all remaining units fully equipped with CCS.
Gas-fired power units, acting as system flexibility resources, sustain an installed capacity of approximately 62 GW from 2030 through 2045 despite declining utilization hours, and then enter a phased retirement. By 2060, about 37 GW of CCS-retrofitted gas-fired units remain in operation, continuing to provide critical flexible support for system reliability.
Nuclear and biomass capacity experience steady growth between 2030 and 2060. Biomass increases from 5.5 GW to around 7.3 GW, and nuclear grows from 28.4 GW to 65.9 GW, offering essential baseload capacity throughout the transition.
VRE becomes the dominant capacity source. Offshore wind experiences a significant boom between 2030 and 2050, with installed capacity surging from 36.1 GW to 150.4 GW—an average annual increase of 5.7 GW—making it the largest contributor to new capacity additions during this period. From 2050 to 2060, the expansion of offshore wind capacity is anticipated to slow, with average annual installations decreasing to approximately 2.6 GW. Consequently, cumulative offshore wind capacity is expected to reach 176.8 GW by 2060. Meanwhile, constrained by the upper limits of exploitable resources, onshore wind installed capacity is projected to increase from 9.6 GW in 2030 to 11.3 GW by 2060, demonstrating limited growth.
PV experiences moderate growth between 2030 and 2050, with an average annual capacity addition of 1.2 GW. However, during the deep decarbonization phase from 2050 to 2060, PV enters a period of accelerated deployment. This surge is driven by multiple factors, including the accelerated phase-out of coal-fired power units, the approaching saturation of viable offshore wind resources, and ongoing cost reductions resulting from technological advancements. During this period, annual PV additions increase to approximately 6.4 GW. By 2060, the total installed solar PV capacity reaches 169.1 GW.
Energy storage installation growth exhibits a distinct accelerating trajectory, strongly correlated with the rising penetration of VRE and the evolution of traditional flexible resources, such as gas-fired power. Notably, PHS and BES demonstrate complementary deployment patterns. During 2030–2040, VRE generation in Guangdong accounts for less than 25% of total electricity output, with sufficient flexibility provided by existing gas-fired units and PHS. Consequently, storage expansion remains moderate.
As VRE penetration accelerates beyond 2040, both PHS and BES deployments enter alternating periods of rapid expansion. From 2040 to 2060, BES additions average 1.7 GW per year—initially modest but accelerating in the latter half—while PHS adds about 1.6 GW annually, with faster growth early on tapering toward 2060. By 2060, BES capacity climbs from 3.3 GW in 2030 to 44.1 GW, while PHS capacity increases from 9.7 GW to 47.8 GW. Critically, the ratio of storage capacity to installed VRE capacity increases from 10% in 2030 to 26% in 2060. This trend illustrates the growing marginal demand for system flexibility: accommodating each additional unit of VRE requires an increasingly larger proportional share of storage capacity. By 2060, Guangdong establishes a multi-resource flexibility portfolio integrating gas-fired CCS units, coal-fired CCS units, PHS, and BES to balance VRE output.
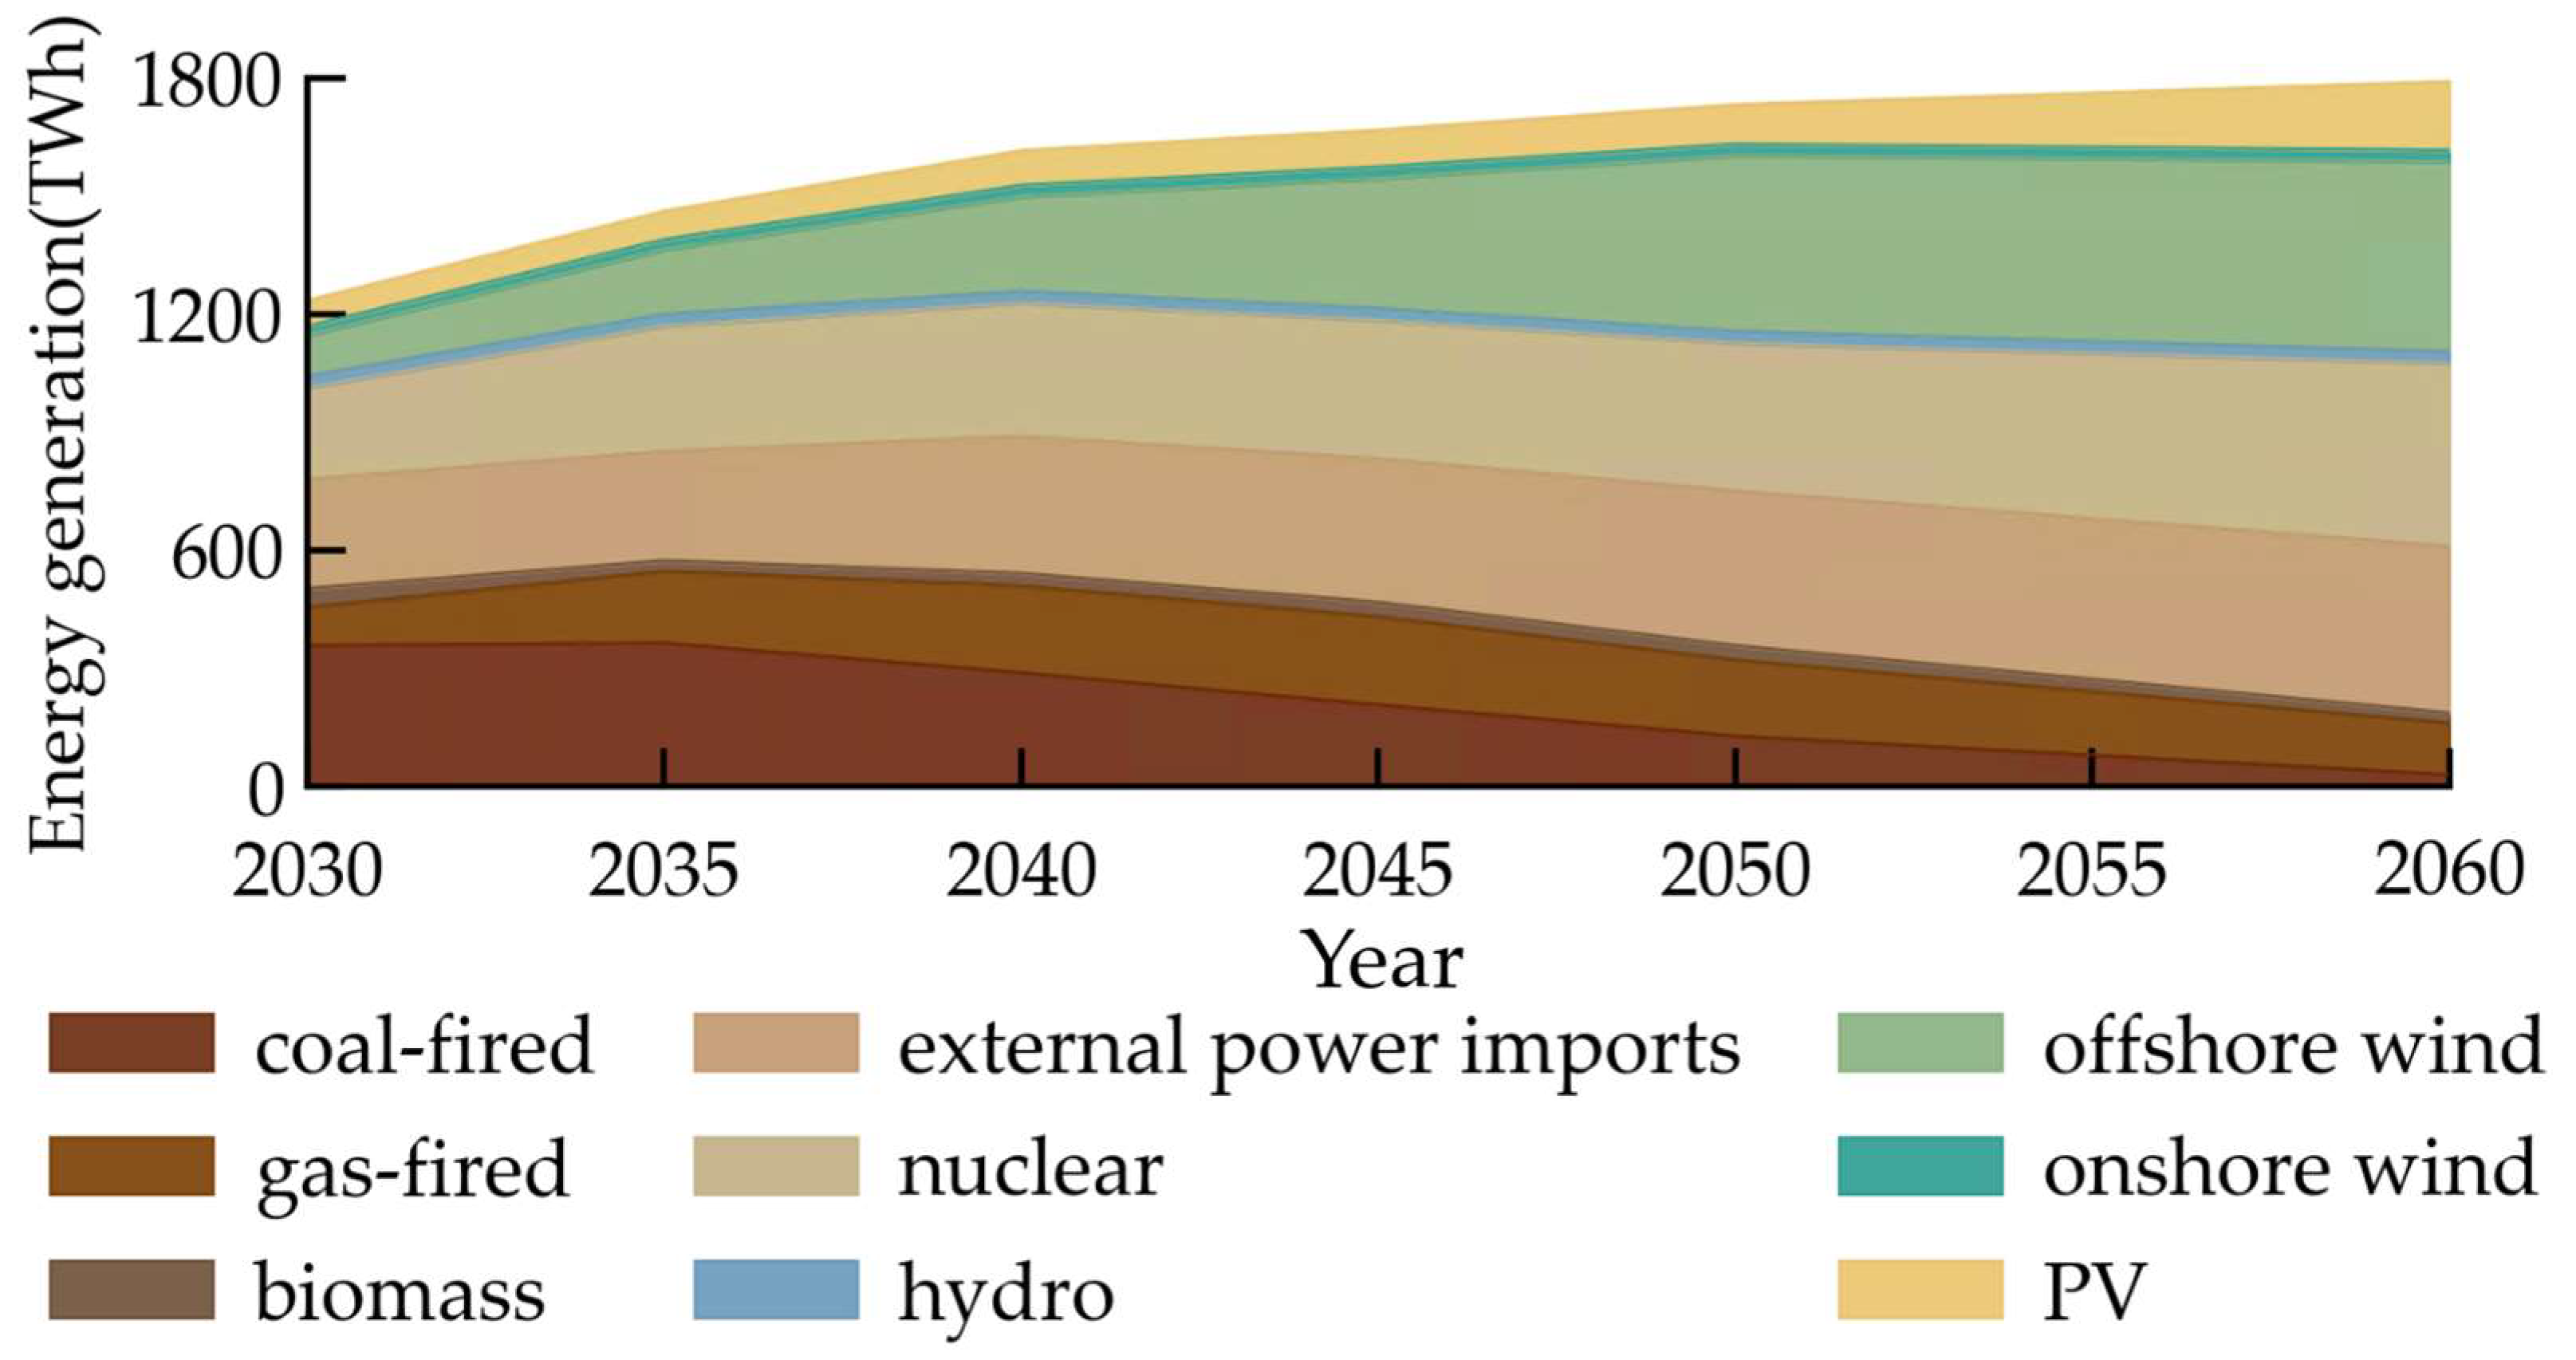
As shown in Figure 4, under the baseline scenario, the electricity generation mix of Guangdong Province in 2030 is primarily composed of coal-fired power (30%), external electricity imports (23%), and nuclear power (19%). By 2060, the composition shifts significantly, with external electricity imports (20%), nuclear power (27%), and VRE sources (40%)—particularly offshore wind power (28%)—becoming the dominant contributors. This transition underscores the province’s systematic decarbonization pathway driven by VRE integration and cross-regional power coordination.
The period from 2030 to 2035 represents a stage of gradual emissions reduction. Driven by increasing electricity demand, carbon-emitting thermal generation—including coal-fired power, gas-fired power and biomass—reached its peak output of 573.2 TWh in 2035, accounting for 40% of total electricity consumption. Within this portfolio: coal-fired power generation is anticipated to remain largely constant, while gas-fired power generation is expected to show a gradual increase. Decarbonization efforts during this phase primarily rely on the retrofitting CCS technology onto existing coal-fired and gas-fired units. By 2035, CCS-equipped plants contributed 32% of total thermal generation.
The period from 2035 to 2050 marks a phase of rapid decarbonization, during which carbon emissions decline by approximately 83% compared to the peak level. This stage is characterized by a structural transformation in the composition of thermal power generation. Generation from coal-fired power units drops significantly from 364.1 TWh to 127.8 TWh, with its generation share decreasing from 25.2% to 7.6%. Meanwhile, gas-fired and biomass generation follow a trajectory of gradual increase in the early years, followed by a modest decline. These sources continue to provide critical energy support during the initial phase of rapid emissions reduction, helping to ensure system reliability and adequacy. Notably, offshore wind power enters a period of rapid expansion during this phase, with an impressive compound annual growth rate (CAGR) of 7.0% in electricity generation. Consequently, decarbonization in this phase is primarily driven by the replacement of high-carbon-emitting thermal power generation with low-carbon and renewable energy sources.
The period from 2050 to 2060 represents the deep decarbonization phase, during which annual power sector CO2 emissions fall to the million-metric-ton range. By 2060, the combined electricity generation from coal-fired, gas-fired, and biomass units declines to 186.1 TWh, entirely provided by CCS-retrofitted facilities. These plants serve primarily as flexible resources, supporting system balancing and grid reliability under high shares of VRE.
In summary, the transition of Guangdong’s power system is anchored by a stable contribution from external power imports and nuclear power, which consistently supply 45–50% of total generation. VRE emerges as the primary source of incremental growth, with its share rising from less than 20% in 2030 to over 40% by 2060. In contrast, conventional thermal power undergoes structural differentiation and a gradual phase-down. Due to natural resource endowments, the expansion potential of hydropower and onshore wind remains limited.
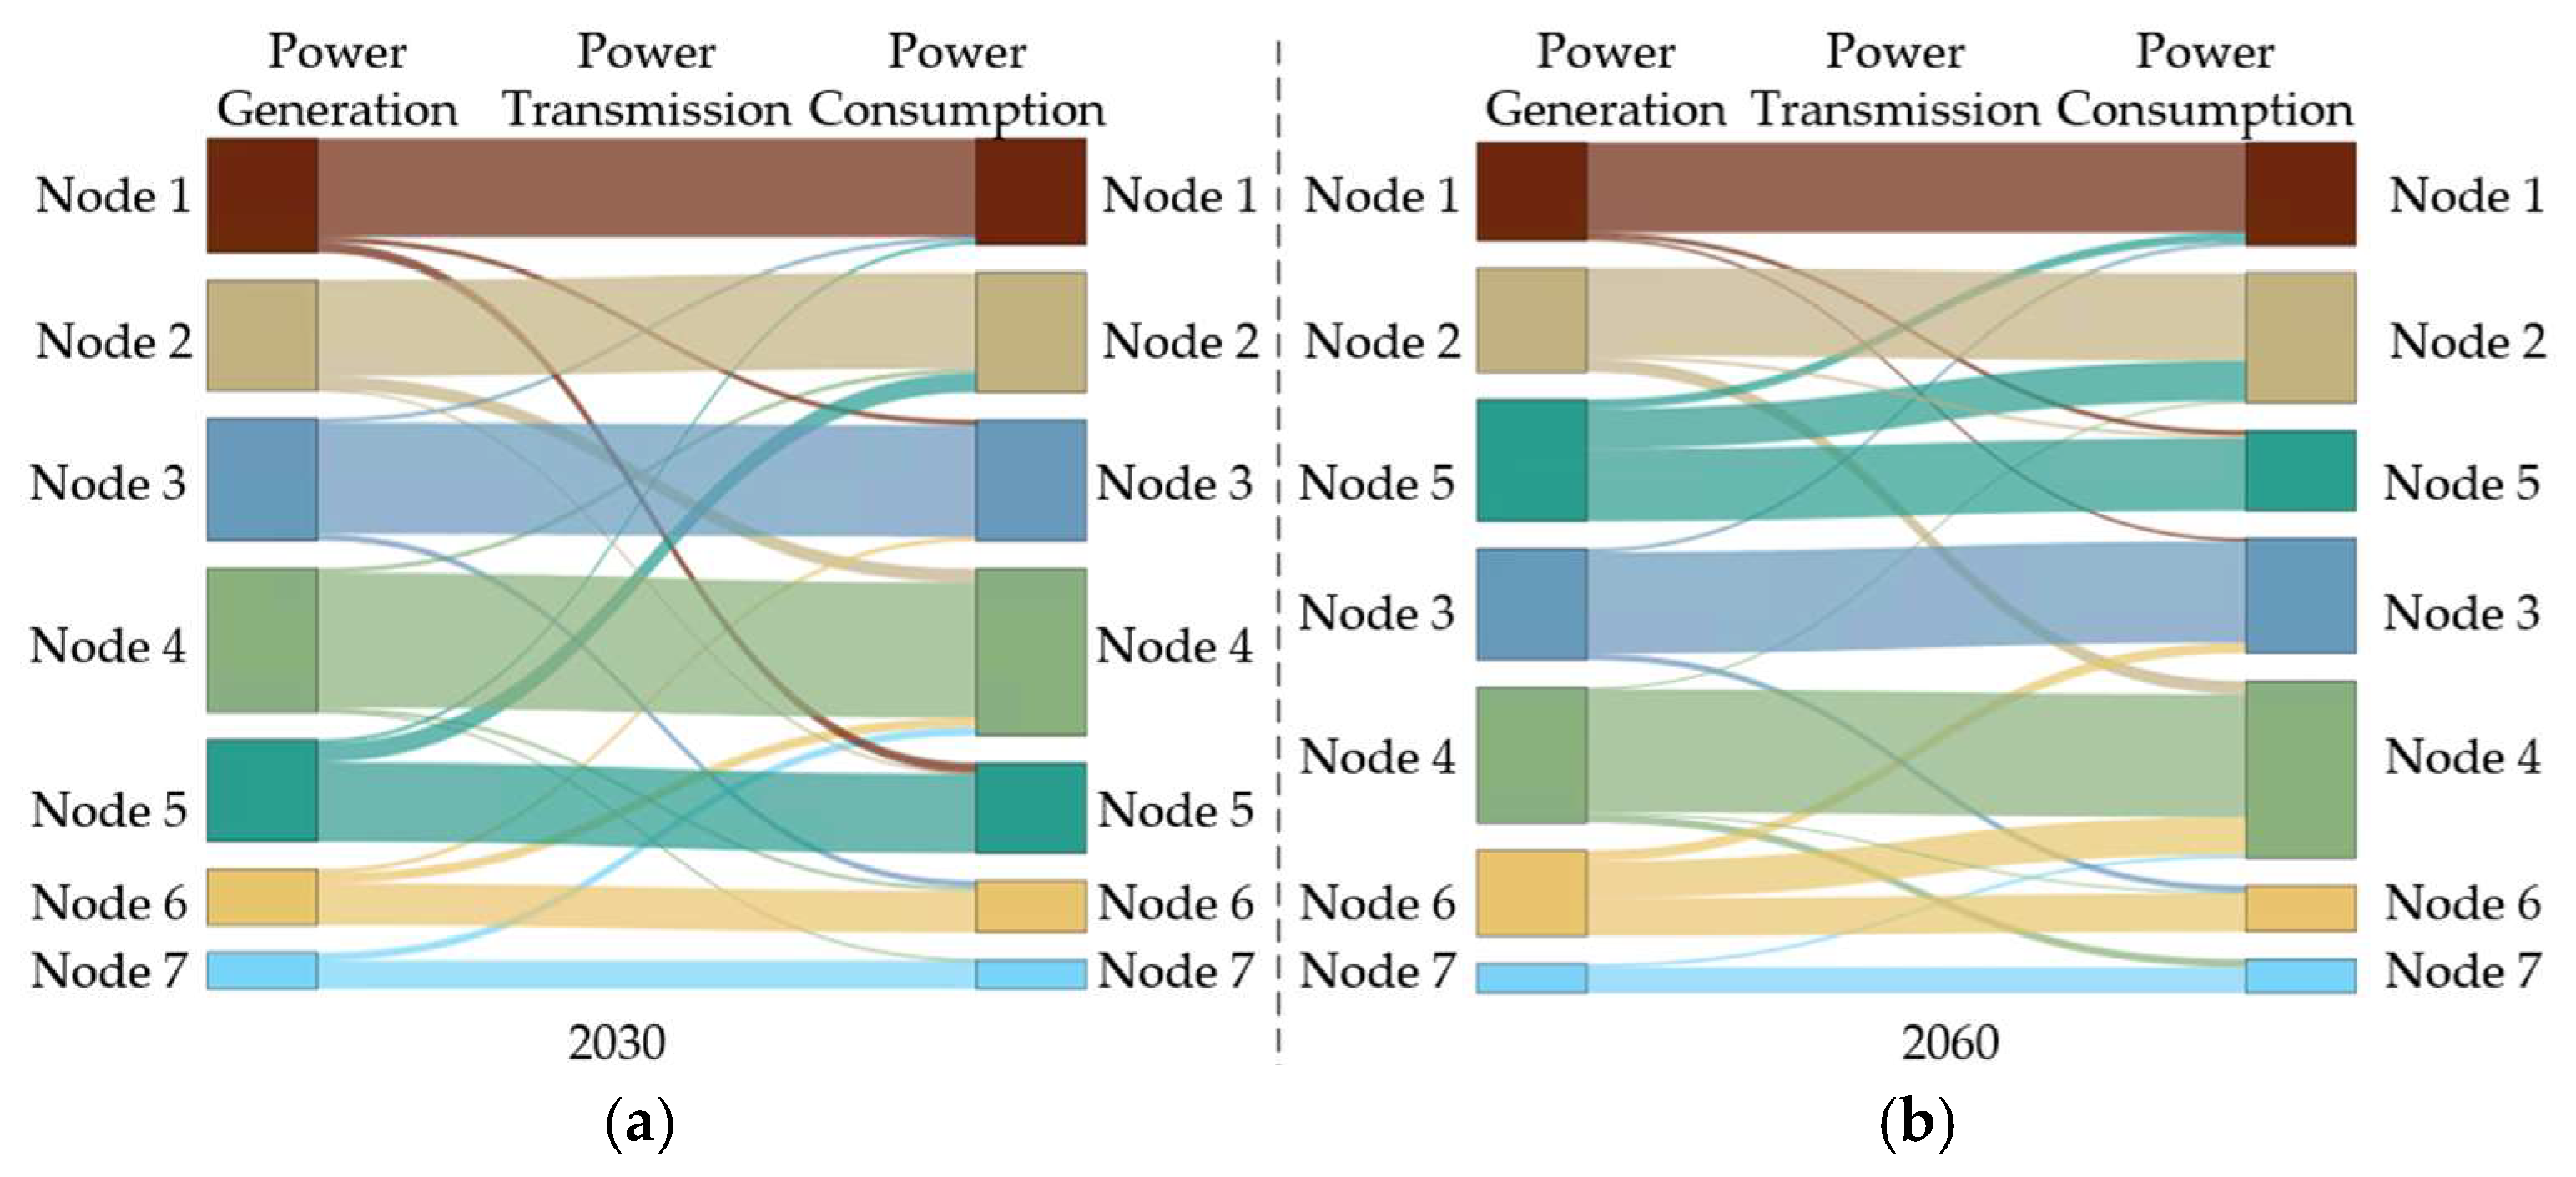
Figure 5 presents the electricity exchange patterns across different nodes in Guangdong Province under Scenario 1 for the years 2030 and 2060. The Sankey diagrams illustrate the relationships between power generation, transmission, and consumption, highlighting the increasing role of inter-regional electricity flows in balancing spatial mismatches between supply and demand.
The growth of inter-regional power transmission substantially outpaces that of load demand. In 2030, the inter-regional electricity transmission among different regions reached 197 TWh, accounting for 16.1% of the total electricity consumption. By 2060, this volume increased to 463 TWh, accounting for 27.4% of the total electricity consumption. The increase in inter-regional power transmission is primarily driven by increased VRE penetration and the spatiotemporal mismatch between load centers and renewable resource locations. Nodes 5 and 6 contribute the most significant increases in inter-regional transmission volume, with an additional 109 TWh for Node 5 and 121 TWh for Node 6. Notably, Nodes 5 and 6 represent the eastern and western coastal regions of Guangdong Province, respectively, areas characterized by high concentrations of wind and solar resources. By 2060, the installed wind power capacity in Nodes 5 and 6 is projected to reach 110.4 GW, accounting for 58.8% of the province’s total wind capacity, while PV capacity will reach 91.4 GW, representing 54.1% of the total PV capacity. Given their relatively modest local load, substantial transmission capacity is required to export surplus VRE generation from these regions to demand centers.
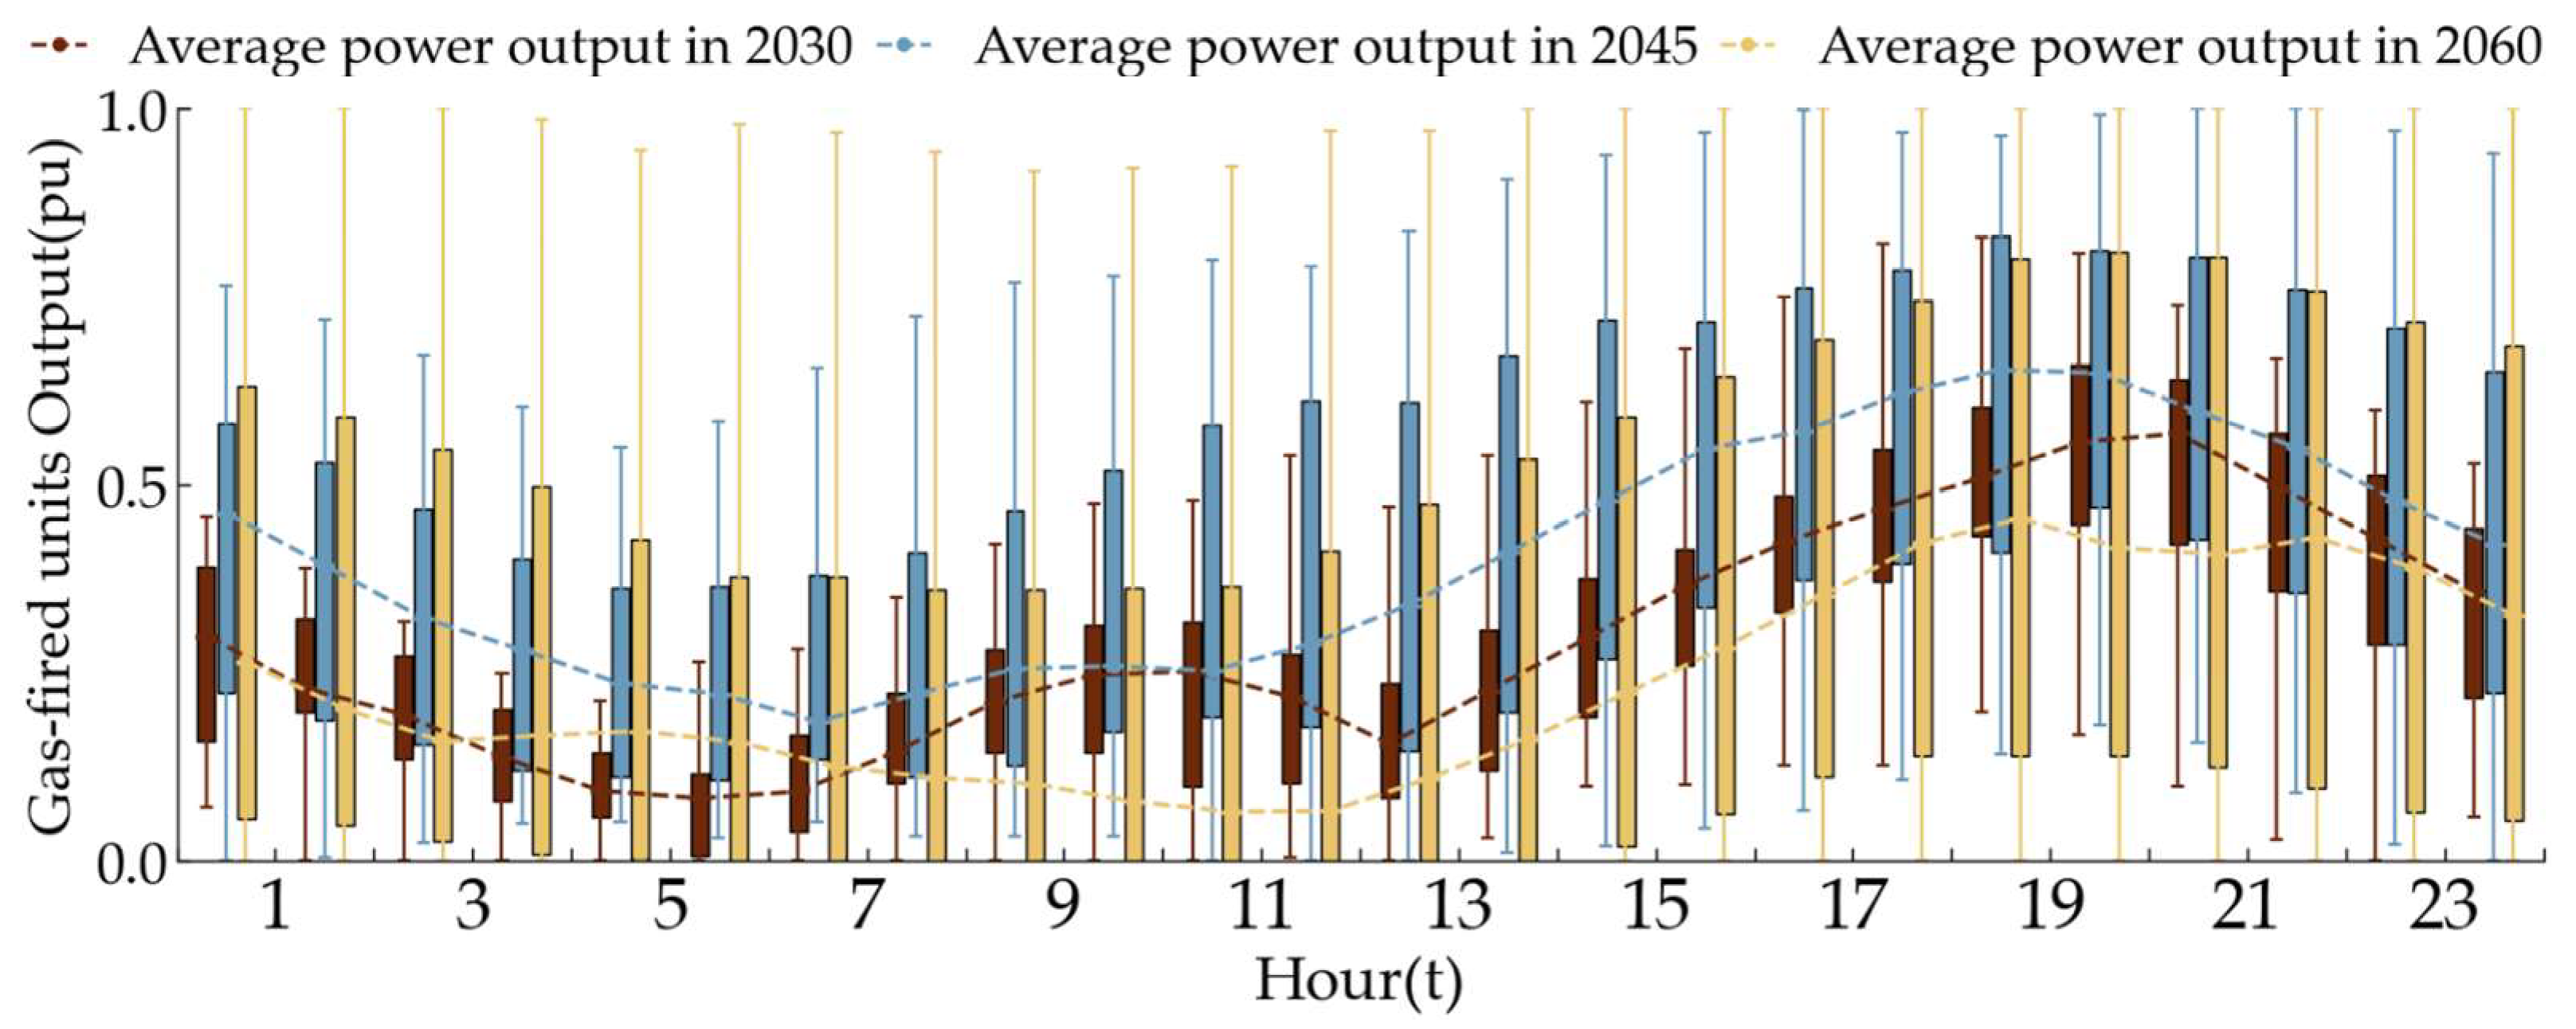
Figure 6 illustrates the diurnal variation in power output from gas-fired units under Scenario 1, elucidating the transitional operational dynamics of gas-fired units in response to escalating VRE penetration. The hourly average output, expressed in per-unit values, is depicted for the years 2030, 2045, and 2060. Distinct curve styles represent each year: a red dotted line for 2030, blue dash-dotted for 2045, and yellow dashed for 2060. Vertical error bars accompanying each data point indicate the range of output variability at corresponding hours.
In 2030, 2045, and 2060, the fluctuation ranges of gas-fired power output are 0.47 pu, 0.78 pu, and 0.98 pu, respectively, demonstrating that as VRE penetration increases, the variation amplitude of gas-fired power output also increases, signifying a growing demand for flexibility provision. Furthermore, the average gas-fired power output exhibits a trend of first increasing and then decreasing. This is primarily attributed to the rapid phase-down of coal-fired power during the 2035–2050 period, which led to an increase in gas-fired power utilization hours. Consequently, the average gas-fired power output in 2045 is higher compared to that in 2030. However, during the deep decarbonization phase from 2050 to 2060, gas-fired power output is deliberately curtailed to achieve further carbon emission reductions, with these plants operating predominantly at low output levels, particularly during midday periods when PV generation reaches its peak.
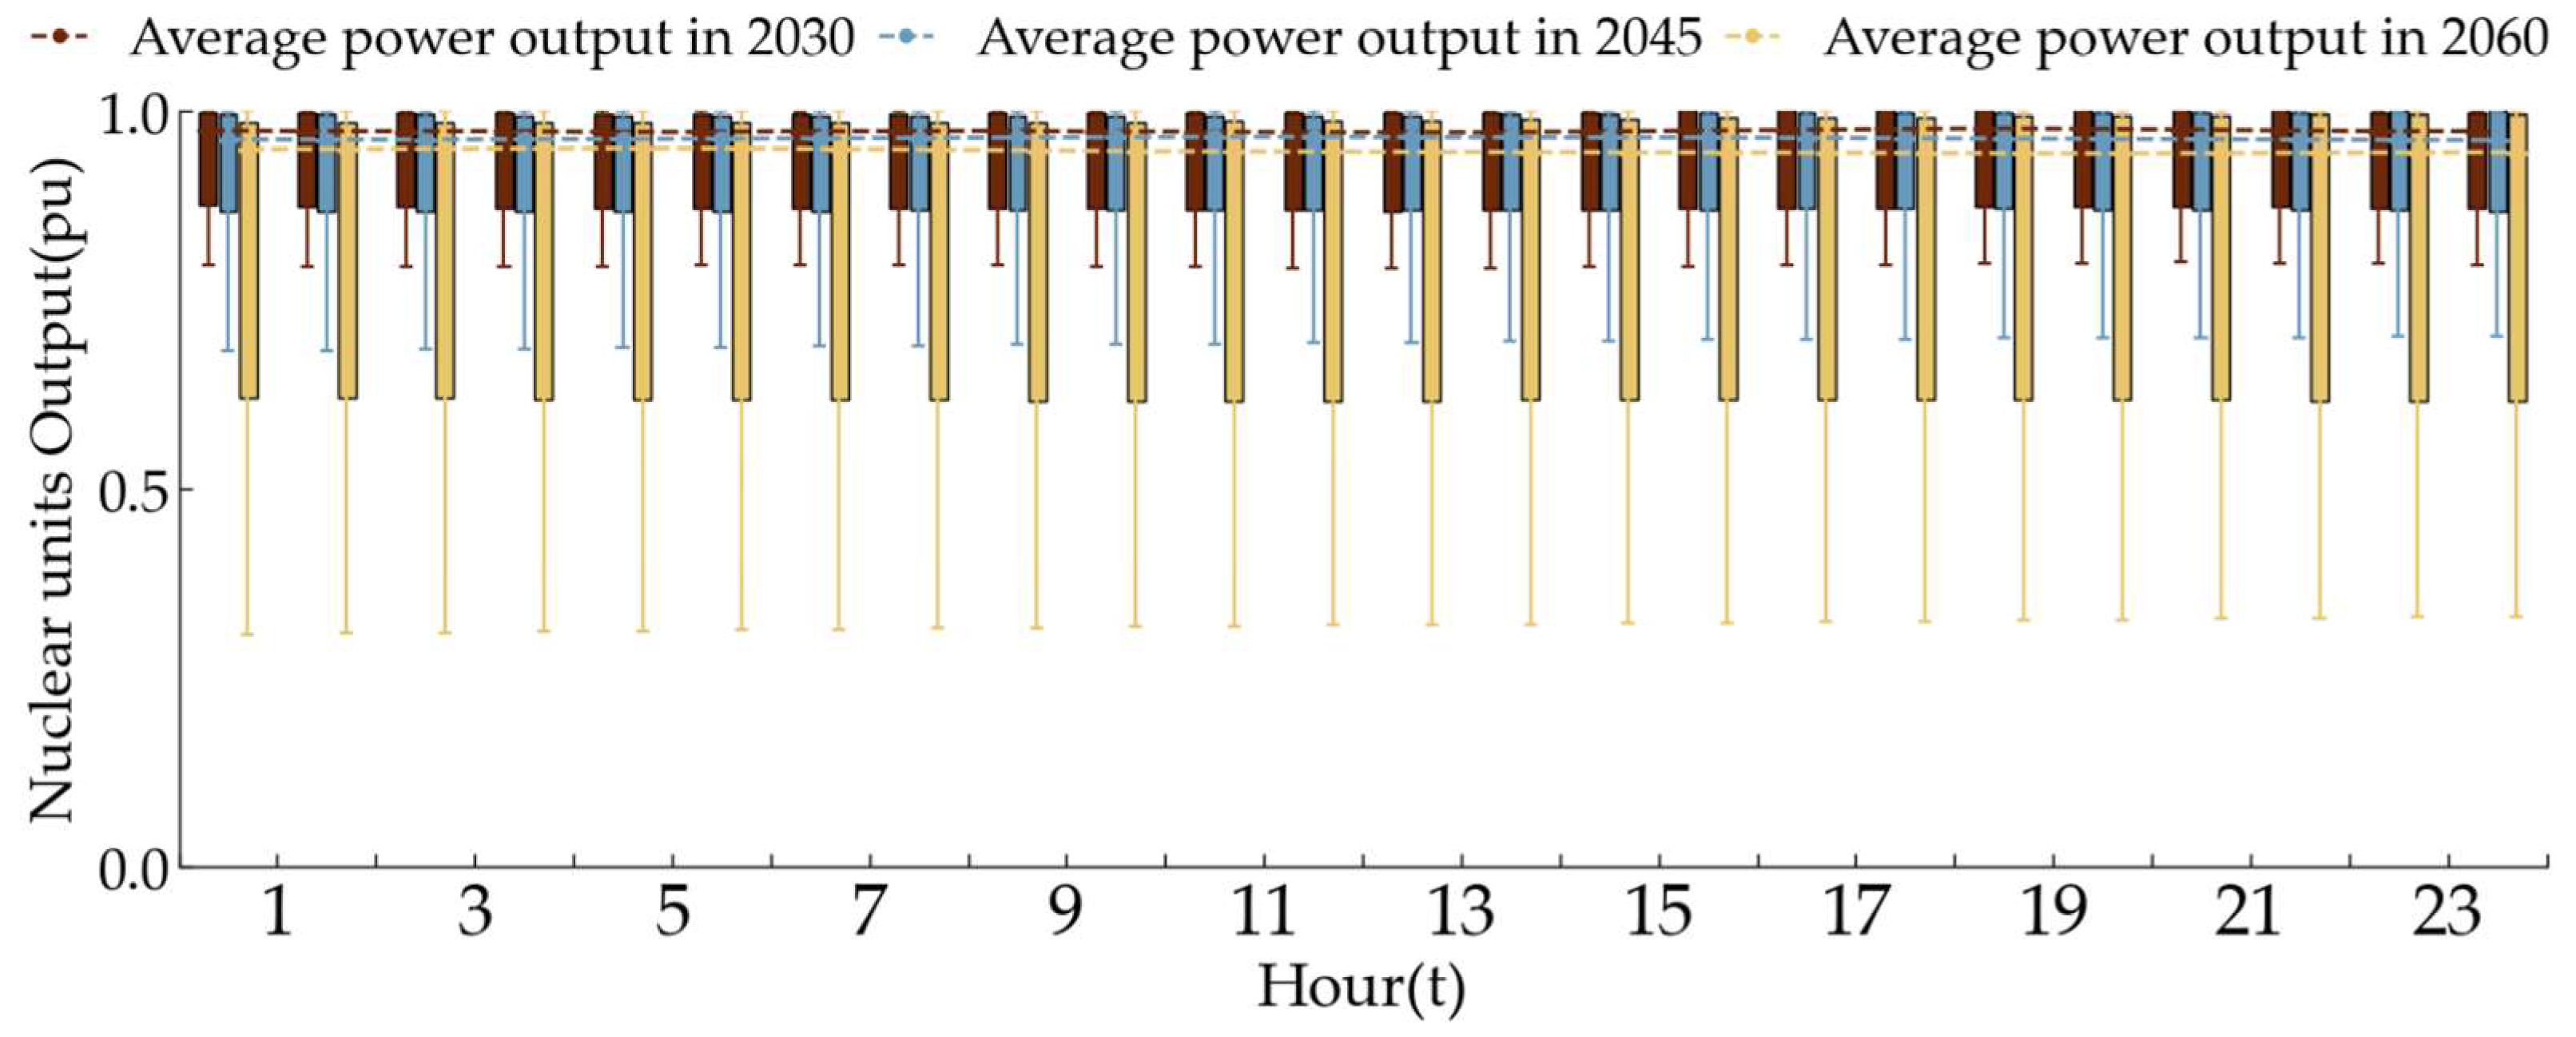
Figure 7 shows the diurnal variation trends of nuclear power output. Although the average output remains essentially constant to maintain economic viability, the variation range of nuclear output still widens across the years, indicating that future nuclear operation will adopt more flexible dispatch modes to accommodate the growing variability of the power system driven by high VRE penetration.

3.3. Impact of Different Carbon Emission Trajectories on Power System Transition Pathways

Carbon budgets and emission pathways serve as critical constraints that profoundly shape the low-carbon transition of Guangdong’s power system. Table 3 presents the carbon emission, installed capacity, inter-regional power transmission, and total annualized cost for Guangdong under different scenarios in 2030, 2045, and 2060. Under an identical carbon budget, achieving earlier carbon peaking can result in a modest increase in operational costs during the initial period. However, it substantially reduces the capital investments required in the later stages. In 2030, Scenario 2 exhibits a 1.7% higher annualized total system cost than Scenario 1. By 2060, however, this relationship reverses, with Scenario 2 achieving a 5.2% lower annualized cost than Scenario 1. Furthermore, before 2045, the total installed capacity gap between Scenario 1 and Scenario 2 is small, but Scenario 2 achieves lower emissions primarily by adjusting the generation mix. In 2030, coal-fired generation in Scenario 1 is 357.9 TWh compared to 302.8 TWh in Scenario 2, with the reduced coal-fired generation mainly compensated by higher-cost gas-fired power, resulting in a higher LCOE for Scenario 2.
After 2045, the installed capacity trajectories between Scenarios 1 and 2 begin to diverge significantly. By 2060, Scenario 2 has 20.9 GW less installed capacity than Scenario 1. This is primarily because Scenario 2 retains more coal-fired and gas-fired units with higher average capacity factors, while Scenario 1 requires more VRE and energy storage installations to achieve deep decarbonization in later stages. Furthermore, the marginal cost of carbon reduction increases significantly during deep decarbonization. Under Scenario 1, from 2030–2045, each 0.1 kg CO2/kWh reduction in carbon emission factor increases LCOE by 0.022 CNY/kWh, while during 2045–2060, each 0.1 kg CO2/kWh reduction increases LCOE by 0.081 CNY/kWh. Consequently, Scenario 2 increases operational costs in the early stage to achieve carbon emission reductions. As the system enters the high-cost deep decarbonization phase, Scenario 2 faces less stringent decarbonization pressure. By circumventing the exponential rise in marginal abatement costs observed in Scenario 1 during deep decarbonization stage, Scenario 2 achieves lower cumulative electricity supply costs by 2060.
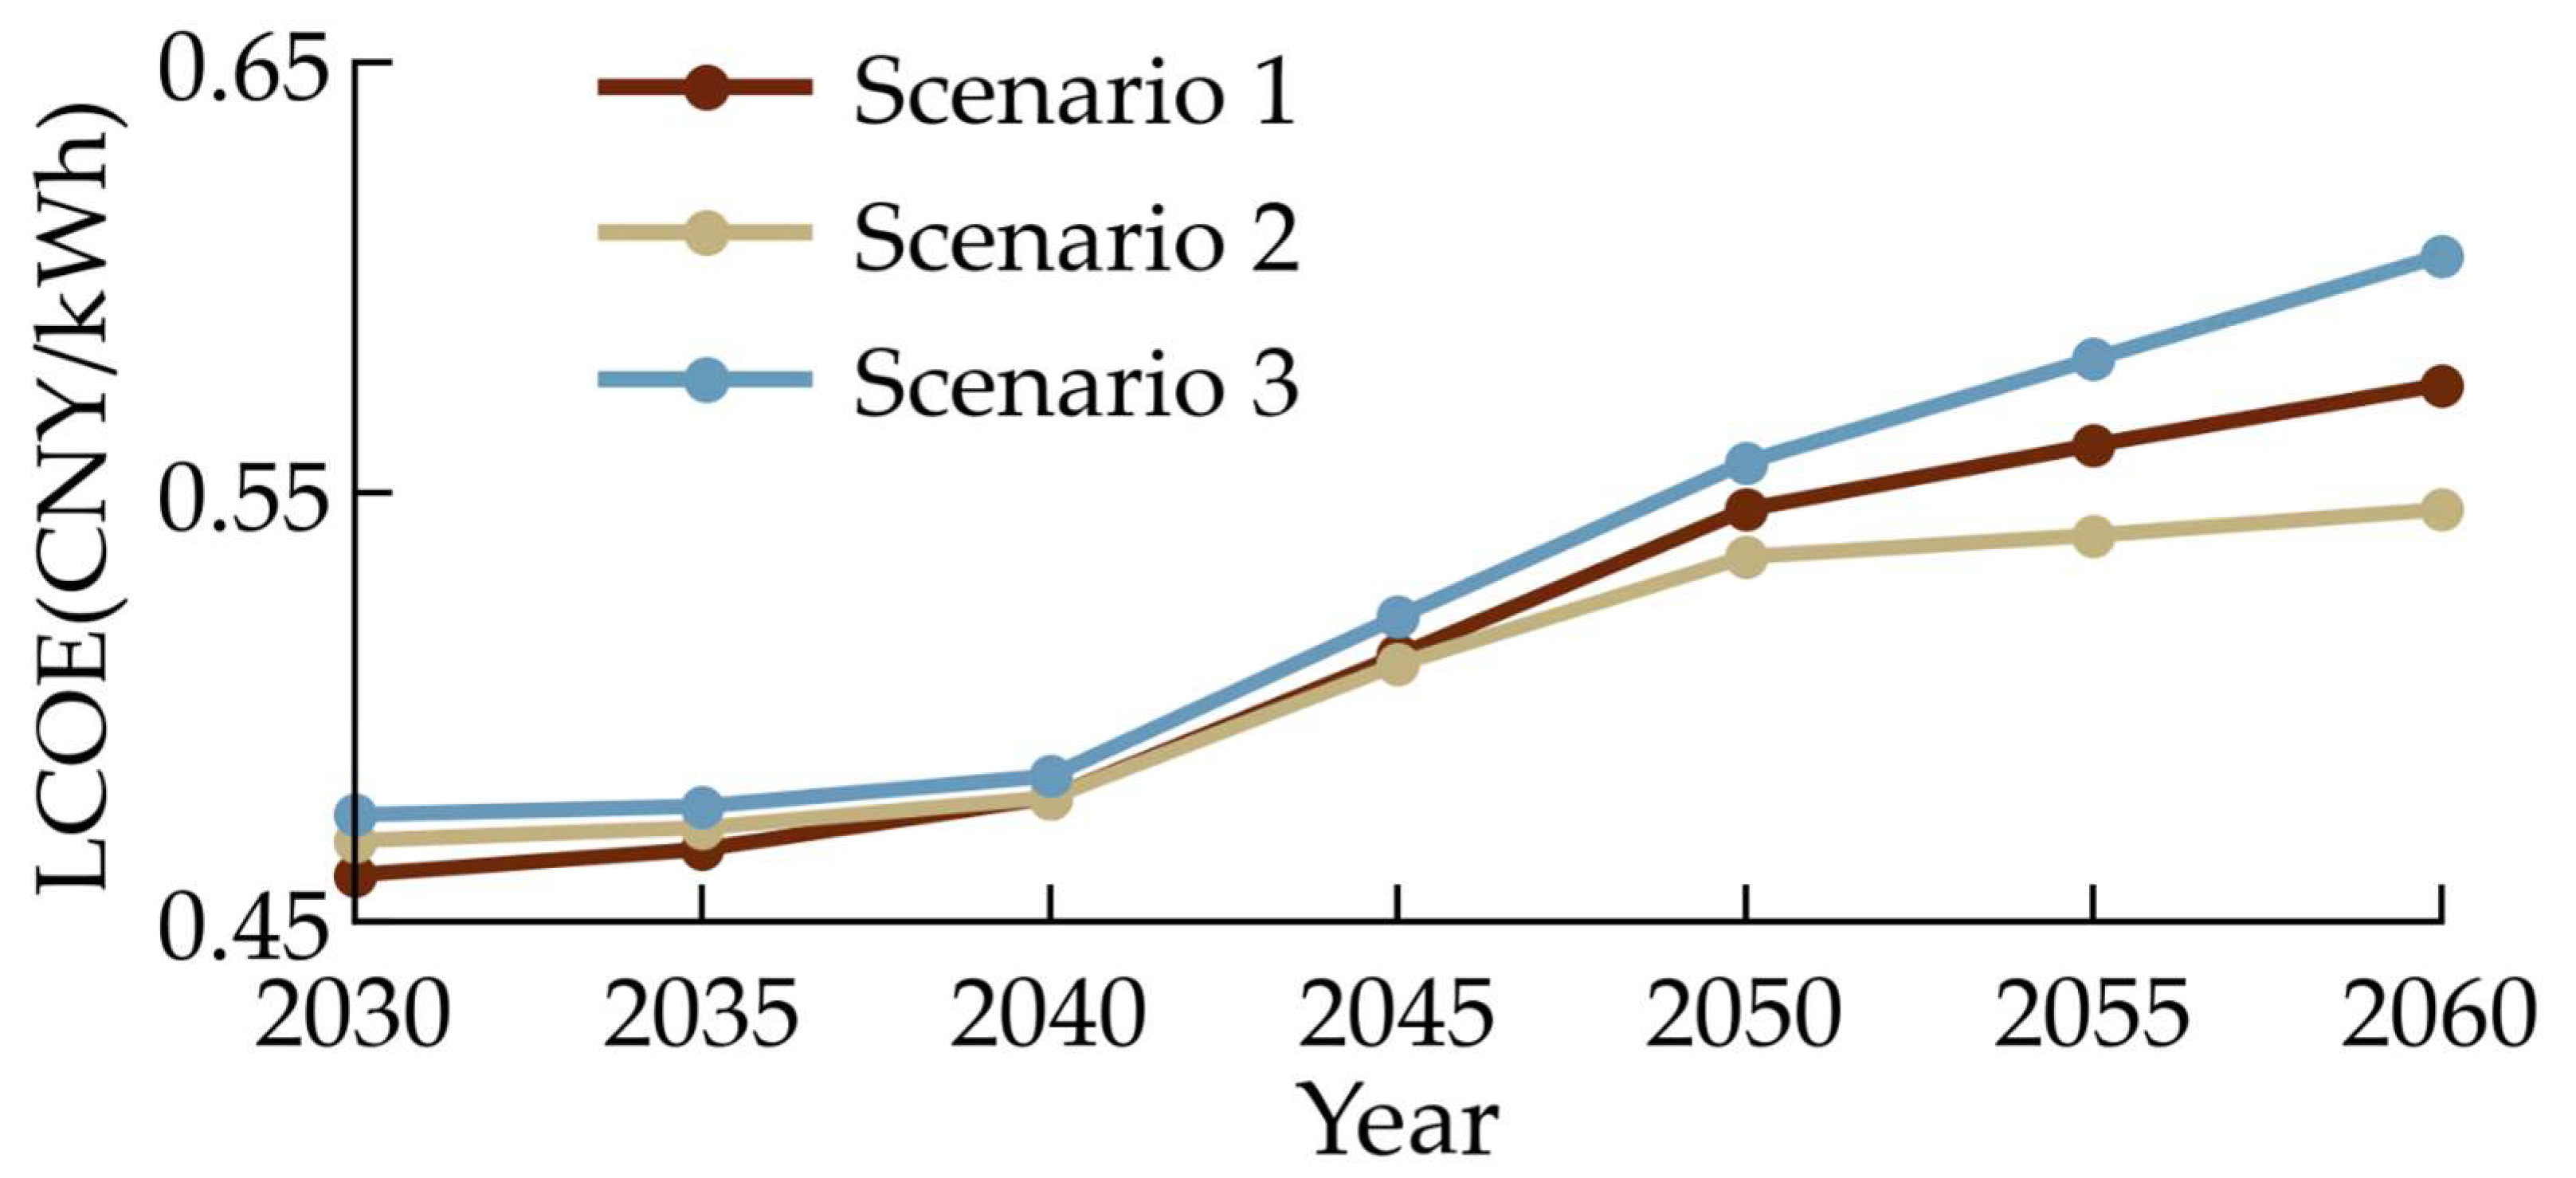
Figure 8 illustrates the evolution of electricity supply costs under different scenarios. Scenario 3 has the smallest carbon budget; therefore, more coal-fired units are retired before 2045 and the system relies more heavily on lower-emission gas-fired units to maintain supply and demand balance. Consequently, Scenario 3 incurs the highest LCOE in 2045. By 2060, Scenario 3 reaches 601.9 GW in installed capacity—45.4 GW higher than Scenario 2—with notable structural differences: carbon-emitting generation capacity is 37.6% lower, energy storage capacity is 33.3% higher, and zero-carbon generation capacity is 11.6% higher, driving its LCOE to be 10.9% above relative to Scenario 2.
Prior to 2040, the LCOE across the three scenarios exhibited only marginal differences, with costs highly correlated with the emission reduction progression. During this phase, emission reductions are primarily achieved by adjusting the dispatch mix of coal-fired and gas-fired power generation. Post-2040, however, significant LCOE divergence emerges. Scenario 3 faces the greatest emission reduction pressure, corresponding to a larger increase in LCOE. The cost increase trend of Scenario 1 is higher than that of Scenario 2 after 2045, mainly because Scenario 1 requires more VRE installations and energy storage in the later period to achieve the system’s predetermined carbon reduction targets.
All analyzed carbon emission pathways necessitate accelerated investment in zero-carbon power sources and energy storage throughout the critical decarbonization period of 2030–2045. As shown in Figure 9, Guangdong’s zero-carbon power installed capacity is projected to officially exceed carbon-emitting power sources between 2030 and 2035. Furthermore, the impact of different carbon emission trajectories on installed capacity is mainly manifested during the deep decarbonization period, exhibiting a significant lagging effect. With the same cumulative carbon budget, an earlier emissions peak provides a wider buffer for the retirement and flexible retrofitting of coal-fired and gas-fired units during the late transition.
Comparing Scenario 1 and Scenario 2, during the rapid reduction period of 2030–2040, carbon-emitting units in Scenario 2 are phased out more quickly. By 2040, the installed capacity of carbon-emitting power sources in Scenario 1 is 152.2 GW, while in Scenario 2 it is 149.4 GW, which is 2.8 GW less than Scenario 1. However, by 2060, the installed capacity of carbon-emitting power sources in Scenario 1 is 53.2 GW, while in Scenario 2 it is 70.6 GW, meaning Scenario 1 retains 17.4 GW less carbon-emitting power capacity compared to Scenario 2, demonstrating that an earlier peak grants more time for carbon-emitting power units to retire or retrofit.
Conversely, a later peak demands greater zero-carbon capacity and additional storage during the deep decarbonization phase. In 2060, the zero-carbon power source installed capacity in Scenario 2 is 398.6 GW, while in Scenario 1 it is 423.0 GW, including 9.0 GW more nuclear power and 15.4 GW more VRE than Scenario 2. Furthermore, the energy storage installed capacity in Scenario 1 is 91.8 GW, which is 14.0 GW more than Scenario 2. Therefore, a later emissions peak requires increased investment in zero-carbon power sources during the deep emission reduction period.

4. Conclusions

The power sector serves as both the principal arena for energy decarbonization and the central engine for achieving China’s “Dual-Carbon” goals. Meanwhile, carbon emissions have gradually evolved from an external outcome of power system planning and operation into a core factor influencing generation portfolios, transmission investment, and operational strategies. This paper constructs a Carbon-Constrained GTSEP Model to analyze the evolutionary pathways of Guangdong Province’s power system under different carbon budget and carbon emission trajectory constraints. The key findings can be summarized as follows:
  • Under the 2.0 °C global warming scenario, Guangdong is expected to establish a clean energy system primarily supported by external power imports, nuclear power, and VRE, with diversified flexibility resources like gas-fired power, flexible coal-fired power, PHS, and BES providing regulation capacity. By 2060, the total electricity generation share of external power imports, nuclear power, and VRE will reach 87%, with nuclear and VRE comprising 70% of total installed capacity. Rising VRE penetration and the spatiotemporal mismatch between demand and generation will drive inter-regional transmission within Guangdong to 463 TWh, or 27.4% of total electricity consumption. The combined uncertainties in load and VRE generation will require gas-fired units to provide substantially greater flexibility services; by 2060, their output regulation range will be twice that of 2030, with high VRE shares compressing their operation to predominantly low-output levels. Nuclear power will also expand its operational range while maintaining annual utilization hours.
  • Achieving an earlier carbon emissions peak can trade smaller short-term operational cost increases for larger long-term cost savings, given the nonlinear marginal growth of decarbonization expenses. Between 2030 and 2045, each 0.1 kg CO2/kWh reduction in the carbon emission factor increases the LCOE by 0.022 CNY/kWh, while from 2045 to 2060, the same reduction raises LCOE by 0.081 CNY/kWh. Therefore, adjusting generation structure early and reducing coal-fired power output can achieve early peaking, providing more buffer time for retirement and flexibility retrofit of thermal units like coal-fired and gas-fired power, thereby reducing transition costs. With the same carbon budget, achieving peak in 2025 compared to 2030 can save CNY 53.7 billion in total costs over the planning horizon, and reduce LCOE by 5.2% by 2060.
In addition to the techno-economic outcomes, the feasibility of earlier peaking also depends on social, institutional, and political conditions. Effective policy coordination, investment mobilization, and market reforms are necessary to support accelerated transitions, while social acceptance of industrial restructuring and renewable expansion remains critical. Without these enabling conditions, the techno-economic advantages of earlier peaking may be difficult to realize in practice.
Future research will further analyze the impact of economic and operational characteristics of various energy storage technologies and thermal unit retrofitting on the low-carbon transformation of the power system.

Author Contributions

Conceptualization, G.G., W.W., P.W. and S.L.; methodology, G.G., Y.L. and W.W.; software, S.Z. and H.Y.; validation, S.Z. and J.G.; formal analysis, G.G. and W.W.; investigation, J.G. and Y.L.; resources, S.L. and P.W.; data curation, J.G.; writing—original draft preparation, G.G. and W.W.; writing—review and editing, P.W., W.W. and S.L.; visualization, J.G.; supervision, W.W. and Y.L.; project administration, P.W.; funding acquisition, P.W. All authors have read and agreed to the published version of the manuscript.

Funding

This research is supported by the Science and Technology Program of Grid Planning and Research Center, Guangdong Power Grid Corporation (Grant No. 031000QQ00240012).

Data Availability Statement

Data used in this study are available on public platforms as referenced in the text.

Conflicts of Interest

Authors Weijie Wu, Shuxin Luo, Yixin Li and Shucan Zhou were employed by the Grid Planning and Research Center, Guangdong Power Grid Corporation. The remaining authors declare that the research was conducted in the absence of any commercial or financial relationships that could be construed as a potential conflict of interest. The Guangdong Power Grid Corporation had no role in the design of the study; in the collection, analyses, or interpretation of data; in the writing of the manuscript, or in the decision to publish the results.

Appendix A. Carbon-Constrained GTSEP Model

Appendix A.1. Objective Function

The objective function formulated by Equation (A1) minimizes the sum of investment cost C plan inv , operating cost C plan oper and penalty cost C plan punish .
min   C plan = C plan inv + C plan oper + C plan punish
The investment cost C plan inv is calculated as
C plan inv = y = 1 N y ( g = 1 N g α g , y O g , y + h = 1 N h α h , y O h , y + w = 1 N w α w , y O w , y + p v = 1 N p v α p v , y O p v , y + b = 1 N b α b , y O b , y + l = 1 N l α l , y O l , y )
where N y , N g , N h , N w , N p v , N b , N l respectively represent the number of planning years, thermal units, hydro units, wind units, PV units, energy storages, and transmission lines. α , y is the investment cost per unit installed capacity, and O , y is the planning capacity for each unit and line.
The annual operating cost is estimated by Equation (A3), including the start-stop cost of thermal power plants and fuel cost.
C plan oper = y = 1 N y s = 1 N c τ s ( g = 1 N g t = 1 N T β g , y P g , y , s , t + i = 1 N i t = 1 N T γ i , y s u O i , y , s , t su + i = 1 N i t = 1 N T γ i , y s d O i , y , s , t sd )
where N c is the number of scenarios and τ s is the weight of scenario s. O i , y , s , t su and O i , y , s , t sd represent the start and stop capacity of coal-fired power unit i at time t, while γ i , y su and γ i , y sd represent cost. P g , y , s , t is the thermal power generation and β g , y is the variable operating cost.
The penalty cost is estimated by Equation (A4):
C plan punish = y = 1 N y s = 1 N c τ s ( n = 1 N n t = 1 N T δ d D n , y , s , t cut + w = 1 N w t = 1 N T δ w P w , y , s , t cut + p v = 1 N pv t = 1 N T δ pv P p v , y , s , t cut )
where D n , y , s , t cut , P w , y , s , t cut , P p v , y , s , t cut represent the load shedding, wind curtailment power, and PV curtailment power, while δ is the load shedding or VRE curtailment cost.

Appendix A.2. Constraints

The first stage sets the constraints on determining the generation and transmission lines investment decisions. Constraint (A5) limits the maximum installed capacity of each generation unit and transmission line. Constraint (A6) requires that the proportion of VRE installed capacity in the system must not be lower than v . Constraint (A7) represents the generation adequacy requirement, which indicates that the loss of load is less than the η amount of total load. Constraint (A8) represents the VRE penetration target, which requires that ξ of the overall electricity load must be supplied by VRE.
O u , y O u , y max , u , y ; u ( g , h , w , p v , b , l )
( O w , y + O p v , y ) v ( O g , y + O w , y + O p v , y + O h , y + O b , y ) , y
s = 1 N c τ s t = 1 N T n = 1 N n D n , y , s , t cut η s = 1 N c τ s t = 1 N T n = 1 N n D n , y , s , t , y
s = 1 N c τ s t = 1 N T ( w = 1 N w P w , y , s , t + p v = 1 N p v P p v , y , s , t ) ξ s = 1 N c τ s t = 1 N T n = 1 N n ( D n , y , s , t D n , y , s , t cut ) , y
where D n , y , s , t is the load demand.
Constraint (A9) represents the power balance at each node.
g Ψ n , g P g , y , s , t + h Ψ n , h P h , y , s , t + w Ψ n , w P w , y , s , t + p v Ψ n , p v P p v , y , s , t + b Ψ n , b P b , y , s , t dis b Ψ n , b P b , y , s , t cha = D n , y , s , t D n , y , s , t cut + l s Ψ n , l s P l s , y , s , t l e Ψ n , l e P l e , y , s , t n , y , s , t
where Ψ n , represents the set of units or lines connected to node n. P b , y , s , t dis , P b , y , s , t cha are variables denoting the discharging and charging power of energy storage devices. P l s , y , s , t , and P l e , y , s , t represent the transmission power.
Constraint (A10) limits the generation units to its capacity, and constraint (A11) represents the ramp limit of generation units. κ u is the hourly ramp up/down rate.
P u , y , s , t O u , y , u , y , s , t ; u ( g , h , w , p v , b )
P u , y , s , t + 1 P u , y , s , t κ u O u , y P u , y , s , t P u , y , s , t + 1 κ u O u , y , u , y , s , t ; u ( g , h , w , p v , b )
Operational flexibility Constraints (A12)–(A16) are incorporated into the planning model to simulate the flexible operation behavior of thermal power units.
g Ψ i , g P g , y , s , t O i , y , s , t ol g Ψ i , g O g , y , i , y , s , t
O i , y , s , t ol = O i , y , s , t 1 ol + O i , y , s , t su O i , y , s , t sd , i , y , s , t
r i , min O i , y , s , t ol g Ψ i , g P g , y , s , t , i , y , s , t
O i , y , s , t ol j = 1 T i o n O i , y , s , t j su , i , y , s , t
O i , y , s , t ol g Ψ i , g O g , y j = 1 T i o f f O i , y , s , t j sd , i , y , s , t
where O i , y , s , t ol is the online capacity of thermal unit type i. r i , min is the minimum loading limits of thermal unit type i. T i o n , T i o f f represent the minimum start-up/shut-down time period of thermal type i.
For transmission lines, constraints (A17) and (A18) formulates the DC power flow equation of the candidate lines and installed lines, respectively.
M 1 x l , y P l , y , s , t B l ( θ l ( + ) , y , s , t θ l ( ) , y , s , t ) P l , y , s , t B l ( θ l ( + ) , y , s , t θ l ( ) , y , s , t ) M 1 x l , y , l Ω C L , y , s , t
P l , y , s , t = B l ( θ l ( + ) , y , s , t θ l ( ) , y , s , t ) , l Ω L \ Ω C L , y , s , t
where M is a large enough constant. Ω L , Ω C L are sets of all transmission lines and candidate lines. B l is the reactance of transmission line l . θ l ( + ) , y , s , t , θ l ( ) , y , s , t are voltage angle at the starting and the ending node of line l .
If x l , y = 0 , constraint (A17) holds at any time; if x l , y = 1 , the constraint of the candidate lines will be the same as the installed lines specified in (A18).
For the storage devices, constraint (A19) limits the charging and discharging rates of storage. Constraint (A20) represents the energy balance of storage, where S O C b , y , s , t is the variable of state of charge (SOC), and η b is the charging/discharging efficiency of storage. Constraint (A21) limits the SOC of storage to the discharging duration hour B b . Constraint (A22) ensures the SOC of storage returns to the initial level at the end of the year.
P b , y , s , t cha , P b , y , s , t dis O b , y , b , y , s , t
S O C b , y , s , t = S O C b , y , s , t 1 + η b P b , y , s , t cha P b , y , s , t dis / η b , b , y , s , t
S O C b , min S O C b , y , s , t B b O b , y , b , y , s , t
S O C b , y , s , t = 0 = S O C b , y , s , t = N T , b , y , s , t
Equation (A23) is the carbon emission cap constraint, where C E y L i m is the carbon emission limit of year y, C E y G e n is the carbon emission, and C E g is the carbon emission intensity of unit g .
10 4 C E y L i m C E y G e n , y
C E y G e n = 10 4 s = 1 N c τ s t = 1 N T g = 1 N g C E g P g , y , s , t
Equation (A25) is the reserve constraint, where ε d is the load reserve rate, ε r e is the forecast error of VRE generation, and φ , y , s , t is the per unit value of wind and solar power forecast output.
i = 1 N i O i , y , s , t ol + w = 1 N w P w , y , s , t + p v = 1 N pv P p v , y , s , t + h = 1 N h P h , y , s , t + b = 1 N b P b , y , s , t cha + n = 1 N n D n , y , s , t cut ( 1 + ε d ) n = 1 N n D n , y , s , t + ε r e ( w = 1 N w φ w , y , s , t O w , y + p v = 1 N pv φ p v , y , s , t O p v , y ) , y , s , t
Equation (A26) represents the inter-year linkage constraint.
O u , y 1 O u , y , u , y ; u ( g , h , w , p v , b , l )
Equations (A1)–(A26) organize the Carbon-Constrained GTSEP Model, enabling high renewable penetration while meeting specified carbon emission constraints.

References

  1. Notice of the General Office of the State Council on Issuing the “Work Plan for Accelerating the Development of a Dual Control System for Carbon Emissions”. Available online: https://www.mee.gov.cn/zcwj/gwywj/202408/t20240806_1083433.shtml (accessed on 2 July 2025).
  2. Guo, J.; Wang, T.; Luo, K.; Qin, X.; Jing, Y.; Zhao, B.; Ma, S. Development of new power systems: Challenges and solutions. New Type Power Syst. 2023, 1, 32–43. [Google Scholar]
  3. Zhao, Y.-R.; Liu, H.-M.; Li, W.; Gong, L.-D. Research on the low-carbon transition policies of power sector under the “Double Carbon” goal. Adv. Clim. Change Res. 2023, 19, 634. [Google Scholar]
  4. Chen, J. An empirical study on China’s energy supply-and-demand model considering carbon emission peak constraints in 2030. Engineering 2017, 3, 512–517. [Google Scholar] [CrossRef]
  5. Xiao, J.; Li, G.; Xie, L.; Wang, S.; Yu, L. Decarbonizing China’s power sector by 2030 with consideration of technological progress and cross-regional power transmission. Energy Policy 2021, 150, 112150. [Google Scholar] [CrossRef]
  6. Kang, C.; Du, E.; Guo, H.; Li, Y.; Fang, Y.; Zhang, Y.; Zhong, H. Primary exploration of six essential factors in new power system. Power Syst. Technol. 2023, 47, 1741–1750. [Google Scholar] [CrossRef]
  7. Cheng, Q.; Li, F.; Luo, S.; Wu, W.; Zhang, N.; Kang, C. Research on the Planning Methodology Framework and Key Supporting Technologies for New Power Systems. Power Syst. Technol. 2025, 49, 2219–2231. [Google Scholar] [CrossRef]
  8. He, L.; Li, X.; Cui, Q.; Guan, B.; Li, M.; Chen, H. Decarbonization pathways to subregional carbon neutrality in China based on the top-down multi-regional CGE model: A study of Guangxi. Energy 2024, 294, 130846. [Google Scholar] [CrossRef]
  9. Sun, L.L.; Cui, H.J.; Ge, Q.S. Will China achieve its 2060 carbon neutral commitment from the provincial perspective? Adv. Clim. Change Res. 2022, 13, 169–178. [Google Scholar] [CrossRef]
  10. Li, N.; Chen, W.; Zhang, Q. Development of China TIMES-30P model and its application to model China’s provincial low carbon transformation. Energy Econ. 2020, 92, 104955. [Google Scholar] [CrossRef]
  11. Shu, Y.; Zhang, L.; Zhang, Y.; Wang, Y.; Lu, G.; Yuan, B.; Xia, P. Carbon peak and carbon neutrality path for China’s power industry. Strateg. Study Chin. Acad. Eng. 2021, 23, 1–14. [Google Scholar] [CrossRef]
  12. Zhuo, Z.; Du, E.; Zhang, N.; Nielsen, C.P.; Lu, X.; Xiao, J.; Wu, J.; Kang, C. Cost increase in the electricity supply to achieve carbon neutrality in China. Nat. Commun. 2022, 13, 3172. [Google Scholar] [CrossRef]
  13. Meng, Q.; Xu, J.; Luo, F.; Jin, X.; Xu, L.; Yao, W.; Jin, S. Collaborative and effective scheduling of integrated energy systems with consideration of carbon restrictions. IET Gener. Transm. Distrib. 2023, 17, 4134–4145. [Google Scholar] [CrossRef]
  14. Li, G.; Luo, Z.; Liao, C. Power capacity optimization and long-term planning for a multi-energy complementary base towards carbon neutrality. Energy 2025, 334, 137644. [Google Scholar] [CrossRef]
  15. Li, Y.; Wu, W.; Yang, H.; Gong, G.; Zhang, Y.; Luo, S.; Zhou, S.; Wang, P. Dynamic Carbon Emission Factors in Source–Network–Storage Power System Planning: A Focus on Inverse Modelling. Energies 2024, 17, 6346. [Google Scholar] [CrossRef]
  16. Wang, Z.; Liu, Y.; Wang, R.; Hu, Y. Cost–Benefit Analysis of Cross-Regional Transmission of Renewable Electricity: A Chinese Case Study. Sustainability 2024, 16, 10538. [Google Scholar] [CrossRef]
  17. Huang, W.; Zhang, N.; Kang, C.; Li, M.; Huo, M. From demand response to integrated demand response: Review and prospect of research and application. Prot. Control Mod. Power Syst. 2019, 4, 1–13. [Google Scholar] [CrossRef]
  18. Fu, X.; Wu, X.; Zhang, C.; Fan, S.; Liu, N. Planning of distributed renewable energy systems under uncertainty based on statistical machine learning. Prot. Control Mod. Power Syst. 2022, 7, 1–27. [Google Scholar] [CrossRef]
  19. Tang, H.; Zhang, S.; Chen, W. Assessing representative CCUS layouts for China’s power sector toward carbon neutrality. Environ. Sci. Technol. 2021, 55, 11225–11235. [Google Scholar] [CrossRef]
  20. Wang, H.; Zhang, J.; Wang, P.; Zhang, N. The role of demand-side flexibilities on low-carbon transition in power system: A case study of West Inner Mongolia, China. Renew. Energy 2025, 242, 122478. [Google Scholar] [CrossRef]
  21. Zhang, Q.; Chen, W. Modeling China’s interprovincial electricity transmission under low carbon transition. Appl. Energy 2020, 279, 115571. [Google Scholar] [CrossRef]
  22. Li, W.; Wang, J.; Du, E.; Wang, P.; Zhang, N.; Kang, C. Planning Coal Power Generation Transition Considering Multiple Alternatives With a Full Life Cycle Perspective. IEEE Trans. Power Syst. 2025, 1–13. [Google Scholar] [CrossRef]
  23. Zhang, B.; Niu, N.; Li, H.; Wang, Z. Assessing the efforts of coal phaseout for carbon neutrality in China. Appl. Energy 2023, 352, 121924. [Google Scholar] [CrossRef]
  24. Ren, D.; Xiao, J.; Hou, J.; Du, E.; Jin, C.; Liu, Y. Construction and evolution of China’s new power system under dual carbon goal. Power Syst. Technol. 2022, 46, 3831–3839. [Google Scholar]
  25. Li, Z.; Chen, S.; Dong, W.; Liu, P.; Du, E.; Ma, L.; He, J. Low carbon transition pathway of power sector under carbon emission constraints. Proc. CSEE 2021, 41, 3987–4001. [Google Scholar]
  26. Wang, T.; Jin, Y.; Li, Y. Optimization Scheduling of Carbon Capture Power Systems Considering Energy Storage Coordination and Dynamic Carbon Constraints. Processes 2025, 13, 1758. [Google Scholar] [CrossRef]
  27. Ma, Y.; Li, Y.P.; Huang, G.H. Planning China’s non-deterministic energy system (2021–2060) to achieve carbon neutrality. Appl. Energy 2023, 334, 120673. [Google Scholar] [CrossRef]
  28. Cheng, R.; Xu, Z.; Liu, P.; Wang, Z.; Li, Z.; Jones, I. A multi-region optimization planning model for China’s power sector. Appl. Energy 2015, 137, 413–426. [Google Scholar] [CrossRef]
  29. Deng, X.; Lv, T. Power system planning with increasing variable renewable energy: A review of optimization models. J. Clean. Prod. 2020, 246, 118962. [Google Scholar] [CrossRef]
  30. Collins, S.; Deane, J.P.; Poncelet, K.; Panos, E.; Pietzcker, R.C.; Delarue, E.; Gallachóir, B.P.Ó. Integrating short term variations of the power system into integrated energy system models: A methodological review. Renew. Sustain. Energy Rev. 2017, 76, 839–856. [Google Scholar] [CrossRef]
  31. Lopion, P.; Markewitz, P.; Robinius, M.; Stolten, D. A review of current challenges and trends in energy systems modeling. Renew. Sustain. Energy Rev. 2018, 96, 156–166. [Google Scholar] [CrossRef]
  32. Zhang, N.; Jiang, H.; Du, E.; Zhuo, Z.; Wang, P.; Wang, Z.; Zhang, Y. An efficient power system planning model considering year-round hourly operation simulation. IEEE Trans. Power Syst. 2022, 37, 4925–4935. [Google Scholar] [CrossRef]
  33. Global Energy Interconnection Development and Cooperation Organization. Research on Global Renewable Energy Development and Investment; China Electric Power Press: Beijing, China, 2020. [Google Scholar]
  34. Du, E.; Zhang, N.; Kang, C.; Xia, Q. A high-efficiency network-constrained clustered unit commitment model for power system planning studies. IEEE Trans. Power Syst. 2018, 34, 2498–2508. [Google Scholar] [CrossRef]
  35. Ministry of Ecology and Environment, National Bureau of Statistics. Announcement on the Release of the 2021 Electricity CO2 Emission Factors. Available online: https://www.mee.gov.cn/xxgk2018/xxgk/xxgk01/202404/t20240412_1070565.html (accessed on 8 July 2025).
  36. Haffner, S.; Monticelli, A.; Garcia, A.; Mantovani, J.; Romero, R. Branch and bound algorithm for transmission system expansion planning using a transportation model. IEE Proc. Gener. Transm. Distrib. 2000, 147, 149–156. [Google Scholar] [CrossRef]
  37. Zhang, Y.L.; Kang, J.N.; Liu, L.C.; Wei, Y.M. Unveiling the evolution and future prospects: A comprehensive review of low-carbon transition in the coal power industry. Appl. Energy 2024, 371, 123649. [Google Scholar] [CrossRef]
  38. Born, K. Exploring the Spatial Dynamics of Circular Economy Transitions: Insights and Lessons from Chile’s Mining Territories. Prog. Econ. Geogr. 2025, 3, 100041. [Google Scholar] [CrossRef]
  39. Ma, L.; Ghorbani, Y.; Kongar-Syuryun, C.B.; Khayrutdinov, M.M.; Klyuev, R.V.; Petenko, A.; Brigida, V. Dynamics of backfill compressive strength obtained from enrichment tails for the circular waste management. Resour. Conserv. Recycl. Adv. 2024, 23, 200224. [Google Scholar] [CrossRef]
  40. Wei, H.Y.; Zhuo, Z.Y.; Zhang, N.; Du, E.S.; Xiao, J.Y.; Wang, P.; Kang, C.Q. Transition path optimization and influencing factor analysis of carbon emission peak and carbon neutrality for power system of China. Autom. Electr. Power Syst. 2022, 46, 1–12. [Google Scholar]
  41. Notice of the State Council on Issuing the Action Plan for Carbon Dioxide Peaking Before 2030. Available online: https://www.gov.cn/zhengce/content/2021-10/26/content_5644984.htm (accessed on 25 August 2025).
  42. The 14th Five-Year Plan for Energy Development in Guangdong Province. Available online: https://www.gd.gov.cn/attachment/0/486/486725/3909371.pdf (accessed on 25 August 2025).
Figure 1. Structure of Carbon-Constrained GTSEP model.
Processes 13 02893 g001
Figure 2. Carbon emission trajectories for each scenario.
Processes 13 02893 g002
Figure 3. Installed power capacity from 2030 to 2060 of Scenario 1.
Processes 13 02893 g003
Figure 4. Power generation from 2030 to 2060 of Scenario 1.
Processes 13 02893 g004
Figure 5. Inter-regional power transmission of Scenario 1. (a) Inter-regional power transmission of Scenario 1 in 2030. (b) Inter-regional power transmission of Scenario 1 in 2060.
Processes 13 02893 g005
Figure 6. The diurnal variability of gas-fired power output under Scenario 1 in 2030, 2045 and 2060.
Processes 13 02893 g006
Figure 7. The diurnal variability of nuclear power output of Scenario 1 in 2030, 2045 and 2060.
Processes 13 02893 g007
Figure 8. The evolution of electricity supply costs under different scenarios.
Processes 13 02893 g008
Figure 9. Installed power capacity of different power sources under different scenarios.
Processes 13 02893 g009
Table 1. The carbon reduction pathways under different scenarios.
ScenarioDescription of Carbon Reduction Pathways
2.0 °C-Peak by 2030
(Scenario 1)
Carbon emissions peak in 2030, with a peak annual emission of 382 Mt and a cumulative carbon budget 1 of 6.8 Gt.
2.0 °C-Peak by 2025
(Scenario 2)
Carbon emissions peak in 2025, with a peak annual emission of 378 Mt and a cumulative carbon budget of 6.8 Gt.
1.5 °C-Peak by 2025
(Scenario 3)
Carbon emissions peak in 2025, with a peak annual emission of 378 Mt and a cumulative carbon budget of 6.0 Gt.
1 The cumulative carbon budget represents the total cumulative carbon emissions for Guangdong Province’s power system from 2025 to 2060.
Table 2. Distribution of load and power sources.
Metric/RegionRegion 1Region 2Region 3Region 4Region 5Region 6Region 7
Node load
proportion (%)
16.716.318.922.913.47.14.7
Existing thermal
power capacity (GW)
33.227.144.928.531.212.59.1
VRE capacity
installation potential (GW)
28.13564.659180.375.253.4
Table 3. Planning results of power system under different scenarios in 2030, 2045, and 2060.
YearScenarioCarbon
Emission (Mt)
Installed
Capacity (GW)
Power
Transmission (TWh)
Total Annualized
Cost (billion CNY)
LCOE
(CNY/kWh)
2030Scenario 1382348.2196.8565.750.461
Scenario 2358348.8191.8575.340.469
Scenario 3342348.6188.6581.950.475
2045Scenario 1137432.2232.2837.280.512
Scenario 2146433.8220.1834.050.510
Scenario 3110427.6256.8851.000.521
2060Scenario 110577.4463.2975.030.575
Scenario 220556.5446.9924.660.546
Scenario 310601.9467.41025.400.605
Disclaimer/Publisher’s Note: The statements, opinions and data contained in all publications are solely those of the individual author(s) and contributor(s) and not of MDPI and/or the editor(s). MDPI and/or the editor(s) disclaim responsibility for any injury to people or property resulting from any ideas, methods, instructions or products referred to in the content.