Article

Investigation on the Reasons for CO Overrun in the Return Air Corner of the Fully Mechanized Coal Mine Working Face

College of Safety Science and Engineering, Xi’an University of Science and Technology, Xi’an 710000, China
*
Author to whom correspondence should be addressed.
Processes 2025, 13(9), 2869; https://doi.org/10.3390/pr13092869
Submission received: 18 July 2025 / Revised: 1 September 2025 / Accepted: 3 September 2025 / Published: 8 September 2025

Abstract

Abnormal CO gas concentration is one of the common problems in coal mine safety production. In view of the phenomenon of CO overrun in the working face, this paper takes the fully mechanized discharge working face of Zhaoxian Mine as the research object, analyzes the occurrence of primary coal seam gas through the coal sample tank analysis experiment and the indoor crushing experiment, and explores the source of CO in the fully mechanized working face. According to the calculation model, the predicted value of CO concentration at the return air corner of the working face was calculated and, combined with the gas data of the working face monitored on site, it was proven that the CO concentration of the working face was in the normal range. This study found that the oxidation of residual coal in the goaf and the generation of CO during the mining process were the main reasons for the high CO concentration in the working face, rather than the occurrence of raw coal. This study reduces the interference of CO concentration on the determination of coal spontaneous combustion, prevents the misjudgment of coal spontaneous combustion, ensures the safe production of the Zhaoxian Coal Mine, provides data and theoretical support for the subsequent establishment of the CO prevention and control system of the working face, and provides a solution and technical reference for the CO overrun phenomenon in the working face of other high-gas mines.

1. Introduction

The spontaneous combustion of coal, which is a combustion phenomenon caused by the accumulation of heat generated by an oxidation reaction under natural conditions, is one of the most common mine disasters, and its occurrence is closely related to internal and external factors such as the degree of coal metamorphism, sulfur content, geological structure, and ventilation conditions [1,2,3]. With the continuous improvement of the mechanization level in fully mechanized coal mining, the large-volume variable speed device installed at the tail of the shearer has caused the tail of the working face to lag behind some supports for a long time. This has led to the increasingly prominent problem of CO accumulation and overrun at the return air corner of the working face, which has become a major hidden danger seriously restricting coal mine safety production [4,5,6].
According to the “Coal Mine Safety Regulations” (2022 edition) in China, the permissible concentration limit of CO in the return air flow of underground mining faces is strictly regulated to 24 ppm. This limit is established to ensure occupational health protection for miners and to prevent potential coal spontaneous combustion disasters. In recent years, a large number of field practices have shown that the CO gas in the working face often exceeds the specified value of the Coal Mine Safety Regulations during coal seam mining, such as in the Sima Coal Mine of Lu’an Group, Lingxin Coal Mine of Ningmei Group, Sanhejian Coal Mine of Xu Mining Group, Jining No. 2 Coal Mine of Yankuang Group, and the Daliuta Coal Mine and Bulianta Coal Mine of Shendong Group [7,8,9]. Subsequently, it was confirmed that no oxidative spontaneous combustion occurred in some goafs, while some mines were closed due to delayed prediction. The direct economic loss caused by spontaneous combustion in the goaf of the Bulianta Mine reached 400 million yuan [10,11,12]. This shows that the abnormal outflow of CO gas has greatly interfered with the determination of the risk of spontaneous combustion of underground coal, seriously affected the timeliness and accuracy of the prediction and early warning of coal fire disasters, thereby missing the optimal opportunity for preventing and controlling coal spontaneous combustion disasters, and even inducing more severe mine disasters [13,14,15].

2. Overview of the Mine

Zhaoxian Coal Mine is a high-gas mine located in the northwest of Linyou County, Baoji City. The second mining area of the mine is located in the northeast of the mining area. Since the 2306 working face (the first mining face) began mining on 4 January 2024, the CO concentration in the goaf and the return air corner has reached a level of more than 40 ppm (exceeding the threshold of 24 ppm stipulated by the “Coal Mine Safety Regulations”). At present, the source of the CO is not clear (raw coal occurrence or oxidation of coal samples during production), and it is impossible to judge whether coal spontaneous combustion occurs in the working face.
The No. 3 coal seam of the Jurassic Yan’an Formation is mined in this face. The height of the machine and wind roadway is 3.7 m, the width of the machine roadway is 5.5 m, the width of the machine roadway is 5.9 m, the top coal of the machine roadway is 0~7.8 m, and the top coal of the wind roadway is 0~11.5 m during the tunneling period. The upper and lower limits of the working face mining are 963 m~1077 m, and the buried depth of the coal seam is 346 m~498 m. The working face strikes 1521 m long (horizontal distance) and tends to be 180 m wide (horizontal distance). The overall trend of the No. 3 coal seam is thick in the north and thin in the south, with a coal thickness of 4.4~16.5 m and an average thickness of 10.3 m, and the occurrence of coal seams is relatively stable, containing mainly long-flame coal (CY41) and non-sticky coal (BN31). The mining parameters of the 2306 working face are shown in Table 1. (The data comes from the relevant technical departments of the Zhaoxian Coal Mine.)
According to the report “Identification of Coal Dust Explosiveness and Spontaneous Combustion Tendency” issued by Shaanxi Coal Mine Safety Equipment Testing Center Co., Ltd. in 2022 in Shaanxi Province, China, the No. 3 coal seam belongs to the Class I coal seam (prone to spontaneous combustion) [16]. As specified in the report, the oxygen absorption capacity of the No. 3 coal seam is 75 cm3/g (dry coal), which meets the criteria of the China National Standard GB/T 44819-2024 [16] for Class I spontaneous combustion tendency (oxygen absorption capacity ≥ 0.70 cm3/g for dry coal) [17].

3. Coal Sample Tank Analysis Experiment

The presence of primary gas in coal seams will interfere with the determination of coal spontaneous combustion and the selection of prevention and control measures [18,19]. Therefore, in this paper, the original gas composition and content in the coal seam are tested, and correlated analysis is conducted through the analytical experiment of the coal sample tank.

3.1. Experimental Conditions and Procedures

It mainly includes the gas desorption device, gas composition, concentration determination device, and gas collection device.
1.
Gas desorption device:
The gas desorption device is mainly used for gas desorption after the underground coal samples are collected and loaded into the closed sampling pipe, so as to avoid the leakage of more gas production during transportation, as shown in Figure 1.
2.
Desorption gas collection device:
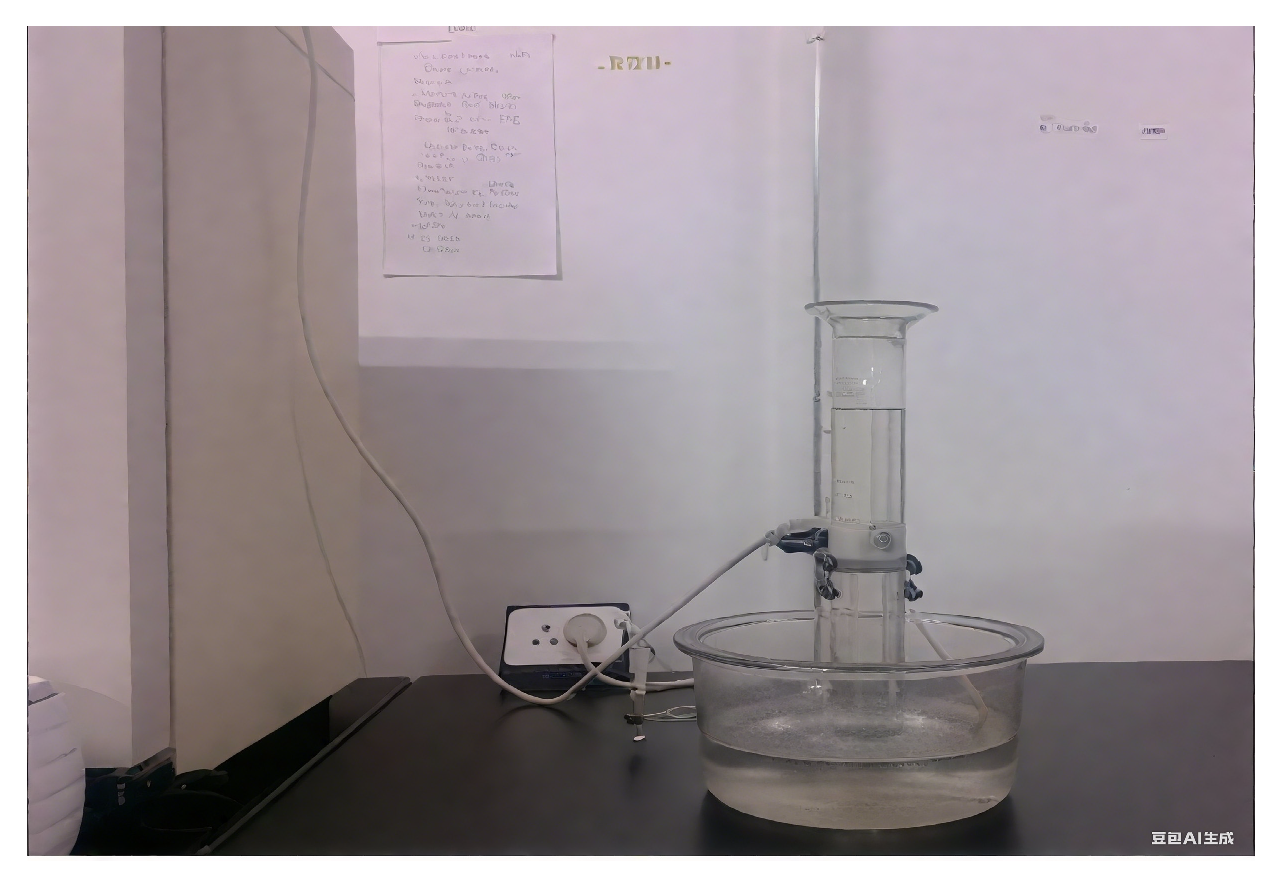
This device is used for collecting desorbed gas via the water displacement method. The structure and physical object of the device are shown in Figure 2.
3.
Gas composition and concentration determination device:
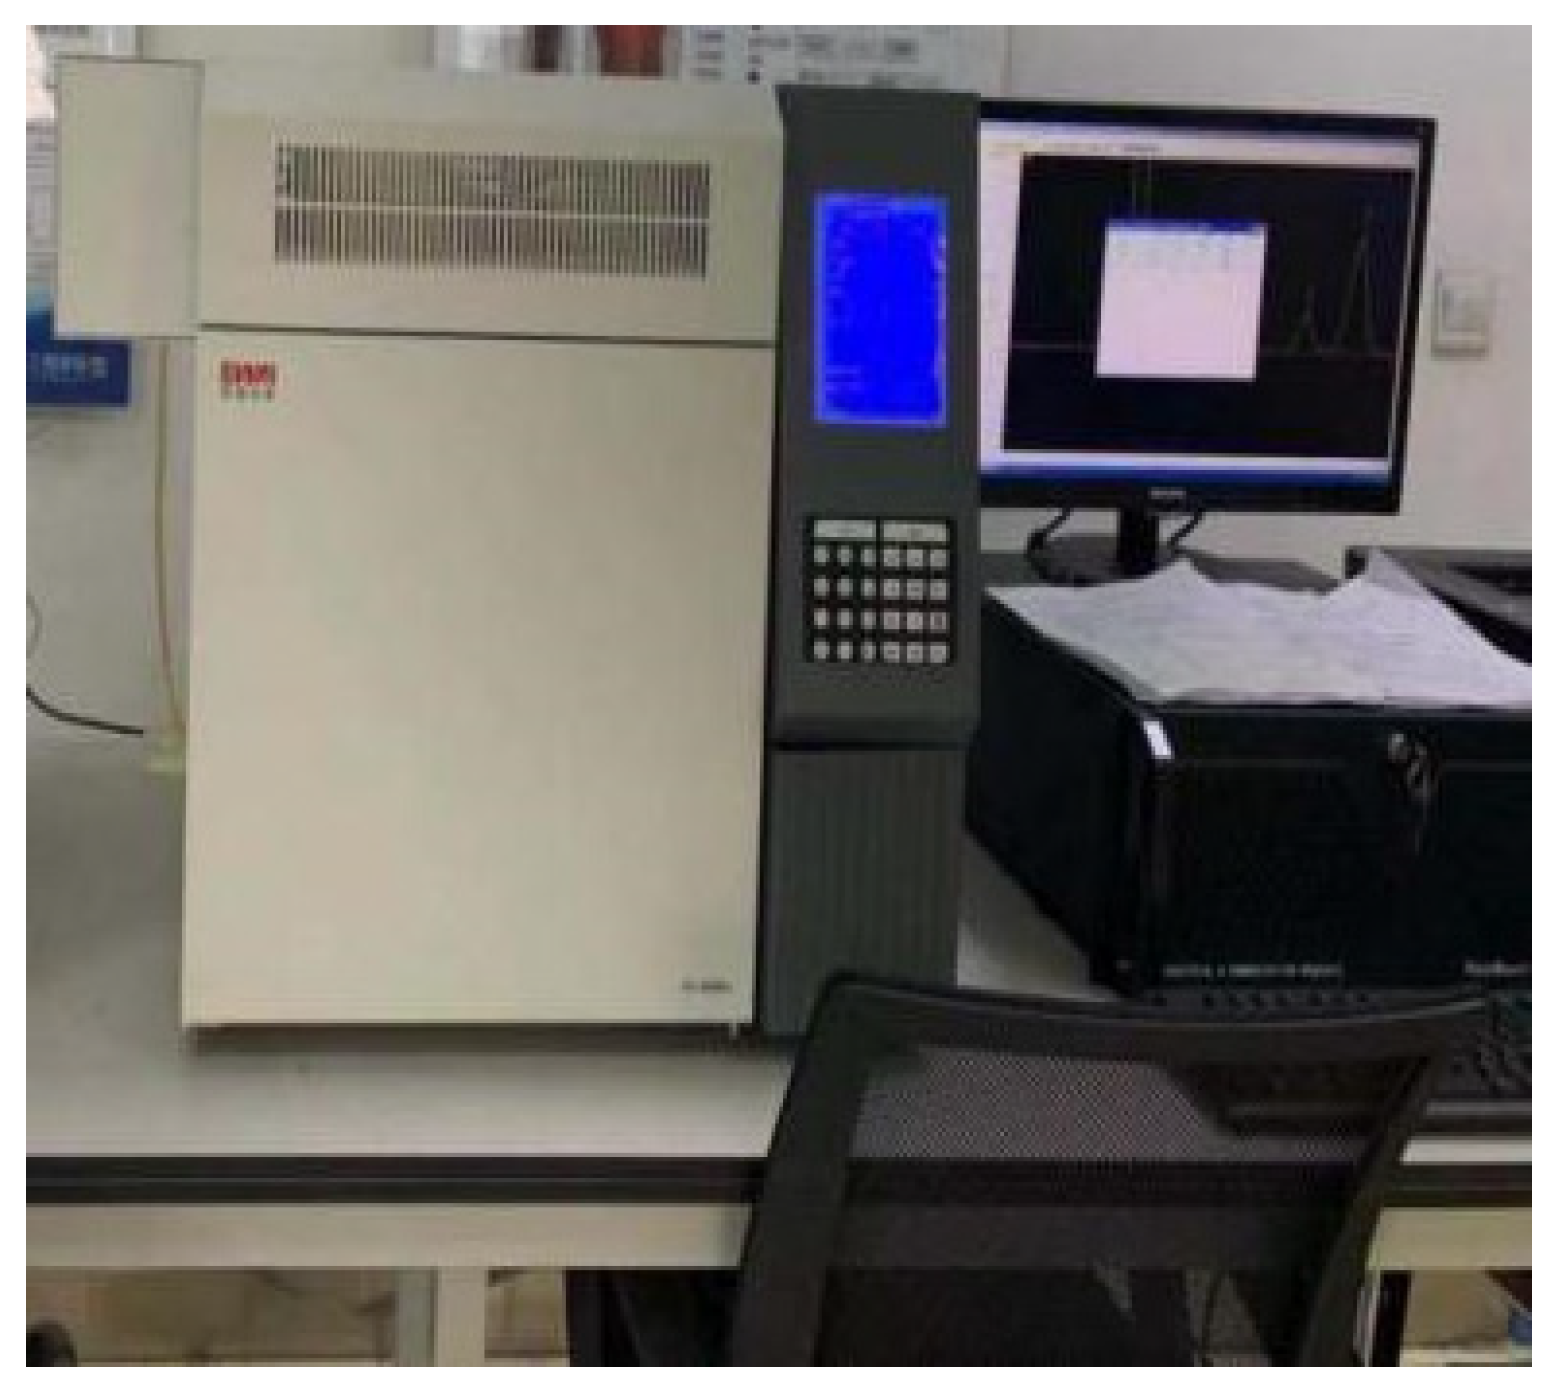
The gas chromatograph: Manual injection and dual detectors (flame ionization and thermal conductivity) were used to analyze the gas composition and concentration, as shown in Figure 3.
During the shutdown of the working face, the coal seam is drilled at the sampling site, and the coal core is collected with a core picker [20]. Before using the coal sample tank sealing, the puncture needle is first inserted into the sealant gasket on the upper part of the tank lid to avoid the phenomenon of holding air in the coal sample tank, and then the tank cover is tightened with a wrench and connected to the exhaust pipe with the puncture needle to determine the gas desorption rate. The downhole gas desorption meter is connected to the coal sample tank, the reading and measurement time of the measuring tube are recorded at certain intervals, and the continuous observation period is 60 min or when the desorption volume is less than 2 cm3/min. After the measurement, the water stop clamp is tightened to check the air tightness of the sampling tank; if there is no air leakage, it is sent to the laboratory to continue the measurement.

3.2. Experimental Results and Analysis

1.
Analysis of the results of gas downhole direct desorption experiments:
The coal core is powdery, the underground atmospheric pressure is 91.100 kPa, the ambient temperature is 24.0 °C, and the results of the underground direct desorption experiment are shown in Table 2.
As can be seen from Table 2, the desorption capacity of downhole gas is 0.02 m3/t.
2.
Analysis of the results of laboratory gas determination experiments:
The desorption capacity of the coal core is composed of two parts, namely the desorption amount measured downhole and the desorption amount determined by the laboratory, and the desorption amount determined by the laboratory is calculated as follows:
V = 293.1 × (P3 − 0.098 h − P22) ÷ P0 ÷ (273.1 + T2)
where
V—Measured desorption capacity in the laboratory;
P3—Laboratory atmospheric pressure, 96.1 kPa;
P22—The saturated vapor pressure of saturated saline at the laboratory ambient temperature t is 1.760 kPa;
P0—standard atmospheric pressure;
T2—laboratory ambient temperature, 26 °C.
The calculated desorption capacity in the laboratory was 0.9072 m3/t. The desorption capacity is 0.9272 m3/t.
The reading of the measuring tube was recorded, the measurement was completed and sent to the laboratory, and the gas content of each gas was analyzed using a fixed benchtop gas chromatograph. The gas determination of the coal sample tank is divided into two parts, namely the coal sample at 400 m of the return air groove of the 2306 working face and the coal sample at the front of the wind roadway excavation head of the 2302 working face, and the gas content is shown in Table 3 and Table 4.
Through the sampling and analysis of gas chromatograph, it was concluded that the primary coal seam at 400 m of the return air groove of the 2306 working face and the front of the excavation head of the 2302 working face contained a small amount of CO, but the air may have been mixed into the sampling process so that the coal sample was oxidized to produce a trace amount of CO during the transportation and storage of the coal sample tank, so the source of CO should be verified by the crushing experiment.

4. Indoor Crushing Experiments

4.1. Experimental Conditions and Procedures

The laboratory lump coal crushing and gas collection device can crush lump coal and collect gas under different gas environmental conditions, mainly including gas cylinders, crushers, and syringes.
The crusher contains two valves of air inlet and air outlet, which can connect the required gas through the air inlet, and then use a syringe to collect the gas generated during the experiment from the gas outlet. The crusher is shown in Figure 4.
During the shutdown period, a certain amount of lump coal was taken from the working face of the second mining area and the roadway of the first mining area, with a diameter of about 10 cm. The outside of the coal sample was peeled off and divided into small pieces with a diameter of about 3 cm, the crushed coal samples were put into the crusher, and five pieces were placed in each experiment. The two groups were fed air and nitrogen from the air intake, respectively, for about 5 to 7 min. After ventilation, it was broken for 5 s and let stand for 5 min. After the dust in the crusher completely settled, the air outlet was opened and a syringe was used to slowly extract the gas. Two experiments were carried out on the same coal sample. The extracted gas was analyzed using a chromatograph and the experiment was recorded.

4.2. Experimental Results and Analysis

The extracted gas was sent to the laboratory, where the gas composition and concentration were analyzed using a fixed benchtop gas chromatograph. The gas determination is divided into two parts, namely the coal sample at the 2306 working face in the second mining area and the coal sample in the alley of the first mining area, and the gas content is shown in Table 5 and Table 6.
From Table 5 and Table 6, it can be seen that the grinding of coal samples in the second and first mining areas of Zhaoxian will not produce CO gas under nitrogen conditions, while the grinding will produce a certain amount of CO under air conditions, the concentration of which is less than 10 ppm, and the CO produced by the grinding of coal samples in the first mining area under air conditions is smaller than that of the coal samples in the second mining area. It is proven that the CO generated during the analysis of the coal sample tank and the indoor crushing experiment is mainly generated by the oxidation of the coal sample, and is not the occurrence of raw coal.

5. Cause Analysis of High CO in Return Air Corner

There are three main reasons for the high CO in the return air corner: The residual coal in the goaf is oxidized to release CO. In the low temperature oxidation stage of coal, the CO concentration increases exponentially with the gradual increase in coal temperature. In the process of coal mining, the high temperature coal body is oxidized to produce CO. In the process of cutting coal in the working face, the rapid friction between the shearer pick and the coal body produces high temperatures, which lead to the acceleration of the oxidation rate of some coal bodies and the production of CO. Mining rubber-tired vehicles produce CO. Mining trackless rubber-tired vehicles and mining explosion-proof vehicles are widely used in the process of underground transportation, resulting in toxic and harmful gases such as CO being produced by diesel vehicle exhaust. However, the field environment and water volume affect the stability of the tail gas purification device of the mine trackless rubber-tired vehicle, and the effect of purifying the gas is not good, so that the harmful tail gases such as CO flow into the return corner of the working face with the air leakage flow.
Through theoretical analysis and field observation, it is determined that the main sources of CO in the return air corner of the 2306 fully mechanized caving face are CO released by oxidation of residual coal in the goaf, CO produced by the coal seam mining process, and CO produced by mining rubber-tired vehicles.

6. Prediction of the Dynamic Distribution of CO at the Return Air Corner Angle of the Fully Mechanized Working Face

In the actual mining process of coal seams in the Shaanxi mining area in China, problems such as gas accumulation and the overrun of CO and other gases often occur to varying degrees, but the on-site bundle monitoring system does not monitor other coal spontaneous combustion ignition index gases and the on-site management does not find that the temperature in the goaf increases significantly, which makes the source of CO in the return air corner a problem that has long plagued mine safety management workers [21,22,23]. Therefore, it is of great significance to calculate the theoretical predicted value of CO through the model, and judge whether the CO concentration in the return air corner of the working face is in the normal range based on the actual situation of the site, so as to provide a theoretical basis for the on-site treatment of the problem of CO accumulation and overrun in the return air corner.

6.1. Calculation Model of CO Concentration at the Return Air Corner of the Working Face

According to the analysis of the source and influencing factors of CO gas in the return air corner of the 2306 working face of Zhaoxian Mine [24], the main factor affecting the CO gas concentration in the working return air corner is the oxidation of the broken coal, so the main sources are divided into three categories: the oxidation of residual coal in the goaf; the coal body entering the goaf during the mining process; and coal cutting, rubber-tired vehicles, and other reasons. According to the above analysis, the following mathematical model for calculating CO concentration at the return air corner of the working face can be established:
VCO = (V1 + V2 + V3) ÷ QL
Among them, QL is the air leakage volume in the goaf, m3/min; V1 is the amount of oxidized CO produced by residual coal in the goaf, mol/cm3; V2 is the amount of CO oxidation produced by coal entering the goaf during V2 pushing, mol/cm3; and V3 is the amount of CO gas produced by other reasons, mol/cm3.

6.1.1. Goaf Air Leakage

The magnitude of the air velocity of the air leakage directly affects the heat dissipation of the coal body and the diffusion of CO gas concentration, and the air leakage air flow in the goaf is generally expressed by parameters such as air leakage intensity and air leakage rate [25,26].
  • Air leakage intensity and air leakage volume:
In a specific area, because the oxygen consumption rate and gas release of coal are basically fixed when the temperature is constant, the air leakage intensity Q ¯ in the goaf determines the distribution of oxygen concentration. The QL calculation formula for goaf air leakage volume is as follows:
Q L   =   Q ¯ S
wherein S is the area of the working face. According to the law of similarity, the distribution of air leakage intensity and oxygen concentration in a goaf of similar working face can be deduced from the known air leakage intensity of the goaf of the working face:
Q ¯ 1 Q 2 = R 1 L 2 ϕ 2 R 2 L 1 ϕ 1 Q 1 Q 2 2
wherein Q ¯ 1 and Q ¯ 2 are the required and known air leakage intensity of the working face, m3/(min·m2), respectively; R1 and R2 are the permeability coefficients of the required and known goafs, respectively; L1 and L2 are the required and known perimeters of the working face, m; φ1 and φ2 are the frictional resistance coefficients of the required and known working surfaces, kg/m3, respectively; and Q1 and Q2 are, respectively, the air distribution volume of the required and known working face, m3/min.
From Equations (3) and (4), we obtain the following:
Q L 1 Q L 2 = Q ¯ 1 S 1 Q ¯ 2 S 2 = R 1 L 2 S 1 ϕ 2 R 2 L 1 S 2 ϕ 1 ( Q 1 Q 2 ) 2
wherein QL1 and QL2 are the required and known air leakage volumes of the working face, m3/min, respectively; and S1 and S2 are the requirements and the known working surface area, m2, respectively.
Defining the air leakage coefficient as η, we then obtain the following:
η = Q L 1 Q 1 2 = R 1 L 2 S 1 ϕ 2 R 2 L 1 S 2 ϕ 1 Q L 2 Q 2 2
If the mining conditions of the two working faces are the same, then η = QL/Q2, so we obtain the following:
QL = ηQ2
wherein Q is the air supply volume of the working face.

6.1.2. The Amount of CO Produced

The oxidation temperature of the coal can be selected according to the actual situation during mining, the CO production rate can be determined according to the test under the corresponding temperature conditions, and the CO concentration is mainly determined by the amount of oxidized coal and the CO production rate [27,28].
  • Oxidation of CO from goaf area:
V 1 = α L H Z 1 ( 1 ϕ ) δ ( T )
Among them, α is the correction coefficient of the residual coal in the goaf oxide zone, which is less than 1. Under normal circumstances, the fully mechanized mining face is 0.3~0.5, and the fully mechanized working face is 0.2~0.4. L is the length of the working face, m; H is the thickness of the mined coal seam, m; Z1 is the width of the oxide zone in the goaf, m; φ is the recovery rate of the working face, %; and δ (T) is the rate of CO gas generation at the temperature T of the coal (determined according to the spontaneous combustion test of coal), mol/(cm3·s).
2.
The amount of CO oxidation produced by coal entering the goaf during the mining process:
V 2 = β L H Z 2 ( 1 ϕ ) δ ( T )
Among them, the β is the oxidation correction coefficient of the residual coal in the goaf heat dissipation zone, which is generally 0.8~1.0 under normal air leakage conditions, and less than 0.5 if the air leakage rate is less than 1%; and Z2 is the width of the goaf heat dissipation zone, m.
3.
The amount of CO produced by coal cutting, rubber-tired vehicles, and other reasons:
Under normal circumstances, the CO generated by rubber-tired vehicles or other reasons has a short existence time, and can generally be ignored in normal monitoring and forecasting, so we obtain the following:
V 3 = V g = ν L H 24 × 3600 θ = 1.157 × 10 5 ν L H θ
Among them, Vg is the amount of CO produced in the process of coal cutting; θ is the amount of CO produced per unit volume of coal during mechanical crushing in the coal cutting process, mol/cm3; and v is the advancing speed of the working face, m/d.

6.1.3. Mathematical Model for CO Concentration Calculation

Substituting the above formula into Equation (10), the calculation model of CO concentration at the return air corner angle under normal production of the working face is obtained as follows:
V C O = [ α Z 1 + β Z 2 L H 1 ϕ δ T + 1.157 × 10 5 ν H L θ ] / ( η Q 2 )
Under general mining conditions, the amount of CO produced by the mechanical crushing of coal is much smaller than that produced by coal oxygen, that is, δ(T) = 1.157 × 10⁵θ. Therefore, when calculating the CO concentration of the return air corner angle under the normal mining conditions of the working face, Equation (11) can be simplified as follows:
V C O = α Z 1 + β Z 2 L H 1 ϕ δ T / η Q 2

6.2. On-Site Monitoring of CO Concentration at the Working Face

6.2.1. On-Site Monitoring of CO Concentration at the Return Air Corner of the Working Face

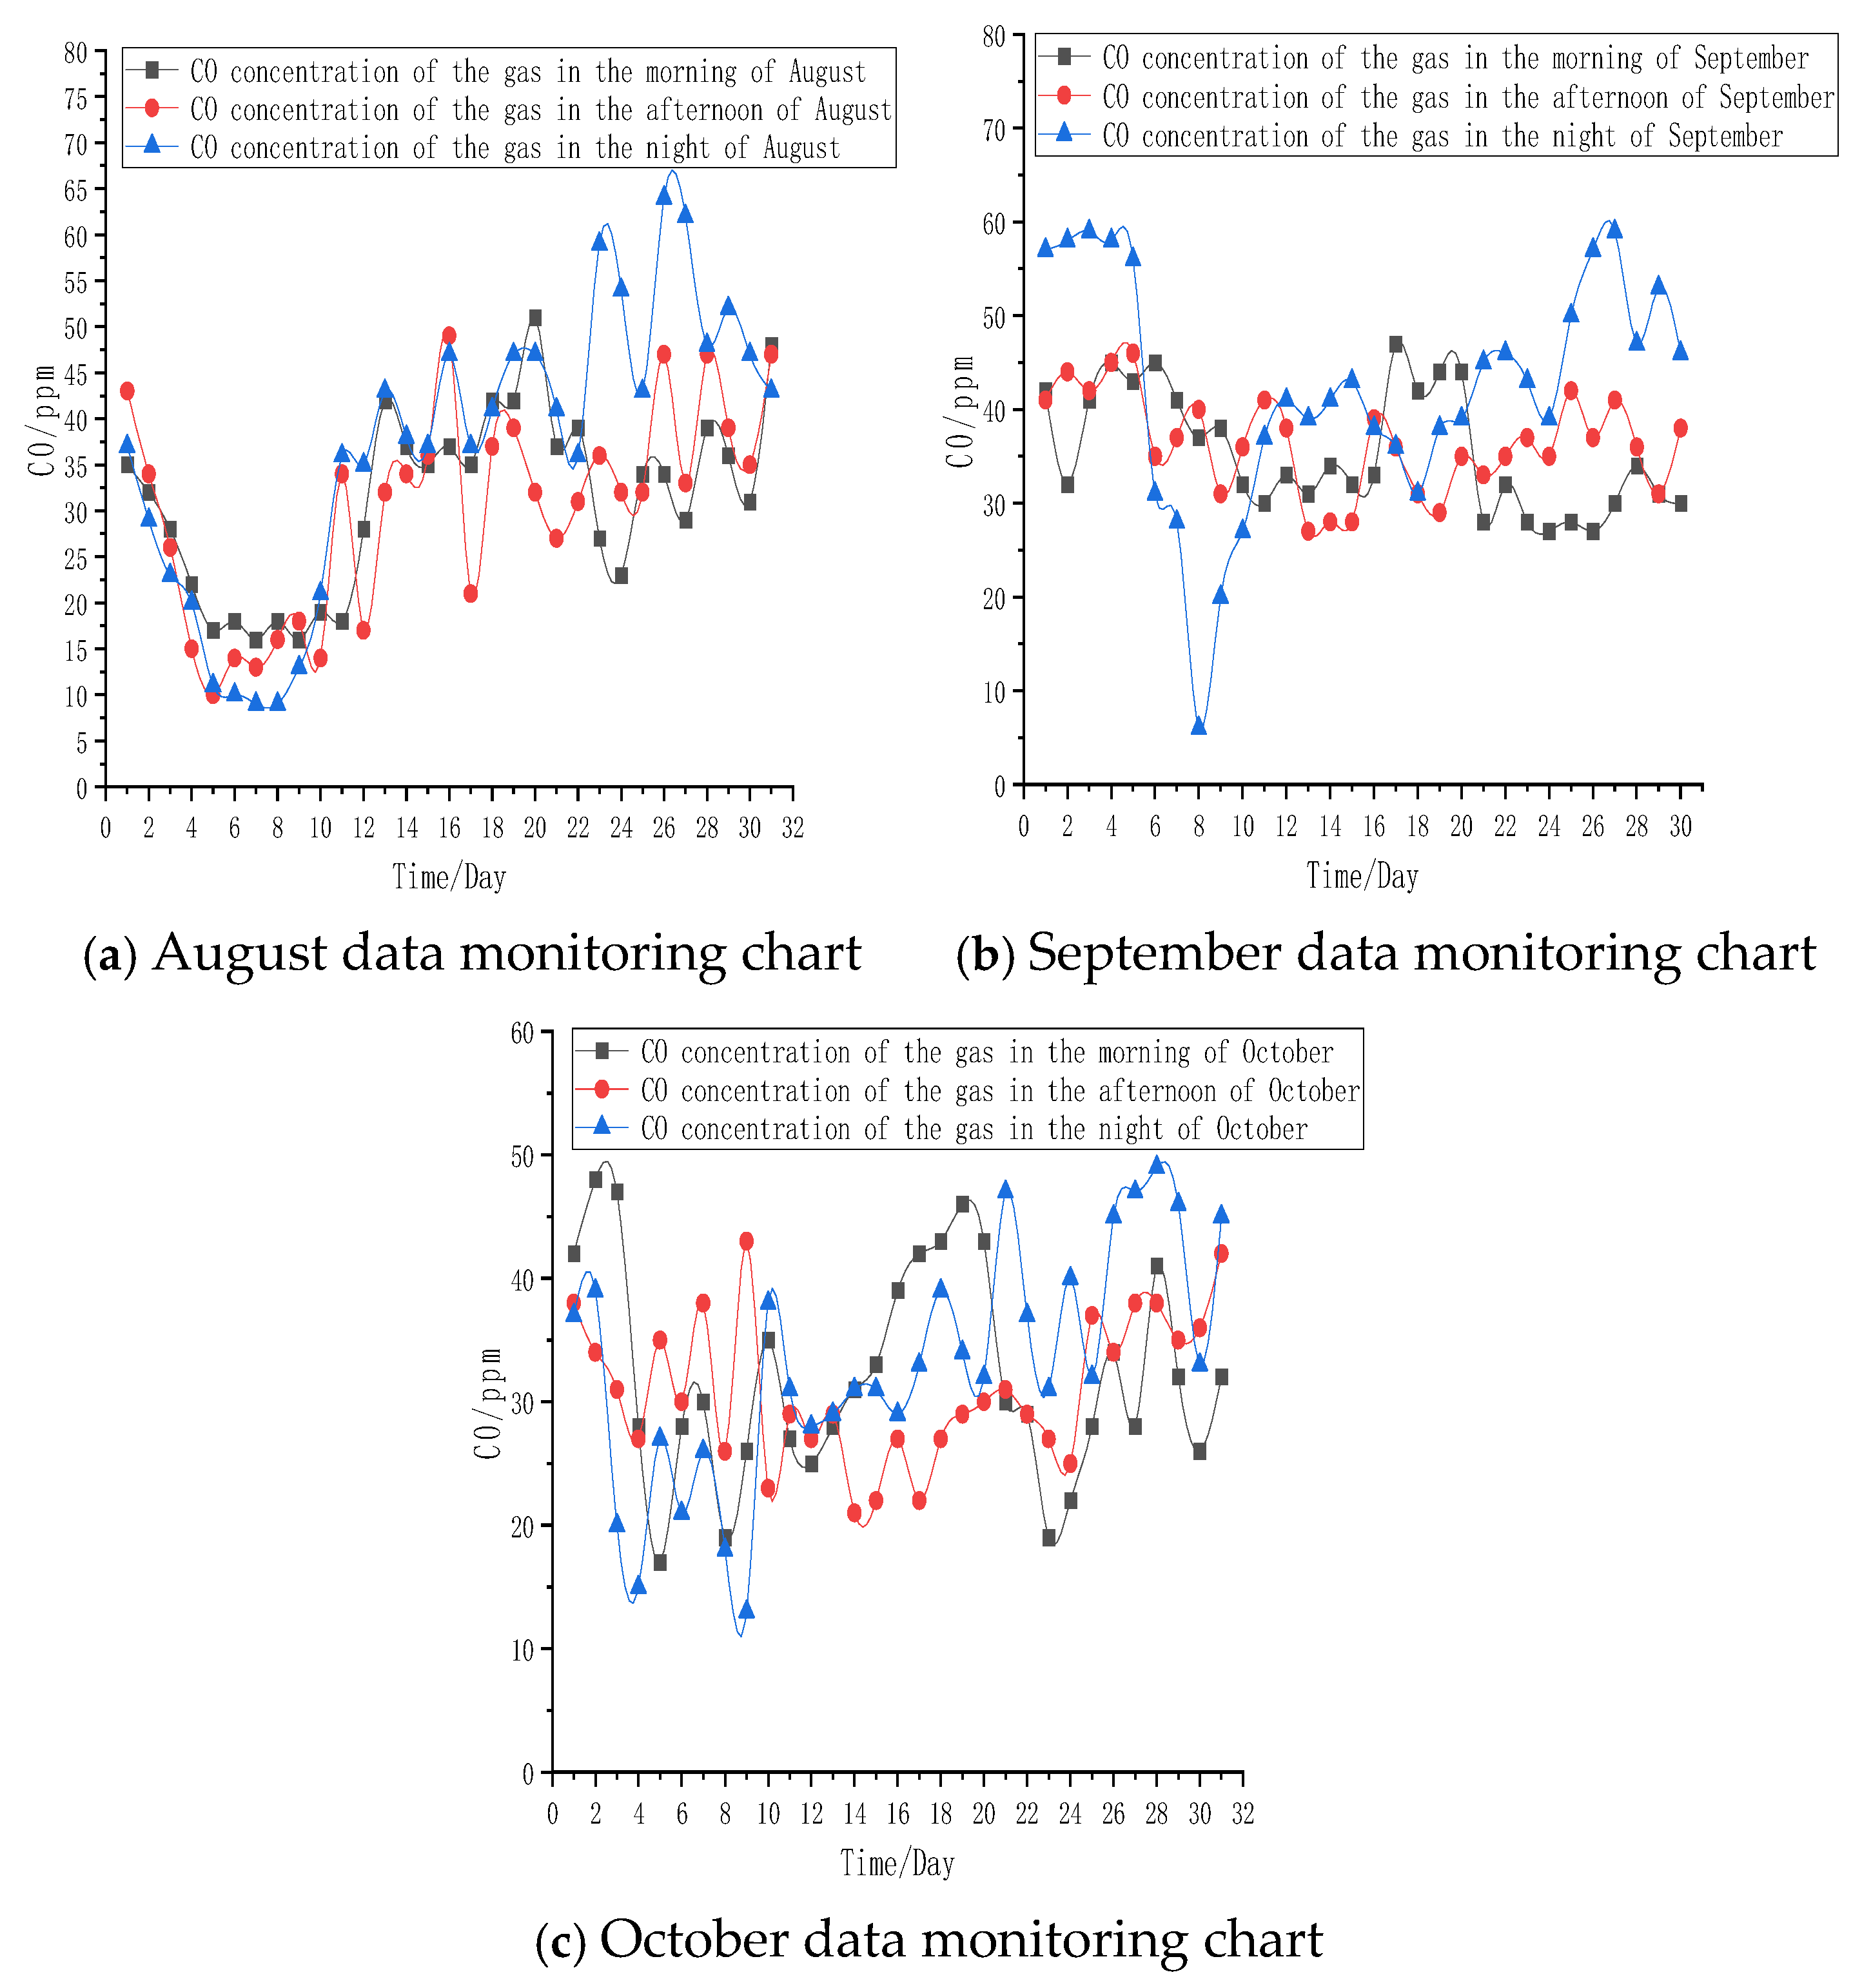
The tile inspector uses a CO identification tube or a multi-parameter gas tester to detect and record the CO concentration at the return air corner of the working face, and moves forward with the advancement of the working face to sort out and analyze the monitoring data of the return air corner of the 2306 working face in August, September, and October. The test results are shown in Figure 5.
As can be seen from Figure 5, the CO concentration at the return air corner of the 2306 fully mechanized mining face is 6~64 ppm. Restricted by the geometric space between the end brackets of the working face and the roadway, the air flow forms eddy currents or stagnant zones in the return air corner area, resulting in reduced wind speed and weakened air exchange capacity in this region, which facilitates the accumulation of CO gas. CO gas will accumulate at the return air corner of the working face, and the CO concentration will be larger where CO comes from the oxidation of the residual coal in the goaf. The size of the CO concentration in the return air corner can reflect the degree of spontaneous combustion of the residual coal in the goaf to a certain extent [29,30].

6.2.2. On-Site Monitoring of CO Concentration at the Return Air Corner of the Working Face

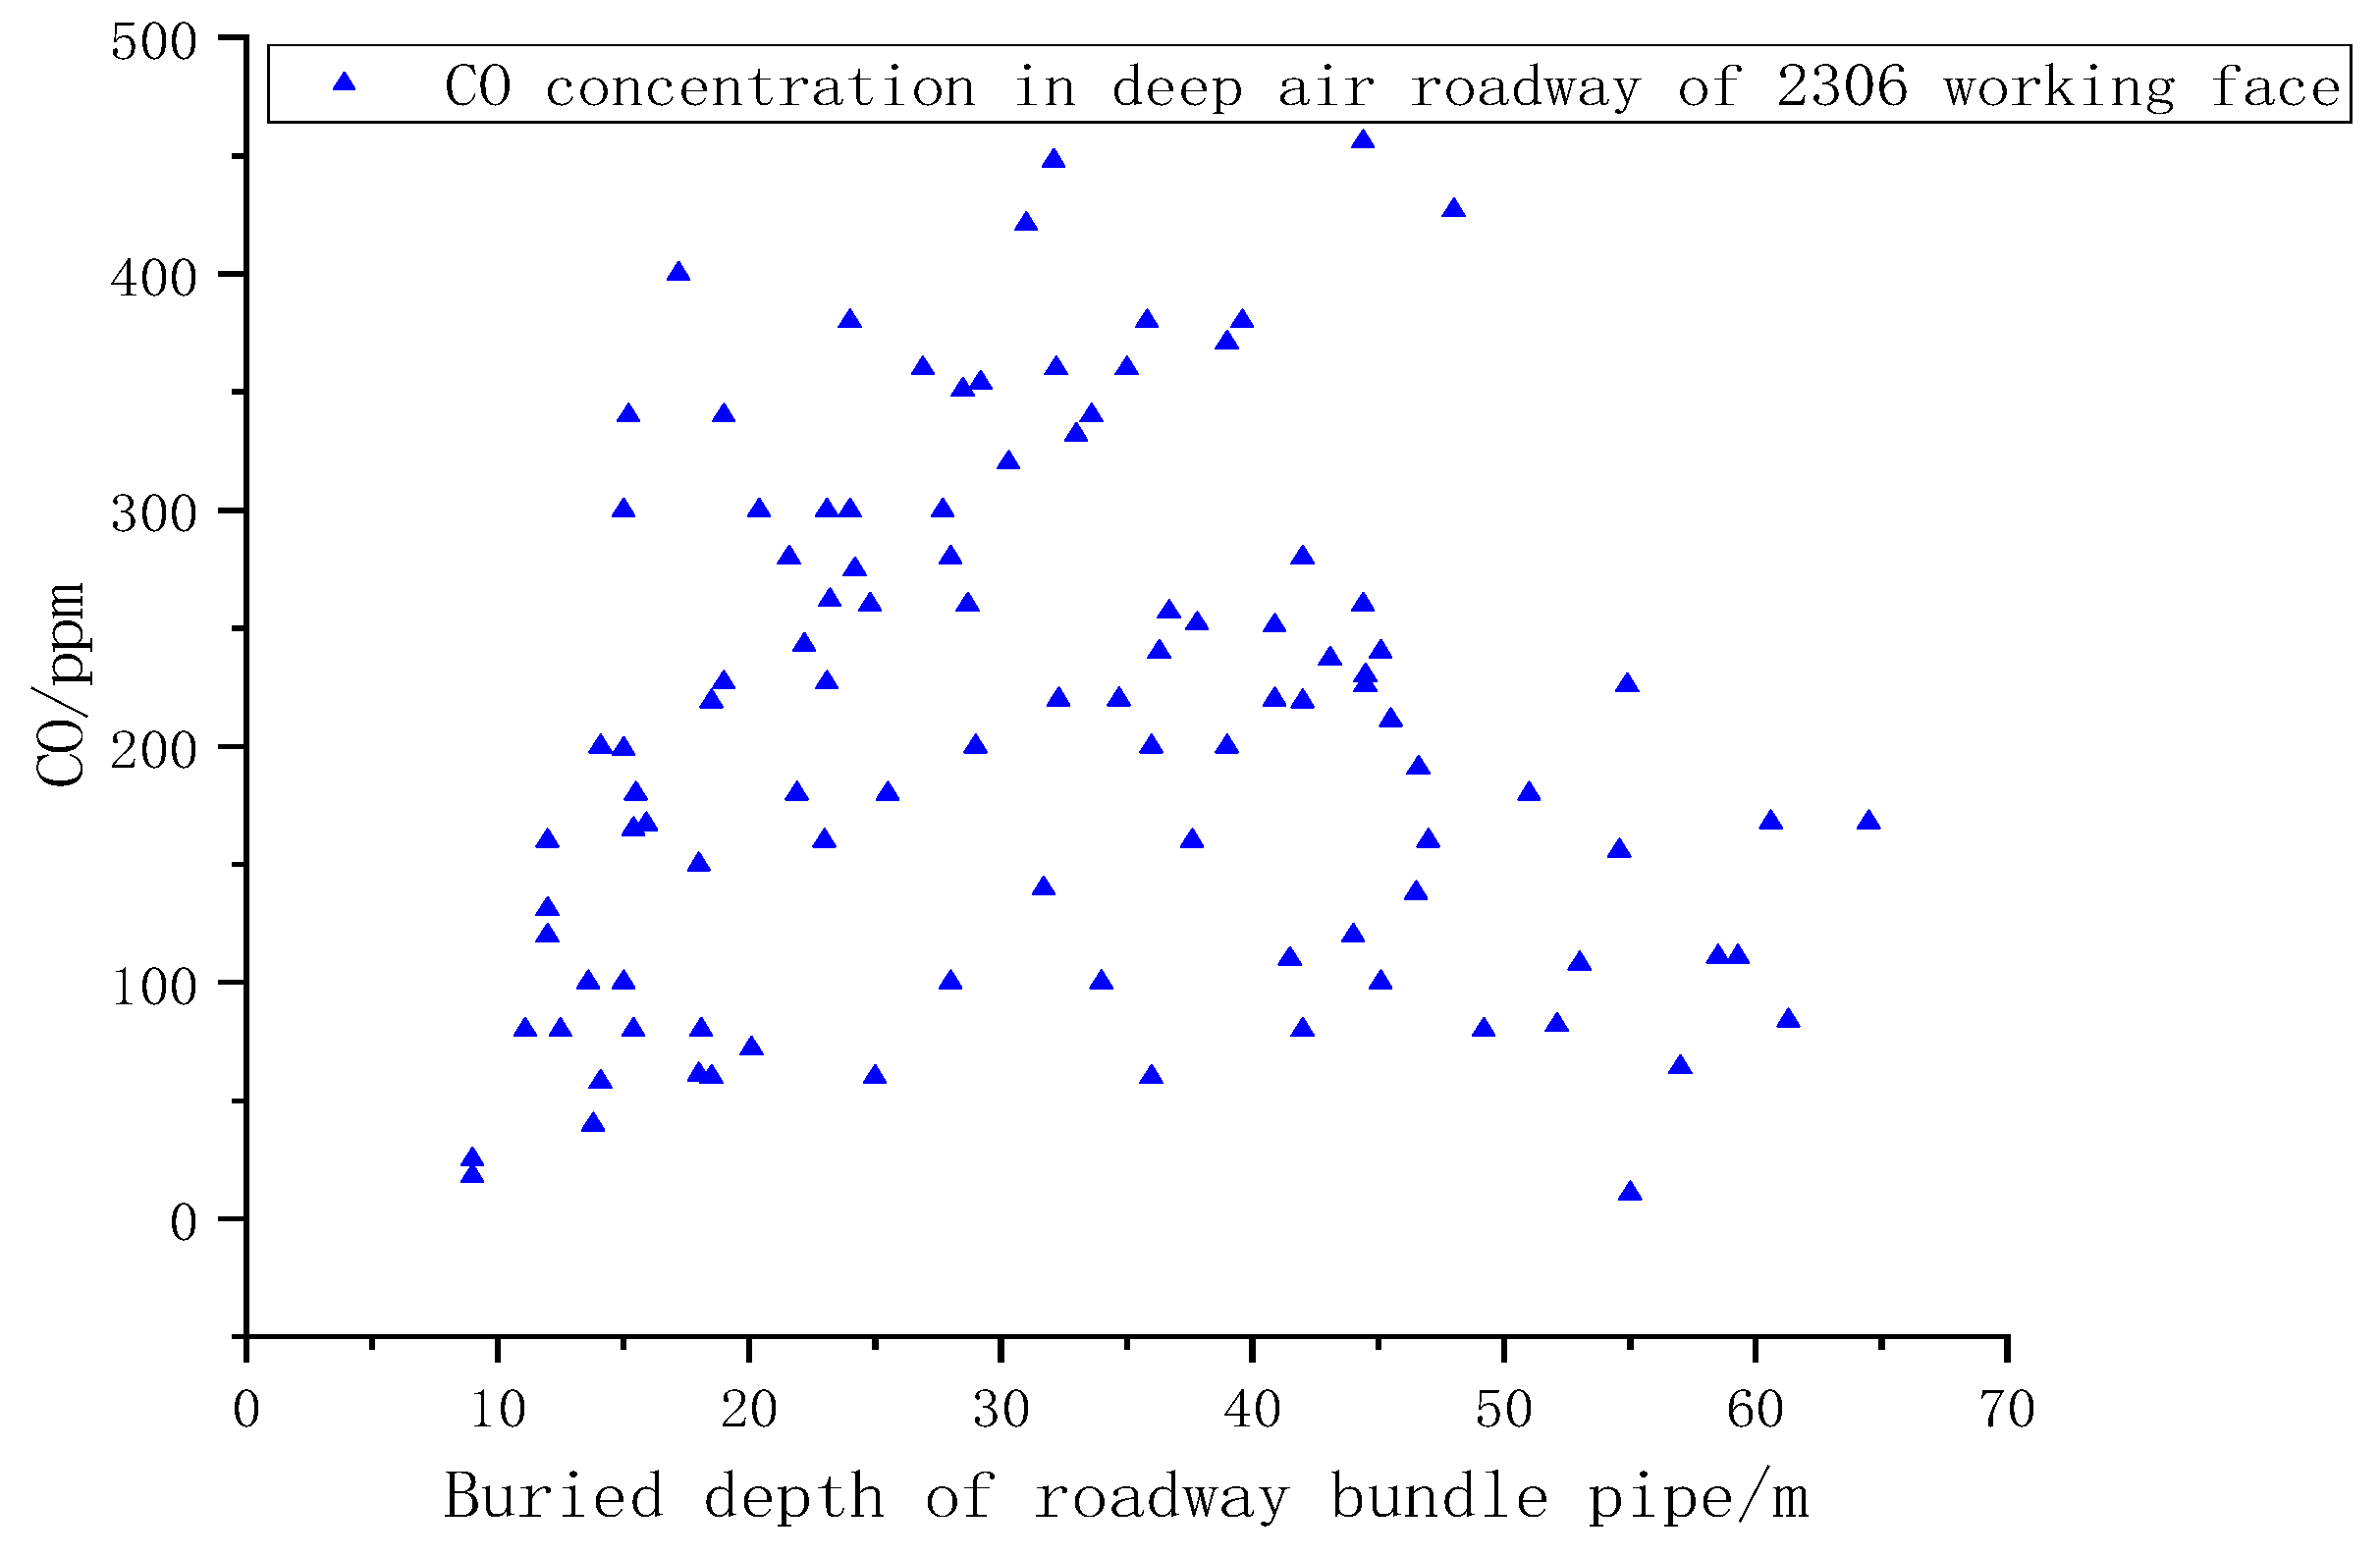
The detection of CO concentration in the deep goaf on the return air side of the working face is conducted once a day, the negative pressure airpump is used to pump the air through the bundle pipe buried in the goaf on the return air side, and the gas sample is sent to the ground chromatography chamber for chromatographic analysis by the sampling bulb. The gas composition of the test analysis is O2, CO, CH4, N2, CO2, and CnHm, and the distance between the goaf measurement point and the working face is recorded at the same time. With the advancement of the working face, the detection data of August, September, and October in the deep goaf on the return air side of the 2306 working face were sorted out and analyzed, and the detection results are shown in Figure 6.
It can be seen from Figure 6 that when the 2306 fully mechanized mining face return air side bundle pipe enters the goaf depth 10~35 m, the detected CO concentration is higher. Most of the time the CO concentration is higher than 100 ppm, and the highest concentration reaches 456 ppm. When the bundle tube penetrates deeper into the goaf more than 40 m, the detected CO concentration shows a downward trend as a whole.

6.3. Dynamic Prediction of CO Concentration at the Return Air Corner of the Working Face

Taking the Zhaoxian 2306 working face as the research object, the basic process parameters of the working face mining were recorded and combined with the report of “Determination of Three Zones of Natural Ignition in the Goaf of Zhaoxian Coal Mine Working Face and the Classification of Coal Spontaneous Combustion Danger Area” issued by China University of Mining and Technology in April 2024 and the “Report on Natural Ignition Marker Gas and Critical Value in the Second Mining Area of No. 3 Coal Seam of Zhaoxian Coal Mine”. The CO generation rate at different temperatures was obtained, which was used as the basis for the calculation of CO concentration at the return air corner of the working face. The CO generation rate is 0.02 × 10⁻¹¹ mol/(cm3·s), the above parameters are substituted into Equations (4) and (11), respectively, and finally the limit CO gas concentration parameters of the working face are obtained, as shown in Table 7.

7. Discussion

This study systematically identified the sources of CO overrun at the return air corner of the fully mechanized mining face in the Zhaoxian Coal Mine and established a predictive model for CO concentration. The key findings are threefold.
First, primary coal seams do not inherently contain CO. Coal sample tank analysis experiments (Section 3) detected trace CO (<10 ppm) in coal samples, but indoor crushing experiments (Section 4) confirmed that CO was only generated under air (oxidative) conditions, not under nitrogen (anaerobic) conditions. This indicates that the observed CO in coal samples originated from post-sampling oxidation rather than primary gas occurrence.
Second, goaf residual coal oxidation is the dominant CO source. Field monitoring (Section 6.2.1) showed CO concentrations of 6–64 ppm at the return air corner and up to 456 ppm in the 10–35 m goaf depth. Notably, our calculated CO prediction model (Section 7) yielded a range of 11–66 ppm, which closely matched the field monitoring data (6–64 ppm), validating the model’s reliability.
Third, CO overrun does not equate to spontaneous combustion risk. The absence of other marker gases (e.g., C2H4, C2H6) in goaf gas analysis (Section 4.2 and the low CO concentration (<100 ppm in most cases) suggest that the current CO levels remain within the “normal oxidation” range defined by the “Natural Ignition Marker Gas Report” (Section 6.2.1, highlighting the practical significance of our risk assessment framework.
Limitations and future work: The model assumes steady-state air leakage, which may not capture transient mining disturbances. Future studies should integrate real-time air velocity data (e.g., ultrasonic anemometers) to improve dynamic prediction accuracy. Additionally, comparative experiments with other high-gas mines (e.g., Shendong Group’s Bulianta Coal Mine [10]) are needed to generalize the findings.

Author Contributions

Conceptualization, C.Q. and W.L.; methodology, W.L.; software, Y.J.; validation, C.Q., X.C. and Y.L.; formal analysis, C.L.; investigation, L.Z.; resources, W.L.; data curation, C.Q.; writing—original draft preparation, C.Q.; writing—review and editing, C.Q.; visualization, J.H.; supervision, W.L.; project administration, C.Q.; funding acquisition, W.L. All authors have read and agreed to the published version of the manuscript.

Funding

This research received no external funding.

Data Availability Statement

The original contributions presented in this study are included in the article. Further inquiries can be directed to the corresponding author(s).

Conflicts of Interest

The authors declare no conflict of interest.

References

  1. Shi, D.; Liu, X.; He, L. A review on mine fire prevention technology and theory based on bibliometric analysis. Sustainability 2023, 15, 16639. [Google Scholar] [CrossRef]
  2. Liu, Y.; Wen, H.; Chen, C.; Guo, J.; Jin, Y.; Zheng, X.; Cheng, X.; Li, D. Research status and development trend of coal spontaneous combustion fire and prevention technology in China: A review. ACS Omega 2024, 9, 21727–21750. [Google Scholar] [CrossRef]
  3. Yan, Q.; Lu, Y.; Wang, Q.; Gu, W.; Wu, F. Research progress and development trend of coal spontaneous combustion prevention technology. Combust. Sci. Technol. 2024, 197, 3057–3084. [Google Scholar] [CrossRef]
  4. Yu, S.-L.; Liu, X. Study on multi-indicator quantitative risk evaluation methods for different periods of coal spontaneous combustion in coal mines. Combust. Sci. Technol. 2024, 196, 1628–1641. [Google Scholar] [CrossRef]
  5. Wang, C.; Hu, P.; Sun, Y.; Yang, C. Study on CO source identification and spontaneous combustion warning concentration in the return corner of working face in shallow buried coal seam. Environ. Sci. Pollut. Res. Int. 2024, 31, 15050–15064. [Google Scholar] [CrossRef]
  6. Li, J.; Li, X.; Chen, S.; Cao, J.; Gao, F. Study on generation, migration and accumulation of CO in the mining goaf of shallow-buried close distance coal seam group. Sci. Rep. 2022, 12, 14424. [Google Scholar] [CrossRef] [PubMed]
  7. Mao, X.; Zhou, Q.; Jia, B.; Chen, J.; Wang, D. Research on CO migration patterns in shallowly buried coal seam composite goafs. ACS Omega 2024, 9, 33710–33722. [Google Scholar] [CrossRef] [PubMed]
  8. Liu, H.; Li, Z.; Li, J.; Yang, Y.; Zhang, Y. CO-based early warning threshold for coal spontaneous combustion. Mater. Chem. Phys. 2024, 313, 128730. [Google Scholar] [CrossRef]
  9. Jia, X.; Qi, Q.; Zhao, Y.; Dong, Z.; Li, X. CO emission regularity and its influencing factors in a fully mechanized caving face. AIP Adv. 2021, 11, 075111. [Google Scholar] [CrossRef]
  10. Cao, W.; Zhong, X.; Wang, D.; Zhou, K.; Wang, Y.; Hou, F. CO release characteristics of coal spontaneous combustion in low-temperature oxygen-deficient environments: Coupling effects of temperature, oxygen concentration and time. J. Hazard. Mater. 2025, 495, 139073. [Google Scholar] [CrossRef]
  11. Gao, S.; Gao, D.; Liu, Y.; Chai, J.; Chen, J. Distribution law of coal spontaneous combustion hazard area in composite goaf of shallow buried close distance coal seam group. Combust. Sci. Technol. 2023, 195, 1960–1980. [Google Scholar] [CrossRef]
  12. Li, Y.; Jiang, M.; Jing, Z. Prediction Model of Spontaneous Combustion of Lignite in Zhalainuoer Mining Area. ACS Omega 2024, 9, 31765–31775. [Google Scholar] [CrossRef]
  13. Fan, Y.; Shu, L.; Song, X.; Gong, H. Study on Air Injection to Enhance Coalbed Gas Extraction. Processes 2025, 13, 1882. [Google Scholar] [CrossRef]
  14. Liang, Y.; Yang, Y.; Guo, S.; Tian, F.; Wang, S. Combustion mechanism and control approaches of underground coal fires: A review. Int. J. Coal Sci. Technol. 2023, 10, 24. [Google Scholar] [CrossRef]
  15. Li, X.; Zhang, J.; Ren, X.; Liu, Y.; Zhou, C.; Li, T. Study on condition analysis and temperature prediction of coal spontaneous combustion based on improved genetic algorithm. AIP Adv. 2022, 12, 115128. [Google Scholar] [CrossRef]
  16. GB/T 44819-2024; Method for Determining the Spontaneous Combustion Indicator Gas and Critical Value in Coal Seams. State Administration of Market Supervision and Administration, National Standardization Management Committee Publisher: Beijing, China, 2024.
  17. Wei, D.; Du, C.; Lei, B.; Lin, Y. Prediction and prevention of spontaneous combustion of coal from goafs in workface: A case study. Case Stud. Therm. Eng. 2020, 21, 100668. [Google Scholar] [CrossRef]
  18. Yılmaz, A.; Bilen, M.; Rasskazova, A. Determination of Gas Contents and Spontaneous Combustion Liabilities of Zonguldak Coals. Solid Fuel Chem. 2025, 59, 97–103. [Google Scholar] [CrossRef]
  19. Gao, S.; Tang, M.; Luo, X.; Zhou, L.; Qiu, J.; Zhang, R. Dynamic simulation study on space-time evolution law of coal spontaneous combustion hazardous zone and high-temperature points in goaf. Int. J. Heat Mass Transf. 2025, 251, 127321. [Google Scholar] [CrossRef]
  20. Ma, Z.; Qin, B.; Shi, Q.; Zhu, T.; Chen, X.; Liu, H. The location analysis and efficient control of hidden coal spontaneous combustion disaster in coal mine goaf: A case study. Process Saf. Environ. Prot. 2024, 184, 66–78. [Google Scholar] [CrossRef]
  21. Li, J.; Li, J.; Wang, T.; Liu, G.; He, Z.; Li, C.; Xie, H. Key techniques for precise measuring gas content in deep coal mine: In-situ pressure-and gas-preserved coring. Int. J. Min. Sci. Technol. 2025, 35, 589–607. [Google Scholar] [CrossRef]
  22. Deng, J.; Li, X.; Wang, K.; Wang, C.; Ren, L.; Qu, G.; Li, Q. Advances and Prospects in the Risk Prediction and Early Warning Technology for the compound disaster of coal spontaneous combustion and gas explosion. Process Saf. Environ. Prot. 2025, 201, 107489. [Google Scholar] [CrossRef]
  23. Cheng, J.; Ma, Y.; Lu, W.; Liu, G.; Cai, F. Using inverting CO critical value to predict coal spontaneous combustion severity in mine gobs with considering air leakages–A case study. Process Saf. Environ. Prot. 2022, 167, 45–55. [Google Scholar] [CrossRef]
  24. Zhang, J.; Cheng, X.; Wen, H.; Wang, W. Prediction and control of coal spontaneous combustion in a multi-fault fully mechanized top coal caving face at the mine field boundary. Combust. Sci. Technol. 2022, 194, 1895–1913. [Google Scholar] [CrossRef]
  25. Wu, F.; Shi, S.; Lu, Y.; Shao, S.; Wu, X.; Gu, W. Analysis of CO source and prediction model of gushing concentration at the return air corner of working face in shallow coal seam mine. Combust. Sci. Technol. 2024, 196, 4204–4219. [Google Scholar] [CrossRef]
  26. Chen, X.; Song, C.; Zhang, Z. The Influence of the Fire Point on the Thermal Dynamic Disaster in the Goaf. Fire 2024, 7, 270. [Google Scholar] [CrossRef]
  27. Wu, Y.; Zhang, Y.; Zhou, C.; Wang, J.; Wu, J.; Ren, T. Study of CO sources and early-warning concentration of spontaneous combustion at air return corner in fully mechanized mining faces. Combust. Sci. Technol. 2021, 193, 1587–1604. [Google Scholar] [CrossRef]
  28. Kursunoglu, N.; Ankara, H. Application of statistical process control to monitor underground coal mine fires based on CO emissions. Combust. Sci. Technol. 2024, 196, 142–159. [Google Scholar] [CrossRef]
  29. Lei, C.; Zhu, Y.; Feng, Q.; Ma, L.; Zhao, J.; Cui, C.; Deng, C. Migration characteristics and prediction of high temperature points in coal spontaneous combustion. Energy 2025, 326, 136288. [Google Scholar] [CrossRef]
  30. Ma, L.; Zhang, W.; Zhao, Q.; Wei, G.; Guo, Y.; Lou, F.; Jin, S.; Tuo, L. Dangerous area evolution and coal spontaneous combustion prevention method induced by air leakage in Goaf of ultra-long working face. Combust. Sci. Technol. 2025, 57, 1–21. [Google Scholar] [CrossRef]
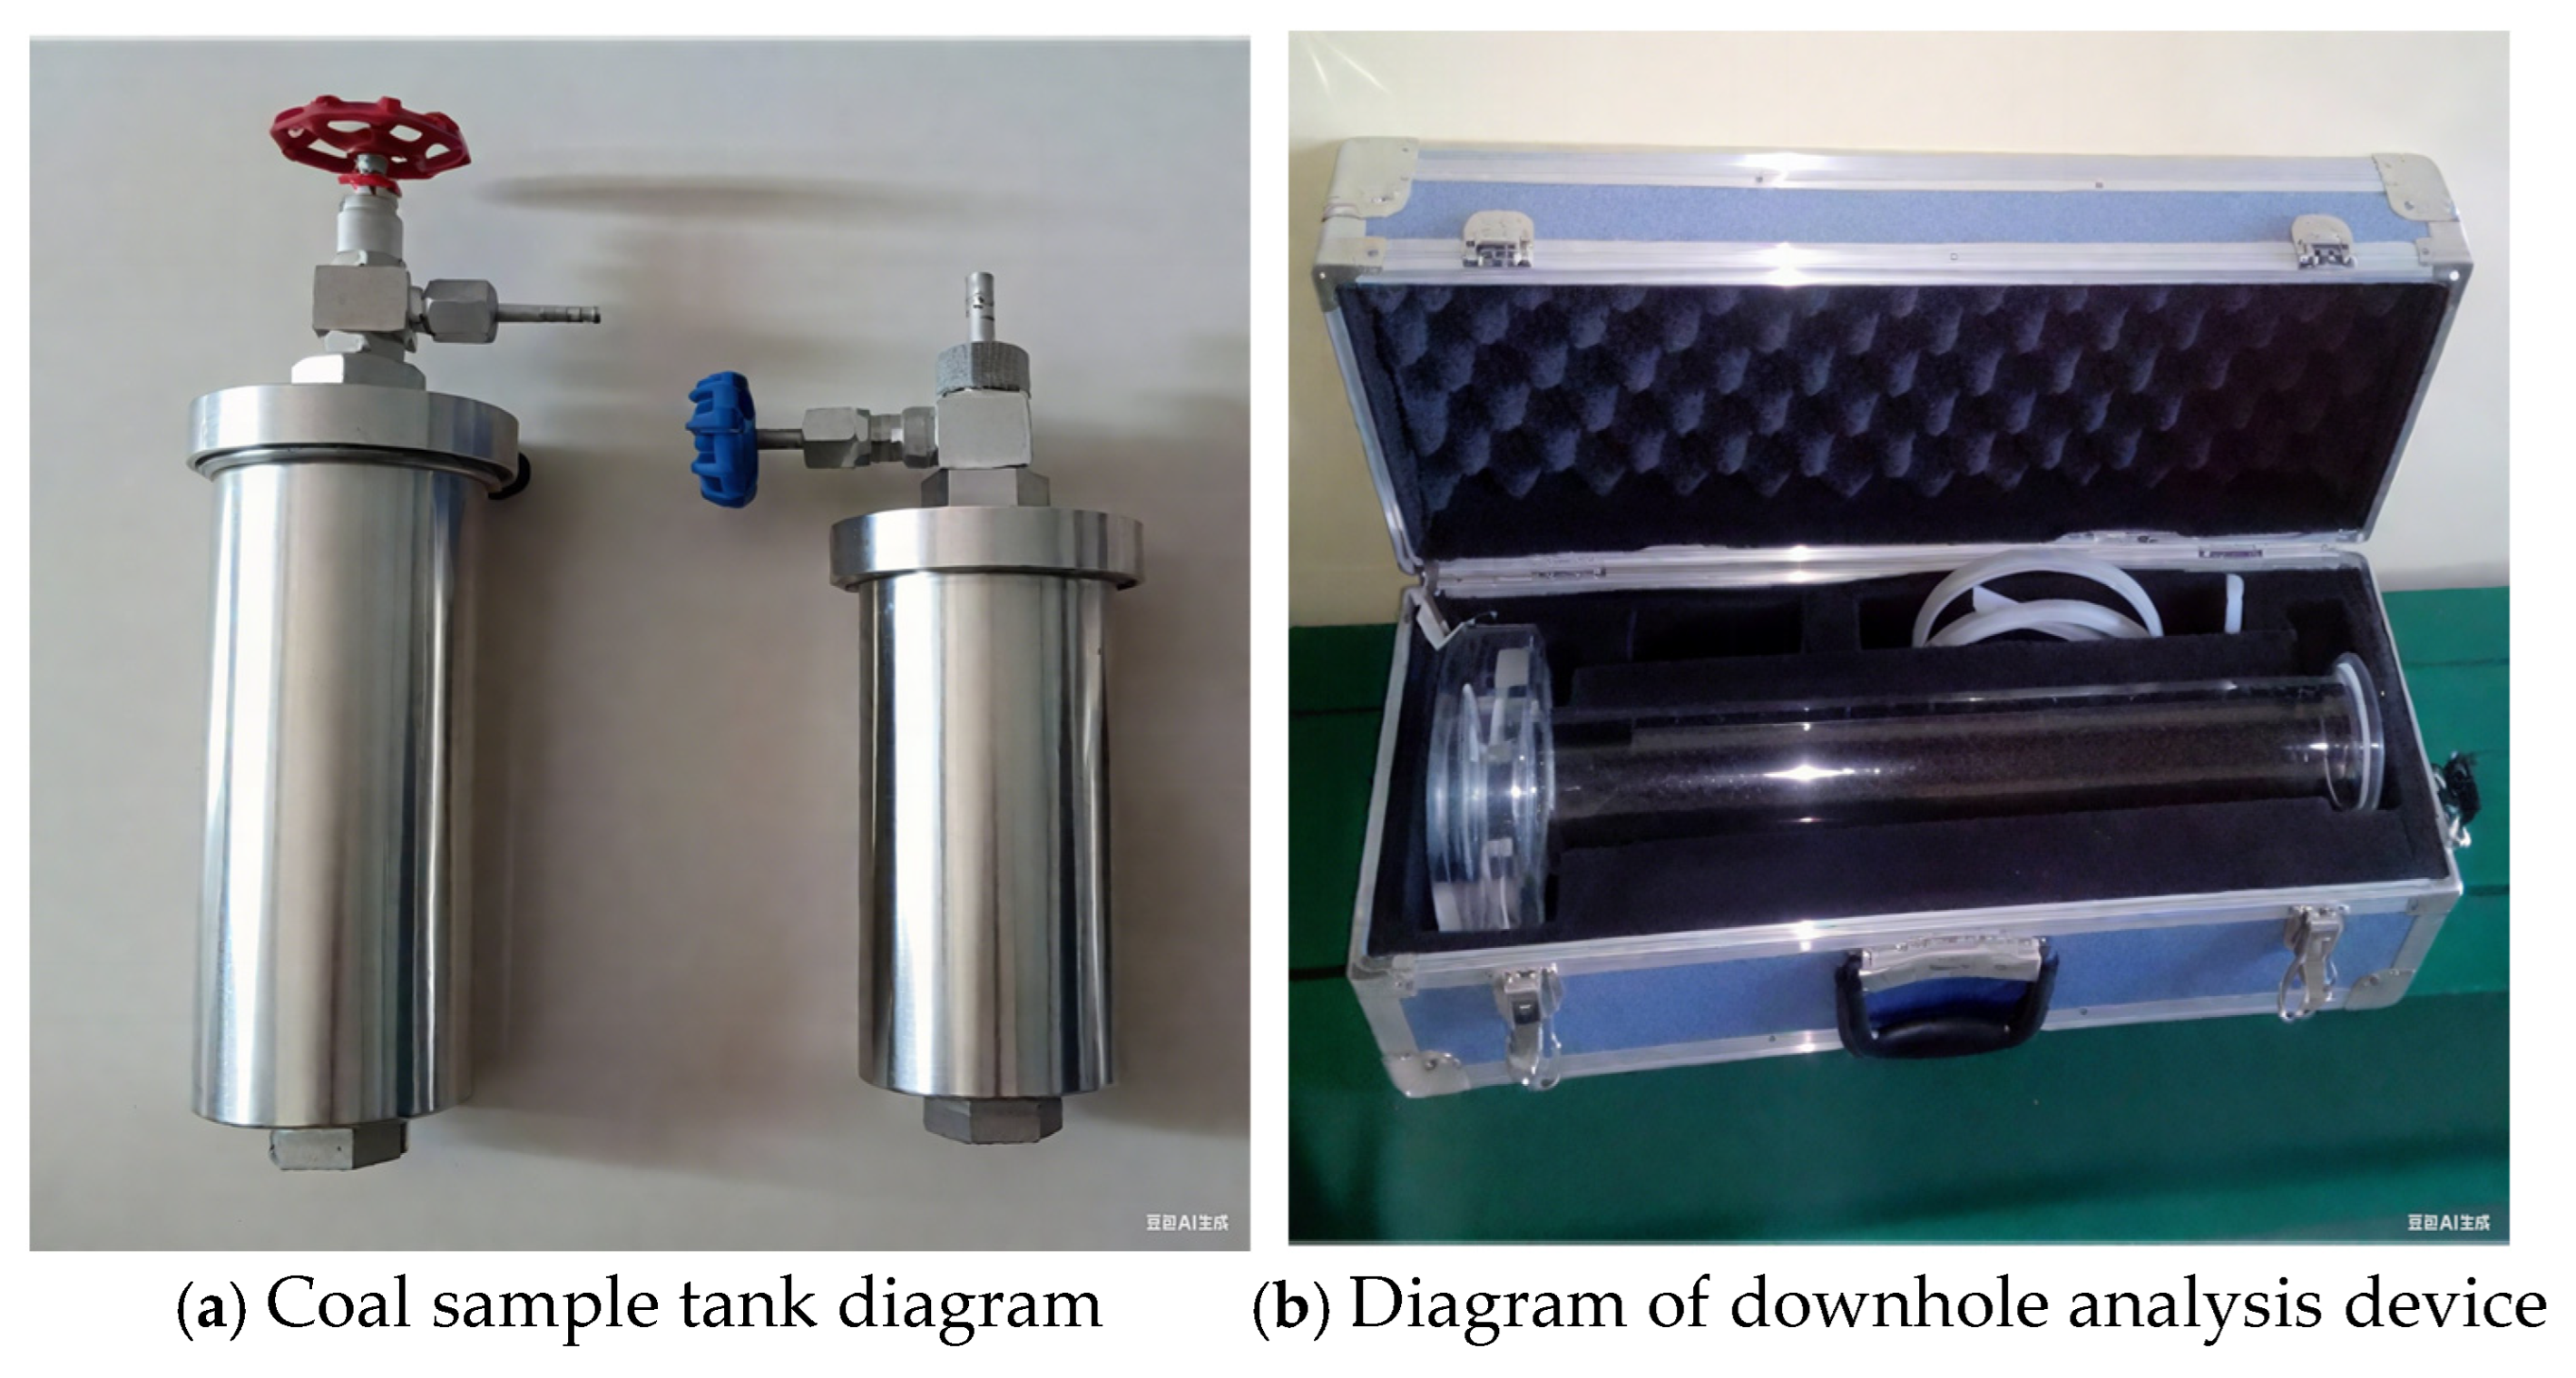
Figure 1. (a) Coal sample tank for collecting coal samples; (b) An instrument for downhole detection of resolution.
Processes 13 02869 g001
Figure 2. Desorption gas collection device.
Processes 13 02869 g002
Figure 3. Gas chromatograph.
Processes 13 02869 g003
Figure 4. Diagram of the crushing unit.
Processes 13 02869 g004
Figure 5. (a) Observation results of CO concentration in the return wind corner of Zhaoxian 2306 fully mechanized mining face in August; (b) Observation results of CO concentration in the return wind corner of Zhaoxian 2306 fully mechanized mining face in September; (c) Observation results of CO concentration in the return wind corner of Zhaoxian 2306 fully mechanized mining face in October.
Processes 13 02869 g005
Figure 6. Observation results of CO concentration in the deep goaf of the return air side of the fully mechanized mining face of Zhaoxian 2306.
Processes 13 02869 g006
Table 1. Table of Zhaoxian Coal Mine 2306 working face mining parameters.
Title Date
Coal mining face2306
Mining methodsFully mechanized mining top coal
Working face length180 m
Air volume of the working face1476 m3/min
Coal mining thickness10.3 m
Advance speed3.2 m/d
Recovery rate93%
Air leakage10 m3/min
Table 2. Table of downhole desorption results.
Time/MinThe Amount of Resolution/cm3
120
210
32
42
52
62
72
82
91
101
111
121
131
141
150
160
Table 3. Coal sample gas occurrence table at 400 m of the return air trough of the 2306 working face of Zhaoxian 3 coal seam.
Serial NumberO2 (%)N2 (%)CO (ppm)CO2 (%)CH4 (%)C2H6 (%)C2H4 (%)C2H2 (%)
115.230377.788690.32916.64560.00550.00000.0000
215.432577.1314110.38947.04090.00470.00000.0000
314.925677.785580.33806.94510.00500.00000.0000
Average15.196177.568590.35226.87720.00510.00000.0000
Table 4. Zhaoxian 3 coal seam 2302 working face excavation head positive coal sample gas occurrence table.
Serial NumberO2 (%)N2 (%)CO (ppm)CO2 (%)CH4 (%)C2H6 (%)C2H4 (%)C2H2 (%)
116.234677.3082100.25726.19520.00380.00000.0000
216.542677.278390.27425.89910.00490.00000.0000
Average16.388677.2933100.26576.04720.00440.00000.0000
Table 5. Composition table of block coal crushing experiment in 2306 working face in Zhaoxian No. 2 mining area.
Serial NumberO2 (%)N2 (%)CO (ppm)CO2 (%)CH4 (%)C2H6 (%)C2H4 (%)C2H2 (%)
N2 No.115.703284.316000.05280.02800.00000.00000.0000
N2 No.213.330086.608300.04140.02040.00000.00000.0000
air No.121.473278.386330.07190.06810.00010.00000.0000
air No.221.824078.120000.04830.00760.00000.00000.0000
Table 6. Gas composition table of coal crushing experiment in Daxiang, Zhaoxian No. 1 mining area.
Serial NumberO2 (%)N2 (%)CO (ppm)CO2 (%)CH4 (%)C2H6 (%)C2H4 (%)C2H2 (%)
N2 No.116.841183.113100.04500.00090.00000.00000.0000
N2 No.215.156284.800000.04340.00030.00000.00000.0000
air No.121.816578.130960.05200.00000.00000.00000.0000
air No.222.495677.453300.05110.00000.00000.00000.0000
Table 7. Comparison table between the predicted calculated value of CO concentration at the return air corner of the working face and the on-site monitoring value.
Title Date
Width of the goaf oxide zone31.35 m
The width of the goaf heat dissipation zone12.4 m
The oxidation correction coefficient of residual coal in the oxidation zone (α)0.3
The correction coefficient of the oxidation of the residual coal in the heat dissipation zone(β)0.5
On-site monitoring value of CO concentration at the corner of the return air6–64 ppm
Calculated value of CO concentration prediction at the corner of the return air corner11–66 ppm
Disclaimer/Publisher’s Note: The statements, opinions and data contained in all publications are solely those of the individual author(s) and contributor(s) and not of MDPI and/or the editor(s). MDPI and/or the editor(s) disclaim responsibility for any injury to people or property resulting from any ideas, methods, instructions or products referred to in the content.