Abstract
To investigate the effect of oxygen concentration on the activation energy of coal oxidation, low-temperature oxidation experiments were carried out on coal samples under controlled oxygen levels (21%, 12%, 10%, 7%, 5%, and 3%) using a programmed-temperature apparatus. The oxygen consumption rates and gas production were measured in relation to temperature, and critical temperatures were identified for each condition, enabling the division of the oxidation process into two distinct stages. Kinetic analyses were conducted for each stage based on the Arrhenius equation derived from the oxygen consumption rate. The apparent activation energy was determined from the slope of the linearized Arrhenius plot. The results demonstrate a strong dependence of activation energy on oxygen concentration, with values increasing from 12.98 kJ·mol−1 at 21% O2 to 25.11 kJ·mol−1 at 3% O2. A marked difference in activation energy was observed across the critical temperature—for instance, under 21% O2, activation energies were 12.98 kJ·mol−1 below and 41.72 kJ·mol−1 above the critical point. Furthermore, a safety threshold of 6% O2 was identified for goaf atmospheres, providing critical guidance for the prevention of coal spontaneous combustion.
1. Introduction
China possesses abundant coal resources and is a major global producer and consumer of coal. The country’s coal production has experienced continuous growth for eight consecutive years, increasing from 3.41 billion tons in 2016 to 4.78 billion tons in 2024 [1]. In 2024, the raw coal production reached 4.759 billion tons, marking a year-on-year growth of 1.3%, with coal consumption accounting for 53.2% of the total energy consumption [2]. However, approximately 90% of China’s coal seams are classified as spontaneous combustion-prone or easily combustible [3], This not only disrupts normal coal production but also poses significant risks to personnel safety and equipment integrity. Consequently, determining the spontaneous combustion propensity of coal is paramount, as it provides crucial guidance for implementing effective prevention and control measures in operational settings.
Researchers have developed diverse methodologies to evaluate the spontaneous combustion tendency of coal [4,5]. Key approaches include the activation energy identification method based on reaction kinetics parameters; static and dynamic oxygen adsorption methods, which measure oxygen consumption under controlled conditions; the crossing-point temperature method, identifying characteristic temperatures at defined heating rates; the basket method, simulating self-heating in coal piles; thermal analysis methods such as thermogravimetry and differential scanning calorimetry analyzing thermal behavior; and the adiabatic oxidation method, tracking temperature rise under adiabatic conditions [6,7,8]. The current standard method in China is the “Chromatographic Oxygen Absorption Identification Method for Spontaneous Combustion Tendency of Coal”. Wang et al. [9] suggested using the activation energy index to classify coal’s spontaneous combustion tendency and discussed its relationship with ignition. Yang et al. [10] used a constant temperature difference method to establish a technique for simultaneously measuring oxygen consumption and heat generation, studying this relationship for four coal types during low-temperature oxidation. Liu Boxiong et al. [11] employed differential scanning calorimetry (DSC) on Chahasu brown coal to investigate the influence of particle size and heating rate on characteristic DSC peak temperatures and critical temperatures, performing quantitative activation energy analysis. Wang et al. [12] conducted a comparative thermogravimetric study on the combustion characteristics of long-flame coal, non-caking coal, gas coal, and anthracite. Results indicated that with increasing metamorphic degree, coal porosity decreases, ignition temperature rises, and combustion activity diminishes. Long-flame coal exhibited the lowest activation energy and strongest spontaneous combustion tendency, providing a theoretical foundation for mine fire prevention. Chen et al. [13] developed a numerical model of coal oxidation to investigate hot-spot migration patterns and reactant evolution during coal spontaneous combustion (CSC). Their findings reveal that in the initial stages of coal self-heating, hot spots primarily form in high-porosity zones. As oxidation intensifies, these hot spots migrate toward the air-inlet side. Variations in coal porosity distribution lead to significant differences in the onset time of thermal runaway. Samples featuring high-porosity regions adjacent to the air inlet prove particularly susceptible to thermal runaway. Wang et al. [14] used NMR to track pore evolution in low-rank coals during heating (25–500 °C). Results show that enhanced NMR signals confirm pore/fracture expansion; mean pore radius rises sharply above 200 °C; permeability jumps beyond 300 °C, indicating boosted fluid transport. Li et al. [15] established a method for simultaneous determination of oxygen consumption and heat production during coal low-temperature oxidation using constant temperature differential thermal analysis. Tests on four coal samples from six mines showed a significant linear positive correlation, confirming oxygen consumption as an effective indicator for evaluating coal spontaneous combustion propensity (CSCP), offering both theoretical and technical support for rapid CSCP identification. Zhu Hongqing et al. [16] explored the kinetic reasons for differences in the spontaneous combustion ease of coals with different metamorphic degrees. They found that the apparent activation energy of the adiabatic process increases logarithmically with coal rank, while the critical temperature increases linearly. Zhang et al. [17] systematically studied CO release during coal spontaneous combustion through non-isothermal experiments. They found that larger particle sizes resulted in longer CO release durations, and continuous oxidation and heat generation occurred even in a 3% oxygen environment. Analysis revealed that activation energy is affected by the synergistic effect of oxidation temperature and coal quality characteristics.
Activation energy refers to the minimum energy required for coal to undergo oxidation reactions. The activation energy derived experimentally is termed apparent activation energy; a lower value indicates greater ease of reaction, and vice versa [18,19]. Research demonstrates that the relationship between temperature and reaction rate during coal-oxygen complex reactions conforms to the Arrhenius equation, and the derived activation energy can characterize coal’s spontaneous combustion propensity [20].
Compared to previous studies, this work focuses specifically on the influence of different oxygen concentrations on activation energy. Experimentally, variations in gas products from the same coal sample under different oxygen concentrations were observed, enabling the calculation of apparent activation energy. This analysis establishes the relationship between oxygen concentration and coal spontaneous combustion propensity, providing scientific evidence for preventing and controlling coal spontaneous combustion in low-oxygen mine environments. Previous studies on the activation energy of coal oxidation have primarily focused on particle size variations (e.g., Reference [21]). This paper investigates the activation energy of coal oxidation based on oxygen concentration characteristics in different zones of goaf areas, aiming to prevent spontaneous combustion of residual coal from an activation energy perspective.
2. Coal Sample Preparation and Experimental Setup
2.1. Coal Sample Preparation
Coal samples were collected from the mining face of the No. 1 coal seam at Gubei Coal Mine. The coal seam in this mine exhibits three defining characteristics: substantial mining depth, elevated geothermal gradients, and low extraction rates. Sampled coal, classified as 1/3 coking coal, demonstrates marked spontaneous combustion liability. Given these specific geo-mining conditions, adiabatic oxidation testing of this coal carries compelling technical and research implications. To avoid pre-oxidation effects, approximately 20 cm of the outer layer was removed prior to sampling. All specimens were immediately sealed in oxygen-impermeable plastic film to prevent oxidation during transport. Core samples were subsequently transferred to the laboratory in ice-packed thermally insulated containers. The samples were crushed in air and sieved into five particle size ranges: 0–0.9 mm, 0.9–3 mm, 3–5 mm, 5–7 mm, and 7–10 mm [21]. Six groups of mixed coal samples (500 g each) were prepared by combining 100 g from each of the five size fractions. Sieved coal samples were vacuum-dried in the laboratory to eliminate internal oxygen interference during subsequent experiments. Temperature-programmed experiments were conducted in a temperature-programmed chamber under different oxygen concentrations (21%, 12%, 10%, 7%, 5%, 3%). Table 1 shows the proximate analysis of the test coal sample, where Aad, Vad, Mad, FCad, and Oad represent ash, volatile matter, moisture, fixed carbon, and oxygen on an air-dried basis, respectively; St denotes total sulfur, and Q is the calorific value (MJ/kg).

Table 1.
Proximate analysis of test coal sample.
2.2. Experimental Apparatus
The experimental setup is shown in Figure 1. A steel pipe (diameter 10 cm, length 20 cm) was filled with 500 g of coal. To ensure uniform gas flow, approximately 2 cm of free space was left at both ends (supported by 100-mesh copper wire mesh). The pipe was then placed in a temperature-controlled heating box using a silicon-controlled rectifier for programmed temperature increase. Gas produced at different coal temperatures was collected. Upon reaching the target temperature, heating was stopped and the temperature was maintained for gas collection. Finally, the composition and concentration of the gas collected at different temperatures were analyzed. The SP-3510 gas chromatograph (Beijing Beifen-Ruili Analytical Instrument Co., Ltd., Beijing, China) was used for analysis. It features parallel detector configurations, such as FID and TCD, to address diverse analytical requirements. Before each analysis run, the instrument was calibrated using standard gases, achieving ppm-level accuracy. Its reliability is further supported by military-standard environmental testing and MTBF (Mean Time Between Failures) certification.
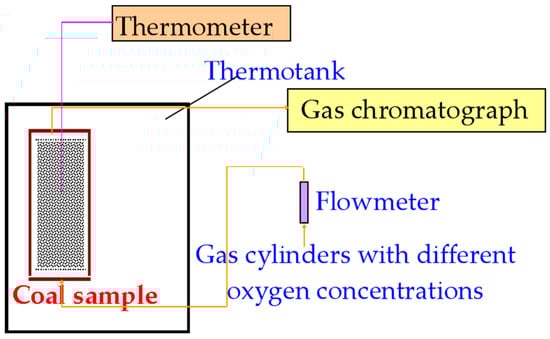
Figure 1.
Schematic diagram of the temperature-programmed experimental setup.
The experimental measurement system comprised three parts: the gas supply system, the temperature control chamber, and the gas sampling/analysis system. (Multiple studies, including Reference [21], have adopted this methodology.) At the start, the coal sample was placed in the reactor vessel, which was then positioned inside the heating chamber and connected to the gas lines. Gas cylinders with different oxygen concentrations were opened, and the flow rate was adjusted to 120 mL/min. Prior to heating initiation for each experiment, gas was purged through the sample for 1 h. Heating commenced at a rate of 0.3 °C/min from 30 °C. Gas composition was analyzed using gas chromatography. Samples were collected and analyzed every 10 °C temperature increase, with a holding time of 0.5 h at each temperature point. The experiment concluded at 320 °C. Gas samples collected at each temperature were analyzed in triplicate, with the average value of gas concentrations being calculated. Heating and gas flow were then stopped. The experimental conditions are summarized in Table 2.
Table 2.
Experimental conditions for coal sample heating in the temperature-programmed chamber.
3. Results and Discussion
3.1. Analysis of Stage Characteristics
3.1.1. Analysis of Carbon Oxides
CO was selected as an indicator gas to distinguish different stages of coal oxidation [22]. The variation in CO concentration with temperature is shown in Figure 2. As shown in Figure 2, CO emission from coal samples showed minimal variation across different oxygen concentrations at ambient temperature. However, significant changes occurred with increasing temperature, becoming notably distinct around 180 °C. The observed pattern indicates that CO emission decreases with decreasing O2 concentration. During heating, all coal samples under varying O2 concentrations exhibited two distinct inflection points in CO production. The first inflection temperature varied with O2 concentration: 60 °C for 21% O2, 70 °C for 12%, 10%, and 7% O2, and 80 °C for 5% and 3% O2. This suggests that lower oxygen concentrations delay the first inflection temperature, which represents the critical temperature of the coal sample [23,24]. Beyond this critical temperature, the CO growth rate significantly exceeded that observed before it. The second inflection occurred around 110 °C, indicating the desiccation temperature of the coal samples, after which the gas growth rate approached an exponential increase.
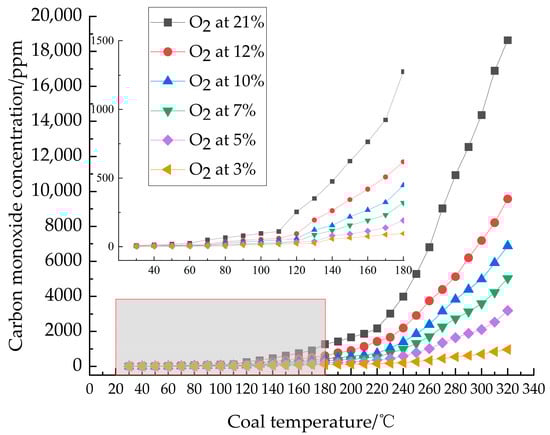
Figure 2.
CO concentration as a function of coal temperature.
During experimental testing, the relationship between CO2 concentration and temperature is illustrated in Figure 3. As observed, CO2 was detected from all six coal samples from Coal Seam No. 1 of Gubei Coal Mine at the initial stage. Overall, CO2 concentration exhibited an exponential increase with rising temperature. Starting from the initial temperature, concentration rose rapidly, showing a particularly abrupt surge above 120. This surge is primarily attributed to the accelerated coal-oxygen complexation reaction.
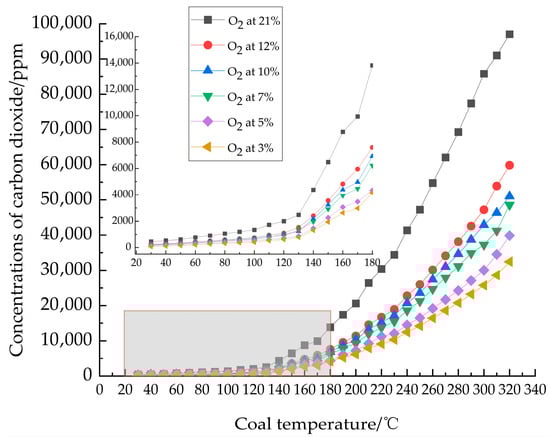
Figure 3.
CO2 concentration as a function of coal temperature.
3.1.2. Analysis of C2H4
C2H4 was selected as an indicator gas for delineating stages in coal low-temperature oxidation [25,26]. As shown in Figure 4, C2H4 production from coal samples increased consistently with rising temperature across all O2 concentrations. At identical temperatures, lower O2 concentrations resulted in reduced gas emissions, with C2H4 release demonstrating a delayed onset. Specifically, C2H4 emerged at 120 °C under O2 concentrations of 21% and 12%, and similarly at 120 °C for 10%, 7%, 5%, and 3%. Below the desiccation temperature (~110 °C), gas growth was relatively gradual, transitioning to an exponential increase beyond this point. This phenomenon can be attributed to the inhibitory effect of low oxygen concentrations on radical chain reactions, reducing the oxidative cleavage of ethylene precursors (aliphatic side chains), consequently yielding lower ethylene compared to normal oxygen conditions. Additionally, the overall reaction rate decreases under low oxygen, necessitating higher temperatures for ethylene accumulation to reach detectable levels.
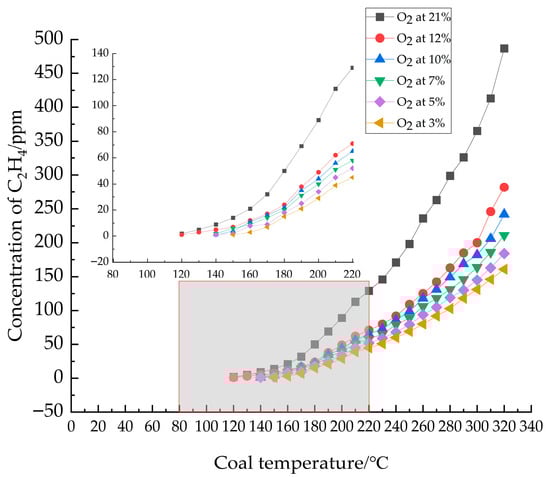
Figure 4.
Graph of the relationship between C2H4 concentration and coal temperature.
3.1.3. Analysis of C2H2
A small amount of C2H2 gas was produced starting at 230 °C in the experiment, as shown in Figure 5.
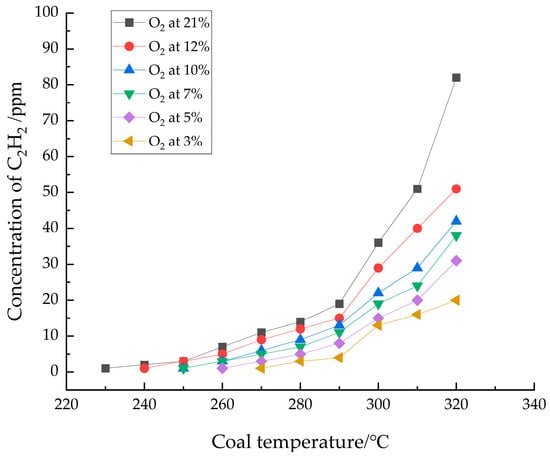
Figure 5.
Graph of the relationship between C2H2 concentration and coal temperature.
Figure 5 indicates that the original coal sample from the No. 1 coal seam of Gubei Coal Mine did not contain C2H2 gas. The C2H2 produced in the high-temperature stage resulted from thermal cracking of the coal sample and is related to its cracking temperature. C2H2 is typically regarded as a marker gas for the intense oxidation stage of coal spontaneous combustion. As the O2 concentration decreased, the C2H2 produced by the coal sample also decreased, and its appearance temperature increased. The onset temperatures for C2H2 detection were 230 °C, 240 °C, 250 °C, 250 °C, 260 °C, and 270 °C under oxygen concentrations of 21%, 12%, 10%, 7%, 5%, and 3%, respectively. The appearance of C2H2 indicates that the coal had entered the intense oxidation stage of spontaneous combustion.
3.1.4. Oxygen Consumption Rate Analysis
The gas sources used were cylinders with oxygen concentrations of 21%, 12%, 10%, 7%, 5%, and 3%. The outlet oxygen concentration was measured by gas chromatography, enabling calculation of the coal sample’s oxygen consumption rate and its variation with temperature.
The oxygen consumption rate of the coal sample in the container [27,28]:
In the equation:
represents the oxygen concentration in the inlet gas (mol/mL), with values: 9.375 × 10⁻⁶ (21%), 5.354 × 10⁻⁶ (12%), 4.461 × 10⁻⁶ (10%), 3.123 × 10⁻⁶ (7%), 2.231 × 10⁻⁶ (5%), 1.338 × 10⁻⁶ (3%).
Q denotes the gas flow rate (mL/s).
S represents the cross-sectional area of the test tube (cm2).
L denotes the height of the coal sample (cm).
and represent the oxygen concentrations at the inlet and outlet of the coal sample ( = ).
is the volume of the test coal sample (cm3).
According to Equation (1), the variation curves of oxygen consumption rate with temperature under different oxygen concentrations can be obtained, as shown in Figure 6.
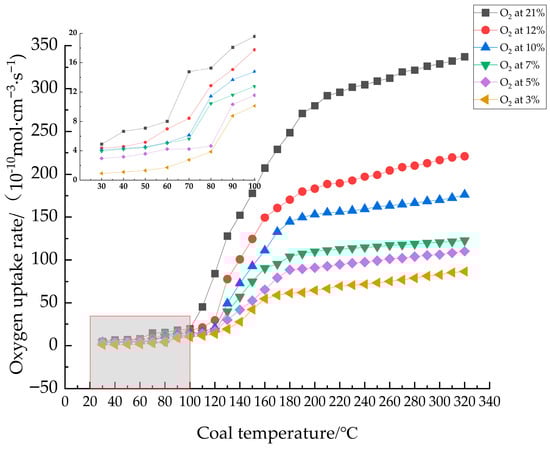
Figure 6.
Oxygen consumption rate versus temperature for coal samples under different oxygen concentrations.
As shown in Figure 6, the oxygen consumption rate of coal samples from the same seam consistently increased with rising temperature across all O2 concentrations. At identical temperatures, the oxygen consumption rate increased proportionally with increasing O2 concentration. Significant rate transitions were observed: at 60 °C for 21% O2, at 70 °C for 12%, 10%, and 7% O2, and at 80 °C for 5% and 3% O2. A secondary transition occurred around 180 °C, where the previously near-exponential growth rate transitioned to a more gradual increase. This is attributed to the limited O2 concentration in the gas supply becoming insufficient to sustain the oxygen demand for high-temperature coal oxidation. Consequently, as the available oxygen within the coal sample vicinity diminished, the oxygen consumption rate progressively decreased.
Figure 6 allows for the identification of critical transition points in coal samples under different oxygen concentrations. Through fitting the six oxygen consumption rate transition points, the critical temperatures were determined as 75 °C and 85 °C at oxygen concentrations of 7% and 3%, respectively, consistent with experimental observations. Further slope analysis of the fitted curve indicates that a pronounced transition in oxygen consumption rate occurs at around 6% oxygen concentration, even without a significant increase in temperature. As shown in Figure 7, this concentration represents the critical threshold. Thus, in practical mining applications, 6% oxygen concentration should be regarded as a safety benchmark. When the oxygen level in the goaf exceeds this value, proactive measures must be taken to prevent spontaneous combustion of coal.
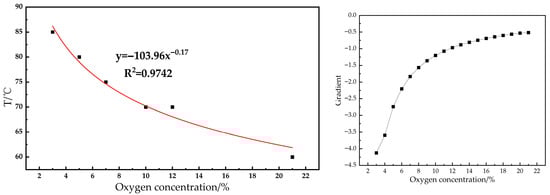
Figure 7.
Oxygen uptake rate breakpoint fitting curve.
3.2. Activation Energy Calculation
During coal spontaneous combustion, chemical adsorption and oxidation reactions occur between the coal surface and oxygen molecules, releasing substantial amounts of gas and heat [29].
Coal + O2 → mCO + gCO2 + other products
Here, m and g represent the moles (or volume fractions) of CO and CO2 produced, respectively. Based on reaction rate theory and the Arrhenius equation [30], assuming a first-order reaction rate dependence on oxygen concentration, the following formula can be derived:
The equation is as follows:
represents the actual oxygen consumption rate per unit volume (mol/(cm3·s)).
A is the pre-exponential factor.
E is the apparent activation energy (J/mol).
R is the molar gas constant (8.314 J/(mol·K)).
n is the reaction order (taken as n = 1 in this study).
is the oxygen concentration within the reacting coal (mol/cm3).
T is the absolute temperature (K).
By integrating Equation (1) with Equation (2), the calculation formula for oxygen consumption rate and activation energy can be derived.
Taking the natural logarithm of both sides yields:
Rearranging gives:
As indicated by Equation (5), in a Cartesian coordinate system with ln(/) as the ordinate and 1/T as the abscissa, the substitution of data yields a linear fit. The activation energy can be calculated from the slope of this linear regression. By substituting the oxygen consumption rates of the coal sample at various O2 concentrations into Equation (5), the apparent activation energy of the coal sample can be determined. Given the significant difference in apparent activation energy before and after the critical temperature, the Arrhenius curves were separately fitted for these two temperature ranges, as illustrated in Figure 8.
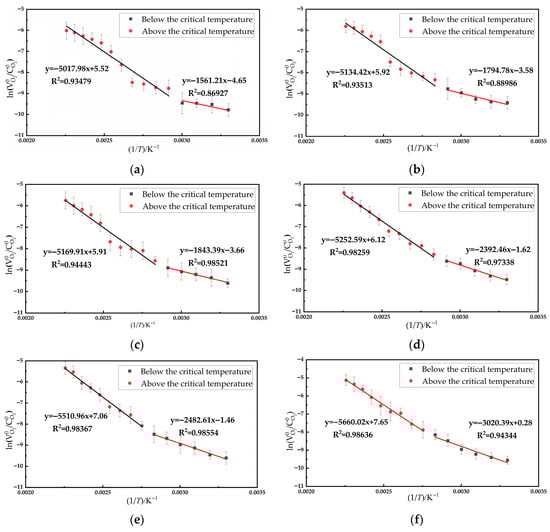
Figure 8.
The relationship curves between ln(
/) and 1/T of coal samples at different O2 concentrations (a) Oxygen concentration: 21%; (b) Oxygen concentration: 12%; (c) Oxygen concentration: 10%; (d) Oxygen concentration: 7%; (e) Oxygen concentration: 5%; (f) Oxygen concentration: 3%.
Based on the linear regression of the plots in Figure 8, the activation energies corresponding to the stages below and above the critical temperature for different oxygen concentrations are summarized in Table 3.
Table 3.
Activation energy of coal samples under varying oxygen concentrations.
In Table 3, E1 represents the apparent activation energy below the critical temperature, and E2 represents the apparent activation energy above it. As the O2 concentration decreases, E1 generally increases. This occurs because lower O2 concentration reduces the probability of contact between coal active sites and oxygen molecules, making the reaction more difficult to initiate. Conversely, higher O2 concentrations increase contact probability, generating more heat and accelerating the reaction.
Above the critical temperature, E2 also increases with decreasing oxygen concentration. This is attributed to the accelerated breakdown of coal’s macromolecular structure above the critical point, generating numerous active groups. However, lower oxygen concentrations reduce the probability of these groups encountering oxygen, hindering reaction. E2 is significantly higher than E1 primarily because reactions below the critical temperature consume substantial quantities of less stable active functional groups. Above the critical temperature, oxygen must react with more stable functional groups, making the process considerably more challenging [31,32].
4. Conclusions
- (1)
- Analysis of indicator gas release patterns revealed that CO and C2H4 release trends largely paralleled the increase in oxygen consumption rate, both escalating with temperature. Critical temperatures for coal samples under varying oxygen concentrations were determined: 60 °C at 21% O2, 70 °C at 12%, 10%, and 7% O2, and 80 °C at 5% and 3% O2. These critical temperatures served as the basis for delineating changes in activation energy.
- (2)
- Following the phase division, the kinetic analysis demonstrates a high degree of equation fitting, which effectively reflects the relationship between ln( /) and 1/T. Below the critical temperature, the coal samples exhibit an increase in activation energy with decreasing O2 concentration. Above the critical temperature, the coal samples also show an increase in activation energy with decreasing O2 concentration.
- (3)
- A significant disparity in activation energy of coal samples is observed across the critical temperature threshold, with the low-temperature phase consistently exhibiting lower activation energy than the high-temperature phase. In practical mining operations, preventive measures must be promptly implemented when oxygen concentration in goaf areas exceeds 6% to mitigate the risk of spontaneous coal combustion.
Author Contributions
Conceptualization, W.L.; Methodology, J.H.; Formal analysis, X.C. and Y.L.; Investigation, C.Q.; Data curation, L.Z. and C.L.; Writing—original draft, W.L. and J.H.; Writing—review & editing, W.L., J.H. and X.C. All authors have read and agreed to the published version of the manuscript.
Funding
This research received no external funding.
Data Availability Statement
The original contributions presented in this study are included in the article. Further inquiries can be directed to the corresponding author.
Conflicts of Interest
The authors declare no conflict of interest.
References
- Sun, B.D.; Teng, X.Y.; Zhang, F.; Pan, Y.; Men, D.P.; Han, Y.J. Analysis and projections on China’s energy landscape in 2025 and the timing of peak coal consumption. China Coal 2025, 51, 33–41. [Google Scholar] [CrossRef]
- China Coal Research Institute (CCRI); Song, M. The Research Group on the Coal Industry Prosperity Index of China Minmetals (Beijing). Research report on the economic situation of China’s coal industry from 2024 to 2025. China Coal 2025, 51, 1–12. [Google Scholar] [CrossRef]
- Deng, J.; Li, X.; Wang, K.; Wang, W.F.; Yan, J.; Tang, Z.Q.; Kang, F.R.; Ren, S.J. Research progress and prospect of mine fire intelligent monitoring and early warning technology in recent 20 years. Coal Sci. Technol. 2024, 52, 154–177. [Google Scholar] [CrossRef]
- Moni, V.; Klouda, P.; Blata, J.; Helebrant, F. The application for a prediction of the coal spontaneous ignition-PREDISAM. Manag. Syst. Prod. Eng. 2017, 25, 81–87. [Google Scholar] [CrossRef]
- Qin, B.T.; Zhong, X.X.; Wang, D.M.; Xin, H.H.; Shi, Q.L. Research progress of coal spontaneous combustion process characteristics and prevention technology. Coal Sci. Technol. 2021, 49, 66–99. [Google Scholar] [CrossRef]
- Huang, G.; Zhang, Y.; Dai, F.; Zhang, X. Research on the Intrinsic correlation mechanism between stage oxidation characteristics and spontaneous combustion tendency of coals with different metamorphic degrees. Chem. Eng. Sci. 2025, 314, 121800. [Google Scholar] [CrossRef]
- Vikram, M.; Bhattacharjee, R.; Paul, P. Determination of spontaneous combustion propensity and ignition time of Indian coal using adiabatic oxidation method. Fuel 2025, 388, 134569. [Google Scholar] [CrossRef]
- Stuhlman, S.; Kumar, K. Activation energies and evolved gas analysis for Argonne premium coals. Int. J. Coal Prep. Util. 2024, 44, 51–66. [Google Scholar] [CrossRef]
- Wang, D.M.; Xin, H.H.; Qi, X.Y.; Dou, G.L.; Qi, G.S.; Ma, L.Y. Reaction pathway of coal oxidation at low temperatures: A model of cyclic chain reactions and kinetic characteristics. Combust. Flame 2016, 163, 447–460. [Google Scholar] [CrossRef]
- Yang, Y.; Niu, H.; Wang, H.; Wang, G.; Bu, Y.; Liu, Y.; Zhou, C.; Sun, L. Study on the effect of the liquid nitrogen freeze-thaw cycle on the coal spontaneous combustion propensity. Appl. Therm. Eng. 2025, 264, 125386. [Google Scholar] [CrossRef]
- Liu, B.X.; Ma, S.Q.; Zhang, C.; Zhu, J.F. Study on the influence of particle size and heating rate on characteristic temperature and activation energy of coal oxidation. Saf. Coal Min. 2023, 54, 77–83. [Google Scholar] [CrossRef]
- Wang, Q.; Lu, X.; Ma, C.; Luo, Z.; Li, Q.; Deng, J.; Sheng, Y.; Peng, B. Comparative study of the kinetic characteristics of coal spontaneous combustion. J. Therm. Anal. Calorim. 2023, 148, 4463–4476. [Google Scholar] [CrossRef]
- Chen, X.; Shi, X.; Zhang, Y.; Zhang, Y.; Ma, Q. Numerical Simulation Study on Coal Spontaneous Combustion: Effect of Porosity Distribution. Combust. Sci. Technol. 2023, 195, 472–493. [Google Scholar]
- Wang, H.; Li, J.; Dong, Z.; Fan, C.; Zhang, Y.; Chen, X. Effect of thermal damage on the pore–fracture system during coal spontaneous combustion. Fuel 2023, 339, 127439. [Google Scholar] [CrossRef]
- Li, J.L.; Xu, Z.; Zhao, Z.; Xu, S. Study on coal’s spontaneous combustion propensity based on the correlation between oxygen consumption and heat generation. Combust. Sci. Technol. 2023, 195, 2258–2273. [Google Scholar] [CrossRef]
- Zhu, G.Q.; Wang, H.Y.; Song, Z.Y.; He, C.N. The relationship between oxidation kinetics characteristic parameters of coal adiabatic progress and metamorphic degree. J. China Coal Soc. 2014, 39, 498–503. [Google Scholar] [CrossRef]
- Zhang, Y.; Shi, X.; Li, Y.; Liu, Y. Characteristics of carbon monoxide production and oxidation kinetics during the decaying process of coal spontaneous combustion. Can. J. Chem. Eng. 2018, 96, 1752–1761. [Google Scholar] [CrossRef]
- Chen, X.; Ma, T.; Zhai, X.; Lei, C. Thermogravimetric and infrared spectroscopic study of bituminous coal spontaneous combustion to analyze combustion reaction kinetics. Thermochim. Acta 2019, 676, 84–93. [Google Scholar] [CrossRef]
- Zhang, X.; Bai, Y.; Li, Q.; Ma, T. Research on spontaneous combustion tendency of bituminous coals in different metamorphic grades based on activation energy index. Min. Safety Environ. Prot. 2016, 43, 5–7. Available online: http://www.cnki.net/kcms/detail/50.1062.TD.20160202.1905.004.html (accessed on 5 September 2025). [CrossRef]
- Fetisova, O.Y.; Kuznetsov, P.; Purevsuren, B.; Avid, B. A kinetic study of the stepwise thermal decomposition of various coals from Mongolia. Solid. Fuel Chem. 2021, 55, 1–7. [Google Scholar] [CrossRef]
- Deng, J.; Zhang, Y.X.; Zhao, J.Y.; Song, J.J.; Zhang, Y.N. Experiment study on oxidation and activated energy of different partical size coal based on programmed temperature rising. Coal Sci. Technol. 2019, 47, 214–219. [Google Scholar] [CrossRef]
- Song, Y. Characteristics of generating carbon oxides at low-temperature oxidation stages of low-rank coal. Shock. Vib. 2022, 2022, 9380297. [Google Scholar] [CrossRef]
- Qu, L. A study on the prediction method of coal spontaneous combustion development period based on critical temperature. Environ. Sci. Pollut. Res. 2018, 25, 35748–35760. [Google Scholar] [CrossRef] [PubMed]
- Qu, L.; Song, D.; Tan, B. Research on the critical temperature and stage characteristics for the spontaneous combustion of different metamorphic degrees of coal. Int. J. Coal Prep. Util. 2018, 38, 221–236. [Google Scholar] [CrossRef]
- Yan, H.; Nie, B.; Liu, P.; Chen, Z.; Yin, F.; Gong, J.; Lin, S.; Wang, X.; Kong, F.; Hou, Y. Experimental assessment of multi-parameter index gas correlation and prediction system for coal spontaneous combustion. Combust. Flame 2023, 247, 112485. [Google Scholar] [CrossRef]
- Deng, J.; Liu, L.; Lei, C.; Wang, C.; Xiao, Y. Spatiotemporal distributions of the temperature and index gases during the dynamic evolution of coal spontaneous combustion. Combust. Sci. Technol. 2021, 193, 1679–1695. [Google Scholar] [CrossRef]
- Wang, J.; Zhang, Y.; Xue, S.; Wu, J.; Tang, Y.; Chang, L. Assessment of spontaneous combustion status of coal based on relationships between oxygen consumption and gaseous product emissions. Fuel Process. Technol. 2018, 179, 60–71. [Google Scholar] [CrossRef]
- Qin, Y.; Chu, C.; Yan, L.; Xu, Y.; Guo, W.; Fan, Q.; He, J.; Li, F. Verification of the oxygen consumption rate of the remaining coal in the gob by research and experiment. Energy Sources Part A 2024, 46, 773–788. [Google Scholar] [CrossRef]
- Jia, X.; Wu, J.; Lian, C.; Rao, J. Assessment of coal spontaneous combustion index gas under different oxygen concentration environment: An experimental study. Environ. Sci. Pollut. Res. 2022, 29, 87257–87267. [Google Scholar] [CrossRef]
- Su, H.; Ji, H.; Chen, X. Model simplification of coal combustion kinetics: A case study of Weihuliang coal in Urumchi, China. Combust. Theor. Model. 2019, 23, 1071–1089. [Google Scholar] [CrossRef]
- Arisoy, A.; Beamish, B. Reaction kinetics of coal oxidation at low temperatures. Fuel 2015, 159, 412–417. [Google Scholar] [CrossRef]
- Deng, J.; Li, Q.; Xiao, Y.; Wen, H. The effect of oxygen concentration on the non-isothermal combustion of coal. Thermochim. Acta 2017, 653, 106–115. [Google Scholar] [CrossRef]
Disclaimer/Publisher’s Note: The statements, opinions and data contained in all publications are solely those of the individual author(s) and contributor(s) and not of MDPI and/or the editor(s). MDPI and/or the editor(s) disclaim responsibility for any injury to people or property resulting from any ideas, methods, instructions or products referred to in the content. |
© 2025 by the authors. Licensee MDPI, Basel, Switzerland. This article is an open access article distributed under the terms and conditions of the Creative Commons Attribution (CC BY) license (https://creativecommons.org/licenses/by/4.0/).