Article

Applying Cleaner Production Methodology and the Analytical Hierarchical Process to Enhance the Environmental Performance of the NOP Fertilizer System

by
Abbas Al-Refaie
1 and
Natalija Lepkova
2,*
1
Department of Industrial Engineering, University of Jordan, Amman 11942, Jordan
2
Department of Construction Management and Real Estate, Vilnius Gediminas Technical University (VILNIUSTECH), LT-10223 Vilnius, Lithuania
*
Author to whom correspondence should be addressed.
Processes 2025, 13(9), 2815; https://doi.org/10.3390/pr13092815
Submission received: 13 June 2025 / Revised: 21 August 2025 / Accepted: 30 August 2025 / Published: 2 September 2025

Abstract

This research considers the production of Potassium Nitrate product, a water-soluble nitrogen–potassium (NK) fertilizer containing 13.7% nitrogen and 46% potassium oxide. Potassium Nitrate (NOP) is produced as a fertilizer grade. The current system incurred high energy consumption, elevated emissions of greenhouse gases, resource degradation, and excessive production costs. Consequently, this research aims to implement the four steps of Cleaner Production (CP) to assess the environmental impacts of Potassium Nitrate products and their main manufacturing processes, and identify the best solution that achieves environmental goals. Environmental assessment was then used to calculate the unit indicators for raw materials, energy, waste generation, product, and packaging. The results showed that the integrated indicator was 5.18, with the energy profile being the most influential factor. Solar thermal and photovoltaic (PV) cell systems were suggested to reduce the high consumption of heavy fuel oil (HFO), including a solar thermal system to support the steam boilers and photovoltaic cells to support the electrical generator. The two alternatives were assessed based on multiple criteria using feasibility analysis and the Analytical Hierarchical Process (AHP). The solar thermal system, comprising 250 evacuated tube collectors, was preferable and resulted in savings of HFO by 121 tons/year, which led to a reduction in gaseous emissions by 375.6 metric tons of CO2 and 21.685 kg of N2O per year. Such improvements can also result in significant cost reductions. In conclusion, applying the CP methodology supported decision-makers in deciding the best system to enhance energy efficiency and reduce environmental nuisance at NOP plants.

1. Introduction

Potassium nitrate (NOP) is a water-soluble fertilizer containing 13.7% nitrate nitrogen and 46% potassium oxide. NOP offers additional benefits, including high purity, low salt indicator, high solubility, and low chlorine level. Therefore, NOP has been widely used in various applications, including glass manufacturing, pharmaceuticals, metal treatment, the food industry, and power plants. Further, NOP as a fertilizer grade passes through production stages, including Nitric Acid production, digestion of phosphate rock, ion exchange, fluoride removal, and NOP production.
Increasing awareness of environmental problems caused by technological processes has urged manufacturers to reduce the adverse environmental impacts of manufacturing processes and products. To face this challenge, a valuation of the environmental impacts of technical processes is needed, followed by appropriate and effective decisions and actions to mitigate negative environmental impacts.
Cleaner production (CP) is the continuous application of an integrated preventive environmental strategy to processes, products, and services to increase eco-efficiency and to reduce risks to humans, resources, and the environment [1]. CP seeks to integrate the continuous utilization of deterrent environmental approaches to processes, products, and services, aiming to enhance efficiency, minimize negative environmental impacts, and achieve sustainable development goals [1]. CP practices collaborate in preserving raw materials and power, assure reduction or elimination of toxic materials, and minimize the toxicity of emissions and residues during the production processes [2]. Several studies implemented CP to achieve the environmental goals of the manufacturing processes [3].
In this regard, this research proposes a framework for CP adoption to enhance the environmental performance of the NOP production line and provides practical solutions to enhance the eco-efficiency of the NOP products. The results are valuable to decision-makers in this industry and direct them on how to benefit from CP practices to increase material and energy utilization and reduce harmful environmental impacts in the NOP products and production processes. The remainder of this research is outlined in the following sequence. Section 2 reviews the relevant studies and applications of CP in previous literature. Section 3 presents the research methodology. Section 4 applies the CP framework to the NOP production line and discusses the research results. Section 5 summarizes the research conclusions and recommendations.

2. Literature Review

2.1. Relevant Studies on CP

CP practices have gained wide implementation in various business applications [4]. For example, Reddick et al. [5] conducted CP for the coal mining and processing industry in South Africa and highlighted the potential for CP to significantly reduce the environmental impacts. Ozturk et al. [6] performed a CP assessment/eco-efficiency analysis in a cotton/polyester fabric finishing–dyeing textile mill, located in Denizli, Turkey. Data were collected for material flow and energy consumption in all processes. Mass-energy balances and specific input and output values based on the production processes were then estimated. The best available techniques options, such as good management practices, water and energy consumption optimization-minimization techniques, chemical consumption optimization, and substitution, were identified using Statistical Multi-criteria Decision-Making Methods, technical and environmental performances, and potential benefits and savings. Huang et al. [7] applied CP in a typical medium-scale ceramic tile plant. After the analysis of material balance and energy efficiency in key auditing procedures, 31 different measures, including facility replacement, technology improvement, process control, raw material and waste reutilization, plant management, and worker training, were proposed and implemented. Results showed obvious progress in energy conservation and emission reduction in the plants. Jia et al. [8] developed an efficient CP assessment indicator framework using a fuzzy AHP model. The assessment methodology was verified and applied to the industry of vanadium extraction from stone coal. Bai et al. [9] proposed a CP methodology to quantitatively evaluate the effectiveness of CP in the stone processing industry in Shandong Province. A three-level framework was structured with 6 indicators and 24 sub-indicators for the characteristics of stone production. The weights of each indicator were calculated using AHP and fuzzy membership degree analysis. Ramos et al. [10] proposed the Lean Cleaner Production Benchmarking (LCPB) method to evaluate the practices and culture relevant to CP application. The method covered management aspects of people, information, products, suppliers and customers, and management and processes, as well as lean management practices, and was applied to 16 Brazilian manufacturing firms. Hou et al. [11] applied CP assessment using the Delphi method, AHP, and fuzzy comprehensive evaluation method to sea cucumber aquaculture in Dalian, China. Two case studies were selected for illustration. de Oliveira Neto et al. [12] examined CP application in Brazilian textile industries through an extensive review of the literature, complemented by the proposal of a theoretical framework. Two case studies were provided to confirm the proposed framework. Van Fan et al. [13] adopted optimization and process design tools, including pinch analysis, process graph, artificial intelligence, and computer-aided modelling in CP. The contributions of waste streams and the circular economy were also examined. De Oliveira Santos et al. [14] provided an approach for CP application combined with quality management principles in four firms: mass services, professional services, a services factory, and a services shop. The study concluded that adoption of CP requires behavioral change, including all actors involved in the process working towards an efficient and sustainable performance with respect to the resources available in nature. de Oliveira Neto et al. [15] evaluated the eco-efficiency of a textile industry that applied CP practices for water reuse, and the minimization of the usage of water and materials aligned with the blue economy principles. The study recommended the elimination of pollutants in the effluents disposed of in rivers, lakes, and the sea. Yang et al. [16] examined the environmental impacts of mining-associated carbon emissions in the Pingshuo mining area in Shanxi Province. CP strategies were analyzed to identify carbon emission sources in opencast mines, including fuel and explosive use, coal mine methane escape, coal and gangue spontaneous combustion, and electricity consumption. Population, GDP, and coal output were the factors influencing carbon emissions. Ma et al. [17] used a data-driven CP strategy for product lifecycle management for energy-intensive manufacturing firms. Two case studies from Southern and Northern China were presented to demonstrate the CP strategy. Zhang et al. [18] developed a comprehensive performance evaluation system to effectively supervise the adoption effects of the CP management system in a steel industry in China. A multi-level indicator system integrating the CP management requirements and sustainable development needs was established. The quantification of performance was obtained by combining AHP and the grey relational degree operation. The application of the CP management mode contributed to sustainable green development.

2.2. Relevant Studies on Fertilizers

Madanhire et al. [19] examined processes involved in the manufacturing of agricultural fertilizers and highlighted the opportunities available to apply CP technology to improve input resource efficiency, reduce waste generated, and minimize resultant pollution in the plant. Kliopova et al. [20] evaluated the possibilities of increasing resource efficiency and reducing energy intensity using alternative resources in nitrogen fertilizer production. The methods of CP, industrial ecology, material flow analysis, environmental impact assessment, and evaluation of environmental efficiency were integrated into the methodology. Several alternatives for resource efficiency and energy saving were suggested. Finally, feasibility analysis was conducted in three case studies to which pollution prevention methods were applied jointly with industrial symbiosis. Zhang et al. [21] assessed the nitrous oxide emission from the intensively fertilized bamboo plantations and developed an approach for advancing the site-specific emission factors considering the influences of climate and soil conditions. The biogeochemical model DeNitrification–DeComposition was validated to estimate nitrous oxide emission under four typical fertilizer management scenarios. Simulation results indicated that the tested fertilizer management practices have a great ability to reduce nitrous oxide emissions, whereas the mitigation effect of each adaptation depends on the site-specific conditions. Cánovas et al. [22] examined the potential recovery of metals in wastes generated by a fertilizer industry in Spain, estimated the available metal reserves, and discussed the technological and economic pros and cons of such source of raw materials. Zhang et al. [23] applied a bottom-up approach coupled with national and regional statistical data to evaluate the environmental impacts of diammonium phosphate and monoammonium phosphate fertilizer production in China. Results showed that the total environmental burden incurred by both types was mainly generated from climate change, terrestrial acidification, human toxicity, particulate matter formation, and marine ecotoxicity categories. Chen et al. [24] proposed a combination of improved energy analysis methods and an economic evaluation to assess compound fertilizer production. The adverse effects of pollution emissions were then quantified for a case study conducted on a compound fertilizer enterprise in the Jiangxi Province of China.
This research contributes to ongoing research on NOP production by developing a comprehensive methodology for environmental assessment of NOP products and production processes using CP practices. In addition, this research utilizes AHP to evaluate multi-criteria for selecting the best improvement alternative that achieves environmental goals.

3. CP Methodology

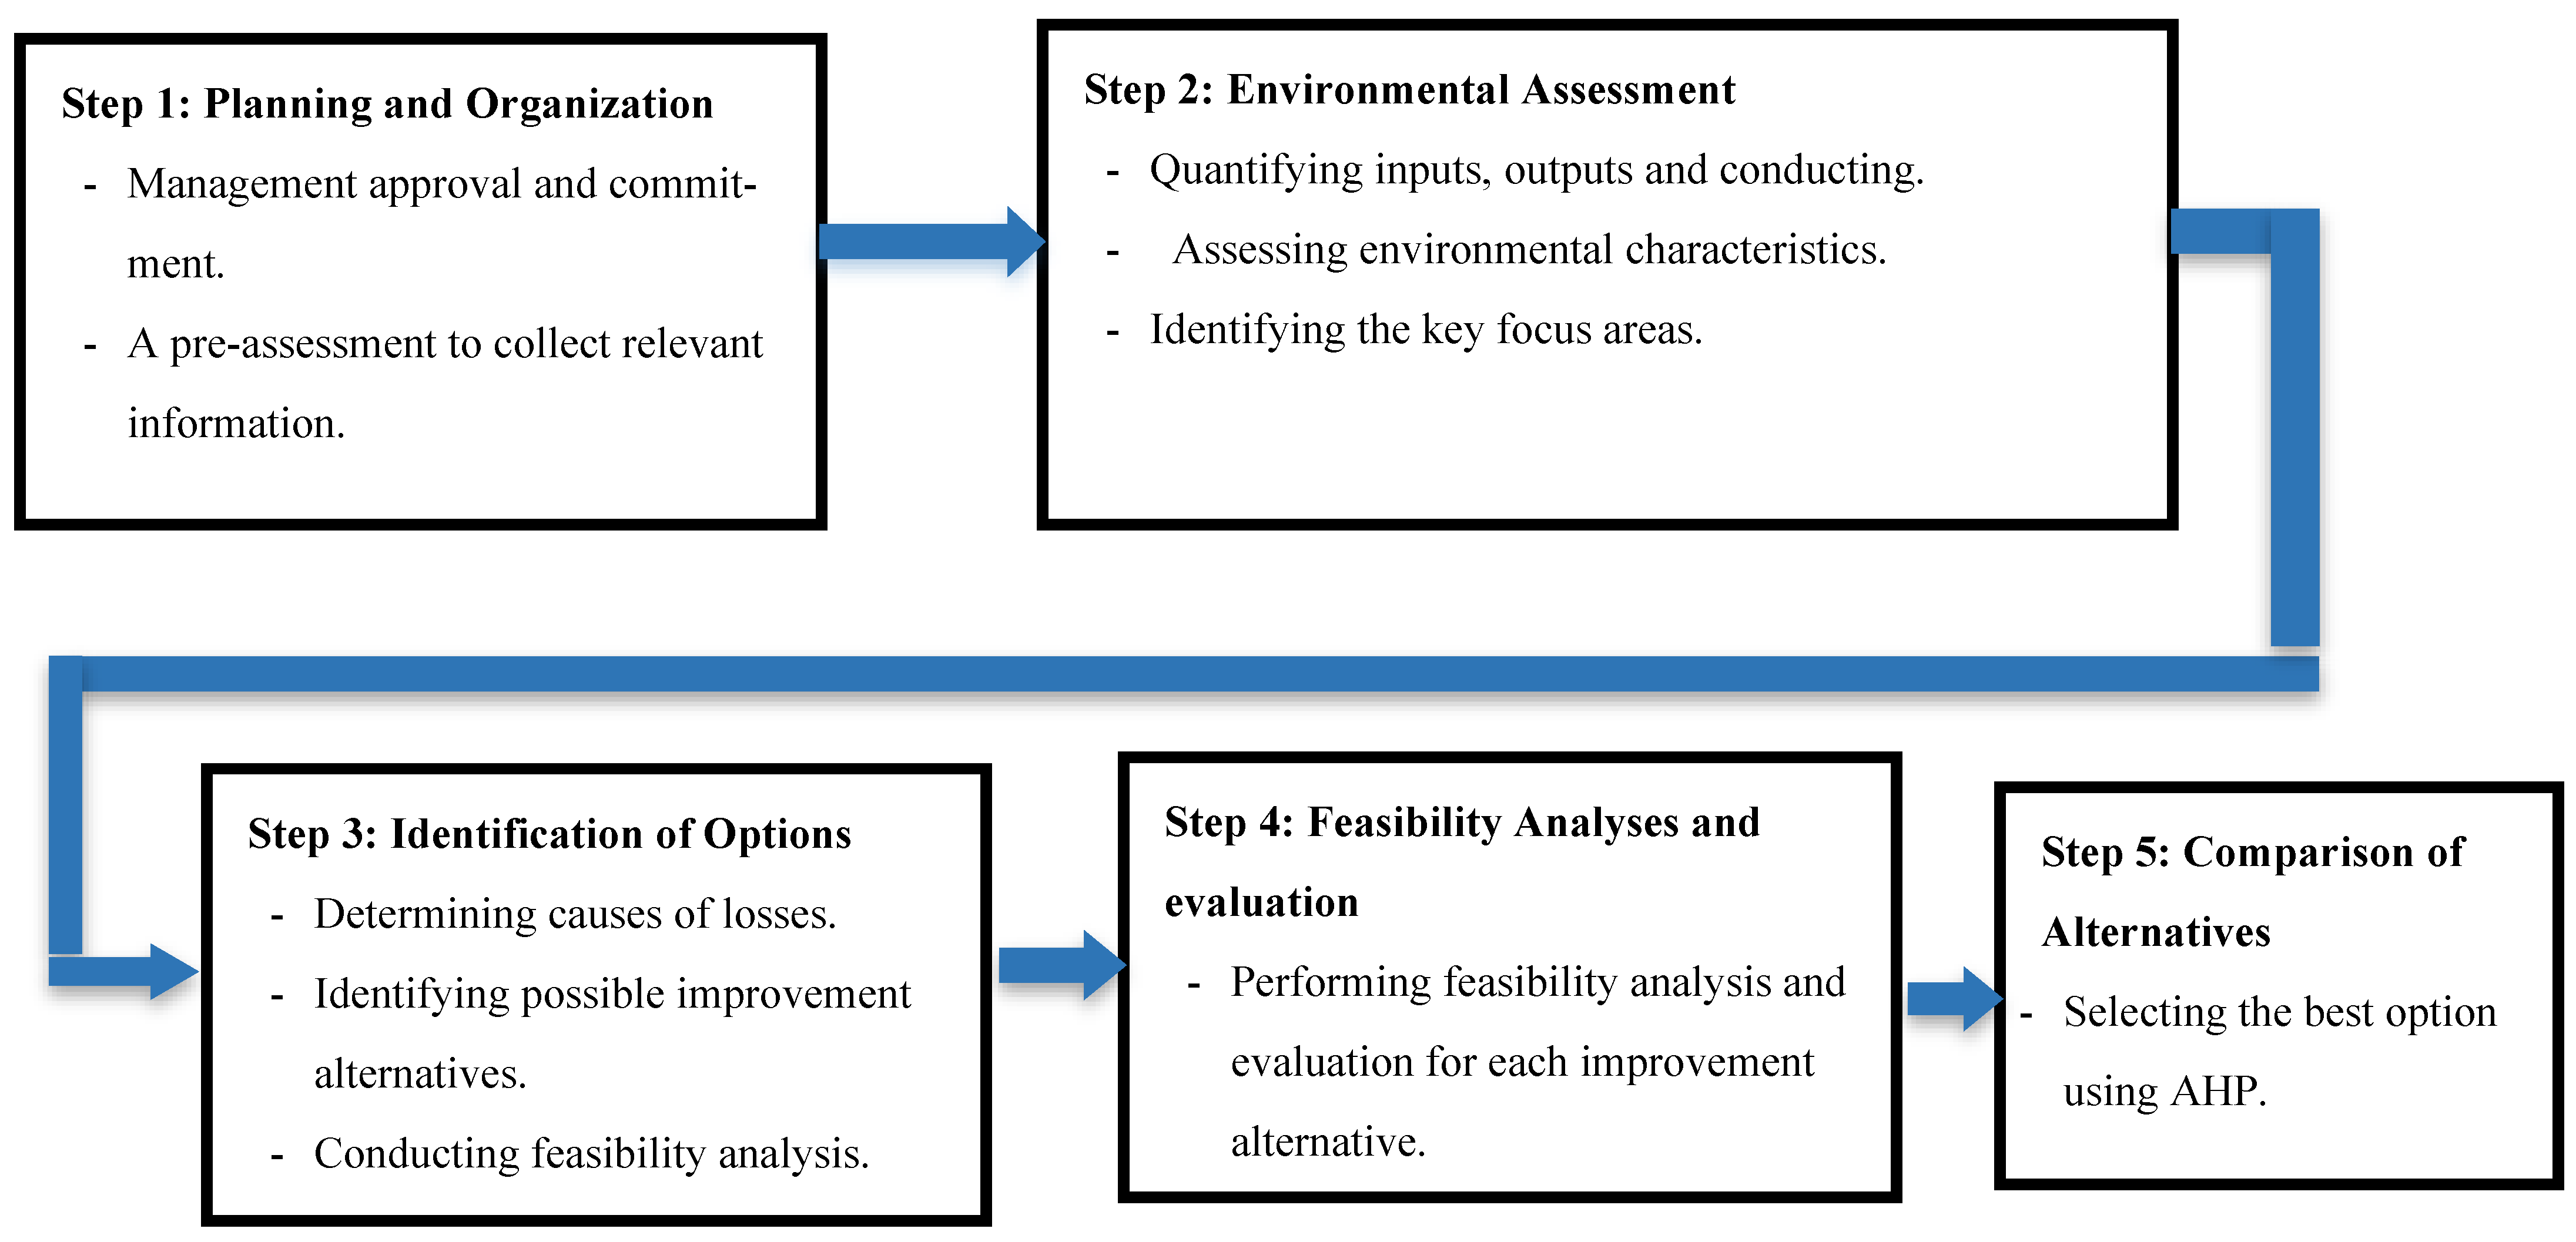
The CP approach is conducted as illustrated in Figure 1.
The four steps and their tasks are presented as follows:
Step 1: Planning and Organization
The purpose of this step is to obtain commitment from top management to planning and organizing the environmental assessment. A pre-assessment is conducted to identify the biggest areas for savings. This information can be obtained through existing documentation and computer systems, a walkthrough of the plant, and simple monitoring, including production capacity, production data for the past year, preferably for each month, energy and other resource consumption data, and costs, preferably for each month and for each production step or department.
Step 2: Environmental Assessment
The environmental assessment was conducted and is presented as follows:
(1)
Quantifying inputs and outputs for each process
The most important input resources to the technological process were determined, including electricity, fuels, water, raw materials, and chemicals. Also, the relevant outputs of the technological process were identified and measured, including solid waste, heat, emissions, noise, and wastewater.
(2)
Assessing environmental characteristics
Five profiles were examined to assess the environmental characteristics for the technological processes, including raw material, energy, waste, product, and packaging profiles as follows [25]:
i. 
Raw material intensity indicator
This indicator calculates the raw material intensity as a percentage of the annual NOP quantity. Let PR (tons/year) denote the annual NOP production. Let Qm be the quantity (tons/year) of raw material m used in the NOP production; m = 1, …, M. Then, the partial raw material intensity, Rm, of material m is estimated as follows:
Rm = Qm/PR    For m = 1, …, M
Then, the total raw material intensity, RI, is calculated using Equation (2).
RI = m = 1 M R m
ii. 
Product indicator
This indicator assesses the quantity, Np, of noxious material p in the NOP production; p = 1, …, P. The partial product indicator, Pp, is estimated as follows:
Pp = Np/PR    For p = 1, …, P
Considering P types of noxious materials, the total product indicator, PI, is calculated as follows:
PI = p = 1 P P p
iii. 
Energy unit indicator
In fertilizer production, various energy types are used to produce PR of NOP, including electricity and heavy fuel oil (HFO). Let De and Ae denote the expected and actual consumptions of source e in NOP production; e = 1,…, E. Let Ve represent the recovered quantity of source e. Then, the partial energy index, Ee, for energy source e can be calculated as follows:
E e = A e V e D e , e
Then, the total energy indicator, EI, from E sources of energy is estimated as stated in Equation (6).
E I = e = 1 E E e
iv. 
Waste generation unit indicator
Three types of waste are examined, including liquid, gaseous, and solid waste. Let W denote the quantity of liquid waste generated from NOP production. Let TL denote the relative toxicity indicator of liquid waste, which is derived from a scale based on environmental hazards, effects on aquatic life, and global warming potential. Then, the partial unit indicator, LI, is calculated as follows:
L I = W × T L P R
Further, the indicator, GIge, of gaseous waste g, g = 1, …, G, due to the use of energy source e is calculated as follows. Let TGge denote the relative toxicity indicator of gaseous waste g due to using energy source e, fuel or electricity, in specific stages of NOP production. Then, GIge is calculated as follows:
G l g e = G g e × T G g e P R , g , e
Then, the total gaseous waste indicator, GI, of G gaseous waste from E energy sources is estimated using Equation (9).
G I = e = 1 E g = 1 G G I g e
Finally, the solid waste indicator, SIs, is calculated as follows. Let the quantity of solid waste s from NOP processes be denoted as Ss; s = 1,…, S. Let TSs indicate the relative toxicity indicator of solid waste s. Then, SIs is calculated as follows:
S l s = S s × T S s P R , s
Then, the total solid waste indicator, SI, from S solid wastes is estimated using Equation (11).
S I = s = 1 S S I s
The calculated LI, GI, and SI are then used to calculate the overall waste index, WI, as follows:
WI = LI + GI + SI
v. 
Packaging Unit Indicator
Let k be the indicator of the material type of bag used for packaging NOP products, where k = 1, …, K. Let ck and wk denote the capacity (bags/ton NOP) and weight (kg) of packaging type k. Finally, let yk and lk denote the percentage of type k of bags used for packaging NOP products and the relative environmental loading of kth bag material type based on the qualitative environmental assessment of packaging materials utilizing subjective experts’ evaluations of each material type regarding environmental degradation, consumption of natural resources and energy, emissions, waste, and effects on human health and safety, respectively. Then, the total quantity (kg), Qk, required for packaging yk of NOP products is calculated as follows:
Q k = y k × w k × c k × P R , k
The packaging unit indicator, Kk, for packaging type k is estimated using Equation (14).
K k = l k × Q k , k
The total packaging indicator, KI, from K types of packaging materials will be
K I = k = 1 K K k
The same approach can be used to calculate the partial packaging indices for wooden hooding films.
(3)
Identifying the focus areas
Generally, the focus areas could include the entire plant, waste generation, raw material, products, and packaging materials that contribute to significant environmental impacts. To identify the key focus areas, the degree of the environmental impacts from all profiles related to the technological processes of NOP is assessed by estimating the total integrated environmental assessment indicator, TI, given by Equation (16).
T I = M I 2 + P I 2 + E I 2 + W I 2 + K I 2
Based on TI and the ranking of indices for the five profiles, the profiles with significant environmental impacts are identified as the focus areas for which improvement opportunities are needed [26,27]. Table 1 displays the environmental nuisance classification scheme for TI.
Step 3: Determining improvement alternatives
After identifying the critical focus areas, it is necessary to investigate the causes behind significant negative environmental impacts. Improvement actions can include modifications to production processes, adopting new technologies, input materials substitution, implementing alternative energy technologies and solutions, on-site reuse/recovery, and production of useful by-products.
Step 4: Feasibility analysis and evaluation of alternatives
Feasibility analysis and evaluation should be conducted for each improvement alternative, including technical, financial, and environmental aspects, to assess its capability to improve the efficiency and sustainability of the NOP production line. Technical feasibility assesses the need for new equipment, space availability, and impact on product quality. The economic feasibility in this research considers the payback period method. Finally, the environmental feasibility evaluates the impact on energy consumption, greenhouse gas emissions, solid waste, and wastewater.
Step 5: Comparing alternatives. AHP is a multi-criteria decision-making approach that can be used to solve complex decision problems [28,29]. It uses a multi-level hierarchical structure of objectives, criteria, sub-criteria, and alternatives. The pertinent data are derived by using a set of pairwise comparisons. These comparisons are used to obtain the weights of importance of the decision criteria and the relative performance measures of the alternatives in terms of each decision criterion. AHP was applied for decision-making, planning, priority setting, and economic analysis in various industrial applications, such as water security assessment and environmental protection measures, and the quality evaluation indicator system of the ecological environment [30]. Table 2 shows the recommended importance and ratings for AHP.
In this research, AHP is utilized for the evaluation of the suggested improvement alternatives and solutions based on multi-criteria including cost, environmental impact, warranty, robustness and sensitivity, maintenance, payback period, and performance. This helps determine the best improvement

4. Application of CP to NOP Production

The CP methodology is applied as follows:
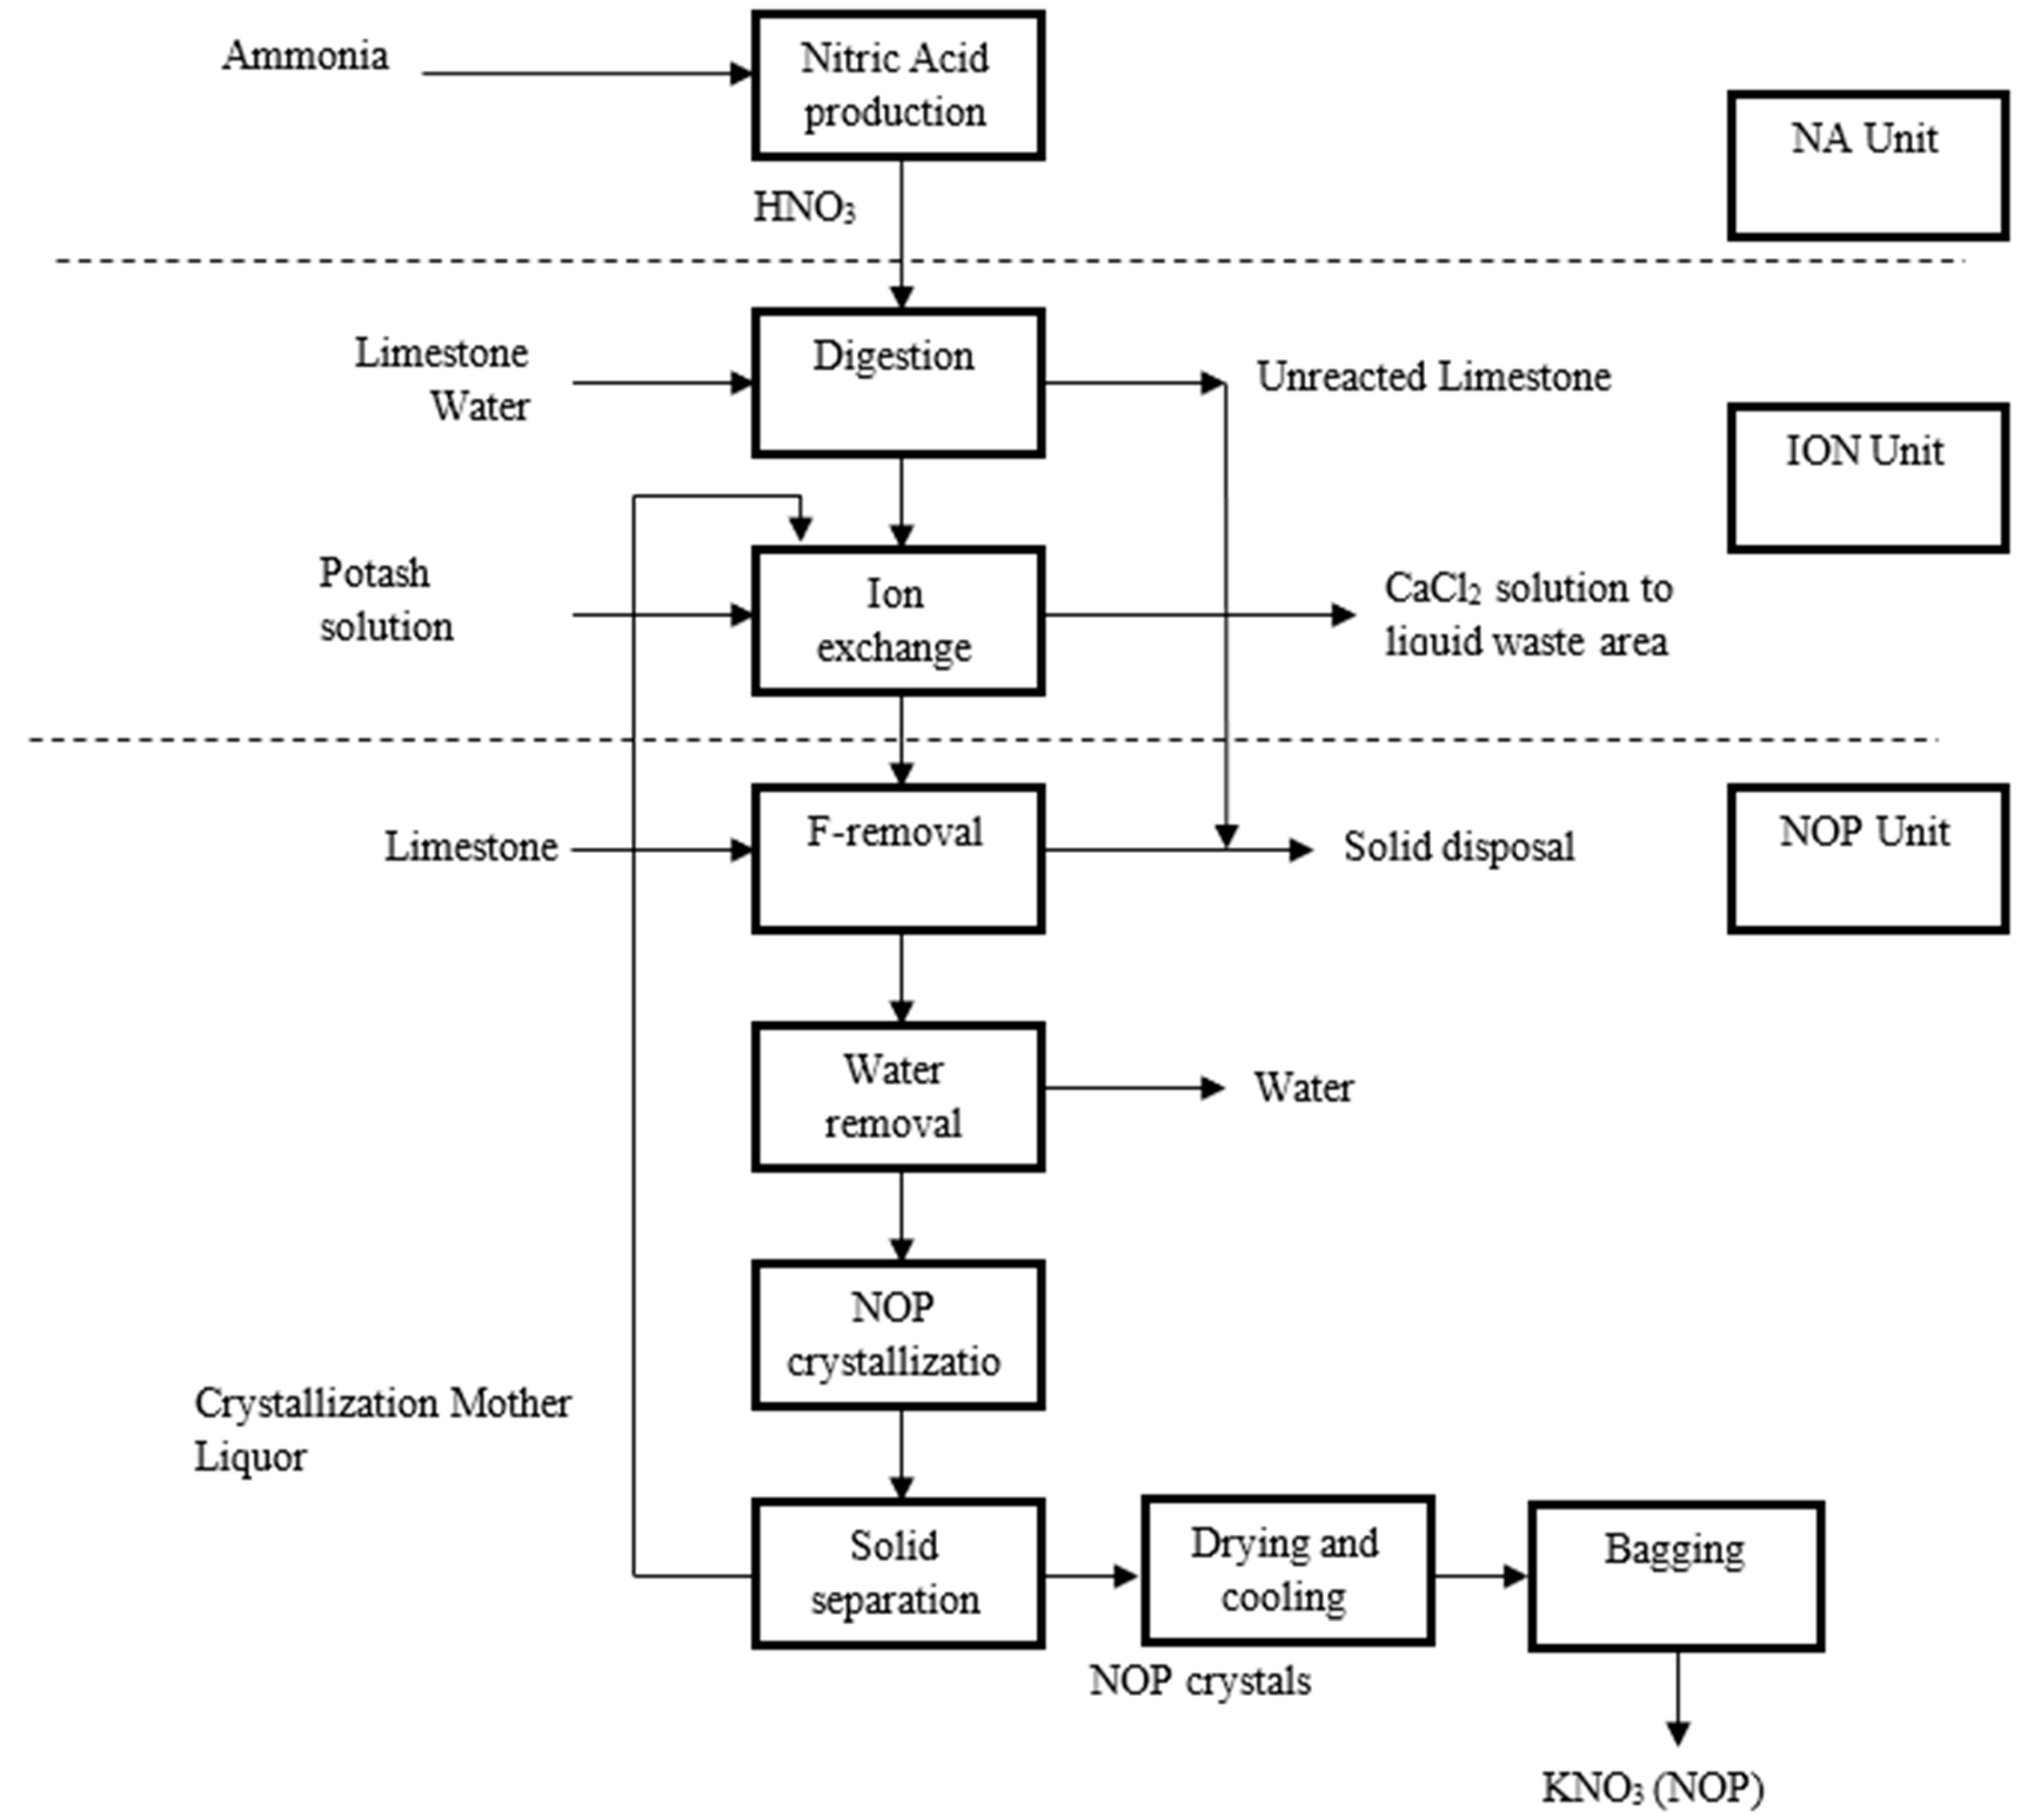
Step 1: The NOP production line is shown in Figure 2. Information about production capacity, production data for energy and resources consumption, and costs was collected and is described as follows:
i.
Nitric Acid Production
The capacity of the Nitric Acid plant is 350 mt/day of HNO3 (expressed at 100% concentration). The product is delivered as 60% by weight. Liquid ammonia is evaporated, superheated, mixed with air, and oxidized in the burner. The resulting nitrous gases are absorbed by water, forming 60% HNO3 (Nitric Acid).
ii.
Ion Exchange Production
In the digestion unit, phosphate reacts with Nitric Acid. The reaction slurry is fed to a thickener. The slurry from digestion is then pumped through a selected number of columns in the Ion Exchange unit, where the calcium and acid hydrogen are exchanged for K-ion. Resin regeneration is done by a concentrated potash solution, which replaces calcium on the resin with potassium. The effluent from regeneration is a calcium chloride solution, sent to an evaporation pond after neutralization with limestone. Urea is finally added to the digester to reduce NOx.
iii.
Potassium Nitrate (NOP) unit
In the NOP unit, the product leaving the ion exchange unit and the underflow from the lamella separator are treated by limestone slurry to precipitate and separate fluorine compounds. The Potassium Nitrate is crystallized from the rich mother liquor. This is done by up-concentrating the liquor in a three-step vacuum evaporation system (falling film evaporators) with subsequent crystallization of the potassium nitrate in the draft tube crystallizer. The crystals from the produced slurry are dewatered in a pre-thickener, followed by a centrifuge, and are dried in a shaking and static dryer. The pure dry NOP product is sent to the bagging unit. The NOP unit consists of a sophisticated energy and condensate recovery system. The most significant waste stream is the concentrated mother liquid (CML) leaving the pre-thickener and the centrifuge. CML is returned to the Ion Exchange unit for recovery/re-processing of the nutrients. The capacity is 150,000 tons of potassium nitrate per year, with actual production of 78,960 tons. The average monthly NOP production is 9017.2 tons.
Step 2: Conducting an environmental assessment
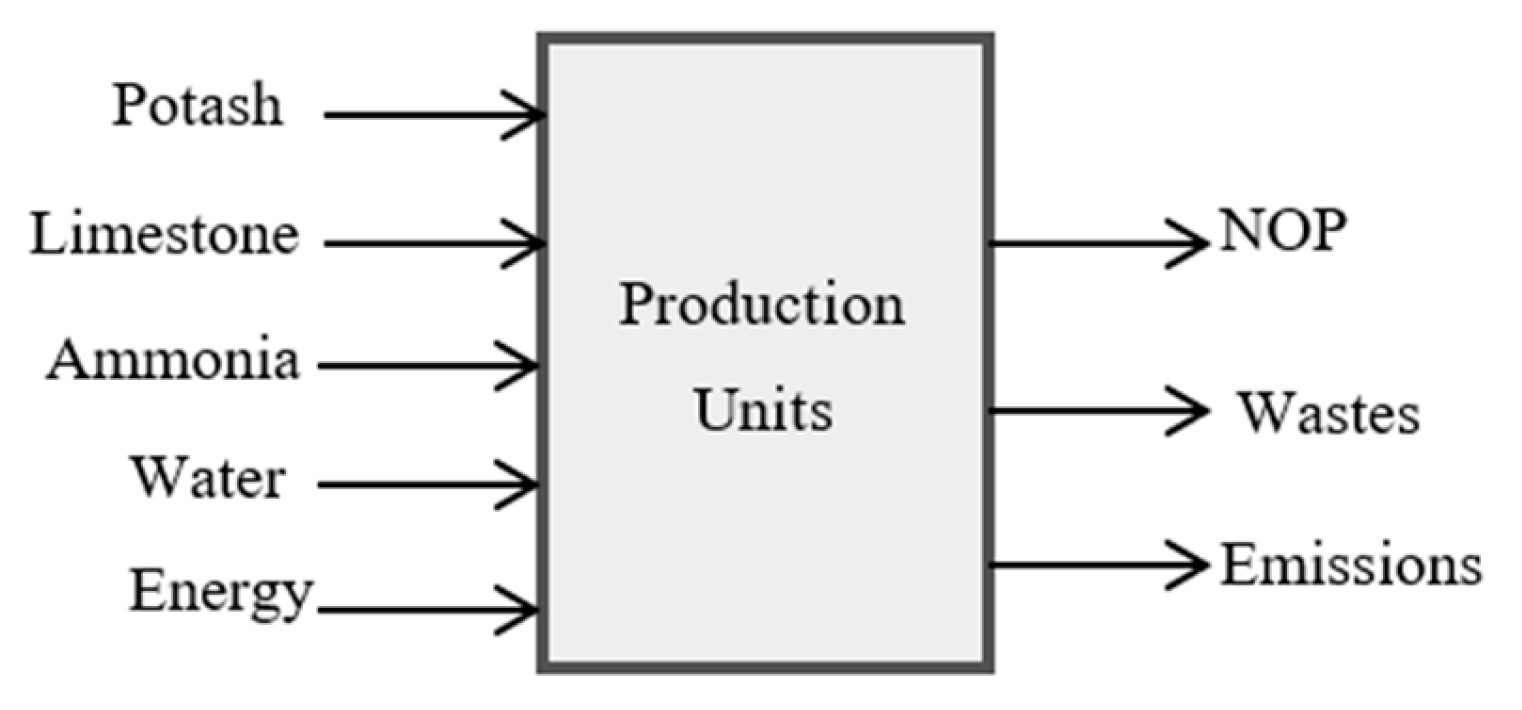
Information was collected regarding the inputs comprising the raw materials, resources, and energy required to produce NOP, and the outputs covering the main products, liquid waste, solid wastes, and emissions, as shown in Figure 3.
An environmental assessment was then conducted to assess the environmental unit indices for five key profiles involving raw materials, energy sources, waste, product, and packaging materials as follows:
  • Raw material indicator
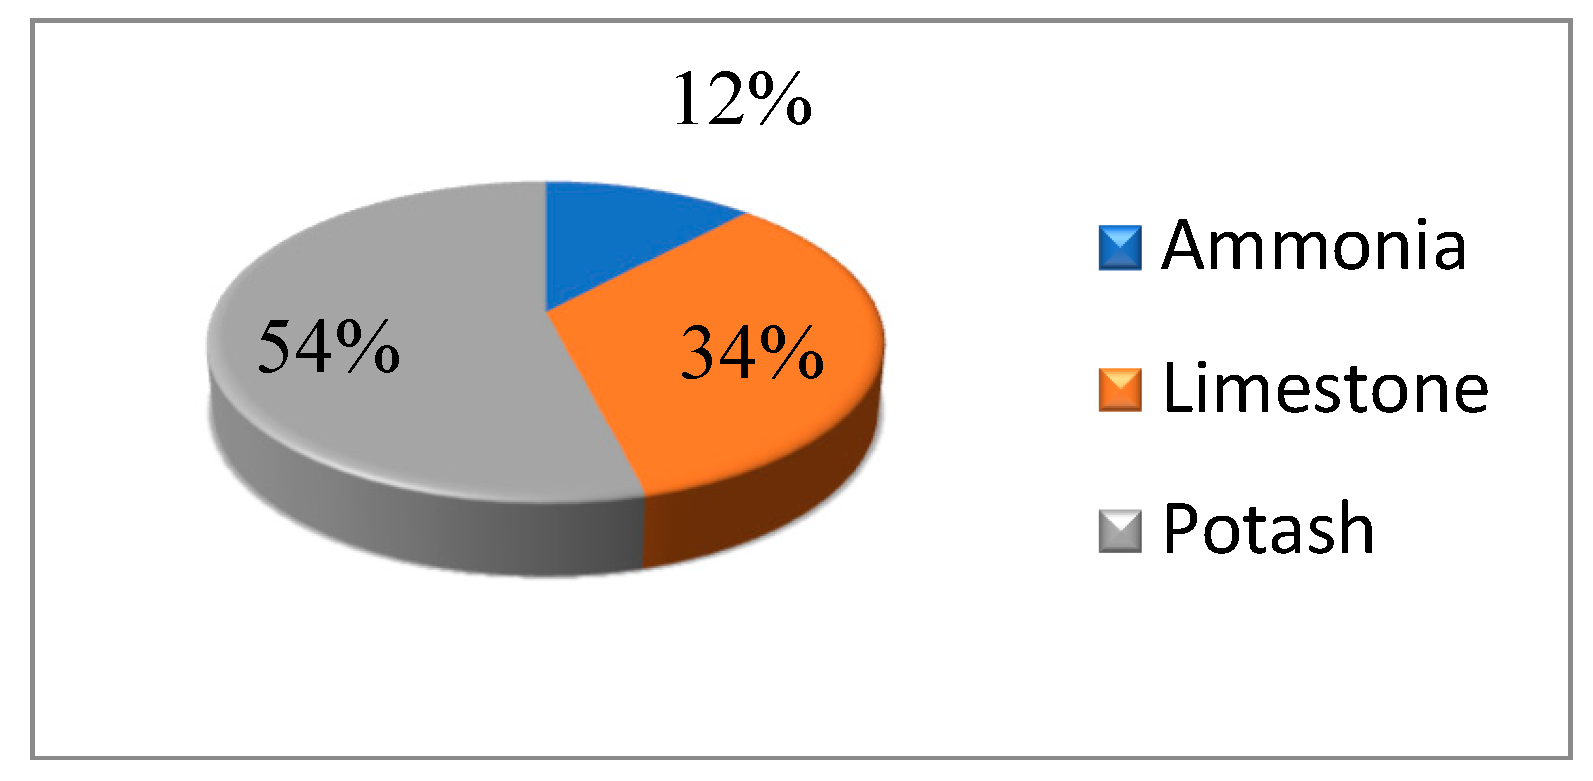
The annual NOP production is 120,000 tons. Three raw materials (M = 3) of NOP are used, including ammonia, limestone, and potash. The raw materials quantities are shown in Table 3.
The raw material percentages are depicted in Figure 4, where the largest (=54%) and lowest (=12%) contributions belong to Potash and Ammonia, respectively.
2.
Product indicator
For assessing the product indicator, Ammonia (p = 1) is the only significantly noxious material in NOP production. The partial product unit indicator, P1, and the environmental nuisance indicator, PI, for ammonia (23,400 tons) are calculated as 0.195 (=23,400/120,000), indicating an insignificant environmental nuisance of NOP.
3.
Energy unit indicator
The monthly NOP-produced quantities are displayed in Table 4.
Two main energy sources (E = 2) are used in NOP processes, including electricity and heavy fuel oil. The energy flow analysis considers the following [29].
(a)
Electricity
The annual electricity consumption for the facility is estimated to be approximately 20.945 GWh of electricity (equivalent to JOD 1.88 million) for the 12 months. The average cost of the electricity tariff is calculated to be 3.79 JOD/kW for the maximum demand, 82 Fils/kWh for the day tariff, and 70 Fils/kWh for the night tariff. The electrical energy consumption for the factory facilities has an irregular pattern. The main electricity consumers in the factory are divided between the nitric acid plant, the ion exchange plant, and the NOP plant. A significant portion of the overall electricity consumption goes to plant auxiliary systems that are required for the processes. The auxiliary systems are lighting, a compressed air system, pumps, and motors. Based on the annual NOP production, the estimated electricity consumption is 20.95 GWh.
(b)
Heavy Fuel Oil (HFO)
HFO is the main fuel utilized by steam boilers in production line processes. The annual estimate of HFO consumption is about 6113.74 metric tons. The estimated HFO consumption per ton of NOP is about 56.5 kg/ton of NOP (=6113.74 GWh/108,206.55 tons). Then, the annual HFO demand to produce 120,000 tons of NOP is 6780.1 tons. The average price of HFO is 462 JOD/metric ton. For technological processes of NOP, inputs of a mass of 51 kg of HFO and 174.54 kWh of electricity are required to produce one ton of NOP. For 120,000 tons of NOP, the average annual demands of HFO and electricity are 6120 (=51 × 120,000) tons and 20,945,000 (= 174.54 × 120,000) kWh, respectively. About 7 kg of high-pressure steam (HPS) at 40 bars and 390 °C is recovered per ton of NOP. The annual amount of recovered steam is 840 tons HPS. The actual consumption of energy sources exceeds the required consumption due to variations in production rates, heat losses, lighting, and the compressed air system. The energy unit indices E1 and E2 for HFO and electricity, respectively, were calculated, and the results are displayed in Table 5.
For illustration, the actual consumption and the recovered energy of HFO are 6780.1 and 67.2 tons, respectively. Then, the partial unit indicator, E1, is 1.097 (= (6780.1 − 67.2)/6120). From Table 5, E1 and E2 are 1.097 and 1.11 for HFO and electricity, respectively. Then, the resultant energy indicator, EI, is calculated as 2.207.
4.
Waste generation unit indicator
Three types of waste are generated in the process: solid, liquid, and gaseous. Solid waste is 20 kg of unreacted limestone generated per ton of NOP, liquid waste is 3 m3 of calcium chloride byproduct per ton of NOP with a density of 1390 kg/m3, and two types of gaseous waste are emitted in the process in a significant amount: CO2 and N2O. For HFO, the average of the emission factor is 3.114 g of CO2 per 1 g HFO (Lower calorific value = 40.5 MJ/kg HFO) and 0.00018 g N2O per g HFO [31,32,33]. A relatively low toxicity indicator is given to Limestone, as limestone has no recognized unusual toxicity to plants or animals. Calcium chloride does not biodegrade or bio-accumulate and remains in a dissolved state. However, it is still toxic to aquatic life in high concentrations, hence the relatively medium toxicity indicator assigned to it. For the gaseous emissions, toxicity was mostly based on the global warming potential (GWP), where the GWP for N2O and CO2 are 273 and 1, respectively [34].
The toxicity indicator for each waste type is shown in Table 6. The partial waste generation unit indicator is then calculated for each type of waste as shown in Table 7.
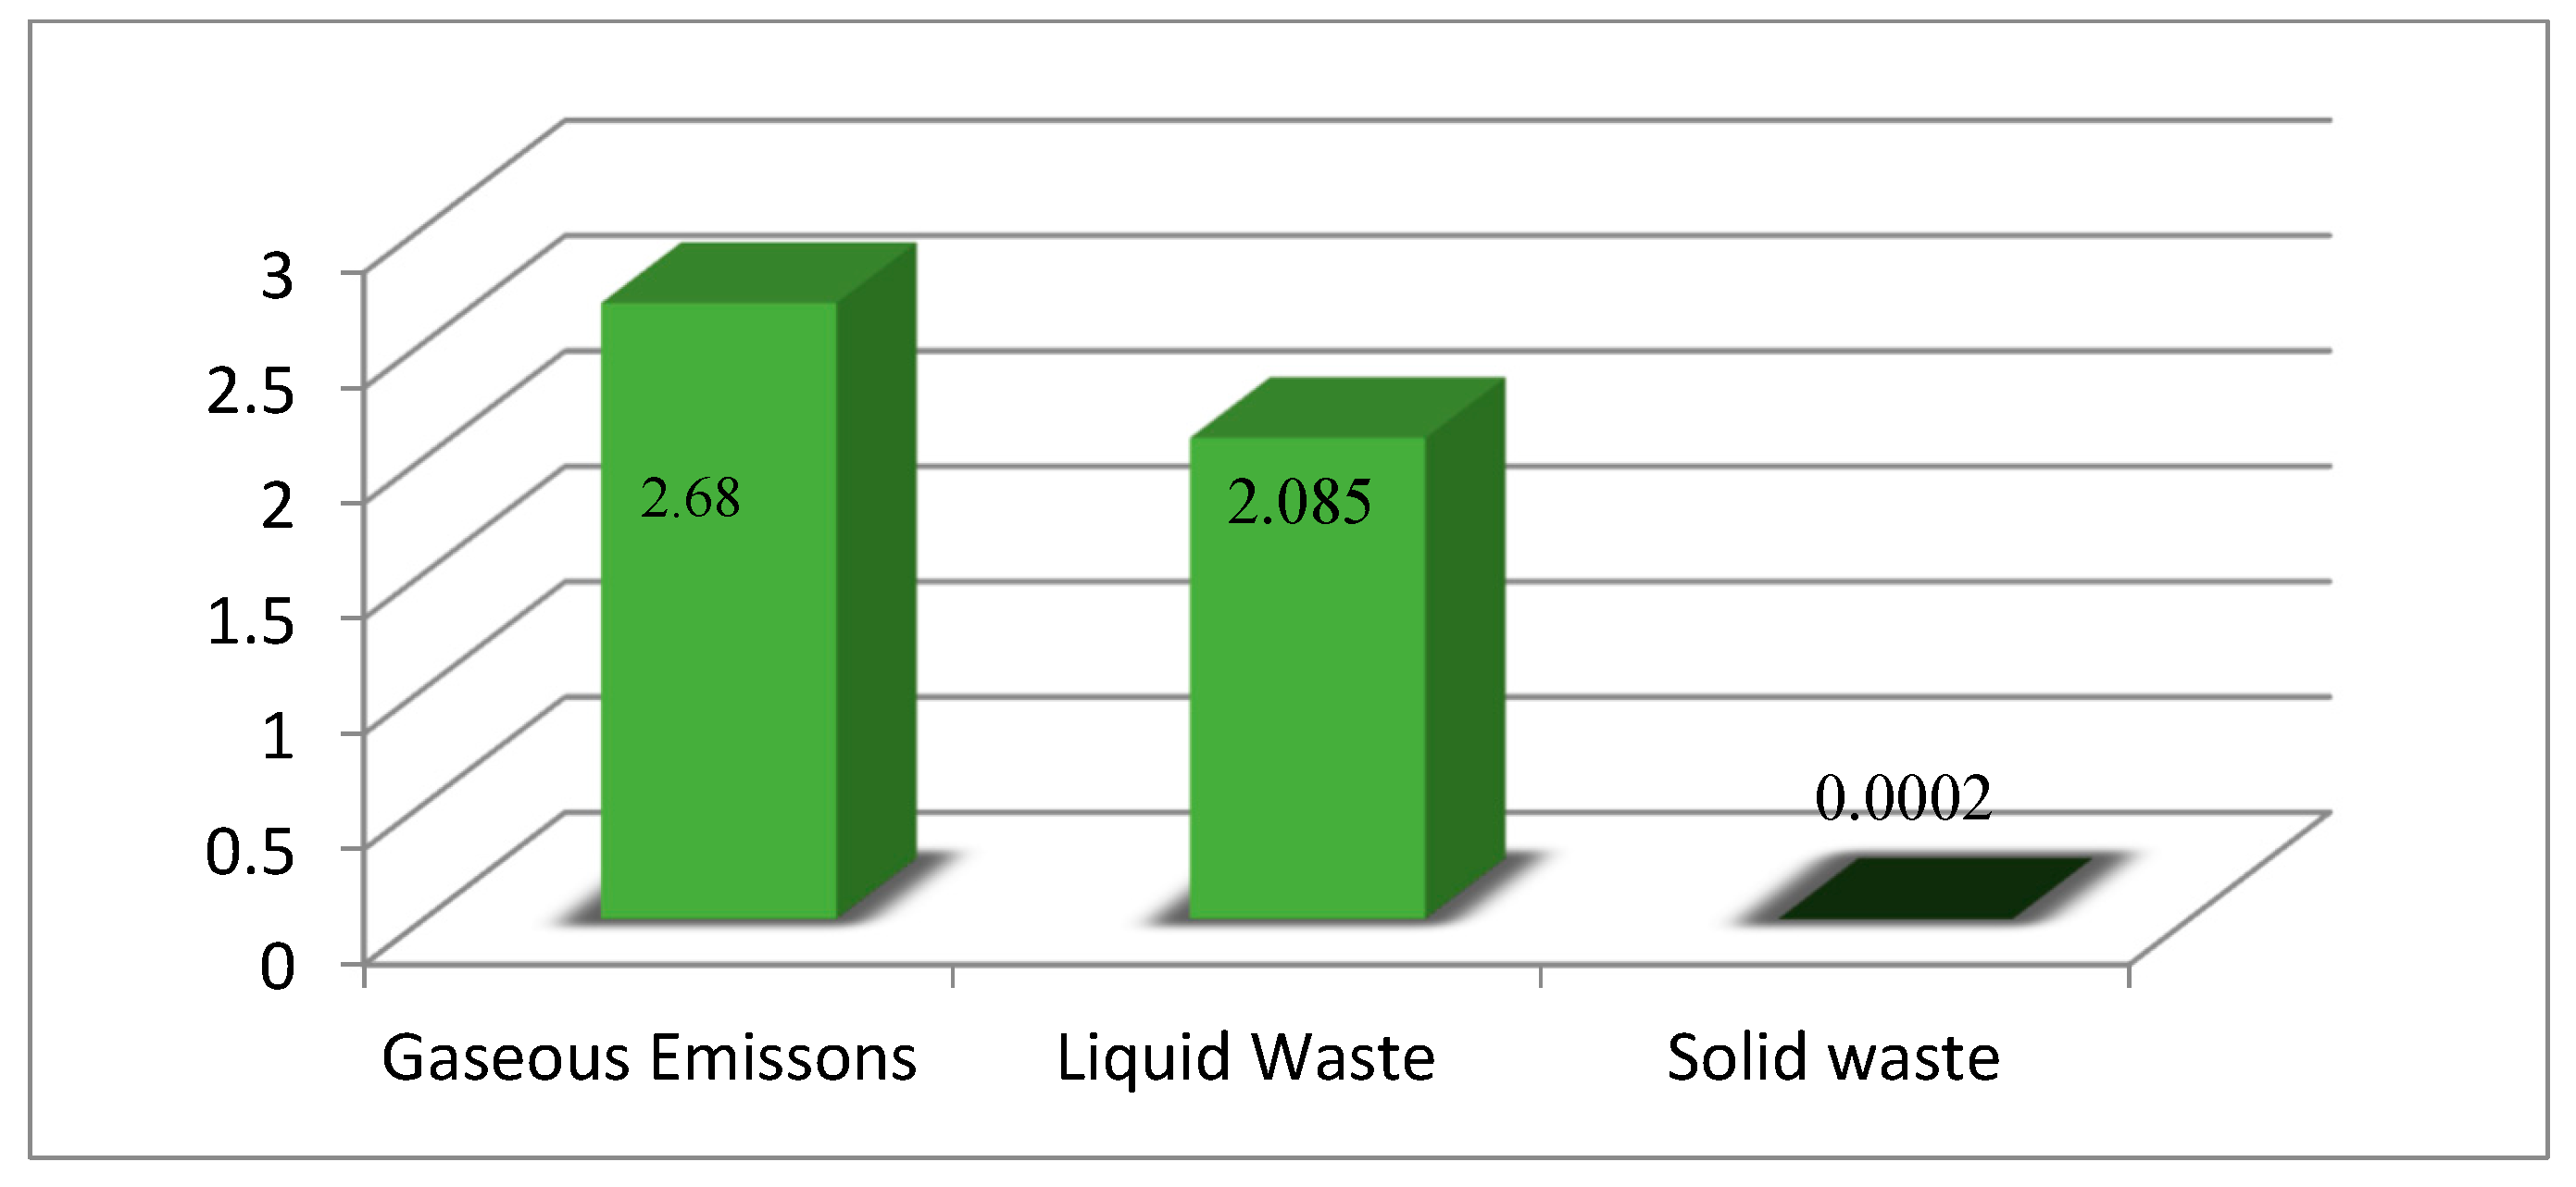
Figure 5 shows a histogram for the partial waste unit indices, where the highest partial unit indicator (=2.68) and the minimum (=0.0002) correspond to the gaseous and solid wastes, respectively. The total gaseous waste indicator, WI, is found to be 4.684.
5.
Packaging Unit Indicator
A percentage of 40% of NOP is packaged in two types of Jumbo bags; the first type has a capacity of 1 ton of NOP and weighs 2.3 kg per bag, and the second type has a capacity of 1.2 tons of the product and weighs 2.6 kg per bag. About 10% and 50% of NOP are packaged into small 25 kg PP and PE bags, respectively. The 25 kg PP and PE bags weigh 0.14 and 0.1 Kg, respectively. Each ton of the small 25 kg bags is grouped on a wooden pallet that weighs 18 kg and is wrapped with a polystyrene hooding film, which weighs 0.62 kg. The mass of each of the packaging materials is calculated as follows:
  • Jumbo bags (1 ton) = 120,000 t NOP × 20% × 1 bag/t NOP × 2.3 kg/bag = 55,200 kg
  • Jumbo bags (1.2 ton) = 120,000 t NOP × 20% × 1 bag/t NOP × 2.6 kg/bag = 62,400 kg
  • Small 25 kg PP bags= 120,000 t NOP × 10% × 40 bag/t NOP × 0.14 kg/bag = 67,200 kg
  • Small 25 kg PE bags= 120,000 t NOP × 50% × 40 bag/t NOP × 0.10 kg/bag = 240,000 kg
  • Wooden pallets = 120,000 t NOP × 60% × 1 pallet/t NOP × 18 kg/pallet = 1,296,000 kg
  • Hooding film = 120,000 t NOP × 60% × 0.62 kg/t NOP = 44,640 kg
The partial packaging unit indicator and relative environmental loading indicator of packaging, pallets, and hooding film are shown in Table 8.
The results for environmental assessment revealed that the highest indicator values correspond to energy and waste profiles. High energy consumption, waste, effluents, and gaseous emissions are common outcomes for plants with large production lines. The integrated environmental assessment indicator is calculated as the square root of the sum of the squares for the five profiles and found to be 5.18, indicating, as shown in Table 1, a moderate environmental nuisance. The reduction in high consumption of HFO and/or electricity as energy sources can be seen as an area for improvement of interest to enhance the environmental performance.
Step 3. Improvement alternatives
Two improvement alternatives were suggested—based on production and expert opinions—to reduce energy consumptions that result from high production demands of HFO and electricity, including the following: A1, installation of a solar thermal system to support the steam boilers; and A2, adoption of photovoltaic solar cells to support the electrical generator. Nevertheless, the high investment costs necessitate conducting a feasibility analysis and multi-criteria evaluation for each option.
Step 4: Feasibility analysis of alternatives
Alternative 1: Solar thermal system installation
The solar thermal system collects heat by absorbing sunlight using a collector that captures sunlight radiation. Lighter and easier collectors with high reliability, efficiency, and the capability to heat water to higher temperatures. Installing 250 evacuated tube collectors requires 1000 square meters. In the production process, two boilers generate steam: a waste heat boiler and an auxiliary boiler. The auxiliary boiler operates at 44 bar and 400 °C. The capacity of the auxiliary boiler is 33 metric tons of steam per hour. The waste heat boiler is mainly an economizer installed to recover the generated heat from burning nitrate. Significant amounts of HFO are consumed to generate steam and hot water. The system delivers 100 m3/day (100,000 Lit/day) hot water, at an average temperature of 55 C°, as depicted in Table 9.
From Table 9, installing a Solar Thermal system reduces HFO consumption, thereby reducing gaseous emissions. Knowing that the average temperature difference (∆T) in the summer season is 35.4 °C, and the specific heat capacity of water is 4.179 KJ/kg °C, the amount of heat gained by water is then calculated as follows:
Heat = ∆T × specific heat capacity × volume × density
= 35.4 × 4.179 × 100 × 999.97 kg/m3 = 14.8 GJ/day = 3.54 G Calories/day
Annual reduction in CO2 emissions (tons) = 14.8 GJ/day × 330 days/year × 76.9 g/MJ = 375.6
Annual reduction in N2O emissions (kg) = 14.8 GJ/day × 330 days/year × 4.44 g/GJ = 21.685
Finally, the amount of saved HFO is calculated as
Amount   HFO   saved   ( tons / yr ) = Energy   saved   per   year   ( G   calorie / year ) amount   of   energy   ( G   calorie / kg )   of   H F O
Amount   HFO   saved   ( tons / yr ) = 3.54 × 330 0.00968 = 120.68
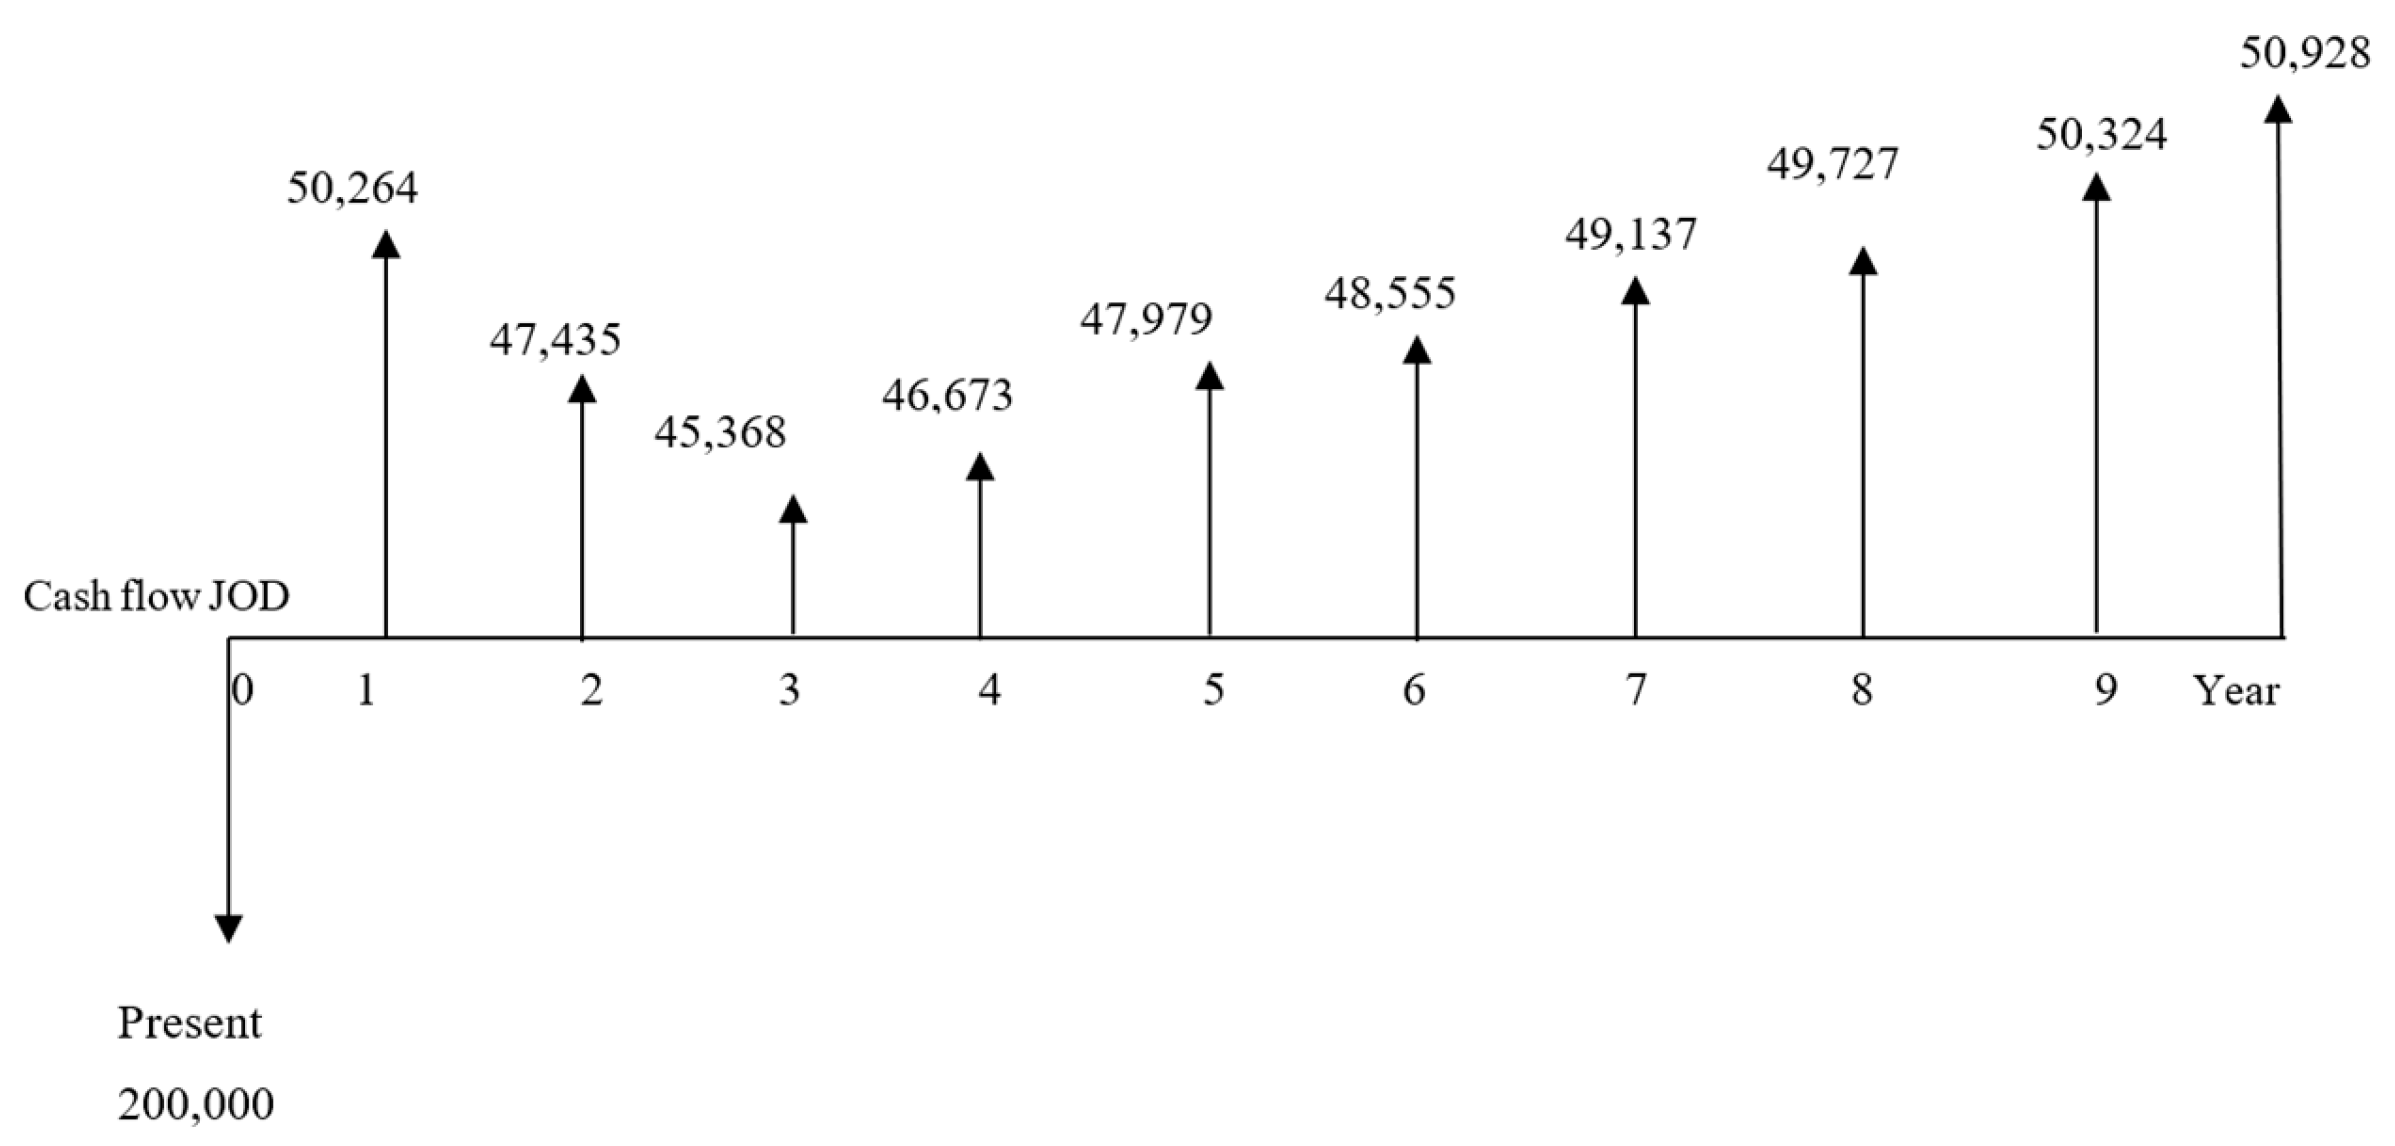
The economic benefits due to installing a solar thermal system are determined using three criteria: net present value (NPV), internal rate of return (IRR), and payback period. The initial investment cost, including collectors, tanks, and installation, is about JOD 200,000, and the actual annual consumption for HFO is about 6114 tons/year. Knowing that the amount saved of HFO after installing the system would be 121 tons/year, the new annual consumption of HFO would be 5993 tons/year. The depreciation in each year of the first 10 years would be JOD 20,000. Considering the 14% tax rate, the NPV shown in Figure 6 is calculated at an inflation rate of 11% using Equation (19).
d k = B S V N N
where
dk: depreciation in year k;
B: cost Basis;
SVN: salvage value;
N: depreciable life.
Figure 6. Cash flows over the years for the A1 system.
Processes 13 02815 g006
The reason for the pattern is that the tariff for HFO will decrease by 6.3% in year 1 and 5.7% in year 2 according to the information in Jordan’s market, and then the tariff starts increasing again in the years after.
Alternative 2: Photovoltaic Cells Installation (PV)
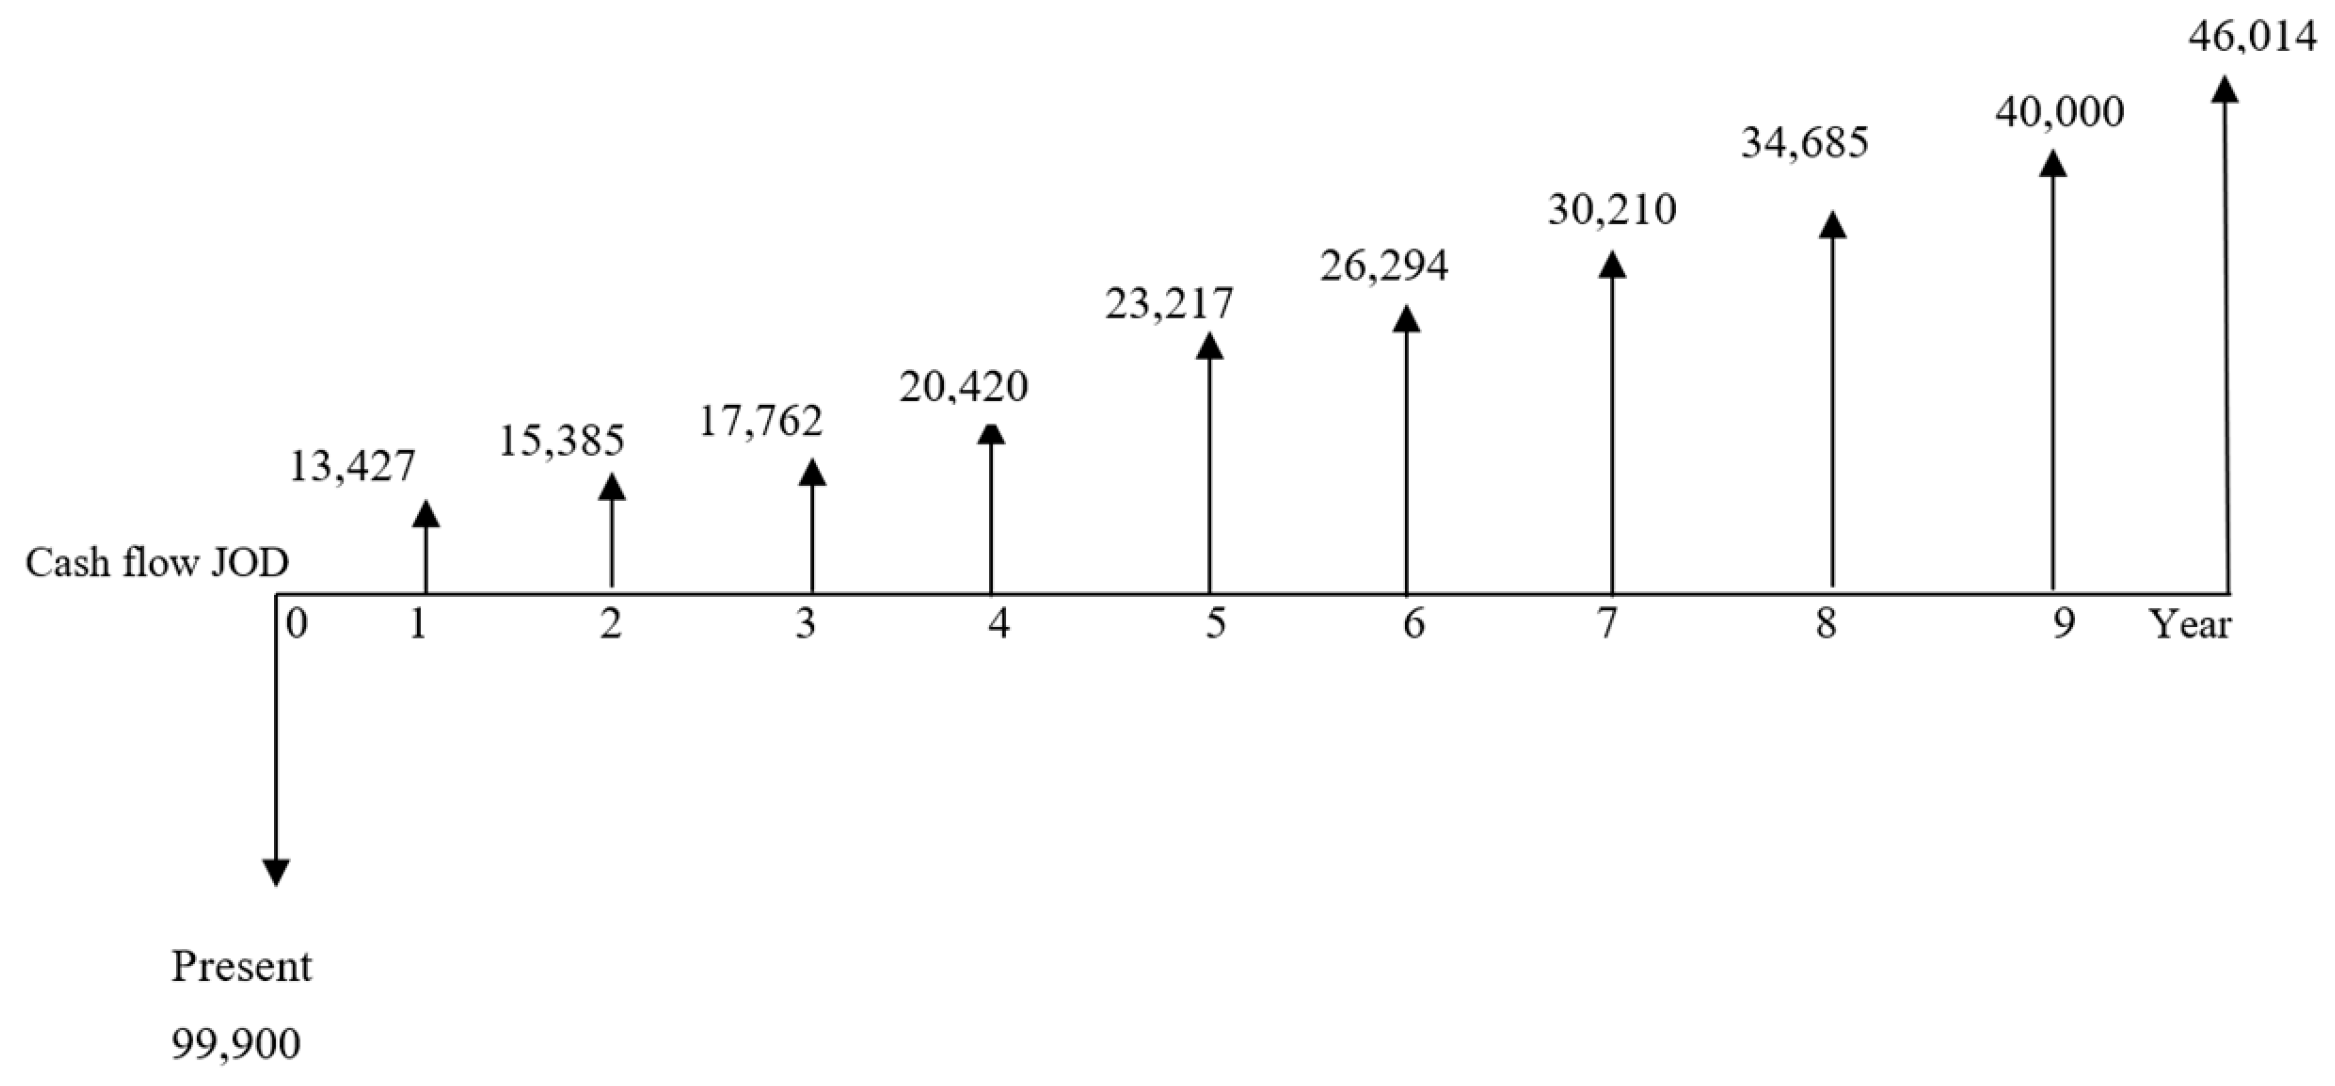
The average electrical consumption is 1,745,416.67 kWh per month. Considering that the electricity tariff for industrial institutions will increase by 15%, PV cells generate a portion of this consumption independently. There are several types of PV cells: Polycrystalline Silicon (multi-Si) cells made of high-purity and multi-crystalline silicon used as raw material [35]. The power output to these cells is proportional to the sun’s intensity, and unlike solar thermal systems, they are extremely sensitive to shading. The available area of 1000 m2 enables the installation of 333 panels (1200 JOD, 3 m2 per panel, with an average annual energy output of 250 kWh/m2) [36,37,38,39,40]. The total cost is JOD 99,900. Consequently, the transition to using PV solar systems can substitute about 250 MWh annually. Electricity itself does not cause pollution or gaseous emissions; however, the production of electricity does. Indirect GHG emissions from the consumption of purchased electricity, heat, or steam are as noxious to the environment, and their effect must be accounted for. When producing 1 kWh, an average of 424 g of CO2 is emitted, or 59.39 kg CO2/kWh [39,40,41,42]. Consequently, the monthly emissions resulting are 740 tons, or 8880 tons annually. The proposed PV system has an annual capacity of 250 MWh, resulting in a CO2 emissions reduction of 106 tons. The monthly power needed after installing the system would be calculated using Equation (20).
Power = Previous Consumption − Electricity generated by PV
= 1,745,417 − 20,833 = 1,724,584 kWh
Knowing that the factory is subject to a 14% tax and the depreciation for the system, which has a depreciable life of 30 years, the depreciation rate is calculated as JOD 9990 over the ten years. The cash flow timeline for the cost reduction is shown in Figure 7 and then discounted back to the present to have an NPV value of JOD 29,236.62.
The cash flow shown in Figure 7 is a gradient, as the tariff for electricity keeps increasing each year by 15%.
Step 5: Comparing alternatives using AHP
A comparison between the two proposed alternatives is displayed in Table 10, where the solar thermal system (STS) results in a reduction in the annual consumption of HFO by 120.681 tons/year, thereby reducing emissions of CO2 and N2O by 375.6 tons and 21.685 kg, respectively.
AHP optimizes decision-making based on multiple criteria, including cost, environmental impact, sensitivity to surrounding conditions, maintenance, warranty, payback period, and performance. Utilizing the ratings displayed in Table 2, the pairwise comparisons between multiple criteria were conducted, and the results are presented in Table 11.
The weights in Table 11 are then standardized by dividing the rate in each cell by the sum of weights in the corresponding column. Table 12 displays the standardized weights. For illustration, for the cost criteria, the weight of 0.0444 for the cell (C-C) is calculated by dividing the corresponding weight (=1) in Table 11 by the sum of the weights of the cost column (=22.5). The other standardized weights are calculated similarly. Next, the sum of the weights in each row is calculated and then divided by the number of criteria (=7) to obtain the weight of each criterion. The consistency check was then performed and found acceptable (consistency ratio = 0).
Based on expert opinions and management preferences, the rating of the two alternative systems, STS and PV, was conducted concerning the selected multiple criteria, as shown in Table 13. The weights are then standardized as shown in Table 14. Finally, the weight of each alternative for each criterion is calculated by multiplying the weighted alternative rating by the corresponding criterion weight. The overall alternative weight is the sum of alternative weights for all criteria, as shown in Table 15. It is found that the overall weight for solar thermal (=0.96) is larger than the weight (=0.71) of the PV system. The ratios of the STS and PV are 57.6% (=0.96/1.67) and 42.4%, respectively.
The AHP results in Table 14 reveal that the solar thermal system (A2) is the best alternative to improve organizational goals for the NOP products and production processes based on multiple environmental and technical criteria.
5. Conclusions

This research presented and implemented a Cleaner Production (CP) methodology to reduce environmental nuisance, production costs, and improve energy efficiency at a NOP fertilizer firm. An environmental and technical assessment was conducted to calculate the environmental indices for five profiles, including raw material, product, energy, waste, and packaging profiles. Results showed that the integrated indicator was 8.083, in which the energy profile is dominant. Two alternatives were suggested, including the solar thermal system and the photovoltaic (PV) cells system, which were evaluated based on multiple criteria using feasibility analysis and AHP. The solar thermal system, 250 evacuated tube collectors (with a solar thermal system capacity of 100,000 L of water/day), was preferable and showed savings of heavy fuel oil (HFO) by 120.681 tons/year, which results in a reduction of gaseous emissions by 375.6 metric tons of CO2 and 21.685 kg of N2O per year. In conclusion, applying the CP methodology supported decision-makers in deciding the best system to enhance energy efficiency and reduce environmental nuisance at NOP plants. This research was conducted to assess the environmental assessment within the factory. Still, further environmental assessment is required to include further stages, such as supplying, transportation, distribution, and recycling/reuse. Future research considers comparative analyses between various types of fertilizers and the reuse of generated energy as inputs to the technological processes in other industries.

Supplementary Materials

The following supporting information can be downloaded at https://www.mdpi.com/article/10.3390/pr13092815/s1, Table S1. Cost reduction after installing a solar thermal system. Figure S1. Cash Flow for the Upcoming Ten Years. Table S2. Economic feasibility analysis for solar thermal system. Table S3. Cost reduction after installing a PV system. Figure S2. Cash Flows after Installing PV System. Table S4. Economic feasibility for PV system.

Author Contributions

Conceptualization, methodology, A.A.-R.; software, A.A.-R.; validation, A.A.-R. and N.L.; formal analysis, A.A.-R. and N.L.; investigation, A.A.-R. and N.L.; resources, A.A.-R. and N.L.; data curation, A.A.-R., writing—original draft preparation, A.A.-R. and N.L.; writing—review and editing, A.A.-R.; visualization, A.A.-R.; supervision, A.A.-R. and N.L. All authors have read and agreed to the published version of the manuscript.

Funding

This research received no external funding.

Data Availability Statement

The original contributions presented in this study are included in the article/Supplementary Materials. Further inquiries can be directed to the corresponding author.

Conflicts of Interest

The authors declare no conflicts of interest.

References

  1. Giannetti, B.F.; Agostinho, F.; Eras, J.C.; Yang, Z.; Almeida, C.M.V.B. Cleaner production for achieving the sustainable development goals. J. Clean. Prod. 2020, 271, 122127. [Google Scholar] [CrossRef]
  2. Da Silva, F.J.G.; Gouveia, R.M. Cleaner Production; Springer International Publishing: New York, NY, USA, 2020. [Google Scholar]
  3. Kalemkerian, F.; Lamela, S.; Santos, J.; Tanco, M. From cleaner production to sustainability: Multiple case studies in Uruguayan companies. Int. J. Environ. Sustain. Dev. 2023, 22, 77–94. [Google Scholar] [CrossRef]
  4. Kliopova, I.; Staniskis, J.K. The evaluation of cleaner production performance in Lithuanian industries. J. Clean. Prod. 2006, 14, 1561–1575. [Google Scholar] [CrossRef]
  5. Reddick, J.F.; Blottnitz, H.V.; Kothuis, B. Cleaner production in the South African coal mining and processing industry: A case study investigation. Int. J. Coal Prep. Util. 2008, 28, 224–236. [Google Scholar] [CrossRef]
  6. Ozturk, E.; Koseoglu, H.; Karaboyaci, M.; Yigit, N.O.; Yetis, U.; Kitis, M. Sustainable textile production: Cleaner production assessment/eco-efficiency analysis study in a textile mill. J. Clean. Prod. 2016, 138, 248–263. [Google Scholar] [CrossRef]
  7. Huang, Y.; Luo, J.; Xia, B. Application of cleaner production as an important sustainable strategy in the ceramic tile plant—A case study in Guangzhou, China. J. Clean. Prod. 2013, 43, 113–121. [Google Scholar] [CrossRef]
  8. Jia, L.; Zhang, Y.; Tao, L.; Jing, H.; Bao, S. A methodology for assessing cleaner production in the vanadium extraction industry. J. Clean. Prod. 2014, 84, 598–605. [Google Scholar] [CrossRef]
  9. Bai, S.W.; Zhang, J.S.; Wang, Z. A methodology for evaluating cleaner production in the stone processing industry: Case study of a Shandong stone processing firm. J. Clean. Prod. 2015, 102, 461–476. [Google Scholar] [CrossRef]
  10. Ramos, A.R.; Ferreira, J.C.E.; Kumar, V.; Garza-Reyes, J.A.; Cherrafi, A. A lean and cleaner production benchmarking method for sustainability assessment: A study of manufacturing companies in Brazil. J. Clean. Prod. 2018, 177, 218–231. [Google Scholar] [CrossRef]
  11. Hou, H.; Sha, S.; Zhang, Y.; Sun, D.; Yang, Q.; Qin, C.; Sun, X. Cleaner Production assessment for sea cucumber aquaculture: Methodology and case studies in Dalian, China. Clean Technol. Environ. Policy 2019, 21, 1751–1763. [Google Scholar] [CrossRef]
  12. de Oliveira Neto, G.C.; Correia, J.M.F.; Silva, P.C.; de Oliveira Sanches, A.G.; Lucato, W.C. Cleaner Production in the textile industry and its relationship to sustainable development goals. J. Clean. Prod. 2019, 228, 1514–1525. [Google Scholar] [CrossRef]
  13. Van Fan, Y.; Chin, H.H.; Klemeš, J.J.; Varbanov, P.S.; Liu, X. Optimisation and process design tools for cleaner production. J. Clean. Prod. 2020, 247, 119181. [Google Scholar] [CrossRef]
  14. de Oliveira Santos, H.; Alves, J.L.S.; de Melo, F.J.C.; de Medeiros, D.D. An approach to implement cleaner production in services: Integrating quality management process. J. Clean. Prod. 2020, 246, 118985. [Google Scholar] [CrossRef]
  15. de Oliveira Neto, G.C.; da Silva, P.C.; Tucci, H.N.P.; Amorim, M. Reuse of water and materials as a cleaner production practice in the textile industry contributing to blue economy. J. Clean. Prod. 2021, 305, 127075. [Google Scholar] [CrossRef]
  16. Yang, B.; Bai, Z.; Zhang, J. Environmental impact of mining-associated carbon emissions and analysis of cleaner production strategies in China. Environ. Sci. Pollut. Res. 2021, 28, 13649–13659. [Google Scholar] [CrossRef] [PubMed]
  17. Ma, S.; Zhang, Y.; Lv, J.; Ren, S.; Yang, H.; Wang, C. Data-driven cleaner production strategy for energy-intensive manufacturing industries: Case studies from Southern and Northern China. Adv. Eng. Inform. 2022, 53, 101684. [Google Scholar] [CrossRef]
  18. Zhang, Y.; Zhang, F.; Yu, H.; Yang, N.; Zhao, Y.; Yang, J.; Yu, H. Performance evaluation of the practical application of cleaner production management system: A case study of steel enterprise. J. Clean. Prod. 2022, 379, 134468. [Google Scholar] [CrossRef]
  19. Madanhire, I.; Mugwindiri, K.; Mbohwa, C. Enhancing cleaner production application in fertilizer manufacturing: Case study. Clean Technol. Environ. Policy 2015, 17, 667–679. [Google Scholar] [CrossRef]
  20. Kliopova, I.; Baranauskaitė-Fedorova, I.; Malinauskienė, M.; Staniškis, J.K. Possibilities of increasing resource efficiency in nitrogen fertilizer production. Clean Technol. Environ. Policy 2016, 18, 901–914. [Google Scholar] [CrossRef]
  21. Zhang, J.; Jiang, J.; Tian, G. The potential of fertilizer management for reducing nitrous oxide emissions in the cleaner production of bamboo in China. J. Clean. Prod. 2016, 112, 2536–2544. [Google Scholar] [CrossRef]
  22. Cánovas, C.R.; Pérez-López, R.; Macías, F.; Chapron, S.; Nieto, J.M.; Pellet-Rostaing, S. Exploration of fertilizer industry wastes as potential source of critical raw materials. J. Clean. Prod. 2017, 143, 497–505. [Google Scholar] [CrossRef]
  23. Zhang, F.; Wang, Q.; Hong, J.; Chen, W.; Qi, C.; Ye, L. Life cycle assessment of diammonium-and monoammonium-phosphate fertilizer production in China. J. Clean. Prod. 2017, 141, 1087–1094. [Google Scholar] [CrossRef]
  24. Chen, Y.; Zhang, X.; Yang, X.; Lv, Y.; Wu, J.; Lin, L.; Zhang, Y.; Wang, G.; Xiao, Y.; Zhu, X.; et al. Emergy evaluation and economic analysis of compound fertilizer production: A case study from China. J. Clean. Prod. 2020, 260, 121095. [Google Scholar] [CrossRef]
  25. Fijał, T. An environmental assessment method for cleaner production technologies. J. Clean. Prod. 2007, 15, 914–919. [Google Scholar] [CrossRef]
  26. Vadrevu, K.P.; Csiszar, I.; Ellicott, E.; Giglio, L.; Badarinath, K.V.S.; Vermote, E.; Justice, C. Hotspot analysis of vegetation fires and intensity in the Indian region. IEEE J. Sel. Top. Appl. Earth Obs. Remote Sens. 2012, 6, 224–238. [Google Scholar] [CrossRef]
  27. Barthel, M.; Fava, J.A.; Harnanan, C.A.; Strothmann, P.; Khan, S.; Miller, S. Hotspots analysis: Providing the focus for action. In Life Cycle Management; Springer: Dordrecht, The Netherlands, 2015; pp. 149–167. [Google Scholar] [CrossRef]
  28. Darko, A.; Chan, A.P.C.; Ameyaw, E.E.; Owusu, E.K.; Pärn, E.; Edwards, D.J. Review of application of analytic hierarchy process (AHP) in construction. Int. J. Constr. Manag. 2019, 19, 436–452. [Google Scholar] [CrossRef]
  29. Hasani Khorshidi, F.; Azizi, M.; Ray, C.; Faezipour, M.M.; Zarea Hosseinabadi, H. An analysis of cleaner production planning by applying analytic hierarchy process: A wood industry case study. Int. J. Sustain. Eng. 2021, 14, 245–254. [Google Scholar] [CrossRef]
  30. Guo, J.; Zhang, Z.B.; Sun, Q.Y. Study and applications of analytic hierarchy process. China Saf. Sci. J. 2008, 18, 148–153. [Google Scholar]
  31. Nana, B.; Zalle, H.; Ouarma, I.; Daho, T.; Yonli, A.; Bere, A. Assessment of carbon dioxide emission factors from power generation in Burkina Faso. Clean Air J. 2023, 33, 1–10. [Google Scholar] [CrossRef]
  32. Tariq, A.I.; Saleh, A.M. An experimental investigation into the combustion properties, performance, emissions, and cost reduction of using heavy and light fuel oils. Case Stud. Therm. Eng. 2023, 44, 102832. [Google Scholar] [CrossRef]
  33. Alawadi, J.F.; Abbasi, G.Y.; Al-Refaie, A. Prioritization of factors influencing outsourcing maintenance decisions in thermal power plants–A case study. J. Qual. Maint. Eng. 2023, 29, 863–876. [Google Scholar] [CrossRef]
  34. Tian, H.; Xu, X.; Lu, C.; Liu, M.; Ren, W.; Chen, G.; Melillo, J.; Liu, J. Net exchanges of CO2, CH4, and N2O between China’s terrestrial ecosystems and the atmosphere and their contributions to global climate warming. J. Geophys. Res. Biogeosci. 2011, 116. [Google Scholar] [CrossRef]
  35. Alrwashdeh, S.S. Investigation of the energy output from PV panels based on using different orientation systems in Amman-Jordan. Case Stud. Therm. Eng. 2021, 28, 101580. [Google Scholar] [CrossRef]
  36. Nijmeh, S.; Hammad, B.; Al-Abed, M.; Bani-Khalid, R. A Technical and Economic Study of a Photovoltaic-phase Change Material (PV-PCM) System in Jordan. Jordan J. Mech. Ind. Eng. 2020, 14, 371–379. [Google Scholar]
  37. Al-Refaie, A. Interpretive Structural Modelling for Implementing Lean and Agile Maintenance Practices Enabled by Industry 4.0. TEM J. 2025, 14, 288–300. [Google Scholar] [CrossRef]
  38. Al-Refaie, A.; Lepkova, N. Satisfaction with rooftop photovoltaic systems and feed-in-tariffs effects on energy and environmental goals in Jordan. Processes 2024, 12, 1175. [Google Scholar] [CrossRef]
  39. Al-Refaie, A.; Lepkova, N. Effects of Overall Satisfaction with PV Systems and Subsidy Policy on Energy Security for Rooftop Buildings Using System Dynamics. In International Conference Modern Building Materials, Structures and Techniques; Springer Nature: Cham, Switzerland, 2023; pp. 517–525. [Google Scholar] [CrossRef]
  40. Al-Refaie, A.; Lepkova, N.; Hadjistassou, C. Using system dynamics to examine effects of satisfaction with PV systems, advertising, and competition on energy security and CO2 emissions in Jordan. Sustainability 2023, 15, 14907. [Google Scholar] [CrossRef]
  41. Al-Refaie, A.; Lepkova, N. Impacts of renewable energy policies on CO2 emissions reduction and energy security using system dynamics: The case of small-scale sector in Jordan. Sustainability 2022, 14, 5058. [Google Scholar] [CrossRef]
  42. Al-Refaie, A.; Lepkova, N. A Fuzzy LARG Indicator for Assessing the Lean, Agile, Resilience, and Green Paradigms in Industrial Companies. Sustainability 2025, 17, 1863. [Google Scholar] [CrossRef]
Figure 1. Cleaner production methodology.
Processes 13 02815 g001
Figure 2. Production flow for NOP.
Processes 13 02815 g002
Figure 3. Inputs–outputs flow diagram for NOP production.
Processes 13 02815 g003
Figure 4. Percentages of raw materials.
Processes 13 02815 g004
Figure 5. Partial unit indices for waste.
Processes 13 02815 g005
Figure 7. Cash flows over the years for the A2 system.
Processes 13 02815 g007
Table 1. Environmental nuisance classification scheme.
Degree TI
LowBelow 5
Medium5–10
High10–15
Very highAbove 15
Table 2. AHP scale and ratings.
ImportanceRating
Extreme importance9
Very strong to extreme importance8
Very strong importance7
Strong importance6
Strong importance5
Moderate to strong importance4
Moderate importance3
Equal to moderate importance2
Equal importance1
Table 3. Raw material quantities.
mRaw Material Tons/Year Rm
1Ammonia 23,4000.20
2Limestone67,2000.56
3Potash105,6000.88
Total196,200
MI196,200/120,000 = 1.64
Table 4. Monthly NOP quantities.
MonthNOP (Ton)MonthNOP (Ton)
January9026.5July9940.3
February11,992.5August8773.4
March11,338.9September10,536.7
April10,553.1October8304.9
May11,201November9455.5
June8903.2December9980.5
Total NOP (tons)120,000
Table 5. Energy quantities and partial unit indices.
ConsumptionVeEe
Energy Source e DeAe
1. HFO (ton)6120 6780.1 67.21.097
2. Electricity (kWh)20,945,000 23,227,799 01.11
Table 6. Toxicity indices for waste types.
Type of WasteToxicityValueEnvironmental Effects
LimestoneLow 0.01No recognized unusual toxicity to plants or animals
Calcium chlorideMedium 0.5Does not biodegrade or bioaccumulate.
Toxic to aquatic life in high concentrations
CO2Medium 1GWP is 1
N2OHigh 273GWP is 273
Table 7. Partial waste generation unit indices.
Waste TypeQuantity (Tons/Year)Toxicity IndicatorPartial Waste Unit IndicatorPartial Unit Indicator
Liquid By-product Calcium Chloride500,400TL = 0.54.17 = 500,400/120 tonLI11 = 2.085
Gaseous Carbon Dioxide19,057.7 (=6120 × 3.114)TG1 = 10.159 (=19,057.7/120,000)GI21e = 0.16
Nitrous Oxide1.1 (=6120 × 0.00018)TG2 = 2730.0092 (=1.1/120,000)GI22e = 2.52
Solid Unreacted limestone2400 TS = 0.01 0.02 = 2400/120 tonSI31 = 0.0002
Table 8. Partial packaging unit indicator for each packaging material.
Packaging Material Partial Packaging Unit Indicator (1)
(×10−3)
Relative Environmental Loading Indicator (2)(1) × (2)
Jumbo bags (1 ton)0.460 (=55,200/120,000)0.450.000207
Jumbo bags (1.2 ton)0.5200.450.000234
Small 25-kg PP bags0.5600.500.000280
Small 25-kg PE bags 2.0000.400.000800
Wooden pallets 10.8000.300.003240
Hooding film 0.3720.600.000223
Packaging unit indicator (KI)0.005
The calculated packaging unit indicator (=0.005) indicates an insignificant environmental nuisance.
Table 9. Solar Thermal system specifications.
ItemAmountUnit
Free space1000Square meters
Solar system capacity that can be installed in the free space100,000Lit/day
Price per solar collector 800JOD
Total number of solar collectors250Evacuated Tube Collectors
The price of solar collectors that can be installed200,000JOD
Table 10. Reductions due to the installation of each system.
ReductionA1A2
HFO consumption (tons/year)120.681-
Electricity consumption (MWh/year)-172.3
CO2 emissions (tons/year)375.6 106
N2O emissions (kg/year)21.685-
Table 11. Pairwise comparison matrix between multiple criteria.
CriteriaCEFWSMPPPR
Cost (C)10.240.201/440.143
Environmental
Effect (EF)
5184583
Warranty (W)0.250.12510.16670.250.250.50
Sensitivity (S)50.25610.2050.25
Maintenance (M)40.2045140.333
Payback Period (PP)0.250.12520.200.2510.167
Performance (PR)70.33324361
Sum 22.52.2332714.56679.9528.255.393
Table 12. Standardized weights for multiple criteria.
CriteriaCEFWSMPPPRSumWeight = Sum/7
C0.04440.08960.14810.01370.02510.14160.02650.5164710.073782
EE0.22220.44780.29630.27460.50250.28320.55633.1784680.454067
W0.01110.05600.03700.01140.02510.00880.09270.2733630.039052
S0.22220.11200.22220.06860.02010.17700.04641.0335550.147651
M0.17780.08960.14810.34320.10050.14160.06171.4764230.210918
PP0.01110.05600.07410.01370.02510.03540.03100.2667520.038107
PR0.31110.14910.07410.27460.30150.21240.18542.0595380.29422
Table 13. Ratings of system alternatives.
Expert Rating
STSPVSTSPV
C (JOD)61,945.09 29,236.6269
EEHFO + N2O
+CO2
CO2
+Electricity
95
W103049
SModerate sensitivity to fluctuationsModerate to high sensitivity to fluctuations96
MLess frequentMore frequent86
PP (Yr)6.57.598
PRHighHigh97
Table 14. Standardized ratings of system alternatives.
STSPVHigher Weight
C (JOD)0.671Lower cost
EE10.56Higher effects on the environment after adoption
W0.441Longer warranty period
S10.67Lower sensitivity
M10.75Lower maintenance
PP (Year)10.87Shorter period
PR10.78Higher performance
Table 15. Overall weights of system alternatives.
CriteriaCEFWSMPPPROverall Weight
Alternative
STS0.0465830.3689890.0153810.1240710.1517970.0351980.2154620.957482
PV0.0698750.2049940.0346080.0827140.1138480.0312870.1675810.704907
Disclaimer/Publisher’s Note: The statements, opinions and data contained in all publications are solely those of the individual author(s) and contributor(s) and not of MDPI and/or the editor(s). MDPI and/or the editor(s) disclaim responsibility for any injury to people or property resulting from any ideas, methods, instructions or products referred to in the content.