Abstract
This study investigates the arc-induced degradation mechanisms of Ag–Ni (90/10) electrical contacts under controlled laboratory cycling conditions using a custom PLC-controlled switching system. The degradation process is characterized by three distinct wear stages: initial arc erosion with localized material removal, a restructuring phase marked by melting and material redistribution, and a final film deposition stage leading to topographical homogenization but functional degradation. Raman spectroscopy confirms progressive nickel oxide and carbonaceous contamination, correlating with contact resistance trends that exhibit multi-phase behavior. Subsurface analysis reveals critical structural damage at mid-life cycles, emphasizing the importance of preventive maintenance. The findings advance understanding of wear mechanisms in Ag–Ni contacts and provide insights into optimizing their service life in industrial switching applications.
1. Introduction
Silver–nickel (Ag–Ni) electrical contact materials have been widely used in a broad range of switching devices—including household appliances, contactors, miniature circuit breakers, and automotive relays—due to their advantageous combination of high electrical conductivity, low and stable contact resistance, excellent machinability, and environmental non-toxicity [1,2]. Despite these favorable properties, Ag–Ni contacts exhibit a strong tendency to weld under high current and elevated temperature conditions, compromising their reliability and service lifetime [3,4,5]. This welding is closely associated with arc erosion phenomena that occur during make-and-break operations, leading to material transfer, surface degradation, and ultimately performance deterioration [6].
Extensive investigations have examined the arc erosion behavior of Ag–Ni contacts in order to enhance welding resistance and improve service life. Prior studies have analyzed the influence of voltage on arc characteristics, duration, and electrode mass loss, while others have highlighted significant local material transfer under varying loads and current intensities [7]. Additional research has explored lifetime prediction based on arc energy and cathode losses, provided insights into welding tendencies [8] and contact forces under resistive loads, and compared fabrication techniques such as mechanical alloying, powder metallurgy, and chemical coating, each of which significantly affects welding resistance and arc erosion characteristics [9,10]. The addition of brittle phases and rare earth elements has also been shown to improve electrical performance, particularly by mitigating material transfer issues.
Despite this substantial body of work on the manufacturing and improvement of Ag–Ni contacts [11,12,13,14], there remains limited understanding of elemental distribution and residual layer formation mechanisms within the molten pool generated during arc erosion. Residual layers formed by molten and re-solidified material critically influence contact properties by altering surface morphology, resistance, and arc stability [15]. Several distinct morphologies resulting from arc erosion have been identified [16,17], yet the precise formation mechanisms and elemental segregation processes governing these residual layers remain insufficiently understood.
In particular, the spatial distribution of alloying elements after arc-induced melting and re-solidification is poorly characterized. This gap hampers the development of predictive models for arc corrosion and limits the optimization of Ag–Ni contacts for enhanced erosion resistance [18,19,20,21]. A deeper understanding of these residual layer characteristics is therefore essential for improving contact durability and ensuring stable electrical performance under demanding operating conditions.
The present study addresses this knowledge gap by conducting a detailed analysis of the corrosive processes induced by electrical arcs on Ag–Ni contacts, focusing on the composition and distribution of residual layers after arc erosion. Through comprehensive microstructural and elemental characterization, we aim to clarify the mechanisms governing residual layer formation and their impact on contact performance. These findings provide new insights into arc erosion phenomena in Ag–Ni systems and will inform the design of advanced contact materials with superior welding resistance and extended service life.
2. Materials and Methods
2.1. The Arc Erosion of Contacts
In an electrical device, the contacts are formed by two distinct components: the fixed contact and the mobile contact. The actual surface through which electric current flows is not perfectly smooth; instead, it exhibits an initial roughness resulting from the mechanical manufacturing process. Consequently, the real contact surface consists of the sum of many microscopic contact spots.
This can be expressed mathematically as:
where:
Ac is the real contact area, F is the applied normal force, s is the material hardness (or specific contact resistance parameter, depending on context).
The studied contact can be seen in Figure 1, with the fixed part, the anode, having a surface made up of raised ridges and recessed channels, forming small discrete contact points. These protrusions are likely the asperities that make the initial electrical contact with the opposite electrode. On the other hand, the anode is different. Its shape is curved, the edges are slightly beveled, and the overall geometry suggests it’s designed for uniform contact over its full area when pressed against the opposing electrode.
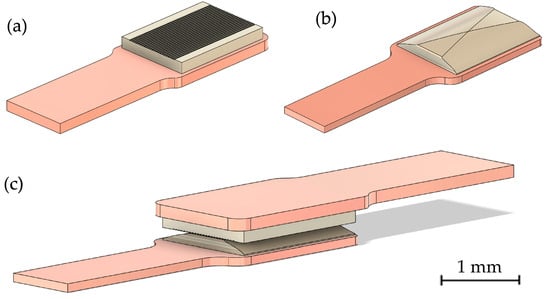
Figure 1.
3D Model of our contact, (a) the anode, (b) the cathode, and (c) the assembled contact.
In Figure 2, a perfect contact is depicted, representing an idealized interface between electrical contacts with no surface imperfections, roughness, or material degradation. The contact resistance is assumed to be negligible, allowing electrical current to flow without losses. It can be observed that the current density is concentrated predominantly at the edges.
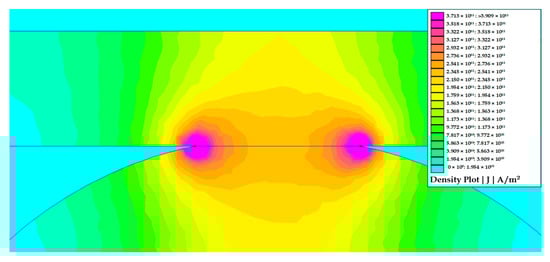
Figure 2.
Simulated current density field on perfect contact.
In contrast, Figure 3 illustrates a simulation incorporating the actual geometry of the contact material, where the current density is elevated at the edges of each recessed channel. These localized regions may act as preferential sites for arc initiation. As the current density increases at these points, they experience the highest levels of Joule heating, potentially accelerating material degradation and erosion. The results are similar to those in other studies [22,23,24,25].
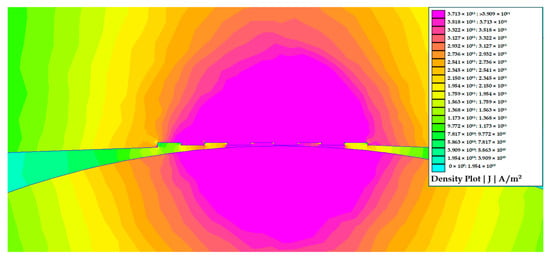
Figure 3.
Simulated current density on imperfect contact.
2.2. Contactor Arc Corrosion Test Bench
Arc-induced contact degradation was studied using a custom-built automated switching system designed specifically for this investigation. The setup integrates a programmable logic controller (PLC), an industrial Ag–Ni 90/10 alloy 3-pole contactor rated at 3.3 kW, and a 1200 W resistive load supplied by a 230 V AC source, resulting in a contact current of approximately 5.2 A. The contactor applies a contact force of approximately 30 N, representative of typical industrial devices. The system cycles the contactor under load with a fixed timing sequence of 2 s ON (coil energized, contacts closed) followed by 2 s OFF (coil de-energized, contacts open), completing one full switching cycle every 4 s. The PLC controls the timing, counts each cycle, and automatically halts the test after 9000 cycles. Although the bulk contact temperature remained near ambient, localized arc-induced heating at the contact interface led to contact welding, highlighting the conditions under which degradation occurs.
The resistive load ensures consistent arc conditions during each opening event, facilitating reproducible arc energy and mechanical stress on the contacts. The Ag–Ni 90/10 (silver-nickel) contacts are commonly used in industry due to their favorable electrical conductivity and arc erosion resistance.
Since the contactor is a sealed commercial device, destructive disassembly is required for direct microscopic inspection of the contacts. Inspections are performed after 3000, 6000, and 9000 cycles, at which points the contactor is removed and dismantled for detailed surface analysis. Contact surfaces are examined using optical microscopy and high-resolution imaging to assess pitting, erosion, material transfer, and oxidation caused by electrical arcing. Experiments are conducted under laboratory ambient conditions (22–26 °C, 45–55% RH), which are continuously monitored to ensure stability. The laboratory environment contains minimal volatile hydrocarbons, with no significant sources of solvents present, to reduce carbonaceous deposition. All components are mounted on a steel panel with passive ventilation. The test system schematic is illustrated in Figure 4.
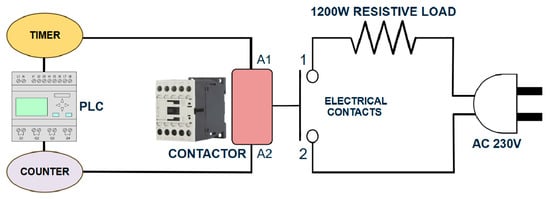
Figure 4.
Contactor Arc Corrosion Test Bench Schematic.
2.3. Equipment Used
The contact surfaces were analyzed using a Keyence VK-X3000 3D Laser Scanning Microscope (Keyence, Mechelen, Belgium). High-resolution topographical images were acquired and processed using the manufacturer’s proprietary software, Keyence VK300 Multifile Analyzer (Version 1.5.7). To obtain detailed cross-sectional profiles of the contact wear, a resin molding technique was employed: the contacts were positioned upright within the resin mold and, after curing, progressively ground using a Struers Laboforce 100 disk grinder (Struers A/S, Ballerup, Denmark) with a series of abrasives until the contact center was exposed. Each inspection after 3000, 6000, and 9000 cycles was performed on a separate contact sample, as the destructive cross-sectional analysis prevented reuse of the same electrode. Non-destructive surface scans were performed on the same electrode prior to cross-sectional analysis. This method allowed precise measurement and visualization of subsurface erosion and material loss. The typical cross-sectional profile of the contact wear obtained using this methodology is illustrated in Figure 5.
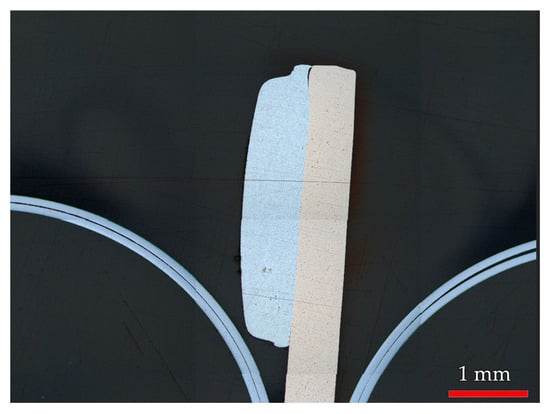
Figure 5.
Wide Field of View cross-sectional profile of the contact incased in resin for observation.
Contact resistance was measured using a Fluke 8846A Micro-Ohmmeter (Fluke Corporation, Everett, WA, USA), in accordance with IEC 60947-4-1, which outlines testing methods for contactors and motor starters. Multiple samples were tested at each inspection interval to ensure statistical significance and reproducibility.
Chemical characterization of the contact surfaces was performed using an Ocean View HDX Raman Spectrometer equipped with a 785 nm laser excitation source (Ocean Insight, Orlando, FL, USA). This setup enabled high-definition spectral mapping to identify surface compounds formed due to electrical arcing, such as oxides and carbonaceous deposits. Spectral data were acquired and analyzed using the manufacturer’s software, providing insights into the chemical changes occurring on the contact material throughout the switching cycles.
3. Results
3.1. Surface Analysis
The evolution of surface roughness and morphology in Ag–Ni electrical contacts was investigated over 0 (reference), 3000, 6000, and 9000 switching cycles using combined optical microscopy and 3D profilometry. The reference surface exhibited a baseline roughness of Ra = 23.35 µm and Rq = 27.57 µm, consistent with the inherent micro texture of the Ag–Ni sintered alloy. The reference surface in 2D and 3D can be seen in Figure 6.
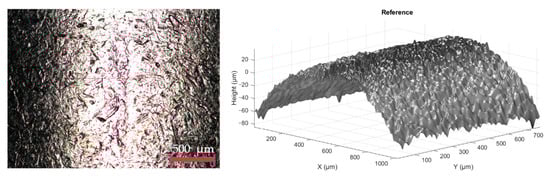
Figure 6.
The reference surface, no uses.
After 3000 operational cycles, the Ag–Ni contact surface exhibited a distinctive hourglass-shaped wear pattern characterized by a narrowed central region of pronounced erosion flanked by broader, less damaged zones. This morphology, seen in Figure 7, reflects localized arcing concentrated at the contact’s high-pressure core, where elevated current density induces intense thermal and mechanical stress, resulting in material ablation and initial carbonaceous residue formation. The tapering of the central wear zone indicates uneven mechanical contact pressure, likely caused by slight misalignment or actuator dynamics, which concentrates arc activity centrally while peripheral regions experience reduced stress. Additionally, the broader lobes at the ends of the hourglass suggest material re-deposition and arc root migration, where vaporized metal and degradation byproducts condense away from the peak erosion site.
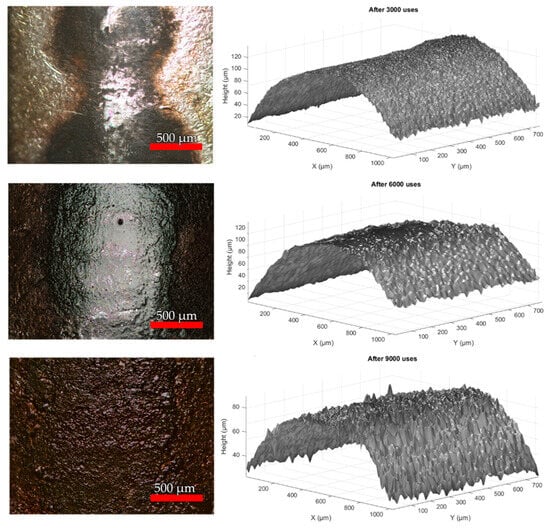
Figure 7.
The surface after 3000, 6000, and 9000 uses (top to bottom).
After 3000 operations, localized arc-induced erosion and thermal protuberances resulted in increased surface unevenness (Ra = 25.45 µm; +9.0%), indicating the onset of mechanical and thermal wear. Continued cycling to 6000 uses further elevated the roughness to Ra = 26.06 µm (+11.6%), coupled with the appearance of a central flattened zone surrounded by raised deposits, consistent with arc material redistribution and surface restructuring. By 9000 cycles, Ra decreased markedly to 21.02 µm (−20% relative to 6000 cycles), reflecting a surface smoothing effect attributed to progressive accumulation of carbonaceous degradation layers and loss of asperities through mechanical burnishing or oxidation-driven sealing. This non-linear evolution in roughness metrics suggests a three-stage wear mechanism: (i) initial arc erosion, (ii) surface restructuring via material migration, and (iii) terminal phase dominated by film deposition and topographical homogenization.
3.2. Contact Area Evolution and Profile Analysis
By analyzing Figure 8, we can observe that the degradation of Ag–Ni electrical contacts under repeated operational cycling exhibits a progressive reduction in contamination-free surface area, decreasing from 5.91% (3000 cycles) to 3.78% (6000 cycles), with visual evidence of near-complete surface coverage by 9000 cycles—representing a 36% loss in clean contact area. This decline follows a nonlinear degradation trajectory characterized by three distinct wear regimes: an early localized arcing phase (0–3000 cycles, −5.91%) dominated by initial formation of carbonaceous residues at high-current contact points; an accelerated fouling phase (3000–6000 cycles, −36%) where arc-induced thermal decomposition and material transfer promote deposit propagation; and a saturation phase (6000–9000 cycles) in which cumulative surface coverage and increased roughness inhibit further clean area recovery, potentially compromising electrical conductivity and mechanical reliability.
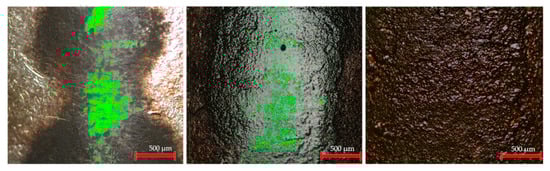
Figure 8.
Carbonaceous byproduct accumulation at 3000, 6000, and 9000 uses (left to right).
The average height profiles, seen in Figure 9, of the Ag–Ni contact surfaces reveal distinct morphological changes with increased usage cycles. The reference profile shows a smooth, symmetric curvature with height variation ranging approximately from −20 µm to +35 µm, indicative of the original surface micro texture. After 3000 cycles, the profile exhibits a marked increase in peak height, reaching over 110 µm, reflecting localized surface protrusions and arc erosion consistent with the hourglass wear pattern. At 6000 cycles, the height profile further intensifies, with peaks exceeding 130 µm and noticeable flattening near the edges, indicative of material redistribution and deposit buildup around the contact area. Conversely, the 9000-cycle profile demonstrates a substantial reduction in height variation, returning closer to baseline levels (~−10 to +30 µm), suggesting surface smoothing due to progressive coverage by carbonaceous films and mechanical burnishing. These trends corroborate the nonlinear wear mechanism where initial arc erosion and material deformation are followed by deposition and surface homogenization, ultimately impacting contact reliability.
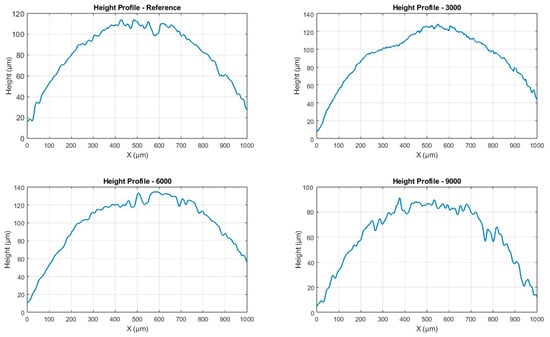
Figure 9.
The Average Height profile after 0 (reference), 3000, 6000, and 9000 uses.
3.3. Raman Spectometry
Raman spectroscopy was employed to investigate the evolution of surface chemistry on Ag–Ni electrical contacts subjected to mechanical and electrical stress at 3000, 6000, and 9000 operational cycles. The spectra, recorded in the 200–2000 cm−1 range using a 785 nm excitation source, reveal clear trends associated with progressive oxidation and contamination, and can be seen in Figure 10.
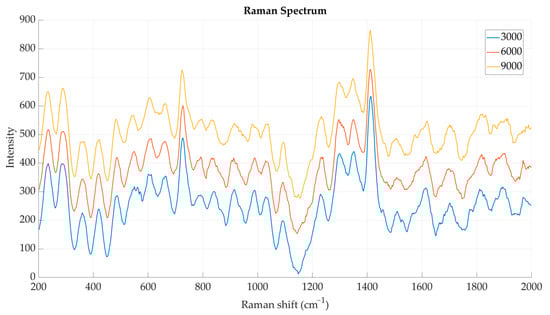
Figure 10.
Raman spectrum after 3000, 6000, and 9000 uses.
All spectra exhibit characteristic peaks attributable to both nickel oxide (Ni-O) and surface carbonaceous species. Prominent features observed near ~470 cm−1 are consistent with Ni-O lattice vibrational modes, suggesting the formation and growth of a Ni-O phase. Additional peaks around ~1070 cm−1 may be attributed to surface-bound nitrate or carbonate groups, likely resulting from environmental exposure or electrochemical processes during switching.
The higher wavenumber region reveals pronounced peaks near 1350 cm−1 (D band) and 1580 cm−1 (G band), which are diagnostic of disordered and graphitic carbon, respectively. These bands indicate progressive accumulation of carbon residues, possibly arising from thermal decomposition of hydrocarbons. The evolution of the carbon residue can be seen in Figure 11.
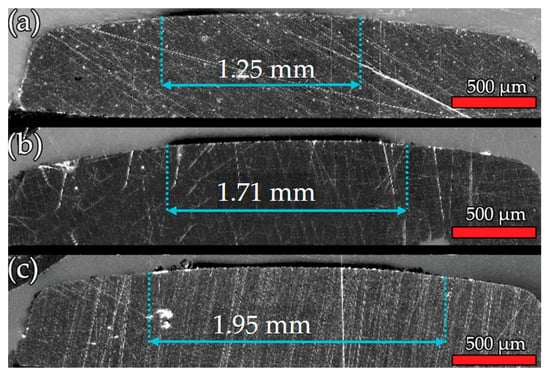
Figure 11.
Cut Profile of the sample after (a) 3000 uses, (b) 6000 uses, and (c) 9000 uses.
The width of the affected region progressively increases from 1.25 mm in (a) to 1.71 mm in (b), and further to 1.95 mm in (c), representing a total increase of approximately 56% from (a) to (c). This widening is attributed to the mechanical pressure applied by the contactor, which induces surface deformation and promotes expansion of the affected zone. Correspondingly, the surface shows increasing accumulation of a carbonaceous deposit, predominantly localized along the edges. This deposit forms a relatively smooth and continuous layer with an irregular boundary that conforms to the surface morphology. The thickness and coverage of the carbonaceous layer increase from (a) through (b) to (c), reflecting enhanced deposition due to prolonged or intensified frictional contact coupled with mechanical stress. These combined effects contribute to the evolving surface morphology and tribological characteristics of the material.
3.4. Profile Analysis
Using LC Microscope Laser Scan, we can observe the profile of the sample in Figure 12. The Ag–Ni electrical contact after 3000 operational cycles exhibits a relatively shallow damaged zone, with an estimated residual layer thickness of ~8–12 µm and minimal porosity. The surface–substrate interface is smooth, and the underlying grain structure remains largely intact, indicating an early localized erosion phase dominated by limited arc-induced melting and rapid resolidification. Defect density is low, with few isolated dark inclusions likely corresponding to oxide or contaminant particles. This stage reflects an initial wear regime in which electrical conductivity and mechanical cohesion are largely preserved, and welding propensity remains minimal.
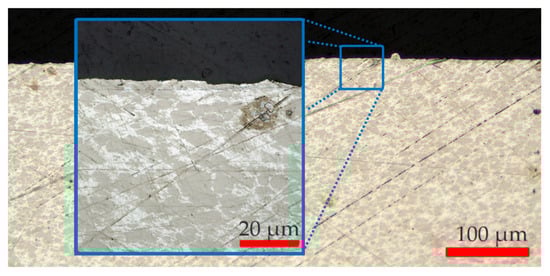
Figure 12.
Profile of the sample after 3000 cycles.
By analyzing Figure 13, we can observe that the Ag–Ni electrical contact after 6000 operational cycles shows the most severe degradation, with a residual layer thickness of ~25–35 µm and widespread porosity concentrated near the surface. The interface is highly irregular, with numerous voids and inclusions indicative of turbulent molten-pool flow, oxide entrapment, and rapid solidification during intense arc events. This condition corresponds to an accelerated degradation phase in which cumulative thermal and mechanical stresses promote deep material disruption, significant contact roughening, and high defect density. These features are expected to substantially elevate contact resistance, destabilize arc behavior, and markedly increase welding risk.
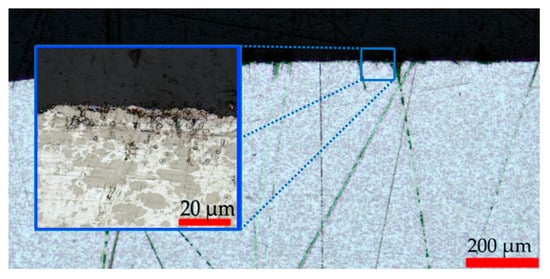
Figure 13.
Profile of the sample at 6000 cycles.
Lastly, looking at Figure 14, we can observe that the Ag–Ni electrical contact after 9000 operational cycles presents a thickened residual layer of ~30–40 µm with localized but pronounced surface irregularities. While the overall porosity appears less uniformly distributed than at 6000 cycles, discrete dark inclusions and directional re-solidification features remain evident, indicating repeated remelting and partial defect coalescence. This stage represents a stabilization phase in which defect growth slows, but cumulative surface roughness and oxide-rich regions continue to impair electrical and mechanical performance. The contact interface at this stage is mechanically less cohesive, with a sustained risk of welding under high-load switching.
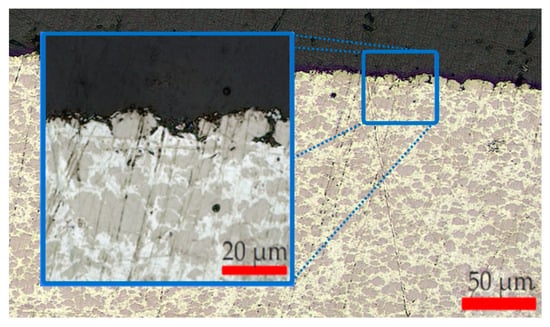
Figure 14.
Profile of the sample at 9000 cycles.
3.5. Contact Resistance
Contact resistance of the Ag–Ni contact increases progressively with usage, starting from an initial value of 0.12 Ω and rising to 1.35 Ω after 9000 cycles. The rate of resistance increase exhibits distinct phases, with an early moderate rise reaching a peak near 1000 uses, corresponding to initial surface wear and mild oxide formation. This is followed by a relatively stable period with minimal rate change until approximately 6000 uses, indicating a temporary stabilization of the contact interface. Beyond this, a pronounced acceleration in resistance growth occurs between 6000 and 8000 uses, where the rate peaks sharply, suggesting significant degradation mechanisms such as pronounced oxide layer growth, material transfer, and increased surface roughness leading to poor electrical contact. A tertiary, smaller peak around 8300 uses points to localized wear or microstructural changes prior to ultimate contact failure. This multi-phase behavior reflects initial conditioning, transient stabilization, and progressive wearout typical of Ag–Ni contacts under repeated mechanical and electrical stress.
In Figure 15, the contact resistance increases rate next to a Gaussian fit that can describe the event using the following mathematical equation:
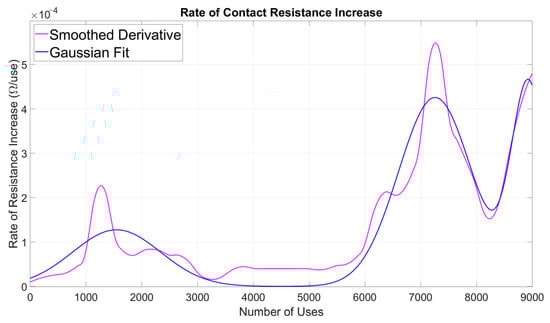
Figure 15.
Rate of Resistance Increase with Use.
To get the contact resistance itself, R, we will integrate over usage x and add the initial resistance, shown in Figure 16, next to the measured data
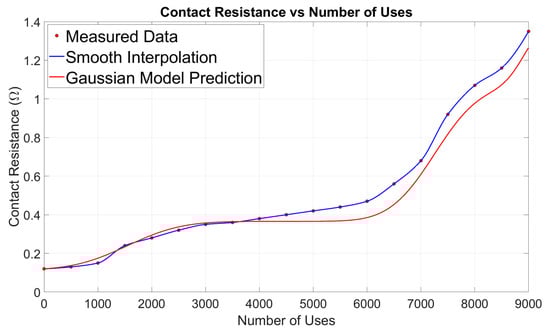
Figure 16.
Measured contact resistance vs. predicted.
The rate of contact resistance increase for the Ag–Ni contact demonstrates a multi-modal behavior across its usage lifetime. An initial moderate peak around 1000 uses suggests early-stage surface changes, likely due to initial wear and formation of oxide films. This is followed by a prolonged phase of low and stable rate from roughly 2000 to 6000 uses, indicating a temporary equilibrium in contact surface conditions. Beyond 6000 uses, a pronounced and sharper peak emerges near 7000–7500 uses, representing accelerated degradation possibly driven by rapid oxide growth, increased surface roughness, and mechanical wear. A third, smaller but distinct peak near 8300 uses indicates localized wear mechanisms or microstructural changes prior to the contact’s end-of-life. The Gaussian fit accurately models these distinct degradation stages, reinforcing the presence of separate physical processes influencing the resistance increase rate during extended usage.
4. Discussion
The investigation into arc-induced degradation of Ag–Ni (90/10) electrical contacts under controlled laboratory cycling conditions provides a clear view of the progressive wear mechanisms affecting industrial switching devices. The custom-built PLC-controlled switching system ensured precise, repeatable operating conditions and enabled monitoring of the degradation process at well-defined intervals of 3000, 6000, and 9000 cycles. This setup allowed a direct correlation between operational history, morphological evolution, subsurface damage, and functional performance metrics such as contact resistance.
Microscopic and profilometric analyses revealed a three-stage wear process:
- Stage 1—Initial arc erosion (0–3000 cycles): Localized material removal occurred at the high-pressure central zone, producing a distinct hourglass-shaped wear pattern. This morphology reflected the high current density and localized thermal stress at the contact core, consistent with early-stage crater formation and molten metal ejection previously observed in Ag–SnO2 [26] and Ag–Ni systems [27]. At this stage, carbonaceous residues began to appear, but surface coverage remained partial. Surface roughness increased by approximately 9% compared with the as-received condition, indicating the formation of thermal protrusions and micro-craters caused by arc impact. Similar roughening in the initial wear stage has been documented in Ag–TiB2 [28] and WC-reinforced Ag systems [29], where molten splashing dominates material loss.
- Stage 2—Restructuring and accelerated fouling (3000–6000 cycles): Arc-induced melting and re-solidification redistributed material toward the periphery while flattening the central contact area. Raised deposits formed at the edges, and widespread porosity developed. Surface roughness peaked at 26.06 μm, corresponding to the most morphologically irregular phase. The contamination-free surface area decreased sharply, indicating accelerated fouling. Residual layer growth was highly heterogeneous—a known driver of localized corrosion and unstable arc behavior in Ag–Ni [30] and Ag–CuO contacts [31]. Comparable “skeleton restructuring” and gradient-driven material migration have been reported in Ag–CuO systems under repetitive arcing [32] and in Ag–Ni arc erosion studies where residual layers thicken to ~8 μm [33].
- Stage 3—Film deposition and topographical homogenization (6000–9000 cycles): Surface roughness decreased to 21.02 μm as carbonaceous and oxide films progressively covered the contact area, smoothing asperities. However, this apparent surface improvement was misleading—the smoothing resulted from insulating film deposition rather than mechanical restoration. Similar late-life homogenization due to oxide-rich film buildup has been observed in Ag–Ni–La2Sn2O7 [34] and Ag2WO4-doped Ag–Ni contacts [35].
Raman spectroscopy confirmed a progressive increase in both nickel oxide formation and carbonaceous contamination throughout the cycling period. The characteristic D and G bands at 1350 cm−1 and 1580 cm−1 grew in intensity over time, indicating accumulation of disordered and graphitic carbon from arc-induced decomposition of airborne hydrocarbons. The affected zone widened from 1.25 mm at 3000 cycles to 1.95 mm at 9000 cycles, highlighting the role of mechanical pressure in propagating contamination—a trend also noted in contact pressure studies on Ag–Ni erosion morphology [36].
The contact resistance exhibited a multi-modal evolution. An initial gradual increase (~1000 cycles) corresponded to oxide film growth and asperity reshaping. A stable plateau persisted until ~6000 cycles, after which resistance rose sharply due to accelerated oxide and carbonaceous layer thickening combined with roughness-related constriction. A third, smaller resistance peak around 8000 cycles suggested localized microstructural disruptions prior to end-of-life failure. Similar resistance instability, with increases exceeding 400% under certain operating conditions, has been reported in low-voltage Ag–Ni relays [37].
Interestingly, some DC switching studies report a resistance recovery phenomenon after 10,000 operations [27], potentially linked to reduced arc severity or self-healing surface effects—conditions unlikely in the present high-load AC environment. Alloying Ag–Ni with Ge, V, or Ta has been shown to reduce resistance fluctuations and enhance thermal stability [38], underscoring the influence of material composition on degradation pathways.
Metallographic analysis revealed that the most severe structural degradation occurred at ~6000 cycles, where molten-pool turbulence, void formation, and oxide entrapment were most prevalent. By 9000 cycles, porosity became more localized, but the residual layer thickened and exhibited repeated remelting features. Such microstructural changes reduce interfacial cohesion and increase the likelihood of contact welding under high-load switching—a failure mode also noted in Ag–CNT [13] and Ag–Ni–graphene composites [39], where reinforcing phases can mitigate but not eliminate arc-induced remelting.
From a service-life perspective, the results confirm that the most severe combined mechanical and chemical degradation occurs in the mid-life stage (~6000 cycles), before complete surface coverage or catastrophic failure. This finding aligns with lifetime prediction models for Ag-based systems [40], which emphasize that residual layer properties (thickness, uniformity, and composition) largely determine the transition from functional stability to rapid failure. The apparent late-life smoothing is deceptive, as it results from insulating deposits rather than restored conductivity.
From an industrial standpoint, the study shows that Ag–Ni (90/10) contacts experience the most severe degradation around mid-life (~6000 cycles), suggesting that inspections and replacements should focus on this stage. Monitoring surface morphology and contact resistance can guide condition-based maintenance, while material optimization—through alloying or surface treatments—can reduce arc-induced fouling and welding. These insights help improve reliability and minimize unexpected downtime in industrial switching devices.
Although this study focuses on Ag–Ni (90/10) contacts with a specific geometry, future work comparing other contact materials and geometries is needed to generalize these findings and identify strategies for improved contact performance. Consequently, condition-based monitoring of both surface morphology and resistance trends is essential for the reliable industrial application of Ag–Ni contacts.
5. Conclusions
The present work advances the understanding of Ag–Ni (90/10) electrical contact degradation by providing a cycle-resolved, mechanistic view of arc erosion under precisely controlled laboratory conditions. While previous studies have examined end-of-life morphologies or average wear rates, this investigation isolates distinct operational stages, combines morphological data with chemical and electrical performance metrics, and reveals transitional behaviors with direct implications for maintenance strategies.
Three key findings highlight the novelty and practical significance of this study:
- Cycle-resolved wear mapping: This study is the first to clearly define and characterize a three-stage arc erosion sequence in Ag–Ni (90/10) under controlled PLC-monitored cycling (0–3000, 3000–6000, and 6000–9000 cycles), linking each morphological transition to quantitative roughness, contamination spread, and Raman spectroscopic signatures.
- Mid-life degradation peak identification: The work pinpoints ~6000 cycles as the critical “wear acceleration” point where morphological irregularity, porosity, and contact resistance growth converge—a stage that precedes catastrophic failure yet represents the optimal window for preventive maintenance or replacement.
- Deceptive late-life surface smoothing: The research demonstrates that topographical homogenization in the late-life stage is driven by insulating oxide–carbon film build-up rather than restorative wear, overturning assumptions that smoother end-of-life surfaces imply performance recovery.
While this study provides a detailed, stage-resolved understanding of Ag–Ni (90/10) degradation, further work is needed to extend these findings toward improved contact design and predictive maintenance strategies. Future research should investigate the effects of targeted alloying and doping—such as the addition of Ge, V, Ta, CNTs, or graphene—on shifting or suppressing the mid-life degradation peak identified at ~6000 cycles. Incorporating in-situ diagnostics, including optical emission spectroscopy, infrared thermography, and acoustic sensing, could enable real-time detection of transitions into critical wear stages. Moreover, experiments conducted under varying humidity, pressure, and atmospheric compositions would clarify the role of environmental factors, particularly airborne hydrocarbons and oxygen, in residual layer chemistry. Finally, integrating the morphological, chemical, and electrical datasets from this and similar studies into predictive lifetime models could provide more accurate forecasts of contact performance across diverse industrial operating conditions.
Author Contributions
Conceptualization, C.-O.S. and A.-D.T.; methodology, C.-O.S.; software, A.-D.T., T.O.C. and V.-A.M.; validation, C.-O.S., A.-D.T., T.O.C., V.-A.M. and M.-N.A.; formal analysis, C.-O.S.; investigation, A.-D.T. and T.O.C.; resources, M.-N.A., L.B. and F.-I.H.; data curation, A.-D.T. and V.-A.M.; writing—original draft preparation, C.-O.S. and A.-D.T.; writing—review and editing, C.-O.S.; visualization, M.-N.A. and F.-I.H.; supervision, C.-O.S. and L.B.; project administration, C.-O.S. and A.-D.T.; funding acquisition, M.-N.A. All authors have read and agreed to the published version of the manuscript.
Funding
This work is part of the Research Fund of the University of Oradea and the project: Developing solutions and proposing recommendations to prevent premature degradation of electrical equipment and cables during use, to improve long-term durability and reliability. PREDELCAB 08/01.04.2025, Research Fund of the University of Oradea.
Data Availability Statement
The original contributions presented in this study are included in the article. Further inquiries can be directed to the corresponding authors.
Conflicts of Interest
The authors declare no conflicts of interest.
References
- Braunovic, M.; Myshkin, N.K.; Konchits, V.V. Electrical Contacts: Fundamentals, Applications and Technology; CRC Press: Boca Raton, FL, USA, 2007. [Google Scholar] [CrossRef]
- Kawakami, Y.; Hasegawa, M.; Watanabe, Y.; Sawa, K. An investigation for the method of lifetime prediction of Ag–Ni contacts for electromagnetic contactor. In Proceedings of the Fifty-First IEEE Holm Conference on Electrical Contacts, Chicago, IL, USA, 26–28 September 2005; IEEE: New York, NY, USA, 2005; pp. 151–154. [Google Scholar] [CrossRef]
- Yoshida, K.; Sawa, K.; Suzuki, K.; Watanabe, M. Influence of Voltage on Arc Characteristics and Electrode Mass Change of AgNi Contacts for Electromagnetic Contactors. IEICE Trans. Electron. 2011, 94, 1395–1401. [Google Scholar] [CrossRef]
- Wathanyu, K.; Rojananan, S. Microstructure, Hardness and Electrical Conductivity of Silver-Metal Oxides Electrical Contact Materials. Adv. Mater. Res. 2012, 486, 529–532. [Google Scholar] [CrossRef]
- Huang, R.; Xu, G.; Zhao, C.; Wu, Q.; Yu, L.; Wu, C. Influence of Ni content on arc erosion behavior of Ag/Ni electrical contact materials. J. Mater. Sci. Mater. Electron. 2023, 34, 1053. [Google Scholar] [CrossRef]
- Fei, Y.; Wang, X.; Zhao, N.; Li, H.; Liu, J.; Li, H.; Qiu, Y. Improving arc erosion resistance of AgNi electrical contact material by a three-dimensional graphene network. Powder Technol. 2025, 457, 120902. [Google Scholar] [CrossRef]
- Książkiewicz, A.; Dombek, G.; Nowak, K. Change in Electric Contact Resistance of Low-Voltage Relays Affected by Fault Current. Materials 2019, 12, 2166. [Google Scholar] [CrossRef]
- Morin, L.; Jemaa, N.B.; Jeannot, D. Make arc erosion and welding in the automotive area. IEEE Trans. Compon. Packag. Manuf. Technol. 2000, 23, 240–246. [Google Scholar] [CrossRef]
- Miao, Y.; Li, J.; Wang, J.; Zhang, M.; Dai, S.; Chen, F.; Zhu, L. Effect of Y2O3 on electric performance of Ag–SnO2–Y2O3 composite electrical contact materials. J. Mater. Sci. Mater. Electron. 2025, 36, 575. [Google Scholar] [CrossRef]
- Swingler, J.; Sumption, A. Arc erosion of AgSnO2 electrical contacts at different stages of a break operation. Wear 2010, 29, 248–254. [Google Scholar] [CrossRef]
- Lin, Z.J.; Gao, W.H.; Li, S.Y.; Shen, Q.; Dai, P.Q.; Zou, L.C.; Chen, H.X.; Sun, X.D. Effect of in-situ phase transition of (MgCoNiCuZn)O high-entropy oxides on microstructure and performance of Ag-based electrical contact materials. Appl. Surf. Sci. 2023, 630, 157479. [Google Scholar] [CrossRef]
- Nie, H.L.; Wang, Z.; Xue, X.Y.; Yu, C.H.; Wang, J.; Wen, K.; Xu, C.H. Designing sandwich-structured Ag–SnO2 contact materials: Overcoming the trade-off between erosion resistance and mechanical properties. Ceram. Int. 2024, 50, 2950–2962. [Google Scholar] [CrossRef]
- Lin, Z.J.; Liu, S.H.; Li, J.G.; Chen, J.L.; Xie, M.; Li, X.D.; Zhang, M.; Zhu, Q.; Huo, D.; Sun, X.D. Morphology-controllable synthesis and thermal decomposition of Ag and Ni oxalate for Ag–Ni alloy electrical contact materials. Mater. Des. 2016, 108, 640–647. [Google Scholar] [CrossRef]
- Yan, T.T.; Yang, W.; Wu, L.M.; Fang, X.S. High-work-function transparent electrode with an enhanced air-stable conductivity based on AgNiCu core-shell nanowires for Schottky photodiode. J. Mater. Sci. Technol. 2025, 209, 95–102. [Google Scholar] [CrossRef]
- Messaoud, A.; Fazel, N.; Garoux, L.; Gasser, F.; Ben Younes, R.; Gasser, J.G. A new high temperature design to determine electrical and thermal conductivities and thermoelectric power. Applications to the sintered composite AgNi (90/10) “pseudo-alloy”. J. Alloys Compd. 2018, 739, 407–417. [Google Scholar] [CrossRef]
- Jablonski, P.D.; Alman, D.E. Oxidation Resistance and Mechanical Properties of Experimental Low Coefficient of Thermal Expansion (CTE) Ni-Base Alloys. Int. J. Hydrogen Energy 2007, 32, 3705–3712. [Google Scholar] [CrossRef]
- Li, W.-J.; Jiang, H.; Li, B.-T.; Chen, Z.-Y.; Zhen, L.; Jia, S.-Y.; Wang, H.-P.; Shao, W.-Z. Advanced Investigations on Ag-Based Electrical Contact Materials. Mater. Today Phys. 2024, 40, 101333. [Google Scholar] [CrossRef]
- Zhou, Z.; Yang, Z.; Wu, Y.; Liu, L. Advanced Vacuum Processing Techniques for Electrical Contact Materials. Vacuum 2024, 220, 112821. [Google Scholar] [CrossRef]
- Zhou, X.; Chen, L.; Liu, M.; Yu, J.; Xiong, D. Effects of NiO Content on the Microstructure and Mechanical Properties of AgSnO2NiO Composites. Sci. Eng. Compos. Mater. 2019, 26, 221–229. [Google Scholar] [CrossRef]
- Lungu, M.; Gavriliu, S.; Patroi, D.; Lucaci, M. Some Considerations Concerning the Obtaining of Some Ag-SnO2; Sintered Electrical Contacts for Low Voltage Power Engineering Switching Devices. Adv. Mater. Res. 2007, 23, 103–106. [Google Scholar] [CrossRef]
- Li, G.; Fang, X.; Feng, W.; Liu, J. In Situ Formation and Doping of Ag/SnO2 Electrical Contact Materials. J. Alloys Compd. 2017, 716, 106–111. [Google Scholar] [CrossRef]
- Li, Y.-H.; Shen, F.; Ke, L.-L. Multi-Physics Electrical Contact Analysis Considering the Electrical Resistance and Joule Heating. Int. J. Solids Struct. 2022, 256, 111975. [Google Scholar] [CrossRef]
- Stanislaw, K.; Grzegorz, S. Study of Contact of Rough Surfaces: Modeling and Experiment; Institute of Fundamental Technological Research, PAS: Warsaw, Poland, 2014; Volume 311, pp. 167–179. [Google Scholar] [CrossRef]
- Riba, J.-R.; Mancini, A.-G.; Abomailek, C.; Capelli, F. A 3D-FEM-Based Model to Predict the Electrical Constriction Resistance of Compressed Contacts. Measurement 2018, 114, 44–50. [Google Scholar] [CrossRef]
- Andras, A.; Popescu, F.D.; Radu, S.M.; Pasculescu, D.; Brinas, I.; Radu, M.A.; Peagu, D. Numerical Simulation and Modeling of Mechano–Electro–Thermal Behavior of Electrical Contact Using COMSOL Multiphysics. Appl. Sci. 2024, 14, 4026. [Google Scholar] [CrossRef]
- Swingler, J.; Sumption, A. Characterization of Contact Resistance Behavior of Low-Voltage Switching Devices. J. Phys. D Appl. Phys. 2010, 43, 245201. [Google Scholar] [CrossRef]
- Han, X.; Li, G.; Lu, H.; Feng, W. Arc erosion behaviors of the densified Ag-SnO2 contact materials containing sub-micron and nano In2O3 additives. Mater. Today Commun. 2024, 38, 108373. [Google Scholar] [CrossRef]
- Wang, X.; Wu, J.; Chen, G.; Wang, X. Influence of Rare Earth Oxide on Microstructure and Properties of Ag–SnO2 Electrical Contacts. Mater. Des. 2014, 60, 345–352. [Google Scholar] [CrossRef]
- Ray, S.; Choudhary, R.; Mondal, D.P.; Modak, P. Arc Erosion and Microstructural Changes of Ag–SnO2–In2O3 Electrical Contact Materials. Mater. Sci. Eng. A 2017, 687, 88–97. [Google Scholar] [CrossRef]
- Swingler, J. Performance and arcing characteristics of Ag/Ni contact materials under DC resistive load conditions. IET Sci. Meas. Technol. 2011, 5, 37–45. [Google Scholar] [CrossRef]
- Ma, X.; Xu, H.; Wang, S.; Zhao, W.; Chen, G. Degradation Mechanisms of Ag–Ni Contacts in High Current Applications. J. Alloys Compd. 2023, 942, 168716. [Google Scholar] [CrossRef]
- Wang, J.; Li, D.; Wang, Y. Microstructure and properties of Ag-SnO2 materials with high SnO2 content. J. Alloys Compd. 2014, 582, 1–5. [Google Scholar] [CrossRef]
- Wang, J.; Li, Z.; Zhang, H.; Sun, Y.; Wang, Z.; Hu, H.; Liu, S.; Yuan, X.; Chen, X. Arc erosion mechanism and surface characteristics of TiN particles reinforced Ag based electrical contact materials. Wear 2025, 566–567, 205900. [Google Scholar] [CrossRef]
- Jiang, L.; Chen, Q.; Zhao, H.; Xu, M. Arc Erosion Behavior and Microstructure of Ag–Ni–C Electrical Contacts. Mater. Chem. Phys. 2024, 308, 128451. [Google Scholar] [CrossRef]
- Morin, M.; Jeannot, F.; Jolly, D.; Derouet, R. Influence of Arc Erosion on the Surface Morphology of Ag–CdO Electrical Contacts. Wear 2000, 245, 107–115. [Google Scholar] [CrossRef]
- Ksiazkiewicz, A.; Dombek, G.; Nowak, K.; Janiszewski, J. Electrodynamic contact bounce induced by fault current in low-voltage relays. Energies 2019, 12, 3926. [Google Scholar] [CrossRef]
- Biyik, E.; Akkurt, S.; Kiliç, G.; Özdemir, M.; Günay, M. Effects of Doping Elements on the Microstructure and Properties of Ag–Ni Electrical Contact Materials. Materials 2021, 14, 3297. [Google Scholar] [CrossRef]
- Huang, X.; Ge, J.; Zhou, Z.; Chen, B.; Zhuo, F.; Zhang, H. Arc erosion properties of the Ag-Cr2AlC contact material. Metals 2025, 15, 293. [Google Scholar] [CrossRef]
- Nurguzhin, M.; Janikeyev, M.; Omarbayev, M.; Yermakhanova, A.; Meiirbekov, M.; Zhumakhanov, M.; Keneshbekova, A.; Atamanov, M.; Akylbayeva, A.; Lesbayev, A.; et al. Structure and properties of Al–CNT-based composites manufactured by different methods: A brief review. Materials 2025, 18, 214. [Google Scholar] [CrossRef] [PubMed]
- Zhang, H.; Wang, X.; Liu, J.; Zhang, H.; Qiu, Y.; Fei, Y. Mechanical Characteristics and Arc Erosion Behavior of Ag–TiB2 Contact Materials with Ni Addition. Sens. Actuators A Phys. 2025, 387, 116427. [Google Scholar] [CrossRef]


Disclaimer/Publisher’s Note: The statements, opinions and data contained in all publications are solely those of the individual author(s) and contributor(s) and not of MDPI and/or the editor(s). MDPI and/or the editor(s) disclaim responsibility for any injury to people or property resulting from any ideas, methods, instructions or products referred to in the content. |
© 2025 by the authors. Licensee MDPI, Basel, Switzerland. This article is an open access article distributed under the terms and conditions of the Creative Commons Attribution (CC BY) license (https://creativecommons.org/licenses/by/4.0/).