Article

Integrated Alkali Gradient pH Control Purification of Acidic Copper-Containing Etching Waste Solution and Cu2(OH)3Cl Conversion-Calcination Process for High-Purity CuO

Chemistry and Material Engineering School, Mianyang Teachers’ College, Mianxing West Road No. 166, Mianyang City 621000, China
*
Authors to whom correspondence should be addressed.
These authors contributed equally to this work.
Processes 2025, 13(9), 2807; https://doi.org/10.3390/pr13092807
Submission received: 13 August 2025 / Revised: 28 August 2025 / Accepted: 29 August 2025 / Published: 2 September 2025
(This article belongs to the Section Chemical Processes and Systems)

Abstract

With the rapid advances of the electronics industry, a large amount of acidic etching waste solutions (AEWS) for etching Printed Circuit Board (PCB) are generated, which require complete remediation and sustainable recycling to avoid environmental pollution and wasting of resources. Herein, the novel purification technology for the acidic copper-containing etching waste solution was exploited via integrated alkali gradient pH control (3.0, 3.2, and 3.5). At pH 3.0, the system demonstrated selective metal removal with 94.02% efficiency for Fe and 82.60% for Mn. Elevating the pH to 3.2 enabled effective elimination of Zn (59.32%), Cr (59.46%), and Al (33.24%), while maintaining minimal copper loss (8.16%). Further pH adjustment to 3.5 achieved enhanced removal efficiencies of 97.86% (Fe), 91.30% (Mn), 59.38% (Zn), 62.10% (Cr), 21.66% (Ca), 34.05% (Al), and 26.66% (Co), with copper retention remaining high at 70.83% (29.17% loss). Furthermore, using the purified AEWS (pH 3.2) as precursor, high-purity nano-CuO was successfully synthesized through a Cu2(OH)3Cl conversion-calcination process, exhibiting 99.20% CuO purity with 0.0012% chlorine content and <0.1% metallic impurities. The development and application of the purification technology for AEWS containing copper, along with the production methodology for high-purity CuO, were significant to the fields of electronic information industry, environmental engineering, green industry and sustainable development of the ecological environment.

Graphical Abstract

1. Introduction

Printed Circuit Board (PCB) is the support of the electronic component, which accounts for approximately 4–7% of the total mass of electronic equipment, even up to 20–40% within consumer electronics (including mobile phones, laptops, etc.). With the rapid development of the electronic information sector, the consumption of electronic equipment (EEE) in the whole world is expected to reach 72.2 million tons in 2030, generating a great growth in the usage of PCB [1]. In the PCB manufacturing process, chemical etching is the critical step, which generates a substantial amount of acidic copper-containing waste etching solution [2]. Statistically, the annual generation of etching waste solution in the world exceeds 1 billion cubic meters, with a sustained annual growth rate ranging between 15% and 18% [3]. Acidic etching waste solutions (AEWS), classified as hazardous liquid waste, contain the high-value Cu elements as well as waste acids, a variety of light and heavy metal species and hydrocarbon organics, which present substantial risks to both the natural environment and human health [4,5,6,7]. Therefore, the thorough remediation and recycling utilization of acidic Cu-containing etching waste solution are of substantial environmental significance. In the past decades, many researchers have been dedicated to developing technologies for the treatment and recycling utilization of AEWS, including solvent extraction [8], neutralization precipitation [9], electrolytic recovery [10], ion adsorption [11], liquid-phase chemical reduction and so forth. Kobayashi et al. [12] introduced a method for treating high-chloride-content etching solutions by employing H2O2 oxidation, adjusting the solution pH to 12, and maintaining the reaction temperature above 70 °C. This approach successfully produced CuO with a chloride concentration as low as 80 mg/kg. Kim et al. [13] utilized a direct NaOH precipitation method to recover Cu from waste etching solutions, achieving a CuO yield of up to 80%. This work further identified the optimal copper precipitation temperature range as 40 °C to 80 °C, noting that higher temperatures correlate with increased CuO content. Qi et al. [14] utilized cerium nitrate to leach Cu from waste etching solutions, subsequently recovering the metal through electrolytic deposition with an impressive recovery efficiency of 99.9%. Wang et al. [15] conducted a comprehensive study on the experimental conditions for the chemical precipitation treatment of Cu, Fe, and Zn ions, revealing that Fe3+ was completely precipitated at a pH of 3.0, while Fe2+ and Zn2+ co-precipitate within a pH range of 6.5–8.5 and reach full precipitation at pH 9.0. Furthermore, Cu2+ demonstrates a precipitation range spanning pH 4.5 to 7.0. Huang et al. [16] employed an ultrasonic recovery technique, which replaced traditional alkaline solutions with limestone to extract Fe and Cu from etching waste solutions. Under the conditions of 25 °C and a pH of 5.5, 99.99% of Cu and 1.29% of Ca were precipitated and solidified. Guo et al. [17] utilized NH4+ to precipitate Cu2+ from AEWS by controlling the crystallization rate. The process yielded particulate matter (Cu2Cl(OH)3) with a dense surface, excellent fluidity, and low hygroscopicity.
Notably, high-purity CuO nanoparticles are much more expensive than Cu2Cl(OH)3, Cu(OH)2, Cu2(OH)2CO3, etc., obtained through the precipitation method. To acquire higher value, many researchers utilized Cu2Cl(OH)3, Cu(OH)2, Cu2(OH)2CO3, etc., as precursors to synthesize nano CuO. Typically, thermal conversion approaches are always carried out to synthesize CuO. For example, Jia et al. [18] first utilized NaOH to convert Cu2Cl(OH)3 to Cu(OH)2. Then, the blue Cu(OH)2 powders were dehydrated in a high-temperature oven at 190 °C to obtain black CuO. Lin et al. [19] firstly prepared precursors of CuO through precipitation of CuSO4 and Na2CO3, which were calcined at 500 °C for 1h to yield CuO nanoparticles with a crystallite size of 20.1 nm.
Inspired by these published works, herein, the purifying conditions of integrated alkali gradient pH control to AEWS were systematically studied. Moreover, the fabricating conditions combined with the purifying conditions to obtain high-purity CuO satisfying the Chinese chemical industry standard (Commercially active CuO, HG/T5354-2018) [20] were also thoroughly researched. Notably, the purification process demonstrated exceptional efficiency in eliminating metal impurities, achieving a removal rate of 96.67% for iron species (Scheme 1). Following optimization of the CuO preparation methodology, encompassing both calcination and precipitation parameters, the synthesized samples derived from purified AEWS demonstrated exceptional CuO purity (99.20%) while maintaining total impurity concentrations below the 0.1% threshold.

2. Materials and Methods

2.1. Materials

Acidic etching waste solution was obtained from a certain company in Sichuan Province of China (Figure S1b). Sodium hydroxide (NaOH), sodium carbonate (Na2CO3), nitric acid (HNO3), phosphoric acid (H3PO4), potassium iodide (KI), silver nitrate (AgNO3) and CuO (AR, 99%) were purchased from Chengdu Colon Chemical Co., Ltd., Chengdu, China. Starch indicator and sodium thiosulfate were purchased from Guangzhou Hewei Pharmaceutical Technology Co., Ltd., Chengdu, China. ICP-certified reference material (GSB 04-1767-2004; GSB 04-1770-2004; GBW(E)086195) was obtained from the National Analysis and Testing Center for Nonferrous Metals and Electronic Materials.

2.2. Purification of AEWS

Pre-prepared NaOH and Na2CO3 solutions of varying concentrations were added dropwise to AEWS (100 mL) under magnetic stirring at room temperature to adjust the pH of the AEWS to 3.0, 3.2, and 3.5, respectively. In detail, at first, NaOH solution (10 mol/L) was employed to adjust the pH value of AEWS to 1.0. Then, the mixture solution of NaOH and Na2CO3 with a concentration of 0.05 mol/L was added to the AEWS (pH 1.0) to regulate the pH to 3.0. Finally, AEWS with a pH value of 3.0 were adjusted by Na2CO3 solution (0.005 mol/L) to increase their pH value to the objective pH value (3.2, 3.5). Many precipitates were produced during the addition of alkaline solution, which were finally filtered and discarded. The mixtures with different pH levels were allowed to stand for 12 h at room temperature. Afterward, the pH was remeasured and readjusted to the target values. Finally, the mixtures were centrifuged to separate the supernatant, which was designated as purified-AEWS.

2.3. Fabrication of CuO

The purified AEWS was first adjusted to a pH value of 4.7 by NaOH solution (0.5 mol/L), then further adjusted to 5.2 by NaOH solution (0.05 mol/L) to obtain Cu2Cl(OH)3. Deionized water (500 mL) was poured into the beakers containing Cu2Cl(OH)3 sediments, which were put in the ultrasonic water bath to remove unreacted chemicals for 20 min at room temperature. The mixtures were filtered again and oven-dried at 70 °C to obtain Cu2Cl(OH)3 particles. Subsequently, these particles were calcined in a furnace at varying temperatures (600 °C, 900 °C, 1000 °C) under an air atmosphere for several hours (1 h, 2 h, 3 h, 4 h) to yield CuO with different purities.

2.4. Characterization

An inductively coupled plasma optical emission spectrometer (National Nuclear Corporation Detection Technology Co., Ltd., Beijing, China Plasma 3000) was used to analyze the contents of metallic elements of the samples. The crystalline phase and structure of the composites were determined by X-ray diffraction (Tongda Technology Co., Ltd., Dandong, China, Tong Da-3700) using Cu Kα radiation, λ = 1.5406 Å, with the scanning rate of 10°/min from 10° to 70°. A scanning electron microscope was employed to observe the microstructure of the CuO (Carl Zeiss, Oberkochen, Germany, EVO 08). The X-ray photoelectron spectra (Thermo Fisher-ESCALAB Xi+, Waltham, MA, USA) were collected by Thermo Scientific ESCALAB Xi+ X-ray Photoelectron Spectrometer equipped with Auger electron spectroscopy to analyze the valence distribution of Cu ions. The Fourier Transform Infrared spectroscopy (Gangdong Sci-Tech Co., Ltd., Tianjin, China, Gang Dong 650s FTIR) recorded the functional moieties of the samples in the wavenumber range from 400 to 4000 cm−1. An integrated thermal gravimetric analyzer (China Beijing Hengjiu Instrument Co., Ltd., Beijing, China HCT-4) was used to measure the thermal stability of the samples in the temperature range of 25–1000 °C at a heating rate of 5 °C/min in an air atmosphere. In this work, the pH values of solutions were measured by a pH meter (Leici pH5-3E (Shanghai, China) equipped with a probe of E-301-D). Three-point correction using pH 6.86, pH 4.01 and pH 9.18 buffer solutions was conducted to calibrate the pH meter.

2.5. Measurement of CuO and Impurity Contents

The methods for determining CuO content, chlorides, and metal impurity elements were based on the Chinese chemical industry standard [20].

2.5.1. Measurement of CuO Content

The specific measurement approaches was paid according to the Chinese standard of CuO. [20] The as-prepared samples (0.1 g) were added to wetted iodine flasks. Then, H3PO4 (5 mL) and ionized water (15 mL) were added to the iodine flasks containing the as-prepared samples. Aqueous sodium thiosulfate solution was titrated into the iodine flasks until the solution transitioned to a light yellow. A total of 3 mL of starch indicator solution was added to the light-yellow solution, followed by continued titration with sodium thiosulfate solution until the complete disappearance of the blue coloration. The CuO contents were calculated by the following formula:
w 1 = V V 0 c M × 10 3 m × 100 %
where V0 (mL) and V (mL) denote the volumes of sodium thiosulfate solution consumed during the titration of the control sample and the as-prepared samples, respectively. c (mol/L) was the molar concentration of sodium thiosulfate solution. m (g) and M (g/mol) reflected the weight of as-prepared samples and the molar mass of CuO, respectively.

2.5.2. Measurement of Chloride Content

The specific measurement approaches was paid according to the Chinese standard of CuO. [20] The as-prepared samples (10 g) and HNO3 solution (40 mL, 50 vol%) were added to beakers and stirred for 10 min to completely dissolve the samples. The solutions were quantitatively transferred to a 100 mL volumetric flask and diluted to the mark with deionized water, noting as solution A. Then, 10 g of CuO (99%, AR) purchased from Chengdu Colon Chemical Co., LTD was dissolved in HNO3 solution (40 mL, 50 vol%), and 5 mL AgNO3 solution (17 g/L) was added to it to form the standard mixture solution. The standard mixture was transferred to a 100 mL volumetric flask and diluted to the mark with deionized water, noting as solution B. Solution A (10 mL) and Solution B (10 mL) were placed in two colorimetric tubes (50 mL), respectively. Then, HNO3 solutions (2 mL, 50 vol%) were introduced to the two colorimetric tubes and diluted to 25 mL with deionized water, while solution A required additional AgNO3 solution (0.5 mL, 17 g/L). Subsequently, 1.5 mL of certified chlorine standard solution (GBW(E)086195) was introduced into solution B to prepare a standard turbidimetric solution containing 0.06 mg/L chlorine, corresponding to a chlorine content of 0.00015% in the final product. Finally, solution A containing AgNO3 was allowed to stand for 10 min, after which its turbidity was quantitatively compared with that of the standard turbidimetric solution prepared from solution B. If the measured turbidity of solution A was lower than that of the standard turbidimetric solution, the chlorine content in the samples was determined to be below the 0.00015% threshold.

2.5.3. Measurement of Metal Impurities Contents

The specific measurement approaches was paid according to the Chinese standard of CuO. [20] ICP-OES was carried out to measure the metal impurity content. The measured samples were prepared using the following procedure. The as-prepared samples (0.1 g) were dissolved in the HNO3 solution, which was transferred to volumetric flasks (100 mL) and diluted to the mark with deionized water. The contents were calculated using the following equation:
w 2 = x M × 10 3 m L × 100 %

3. Results and Discussions

3.1. Removal of Metallic Impurities from AEWS

The original AEWS was shown in Figure S1a, displaying nearly black, and the concentrations of metal ions within AEWS were exhibited in Table S1, which were measured by ICP-OES. It was shown that Cu content within AEWS was about 97,609 mg/L, demonstrating a copper-rich feature. However, the concentrations of impurities, including Ca, Mg, Zn, and Al, were 78.17 mg/L, 17.32 mg/L, 97.05 mg/L, and 11.08 mg/L, respectively, attesting to the challenge of purifying AEWS for producing high-purity CuO. Other metal impurities, including Mn, Ni, Co, and Fe, were also confirmed to exist within AEWS, further illustrating the constituent complexity.
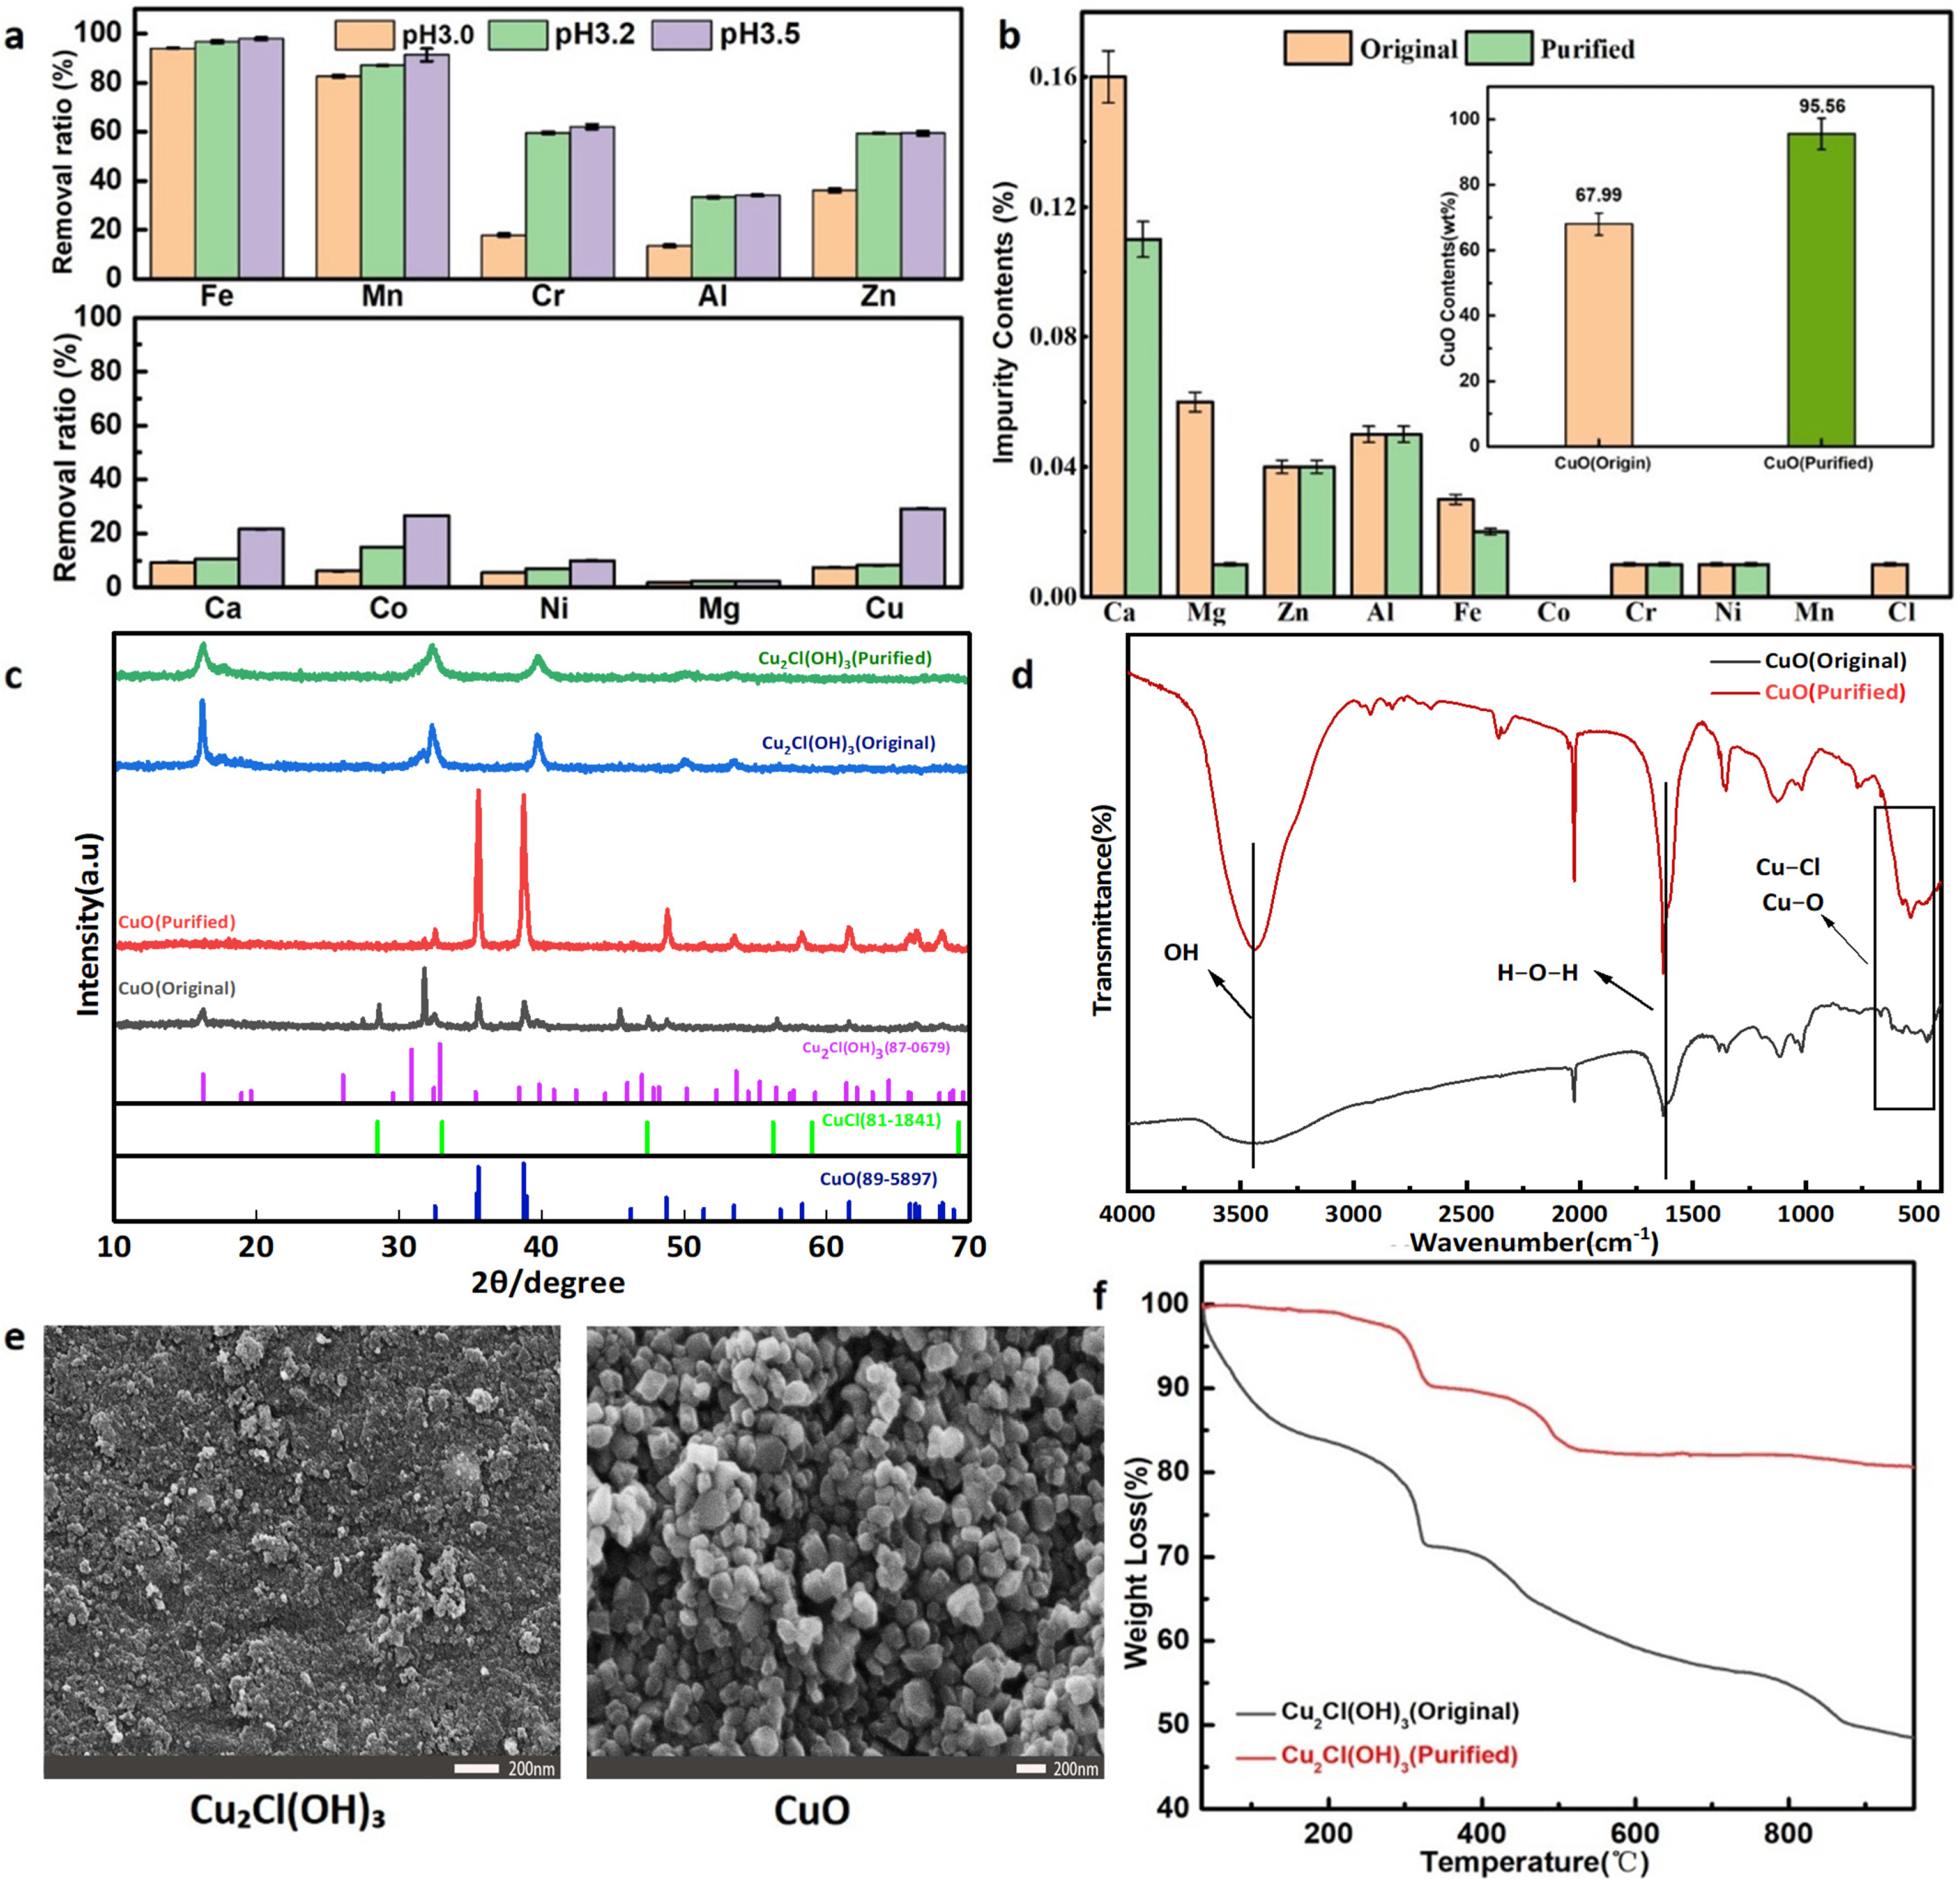
For effective purification of AEWS, a combined alkaline gradient pH control (pH 3.0, 3.2, and 3.5) strategy was employed to remove metallic impurity elements. After adjusting the pH of the etching solution, a significant precipitate formed beneath the etching solution (Figure S1b). As shown in Figure 1a, the removal rates of Fe, Mn and Zn elements reached 94.02%, 82.60% and 36.80%, respectively, when the pH of AEWS was adjusted to 3.0. Meanwhile, at pH 3.0, the removal rates of other metallic elements (Ca, Al, Cr, Co, Ni, Mg) remained relatively low, with elimination rates of only 9.26%, 7.49%, 17.89%, 6.14%, 5.52%, and 1.79%, respectively.
In these impurities, Fe3+ in the etching solution readily forms hydroxide precipitates with alkaline solutions, resulting in high removal efficiency. In contrast, Mn remains primarily in ionic form with a minor portion as hydroxides [21]. However, since the Mn content in AEWS was inherently low, its concentration was further reduced due to adsorption and flocculation by other colloidal precipitates. Zinc hydroxide is an amphoteric substance; at pH < 6, Zn primarily exists as Zn2+. At pH = 7–8, 96.45% of Zn2+ in the solution transforms into Zn(OH)2 precipitate. When the solution pH exceeds 10, the precipitate dissolves to form ZnO22−. Although adsorption and flocculation by other colloidal precipitates can enhance its removal efficiency, the residual Zn ion content in the purified solution remains relatively high due to the initially high Zn ion concentration in AEWS.
When the pH of the etching solution was further increased to 3.2, the removal rates of Fe, Mn, Cr, Zn and Al ions significantly improved, reaching 96.67%, 86.95%, 59.46%, 59.32%, and 33.24%%, respectively. However, the removal rates of other metal ions (Ca, Co, Ni, Mg) remained unsatisfactory, with respective values of only 10.56%, 14.90%, 6.90%, and 2.36%, all below 20%. When the pH was further raised to 3.5, the removal rates of these ions showed no significant additional improvement except for Ca (21.66%) and Co (26.66%).
In summary, pH adjustment of the original etching solution can effectively remove metal ion impurities. However, the removal efficiencies vary significantly due to differences in the physicochemical properties of different metal ions. For example, the precipitation pH ranges for various metal ions are well-established: Fe3+ (1.9–2.7), Al3+ (3.5–4.7), and Cr3+ and Cr6+ (4.5–7.0) exhibit lower precipitation pH values compared to Cu2+ (5.2–6.0). In contrast, Fe2+ (6.2–8.8), Co2+ and Co3+ (8.0–9.5), Zn2+ (7.0–8.0), Ca2+ (8.5–9.2), Mg2+ (8.5–9.2), and Mn2+ (~10.0) demonstrate significantly higher precipitation pH ranges than that of Cu2+ [22,23,24]. Meanwhile, the precipitation of Ca2+ and Mg2+ as hydroxide compounds requires a significantly higher pH range of 8.9–9.2, which explains their relatively low removal efficiency in the AEWS system at pH 3.5 [25].
Simultaneously, pH adjustment induced copper precipitation, causing Cu2+ concentrations in AEWS to decrease from 97,609.00 mg/L to 90,298.08 mg/L (7.49% loss) at pH 3.0, with greater losses of 8.16% (89,644.10 mg/L) and 29.17% (69,136.45 mg/L) observed at pH 3.2 and 3.5, respectively. This phenomenon can be attributed to the localized pH elevation in solution, which resulted in the precipitation of copper species in the process of adjusting pH. The copper species may exist in various forms, including Cu2Cl(OH)3, Cu(OH)3, Cu(OH)42−, and CuOH+ within a pH range of 4.4–6.4 in aqueous solution [26].
The experimental results revealed that the PCB etching solution contained various metal impurities with distinct properties. Gradient pH adjustment enabled the selective removal of different metal ions. A comprehensive evaluation considering both impurity removal efficiency and copper conservation identified pH 3.2 as the optimal purification condition.

3.2. Preparation of CuO with AEWS

As evidenced by the results presented in Figure 1a, the pH-adjusted AEWS (pH 3.2) retained significant concentrations of Ca, Mg, and Co ions, necessitating additional purification steps to achieve the high-purity requirements for CuO synthesis. Given the substantial difference between the precipitation pH ranges of Ca, Mg, Zn, Co, and Mn ions compared to that of Cu ions, the purified AEWS was further adjusted to pH 5.2 to selectively precipitate Cu2Cl(OH)3.
The metal ion concentrations remaining in the filtrate after Cu2Cl(OH)3 separation are presented in Table S2. Notably, most competing metal ions (Ca, Mg, Co, etc.) were effectively retained in the aqueous phase. Corresponding analysis of the Cu2Cl(OH)3 precipitate (Table S3) revealed remarkably low incorporation of these metal impurities, with all detected species (Ca, Mg, Co, etc.) accounting for less than 0.35% of the total composition.
Subsequently, CuO was synthesized using Cu2Cl(OH)3 precursors from both original and purified AEWS, following the thermal treatment protocol outlined in Scheme 1 (600 °C, 1 h). As shown in Figure S2, the CuO obtained from the original AEWS displayed a grayish-green coloration with heterogeneous particle morphology, whereas that produced from the purified precursor exhibited a characteristic deep black hue with uniform particle size distribution. The CuO content analysis results (Figure 1b) revealed that the CuO obtained from the original AEWS had a purity of only 67.99%, whereas that from the purified AEWS reached 96.56% (Figure 1b). Furthermore, the impurity content in CuO (Figure 1b) demonstrated that the purification treatment of the etching solution effectively reduced the metal ion content in the final product.
The CuO fabricated from both purified and original AEWS was characterized by XRD, SEM and FTIR to determine their structures. The diffraction peaks of precipitate products from both original and purified AEWS at 12.4°, 33.1° and 39.10° corresponded to the characteristic peaks of Cu2Cl(OH)3 (PDF#87-0679) (Figure 1c). Following calcination at 600 °C for 1 h under ambient atmosphere, the formation of CuO was confirmed by X-ray diffraction analysis, with all observed diffraction peaks matching the standard card for monoclinic CuO (PDF#89-5897). However, the XRD pattern of CuO synthesized from original AEWS exhibited additional diffraction peaks corresponding to cubic CuCl (PDF#81-1841) and rhombohedral Cu2Cl(OH)3 (PDF#87-0679), providing clear evidence that the purification process significantly influences the purity of CuO. Furthermore, the XRD patterns revealed significantly sharper diffraction peaks for CuO fabricated from purified AEWS compared to those from original AEWS, indicating that the pre-purification process effectively enhances the crystallinity of the resulting CuO.
The FT-IR spectra further verified this point (Figure 1d). In addition to the characteristic absorption bands of CuO, the FT-IR spectrum of nanoparticles generated from the original AEWS revealed multiple extraneous peaks, suggesting the presence of various impurity compounds [27]. The absorption bands around 1600 cm−1 were generated from the chemisorbed or physisorbed water molecules on the surface of CuO, while the broad peak around 3400 cm−1, attributed to -OH, was contributed to the incomplete conversion of Cu2Cl(OH)3 under 600 °C for 1 h [28]. Peaks around 400–900 cm−1 were assigned by the metal-oxgen stretching of CuO. Specifically, the peak appearing at 530 cm−1 was attributed to Cu-O stretching vibration [29].
Meanwhile, the purification process of AEWS plays a crucial role in determining the microstructural characteristics of the resulting CuO. As illustrated in Figure 1e, both Cu2Cl(OH)3 and CuO prepared from purified AEWS exhibited uniform particle size distributions, with average diameters of approximately 120 nm. In contrast, CuO produced from untreated AEWS displayed irregular particle morphologies and severe agglomeration phenomena (Figure S3).
TGA was performed to investigate the thermal decomposition pathway of Cu2Cl(OH)3 and its subsequent transformation into CuO during calcination under atmospheric conditions (Figure 1f). During the initial heating stage (30–100 °C), Cu2Cl(OH)3 derived from the original AEWS exhibited a substantial weight loss of 14%, while the purified counterpart showed only a 3% mass reduction, primarily attributed to the elimination of residual water molecules. Over the temperature range of 240–400 °C, Cu2Cl(OH)3[original] and other impurities experienced significant thermal decomposition, accompanied by a substantial weight loss of 25%, while the weight loss of Cu2Cl(OH)3[purified] within this temperature range was 9% [30,31,32,33]. In the temperature range of 400–780 °C, the oxidation reactions of CuCl2 and CuCl decomposed from Cu2Cl(OH)3[original] and Cu2Cl(OH)3[purified] occurred with the weight loss of 3% and 7%, respectively (9) [34].
Throughout the entire thermal treatment, the total weight loss of Cu2Cl(OH)3[original] and Cu2Cl(OH)3[purified] was 50% and 20%, respectively, primarily due to the presence of numerous hydroxyl-containing impurities in the Cu2Cl(OH)3[original] products. Specifically, the thermal decomposition of impurity phases, particularly Fe(OH)3 (200–300 °C) and Ca(OH)2 (100–480 °C), contributed significantly to the greater weight loss observed in Cu2Cl(OH)3[original] compared to Cu2Cl(OH)3[purified]. Additionally, the decomposition of additional impurity hydroxides, including Al(OH)3 (400–600 °C), Zn(OH)2 (400–500 °C), and Mg(OH)2 (600–740 °C), further contributed to the enhanced weight loss observed in Cu2Cl(OH)3 [original] [35].
6 C u 2 C l O H 3 200 350   ° C C u C l 2 + 2 C u C l + 9 H 2 O + 9 C u O + C l 2
2 F e O H 3 200 300   ° C F e 2 O 3 + 3 H 2 O
C a O H 2 100 480   ° C C a O + H 2 O
2 A l O H 3 400 600   ° C A l 2 O 3 + 3 H 2 O
Z n O H 2 400 500   ° C Z n O + H 2 O
M g O H 2 600 740   ° C M g O + H 2 O
2 C u C l + C u C l 2 + O 2 500 600   ° C 2 C u O + C l 2

3.3. Refinement of High Purity CuO

To optimize the purity of CuO, key experimental parameters, including calcination temperature, calcination time, stirring techniques, and copper precipitation rates, were systematically varied. This investigation focused on elucidating the effects of these processing variables on the purity, impurity profile, phase composition, and morphology of CuO.

3.3.1. Calcination Technology

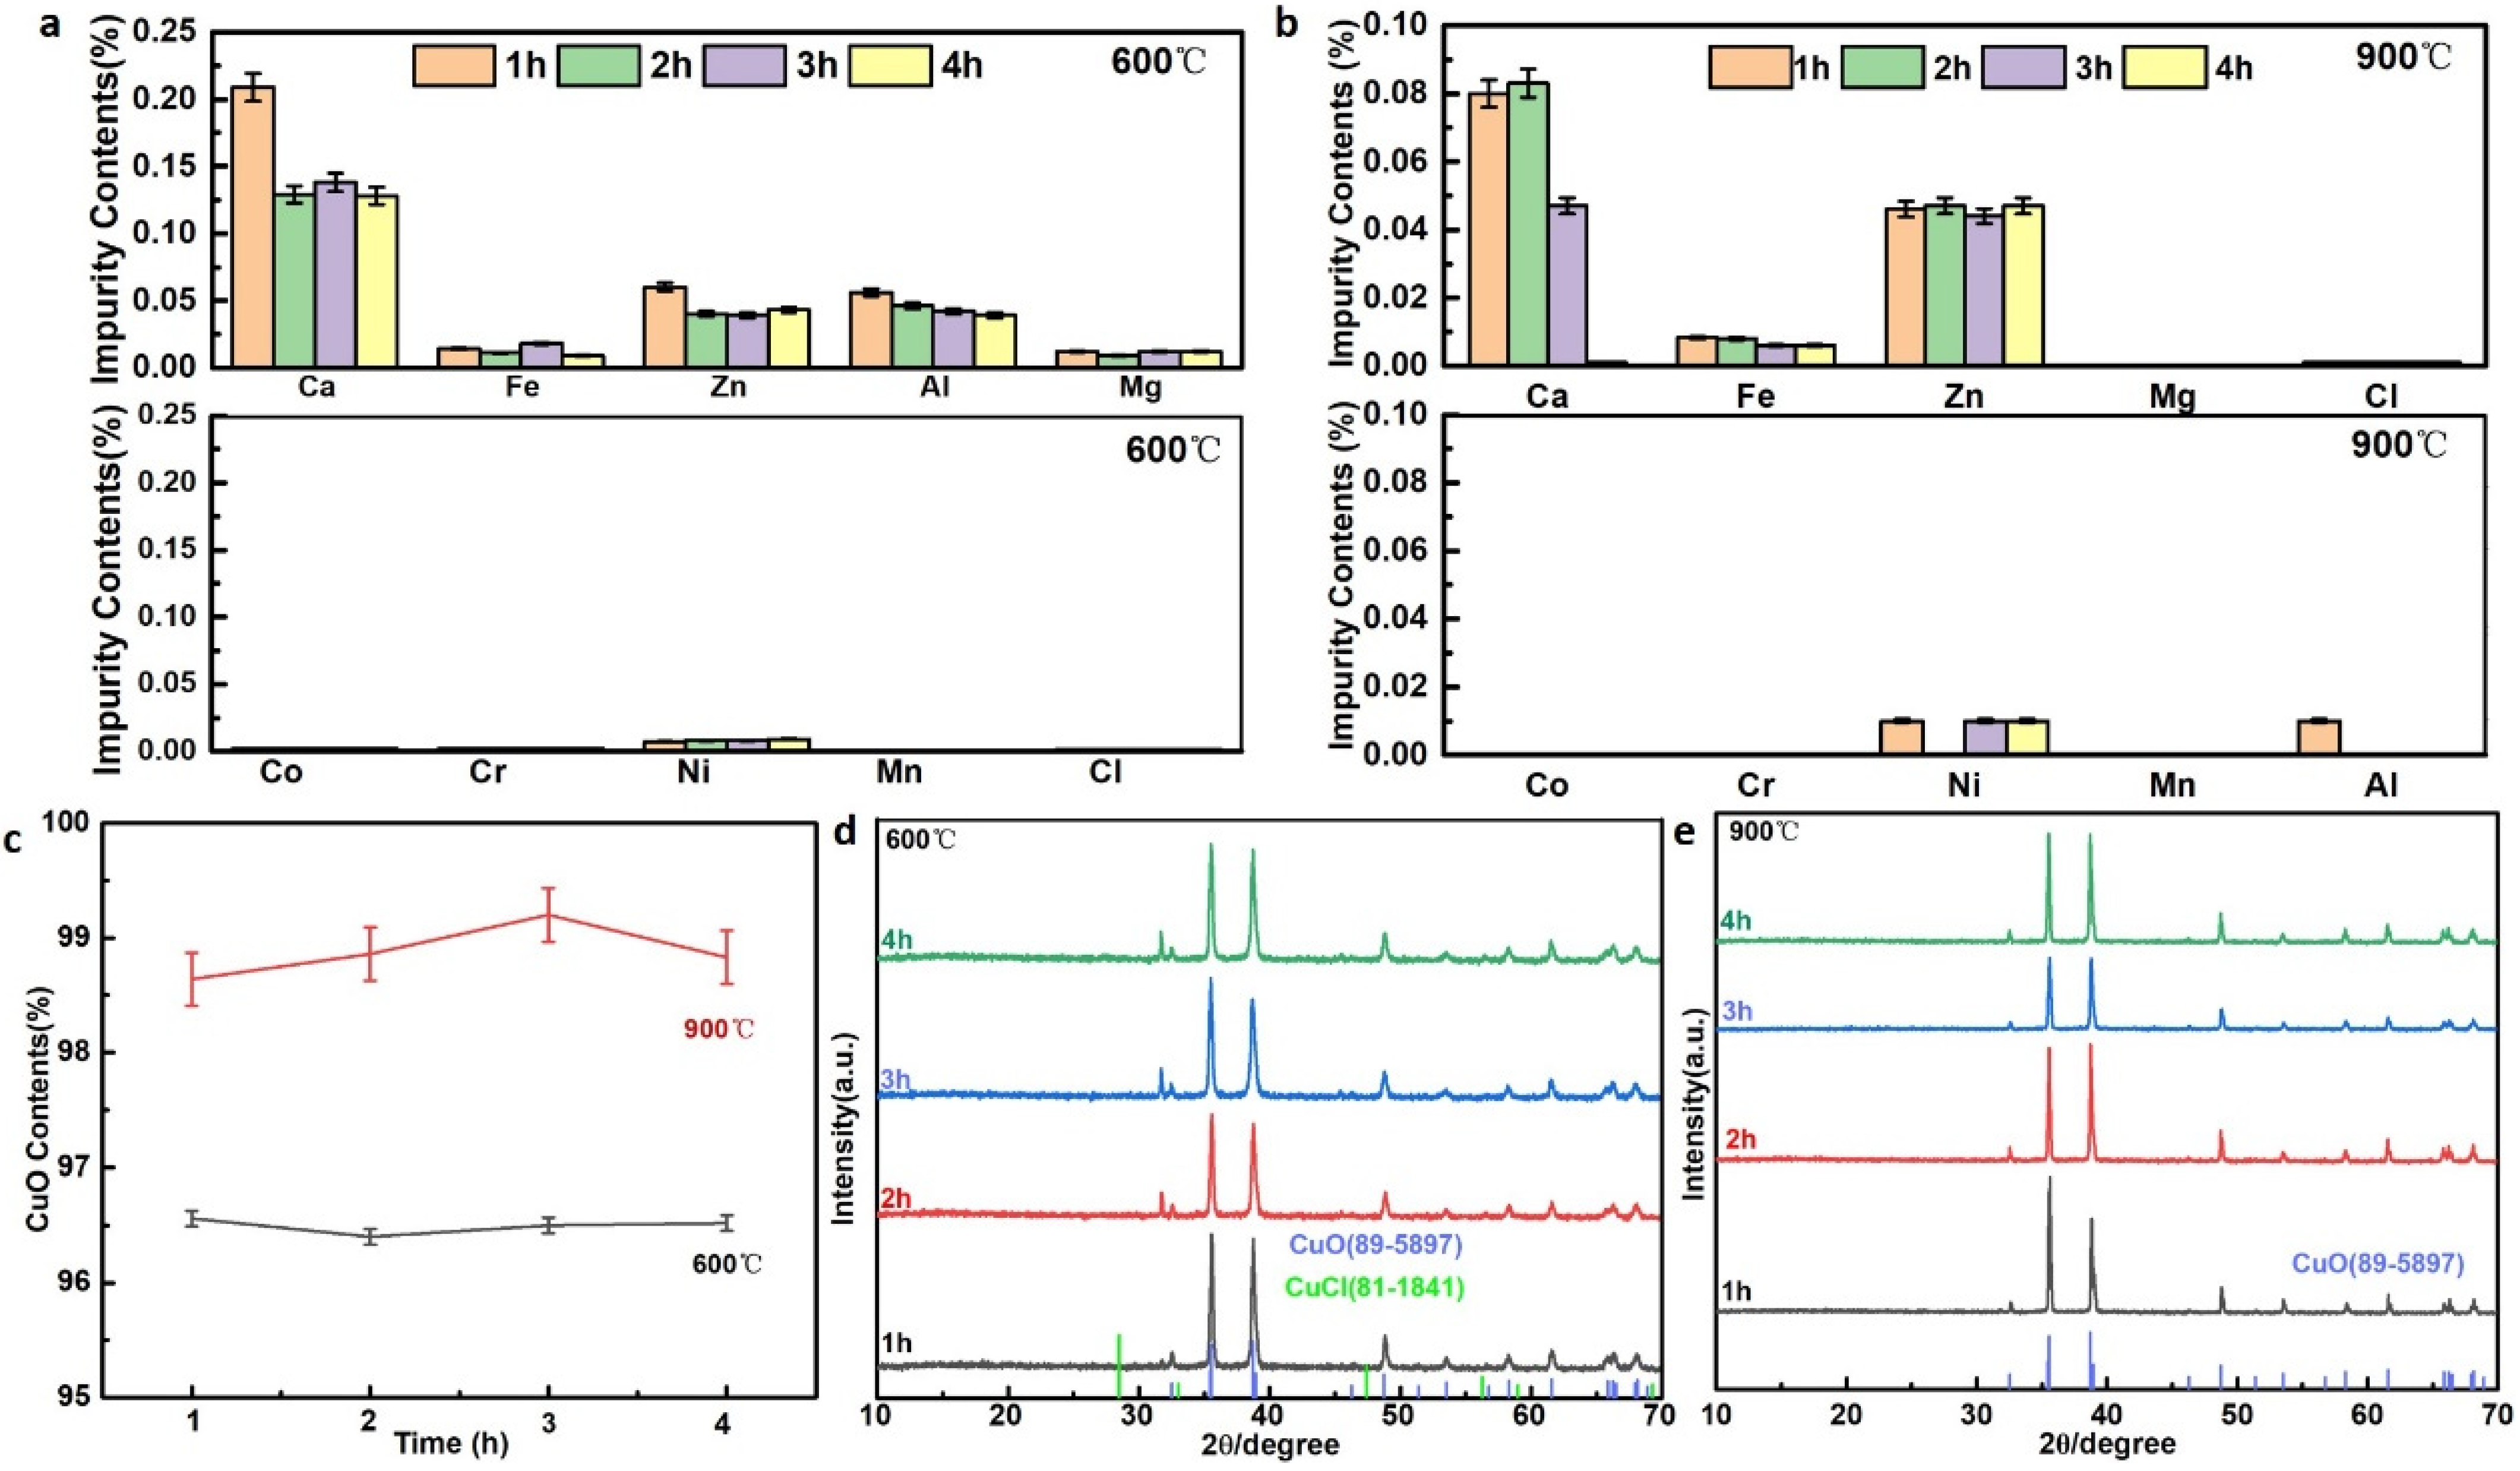
Cu2Cl(OH)3 obtained from purified AEWS was calcinated at 600 °C and 900 °C for different times (1 h, 2 h, 3 h and 4 h) to fabricate high-purity CuO. As shown in Figure 2a–c, the CuO content in samples calcined at 900 °C significantly exceeded that of samples processed at 600 °C, indicating a strong temperature dependence of CuO purity. Extending the calcination time from 1 to 3 h at 900 °C resulted in a notable increase in CuO purity from 98.64% to 99.20%, whereas samples calcined at 600 °C maintained a consistent purity level of approximately 96.50%, demonstrating minimal sensitivity to calcination time at lower temperatures. However, when the calcination duration was extended to 4 h at 900 °C, an unexpected decrease in CuO purity to 98.83% was observed, suggesting potential thermal decomposition or phase transformation at prolonged high-temperature treatment. According to these phenomena, it was supposed that the calcination temperature dominated the purity of the samples. Consequently, Cu2Cl(OH)3 was calcined at an elevated temperature of 1000 °C for 1 h to produce CuO. Surprisingly, this treatment yielded only a marginal improvement in CuO purity (98.60%), demonstrating that increasing the calcination temperature beyond 900 °C provided negligible enhancement in product purity (Figure S5, Table S4). Although the total impurity concentration in these samples was maintained below 0.2%, the levels of most metallic impurities failed to meet the stringent requirements of the Chinese chemical industry standard (HG/T 5354-2018). [20]
The XRD was performed to characterize the crystal structure of the samples obtained at 600 °C and 900 °C. As shown in Figure 2d, the predominant diffraction peaks matched well with the characteristic reflections of monoclinic CuO (PDF#89-5897), whereas additional peaks corresponding to cubic CuCl (PDF#81-1841) were detected in the XRD patterns of samples synthesized at 600 °C. However, the peaks attributed to CuCl (PDF#81-1841) were hardly observed in the XRD patterns of samples generated at 900 °C, illustrating that the higher calcination temperature was beneficial for the oxidation reactions of CuCl, which largely enhanced the purity of CuO particles (Figure 2e).
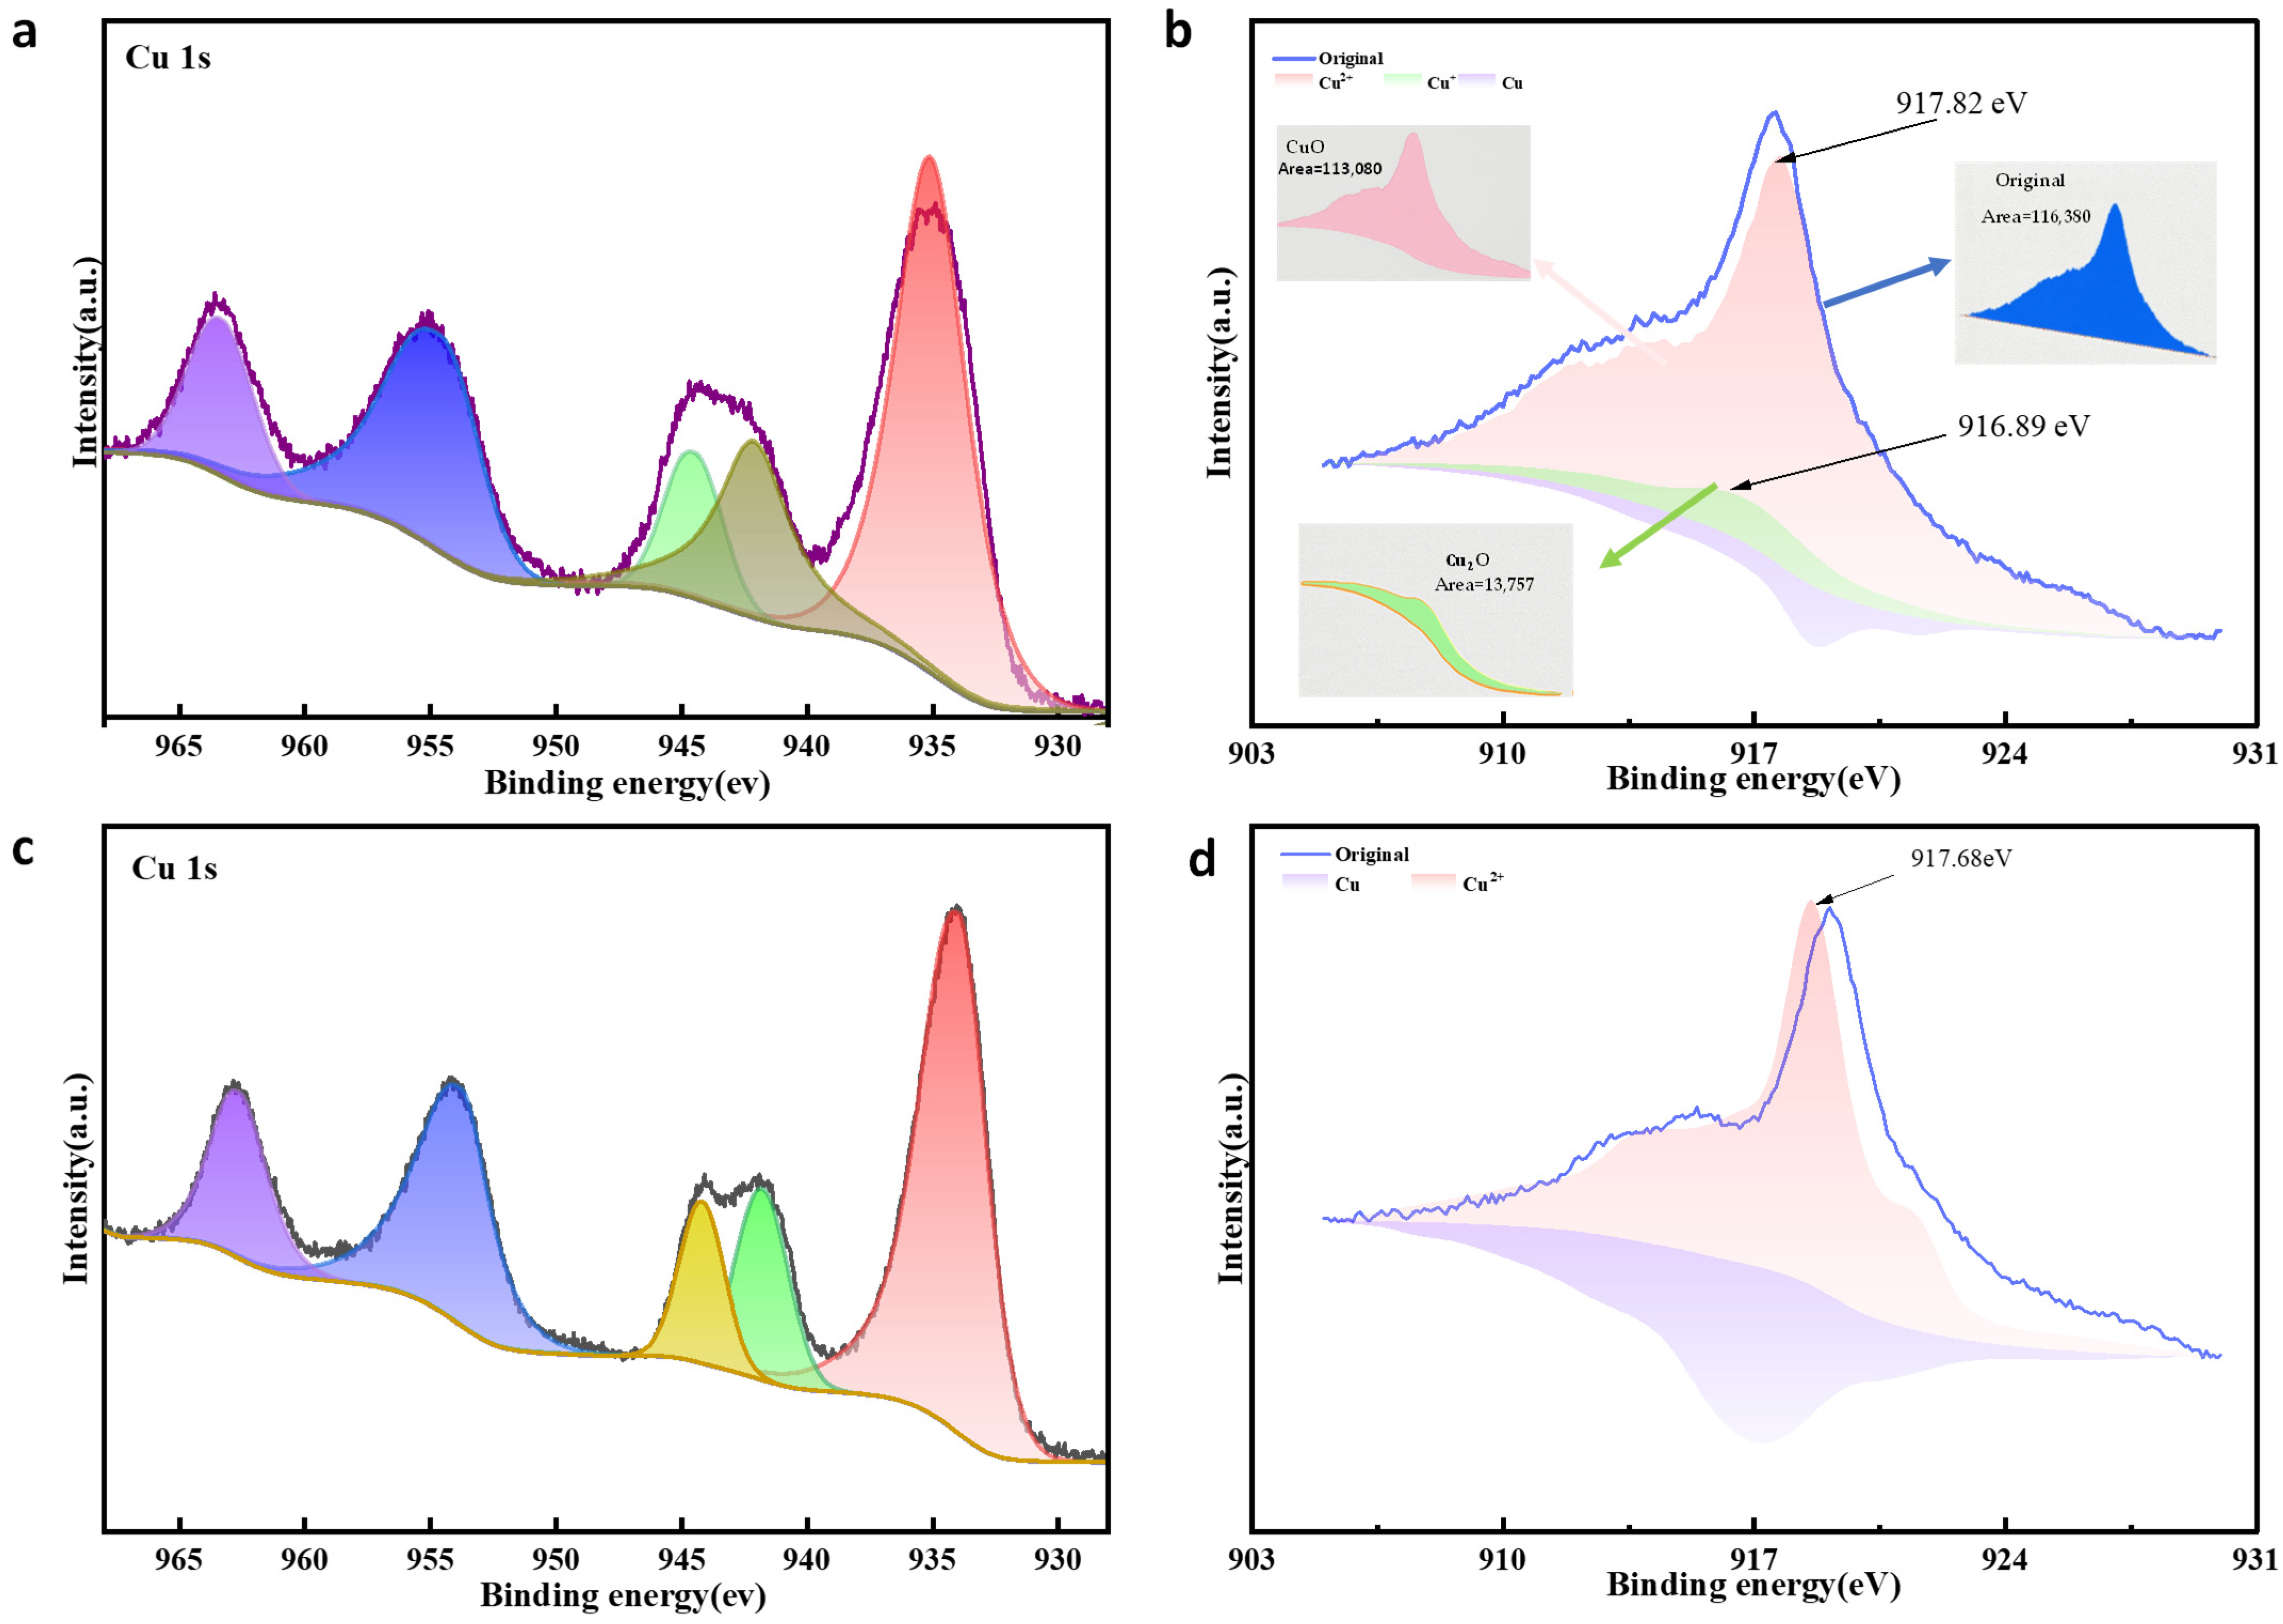
The results of X-ray Photoelectron Spectroscopy (XPS) and Auger Electron Spectroscopy (AES) further verified this perspective. The XPS and AES spectra of samples synthesized at 600 °C (Figure 3a,b) revealed distinct peaks corresponding to Cu+ species, with the integrated peak area ratio of Cu2+ to Cu+ determined to be 9:1. In contrast, no detectable Cu+ signatures were observed in the corresponding spectra of samples processed at 900 °C (Figure 3c,d).
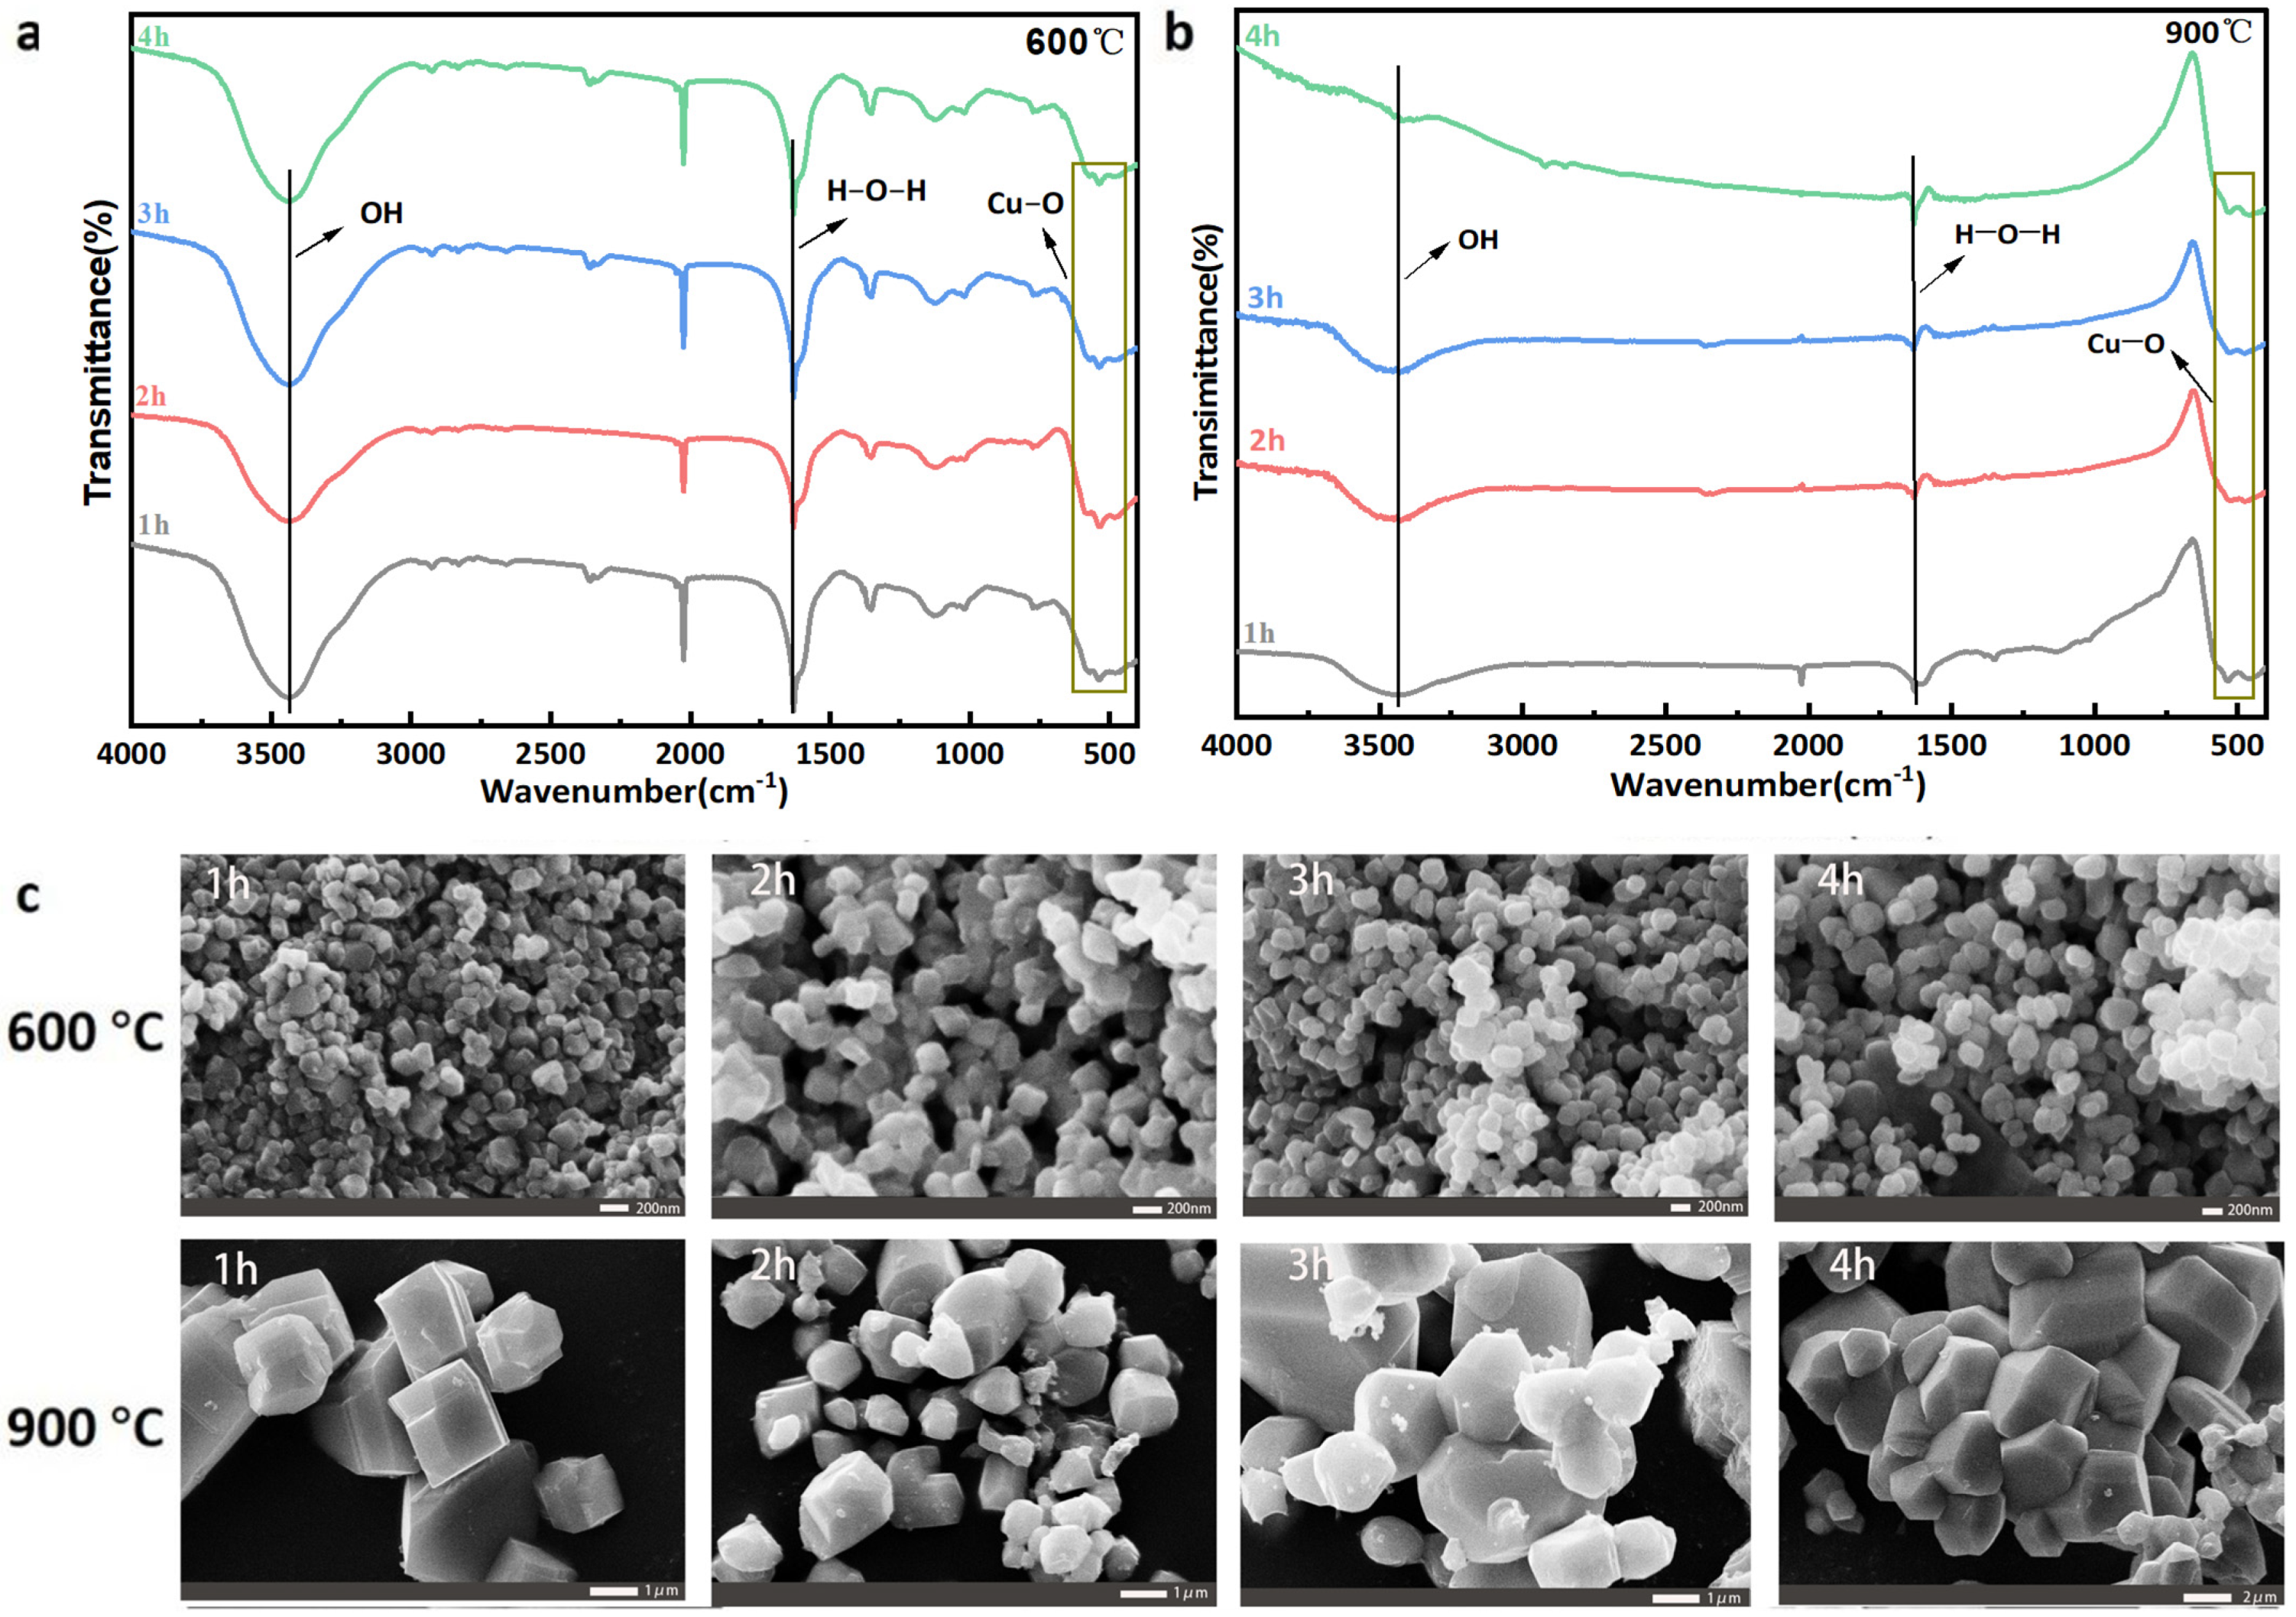
The FT-IR spectra of samples synthesized at 600 °C and 900 °C, featured in Figure 4a and 4b, respectively, exhibited distinct absorption bands at 530 cm−1 corresponding to Cu-O stretching vibrations, confirming the successful formation of CuO [29]. The peaks at around 1600 cm−1 were attributed to chemisorbed or physisorbed water molecules on the surface of CuO, which almost disappeared in the spectra of CuO obtained at 900 °C, probably attributed to the smaller sizes of CuO obtained at 600 °C, enabling it to adsorb more water molecules, while the larger CuO nearly lost the adsorption capacity for water. In comparison to the FT-IR spectra of samples processed at 600 °C, the characteristic -OH stretching vibration band at approximately 3400 cm−1 was nearly absent in samples calcined at 900 °C, indicating the virtually complete thermal decomposition of Cu2Cl(OH)3 at elevated temperatures. Moreover, the intensity of extraneous peaks was significantly reduced in Figure 4b, resulting from the near-complete conversion to CuO phase during the 900 °C calcination process. As the calcination duration increased, a progressive attenuation of absorption bands corresponding to both hydroxyl groups and impurity phases was observed, demonstrating that extended calcination times effectively enhance the purity of CuO products.
The microstructure of CuO was highly correlated with the calcination technology. Specifically, the calcination temperature significantly influenced CuO morphology: particles calcined at 600 °C maintained nanoscale dimensions (~120 nm), while those processed at 900 °C underwent substantial grain growth exceeding 1 μm, ascribing to the spontaneous agglomeration at higher calcination temperature (Figure 4c). Moreover, the high-temperature calcination environment provided substantial energy and enhanced surface activity to CuO particles [36]. Conversely, it was obvious that prolonging calcination time barely affected the sizes of CuO particles.
The experimental results indicated that the purification process effectively reduced the impurity content of the raw material, while the calcination temperature further determined the phase purity and crystalline morphology of the final product. After calcination at 900 °C for 3 h, the purity of CuO reached 99.20%, significantly higher than the 96.5% achieved at 600 °C, demonstrating that higher temperatures are more conducive to the complete oxidation of CuCl and the thermal decomposition of impurity phases. However, excessively high temperatures (1000 °C) or prolonged calcination times (4 h) show no significant further improvement, highlighting the importance of optimizing process parameters. XRD, XPS, and FT-IR analyses confirmed that purification combined with high-temperature calcination effectively reduces Cu+ residues and hydroxyl adsorption while promoting grain growth. Nevertheless, some metal impurities remain slightly above industry standards, indicating the need for further optimization of the purification process. In conclusion, the synergistic control of raw material purification and calcination temperature was a key factor in producing high-purity nano CuO.

3.3.2. Optimizing the Precursor of CuO

While elevated calcination temperatures and extended processing time significantly improve CuO purity, the resulting particle size of samples calcined at 900 °C becomes prohibitively large, leading to dissolution velocities that fail to comply with the stringent requirements outlined in the Chinese Chemical Industry Standard (HG/T 5354-2018). To achieve simultaneous reduction of CuO particle size and maintenance of its high purity, this study implemented a combined approach of mechanical agitation and controlled alkaline solution auto-injection. The obtained Cu2Cl(OH)3 were calcinated at 600 °C or 900 °C for 1 h to produce high-purity and small CuO.
The CuO purity levels in samples processed at 600 °C and 900 °C for 1 h reached 97.50% and 99.02%, respectively, while maintaining total impurity concentrations below the 0.1% threshold (Figure 5a,b), closely approaching the purity of the as-prepared sample calcined at 900 °C for 3 h (99.20%). The CuO synthesized from optimized Cu2Cl(OH)3 precursor manifested significantly higher purity compared to that produced from conventional Cu2Cl(OH)3 under identical calcination conditions. Additionally, the XRD patterns of CuO derived from optimized Cu2Cl(OH)3 precursor and calcined at 900 °C exhibited significantly sharper diffraction peaks corresponding to monoclinic CuO (PDF#89-5897) compared to those processed at 600 °C, indicating enhanced crystallinity at higher calcination temperatures (Figure 5c).
The SEM images verified that the optimization process observably reduced the sizes of CuO particles (Figure 5d). The CuO particles synthesized through 600 °C calcination demonstrated a narrow particle size distribution between 140 and 180 nm, exhibiting excellent size uniformity, which was smaller than that of CuO calcinated from normal Cu2Cl(OH)3.

3.4. Comparative Analysis

Different application fields have specific standards for CuO content (e.g., electronic-grade copper oxide requires ≥99%, while chemical catalyst-grade requires ≥98%). Additionally, if metal impurities such as Fe and Ni in the etching solution are not effectively removed, they will significantly degrade the electrochemical activity or catalytic performance of CuO. Meanwhile, chloride residue was a core quality control indicator for CuO recovery from etching solutions. Excessive chloride content will directly limit the high-value applications of the product and cause corrosion and environmental issues. In previous investigations, researchers primarily focused on Cu2+ recovery rates, process variations, experimental conditions, and product morphology, without in-depth discussion of CuO-specific quality indicators (e.g., whether CuO content meets grade requirements, multi-metal impurity levels, and chloride content) or related purification processes. This study proposed a cost-effective and operationally simple method using combined alkaline gradient pH control to remove metallic impurities from etching waste. The approach enables effective elimination of multiple metal impurities, facilitating the production of high-purity copper-based products. In summary, the technology containing purifying, calcination and optimizing technologies was developed to fabricate high-purity CuO. This methodology offered significant advantages, including operational simplicity, cost-effectiveness, and high processing efficiency. The process imposes minimal requirements on treatment facilities and equipment, while utilizing readily available chemical precipitants. Furthermore, the resulting waste stream can be effectively managed through standard treatment procedures, ensuring compliance with environmental regulations.

3.5. Conclusions

In summary, a chemical precipitation approach was employed to purify AEWS, which subsequently served as the precursor for synthesizing high-purity CuO. Throughout the purification process, the removal efficiency of metal impurities from AEWS achieved 96.67% for iron species, while the resulting CuO product exhibited a purity level of 99.20% with total impurity content maintained below 0.1%. This study provides valuable insights and methodological guidance for the advanced treatment and resource recovery of chemical waste streams, while offering significant implications for ecological conservation and the development of sustainable green chemistry practices.

Supplementary Materials

The following supporting information can be downloaded at: https://www.mdpi.com/article/10.3390/pr13092807/s1, Figure S1: Digital photographs of original acidic etching waste solution (a) top view; (b) Physical diagram of the solution after impurity removal from the etching solution.; Figure S2: Digital photographs of CuO prepared from (a) original and (b) purified AEWS; Figure S3: SEM images of (a) Cu2Cl(OH)3(original); (b) CuO (original); Figure S4: Digital photographs of CuO calcinated from Cu2Cl(OH)3(original) at (a) 600 °C and (b) 900 °C; Figure S5: (a) Product (1000 °C) CuO physical map; (b) SEM images of as-prepared CuO calcinated under 1000 °C for 1 h; (c) XRD patterns of samples obtained from Cu2Cl(OH)3 calcinated at 1000 °C for 1 h; (d) FT-IR spectra of as-prepared CuO calcinated under 1000 °C for 1 h. Table S1: The concentrations of metal ions in original acidic etching waste solution; Table S2: The concentrations of metal ions in filtered solution after separating Cu2Cl(OH)3 from purified AEWS; Table S3: The metal ions contents in Cu2Cl(OH)3 from purified AEWS; Table S4: The metal ions contents of CuO calcinated 1000 °C.

Author Contributions

Conceptualization: D.H. and S.X.; Data curation: S.R.; Funding acquisition: S.X. and S.L.; Investigation: S.R.; Project administration: D.H. and S.X.; Writing—original draft: S.R., D.H. and S.X.; Writing—review and editing: S.R., S.X. and D.H. All authors have read and agreed to the published version of the manuscript.

Funding

This research was funded by Open Fund of Vanadium and Titanium Resource Comprehensive Utilization Key Laboratory of Sichuan Province (2023FTSZ02); Mianyang Teachers’ College Start-up Funding (QD2021A11); Innovation Team of Mianyang Teachers’ College (CXTD2023PY06).

Data Availability Statement

The data supporting this article are available from the corresponding author upon reasonable request. The data supporting this article have been included as part of the Supplementary Information.

Conflicts of Interest

There are no conflicts to declare.

References

  1. Li, H.; Eksteen, J.; Oraby, E. Hydrometallurgical recovery of metals from waste printed circuit boards (WPCBs): Current status and perspectives–A review. Resour. Conserv. Recycl. 2018, 139, 122–139. [Google Scholar] [CrossRef]
  2. Chang, Y.; Deng, L.; Meng, X.; Zhang, W.; Wang, C.; Wang, Y.; Zhao, S.; Li, L.; Crittenden, J.C. Closed-loop electrochemical recycling of spent copper (II) from etchant wastewater using a carbon nanotube modified graphite felt anode. Environ. Sci. Technol. 2018, 52, 5940–5948. [Google Scholar] [CrossRef] [PubMed]
  3. Yu, M.; Zeng, X.; Song, Q.; Liu, L.; Li, J.H.; Li, J. Examining regeneration technologies for etching solutions: A critical analysis of the characteristics and potentials. J. Clean. Prod. 2016, 113, 973–980. [Google Scholar] [CrossRef]
  4. Ullah, A.A.; Maksud, M.A.; Khan, S.R.; Lutfa, L.N.; Quraishi, S.B. Dietary intake of heavy metals from eight highly consumed species of cultured fish and possible human health risk implications in Bangladesh. Toxicol. Rep. 2017, 4, 574–579. [Google Scholar] [CrossRef]
  5. Binesh, A.; Venkatachalam, K. Copper in Human Health and Disease: A Comprehensive Review. J. Biochem. Mol. Toxic. 2024, 38, e70052. [Google Scholar] [CrossRef]
  6. Rehman, M.; Liu, L.; Wang, Q.; Saleem, M.H.; Bashir, S.; Ullah, S.; Peng, D. Copper environmental toxicology, recent advances, and future outlook: A review. Environ. Sci. Pollut. R. 2019, 26, 18003–18016. [Google Scholar] [CrossRef]
  7. Teschke, R. Copper, iron, cadmium, and arsenic, all generated in the universe: Elucidating their environmental impact risk on human health including clinical liver injury. Int. J. Mol. Sci. 2024, 25, 6662. [Google Scholar] [CrossRef] [PubMed]
  8. Sinha, M.K.; Sahu, S.K.; Pramanik, S. Recovery of high value copper and zinc oxide powder from waste brass pickle liquor by solvent extraction. Hydrometallurgy 2016, 165, 182–190. [Google Scholar] [CrossRef]
  9. Che, J.; Zhang, W.; Ma, B.; Wang, C. An efficient process for recovering copper as CuO nanoparticles from acidic waste etchant via chemical precipitation and thermal decomposition: Turning waste into value-added product. J. Clean. Prod. 2022, 369, 133404. [Google Scholar] [CrossRef]
  10. Li, X.; Jia, Y.; Qin, Y.; Zhou, M.; Sun, J. Iron-carbon microelectrolysis for wastewater remediation: Preparation, performance and interaction mechanisms. Chemosphere 2021, 278, 30483. [Google Scholar] [CrossRef]
  11. Ramírez Zamora, R.M.; Schouwenaars, R.; Durán Moreno, A.; Buitron, G. Production of activated carbon from petroleum coke and its application in water treatment for the removal of metals and phenol. Water Sci. Technol. 2000, 42, 119–126. [Google Scholar] [CrossRef]
  12. Kobayashi, T.; Kano, K.; Suzuki, T.; Kobayashi, A. A novel technology for on-site cupric oxide recovery from cupric chloride etchant waste. Water Sci. Technol. 2011, 64, 416–422. [Google Scholar] [CrossRef] [PubMed]
  13. Kim, Y.K.; Riu, D.H.; Kim, S.R.; Kim, B.I. Preparation of shape-controlled copper oxide powders from copper-containing solution. Mater. Leet 2002, 54, 229–237. [Google Scholar] [CrossRef]
  14. Qi, W.X.; Zhang, H.; Liu, K.; Li, J.; Zhang, X.X.; Xie, Y.Y.; Qi, T. Clean recovery of copper from waste printed circuit boards using ceric ammonium nitrate. Sep. Purif. Technol. 2023, 324, 124474. [Google Scholar] [CrossRef]
  15. Wang, L.P.; Chen, Y.J. Sequential precipitation of iron, copper, and zinc from wastewater for metal recovery. J. Environ. Eng. 2023, 145, 04018130. [Google Scholar] [CrossRef]
  16. Huang, Z.; Xie, F.; Ma, Y. Ultrasonic recovery of copper and iron through the simultaneous utilization of Printed Circuit Boards (PCB) spent acid etching solution and PCB waste sludge. J. Hazard. Mater. 2011, 185, 155–161. [Google Scholar] [CrossRef]
  17. Guo, Y.; Zheng, J.; Yan, X.; Liu, X.; Xu, W.; Liu, W.; Lin, Z. Recovery of copper from printed circuit board (PCB) acidic etching wastewater: Ammonia regulates the crystallization of high valued copper salt. Surf. Interfaces 2022, 31, 969. [Google Scholar] [CrossRef]
  18. Wen, Z.J.; Eliot, R.; Hui, S.; Baikun, L.; Heng, Z.; Yu, L. Cu2Cl(OH)3 to nanostructured sisal-like Cu(OH)2 and CuO: Synthesis and characterization. J. Appl. Phys. 2009, 105, 064917. [Google Scholar]
  19. Chia-Chang, L.; Min-Shan, W. Continuous production of CuO nanoparticles in a rotating packed bed. Ceram. Int. 2016, 42, 2133–2139. [Google Scholar] [CrossRef]
  20. HG/T 5354-2018; Industrial Activated Copper Oxide. Chemical Industry Press: Beijing, China, 2018.
  21. Stec, M.; Jagustyn, B.; Słowik, K.; Ściążko, M.; Iluk, T. Influence of high chloride concentration on pH control in hydroxide precipitation of heavy metals. J. Sustain. Met. 2020, 6, 239–249. [Google Scholar] [CrossRef]
  22. BrbootI, M.M.; AbiD, B.A.; Al-ShuwaikI, N.M. Removal of heavy metals using chemicals precipitation. Eng. Technol. J. 2011, 29, 595–612. [Google Scholar] [CrossRef]
  23. Seo, E.Y.; Cheong, Y.W.; Yim, G.J.; Min, K.W.; Geroni, J.N. Recovery of Fe, Al and Mn in acid coal mine drainage by sequential selective precipitation with control of pH. Catena 2017, 148, 11–16. [Google Scholar] [CrossRef]
  24. Chen, Q.; Yao, Y.; Li, X.; Lu, J.; Zhou, J.; Huang, Z. Comparison of heavy metal removals from aqueous solutions by chemical precipitation and characteristics of precipitates. J. Water Process Eng. 2018, 26, 289–300. [Google Scholar] [CrossRef]
  25. Jay Chithra, M.; Sathya, M.; Pushpanathan, K.J.A.M.S. Effect of pH on crystal size and photoluminescence property of ZnO nanoparticles prepared by chemical precipitation method. Acta Metall. Sin. 2015, 28, 394–404. [Google Scholar] [CrossRef]
  26. Baltpurvins, K.A.; Burns, R.C.; Lawrance, G.A. Heavy metals in wastewater: Modelling the hydroxide precipitation of copper (II) from wastewater using lime as the precipitant. Waste Manag. 1996, 16, 717–725. [Google Scholar] [CrossRef]
  27. Luna, I.Z.; Hilary, L.N.; Chowdhury, A.S.; Gafur, M.A.; Khan, N.; Khan, R.A. Preparation and characterization of copper oxide nanoparticles synthesized via chemical precipitation method. Open Access Libr. J. 2015, 2, 1–8. [Google Scholar] [CrossRef]
  28. Momenil, M.; Mirhosseini; Nazar, Z.; Kazempour, A.; Hakimiyan, M. Antibacterial and photocatalytic activity of CuO nanostructure films with different morphology. J. Mater. Sci. Mater. Electron. 2016, 27, 8131–8137. [Google Scholar] [CrossRef]
  29. Meshram, S.P.; Adhyapak, P.V.; Mulik, U.P.; Amalnerkar, D.P. Facile synthesis of CuO nanomorphs and their morphology dependent sunlight driven photocatalytic properties. Chem. Eng. J. 2012, 204–206, 158–168. [Google Scholar] [CrossRef]
  30. Koga, N.; Okada, S.; Nakamura, T.; Tanaka, H. A kinetic study of the thermal decomposition of iron (III) hydroxide-oxides Part 2. Preparation and thermal decomposition of γ-FeO (OH). Thermochim. Acta 1995, 267, 195–208. [Google Scholar] [CrossRef]
  31. Mirghiasi, Z.; Bakhtiari, F.; Darezereshki, E.; Esmaeilzadeh, E. Preparation and characterization of CaO nanoparticles from Ca(OH)2 by direct thermal decomposition method. J. Ind. Eng. Chem. 2014, 20, 113–117. [Google Scholar] [CrossRef]
  32. Iwasaki, S.; Kodani, S.; Koga, N. Physico-geometrical kinetic modeling of the thermal decomposition of magnesium hydroxide. Phys. Chem. C 2020, 124, 2458–2471. [Google Scholar] [CrossRef]
  33. Moezzi, A.; Cortie, M.; McDonagh, A. Transformation of zinc hydroxide chloride monohydrate to crystalline zinc oxide. Dalton T 2016, 45, 7385–7390. [Google Scholar] [CrossRef]
  34. Koga, N. A comparative study of the effects of decomposition rate control and mechanical grinding on the thermal decomposition of aluminum hydroxide. J. Therm. Anal. Calorim. 2005, 8, 595–601. [Google Scholar] [CrossRef]
  35. Haq, I.U.; Akhtar, K.; Malook, K. Synthesis and characterization of monodispersed copper oxide and their precursor powder. Mater. Res. Bull. 2014, 57, 121–126. [Google Scholar] [CrossRef]
  36. Filipič, G.; Cvelbar, U. Copper oxide nanowires: A review of growth. Nanotechnology 2012, 23, 194001. [Google Scholar] [CrossRef] [PubMed]
Scheme 1. (a) The purification process of AEWS; (b) the preparation technology of CuO.
Processes 13 02807 sch001
Figure 1. (a) the metal ions contents of purified AEWS at pH 3.0, 3.2 and 3.5; (b) the concentrations of CuO in samples prepared from purified AEWS and original AEWS; (c) XRD patterns of Cu2Cl(OH)3 and CuO from purified AEWS and original AEWS; (d) FT-IR spectra of CuO obtained from purified AEWS and original AEWS; (e) SEM images of Cu2Cl(OH)3 and CuO synthesized from purified AEWS; (f) TGA of Cu2Cl(OH)3 obtained from purified AEWS and original AEWS.
Processes 13 02807 g001
Figure 2. The impurity contents of CuO obtained from Cu2Cl(OH)3 calcinated at (a) 600 °C and (b) 900 °C for different times; (c) the CuO contents of samples; XRD patterns of samples obtained from Cu2Cl(OH)3 calcinated at (d) 600 °C and (e) 900 °C for different times.
Processes 13 02807 g002
Figure 3. The (a) XPS and (b) AES spectra of samples obtained under 600 °C; (c) XPS and (d) AES spectra of samples obtained under 900 °C.
Processes 13 02807 g003
Figure 4. FT-IR spectra of as-prepared CuO calcinated under (a) 600 °C and (b) 900 °C for different times; (c) SEM images of as-prepared CuO calcinated under 600 °C for 1 h, 2 h, 3 h, 4 h and under 900 °C for 1 h, 2 h, 3 h, 4 h.
Processes 13 02807 g004
Figure 5. (a) CuO contents, (b) impurity contents, (c) XRD patterns in samples calcinated at 600 °C and 900 °C for 1 h from optimizing and normal Cu2Cl(OH)3, (d) SEM images of samples calcinated at 600 °C and 900 °C for 1 h from optimizing Cu2Cl(OH)3.
Processes 13 02807 g005
Disclaimer/Publisher’s Note: The statements, opinions and data contained in all publications are solely those of the individual author(s) and contributor(s) and not of MDPI and/or the editor(s). MDPI and/or the editor(s) disclaim responsibility for any injury to people or property resulting from any ideas, methods, instructions or products referred to in the content.