Article

Causes and Controlling Factors of Overpressure Systems in the Qingshankou Formation: Insights for Unconventional Oil and Gas Exploration

1
State Key Laboratory of Continental Shale Oil, Daqing 163712, China
2
Exploration and Development Research Institute of PetroChina Daqing Oilfield Company Limited, Daqing 163712, China
3
Sanya Offshore Oil & Gas Research Institute of Northeast Petroleum University, Sanya 572025, China
4
School of Earth Resources, China University of Geosciences (Wuhan), Wuhan 430074, China
*
Author to whom correspondence should be addressed.
Processes 2025, 13(9), 2790; https://doi.org/10.3390/pr13092790
Submission received: 7 August 2025 / Revised: 21 August 2025 / Accepted: 26 August 2025 / Published: 31 August 2025
(This article belongs to the Section Energy Systems)

Abstract

Overpressure systems in the Qingshankou Formation of the Gulong Sag have a significant impact on unconventional shale oil accumulation, but their distribution and genesis are unknown. This study uses a comparative analysis of three primary pressure prediction methods—the equivalent depth method, the Eaton method, and the Bowers method—to investigate the genetic mechanisms of overpressure and their controlling factors. The study clarifies the link between overpressure and hydrocarbon distribution. The key findings are as follows. (1) The Eaton method is identified as the best approach for estimating current formation pore pressure. The Qingshankou Formation exhibits mild overpressure development, with a maximum pressure coefficient of 1.44. (2) Hydrocarbon-generating overpressure, driven by source rock maturation, is confirmed as the dominant mechanism through integrated acoustic velocity–density cross plots and logging analysis. (3) Tectonic-sedimentary factors, such as burial depth, source rock thickness, sand-mud ratio, and faults, collectively control the spatial variability of overpressure. (4) The distribution of the Gulong shale oil and the Fuyu tight oil is influenced by overpressure, with the northwestern part of the sag and the adjacent sand bodies being the respectively favorable areas. These results lay the groundwork for accurately reconstructing paleopressure and better understanding the hydrocarbon accumulation potential of shale oil and Fuyu tight oil. They also provide guidance on the exploration and development of unconventional resources.

1. Introduction

As global energy demand rises, unconventional oil and gas resources, such as shale oil and gas, have become critical to ensuring energy security and sustainability. These resources have significant potential for diversifying energy supplies and reducing reliance on conventional sources [1,2]. Overpressure systems, as a key geological phenomenon, have a significant impact on hydrocarbon migration and accumulation, affecting the efficiency and sustainability of unconventional resource development [3]. According to statistics, 180 sedimentary basins around the world contain overpressured strata, and hydrocarbon distribution in approximately 160 basins is closely related to overpressure genesis [4,5]. Therefore, understanding the mechanisms of overpressure and their relationship with hydrocarbon accumulation is critical for guiding exploration and assessing resource potential. Moreover, abnormal pressure monitoring is critical for maintaining drilling safety. Accurate formation pore pressure prediction can improve drilling efficiency and ensure safe drilling and completion operations [6].
Given the pivotal role of overpressure systems in the global development of unconventional resources, this study focuses on the Songliao Basin—a strategically significant oil-bearing region in Northeast China. As a major hydrocarbon-producing basin, the Songliao Basin exhibits widespread overpressure within the Cretaceous Qingshankou Formation, its primary oil-producing unit [7,8]. Previous research has primarily focused on specific members or sags in the Songliao Basin, addressing issues such as overpressure distribution, genesis, and its impact on adjacent reservoir diagenesis, as well as tight oil accumulation [9,10,11,12]. These studies primarily address issues such as the distribution and genesis of overpressure [11], the impact of overpressure in source rocks on the diagenesis of adjacent reservoirs [12], and the accumulation of tight oil based on overpressure [13,14]. However, previous studies have not specifically targeted the Gulong Sag, leading to substantial inconsistencies in reported overpressure values for this area—with some accounts even documenting anomalously high pressure coefficients exceeding 1.7 [8,11]. The Gulong Sag’s Qingshankou Formation is thought to contain significant shale oil resources, with reserves totaling 15.1 billion tons [15]. Recent research has found a link between daily average shale oil and gas production and the overpressure state in this formation [8]. Yet, exploration results in some appraisal and development wells have been suboptimal due to unclear control factors for sweet spots and the ambiguous impact of overpressure on shale oil [16]. Thus, a thorough analysis of overpressure distribution and controlling factors is required to improve exploration efforts.
Formation pore pressure prediction is critical for understanding overpressure distribution. The primary prediction methods are divided into three categories. First, methods based on Terzaghi’s effective stress theory, such as the equivalent depth method [17], the Eberhart–Phillips model [18], the Bowers model [19], the Dutta method [20], and the Budge–Fudge method [21], establish relationships to calculate formation pore pressure. Second, logging-based methods such as the Eaton method show good correlation with formation pore pressure [22]. Third, seismic-based methods, such as the Fillippone formula (using seismic interval velocity) [23] and its variants, the Martinez and Liu Zhen methods [24,25], relate P-wave velocity to formation pore pressure. Recent applications of machine learning in formation pore pressure prediction have resulted in novel approaches [26,27]. However, limitations in seismic interval velocity resolution, as well as challenges like data scarcity and complex geological conditions, limit the effectiveness of machine learning methods. Consequently, traditional methods such as the Eaton method, equivalent depth method, and effective stress method continue to dominate formation pore pressure prediction in the Qingshankou Formation of the Songliao Basin [8,11,28]. Existing studies, which frequently rely on single-method approaches, produce inconsistent results for formation pore pressure prediction in the Gulong Sag, with no agreement reached. Additionally, the equivalent depth method is limited to overpressure caused by undercompaction, whereas the Eaton and effective stress methods necessitate extensive pressure measurements and well logging [29]. To accurately characterize the overpressure distribution in the Qingshankou Formation of the Gulong Sag, a practical and precise pressure prediction method is urgently required.
Overpressure genesis mechanisms are classified in a variety of ways. Bowers (1995) identified four key mechanisms: undercompaction, fluid expansion, lateral transfer, and tectonic loading [19]. Zhao et al. (2017) [30] classified these mechanisms into five categories: disequilibrium compaction, fluid expansion, diagenesis, tectonic compression, and pressure transfer, with fluid expansion further divided into hydrocarbon generation and thermal expansion. Overpressure genesis is identified using six main methods: logging curve combination analysis, the Bowers method, sonic velocity–density cross-plotting, porosity comparison, pressure calculation back-analysis, and comprehensive analysis [30,31]. Previous research has shown that overpressure in the Songliao Basin’s mudshale is primarily caused by disequilibrium compaction, hydrocarbon generation expansion, or their combined effects [8,32]. However, these studies frequently rely on a single logging-based method, ignoring the impact of sedimentary environments, sediment characteristics, and tectonic activities on overpressure formation [33]. Additionally, while most research has concentrated on the first member of the Qingshankou Formation, a systematic comparative analysis of overpressure genesis across different lithologies and stratigraphic units (first, second, and third members) in the Gulong Sag is still lacking.
The primary factors influencing overpressure distribution can be classified into six categories: (1) tectonic framework, (2) sedimentation rate, (3) source rock distribution, (4) thermal evolution degree, (5) thickness configuration of sandstone and mudstone layers, and (6) fault activity [34,35,36,37,38]. Current research on the factors that influence overpressure in the Songliao Basin has primarily concentrated on typical regions such as the Xujiaweizi Fault Depression and the Qiaojia-Gulong Sag. Existing research has shown that the evolution of overpressure in the Xujiaweizi Sag is primarily influenced by sedimentation rate, mudstone thickness, and source rock maturity [39]. In contrast, the formation of overpressure in the Qiaojia-Gulong Sag is influenced by several factors, including sedimentary environment, tectonic evolution, fluid properties, and burial depth [8]. Notably, research on the factors that control overpressure in the Gulong Sag remains limited, which limits our understanding of the coupling relationship between the overpressure system and hydrocarbon accumulation in this area.
This study investigates the overpressure characteristics of the Qingshankou Formation in the Gulong Sag, Songliao Basin, through four key research tasks, as outlined in the workflow presented in Figure 1. (1) Formation pore pressure is calculated using the equivalent depth method, Eaton method, and Bowers method with integrated drilling and logging data, and the most appropriate method is identified by comparing it to measured pressure data. (2) Single-well pressure calculations are performed using the chosen method to create a planar overpressure distribution model using spatial interpolation, and the vertical distribution of overpressure is examined along typical well profiles. (3) Logging curve analysis and sonic velocity–density cross-plotting are used to identify overpressure genesis types and dominant mechanisms, revealing the primary controlling factors. (4) The spatial relationship between overpressure systems and shale oil reservoirs is studied to better understand the role of overpressure in shale oil accumulation and its influence on hydrocarbon enrichment in the Fuyu tight oil reservoir. The core innovations are as follows: (1) a systematic comparison of multiple pore-pressure prediction methods to identify the most reliable approach for present-day pressure estimation in the study area; (2) an investigation into the key geological controls on overpressure development; and (3) an analysis of the critical role that overpressure plays in the accumulation of both shale oil and the Fuyu tight oil reservoir.

2. Geological Setting

The Songliao Basin is the largest Mesozoic-Cenozoic continental petroleum basin with a dual structure (lower fault and upper depression) in Northeast China, covering 26 × 104 km2 [40]. The basin has six major structural units: the central depression, the western slope, the northeast uplift, the southeast uplift, the northern dip, and the southwest uplift (Figure 2a) [7,41]. The Gulong Sag, located in the western part of the central depression, features a monocline structure dipping southeastward from the northwest. It covers an area of about 3700 km2 (Figure 2a) [42]. The sedimentary strata in the Gulong Sag include faulted, depressed, and inverted units, ranging from oldest to youngest: Lower Cretaceous Huoshiling (K1h), Shahezi (K1sh), Yingcheng (K1yc), Denglouku (K1d), and Quantou (K1q) Formations; Upper Cretaceous Qingshankou (K2qn), Yaojia (K2y), Nenjiang (K2n), Sifangtai (K2s), and Mingshui (K2m) Formations; Paleogene Yi’an Formation (E2y); and the Neogene Da’an (N2d) and Taikang (N2t) Formations [43].
Exploration results show that the northern Songliao Basin’s middle-shallow strata contain two major oil-generating formations (Qingshankou and Nenjiang Formations) as well as seven key oil-bearing units (Heidimiao, Saertu, Putaohua, Gaotaizi, Gulong, Fuyu, and Yangdachengzi) [7]. In the Gulong Sag, the organic-rich shale of the Qingshankou Formation is the dominant source rock and seal, determining the distribution of source-reservoir-seal assemblages and hydrocarbon accumulations [46]. This study focuses on the Qingshankou Formation, which is made up of three members: Qing-1 (K2qn1), Qing-2 (K2qn2), and Qing-3 (K2qn3) (Figure 2b). The lithology of the Qing-1 member is primarily mudstone and shale, with dark mudstone thicknesses ranging from 30 to 100 m. The Qing-2 and Qing-3 members are primarily composed of mudstone, shale, argillaceous siltstone, siltstone, and fine-grained sandstone, with a total formation thickness of 300 to 400 m. The Qingshankou Formation shows clear lateral variability in lithology. Thick, laterally continuous mudstones dominate the sag center, whereas toward the margins, sandstone bodies become increasingly prevalent, resulting in greater lithological heterogeneity [8,44]. The vitrinite reflectance (Ro) of source rocks in the Gulong Sag’s Qingshankou Formation decreases from more than 1.6% in the center of the Gulong Sag to around 1.2% at its margins, indicating that organic matter has matured to a high level. This stage has a high gas-oil ratio, making it the primary formation stage for condensate oil [47].

3. Data and Methodology

3.1. Data

The drilling and logging data for this study were collected from 86 wells in the Gulong Sag (Figure 2a). These data, which include well depth, lithology, acoustic transit time (AC), density (DEN), and resistivity (Rt), give a complete picture of the target formations. Formation pore pressure data were collected from 34 wells, totaling 72 data points. Stratigraphic data, sandstone and mudshale thicknesses, and fault information were obtained through integrated drilling, logging, seismic, and geological modeling analyses, but they are not discussed here.

3.2. Methodology

Due to data availability and geological complexities, formation pore pressure prediction in the Gulong Sag relies primarily on three established methods: the Eaton method, the Bowers method, and the equivalent depth method. Given that each method is uniquely suited to different overpressure mechanisms, this study conducts a thorough comparative analysis to determine the most accurate and reliable prediction method for the region.

3.2.1. Equivalent Depth Method

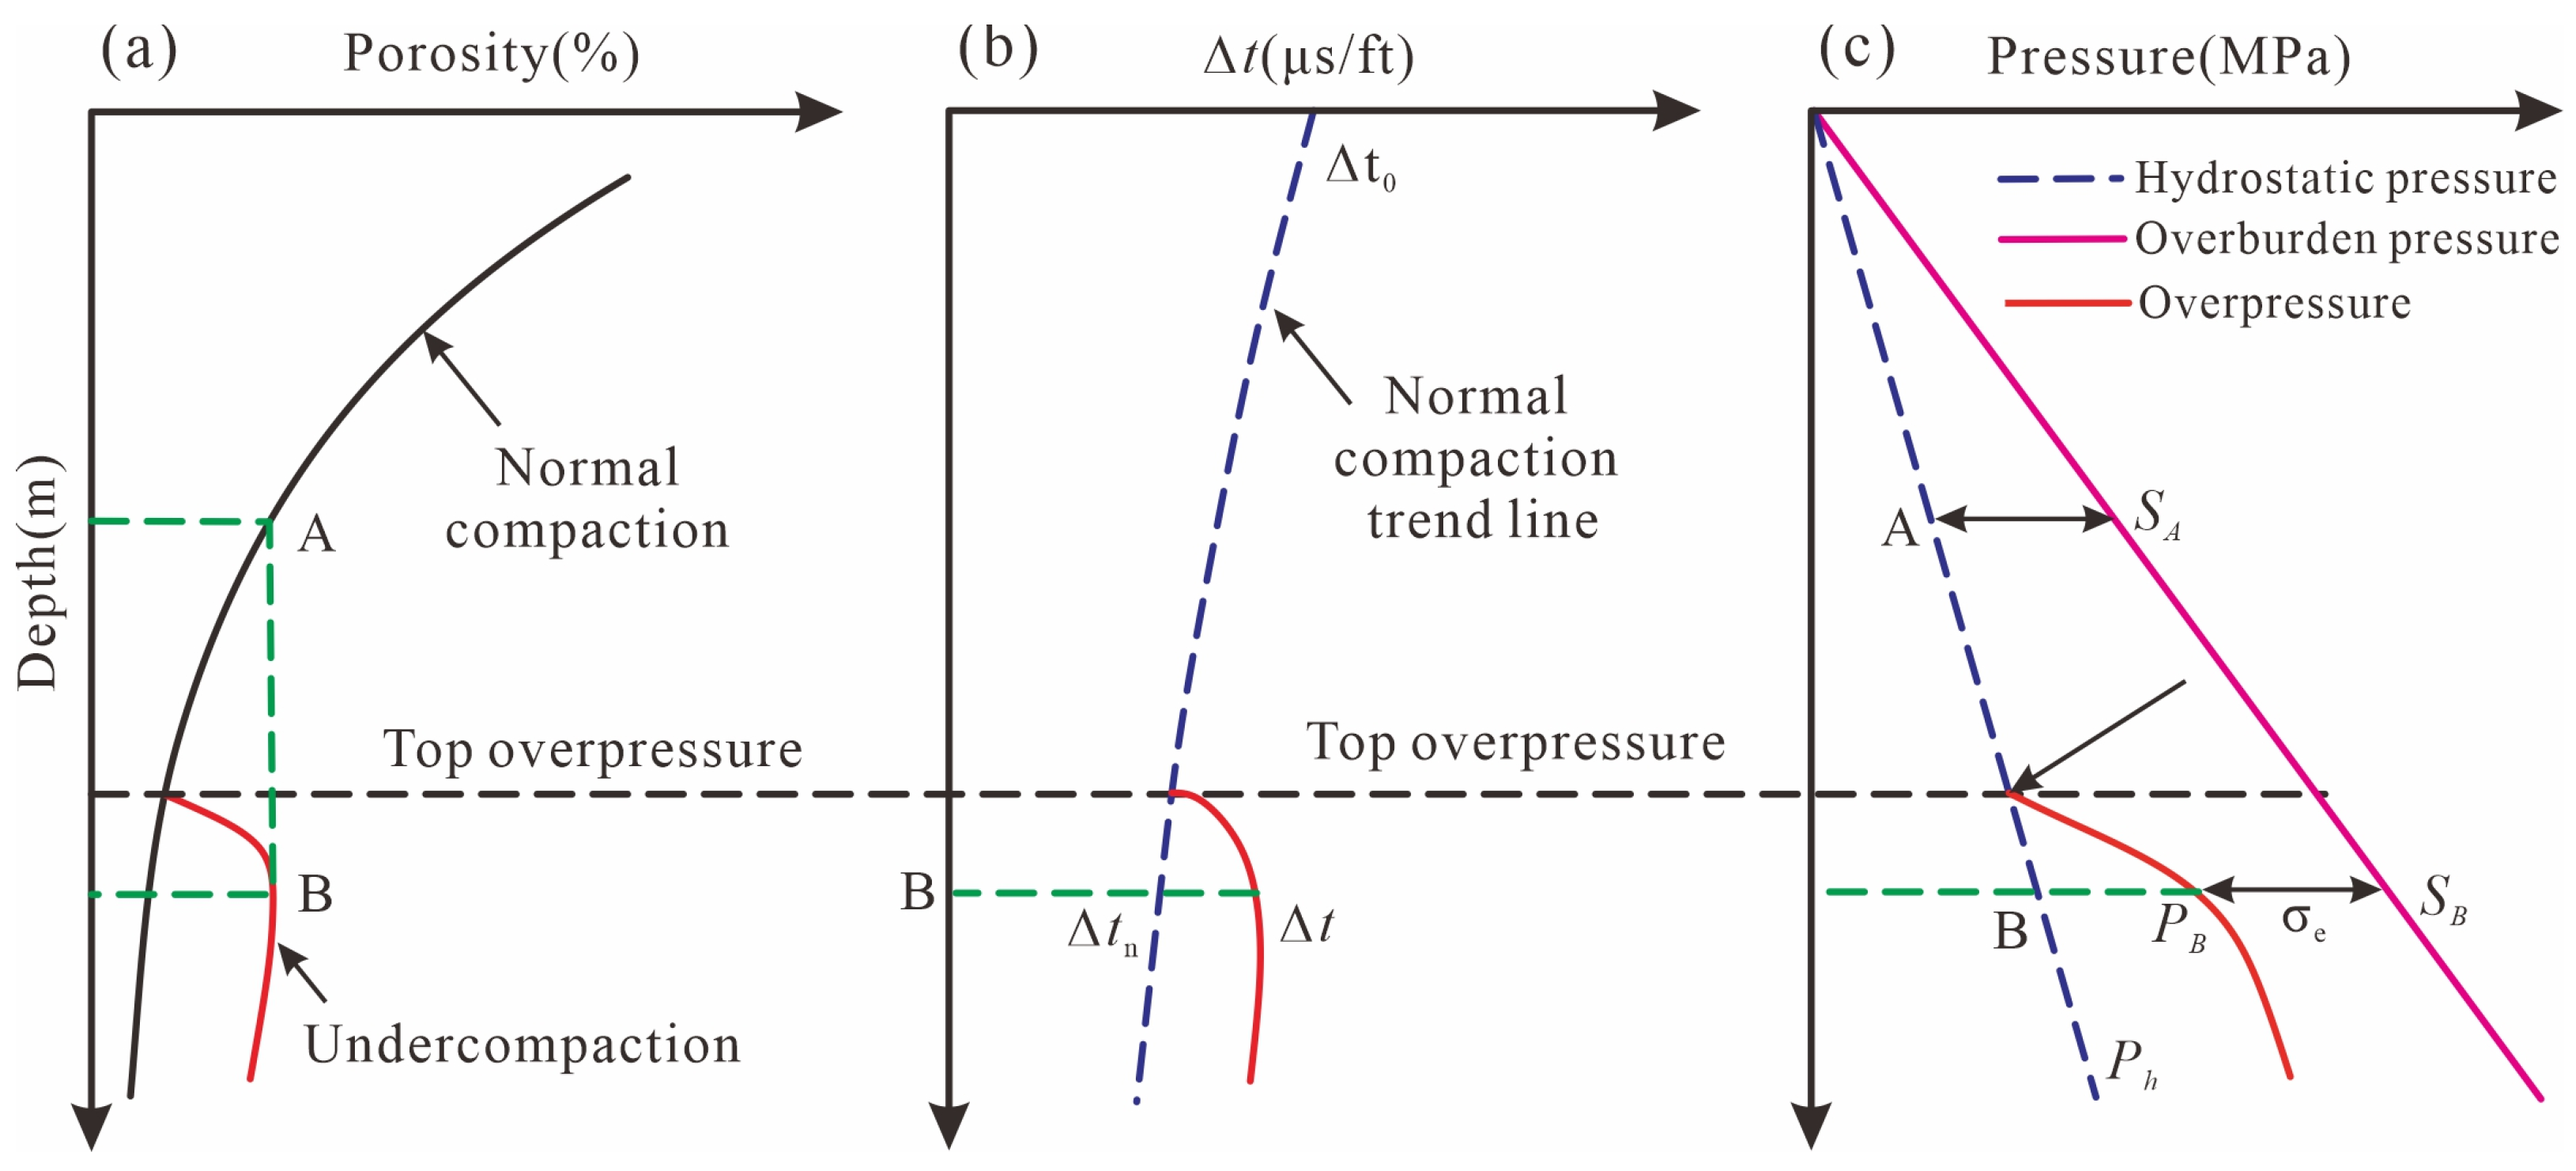
The theoretical foundation of the equivalent depth method is primarily based on the effective stress principle, which states that formations with identical porosity will have the same degree of compaction and, as a result, the same effective stress. In other words, two depth points with identical porosity values are assumed to have the same effective stress (Figure 3a,c) [20,33]. This principle enables the calculation of the pore fluid pressure PB at point B:
P B = S B ( S A P A ) = ρ ω g H A + ρ m g H B H A
where PA and PB represent pore fluid pressures at points A and B, respectively, MPa; SA and SB represent the overburden pressures at points A and B, respectively, MPa; ρω (1.0 g/cm3 on average in the study area) and ρm represent the formation water and overburden rock densities, respectively, g/cm3; HA and HB are the depths of points A and B, respectively, m; and g is the gravitational acceleration, with a value of 9.8 m/s2.
To predict pressure using the equivalent depth method, it is important to accurately determine the depth HA of point A and the density ρm of the overburden rock. This requires creating a precise normal compaction trend line and a formation density-depth relationship curve.
(1) Establish the normal compaction trend: select mudstone intervals thicker than 2 m to plot acoustic time difference-depth cross-plots, fit an exponential trend line to these data points to define the normal compaction curve, and calculate the equivalent depth HA for point B using Equation (2):
H A = 1 C ln Δ t 0 ln Δ t
where ∆t and ∆t0 represent the acoustic time difference at point B and surface mudstone, respectively, μs/ft, and C is the inverse of the slope of the normal trend line, dimensionless.
(2) Derive the density trend line: fit an exponential relationship between mudstone density and depth; then, use Equation (3) to calculate density at point B:
ρ m = ρ 0 e C 1 H A + ρ 0 e C 1 H B 2
where ρ0 is the surface mudstone density, g/cm3; and C1 is the inverse slope of the density trend line, dimensionless.

3.2.2. Eaton Method

The Eaton method is a semi-empirical, semi-quantitative approach to predicting formation pore pressure. Its principle is based on the observation that in clastic rock formations, the compaction trend in overpressured zones deviates from the normal trend because of overpressure, with the degree of deviation positively correlated with the magnitude of overpressure. The Eaton coefficient c establishes an empirical relationship between the ratio of measured values to normal compaction trend values at the same depth and formation pore pressure, allowing for the prediction of formation fluid pressure (Figure 3b,c) [22,48]. The formula for calculating pore fluid pressure is given below.
P B = S B ( S B P h ) Δ t n Δ t c = ρ m g H B ( ρ m g H B ρ w g H B ) Δ t n Δ t c
where PB, SB, and Ph represent the pore fluid pressure, the overburden pressure, and the hydrostatic pressure at point B, respectively, MPa; Δt and Δtn represent the measured and normal acoustic time differences at point B, respectively, μs/ft; c is the Eaton exponent; and HB is the burial depth of point B, m.
The Eaton coefficient c is calculated iteratively as c0 + k × Δc (with c0 = 0, k = 1, 2, …, and Δc = 0.1). The relative error between the measured and predicted pressures is then calculated for each Eaton exponent. The Eaton exponent with the lowest root-mean-square error (RMSE) is chosen as the best solution. The formula for calculating RMSE is as follows:
R M S E = i = 1 n Y i X i 2 n
where Y and X represent the predicted pressure and the measured pressure, MPa, and n is the number of samples.

3.2.3. Bowers Method

The Bowers method predicts formation pore pressure while taking into account mudstone undercompaction and fluid expansion. Unlike other methods, it does not rely on a standard compaction trend line. Instead, it directly calculates vertical effective stress using the original loading and unloading curve equations for vertical effective stress and acoustic velocity. The formation pore pressure is then determined using the effective stress principle, which considers the overburden pressure and the vertical effective stress [19,49,50]. Bowers (1995) [19] proposed a power relationship between acoustic velocity and effective stress:
v p = v m l + A σ e B
where νp is the compressional velocity at a given depth, ft/s; νml is the compressional velocity in the mudstone baseline, with a value of 5000 ft/s; σe is the vertical effective stress, MPa; and A and B are the parameters calibrated with offset velocity versus effective stress data, dimensionless.
When formation uplift or unloading occurs, the effective stress and compressional velocity diverge from the loading curve, resulting in a higher velocity at the same effective stress than the loading curve. Bowers (1995) [19] proposed the following empirical relationship to account for this deviation due to unloading.
v p = v m l + A σ max σ e σ max 1 U B
where σe, νp, νml, A, and B retain their previous definitions; U denotes the uplift parameter, dimensionless; and
σ max = v max v m l A 1 / B
where σmax is the estimate of the effective stress at the onset of unloading, MPa, and νmax is the estimate of the velocity at the onset of unloading, ft/s. Without significant lithological changes, νmax is usually set to the velocity at the beginning of the velocity reversal.
Rearranging Equation (7), the pore pressure for the unloading scenario can be derived as follows:
p u l o = σ V v p v m l A U B σ max 1 U
where pulo is the pore pressure during unloading, MPa, and σV is the overburden stress, MPa.

4. Results and Discussions

4.1. Evaluation of Formation Pore Pressure

4.1.1. Measured Pressure

The pressure coefficient, defined as the ratio of formation pressure to hydrostatic pressure at a given depth, is a popular metric for measuring pressure magnitudes that accurately reflects the relationship between abnormal pressure and hydrostatic pressure. Formation pressure states are classified into four categories based on the pressure coefficient (Pc): underpressure (<0.96), normal pressure (0.96–1.06), high pressure (1.06–1.2), and overpressure (>1.2). Overpressure is classified into three categories: mild (1.2–1.6), strong (1.6–2.0), and extreme (>2.0) [51,52]. According to the analysis results, overpressure in the Qingshankou Formation begins at a depth of approximately 1050 m (overpressure top interface) and increases with depth. Pressure data from the Gulong Sag show that the Qingshankou Formation’s pore pressure ranges from 6 to 35.06 MPa, with pressure coefficients ranging from 0.83 to 1.44 (Figure 4). Specifically, the Qing-1 member has formation pore pressures ranging from 13.56 to 35.06 MPa (average 21.76 MPa) and pressure coefficients ranging from 0.97 to 1.44 (average 1.08). Thus, the formation is characterized predominantly by high pressure, with local overpressure conditions. In contrast, the Qing-2 and Qing-3 members have formation pore pressures of 6–33.95 MPa (average 16.79 MPa) and pressure coefficients of 0.83–1.42 (average 1.04), indicating a mix of normal and high-pressure zones.

4.1.2. Optimization of Prediction Methods

Given the scarcity of measured pressure data points in the Qingshankou Formation, accurately determining the spatial distribution of formation pore pressure is a significant challenge. Therefore, selecting the best approach for predicting formation pore pressure across the study area is critical. In this study, the equivalent depth method, Bowers method, and Eaton method are used to forecast formation pore pressure using measured pressure data from the study area as well as logging and drilling data from 86 wells. The three methods’ predictions were validated against measured data from 37 wells, yielding the following relative errors (relative error = (predicted value − actual value)/actual value × 100%): the relative error of the Eaton method ranges from −20% to 20%, and the RMSE values of the equivalent depth method, Bowers method, and Eaton method are 43.54%, 24.17%, and 13.05%, respectively. Based on the comprehensive analysis of relative error and RMSE, the Eaton method is considered to have high accuracy and applicability for pressure prediction in this area (Figure 5).
To further validate this conclusion, it is essential to discuss the theoretical distinctions between the Eaton and Bowers methods and their relevance to the geological conditions of the Gulong Sag. In the context of hydrocarbon accumulation, Eaton’s method is primarily empirical, relying on observed relationships between sonic velocity (or resistivity) and normal compaction trends, with overpressure inferred from deviations from these trends [22]. It performs optimally in settings where disequilibrium compaction dominates overpressure generation, particularly in stable, mudstone-rich sequences. In contrast, the Bowers method is grounded in rock physics, explicitly linking acoustic velocity to effective stress and accommodating both loading (compaction-dominated) and unloading (fluid expansion-related) processes [19]. This renders it especially suitable for geologically complex regions characterized by significant uplift or multifaceted pressure histories.
The superior performance of the Eaton method in this study aligns with the geological history of the Gulong Sag. Since the deposition of the Qingshankou Formation, the area has undergone limited tectonic disruption and negligible uplift, resulting in a largely stable burial environment without pronounced unloading effects [8]. These conditions closely match the compaction-driven overpressure scenarios where the Eaton method is most effective. The comparatively higher root mean square error (RMSE) of the Bowers method (24.17%) can be attributed to the absence of the strong unloading mechanisms or complex tectonic events that the method is designed to model. In the absence of such processes, the physical responses central to the Bowers approach—such as velocity anomalies induced by unloading—are not significantly expressed, reducing its predictive accuracy. Thus, the results presented in Figure 5 do not conflict with theoretical expectations but instead underscore the critical importance of selecting a pore-pressure prediction method that aligns with the specific geological context of the study area.
It is also important to acknowledge several potential limitations that may affect the interpretability of the conclusions. First, uncertainties in seismic velocity data could introduce errors into pore pressure predictions. The Eaton method relies critically on accurate sonic or seismic velocity determinations to detect deviations from normal compaction trends; while logging and drilling data from 86 wells were used in the prediction process, velocity perturbations within the Qingshankou Formation’s thinly interbedded sand-mudstone sequences may still lead to localized anomalies. Second, potential inaccuracies in direct pressure measurements might impact validation: the 72 formation pressure data points from 37 wells could be influenced by wellbore fluid invasion, transient pressure effects during testing, or instrumental error (typically within ±5%), which may introduce slight biases into relative error and RMSE calculations—particularly for intervals with low absolute pressure values. Nevertheless, over 80% of the measured points exhibit relative errors within ±15% even when accounting for these uncertainties, supporting the robustness of the conclusion that the Eaton method delivers the highest predictive accuracy in this setting.

4.1.3. Pressure Distribution Characteristics

(1)
Plane Distribution Characteristics
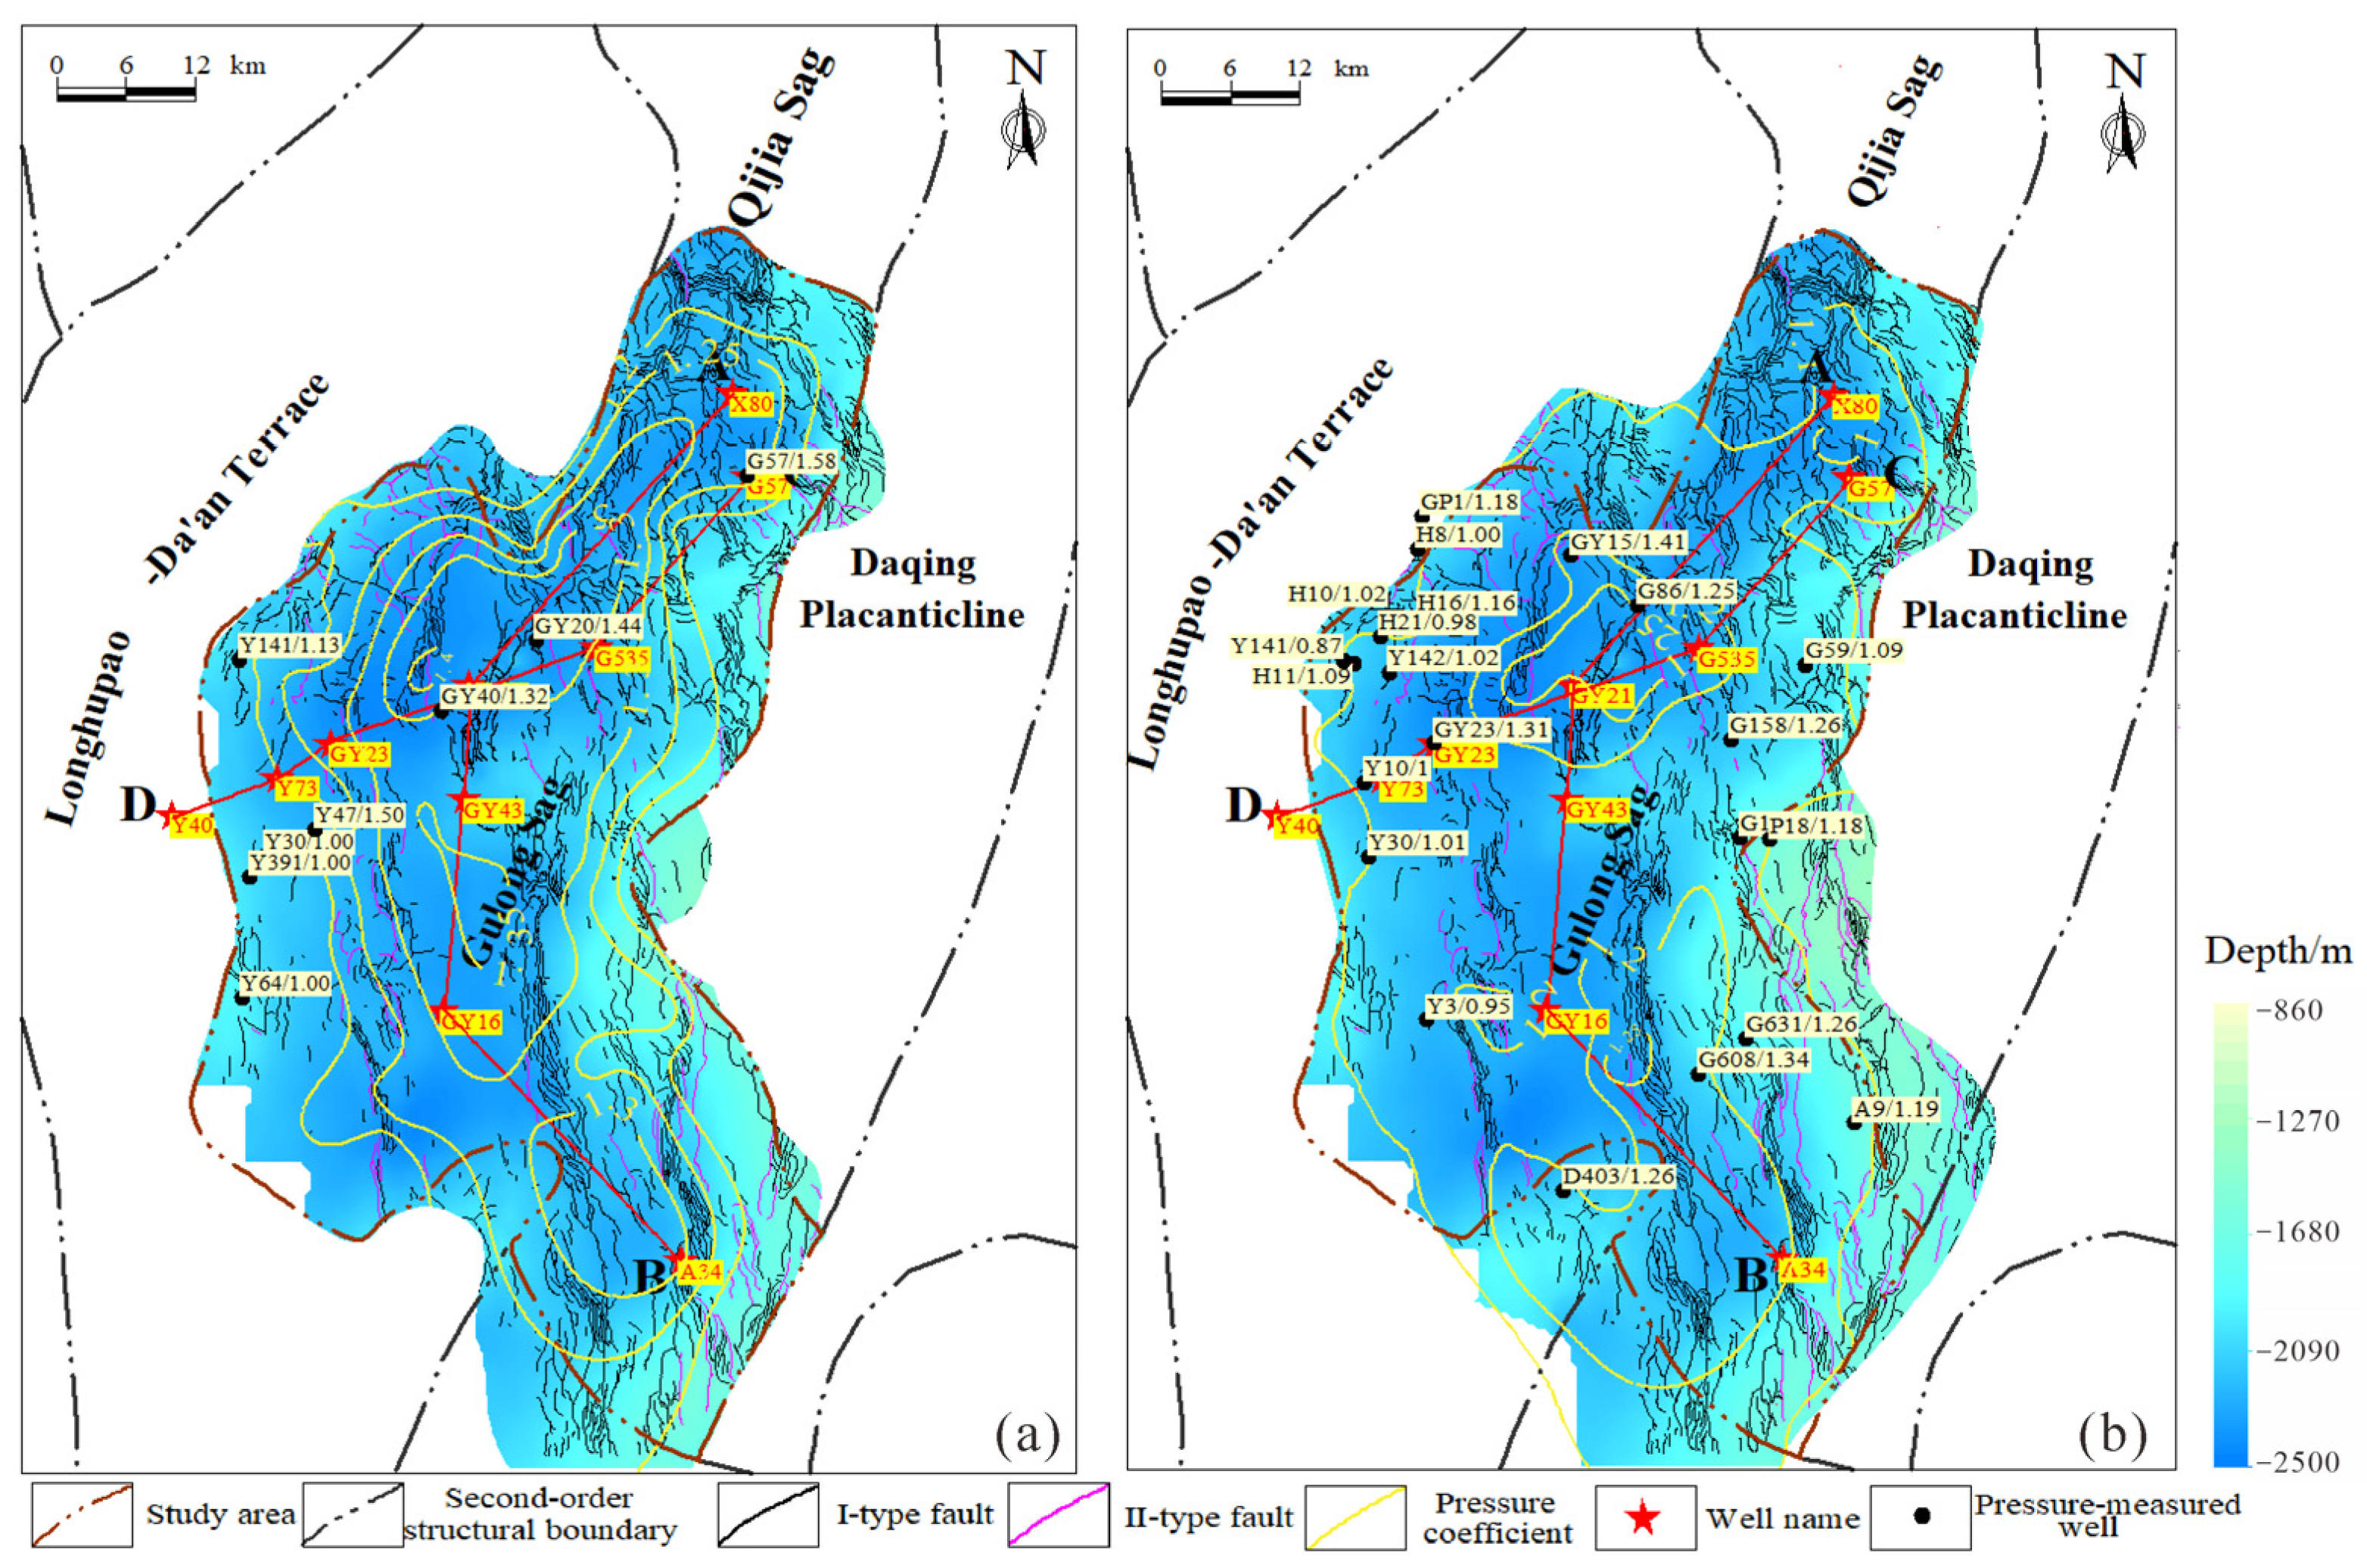
Accurate prediction and management of high-pressure zones are critical for maximizing resource utilization while minimizing environmental impacts associated with unconventional oil and gas exploration, such as water consumption and surface disturbance. Based on logging data from 86 wells in the Gulong Sag, the Eaton method was used to calculate formation pore pressure and generate isopach maps of pressure coefficients for the Qing-1 and Qing-23 members (Figure 6). The figures show that the center of overpressure development is located in the northern part of the sag, with a clear north-south gradient in formation pressure, and the highest pressure coefficients are concentrated in this northern region of the Gulong Sag. The degree and distribution of overpressure in the Qingshankou Formation, in particular, vary significantly. The Qing-1 member has the most extensive overpressure development, covering the majority of the Gulong Sag, with a gradual increase in the formation pressure coefficient from south to north, reaching a peak of 1.44. It demonstrates a significant north-south gradient in overpressure development, particularly in the Qing-1 member. In contrast, the Qing-2 and Qing-3 members exhibit lower overpressure and a narrower distribution range. Understanding these distinctions is critical for targeted exploration and development strategies because it identifies regions with greater potential for unconventional oil and gas resources. Overpressure in these members is limited to narrow areas in the Sag’s northern, central, and southern parts, with the Qing-23 members’ maximum pressure coefficient in the northern part reaching 1.3.
(2)
Profile Distribution Characteristics
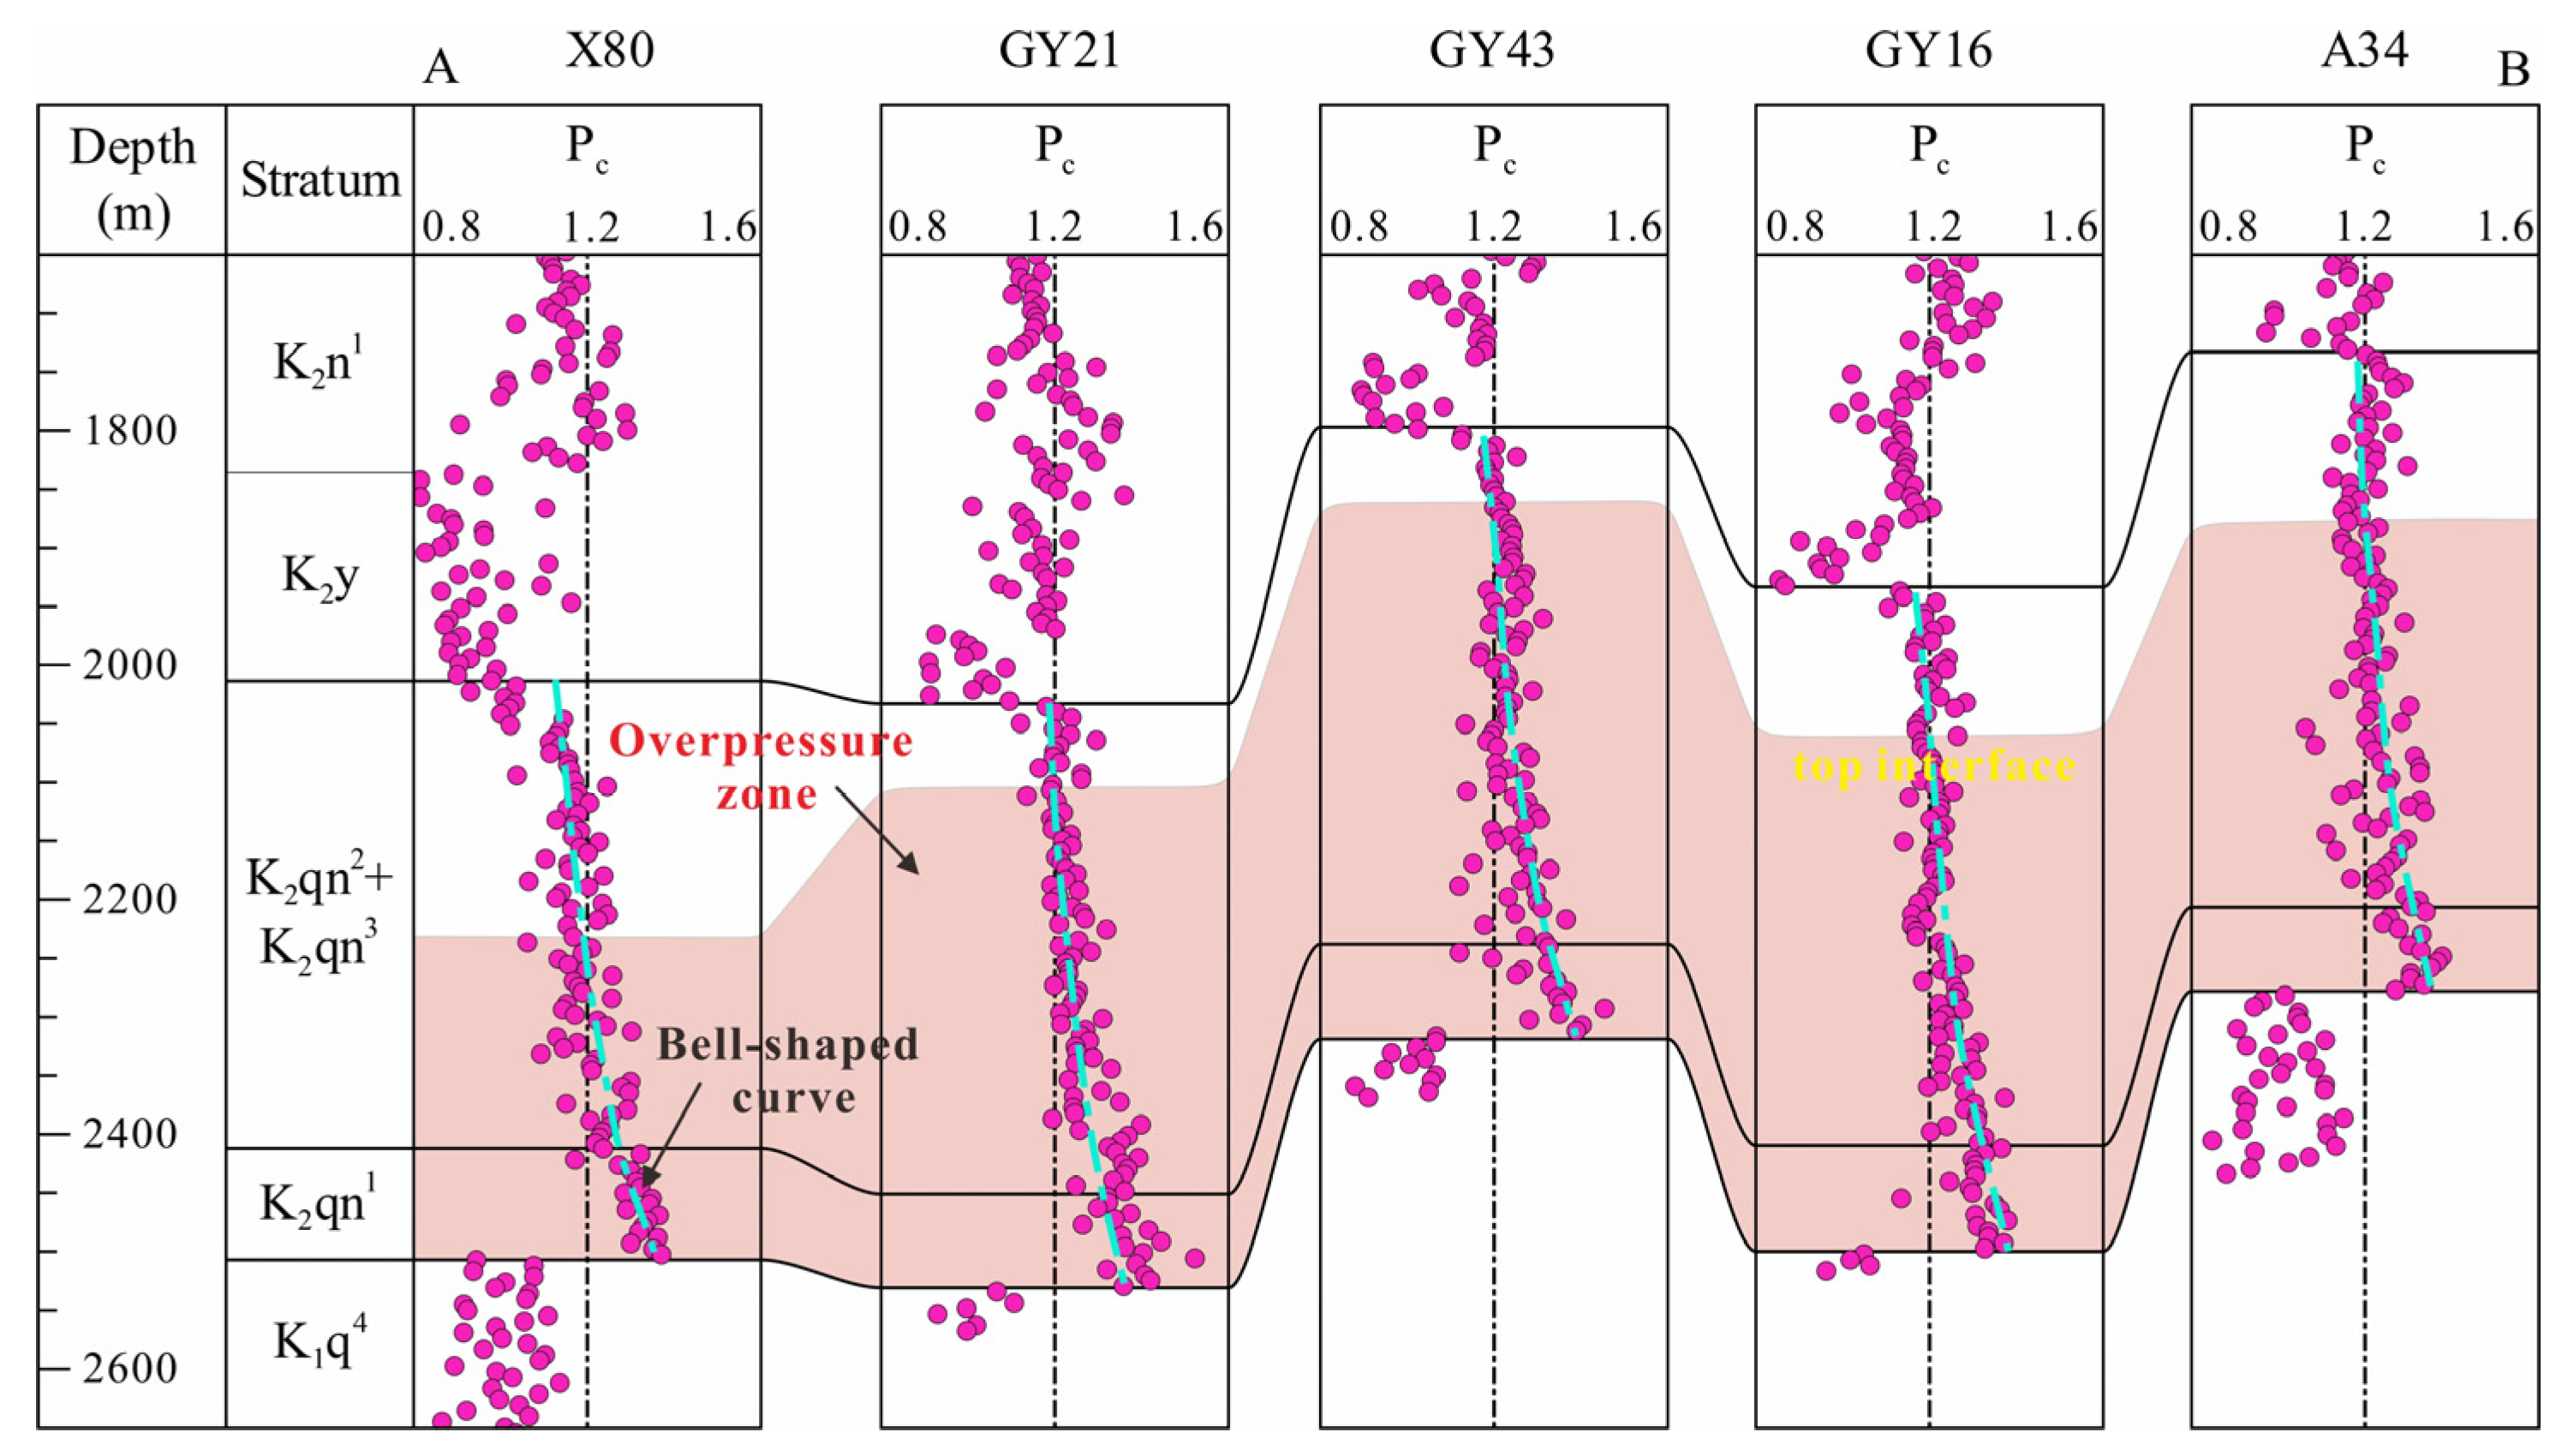
Ten wells from the Gulong Sag were chosen to create overpressure cross-sections in the north-south (A-B) and east-west (C-D) directions (Figure 6). These sections were examined to determine the vertical distribution, amplitude, and top interface depth of overpressure zones. Figure 7 and Figure 8 show that the Qingshankou Formation is generally overpressured, with the Qing-1 member having the most pronounced overpressure. The pressure coefficient for the Qing-1 member ranges from 1.2 to 1.5, with a peak of 1.44, indicating mild overpressure. The pressure coefficient for the Qing-2 and Qing-3 members ranges between 1.0 and 1.4, with a maximum of 1.37 indicating high pressure to mild overpressure.
The “bell-shaped” pattern is predominantly observed in wells located in the structurally stable central depocenter of the sag (e.g., Wells GY43 and G535). These areas have experienced continuous burial without significant tectonic disturbance since the deposition of the Qingshankou Formation. The stable structural setting limits the development of large-scale faults or fractures, creating favorable conditions for overpressure sealing—hydrocarbons have little opportunity for expulsion, and overpressure accumulates continuously with depth. The rapid decrease in pressure coefficient at a certain depth is attributed to local pressure release (without large-scale leakage) once the overpressure reaches the threshold of the mudstone’s sealing capacity, which is sustained by the undisturbed burial background.
In contrast, the “arc-shaped” pattern is more common in wells at the sag flanks or transitional zones near fault systems (e.g., Wells Y40 and Y73), where the structural setting is relatively unstable. Proximity to faults provides effective pathways for hydrocarbon expulsion: even as overpressure accumulates with depth, continuous leakage of hydrocarbons through fault/fracture networks weakens the overall pressure build-up, leading to the slow, gradual decrease in pressure coefficient after the peak. This aligns with the influence of structural instability on pressure preservation.
Cross-well sections show a strong correlation between overpressure and burial depth. Wells GY21 and G535, located in the center of the Gulong Sag, have a deeper burial depth and more pronounced overpressure characteristics than Wells X80 and Y73, which are on the flanks and have shallower burial depths and less distinct overpressure features. This evidence confirms that the central part of the Gulong Sag has greater overpressure development and thicker overpressure zones, which gradually thin out from the center to the edges. The transition from a bell-shaped to an arc-shaped pressure coefficient distribution from the sag center to its edges suggests that hydrocarbons may have migrated laterally or reversedly along the sag margins at the base of the Qingshankou Formation, resulting in a pressure coefficient reduction. The overpressure top interface depth varies from 1750 to 2033 m and decreases as burial depth increases. The thickness of the overpressured stratum decreases from the sag center to the flank, with overpressure forming primarily in the Qing-1 Member and the lower part of the Qing-2 Member.

4.2. Causes of Overpressure

This study investigates 86 wells in the Gulong Sag using integrated logging curve analysis and acoustic wave velocity–density cross-plotting to identify and synthesize the mechanisms of overpressure in the Qingshankou Formation. Understanding these mechanisms is critical for unconventional oil and gas exploration because they directly affect hydrocarbon distribution and preservation. For example, hydrocarbon generation expansion overpressure implies active hydrocarbon generation and migration, which favors tight oil and gas accumulation. In contrast, disequilibrium compaction overpressure occurs in rapidly deposited thick fine-grained sediments (e.g., deltas, turbidites) due to insufficient fluid expulsion, which results in undercompaction [53].

4.2.1. Logging Curve Combination Method

The combined logging curve analysis method determines the causes of formation pressure by examining deviations in acoustic travel time, formation density, and resistivity from the normal compaction trend line, as well as the consistency of anomaly depths across multiple curves. In contrast, under normal compaction, the acoustic time difference decreases while density and resistivity increase with burial depth (Figure 9a). Under overpressure caused by disequilibrium compaction, the acoustic time difference increases with burial depth, while resistivity and density fall sharply. Under overpressure caused by hydrocarbon generation expansion, the acoustic time difference and resistivity increase significantly, while density decreases with burial depth (Figure 9a). Moreover, the timing of reversals in the three logging curves (acoustic wave velocity, resistivity, and density) is an important indicator for determining the causes of overpressure. If all three curves reverse at the same time, it is most likely due to undercompaction. Conversely, if they reverse at different times, notably when the density curve lags behind the others, overpressure could result from processes such as hydrocarbon generation expansion or tectonic compression [31,48,49].
Using Well G535 as an example, the logging curve combination analysis chart shows a strong correlation between overpressure and lithology (Figure 10). The Yaojia Formation is made up of interbedded siltstone and silty mudstone; the upper Qing-2 and Qing-3 are made up of silty mudstone intercalated with thin mudstone layers; the lower Qing-2, Qing-3, and Qing-1 are made up of organic-rich mudshale; and member 3–4 of the Quantou Formation has mudstone and argillaceous siltstone interbedded. Overpressure distribution is highly correlated with lithology, with the thick mudshale in Qing-1 serving as the primary overpressure interval, characterized by low compaction and significant hydrocarbon generation. In contrast, silty interlayers, which have a higher permeability, prevent overpressure formation.
The logging curves in Well G535 (Figure 10) show typical responses associated with hydrocarbon generation overpressure: the acoustic travel time and resistivity curves show synchronous abnormal reversal (increasing with depth) at 1950 m, which is consistent with the effect of elevated pore fluid pressure caused by hydrocarbon charging. The density curve lags behind, decreasing at around 2100 m, which is due to the time delay caused by the “fluid substitution effect” during hydrocarbon production. After organic matter is pyrolyzed into hydrocarbons, it takes time to displace pore water through the pore network, so the density response lags behind the acoustic and resistivity signals. According to the overpressure cause discrimination chart (Figure 9), the asynchronous reversal of the three curves with density lag fully matches the logging response model for “hydrocarbon generation expansion overpressure,” confirming that hydrocarbon generation is the primary cause of overpressure in the Qingshankou Formation.

4.2.2. Acoustic Velocity–Density Method

The acoustic wave velocity–density cross-plot, developed from Bowers’ theory, is a popular tool for determining overpressure causes. Overpressure caused by disequilibrium compaction is shown on the loading curve. In contrast, overpressure caused by fluid expansion, tectonic compression, clay mineral transformation, or a combination of the three is shown on the unloading curve. (1) Overpressure caused by fluid expansion is characterized by a decrease in acoustic velocity as overpressure increases, while density remains relatively stable. (2) As overpressure from tectonic compression increases, so do acoustic velocity and density. (3) Clay mineral transformation-related overpressure is characterized by increased density but stable or slightly decreasing acoustic velocity. (4) As overpressure increases, disequilibrium compaction causes a decrease in acoustic velocity and density [20,31] (Figure 9b).
Acoustic velocity–density cross-plots from 86 wells in the Gulong Sag demonstrate that overpressure in the Qingshankou Formation is caused by hydrocarbon generation expansion and undercompaction. Quantitative evaluation with the AC/Rt/DEN-effective stress model [54] reveals that hydrocarbon generation expansion contributes 60.65–93.32% (mean 77.07%) to the overpressure in the Qing-1 member and 58.80–92.43% (mean 76.09%) in the Qing-2 and Qing-3 members. The analysis shows that hydrocarbon generation expansion is the primary cause of overpressure in the Qingshankou Formation. The acoustic velocity–density scatter points for the Qingshankou Formation in Wells G66 and GY39 primarily correspond to the unloading curve, which shows decreasing acoustic velocity and stable density as overpressure increases (Figure 11). Some points extend in the opposite direction of the loading curve, indicating that as overpressure decreases, so do acoustic velocity and density. The evidence suggests that overpressure in the Qingshankou Formation is primarily caused by the combined effects of hydrocarbon generation expansion and disequilibrium compaction, with hydrocarbon generation playing the dominant role. Detailed analysis reveals that the Qing-2 and Qing-3 members have more scatter points extending in the opposite direction of the loading curve than the Qing-1 member. It suggests that the Qing-2 and Qing-3 members are more susceptible to disequilibrium compaction as a result of differences in sedimentary environment or lithology. However, hydrocarbon generation expansion remains the primary source of overpressure in these members.

4.3. Controlling Factors of Overpressure

4.3.1. Buried Depth/Maturity

Previous pressure distribution analysis revealed a strong correlation between formation pore pressure and burial depth in the Qingshankou Formation (Figure 6, Figure 7 and Figure 8). To further investigate this relationship, a statistical analysis was performed on the average burial depth and pressure coefficients of the Gulong Sag’s Qing-1 and Qing-23 members. The pressure coefficient of the Qing-23 members gradually increases with increasing burial depth, whereas the pressure coefficient of the Qing-1 member initially rises slowly before rapidly increasing with depth (Figure 12a,b). The results can be explained as follows. At shallow burial depths, less compacted sediments, high rock porosity, and well-developed fractures allow for unobstructed fluid discharge, making overpressure development unlikely. Overburden pressure and sediment compaction become more intense as the burial depth increases. Rapid sedimentation causes compaction to outpace fluid expulsion, resulting in decreased rock porosity, microfracture aperture, lower permeability, and obstructed fluid discharge, eventually leading to overpressure formation. Furthermore, the planar distribution characteristics of pressure exhibit a strong correlation with (Ro) (Figure 2 and Figure 6). When organic matter reaches the hydrocarbon generation threshold with increasing burial depth, hydrocarbon production increases significantly. As maturity progresses, the hydrocarbon generation process shifts from oil-dominant to gas-dominant, resulting in a gradual increase in pressure from hydrocarbon formation. Similar trends have been documented in other lacustrine basins with analogous geological backgrounds. For example, in studies on the Shahejie Formation of the Dongying Sag, Bohai Bay Basin, Han (2012) also observed a positive correlation between burial depth and pressure coefficient in muddy shales [55], which was attributed to intensified compaction and restricted fluid discharge with increasing depth—consistent with the mechanism in the Gulong Sag.

4.3.2. Source Rock Thickness

The hydrocarbon source rock produces overpressure fluid and serves as the overpressure reservoir’s sealing cap. Its thickness has a significant influence on the distribution of the overpressure zone. Thicker hydrocarbon source rocks typically contain more organic matter and have a higher hydrocarbon potential, resulting in more fluids (such as oil, gas, and water) [56]. During compaction, thick hydrocarbon source rocks have a longer fluid-discharging path and lower discharge efficiency, which impedes fluid discharge and causes overpressure [57]. Statistical analysis reveals a relationship between the thickness of hydrocarbon source rocks and pressure coefficients in the Qing-1 and Qing-23 members. The thickness of the Qing-1 member varies between 35.1 m and 94.5 m, with an average of 66.76 m. The Qing-23 members’ thickness ranges from 43.79 m to 479.05 m, with an average of 293.73 m. Notably, though the Qing-23 member has thicker source rocks, overpressure is more developed in the Qing-1 member. This discrepancy may relate to differences in organic matter maturity and hydrocarbon generation intensity: the Qing-1 member exhibits higher maturity and stronger hydrocarbon generation, and its substantial hydrocarbon generation—more critical than source rock thickness alone—effectively drives overpressure development. There is a clear trend in which the thickness of these source rocks increases with increasing pressure. This suggests that the total thickness of hydrocarbon source rocks in the Qingshankou Formation is significantly correlated with the distribution of overpressure and plays an important role in determining the spread of the overpressure system. This relationship between source rock thickness and overpressure has parallels in other lacustrine basins. In the Dongying Sag (Bohai Bay Basin), Zhao (2008) observed that high-value zones of abnormal overpressure correspond well to areas with thick dark mudstones [58]—this mirrors the phenomenon in the Gulong Sag, where greater thickness of the Qingshankou Formation source rocks is associated with higher pressure coefficients.

4.3.3. Sand–Mud Ratio

The sand-mud ratio is critical for assessing reservoir quality and fluid flow behaviors, which have a significant impact on the exploration and development of unconventional oil and gas reserves [59]. Statistical analysis of the sand-mud ratio was conducted in this study for mudstone-dominated intervals. The results show that in the Qing-1 member, the sand-mud ratio ranges from 0 to 0.99, with an average of 0.32, while in the Qing-2 and Qing-3 members, it ranges from 0 to 0.88, with an average of 0.16. Further refined analysis by sand-mud ratio intervals reveals a clear segmented correlation between the sand-mud ratio and the pressure coefficient, which is significantly controlled by differences in hydrocarbon generation across the intervals.
Within the range where the sand-mud ratio is below 0.45, the pressure coefficient decreases as the ratio increases, and the pressure coefficient in the Qing-1 member is generally higher than that in the Qing-2 and Qing-3 members. Although overpressure in both intervals is primarily caused by hydrocarbon generation expansion, the difference in pressure coefficients stems from the coupling effect of hydrocarbon generation intensity and mudstone sealing capacity. The Qing-1 member has greater burial depth, higher thermal maturity, and stronger hydrocarbon generation potential. Under conditions of a low sand-mud ratio (high mudstone proportion), mudstones effectively seal the overpressure generated by hydrocarbon generation, and the abundant hydrocarbon generated helps maintain the pressure coefficient at a high level. As the sand-mud ratio increases (higher sandstone proportion), sand body connectivity increases, allowing overpressure to gradually dissipate through the sandstone pore system, resulting in a decrease in the pressure coefficient. The Qing-2 and Qing-3 members have greater mudstone thickness and better sealing conditions, but their hydrocarbon generation intensity is weaker. At low sand-mud ratios, although thick mudstones can effectively preserve overpressure, limited hydrocarbon generation leads to an overall lower pressure coefficient compared to the Qing-1 member. As the sand-mud ratio increases, the disruption of the sealing system by sand bodies also leads to overpressure release, causing a declining trend in the pressure coefficient. However, due to the greater mudstone thickness, the decrease is more gradual than in the Qing-1 member.
When the sand-mud ratio reaches or exceeds 0.45, the proportion of sandstone increases significantly, which disrupts the continuous mudstone sealing network and enhances vertical and lateral formation connectivity. At this point, regardless of the high hydrocarbon generation intensity in the Qing-1 member or the superior sealing foundation in the Qing-2 and Qing-3 members, the overpressure generated by hydrocarbon generation cannot be effectively preserved. Formation fluid pressure rapidly equilibrates to hydrostatic pressure via the sand bodies, exhibiting the characteristics of a normal-pressure system. This phenomenon indicates that a sand-mud ratio of 0.45 is a critical threshold for overpressure preservation. Beyond this value, the controlling effect of sand body connectivity on pressure outweighs the differences in hydrocarbon generation intensity and mudstone sealing capacity. The “critical sand-mud ratio threshold” for overpressure preservation is a common feature in lacustrine basins, though specific values vary with local conditions. In the Gubei Sag (Bohai Bay Basin), Dang et al. (2016) identified a similar threshold (~0.92) [36], above which sand body connectivity disrupted mudstone sealing and led to pressure equilibration—consistent with our 0.45 threshold in the Gulong Sag.

4.3.4. Faults

Faults have a dual impact on hydrocarbon exploration: they act as conduits for hydrocarbon migration while also affecting the integrity of hydrocarbon traps via overpressure distribution. The northern Songliao Basin, characterized by multi-stage tectonic activity, has a well-developed fault system. Notably, the hydrocarbon source rocks of the Qingshankou Formation contain numerous fault-dense zones that extend into the Fuyu oil reservoir. These fault-dense zones, defined by similar or identical strikes, interrelated causes, and concentrated distribution, exhibit distinct linear patterns on the plane [57,60]. The Fuyu oil reservoir primarily contains two types of source-connected faults: I-type and II-type. The I-type fault extends upward to the Qingshankou Formation and downward to the Fuyu oil reservoir, connecting the source rocks of the Qingshankou Formation and the Fuyu oil reservoir. Its fractures allow for unidirectional downward hydrocarbon migration, which transports oil and gas only to the Fuyu reservoir. In contrast, the II-type fault runs up to the Gaotaizi and higher reservoirs and down to the Fuyu reservoir. These faults and associated fractures connect the source rocks to multiple reservoir layers, allowing for bidirectional hydrocarbon migration (both upward and downward) [61,62].
Statistical analysis indicates that the pressure coefficients of the Qing-1 and Qing-23 members gradually decrease as their distance from the fault zones increases. Locations near fault zones have relatively stable pressure coefficients. Furthermore, in areas with well-developed faults (such as Wells Y83, Y64, and Y901), the pressure coefficient of the Qing-1 member approaches one. Previous studies have shown that the proportion of currently closed faults in the Qijia-Gulong area accounts for more than 94%, which plays a good sealing role in the formed conventional oil reservoirs and shale oil reservoirs [63]. Therefore, the sealing faults in the Gulong Sag effectively seal the overpressure and hydrocarbons in the Qingshankou Formation. Only in a few areas where the faults are open do hydrocarbons migrate, resulting in lower pressure coefficients.

4.4. Geological Significance of Overpressure

4.4.1. Relationship Between Shale Oil Reservoirs and Overpressure

The Qingshankou Formation shale in the Gulong Sag is very mature (Figure 2a). As the source rock begins to generate significant amounts of hydrocarbon, the abnormal pressure in the formation increases. Hydrocarbon production causes an increase in volume. However, the shale acts as an effective seal, preventing the produced oil and gas from being expelled in a timely manner. This process results in a steady increase in formation fluids and a gradual buildup of pressure, culminating in overpressure. This hydrocarbon generation-driven pressurization mechanism ensures that the formation is energy-rich, with pressure coefficients that typically exceed 1.2 and can reach 1.44, creating favorable conditions for shale oil enrichment. Overpressure has a significant impact on the reservoir properties of shale. On the one hand, when the discharge of overpressured fluids is impeded, the pore fluids bear some of the overburden pressure. This reduces the effective stress on the framework grains, weakens compaction, and preserves the reservoir’s intergranular porosity. Overpressure, on the other hand, can promote the formation of microfractures, which creates more space for the storage and flow of shale oil, further optimizing the shale reservoir conditions [64,65].
The Qingshankou Formation of the Gulong Sag currently contains proven shale oil reserves on the western slope, while controlled reserves are located in the central-western part (Figure 13a). The sand bodies of the Qingshankou Formation on the western slope are thicker than those in the sag center, with the main feature being interbedded shale. Consequently, the Qingshankou Formation’s overpressure drives the initial migration of shale oil. Propelled by hydrocarbon generation and increasing pressure, the oil overcomes the reservoir’s migration resistance. It migrates short distances, accumulating in interbedded layers like sandstone and dolomite within the shale sequence to form interbedded shale oil accumulations [7] (Figure 2b). Additionally, the presence of overpressure allows shale oil to be retained and enriched in place, resulting in large-scale, continuously distributed shale-type shale oil deposits in the central-western part of the sag. Furthermore, fault stability and the cumulative effect of overpressure are important factors in the development of overpressure in mud shale layers. Stable faults have not hampered the preservation of overpressure, ensuring the retention conditions for shale oil.
Previous studies have indicated a correlation between the oil quality types of shale oil in the Gulong Sag and the formation’s overpressure state. In light oil production areas, formation pressure ranges from weak to strong overpressure. Light shale oil struggles to migrate due to reservoir resistance and tends to accumulate in place, forming self-sealed accumulations. It results in higher abnormal formation pressures and thus higher oil and gas yields. For instance, oil production rates in Wells GY2, GY3, and GY1 exhibit significant positive correlations with increasing pressure coefficients, rising progressively to 14.4 m3/d, 19.2 m3/d, and 21.9 m3/d, respectively. Thus, the “weak to strong overpressure” pressure-retention box structure has become a reliable predictor of high-yield oil and gas layers in the Gulong Sag [8]. Based on overpressure distribution characteristics and shale oil enrichment patterns, future exploration efforts should focus vertically on the Qing-1 member and the lower section of the Qing-2 member. These intervals typically have formation pressure coefficients greater than 1.20 and sufficient formation energy, which are favorable for shale oil production via fracturing [66]. Horizontally, the western slope and northwestern portion of the Gulong Sag should be the primary focus. These areas have well-developed interbedded shale or higher formation pressure coefficients, as well as better reservoir conditions and higher oil content, making them ideal locations for shale oil exploration and development.

4.4.2. Significance of the Accumulation of Fuyu Tight Oil

The tight oil in the Fuyu reservoir, a critical unconventional energy resource in the region, is primarily derived from hydrocarbons produced by the mature source rocks of the Qing-1 member. Overpressure in the Qing-1 member has a significant impact on hydrocarbon accumulation in the Fuyu reservoir beneath it. The Qing-1 source rocks are distinguished by their extensive coverage, high maturity, and strong hydrocarbon expulsion capacity, making them important contributors to the region’s limited oil resources. Analysis of the pressure coefficient and fault distribution overlay map (Figure 6) reveals no significant pressure decrease near fault zones, implying that the Gulong Sag faults are generally closed. Pressure profiles along cross-sections (Figure 7 and Figure 8) show that in some areas of the Gulong Sag, hydrocarbons may migrate laterally or in reverse to form the Fuyu oil layer, lowering pressure at the Qing-1/Quantou contact. This integrated analysis emphasizes the importance of overpressure as a driving force for hydrocarbon migration, a key mechanism in unconventional oil exploration. Hydrocarbons migrate downward along fractures only in specific areas.
The shape of the pressure coefficient envelope curve indicates whether hydrocarbons from the Qing-1 source rocks are transported downward into the Fuyu reservoir. The central Gulong Sag has a bell-shaped pressure coefficient profile for the Qing-1 member, with a sharp pressure transition at the interface with the Fuyu oil reservoir. In contrast, at the Qing-1 base near the Fuyu reservoir, the flanks show arc-shaped curves with gradual changes (Figure 7 and Figure 8). An integrated analysis of the Fuyu oil layer’s sandstone thickness map, the fault distribution map, the Qing-1 member pressure coefficient contour map, and the superimposed map of the Fuyu oil layer reserve area reveals the following: the central Gulong Sag has underdeveloped fractures that effectively seal overpressure for the Qing-1 source rocks. In contrast, mature source rocks along the flanks experience a gradual decrease in pressure coefficient due to hydrocarbon expulsion. Hydrocarbons migrate slowly into intermediate reservoirs before moving laterally to the Fuyu reservoir via faults or sand bodies, where they accumulate in lithologic, fault-lithologic, and anticline-lithologic traps (Figure 13b). The thick shale layers of the Qing-1 Formation serve as excellent regional cap rocks. Their overpressure not only seals hydrocarbons within the underlying Fuyu reservoir, but it also increases the reservoir’s sealing capacity, protecting energy resources.

5. Conclusions

This paper investigates the pressure characteristics of the Qingshankou Formation in the Gulong Sag, identifies the causes of overpressure, and conducts a systematic analysis of the relationship between overpressure and hydrocarbon distribution. The findings reveal the following:
(1)
The overpressure in the Qingshankou Formation is primarily caused by hydrocarbon generation expansion, with a pressure coefficient that typically exceeds 1.2 and peaks at 1.44, resulting in highly favorable geological conditions for shale oil enrichment.
(2)
Regions with greater burial depth, higher maturity, thicker source rocks, and low-er sand-mud ratios have more pronounced overpressure development. Most faults have good sealing properties and can effectively preserve overpressure; only a few open faults lead to local pressure reduction.
(3)
In the flank areas with well-developed faults, overpressure in the Qing-1 member can drive reverse hydrocarbon migration into the underlying Fuyu reservoir, facilitating accumulation; in the central sag, where faults are closed, hydrocarbon migration is not obvious, and the “hydrocarbon reversed migration” mechanism and regional caprock characteristics contribute to hydrocarbon preservation.
(4)
Future exploration efforts should focus on shale oil in the northwest part of the sag and tight oil within the Fuyu reservoir’s thicker sand bodies on both flanks. Concurrently, systematic research into paleopressure evolution and fault formation is required. By clarifying their spatiotemporal coupling relationships, we can improve our dynamic understanding of hydrocarbon accumulation processes, provide precise theoretical support for exploration target optimization, and, ultimately, increase the success rate of oil and gas exploration.

Author Contributions

Conceptualization, S.L.; Software, M.L. and S.W.; Validation, Q.Z.; Investigation, J.L., M.L. and S.W.; Resources, X.F. and J.L.; Data curation, Q.Z.; Writing—original draft, F.C.; Writing—review & editing, G.B.; Visualization, G.B.; Supervision, X.F.; Project administration, F.C.; Funding acquisition, S.L. All authors have read and agreed to the published version of the manuscript.

Funding

This research was funded by National Natural Science Foundation of China (grant numbers 42272156 and 42472204), Natural Science Foundation of Heilongjiang Province of China (grant number YQ2024D007), and the research on Educational Reform of Hainan Higher Education Institutions (grant number Hnjg2024-276).

Data Availability Statement

The original contributions presented in this study are included in the article. Further inquiries can be directed to the corresponding author.

Conflicts of Interest

Authors Fangju Chen, Xiuli Fu, Qiang Zheng, Jie Li and Mengxia Li were employed by PetroChina Daqing Oilfield Company Limited. The remaining authors declare that the research was conducted in the absence of any commercial or financial relationships that could be construed as a potential conflict of interest.

References

  1. He, W.; Liu, B.; Zhang, J.; Bai, L.; Tian, S.; Chi, Y. Geological Characteristics and Key Scientific and Technological Problems of Gulong Shale Oil in Songliao Basin. Earth Sci. 2023, 48, 49–62. [Google Scholar] [CrossRef]
  2. Wang, J.; Chen, F.; Li, W.; Lu, S.; Zhao, S.; Liu, Y.; Wang, Z. A multi-scale and multi-mechanism coupled model for carbon isotope fractionation of methane during shale gas production. Pet. Sci. 2025, 22, 2719–2746. [Google Scholar] [CrossRef]
  3. Xie, X.; Jiao, J.; Tang, Z.; Zheng, C. Evolution of Abnormally Low Pressure and its Implications for the Hydrocarbon System in the Southeast Uplift Zone of Songliao Basin, China. AAPG Bull. 2003, 87, 99–119. [Google Scholar] [CrossRef]
  4. Yang, L.; Fu, J.; Chen, C.; Sun, Y.; Gao, R.; Zhou, X.; Liu, C.; Wang, Q. Study on Genetic Mechanism of Overpressure System in Middle-Deep Layers in Western Sag of Liaohe Basin. China Energy Environ. Prot. 2024, 46, 106–108. [Google Scholar] [CrossRef]
  5. Wang, J.; Lu, S.; Zhang, P.; Li, Q.; Yin, Y.; Li, W.; Zhou, N.; Chen, G.; Yi, Y.; Wu, C. Characterization of shale oil and water micro-occurrence based on a novel method for fluid identification by NMR T2 spectrum. Fuel 2024, 374, 132426. [Google Scholar] [CrossRef]
  6. Li, X.; Liu, Z.; Ma, X.; Jiao, L.; Zhou, Z.; Xu, X.; Yang, Y. Mechanism of Generation and Prediction of Distribution of Overpressure within the Permian Strata in the Jimusar Depression, Junggar Basin. Acta Geosci. Sin. 2024, 45, 953–964. [Google Scholar] [CrossRef]
  7. Zhang, H.; Wang, X.; Jia, C.; Li, J.; Meng, Q.; Jiang, L.; Wang, Y. Total Petroleum System and Hydrocarbon Accumulation Model in Shallow and Medium Strata in Northern Songliao Basin, NE China. Pet. Explor. Dev. 2023, 50, 683–694. [Google Scholar] [CrossRef]
  8. Huang, Y.; Chang, J.; Qiu, N.; Lin, T.; Fu, X.; Tang, B.; Li, J. Pressure Field Characteristics and Overpressure Geneses of Qingshankou Formation in Qijia-Gulong Sag, Songliao Basin. Acta Pet. Sin. 2024, 45, 1800–1817. [Google Scholar] [CrossRef]
  9. Fu, G.; Sun, K.; Song, G. Difference of Formation and Evolution of Overpressure of K1qn1 Mudstone East and West of Daqing Placanticline. J. Northeast. Pet. Univ. 2008, 32, 1–4+121. [Google Scholar] [CrossRef]
  10. Jiang, L.; Zhang, X.; Ma, X. K1qn1 Mudstone Overpressure in North Songliao Basin and its Significance. Pet. Geol. Oilfield Dev. Daqing 2013, 32, 25–28. [Google Scholar] [CrossRef]
  11. Ren, L.; Dai, J.; Lin, C.; Cao, Z. Characteristics of Overpressure and its Geological Significance for Hydrocarbon of Qingshankou Formation in Southern Fuxin Uplift, Songliao Basin. Nat. Gas Geosci. 2017, 28, 1020–1030. [Google Scholar] [CrossRef]
  12. Lei, Z.; Xie, X.; Huang, W.; Du, X.; Wang, W.; Wang, W.; Jiao, J.; Wei, W. Abnormal Pressure System Characteristics of Mid-Shallow Formation in Qijiagulong-Sanzhao Depression of Songliao Basin, China. J. Jilin Univ. (Earth Sci. Ed.) 2012, 42 (Suppl. S1), 96–104. [Google Scholar] [CrossRef]
  13. Zhu, G.; Wang, X.; Bai, X.; Lu, J.; Li, J. New Exploration Fields and Resource Potential of Tight Oil in Northern Songliao Basin. Acta Pet. Sin. 2025, 46, 33–47. [Google Scholar] [CrossRef]
  14. Qu, J. Enrichment Regularity and Main Controlling Factors of the Tight Oil in Fuyu Oil-Bearing in Longxi Area, Songliao Basin. J. Yangtze Univ. (Nat. Sci. Ed.) 2025, 1–14. [Google Scholar] [CrossRef]
  15. He, W.; Zhao, Y.; Zhong, J.; Sun, N. Characteristics and Significance of Micron Pores and Micron Fractures in Shale Oil Reservoirs of Cretaceous Qingshankou Formation in Gulong Sag, Songliao Basin. Lithol. Reserv. 2024, 36, 1–18. [Google Scholar] [CrossRef]
  16. Cao, Z.; Lin, J.; Ling, L.; Wang, X.; Tan, X.; Wang, H.; Zhao, H.; Xu, R.; Zhang, Y. The Cause of Shale Oil Overpressure and its Influence on Productivity in Jimsar Sag. Well Logging Technol. 2025, 49, 298–309+328. [Google Scholar] [CrossRef]
  17. Hottmann, C.; Johnson, R. Estimation of Formation Pressures from Log-Derived Shale Properties. J. Pet. Technol. 1965, 17, 717–722. [Google Scholar] [CrossRef]
  18. Eberhart-Phillips, D.; Han, D.; Zoback, M. Empirical Relationships among Seismic Velocity, Effective Pressure, Porosity, and Clay Content in Sandstone. Geophysics 1989, 54, 82–89. [Google Scholar] [CrossRef]
  19. Bowers, G. Pore Pressure Estimation From Velocity Data: Accounting for Overpressure Mechanisms Besides Undercompaction. SPE Drill. Complet. 1995, 10, 89–95. [Google Scholar] [CrossRef]
  20. Dutta, N. Geopressure Prediction Using Seismic Data: Current Status and the Road ahead. Geophysics 2002, 67, 2012–2041. [Google Scholar] [CrossRef]
  21. Sargent, C.; Goulty, N.; Cicchino, A.; Ramdhan, A. Budge-Fudge Method of Pore-Pressure Estimation from Wireline Logs with Application to Cretaceous Mudstones at Haltenbanken. Pet. Geosci. 2015, 21, 219–232. [Google Scholar] [CrossRef]
  22. Eaton, B. The Equation for Geopressure Prediction from Well Logs. In Proceedings of the Fall Meeting of the Society of Petroleum Engineers of AIME, Dallas, TX, USA, 28 September–1 October 1975. [Google Scholar] [CrossRef]
  23. Fillippone, W. Estimation of Formation Parameters and the Prediction of Overpressures from Seismic Data. In SEG Technical Program Expanded Abstracts 1982; Society of Exploration Geophysicists: Houston, TX, USA, 1982; pp. 502–503. [Google Scholar] [CrossRef]
  24. Martinez, R. Deterministic Estimation of Porosity and Formation Pressure from Seismic Data. In SEG Technical Program Expanded Abstracts 1985; Society of Exploration Geophysicists: Houston, TX, USA, 1985; pp. 486–487. [Google Scholar] [CrossRef]
  25. Liu, Z.; Zhang, W.; Zhang, H.; Deng, Y. An Analysis of Abnormal Formation Pressures of Paleogene in the North Sag of Liaoxi Depression. Acta Pet. Sin. 1993, 14, 14–24. [Google Scholar] [CrossRef]
  26. Farsi, M.; Mohanmadian, N.; Ghorbani, H.; Wood, D.; Alvar, M. Predicting Formation Pore-Pressure from Well-Log Data with Hybrid Machine-Learning Optimization Algorithms. Nat. Resour. Res. 2021, 30, 3455–3481. [Google Scholar] [CrossRef]
  27. Georgy, P.; Kerim, K.; Sergey, S.; Nikita, B.; Ammar, A.; Mahmoud, A. Predicting Mud Weight in Carbonate Formations Using Seismic Data: A Data-Driven Approach. Geoenergy Sci. Eng. 2025, 250, 213850. [Google Scholar] [CrossRef]
  28. Li, K.; Chen, S.; Zhao, H.; Wang, T.; Huo, Q. Predicting Method of the Pore Pressure in Qingshankou-Formation Mud Shale of Songliao Basin and its Application. Pet. Geol. Oilfield Dev. Daqing 2018, 37, 7–12. [Google Scholar] [CrossRef]
  29. Shi, M.; Liu, Z.; Yang, X.; Yang, J.; Chen, X.; Liu, H.; Cao, J. Review and Prospect Prediction Technology for Formation Pore Pressure by Geophysical Well Logging. Prog. Geophys. 2020, 35, 1845–1853. [Google Scholar] [CrossRef]
  30. Zhao, J.; Li, J.; Xu, Z. Advances in the Origin of Overpressures in Sedimentary Basins. Acta Pet. Sin. 2017, 38, 973–998. [Google Scholar] [CrossRef]
  31. Du, H.; Liu, Y.; Fan, L.; Ma, Z.; Luo, X.; Shen, A.; Zeng, S. Genesis and Evolution of Overpressure in Lower Paleozoic Carbonate Rocks of Ordos Basin. Acta Pet. Sin. 2025, 46, 891–908. [Google Scholar] [CrossRef]
  32. Xu, Z.; Zhao, J.; Li, J. The Impact of Organic Matter Content on Overpressure Analysis and Its Correction Method in the First Member of Cretaceous Qingshankou Formation, Placanticline Area, Songliao Basin. Oil Gas Geol. 2019, 40, 938–946. [Google Scholar] [CrossRef]
  33. Zhang, Z.; Chang, J.; Shan, X.; Li, C.; Guo, H.; Peng, B.; Xu, J.; Huang, Y. Pressure Distribution Characteristics and Overpressure Genesis of the Permian Formation in Mahu Sag and Surrounding Areas. Chin. J. Geol. 2024, 59, 1229–1244. [Google Scholar] [CrossRef]
  34. Wang, Y.; Hao, X.; An, T.; Zhang, P.; Xiong, W.; Qin, F. Co-evolution of Formation Pressure, Fluid, and Reservoir Property under the Control of Basin Structure and its Controlling Effect on Reservoir Accumulation: A Case Study of Paleogene in Dongying Depression. Acta Pet. Sin. 2023, 4, 1058–1071. [Google Scholar] [CrossRef]
  35. Qiu, Y. Overpressure Structure in Dongying Sag and its Controlling Factors. China Pet. Explor. 2018, 23, 28–34. [Google Scholar] [CrossRef]
  36. Dang, X.; He, S.; Wang, Y.; Hao, X.; Zhang, J. Distribution Characteristics and Controlling Factors of the Overpressure Zone in Sandstone Reservoir of Gubei Sag. Pet. Geol. Recovery Effic. 2016, 23, 47–52. [Google Scholar] [CrossRef]
  37. Bao, Y.; Zhang, L.; Li, J. Approach to Paleogene Overpressure Origin in Jiyang Depression. Xinjiang Pet. Geol. 2012, 33, 17–21. [Google Scholar]
  38. Liu, H.; Yuan, F.; Jiang, Y.; Hao, X.; Fang, X. Genesis and Characteristics of Paleogene Overpressure in Zhanhua Depression, Jiyang Sub-basin. J. China Univ. Pet. (Ed. Nat. Sci.) 2021, 45, 23–32. [Google Scholar] [CrossRef]
  39. Chen, H.; Zhang, F.; Jiang, Q.; Liu, H.; Sun, L.; Liu, G. Overpressure-Generating Mechanism and Its Evolution Characteristics of Cretaceous Shahezi Formation in Xujiaweizi Fault Depression, Songliao Basin. Lithol. Reserv. 2025, 37, 102–114. [Google Scholar] [CrossRef]
  40. Liu, B.; Meng, Q.; Fu, X.; Lin, T.; Bai, Y.; Tian, S.; Zhang, J.; Yao, Y.; Cheng, X.; Liu, Z. Composition of generated and expelled hydrocarbons and phase evolution of shale oil in the 1st member of Qingshankou Formation, Songliao Basin. Oil Gas Geol. 2024, 45, 406–419. [Google Scholar] [CrossRef]
  41. Li, C.; Luo, X.; Zhang, L.; Fan, C.; Xu, C.; Liu, A.; Li, H.; Li, J.; Lei, Y. New Understanding of Overpressure Responses and Pore Pressure Prediction: Insights from the Effect of Clay Mineral Transformations on Mudstone Compaction. Eng. Geol. 2022, 297, 106493. [Google Scholar] [CrossRef]
  42. Liu, B.; Shi, J.; Fu, X.; LU, Y.; Sun, X.; Gong, L.; Bai, Y. Petrological Characteristics and Shale Oil Enrichment of Lacustrine Fine-grained Sedimentary System: A Case Study of Organic-rich Shale in First Member of Cretaceous Qingshankou Formation in Gulong Sag, Songliao Basin, NE China. Pet. Explor. Dev. 2018, 45, 828–838. [Google Scholar] [CrossRef]
  43. Chen, F.; Lu, S.; Huang, Z.; Wang, W.; Xie, Z.; Xiao, H. Sedimentary Characteristics and Favorable Exploration Zone of K1qn1 in Gulong Depression of Songliao Basin. J. Cent. South Univ. (Sci. Technol.) 2013, 44, 1955–1963. [Google Scholar]
  44. Sun, L.; Zhu, R.; Zhang, T.; Cai, Y.; Feng, Z.; Bai, B.; Jiang, H.; Wang, B. Advances and Trends of Non-Marine Shale Sedimentology: A Case Study from Gulong Shale of Daqing Oilfield, Songliao Basin, NE China. Pet. Explor. Dev. 2024, 51, 1367–1385. [Google Scholar] [CrossRef]
  45. Lin, T.; Wang, R.; Zhang, J.; Liu, Z.; Bai, Y.; Cheng, X.; Liu, X.; Lu, J.; Ma, S.; Li, X. Enrichment Law and Favorable Areas Distribution of Gulong Shale Oil in Songliao Basin. Pet. Geol. Oilfield Dev. Daqing 2024, 43, 88–98. [Google Scholar] [CrossRef]
  46. Zhu, G.; Wang, X.; Zhang, J.; Liu, Z.; Bai, Y.; Zhao, Y.; Fu, X.; Zeng, H. Enrichment Conditions and Favorable Zones for Exploration and Development of Continental Shale Oil in Songliao Basin. Acta Pet. Sin. 2023, 44, 110–124. [Google Scholar] [CrossRef]
  47. Fu, X.; Chang, J.; Tang, B.; Zhu, C.; Li, X.; Huang, Y.; Su, Y.; Xu, Q.; Meng, Q. Rapid Maturation Evolution of the Shale Oil in the Heat Sedimentary Basins: A Casestudy of the Qijiagulong Sag in Songliao Basin, Northeastern China. Chin. J. Geophys. 2025, 68, 182–198. [Google Scholar] [CrossRef]
  48. Yang, X.; Liu, C.; Wang, F.; Li, G.; Feng, D.; Yang, T.; He, Z.; Su, J. Distribution and Origin of Overpressure in the Paleogene Dongying Formation in the Southwestern Sub-sag, Bozhong Sag, Bohai Bay Basin. Oil Gas Geol. 2024, 45, 96–112. [Google Scholar] [CrossRef]
  49. Zhang, J. Pore pressure prediction from well logs: Methods, modifications, and new approaches. Earth-Sci. Rev. 2011, 108, 50–63. [Google Scholar] [CrossRef]
  50. Zhao, Q.; Wang, X.; Guan, L.; Zhang, W.; Zhu, J. Formation Pressure Detection Method Based on Modified Bowers Method-Taking Baiyun Sag as an Example. Theory Pract. New Ind. 2022, 9, 123–130. [Google Scholar] [CrossRef]
  51. Lou, Z.; Gao, R.; Cai, X.; Xu, H. The Evolution of Fluid Dynamic Field and the Origin of Subnormal Pressure in Songliao Basin, China. Acta Pet. Sin. 1999, 20, 21–31. [Google Scholar] [CrossRef]
  52. Li, W.; Chen, Z.; Huang, P.; Yu, Z.; Min, L.; Lu, X. Formation of overpressure system and its relationship with the distribution of large gas fields in typical foreland basins in central and western China. Pet. Explor. Dev. 2021, 48, 536–548. [Google Scholar] [CrossRef]
  53. Shen, J.; Cong, Y.; Mao, L.; Lu, S. Mechanism of Putaohua Oil Layer’s Overpressure in the Gulong Sag, Songliao Basin. Chin. J. Geol. 2009, 44, 502–512. [Google Scholar] [CrossRef]
  54. Liu, T.; Liu, J. Quantitative Evaluation on Overpressure Generated from Undercompaction and Fluid Expansion. Acta Pet. Sin. 2018, 39, 971–979. [Google Scholar] [CrossRef]
  55. Han, Y. The Relationship Between Sandstone Diagenesis and Overpressure Fuild of the Shahejie Formation in Dongying Depression. Master’s Thesis, China University of Geosciences, Beijing, China, 2012. Available online: https://d.wanfangdata.com.cn/thesis/Y2189335 (accessed on 25 August 2025).
  56. Bai, G.; Chen, G.; Cai, Z.; Yan, H.; Lu, S.; Radwan, A. Movable oil content evaluation in low-to-medium maturity lacustrine shale during in-situ conversion. Adv. Geo-Energy Res. 2025, 16, 77–90. [Google Scholar] [CrossRef]
  57. Ma, W.; Li, J.; Wang, D.; Wang, Y.; Ma, C.; Wang, Z.; Du, T. Hydrocarbon expulsion efficiency of source rocks and its influencing factors. Nat. Gas Geosci. 2016, 27, 1742–1751. [Google Scholar] [CrossRef]
  58. Zhao, G. Study of the Abnormal High-Pressure in Hydrocarbon Source Rocks—Taking Paleogene in the Dongying Sag, the Bohai Bay Basin as an Example. Pet. Geol. Exp. 2008, 4, 340–344. [Google Scholar] [CrossRef]
  59. Li, W.; Wang, J.; Jia, C.; Lu, S.; Li, J.; Zhang, P.; Wei, Y.; Song, Z.; Chen, G.; Zhou, N. Carbon isotope fractionation during methane transport through tight sedimentary rocks: Phenomena, mechanisms, characterization, and implications. Geosci. Front. 2024, 15, 101912. [Google Scholar] [CrossRef]
  60. Jin, Q.; Gan, J.; Lu, M.; He, S.; Sun, S.; Wang, J.; Gao, Y. Analysis of the Causes of Formation Overpressures in the Chezhen Sag of Bohai Bay Basin. J. Northeast. Pet. Univ. 2015, 39, 32–40+6–7. [Google Scholar] [CrossRef]
  61. Jing, C.; Liu, H.; Jing, X.; Feng, Y.; Zhao, M. Prediction of Overpressures Generated by Fluid Expansion: Methods and Application. Xinjiang Pet. Geol. 2016, 37, 240–245. [Google Scholar] [CrossRef]
  62. Wang, X.; Bai, X.; Li, J.; Jin, Z.; Wang, G.; Chen, F.; Zheng, Q.; Hou, Y.; Yang, Q.; Li, J.; et al. Enrichment Model and Major Controlling Factors of Below-source Tight Oil in Lower Cretaceous Fuyu Reservoirs in Northern Songliao Basin, NE China. Pet. Explor. Dev. Online 2024, 51, 279–291. [Google Scholar] [CrossRef]
  63. Wang, Y.; Chen, B.; Chen, J. Roof and Floor Faults Seal of Gulong Shale Oil Reservoir in Songliao Basin and Optimization of Favorable Areas for Oil and Gas Accumulation. Pet. Geol. Oilfield Dev. Daqing 2022, 41, 53–67. [Google Scholar] [CrossRef]
  64. Li, Y.; Chen, G.; Cai, Z.; Lu, S.; Wang, F.; Zhang, Y.; Bai, G.; Ge, J. Occurrence of methane in organic pores with surrounding free water: A molecular simulation study. Chem. Eng. J. 2024, 497, 155597. [Google Scholar] [CrossRef]
  65. Liang, Z.; Wang, J.; Yu, T. Coexisting relationship between shale gas enrichment and over-pressure system in east China. Prog. Geophys. 2017, 32, 1591–1596. [Google Scholar] [CrossRef]
  66. Jia, C.; Yao, J.; Kamy, S. Acid Stimulation Simulation Theory and Application in Carbonate Rocks; Springer: Berlin/Heidelberg, Germany, 2025; pp. 1–274. [Google Scholar] [CrossRef]
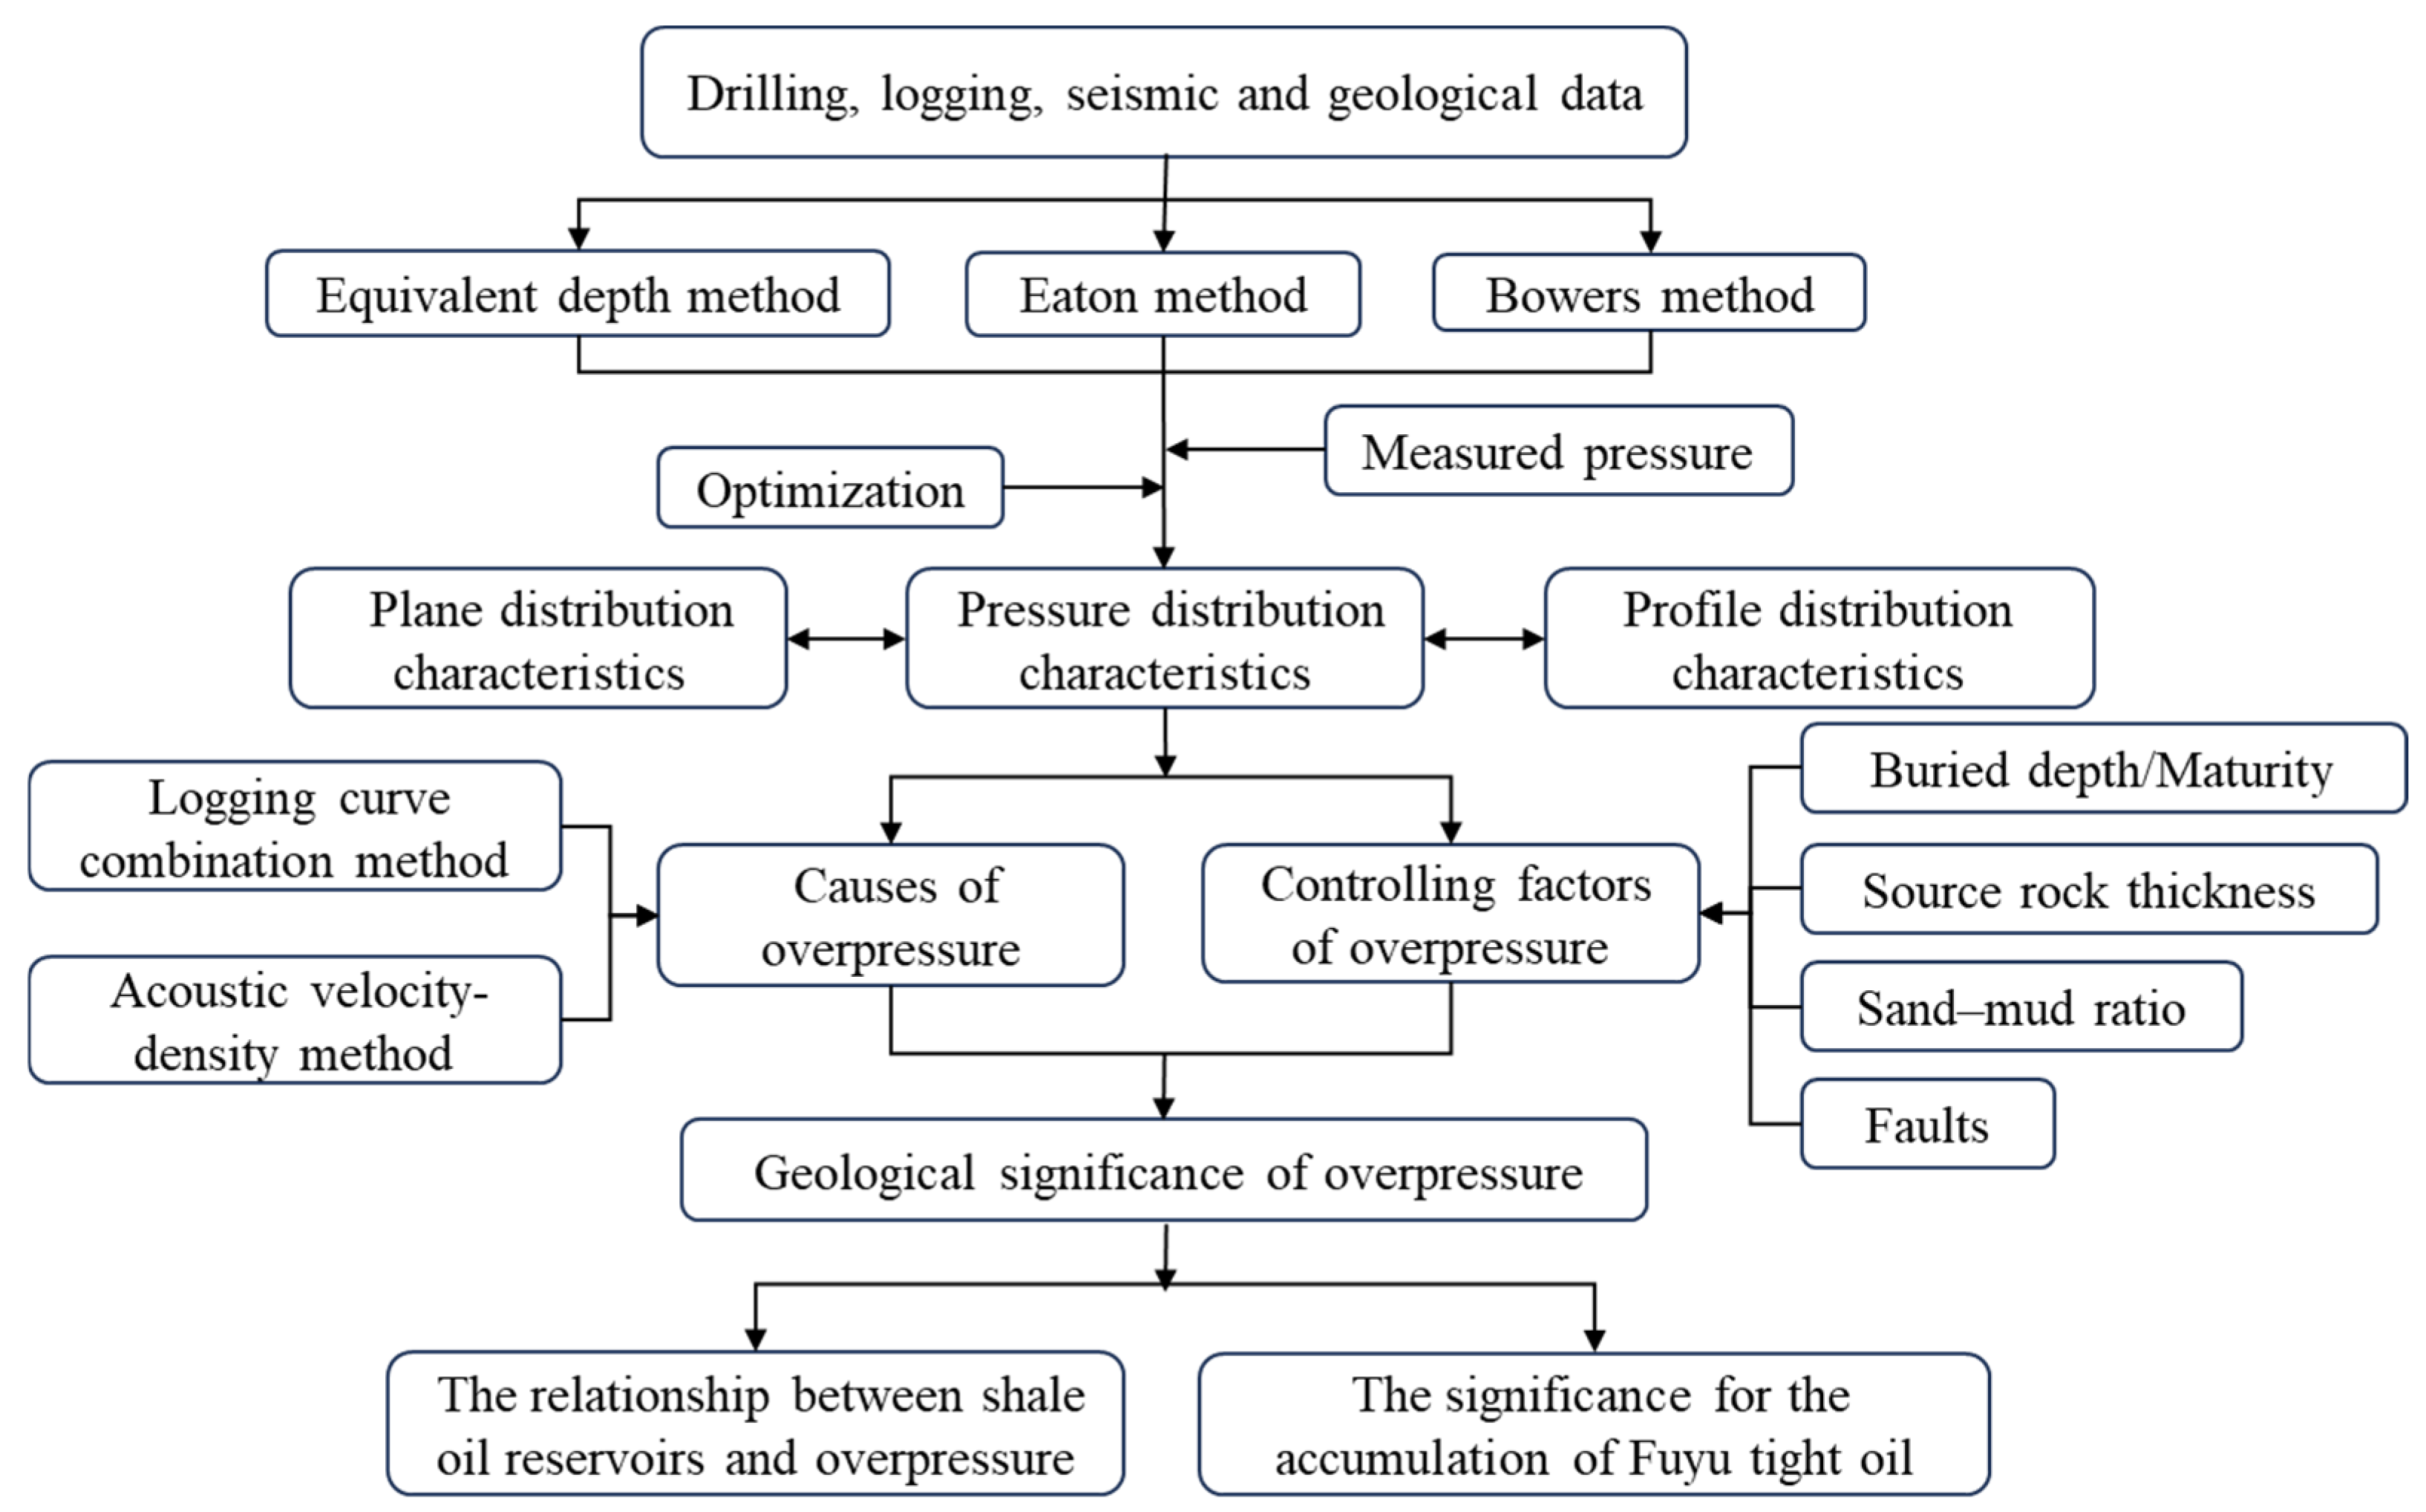
Figure 1. The flowchart that outlines the main topics covered in this study.
Processes 13 02790 g001
Figure 2. Column diagram of structural location and strata in the study area: (a) Gulong Sag structural; (b) Stratigraphic and lithologic profile diagram (modified from [44,45]).
Processes 13 02790 g002
Figure 3. Schematic diagrams of porosity (a), acoustic time difference (b), and corresponding pore pressure (c) A and B represent two points at different depths.
Processes 13 02790 g003
Figure 4. Relation between measured pressure and depth: (a) measured pressure; (b) measured pressure coefficient.
Processes 13 02790 g004
Figure 5. Comparison of relative errors in pressure prediction by three methods in the Gulong Sag.
Processes 13 02790 g005
Figure 6. Pressure coefficient, burial depth, and fault distribution overlay map of the Qingshankou Formation in the Gulong Sag: (a) Qing-1 member; (b) Qing-23 members. A-B and C-D denote the locations of the north-south and east-west cross-sections, respectively.
Processes 13 02790 g006
Figure 7. North-south overpressure cross–well section of the Gulong Sag.
Processes 13 02790 g007
Figure 8. East–west overpressure cross–well section of the Gulong Sag.
Processes 13 02790 g008
Figure 9. Overpressure cause discrimination chart (a) Logging response characteristics for fluid expansion-induced overpressure; (b) Overpressure cause discrimination based on acoustic velocity–density cross-plots.
Processes 13 02790 g009
Figure 10. Pressure prediction results and comprehensive logging response of Well G535.
Processes 13 02790 g010
Figure 11. Acoustic velocity–density cross-plots of the Gulong Sag (a) Well G66; (b) Well GY39.
Processes 13 02790 g011
Figure 12. Relationship between buried depth and source rock thickness, sand-mud ratio, and distance from the fault zone of different members and the pressure coefficient: (a) relationship between buried depth and pressure coefficient of Qing-1 member; (b) relationship between buried depth and pressure coefficient of Qing-23 members; (c) relationship between source rock thickness and pressure coefficient of Qing-1 member; (d) relationship between source rock thickness and pressure coefficient of Qing-23 members; (e) relationship between pressure coefficient and sand–mud ratio; (f) relationship between pressure coefficient and distance from the fault zone.
Processes 13 02790 g012
Figure 13. Relationship between the distribution of the Gulong shale oil and the Fuyu tight oil and the pressure coefficient of the Qing-1 member: (a) a composite map integrating the fault distribution, Qing-1 member pressure coefficient contours, and the reserve area of the shale oil layer; (b) a composite map integrating the sandstone thickness of the Fuyu oil layer, fault distribution, Qing-1 member pressure coefficient contours, and the reserve area of the Fuyu oil layer [7,62].
Processes 13 02790 g013
Disclaimer/Publisher’s Note: The statements, opinions and data contained in all publications are solely those of the individual author(s) and contributor(s) and not of MDPI and/or the editor(s). MDPI and/or the editor(s) disclaim responsibility for any injury to people or property resulting from any ideas, methods, instructions or products referred to in the content.