Article

Quantitative Evaluation of Hydrocarbon-Generation Intensity of Coal-Measure Mudstones in the Shanxi Formation on the Eastern Margin of the Ordos Basin: A Case Study of the Daning–Jixian Area

1
National and Local Joint Engineering Research Center for Carbon Capture Utilization and Sequestration, Shaanxi Key Laboratory for Carbon Neutral Technology, and State Key Laboratory of Continental Dynamics, Department of Geology, Northwest University, Xi’an 710127, China
2
Petrochina Coalbed Methane Company Limited, Beijing 100028, China
3
College of Geosciences, China University of Petroleum, Beijing 102249, China
*
Authors to whom correspondence should be addressed.
Processes 2025, 13(9), 2786; https://doi.org/10.3390/pr13092786 (registering DOI)
Submission received: 20 July 2025 / Revised: 18 August 2025 / Accepted: 28 August 2025 / Published: 30 August 2025
(This article belongs to the Section Energy Systems)

Abstract

Hydrocarbon-generation intensity (HGI) is a critical indicator for evaluating shale gas potential in source rocks. This study proposes a practical method to estimate HGI by integrating experimental pyrolysis data, EasyRo-based maturity transformation, kinetic modeling, and geological parameters. Using core samples from the Shanxi Formation in the eastern margin of the Ordos Basin, gold tube pyrolysis experiments were conducted under closed-system conditions to obtain gas yield data. The EasyRo model was applied to transform temperature to maturity, and a kinetic model was constructed to simulate hydrocarbon generation. Total organic carbon (TOC), maturity (Ro), thickness, and true density were used to calculate HGI at different depths. Spatial prediction of HGI was achieved using Kriging interpolation. Results indicate that although carbonaceous mudstones have higher TOC (14.2%) and gas yields (up to 155.84 mg/g TOC), black mudstones exhibit a 24.77% higher HGI due to greater thickness (average 67.2 m). This highlights the dominant role of formation thickness in controlling. Notably, black mudstones in the deeper western subregion exhibit greater gas-generation potential. These findings offer a robust quantitative basis for evaluating deep coal-measure shale gas resources in the Ordos Basin.

1. Introduction

Coal-measure shale gas has become a key player in global natural gas supply [1]. Fueled by ongoing innovations in extraction methods, exploration theories, and hydraulic fracturing technologies, this vital unconventional resource is expanding its proportion in the global natural gas portfolio [2,3]. Organic-rich shales can be categorized according to depositional settings as marine, continental, and marine–continental transitional types [4,5]. The eastern margin of the Ordos Basin, characterized by marine–continental transitional sedimentary environments and elaborate tectonic frameworks, serves as a key exploration target for coal-measure shale gas in China [4,5,6]. The coal-bearing layers of the Shanxi Formation have formed extensively in the Daning–Jixian research region, with black shales (average thickness 67.2 m), carbonaceous mudstones (average 4.76 m), and coal seams—these lithologies form a high-quality basis for gas accumulation, as confirmed by data from 137 wells in this study [7]. By the end of 2023, notable progress was made in key blocks such as Daning–Jixian, Shenfu, and Daniudi. Notably, an increasing number of wells targeting the Shanxi Formation have yielded high-volume industrial gas flows, underscoring the favorable conditions of source–reservoir–seal systems and hydrocarbon accumulation [8]. The latest evaluations suggest that the shale gas resources from coal measures in the Daning–Jixian region surpass 1500 × 109 m3, indicating vast exploration and development potential and positioning this area as a likely major breakthrough in China’s unconventional gas sector following coalbed methane [9].
Pyrolysis modeling offers a robust method to quantitatively evaluate the petroleum-generating potential of organic-rich strata. The generation of hydrocarbons is a continuous and complex physicochemical process influenced by multiple factors. The hydrocarbon-generation capacity varies significantly as kerogen type, organic richness, and maturity shift throughout thermal evolution. Closed-system gold tube pyrolysis tests facilitate in-depth analysis of petroleum formation rates and pathways during the thermal evolution of bulk rock samples or purified kerogen [10,11,12,13]. Additionally, when kinetic data obtained from these experiments are combined with basin modeling methods [14,15], it is possible to accurately model and project petroleum formation processes of kerogen under actual geological conditions.
Most existing evaluations focus on isolated parameters such as TOC, Ro, or gas content, without integrating kinetic simulations or spatial modeling [16,17]. Moreover, few studies distinguish between different types of coal-measure mudstones, such as carbonaceous and black mudstones, which may differ significantly in thickness, depositional environment, and hydrocarbon-generating behavior.
To address these gaps, this study integrates closed-system pyrolysis experiments, EasyRo maturity conversion, and kinetic modeling to simulate hydrocarbon generation under geological conditions. Hydrocarbon-generation intensity (HGI) is calculated using total organic carbon (TOC), vitrinite reflectance (Ro), formation thickness, and true density, while spatial prediction of HGI is achieved via Kriging interpolation. Additionally, the differences in geochemical and kinetic parameters between carbonaceous mudstones and black mudstones are quantitatively compared. This work provides a more comprehensive and predictive understanding of the distribution characteristics of HGI in the Daning–Jixian area.

2. Geological Setting

Situated on the western edge of the North China Plate, the Ordos Basin is recognized as a major petroleum-rich basin in China. It plays a crucial role in the nation’s oil and gas exploration due to its abundant hydrocarbon resources [18,19,20,21,22]. Since the Proterozoic, it has undergone multiple tectonic events, forming an asymmetrical synclinal structure characterized by a gradual eastern dip and a sharply inclined western flank [23,24]. From a geographical perspective, the Ordos Basin is bounded by several prominent mountain ranges: the Helan and Liupan Mountains to the west, the Lüliang Mountains to the east, the Yin Mountains to the north, and the Qinling orogenic belt to the south (see Figure 1a) [25,26]. Tectonically, the Ordos Basin is subdivided into six major structural zones: the Yimeng Uplift, the Western Thrust Belt, the Tianhuan Depression, the Yishan Slope, the Western Shanxi Fold Belt, and the Weibei Uplift (refer to Figure 1a) [16].
The research location is situated on the eastern edge of the Ordos Basin (Figure 1a). This area has undergone uninterrupted subsidence along with several marine transgressions since the Late Paleozoic, leading to the establishment of an epicontinental sea depositional environment [27]. During the Early Permian, the depositional setting transitioned progressively from an epicontinental sea to fluvial–deltaic systems, generating transitional sediments and diverse organic-rich source rock intervals [28]. The Carboniferous–Permian transitional sequences, including the Benxi, Taiyuan, and Shanxi formations, were laid down unconformably over the weathered Ordovician basement (Figure 1b) [29]. During the Shanxi Formation’s sedimentation period, the area experienced a shift from a transitional marine–continental environment to a dominantly terrestrial setting. This shift facilitated the development of multiple organic-rich shale horizons formed primarily under continental depositional conditions (see Figure 1b) [16]. The stratigraphy is characteristic of coal-measure formations that are rich in shale gas resources. Surrounding regions, including Shenmu and Linxing, have shown significant hydrocarbon-generation potential stemming from the shales of the Shanxi Formation [17], indicating that the shales in the study area are likely valuable exploration targets [16].

3. Experimental Samples and Research Methods

3.1. Sample Information

This study compiled data from 137 wells within the study area, focusing on key parameters of the Shanxi Formation mudstones, including thickness, burial depth, total organic carbon (TOC), and vitrinite reflectance (Ro), to analyze their spatial distribution characteristics. The geochemical datasets were provided by PetroChina Coalbed Methane Co., Ltd, Beijing, China.
Additional mudstone samples were pulverized to a fine powder (~80 μm, 200 mesh). Approximately 60 g of each powdered sample was treated successively with 10 mL of 36% HCl and 10 mL of 40% HF to dissolve carbonate and silicate minerals, respectively. This acid treatment is crucial for isolating kerogen and ensuring the accuracy of geochemical analyses [30]. The completeness of mineral removal was verified by the absence of visible effervescence upon further acid application and by examining the residual mineralogy under polarized light microscopy.
Subsequently, pyrite was eliminated through chemical reduction using 6 mol/L hydrochloric acid and arsenic-free zinc powder. Kerogen isolation was then performed via heavy liquid ultrasonic centrifugation. The concentrated kerogen fractions were dried in an oven at 60 °C for 24 h.
For organic geochemical analyses (including TOC, Ro, and Rock-Eval), a total of 54 mudstone samples were analyzed, consisting of 38 black mudstones and 16 carbonaceous mudstones. Since no low-maturity samples were available within the study area, gold tube pyrolysis experiments were conducted on one carbonaceous mudstone sample and one black mudstone sample collected from the northern part of the study area. The detailed experimental setup and results are presented in Figure 1.

3.2. Maturity Analysis

For thermal maturity analysis, representative black mudstones and carbonaceous mudstones from the Shanxi Formation were selected. The powdered samples were embedded in low-viscosity epoxy resin, cured at room temperature for 24 h, then mounted onto glass slides using thermoplastic adhesive and polished into 30 μm thick optical thin sections using progressively finer diamond paste. Systematic analysis covered maceral composition, palynofacies, and Ro. Maceral and palynofacies observations utilized a Leica DM4500P polarizing microscope, while Ro measurements were performed via a QDI 302 micro-spectrophotometer (Craic Technologies Inc., San Dimas, CA, USA) linked to the Leica DM4500P microscope (Leica Microsystems GmbH, Wetzlar, Germany).

3.3. Rock Pyrolysis and TOC Determination

Small aliquots of powdered samples were analyzed using a Rock-Eval VI pyrolyzer (Vinci Technologies, Nanterre, France) to obtain key parameters including S1, S2, and Tmax. Here, S1 represents free hydrocarbons present in the rock (mg HC/g rock), S2 refers to hydrocarbons generated through pyrolysis of kerogen (mg HC/g rock), and Tmax is the temperature at which S2 reaches its peak, serving as an indicator of thermal maturity. Samples exceeding 10 g underwent treatment with hydrochloric acid to remove carbonate minerals, followed by rinsing with deionized water until a neutral pH was achieved. Samples were then dried at 60 °C to constant weight, and the weight loss was recorded at this stage. A LECO C230 carbon (LECO Corporation, St. Joseph, MI, USA) analyzer was used to measure TOC content.

3.4. Gold Tube Pyrolysis Experiment

In this study, one low-maturity (Ro ≈ 0.6%) carbonaceous mudstone sample and one low-maturity black mudstone sample, both collected from core intervals of the P1s23 submember in the northern Daning–Jixian area, were selected for gold tube pyrolysis experiments. Pre-pyrolysis treatment included Rock-Eval VI analysis to obtain S1, S2, and Tmax, with each sample replicate (n = 3) ensuring data reliability (Table 1). For each sample weighing more than 10 g, the powder was first treated with concentrated hydrochloric acid to remove carbonates, then thoroughly rinsed with deionized water and dried at 60 °C before TOC analysis using a LECO C230 analyzer. Gold tube pyrolysis experiments were conducted following established protocols [13,31,32] under a constant pressure of 50 MPa, with heating rates of 2 °C/h and 20 °C/h to simulate geological burial conditions. The residence time at the final temperature was maintained for 72 h to ensure complete reaction and stabilization of products. Only gas-phase products were analyzed after pyrolysis, focusing on the composition and yield of hydrocarbon and non-hydrocarbon gases. Liquid hydrocarbon analysis and gas chromatography were not performed, as this study primarily aims to evaluate coalbed methane (CBM) generation, where gaseous products are the main target. These experiments enabled the quantitative assessment of methane generation and total gas yields, providing a basis for calculating hydrocarbon-generation intensity during the thermal evolution of Shanxi Formation mudstones. Thermogravimetric analysis (TGA) was not employed in this study, but future work will include such methods to further validate pyrolysis-based gas yield measurements.

4. Results

4.1. Kerogen Types and Quality

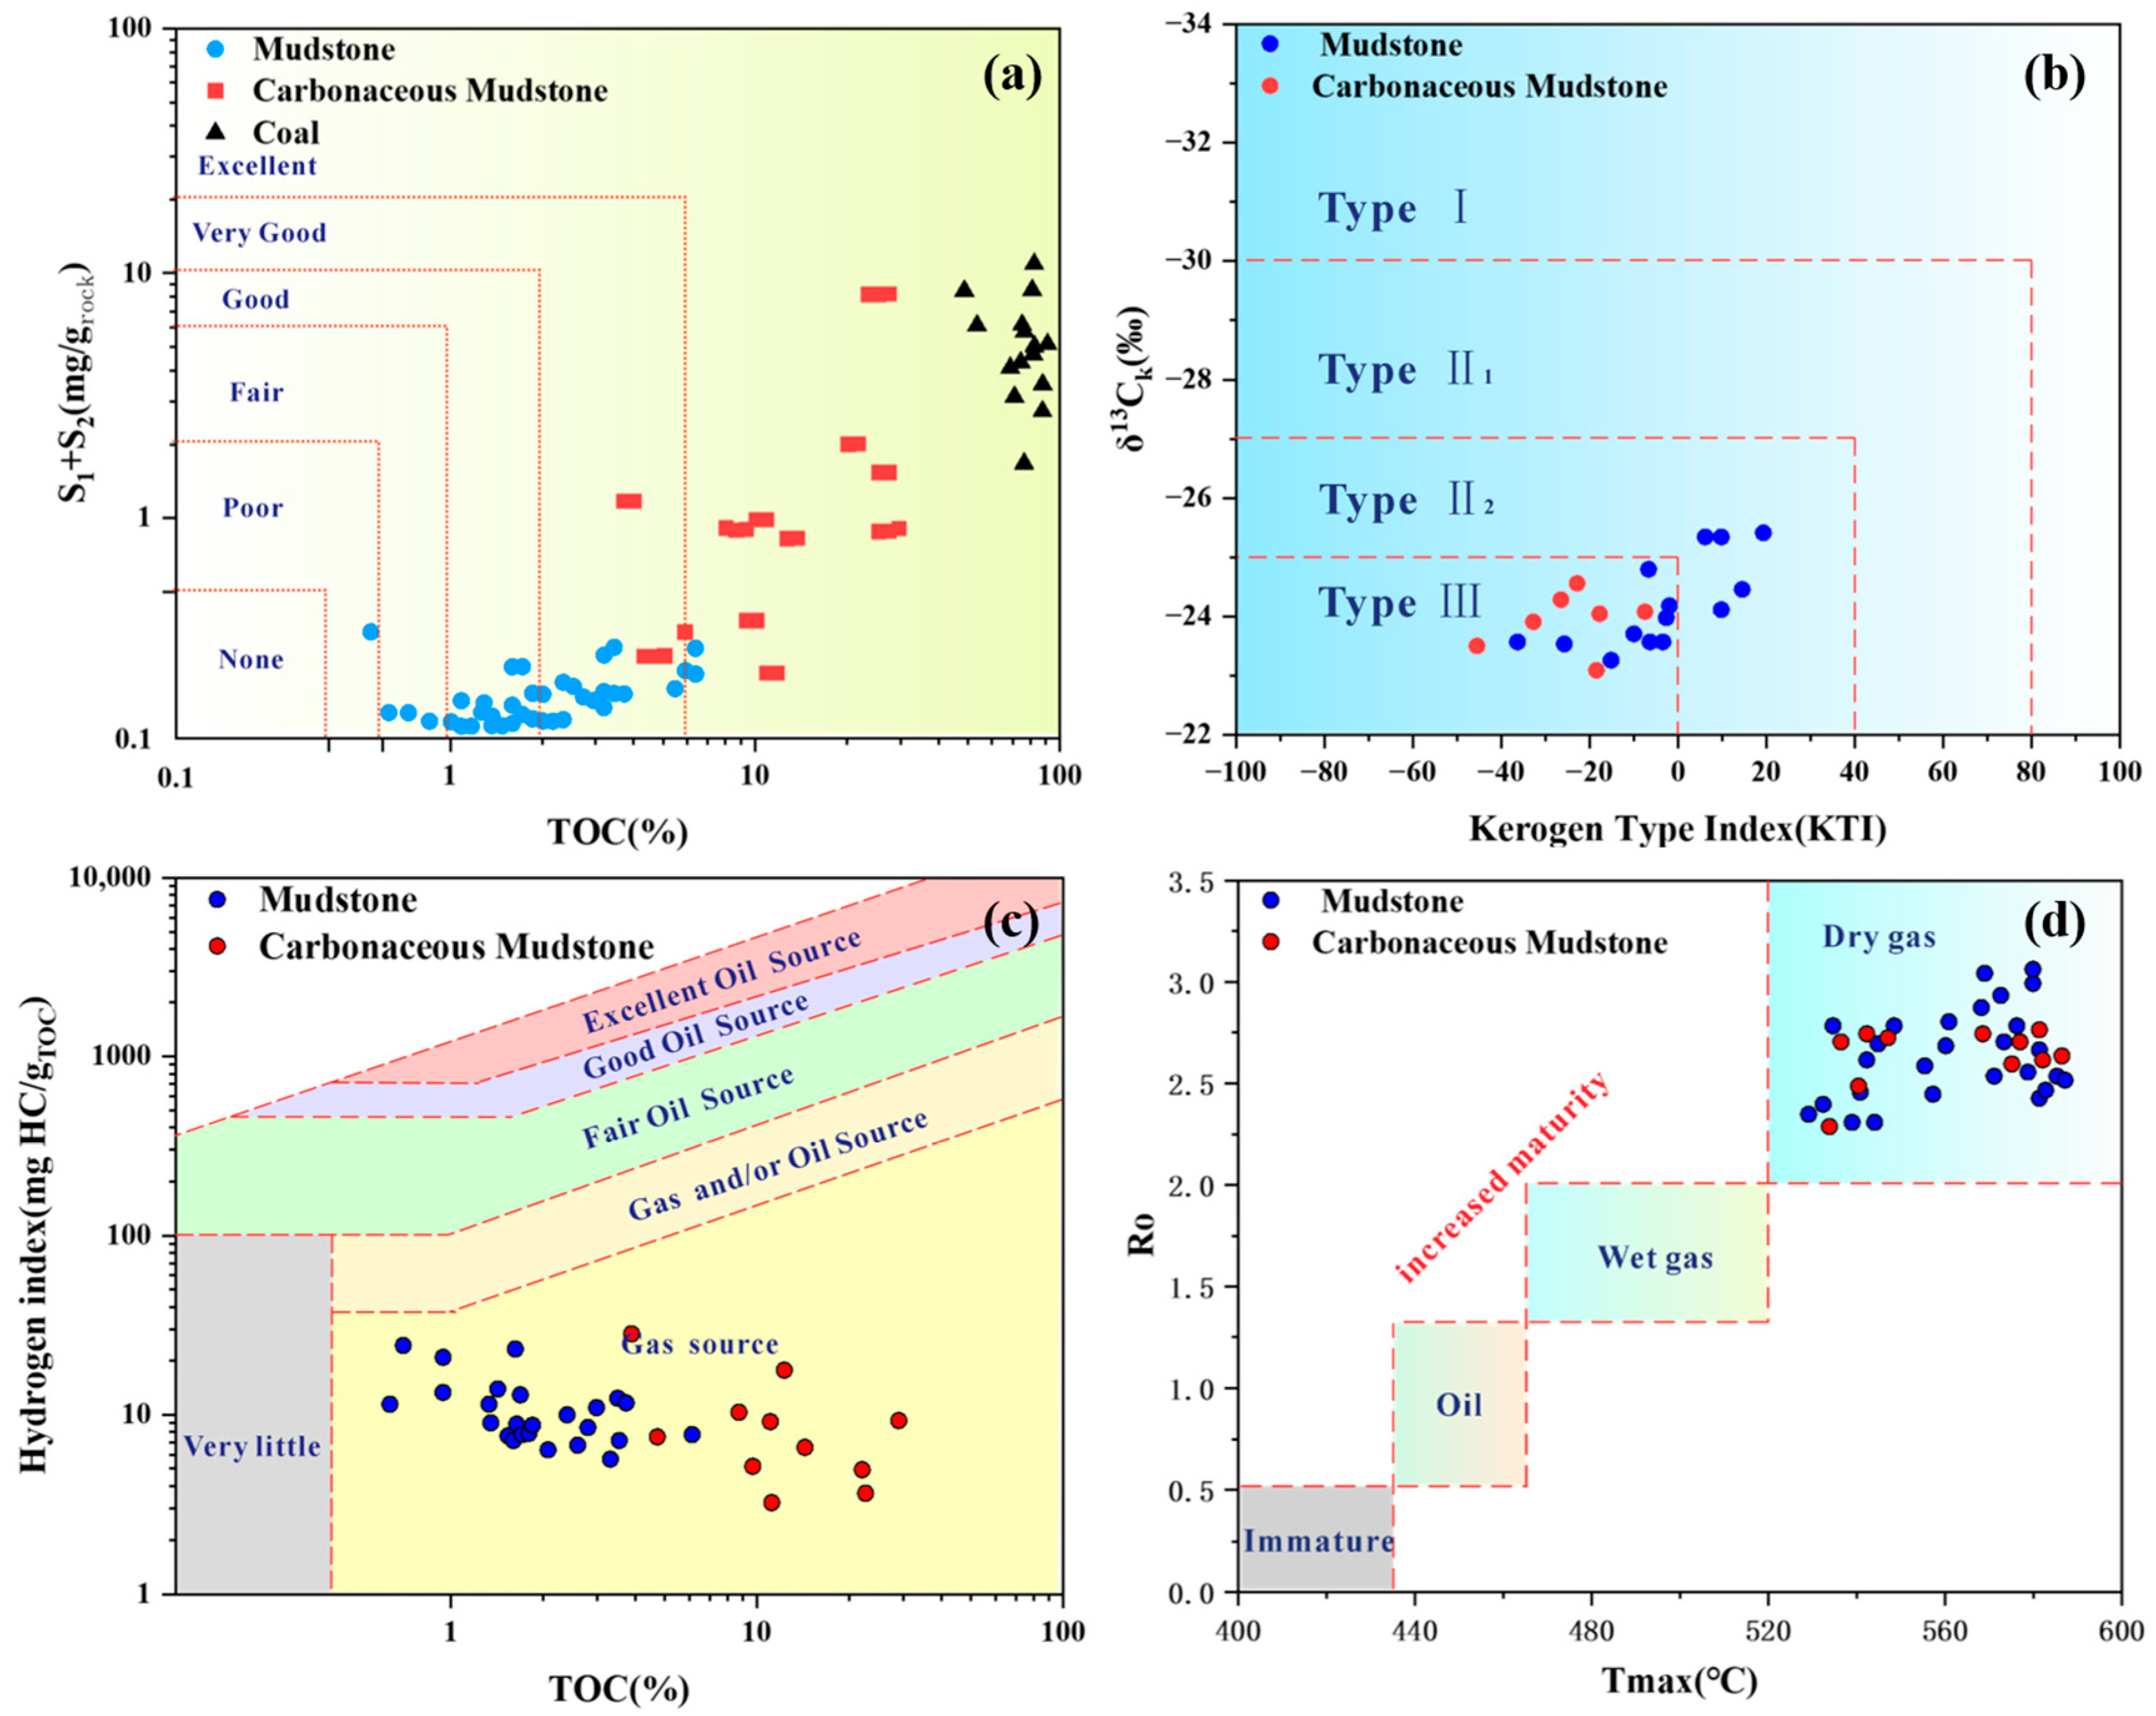
The hydrocarbon-generation capability of source rocks is primarily determined by two fundamental indicators: total organic carbon (TOC) content and the combined values of free and potential hydrocarbons (S1 + S2) [33]. As illustrated in Figure 2a, the black and carbonaceous mudstones of the Shanxi Formation demonstrate strong potential for generating shale gas.
The type of organic matter (OM) plays a crucial role in both the efficiency of hydrocarbon generation and the nature of the compounds produced during various stages of thermal evolution. As illustrated in the TI–δ13C plot (Figure 2b), the majority of samples are dominated by Type III kerogen, while a smaller portion aligns with Type II2. Furthermore, the correlation between TOC and hydrogen index (HI) values (Figure 2c) reinforces that the mudstone samples from the Shanxi Formation represent gas-prone source rocks with considerable hydrocarbon-generation potential.
Ro are essential parameters for identifying the type and maturity level of organic matter. These indicators are commonly used in geochemical analyses to assess thermal evolution and classify the hydrocarbon-generation potential of source rocks. In addition, as organic matter matures, there is a clear downward trend in the hydrogen index (HI), production index (PI), and the atomic ratios of oxygen to carbon (O/C) and hydrogen to carbon (H/C). These changes reflect the progressive thermal evolution of the organic material. The plotted relationship between Ro and Tmax values (Figure 2d) clearly indicates that all mudstone samples from the Shanxi Formation analyzed in this study have reached a high level of thermal maturity (Ro exceeding 1.3%), corresponding to the dry gas generation stage. Therefore, it can be concluded that the Shanxi Formation mudstones mainly consist of Type III and partially Type II2 kerogen. These samples are in an advanced thermal maturity stage (Ro > 1.3%), indicating that they are within the dry gas generation window and exhibit strong potential for gas-generation.

4.2. Gold Tube Pyrolysis

4.2.1. Gaseous Hydrocarbon Yields

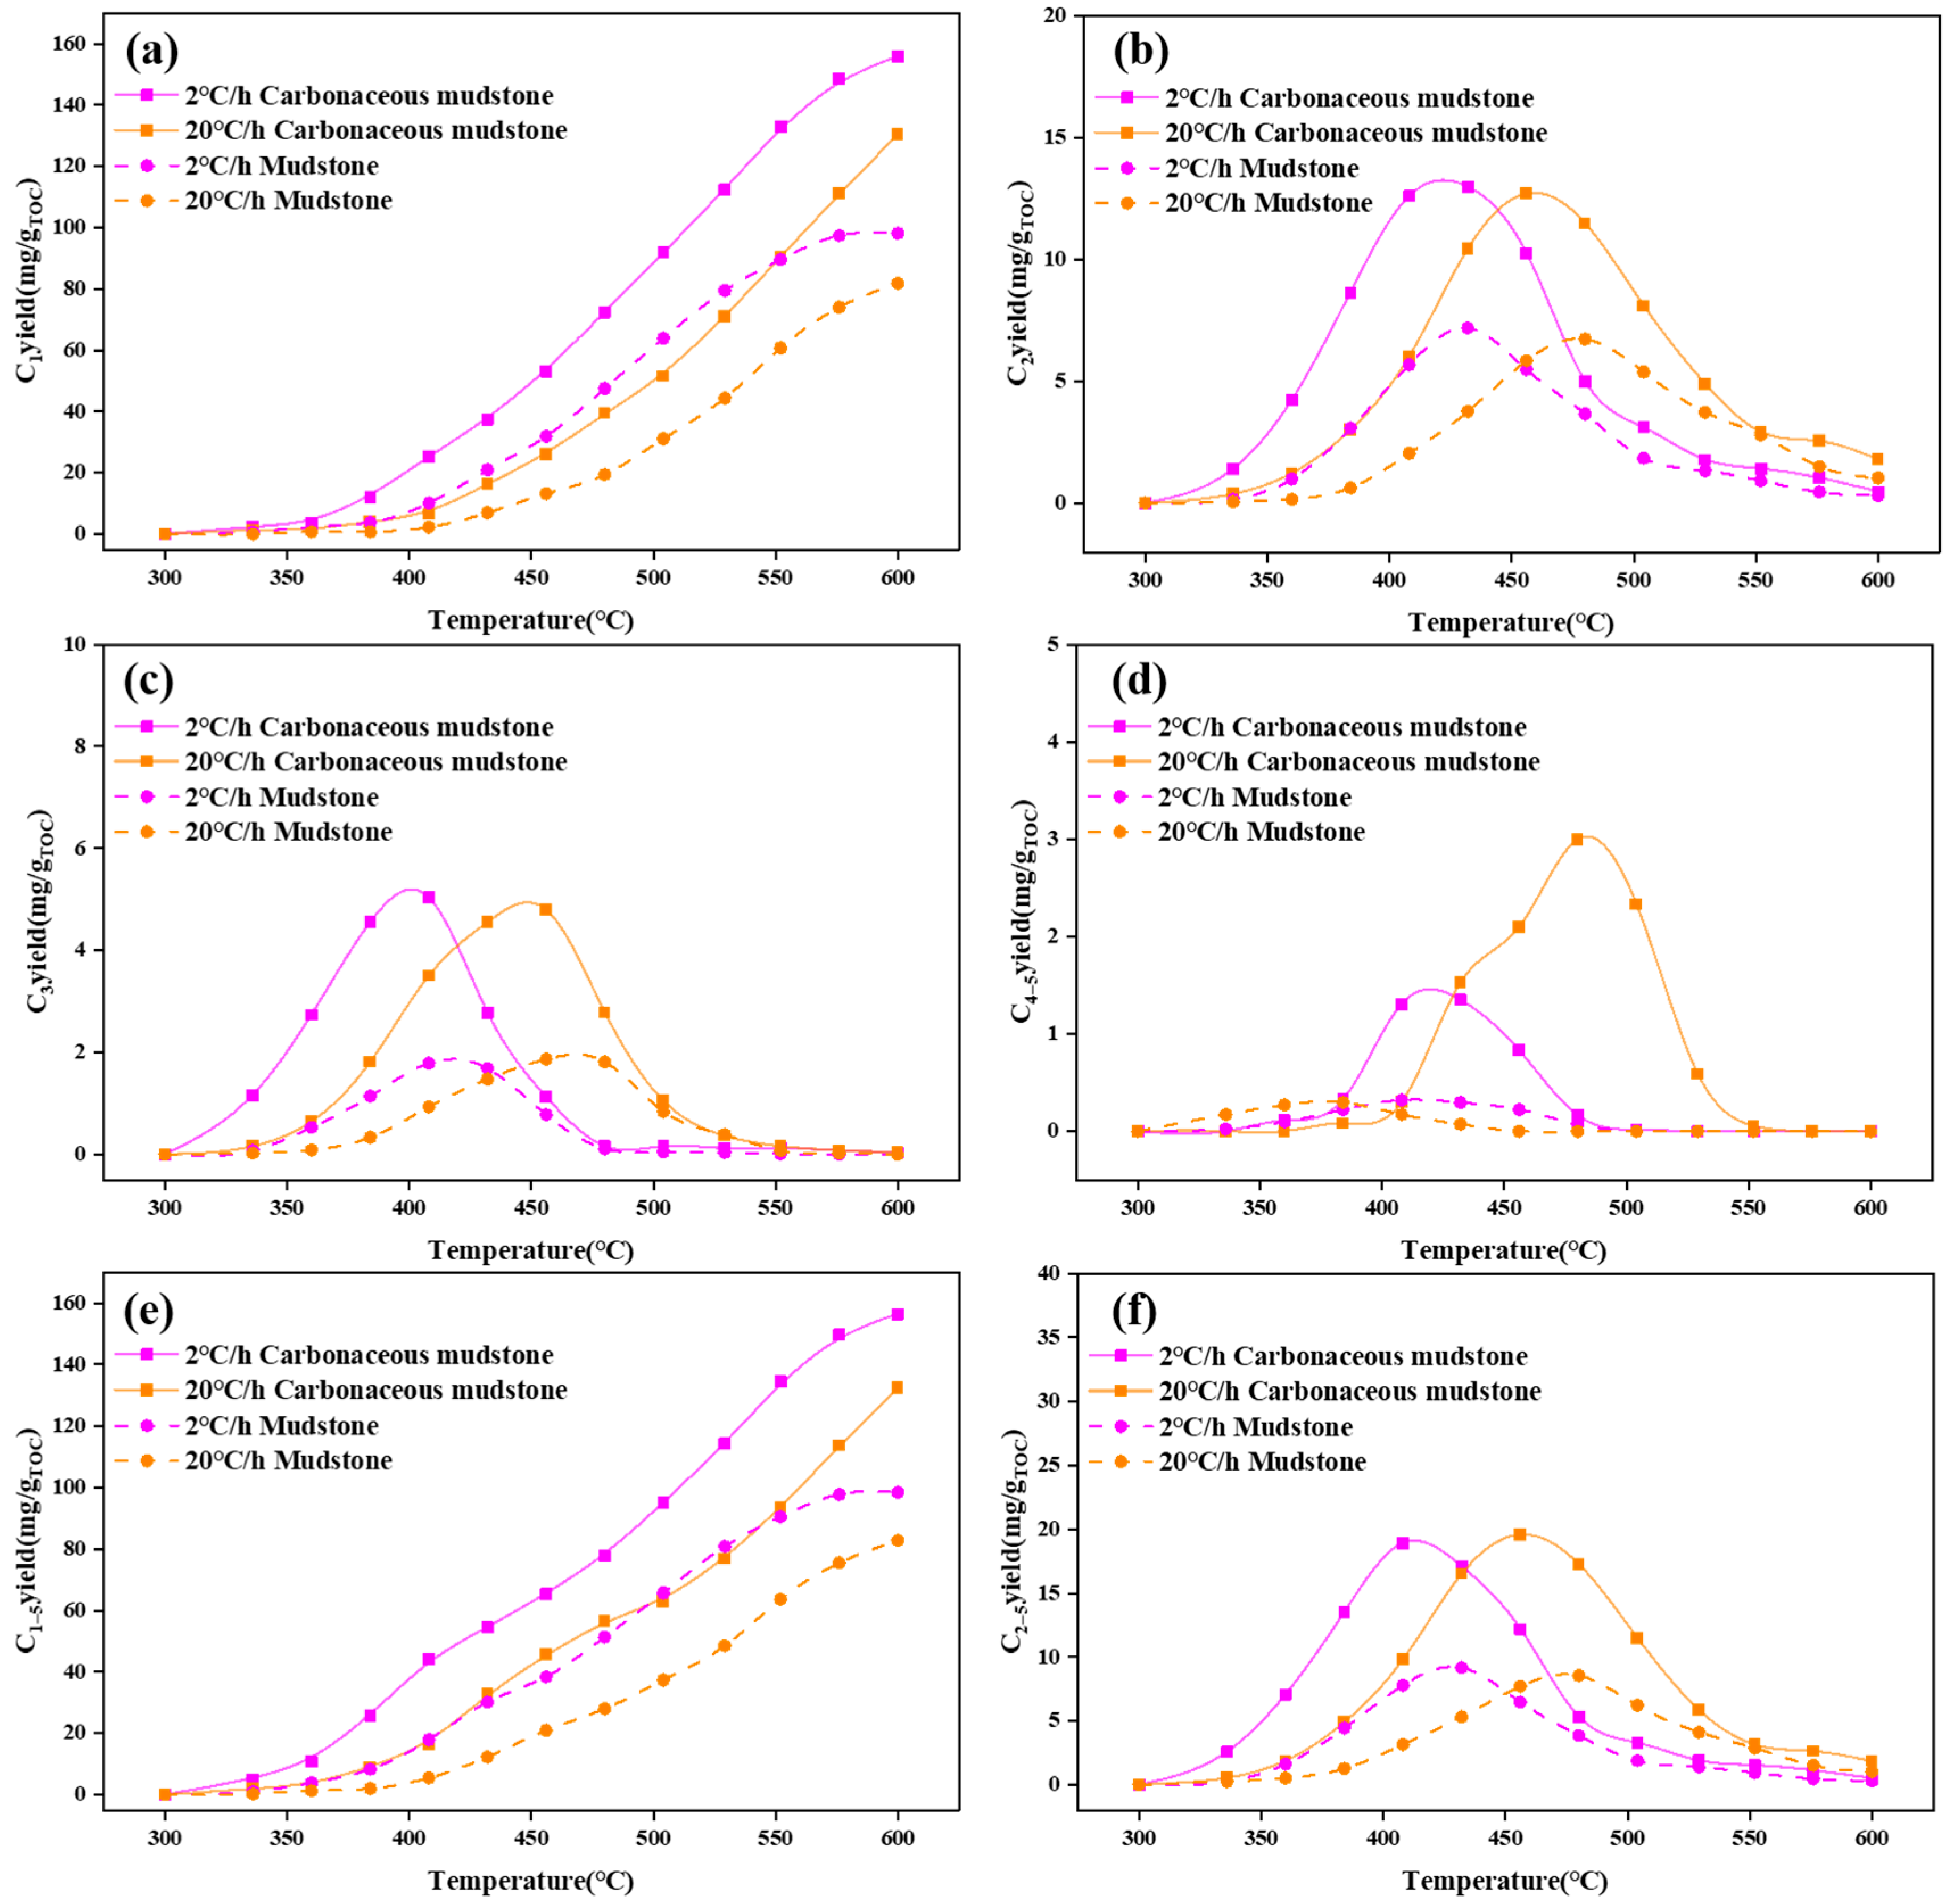
The production of gaseous hydrocarbons (C1–C5) from black and carbonaceous mudstone samples was evaluated through gold tube pyrolysis experiments conducted at two different heating rates: 2 °C per hour and 20 °C per hour. The results reveal consistent trends in hydrocarbon yields under both heating regimens (Figure 3). In the target temperature range, longer pyrolysis times resulted in more complete reactions, greater efficiency in converting organic matter, and higher yields. As a result, the full hydrocarbon-generation process is effectively captured by pyrolysis with a heating rate of 2 °C/h. Given the similarity in pyrolysis results between carbonaceous and black mudstones, the experiment using black mudstone at 2 °C/h is herein discussed as a representative case.
This similarity is likely attributed to their shared dominant kerogen type (Type III), which follows a consistent thermal degradation pathway, even with differences in TOC content. The primary control on hydrocarbon-generation pathways in both lithologies is thus thermal maturity rather than organic richness, leading to comparable yield trends under the same heating rate.
Across the full pyrolysis range (300–600 °C), yields of C1–5 and C1 went up steadily as the temperature rose (Figure 3). In contrast, other gaseous hydrocarbons reached peak yields around 450 °C before sharply declining to near-zero levels at higher temperatures. As illustrated in Figure 3a,e, the yields of C1 and C1–5 became nearly equivalent by the end of pyrolysis. Further evidence from Figure 3a–f indicates that methane dominated the hydrocarbon products in the later stages of pyrolysis, accounting for over 99% of total gaseous hydrocarbons. For both mudstone types, the yields of C2, C3, and C4–5 initially increased with temperature before undergoing a subsequent decrease, as shown in Figure 3b–d. Peak yields for carbonaceous mudstone occurred at 432 °C (C2), 409.5 °C (C3), and 408.6 °C (C4–5), while those for black mudstone were observed at 419.9 °C (C2), 407.6 °C (C3), and 395.7 °C (C4–5). These findings suggest that as the hydrocarbon molecular weight decreases, the temperature corresponding to maximum yield also decreases.

4.2.2. Kinetic Parameters

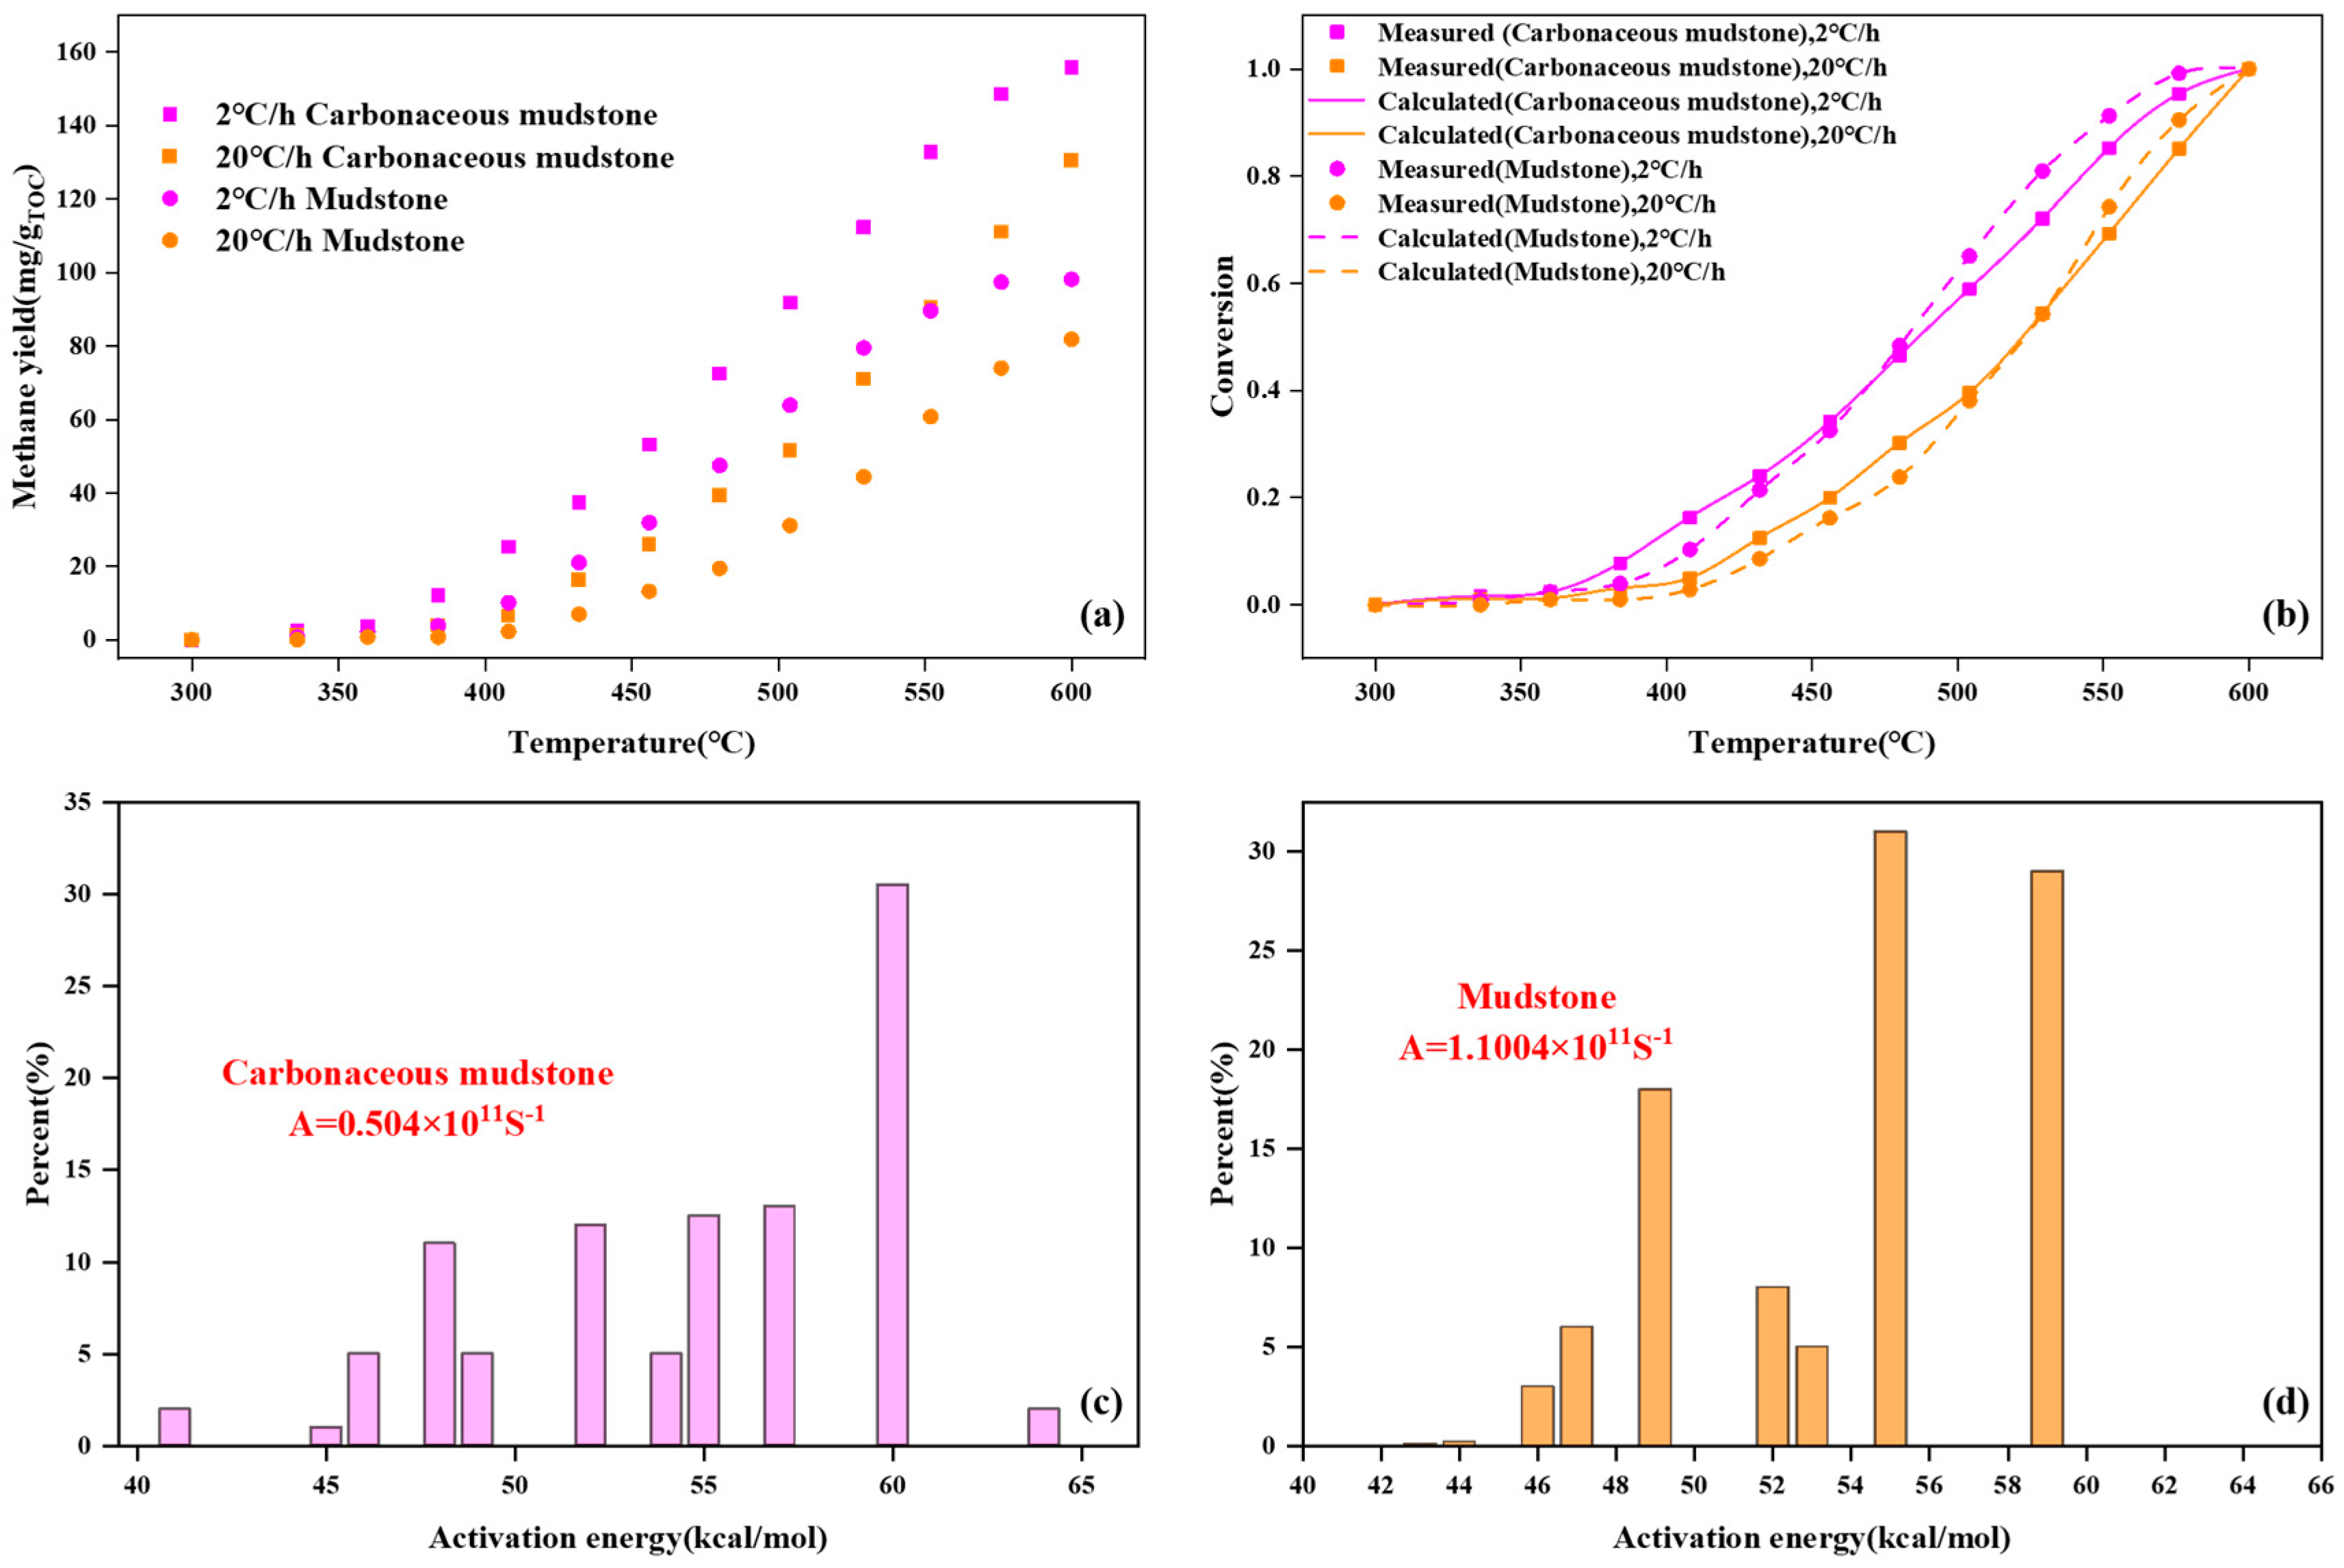
Under geological conditions, hydrocarbon generation in source rocks constitutes a continuous and intricate physicochemical process regulated by factors including temperature, pressure, and time. Across different stages, the makeup and geochemical features of hydrocarbon products vary significantly [10]. Kerogen-driven hydrocarbon generation adheres to a first-order kinetic model [11,12,13]. The kinetic modeling was performed using the KINETICS v2.0 software developed by Geokinetics Inc., which utilizes a parallel first-order reaction model and least-squares fitting to derive activation energy distributions and frequency factors from S2 pyrolysis data. In the present study, KINETICS software was employed to process the pyrolysis data, facilitating the derivation of kinetic parameters and methane generation conversion rates (Figure 4).
The yield and transformation profiles for C1, C2–5, and the combined C1–5 hydrocarbons, derived from activation energy-based calculations, closely match the experimental data, demonstrating strong consistency between the modeled and observed results. This congruence confirms that the fitted kinetic parameters are reliable for further computations (Figure 4a,b). For carbonaceous mudstone, the activation energy for C1 generation ranges from 48 to 60 kcal/mol, displaying multiple peaks, with a frequency factor of 1.1004 × 10¹¹ S−1 (Figure 4c). Similarly, the activation energy for C1 generation in black mudstone falls within the 48–60 kcal/mol range, featuring three distinct peaks at 49 kcal/mol, 55 kcal/mol, and 59 kcal/mol, alongside a frequency factor of 0.504 × 10¹¹ s−1 (Figure 4d).

4.2.3. EasyRo–Temperature Conversion

Ro is widely recognized as a key parameter for evaluating source rock maturity. The EasyRo (Easy Vitrinite Reflectance) model is commonly applied to calculate the maturity of thermally simulated samples. However, discrepancies exist between maturity values derived from the EasyRo model and those of actual geological samples, particularly at high maturity stages. Based on extensive thermal simulation experiments and corresponding Ro–temperature datasets, a modified EasyRo equation was developed to establish the relationship between pyrolysis temperature (T) and maturity (Ro):
Ro = 0.2766e(0.0048T) − 0.68,
with a correlation coefficient of R2 = 0.98. This modified equation is suitable for characterizing the maturity of coal-measure source rocks during thermal simulation [34]. Equation (1) was empirically derived and calibrated using experimental datasets from coal-measure source rocks [12,34]. The model shows improved performance over traditional EasyRo models [11] at high maturity stages, especially in dry gas windows (Ro > 2.0%).
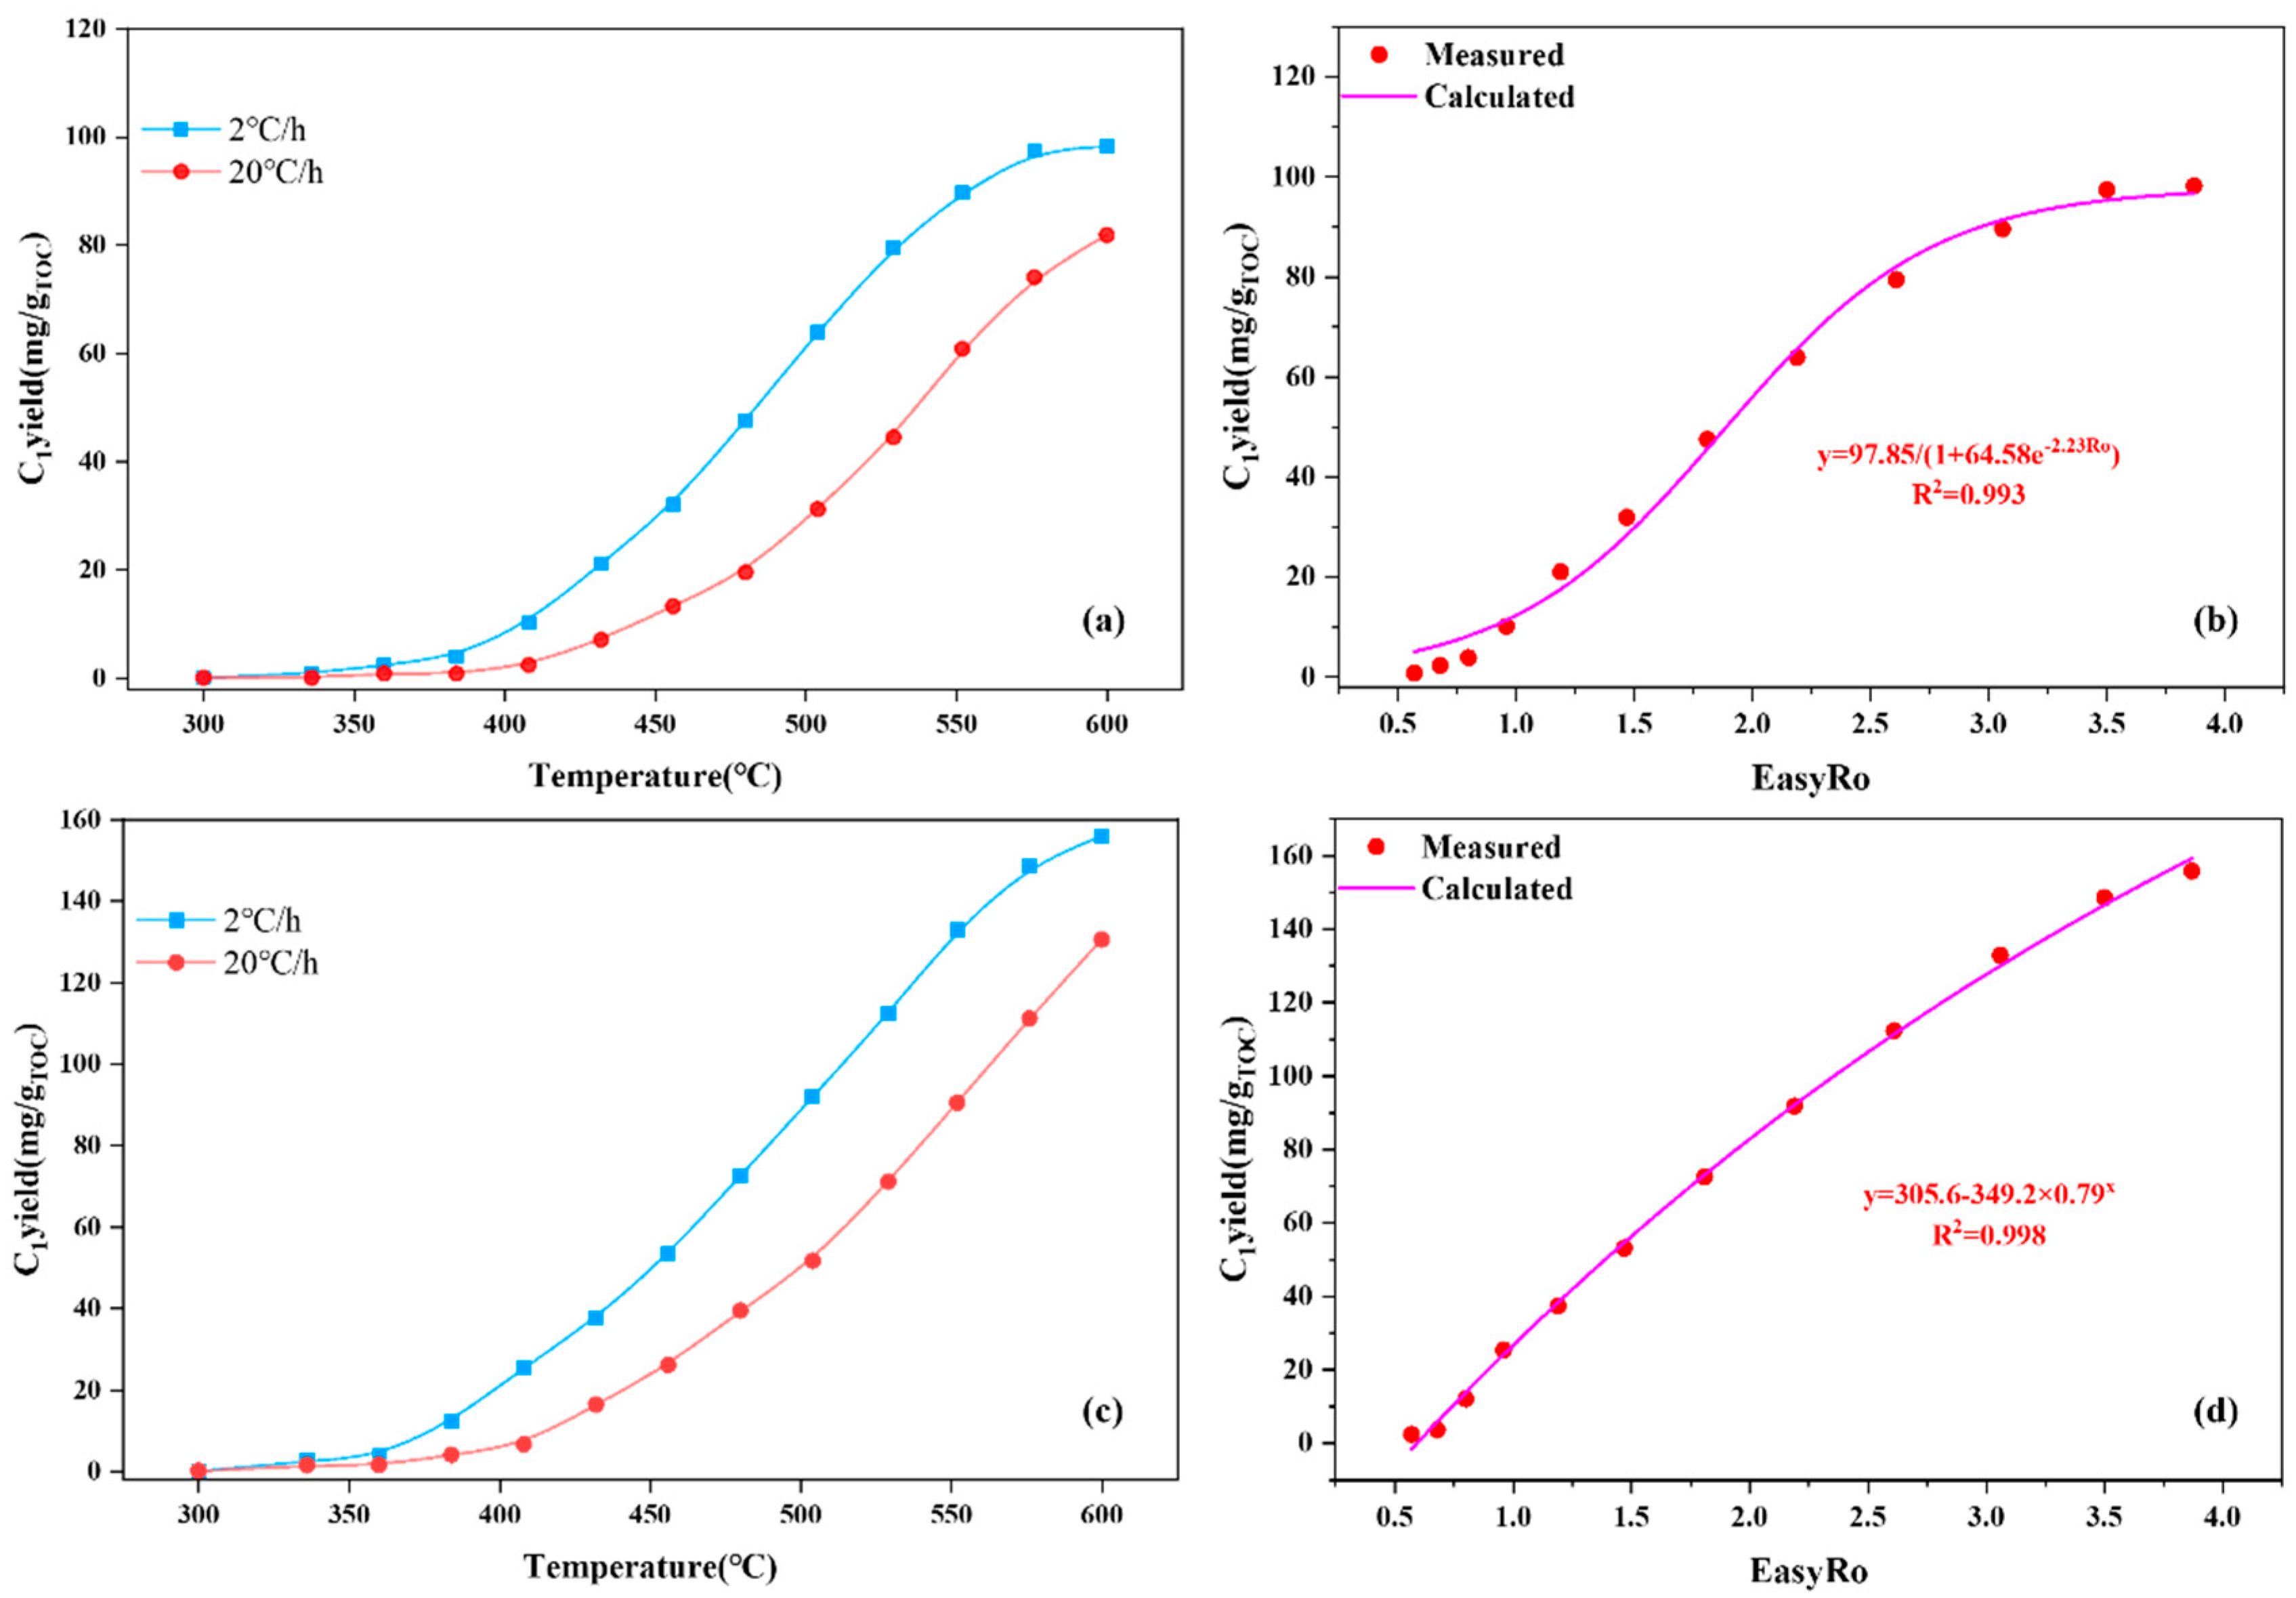
Researchers carried out gold tube pyrolysis on mudstone samples collected from the study area. Because a heating rate of 2 °C/h is highly similar to natural geothermal gradients, these experiments’ methane (CH4) yield data were used for curve fitting. Using the aforementioned modified equation, pyrolysis temperature (T) was converted to maturity (Ro), enabling the analysis of gas yield variations with Ro (Figure 5a,c). The fitting results are as follows: for black mudstone, the CH4 yield (y) conforms to the equation
y = 97.85/(1 + 64.58 × e (−2.23×Ro)),
Gas yield rises from 20 mg/g TOC (Ro = 1.0%) to 98 mg/g TOC (Ro = 2.5%) in dark mudstones, exhibiting an initial rapid rise followed by a gradual slowdown. Specifically, the rate of increase decelerates when Ro > 2% and stabilizes when Ro > 2.5%, approaching a maximum yield of 98.18 mg/g TOC (Figure 5b). For carbonaceous mudstone, the fitting equation is
y = 305.6 − 349.2 × 0.79Ro,
with gas yield increasing steadily alongside maturity. The growth rate diminishes when Ro > 3% and converges toward a maximum value of 155.84 mg/g TOC once Ro exceeds 4% (Figure 5d).
In this model, Ro values are derived from temperature using the modified EasyRo equation, based on gold tube pyrolysis experimental data. Such Ro–temperature conversions are widely applied in thermal simulation studies of source rocks, especially in closed-system gold tube experiments, to enable direct comparison between experimental results and natural geological maturity levels [11]. This approach allows maturity to be expressed in a standardized form, facilitating kinetic modeling and gas yield prediction. However, it should be noted that these Ro values represent simulated maturity under laboratory heating conditions, which may not fully replicate long-term geological processes, particularly at extremely high maturity levels (Ro > 4%). Future work will test the applicability of this relationship to other coal-measure mudstones from different basins to further evaluate its generality.

4.3. Distribution Characteristics of Mudstones

4.3.1. Thickness Distribution

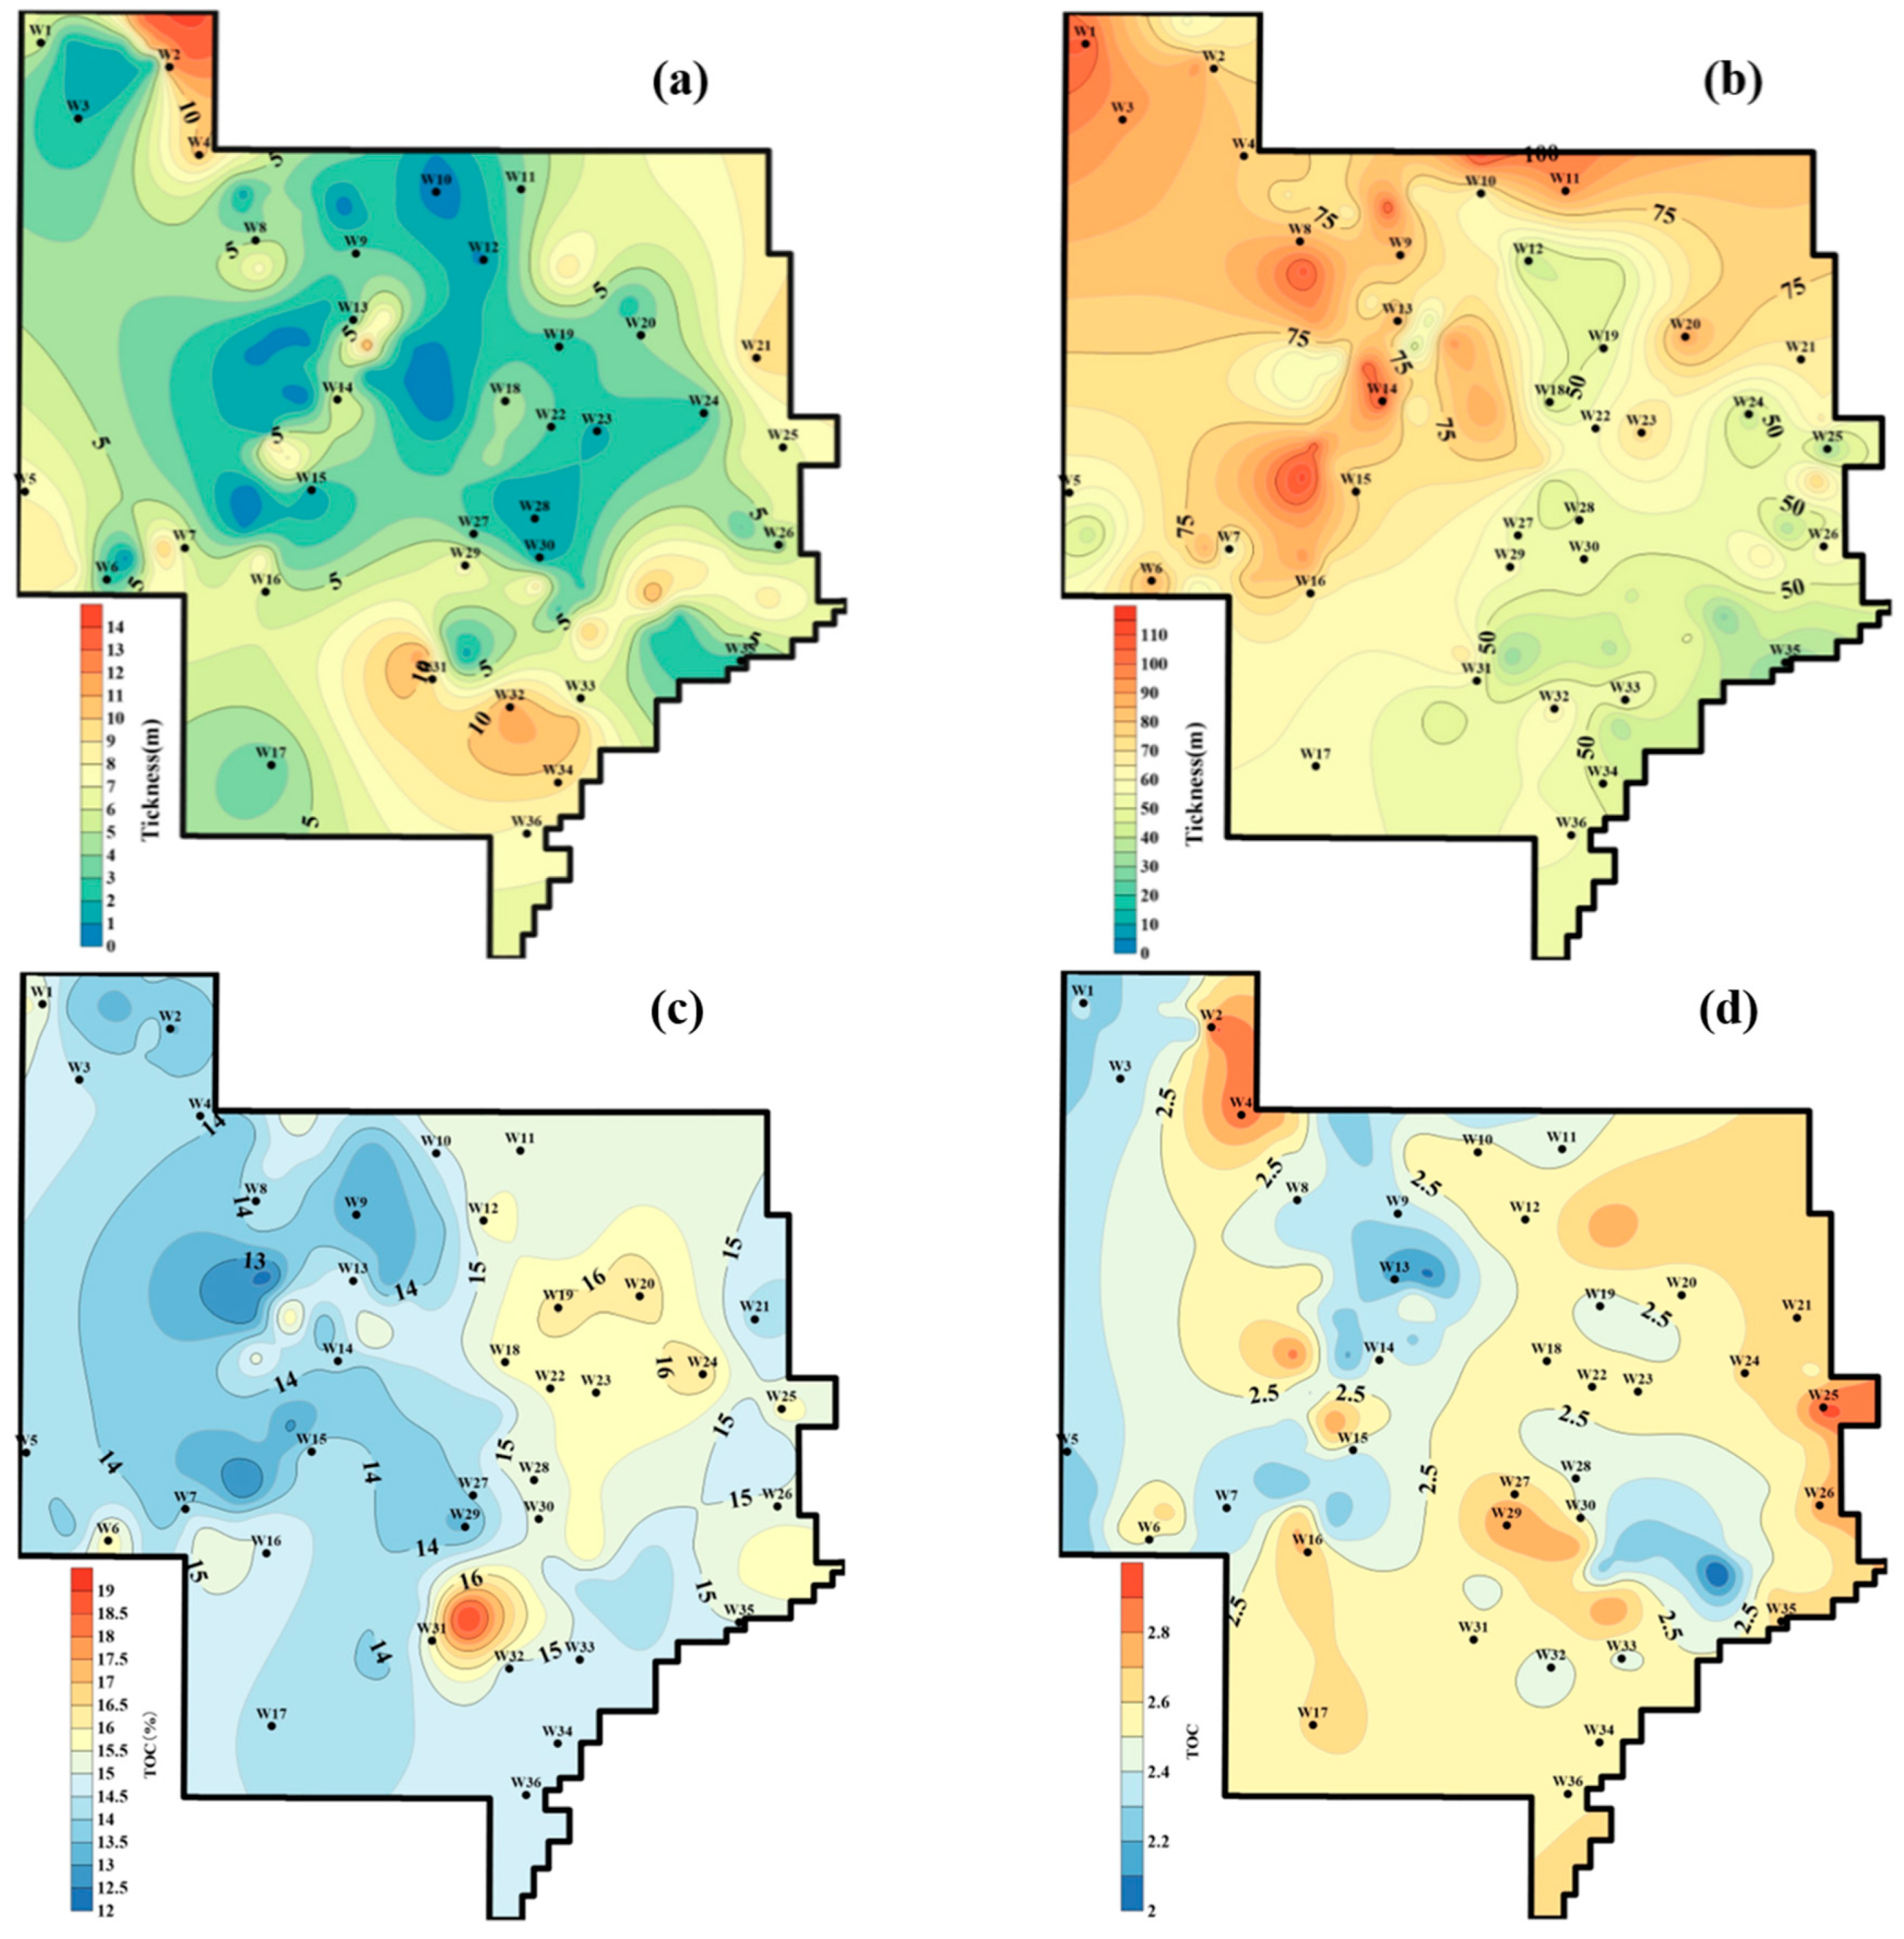
Within the study region, carbonaceous and black mudstones of the Shanxi Formation are extensively developed and exhibit a significant presence. The carbonaceous mudstones display thicknesses varying between 0.13 m and 12.40 m, averaging approximately 4.76 m across the study area. The maximum thickness of carbonaceous mudstones is distributed near the W32 well area. In terms of spatial distribution, their thickness exhibits a pattern of being greater in peripheral regions and lesser in the central area, increasing gradually from the center toward the surroundings (Figure 6a, carbonaceous mudstones). For black mudstones, the thickness varies from 28.38 to 112.70 m, with an average of 67.20 m, characterized by significant east–west differentiation in thickness—dominant areas are almost concentrated in the west—with greater thickness in the northwest and lesser in the southeast, showing an increasing trend from the southeast to the northwest (Figure 6b, black mudstones).

4.3.2. TOC Distribution

The total organic carbon (TOC) content in the carbonaceous mudstones varies from 12.78% to 18.42%, with an average value of 14.20% (Figure 6c, carbonaceous mudstones). In contrast, black mudstones have a TOC content ranging from 1.91% to 3.00%, with an average of 2.77% (Figure 6d, black mudstones). Both lithologies display a consistent distribution trend, with higher TOC values in the eastern part of the study area and lower values in the western part.

4.3.3. Ro Distribution

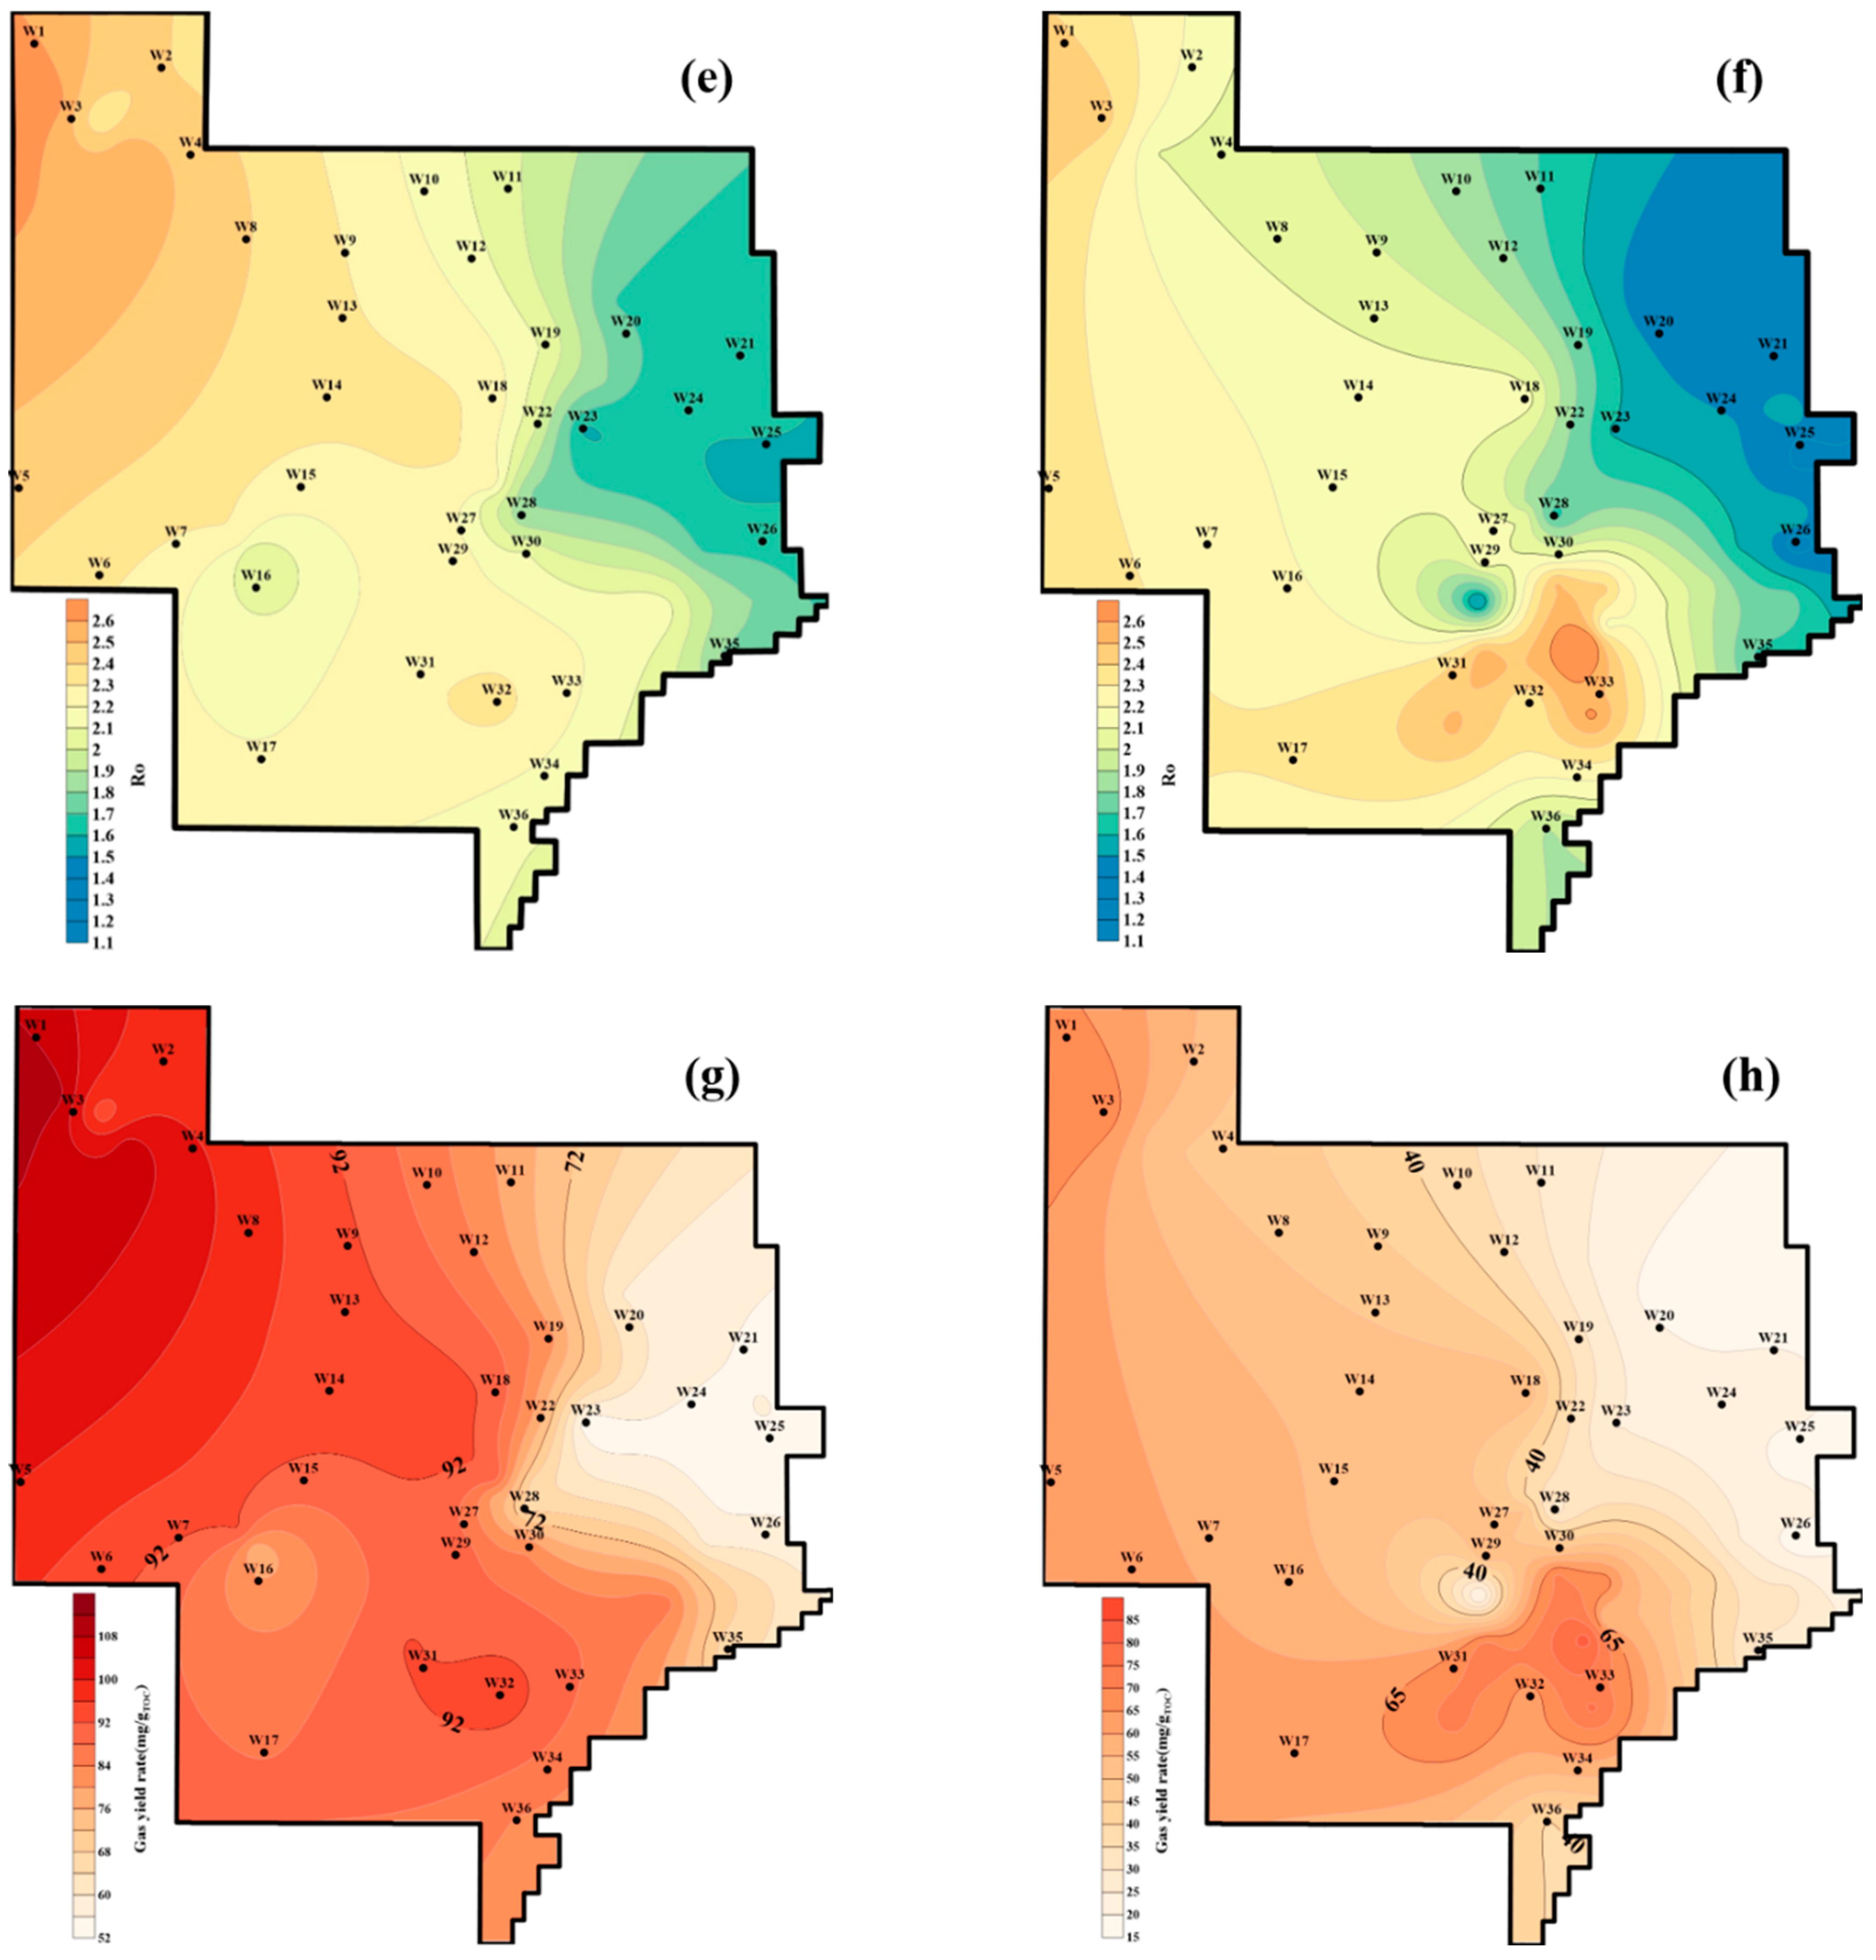
Ro of carbonaceous mudstones ranges from 1.37% to 2.47%, with an average of 1.97%, and peaks in the western region (Figure 6e, carbonaceous mudstones). For black mudstones, Ro varies from 1.14% to 2.57%, with an average of 1.83% (Figure 6f, black mudstones). Notably, Ro values for both mudstone types exhibit a decreasing trend from west to east.
Based on the Ro-to-gas yield conversion method described in Section 4.2.2 and the areal distribution of Ro, the spatial distribution of gas yields was derived (Figure 6g,h). According to Figure 6g (carbonaceous mudstones) and Figure 6h (black mudstones), the maximum gas yield of black mudstones reaches 80.84 mg/g TOC, with an average of 47.76 mg/g TOC, whereas carbonaceous mudstones have a maximum gas yield of 110.63 mg/g TOC and an average of 85.57 mg/g TOC. Although the gas yield distribution trends are similar for both lithologies, carbonaceous mudstones consistently exhibit higher yields. The highest values are concentrated in the central area, while the lowest values occur in the east, presenting an overall west-high and east-low pattern. This description refers specifically to the gas yield distribution, not the general Ro distribution.

4.3.4. True Density

True density is defined as the mass per unit volume of the solid fraction of a rock, excluding pore spaces. It reflects the intrinsic density of the solid matter and is commonly used in hydrocarbon-generation calculations instead of bulk density. Fluids at different depths also have varying effects on the density of mudstones, but this issue is not considered in this paper [35,36,37,38,39]. To estimate true density from bulk density, logging-derived density data and porosity are utilized, with the relevant variables defined as follows:
ρb—bulk density, g/cm3; ρm—true (grain) density; Φ—porosity; ρf—density of the pore fluid.
Since the oil content in the coal seam is low in this case, the pores are assumed to be filled primarily with water. The density of water at reservoir temperature is considered to be 1 g/cm3.
ρb = ϕ + (1 − ϕ) × ρm,
Given the minor density differences between carbonaceous and black mudstones, constant values were adopted for calculations. Based on the dataset, the true densities used are 2.65 g/cm3 for carbonaceous mudstones and 2.75 g/cm3 for black mudstones (see Section 5.3).
Given that the density variation of formation water with depth (typically 0.98–1.05 g/cm3 in this region) is minor compared with the true grain density of the mudstones (>2.6 g/cm3), its effect on calculated HGI values is negligible. Sensitivity tests indicate that using a constant pore fluid density of 1.0 g/cm3 results in HGI changes of less than 1%, which is within the overall uncertainty of the model.

5. Discussion

5.1. Natural Gas Generation at Different Stages

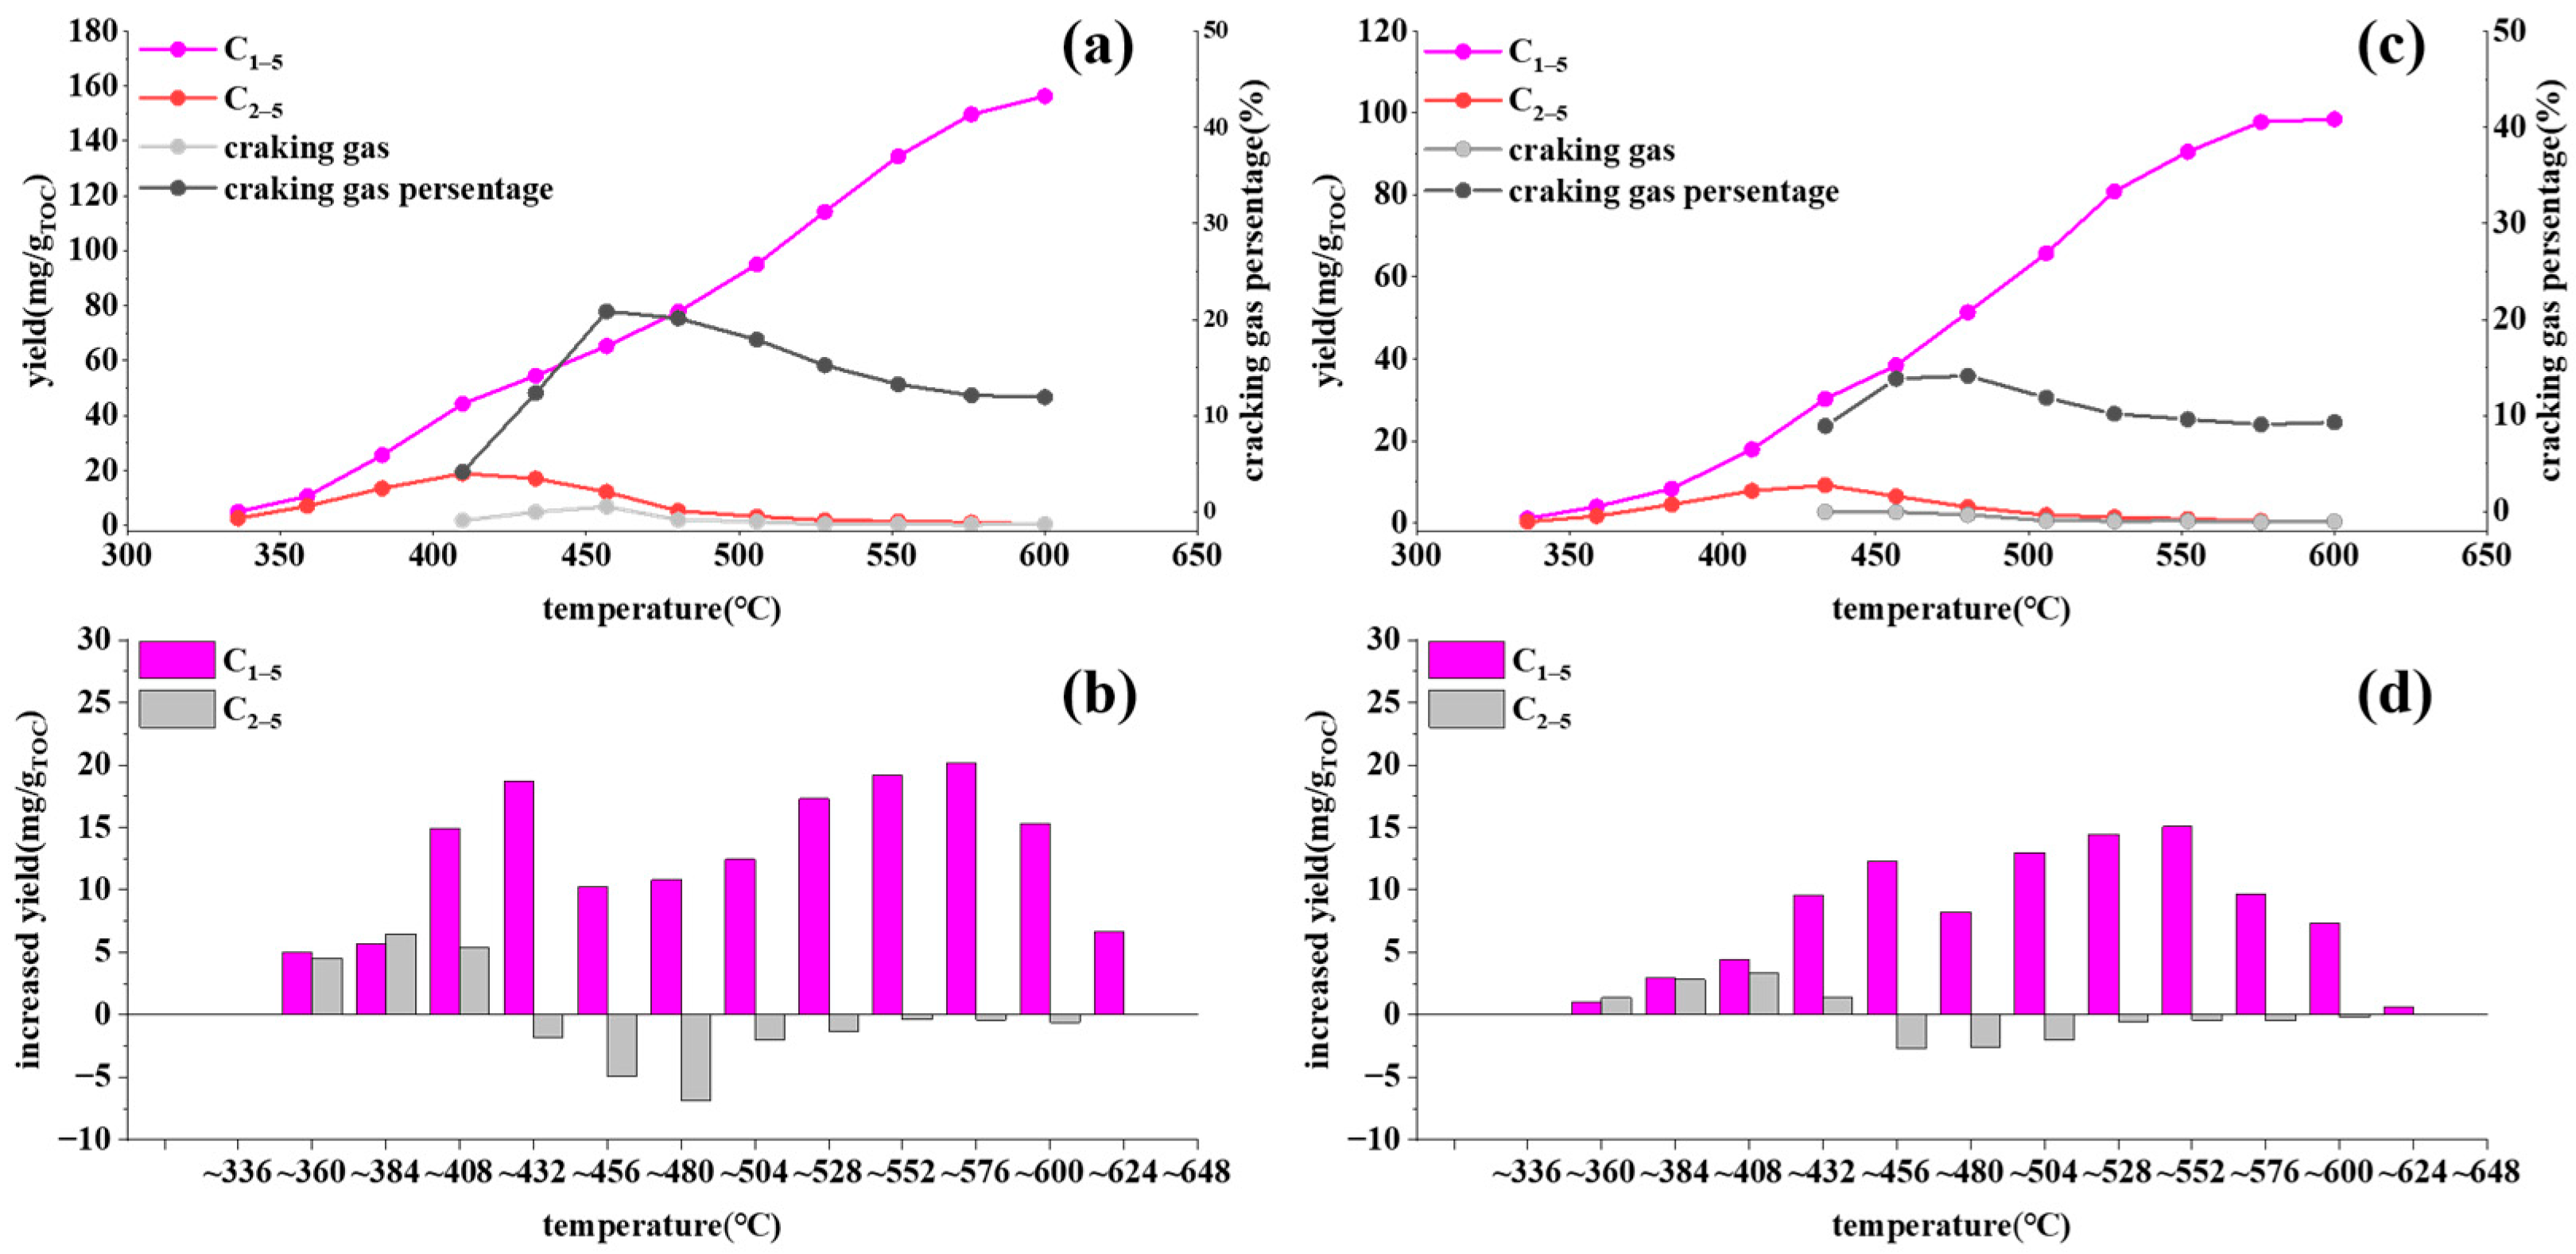
Previous studies have shown that methane is directly generated during the initial thermal cracking of kerogen, while wet gas components can further crack into methane as temperature increases [40]. To evaluate gas content and measure how wet gas cracking contributes to methane generation at varying maturity levels, researchers analyzed the evolutionary trends and net yields of C1–5 and C2–5 hydrocarbons under a 2 °C/h heating rate. These findings allow the hydrocarbon-generation process to be split into three stages (Figure 7):
Stage I (T < 432 °C): This stage is dominated by kerogen cracking. Both C1–5 and C2–5 yields increase with temperature, with a notable acceleration after 384 °C. Prior to 384 °C, yield increases are sluggish due to insufficient temperature for wet gas cracking. Between 384–408 °C (carbonaceous mudstones) and 384–432 °C (black mudstones), C1–5 yields rise sharply while C2–5 yields begin to decline, reflecting rapid methane generation from kerogen cracking. The main source of hydrocarbon gases in this stage is the initial decomposition of kerogen [41,42].
Stage II (432–528 °C): This stage involves concurrent kerogen cracking and wet gas cracking. Although C1–5 yields continue to increase, the growth rate slows due to the decrease in C2–5. C2–5 exhibits a net negative yield, with maximum consumption observed at 528 °C. The conversion of wet gas to methane peaks at 450 °C, where methane derived from wet gas cracking accounts for 22.41% of total methane in carbonaceous mudstones and 15.74% in black mudstones. Kerogen cracking contributes far more to methane generation than wet gas or oil cracking, following the order kerogen > oil > wet gas [43].
Stage III (528–600 °C): Wet gas cracking ceases, and the net yield of C1–5 decreases. Most gaseous products at this stage are still derived from residual kerogen. The cumulative C1–5 yields reach 156.35 mg/g TOC for carbonaceous mudstones and 98.49 mg/g TOC for black mudstones.
The transition around 432 °C corresponds to a Ro of approximately 1.3%, aligning with the entry into the dry gas window. The 528 °C threshold reflects peak dry gas generation, marking the end of effective gas generation under natural burial conditions.
In the gold tube experiments of this study, wet gas cracking is most pronounced in Stage II (432–528 °C), where the net negative increment in C2–5 yields (ranging from −2.1 to −5.3 mg/g TOC) was used to quantify the cracking efficiency—this range is narrower than that reported by He et al. (2022), likely due to differences in TOC content [16]. Although slight C4–5 cracking might occur in Stage I, its impact is insignificant. Overall, kerogen cracking remains the dominant source of methane generation across all three stages.

5.2. Hydrocarbon-Generation Intensity Calculation

Hydrocarbon-generation intensity (HGI) quantifies the ability and efficiency of source rocks to generate hydrocarbons during thermal maturation, serving as a key indicator of hydrocarbon potential [12]. In this study, hydrocarbon-generation intensity (HGI) of Shanxi Formation mudstones was quantified using a modified industry equation:
G = H × ρ× TOC × r,
G denotes the hydrocarbon-generation intensity of source rocks, with units of 108 m3/km2; H represents the thickness of source rocks in meters, derived from logging interpretations of 137 wells within the study area; ρ refers to the density of source rocks in g/cm3, obtained from logging curves of different lithologies; TOC stands for total organic carbon content in percentage, determined via fixed carbon–TOC conversion; and r indicates the gas-generation rate in cm3/gTOC, calculated through Ro–gas generation rate conversion.
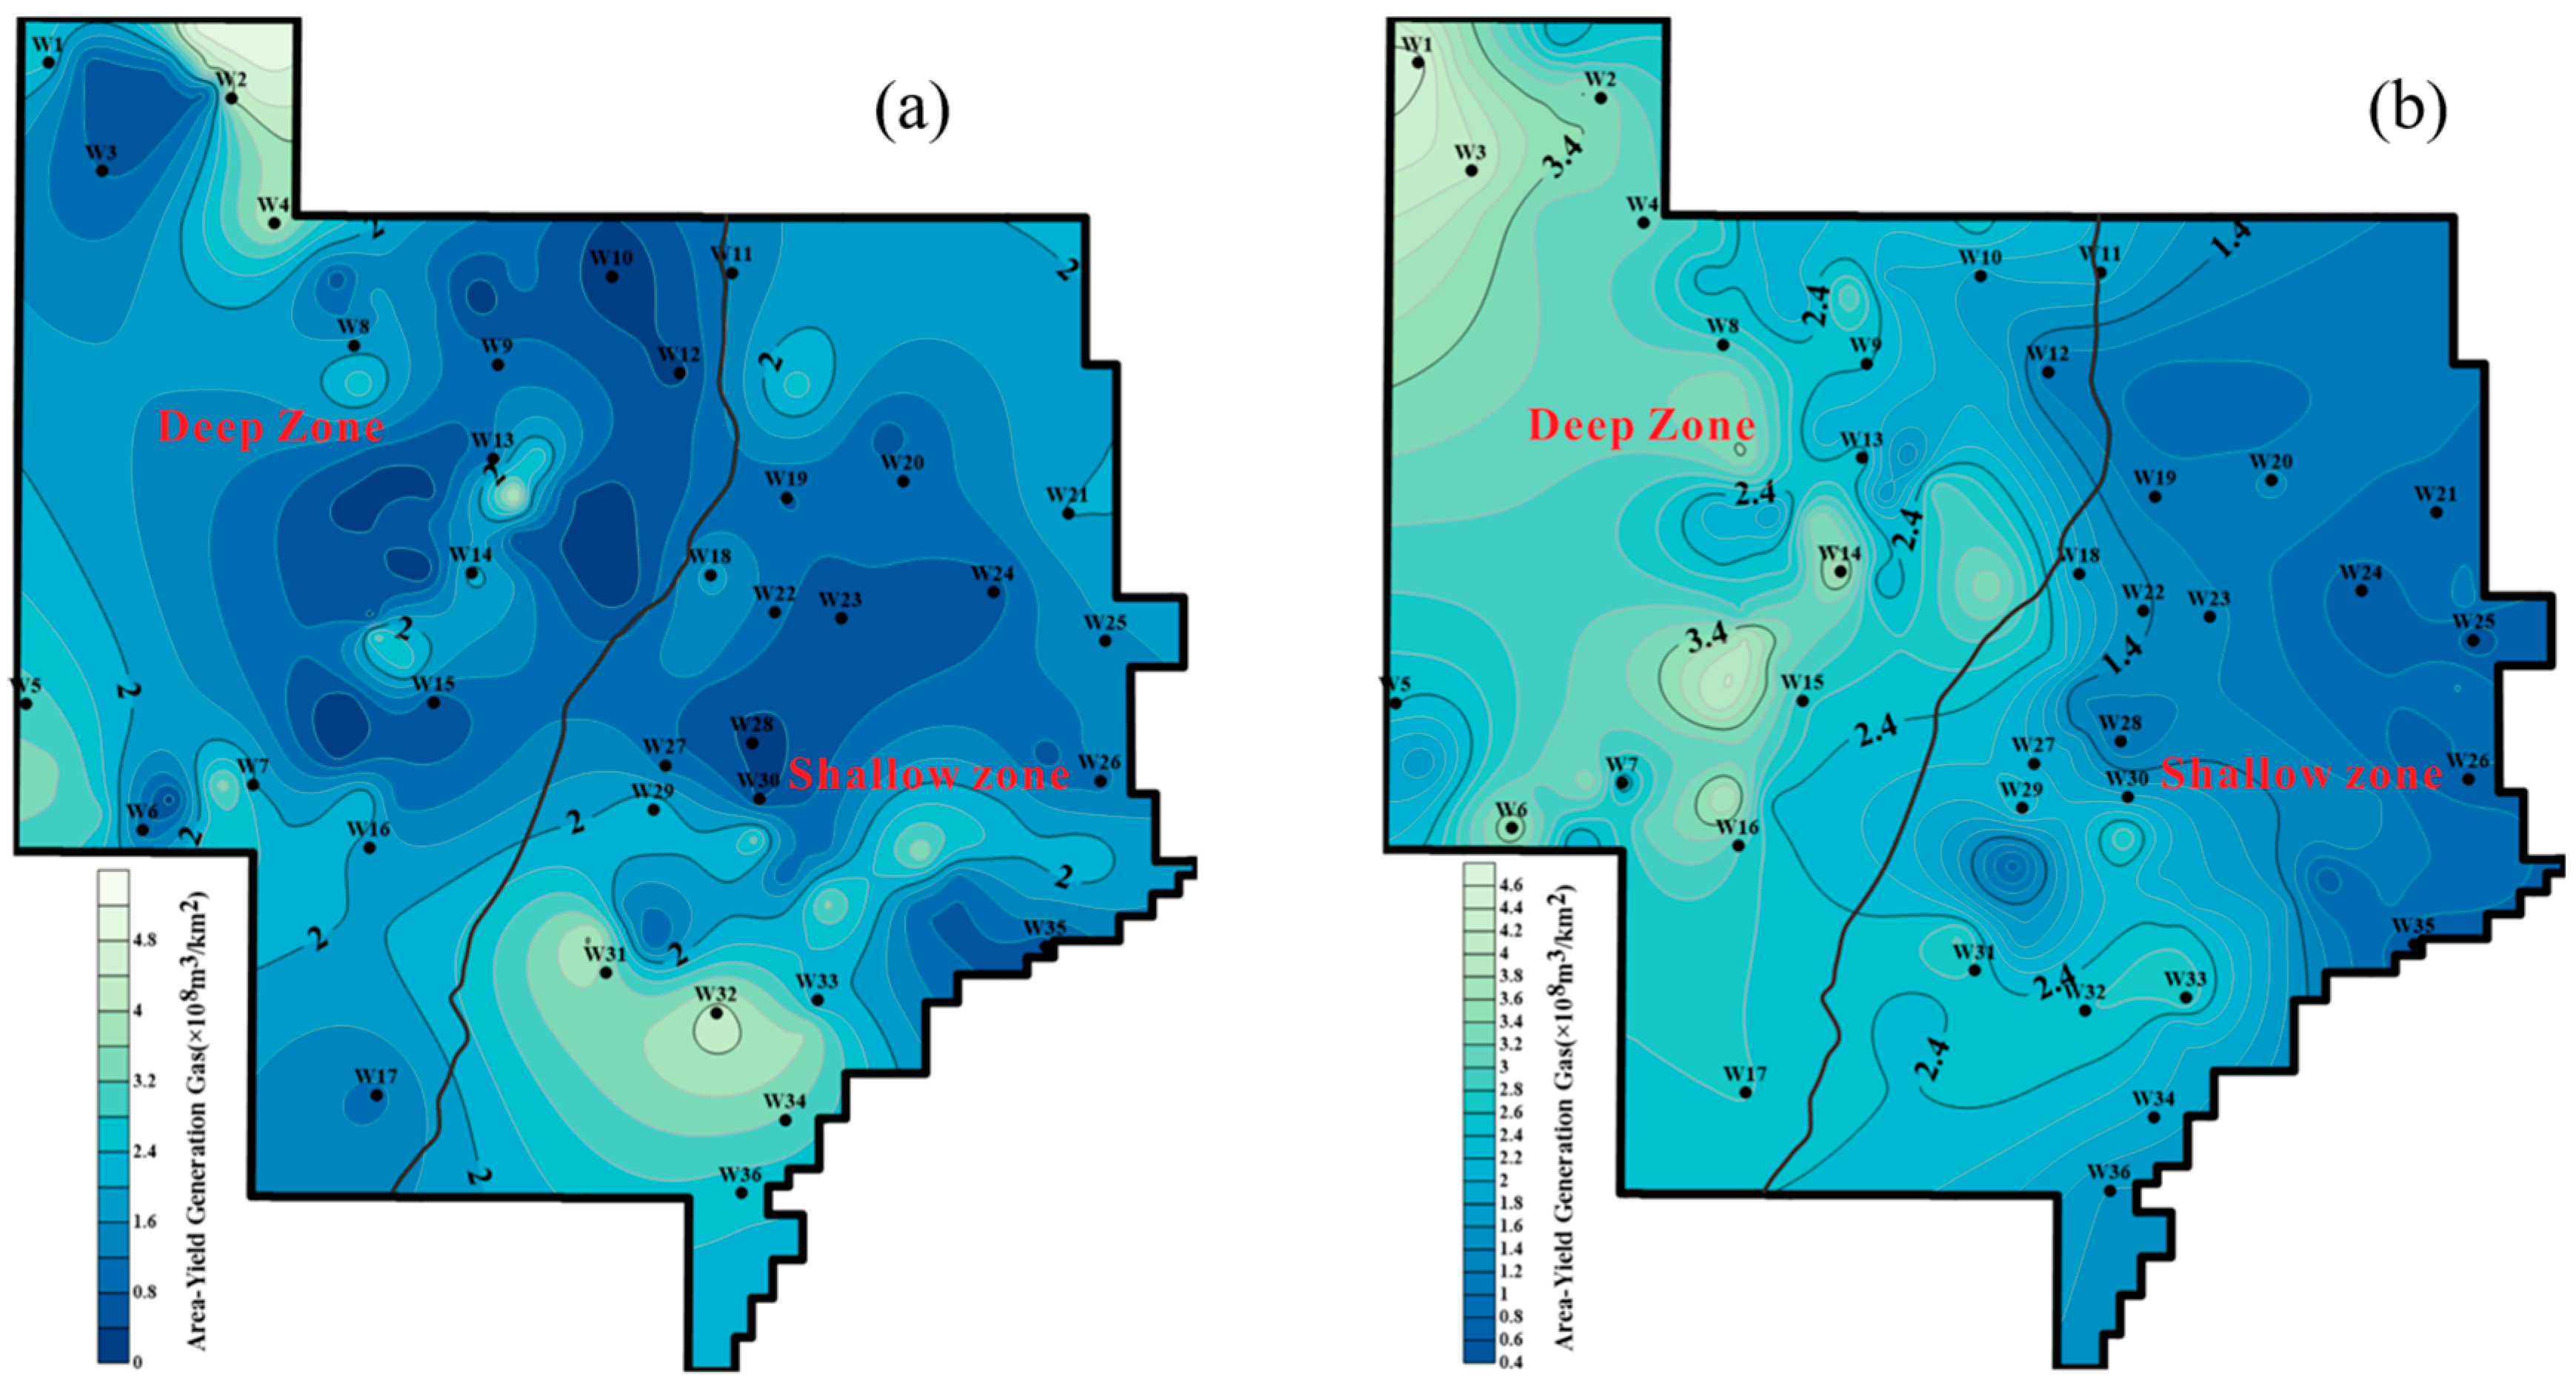
Spatial parameters were mapped using Surfer 10 software. Grid data were extracted and input into the formula to calculate HGI across the area. The carbonaceous mudstone exhibits HGI ranging from 0.07 to 5.16 × 10⁸ m3/km2, with an average of 1.64 × 10⁸ m3/km2, showing low values in the central part and higher values at the periphery (Figure 8a). Black mudstones have HGI ranging from 0.48 to 4.51 × 10⁸ m3/km2, with an average of 2.18 × 10⁸ m3/km2, higher in the west and lower in the east (Figure 8b). These patterns likely result from fault-induced burial depth differences of 500–700 m, which seem to have a limited effect on carbonaceous mudstone HGI.
A sensitivity analysis was conducted by varying TOC, Ro, and thickness by ±10%. Results indicate that thickness exerts the greatest control on HGI variability (~22%), followed by TOC (~12%) and Ro (~8%). This confirms that although input uncertainties exist, HGI estimations remain robust in identifying high-potential zones.

5.3. Differences in Hydrocarbon Generation and Controlling Factors

The study area, situated on the margin of the Ordos Basin, features a complex structural framework characterized by numerous faults and fractures. A north–south trending fault approximately divides the area into eastern and western subregions, with the eastern part being relatively shallow and the western part deeper, exhibiting a burial depth difference of 500–700 m.
To quantitatively compare the geochemical and kinetic properties of carbonaceous versus black mudstones, Table 2 summarizes key parameters, including TOC, maturity (Ro), thickness, gas yield, and HGI. These distinctions form the basis for evaluating differences in hydrocarbon-generation potential between the two lithofacies.
Black mudstones are significantly thicker (average 67.2 m) than carbonaceous mudstones (average 4.76 m), which is attributed to sustained sedimentation in semi-enclosed aquatic environments during the deposition of the Shanxi Formation. In contrast, carbonaceous mudstones formed in swamp or delta plain settings over short periods, resulting in poor lateral continuity.
Carbonaceous mudstones display markedly higher TOC contents (average 14.20%) compared to black mudstones (average 2.77%). This difference arises because carbonaceous mudstones have organic inputs derived primarily from plants, whereas black mudstones contain mixed terrestrial–marine organic matter with some algal components.
Despite the similarity in Ro values (1.97% vs. 1.83%), carbonaceous mudstones exhibit higher gas yields, with gold tube experiments showing a 37% higher methane production than black mudstones (155.84 vs. 98.18 mg/g TOC).
Given the minimal variation in true density (treated as a constant in calculations), further discussion of this parameter is omitted. Although carbonaceous mudstones outperform black mudstones in all parameters except thickness, the hydrocarbon-generation intensity (HGI) of black mudstones is still 24.77% higher, highlighting the dominant influence of thickness.
Due to the lack of in situ production data in the Daning–Jixian region and the limited number of pyrolysis-derived yield measurements, formal statistical significance testing (e.g., ANOVA or t-test) was not performed in this study. However, preliminary trends observed in laboratory gas yields still suggest lithological differences in hydrocarbon generative potential. Future work should incorporate industrial production data or conduct larger-scale pyrolysis experiments to enable robust statistical evaluation.
A comparison of spatial distribution trends indicates that the HGI of both mudstone types correlates most strongly with thickness. For black mudstones, despite minor variations in TOC content, the spatial trends of thickness, gas yield, and HGI are consistent, supporting thickness as the controlling factor. This relationship also holds for carbonaceous mudstones.
The spatial distribution of calculated HGI values shows a strong correlation with the pyrolysis profiles obtained from gold tube experiments. At the same level of Ro, samples with earlier transformation temperatures and higher gas yields exhibit higher HGI values, confirming that kinetic behavior observed at the sample scale can reliably reflect hydrocarbon-generation potential at a larger geological scale.
While thickness appears to be the primary factor influencing HGI, other geological variables—such as lateral facies changes, mineralogical composition, and permeability—could also influence hydrocarbon retention and expulsion efficiency. These factors warrant further investigation in future studies. Future work should integrate mineralogical proxies (e.g., quartz/clay ratio), normalized gas yield (e.g., gas/TOC ratio), and burial–thermal history reconstructions to further refine the model.
In conclusion, thickness is the primary factor responsible for the differences in HGI between the two mudstone types and represents the dominant control on their hydrocarbon-generation potential.

6. Conclusions

(1) In the Daning–Jixian area, the Shanxi Formation’s carbonaceous and black mudstones, respectively, show TOC contents within 12.78–18.42% and 1.91–3.00%. Ro values range from 1.37 to 2.47% for carbonaceous mudstones and 1.14 to 2.57% for black mudstones, indicating that both lithologies are in the overmature gas-generation stage. Geochemical analyses confirm that these mudstones are dominated by Type II2 and Type III kerogen, demonstrating strong gas-generation potential and thus qualifying as high-quality source rocks.
(2) Calculations of hydrocarbon-generation intensity (HGI) reveal that carbonaceous mudstones have HGI values ranging from 0.07 × 10⁸ to 5.16 × 10⁸ m3/km2, with an average of 1.64 × 10⁸ m3/km2, and minimal variation between shallow and deep zones. For black mudstones, HGI ranges from 0.48 × 10⁸ to 4.51 × 10⁸ m3/km2, with an average of 2.18 × 10⁸ m3/km2, and shows a distinct spatial variation—with notably higher values in the western deep zone compared to the eastern shallow zone.
These results collectively emphasize the pivotal influence of source rock thickness on hydrocarbon-generation potential in the study area, offering meaningful implications for assessing the petroleum systems of the Shanxi Formation in the Daning–Jixian area. Further studies focusing on the coupling relationship between thickness variations and tectonic evolution could enhance our understanding of hydrocarbon accumulation mechanisms in similar geological settings.

Author Contributions

Methodology, Y.D.; software, K.Z.; formal analysis, F.Q. and W.H.; investigation, S.G., C.X., M.W., and Y.Z.; writing—original draft preparation, J.S.; writing—review and editing, J.S. All authors have read and agreed to the published version of the manuscript.

Funding

This study was supported by the National Key Research and Development Program of China (Grant No. 2024YFC2909400); the National Natural Science Foundation of China (Grant Nos. 42372188, 42102224, and 41902168); and the Young Elite Scientists Sponsorship Program by the China Association for Science and Technology (CAST) (Grant No. 41902168). Additionally, it was funded by the Science and Technology Project of PetroChina Company Limited, titled “Research on Deep Coalbed Methane Accumulation Theory and Efficient Development Technology” (Grant No. 2023ZZ18YJ); and the Science and Technology Project of PetroChina Coalbed Methane Company Limited, titled “Basic Geological Research on Upper Paleozoic Coal Measures in the Eastern Margin of Ordos Basin” (Grant No. 2023-KJ-18).

Data Availability Statement

Data are contained within the article.

Acknowledgments

The authors would like to thank all team members for their valuable contributions to this research. Special thanks to Yi Du for providing methodological guidance and to Kuaile Zhang for software support. The authors also acknowledge Futao Qu for data analysis, and Sasa Guo, Chang Xu, Miao Wang, and Yijing Zhang for their efforts in sample investigation and field work.

Conflicts of Interest

Author Wei Hou was employed by the company Petrochina Coalbed Methane Company Limited. The remaining authors declare that the research was conducted in the absence of any commercial or financial relationships that could be construed as a potential conflict of interest. The Petrochina Coalbed Methane Company Limited and PetroChina Company Limited had no role in the design of the study; in the collection, analyses, or interpretation of data; in the writing of the manuscript, or in the decision to publish the results.

Abbreviations

The following abbreviations are used in this manuscript:
TOCTotal Organic Carbon
RoVitrinite Reflectance
HGIHydrocarbon-Generation Intensity
OMOrganic Matter
HIHydrogen Index
PIProduction Index
C1–C5Gaseous Hydrocarbons
S1Free Hydrocarbons
S2Potential Hydrocarbons
TmaxMaximum Pyrolysis Temperature
EasyRoEasy Vitrinite Reflectance

References

  1. Qiu, Z.; Song, D.; Zhang, L.; Zhang, Q.; Zhao, Q.; Wang, Y.; Liu, H.; Liu, D.; Li, S.; Li, X. The Geochemical and Pore Characteristics of a Typical Marine–Continental Transitional Gas Shale: A Case Study of the Permian Shanxi Formation on the Eastern Margin of the Ordos Basin. Energy Rep. 2021, 7, 3726–3736. [Google Scholar] [CrossRef]
  2. Li, Y.; Tang, S.; Zhang, S.; Xi, Z. In Situ Analysis of Methanogenic Pathways and Biogeochemical Features of CBM Co-Produced Water from the Shizhuangnan Block in the Southern Qinshui Basin, China. Energy Fuels 2020, 34, 5466–5475. [Google Scholar] [CrossRef]
  3. Wang, D.; Li, S.; Wang, R.; Li, B.; Pan, Z. Evaluating the Stability and Volumetric Flowback Rate of Proppant Packs in Hydraulic Fractures Using the Lattice Boltzmann-Discrete Element Coupling Method. J. Rock Mech. Geotech. Eng. 2024, 16, 2052–2063. [Google Scholar] [CrossRef]
  4. Dong, D.; Qiu, Z.; Zhang, L.; Li, S.; Zhang, Q.; Li, X.; Zhang, S.; Liu, H.; Wang, Y. Research Progress on the Shale Gas System of Marine-continental transitional Facies and New Discoveries. Acta Sedimentol. Sin. 2021, 39, 29–45. [Google Scholar] [CrossRef]
  5. Zhang, L.; Dong, D.; Qiu, Z.; Wu, C.; Zhang, Q.; Wang, Y.; Liu, D.; Deng, Z.; Zhou, S.; Pan, S. Sedimentology and Geochemistry of Carboniferous-Permian Marine-Continental Transitional Shales in the Eastern Ordos Basin, North China. Palaeogeogr. Palaeoclimatol. Palaeoecol. 2021, 571, 110389. [Google Scholar] [CrossRef]
  6. Kuang, L.; Dong, D.; He, W.; Wen, S.; Sun, S.; Li, S.; Qiu, Z.; Liao, X.; Li, Y.; Wu, J.; et al. Geological Characteristics and Development Potential of Transitional Shale Gas in the East Margin of the Ordos Basin, NW China. Pet. Explor. Dev. 2020, 47, 471–482. [Google Scholar] [CrossRef]
  7. Gu, Y.; Li, X.; Qi, L.; Li, S.; Jiang, Y.; Fu, Y.; Yang, X. Sedimentology and Geochemistry of the Lower Permian Shanxi Formation Shan 23 Submember Transitional Shale, Eastern Ordos Basin, North China. Front. Earth Sci. 2022, 10, 859845. [Google Scholar] [CrossRef]
  8. Zhang, Q.; Xiong, W.; Li, X.; Feng, C.; Qiu, Z.; Liu, W.; Li, X.; Xiao, Y.; Liu, D.; Yang, H. Discussion on Transitional Shale Gas Accumulation Conditions from the Perspective of Source-Reservoir-Caprock Controlling Hydrocarbon: Examples from Permian Shanxi Formation and Taiyuan Formation in the Eastern Margin of Ordos Basin, NW China. Energies 2023, 16, 3710. [Google Scholar] [CrossRef]
  9. National Energy Administration of China. Annual Report on Unconventional Gas; National Energy Administration of China: Beijing, China, 2024.
  10. Behar, F.; Vandenbroucke, M.; Tang, Y.; Marquis, F.; Espitalie, J. Thermal Cracking of Kerogen in Open and Closed Systems: Determination of Kinetic Parameters and Stoichiometric Coefficients for Oil and Gas Generation. Org. Geochem. 1997, 26, 321–339. [Google Scholar] [CrossRef]
  11. Kenneth, E.; Peters, A.K.B.; Walters, C.C. Petroleum Generation Kinetics: Single versus Multiple Heating-Ramp Open-System Pyrolysis. AAPG Bull. 2015, 99, 591–616. [Google Scholar] [CrossRef]
  12. Wang, Q.; Liu, W.; Meng, P.; Hu, J.; Wang, X.; Zhang, D.; Liu, J. Assessment the Gas Potential of Coal-Bearing Mudstones from Upper Paleozoic in Ordos Basin via Gold-Tube Pyrolysis. J. Nat. Gas Sci. Eng. 2021, 90, 103895. [Google Scholar] [CrossRef]
  13. Huang, W.; Zeng, L.; Pan, C.; Xiao, Z.; Zhang, H.; Huang, Z.; Zhao, Q.; Yu, S.; Xu, H.; Chen, C.; et al. Petroleum Generation Potentials and Kinetics of Coaly Source Rocks in the Kuqa Depression of Tarim Basin, Northwest China. Org. Geochem. 2019, 133, 32–52. [Google Scholar] [CrossRef]
  14. Liang, H.; Xu, G.; Xu, F.; Fu, D.; Liang, J.; Yu, Q.; Wang, D. Oil Generation of Lacustrine Type II Shale: A Case Study of the Shahejie Formation, Laizhou Bay Sag, Bohai Bay Basin (China). J. Pet. Sci. Eng. 2020, 195, 107839. [Google Scholar] [CrossRef]
  15. Xu, H.; Ding, X.; Luo, Z.; Liu, C.; Li, E.; Huang, P.; Yu, S.; Liu, J.; Zou, Y.; Pan, C. Confined Pyrolysis for Simulating Hydrocarbon Generation from Jurassic Coaly Source Rocks in the Junggar Basin, Northwest China. Energy Fuels 2017, 31, 73–94. [Google Scholar] [CrossRef]
  16. He, Q.; Chen, S.; Li, S.; Guo, B.; Lu, J.; Li, Y.; Li, X.; Zhao, L.; Ma, Z. Organic Geochemical Characteristics and Hydrocarbon Generation Mechanism of Marine-Continental Transitional Organic-Rich Shale: A Case Study from the Shanxi Formation in the Eastern Margin of the Ordos Basin. J. Pet. Sci. Eng. 2022, 219, 111116. [Google Scholar] [CrossRef]
  17. Wang, Z.; Zhou, N.; Lu, S.; Liu, Y.; Lin, L.; Liu, Y.; Song, B. Generation, Accumulation, and Distribution of Upper Paleozoic Tight Sandstone Gas in the Northeastern Margin of the Ordos Basin. Mar. Pet. Geol. 2023, 156, 106463. [Google Scholar] [CrossRef]
  18. Anees, A.; Zhang, H.; Ashraf, U.; Wang, R.; Liu, K.; Abbas, A.; Ullah, Z.; Zhang, X.; Duan, L.; Liu, F.; et al. Sedimentary Facies Controls for Reservoir Quality Prediction of Lower Shihezi Member-1 of the Hangjinqi Area, Ordos Basin. Minerals 2022, 12, 126. [Google Scholar] [CrossRef]
  19. Tang, X.; Zhang, J.; Ding, W.; Yu, B.; Wang, L.; Ma, Y.; Yang, Y.; Chen, H.; Huang, H.; Zhao, P. Reservoir and Gas-Bearing Properties of Upper Paleozoic Marine-continental transitional Shale in the Southeastern Ordos Basin. Earth Sci. Front. 2016, 23, 147–157. [Google Scholar] [CrossRef]
  20. Huang, L.; Liu, C.; Liu, Y.; Zhou, Y.; He, F.; Wang, Z.; Zhang, Y.; Guo, B.; Liang, C. Development model of vertical stratification for the strike-slip fault in the Ordos Basin and its significance. Sci. China Earth Sci. 2025, 68, 1497–1510. [Google Scholar] [CrossRef]
  21. Zheng, D.; Pang, X.; Jiang, F.; Liu, T.; Shao, X.; Li, L.; Huyan, Y.; Guo, F. Reservoir-Forming Characteristics and Physical Simulation of Tight Gas in the Linxing Area, Ordos Basin. Oil Gas Geol. 2020, 41, 744–754. [Google Scholar]
  22. Huang, L.; Liu, C.; Wang, Z.; Zhou, Y.; He, F.; Liu, Y.; Huang, Y. An alternative formation mechanism for strike-slip fault in stable intracratonic basin. J. Struct. Geol. 2025, 191, 105292. [Google Scholar] [CrossRef]
  23. Anees, A.; Zhang, H.; Ashraf, U.; Wang, R.; Liu, K.; Mangi, H.N.; Jiang, R.; Zhang, X.; Liu, Q.; Tan, S.; et al. Identification of Favorable Zones of Gas Accumulation via Fault Distribution and Sedimentary Facies: Insights from Hangjinqi Area, Northern Ordos Basin. Front. Earth Sci. 2022, 9, 822670. [Google Scholar] [CrossRef]
  24. Bai, J.; Zhao, J.; Ren, Z.; Li, W.; Wang, K.; Li, X. Paleogeographic and Sedimentary Evolution of Meso–Neoproterozoic Strata in the Ordos Basin, Western North China Craton. J. Pet. Sci. Eng. 2022, 215, 110600. [Google Scholar] [CrossRef]
  25. Geng, J.-Z.; Qiu, K.-F.; Gou, Z.-Y.; Yu, H.-C. Tectonic Regime Switchover of Triassic Western Qinling Orogen: Constraints from LA-ICP-MS Zircon U–Pb Geochronology and Lu–Hf Isotope of Dangchuan Intrusive Complex in Gansu, China. Geochemistry 2017, 77, 637–651. [Google Scholar] [CrossRef]
  26. Wang, J.; Li, X.; Liu, H.; Deng, X.; Wanyan, R. Depocenter Migration of the Ordos Basin in the Late Triassic and Its Controls on Shale Distribution. Interpretation 2017, 5, SF81–SF98. [Google Scholar] [CrossRef]
  27. Wei, Z.; Wang, Y.; Wang, G.; Zhang, T.; He, W.; Ma, X.; Yu, X. Enrichment Mechanism of the Upper Carboniferous-Lower Permian Transitional Shale in the East Margin of the Ordos Basin, China: Evidence from Geochemical Proxies. Geofluids 2020, 2020, 8867140. [Google Scholar] [CrossRef]
  28. Zhang, L.; Zhao, Q.; Peng, S.; Qiu, Z.; Feng, C.; Zhang, Q.; Wang, Y.; Dong, D.; Zhou, S. Paleoenvironment and Organic Matter Accumulation Mechanism of Marine-continental transitional Shales: Outcrop Characterizations of the Carboniferous–Permian Strata, Ordos Basin, North China. Energies 2021, 14, 7445. [Google Scholar] [CrossRef]
  29. Wei, Z.; Wang, G.; Wang, Y.; Ma, X.; Zhang, T.; He, W.; Yu, X. Geochemical and Geological Characterization of Marine-continental Transitional Shale: A Case Study in the Ordos Basin, NW China. Acta Geol. Sin. Engl. Ed. 2020, 94, 809–821. [Google Scholar] [CrossRef]
  30. Fu, C.; Du, Y.; Song, W.; Sang, S.; Pan, Z.; Wang, N. Application of automated mineralogy in petroleum geology and development and CO2 sequestration: A review. Mar. Pet. Geol. 2023, 151, 106206. [Google Scholar] [CrossRef]
  31. Fu, C.; Kou, X.; Du, Y.; Jiang, L.; Sang, S.; Pan, Z. Experimental Study of Supercritical CO2-H2O-Coal Interactions and the Effect on Coal Spontaneous Imbibition Characteristics. Fuel 2025, 383, 133888. [Google Scholar] [CrossRef]
  32. Liang, H.; Xu, F.; Grice, K.; Xu, G.; Holman, A.; Hopper, P.; Fu, D.; Yu, Q.; Liang, J.; Wang, D. Kinetics of Oil Generation from Brackish-Lacustrine Source Rocks in the Southern Bohai Sea, East China. Org. Geochem. 2020, 139, 103945. [Google Scholar] [CrossRef]
  33. Handhal, A.M.; Al-Abadi, A.M.; Chafeet, H.E.; Ismail, M.J. Prediction of Total Organic Carbon at Rumaila Oil Field, Southern Iraq Using Conventional Well Logs and Machine Learning Algorithms. Mar. Pet. Geol. 2020, 116, 104347. [Google Scholar] [CrossRef]
  34. Li, E.; Ma, W.; Li, J.; Ma, X.; Pan, C.; Zeng, L.; Wang, M. Thermal Simulation Study of Coal-Derived Hydrocarbon Generation from the Jurassic in the Southern Junggar Basin. Geoscience 2022, 36, 1313–1323. [Google Scholar] [CrossRef]
  35. Yao, P.; Zhang, J.; Lv, D.; Vandeginste, V.; Chang, X.; Zhang, X.; Wang, D.; Han, S.; Liu, Y. Effect of water occurrence in coal reservoirs on the production capacity of coalbed methane by using NMR simulation technology and production capacity simulation. Geoenergy Sci. Eng. 2024, 243, 213353. [Google Scholar] [CrossRef]
  36. Fu, C.; Xu, X.; Du, Y.; Kou, X. Experimental Study on the Influence of Pore Structure on Spontaneous Imbibition in Marine Black Shale. Capillarity 2024, 10, 57–72. [Google Scholar] [CrossRef]
  37. Xing, H.; Du, Y.; Fu, C.; Pan, Z.; Wang, Z.; Ma, J.; Gao, W.; Ma, L. Effects of ScCO2-H2O on the Macromolecular Structure and Adsorption Characteristics of Low-Rank Coal in the Ordos Basin. Fuel 2026, 405, 136410. [Google Scholar] [CrossRef]
  38. Wang, L.; Du, Y.; Wu, G.; Fu, X.; Xu, C.; Pan, Z. Application of Nuclear Magnetic Resonance Technology in Reservoir Characterization and CO2 Enhanced Recovery for Shale Oil: A Review. Mar. Pet. Geol. 2025, 177, 107353. [Google Scholar] [CrossRef]
  39. Lv, C.; Du, Y.; Fu, C.; Pan, Z.; Wang, Z.; Ma, J.; Gao, Y. Investigating the Mechanistic Effects of Supercritical CO2 on Tight Sandstone Mechanical Properties under Varying Water Compositions. Phys. Fluids 2025, 37, 043101. [Google Scholar] [CrossRef]
  40. Shao, X.-H.; Pang, X.-Q.; Li, M.-W.; Li, Z.-M.; Zhao, Y. Hydrocarbon Generation from Lacustrine Shales with Retained Oil during Thermal Maturation. Pet. Sci. 2020, 17, 1478–1490. [Google Scholar] [CrossRef]
  41. Wang, Q.; Zou, H.; Hao, F.; Zhu, Y.; Zhou, X.; Wang, Y.; Tian, J.; Liu, J. Modeling Hydrocarbon Generation from the Paleogene Source Rocks in Liaodong Bay, Bohai Sea: A Study on Gas Potential of Oil-Prone Source Rocks. Org. Geochem. 2014, 76, 204–219. [Google Scholar] [CrossRef]
  42. Tian, H.; Xiao, X.; Wilkins, R.W.T.; Tang, Y. An Experimental Comparison of Gas Generation from Three Oil Fractions: Implications for the Chemical and Stable Carbon Isotopic Signatures of Oil Cracking Gas. Org. Geochem. 2012, 46, 96–112. [Google Scholar] [CrossRef]
  43. Zhang, J.; Li, Y.; Liu, J.; Yan, X.; Li, L.; Shen, W. Modeling Hydrocarbon Generation of Deeply Buried Type III Kerogen: A Study on Gas and Oil Potential of Lishui Sag, East China Sea Shelf Basin. Front. Earth Sci. 2021, 8, 609834. [Google Scholar] [CrossRef]
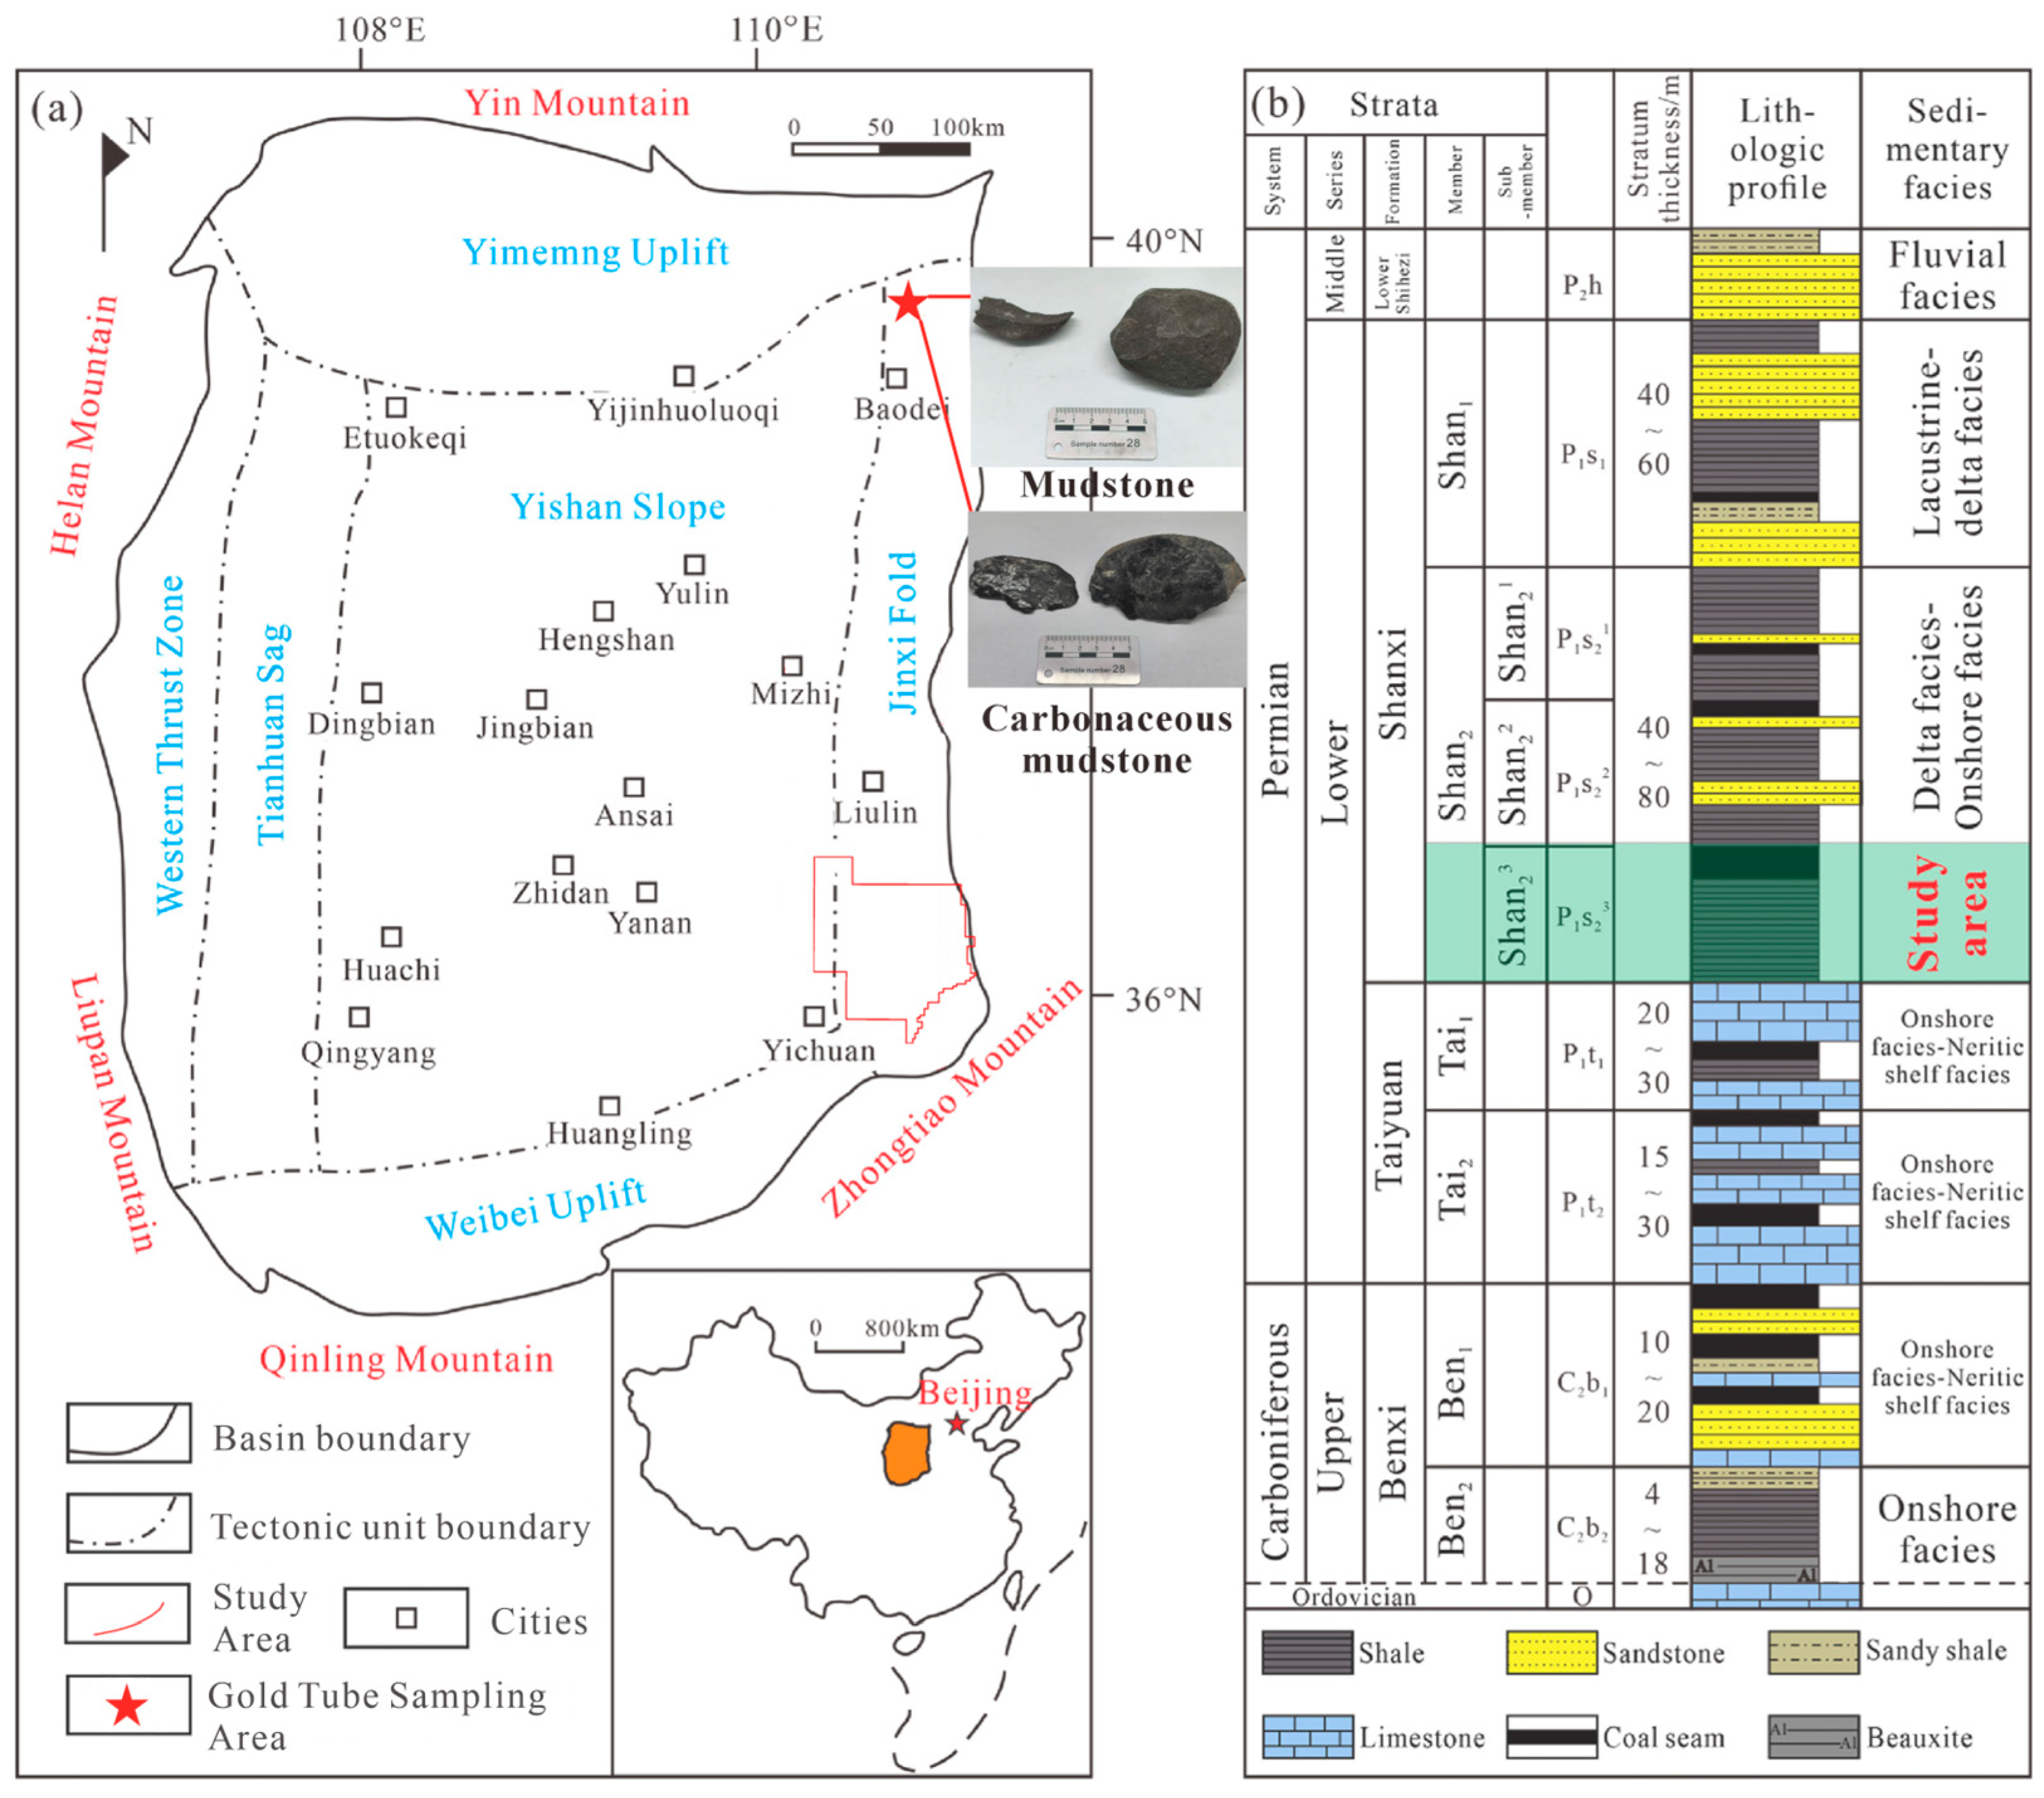
Figure 1. Location map of the study area (a) and stratigraphic column (b).
Processes 13 02786 g001
Figure 2. Cross-plots of geochemical parameters for mudstones in the Shanxi Formation. (a) TOC vs. S1 + S2, (b) TI vs. δ13C, (c) TOC vs. HI, (d) Tmax vs. Ro.
Processes 13 02786 g002
Figure 3. Variations in gaseous hydrocarbon yields of Shanxi Formation mudstones with pyrolysis temperature. (a) Methane (C1); (b) ethane (C2); (c) propane (C3); (d) butane-pentane (C4–5); (e) methane-pentane (C1–5); (f) ethane-pentane (C2–5).
Processes 13 02786 g003
Figure 4. (a) Methane yield from kerogen at each temperature step for mudstone samples from the Daning–Jixian area under heating rates of 2 °C/h and 20 °C/h; (b) optimal fitting curve for methane generation from kerogen degradation; (c) kinetic parameters of carbonaceous mudstone; (d) kinetic parameters of mudstone. A = frequency factor.
Processes 13 02786 g004
Figure 5. Ro–gas yield conversion diagrams for mudstones. (a) Methane yield of black mudstones from gold tube pyrolysis; (b) gas yield–Ro fitting diagram for black mudstones; (c) methane yield of carbonaceous mudstones from gold tube pyrolysis; (d) gas yield–Ro fitting diagram for carbonaceous mudstones.
Processes 13 02786 g005
Figure 6. Planar distribution of hydrocarbon-generation parameters for Shanxi Formation mudstones in the study area. (a) Thickness contour map of carbonaceous mudstones; (b) thickness contour map of black mudstones; (c) TOC contour map of carbonaceous mudstones; (d) TOC contour map of black mudstones; (e) Ro contour map of carbonaceous mudstones; (f) Ro contour map of black mudstones; (g) gas yield contour map of carbonaceous mudstones; (h) gas yield contour map of black mudstones.
Processes 13 02786 g006aProcesses 13 02786 g006b
Figure 7. Hydrocarbon yield–temperature relationship from gold tube pyrolysis. (a) Variations in C1–5, C2–5 yields and calculated oil-cracked gas yields of carbonaceous mudstones with increasing temperature (2 °C/h); (b) net changes in C1 and C2–5 yields of carbonaceous mudstones within temperature intervals (2 °C/h); (c) variations in C1–5, C2–5 yields and calculated oil-cracked gas yields of black mudstones with increasing temperature (2 °C/h); (d) net changes in C1 and C2–5 yields of black mudstones within temperature intervals (2 °C/h).
Processes 13 02786 g007
Figure 8. (a) Gas-generation intensity of carbonaceous mudstones; (b) gas-generation intensity of black mudstones.
Processes 13 02786 g008
Table 1. Parameters of samples for gold tube pyrolysis simulation.
LithologyMass (mg)S1 (mg/g)S2 (mg/g)S1 + S2 (mg/g)Tmax (°C)TOC (%)Ro (%)
Carbonaceous mudstone12.80.084.845.044266.50.60
Mudstone10.770.033.073.134312.30.61
Table 2. Key parameter differences between carbonaceous and black mudstones.
ParameterCarbonaceous MudstoneBlack Mudstone
TOC (%)14.20 ± 1.252.77 ± 0.35
Ro (%)1.97 ± 0.311.83 ± 0.38
Thickness (m)4.76 ± 2.1567.20 ± 10.42
Gas Yield (mg/g TOC)155.8498.18
HGI (108 m3/km2)1.642.18
Disclaimer/Publisher’s Note: The statements, opinions and data contained in all publications are solely those of the individual author(s) and contributor(s) and not of MDPI and/or the editor(s). MDPI and/or the editor(s) disclaim responsibility for any injury to people or property resulting from any ideas, methods, instructions or products referred to in the content.