1. Introduction
Corticosteroids are essential stress hormones, either produced endogenously or administered as pharmaceuticals or veterinary agents. They are typically classified as glucocorticoids or mineralocorticoids and are widely used to treat various medical conditions, primarily as anti-inflammatory agents [
1,
2,
3]. Dexamethasone (DXM), a synthetic glucocorticoid, structurally similar to the endogenous hormone cortisol, exhibits enhanced anti-inflammatory potency, approximately 25 times greater, due to key structural modifications, including a fluorine atom at position C9, unsaturation between C1 and C2 forming a cross-conjugated dienone system, and a methyl group at C16 (
Figure 1) [
4,
5,
6,
7].
DXM has been frequently detected in surface water, with reported concentrations up to 8.78 ng/L. In drinking water, maximum concentrations of 0.37 ng/L and 2.11 ng/L have been observed. Arvaniti et al. [
2] reported that DXM concentrations can reach as high as 1050.90 ng/L in wastewater, 2.11 ng/L in river water, and 8.78 ng/L in tap water. Although these concentrations are generally low (in the μg/L to ng/L range), the presence of DXM in aquatic environments is a growing concern due to its potential chronic toxicity. Even at trace levels, glucocorticoids such as DXM can disrupt aquatic ecosystem, affecting the reproduction, growth, and development of fish and other organisms [
8].
Advanced oxidation processes (AOPs) have emerged as effective technologies for degrading different pollutants. These processes generate highly reactive oxidizing species, primarily hydroxyl radicals (
•OH), which possess a high oxidation potential (2.8 V) and can non-selectively oxidize a wide range of organic contaminants [
9,
10]. Various AOPs have been successfully applied for the degradation of DXM, electro-peroxone coupled with ultrasonic irradiation (78.7% TOC and 94.4% COD removal) [
4], ozonation (95%) [
8], sonochemical oxidation [
7], thermally activated persulfate at pH 7 (100%) [
2], and pulsed corona discharge with the addition of peroxydisulfate, peroxymonosulfate, and hydrogen peroxide [
3] Other effective treatments include UV/persulphate (100%) [
11], anodic oxidation [
12], UV/S
2O
82−/Al
2O
3 (94%) [
13], and direct photolysis (100%) [
14].
Photocatalysis involves the use of semiconductor catalysts such as TiO
2 and ZnO, which, under ultraviolet (UV) irradiation, absorb photons and promote the excitation of electrons from the valence band (VB) to the conduction band (CB). This excitation generates photo-induced electrons (e
−) in the CB and holes (h
+) in the VB, which subsequently participate in redox reactions that lead to the formation of reactive radicals, as shown in Equations (1)–(4). This process is initiated when the energy of the incident photon is equal to or greater than the bandgap energy of the semiconductor material [
15]. The efficiency of the photocatalytic process is influenced by several operational parameters, including the type of radiation, catalyst and pollutant concentrations, water matrix composition, temperature, dissolved oxygen concentration, and pH [
16].
TiO
2 is a widely used photocatalyst due to its non-toxicity, stability, and high activity, but its wide bandgap (~3.2 eV) restricts absorption to the UV region and promotes e
−/h
+ recombination. Modification strategies such as transition metal doping introduce impurity levels that reduce the bandgap, extend visible-light absorption, and suppress charge recombination [
17,
18]. Traditionally, photocatalysts are used in suspension, which can complicate recovery and reuse. To address this, semiconductor materials can be immobilized onto solid supports such as glass beads, pebbles, sand, activated carbon, natural pumice, ceramics, and zeolites [
19]. Among them, zeolites are especially attractive owing to their high surface area, adsorption capacity, and ability to reduce e
−/h
+ recombination, which enhances photocatalytic efficiency [
19,
20,
21].
As previously reported, the goal of this research lies in the synthesis of a modified TiO2-Zn(II)-clinoptilolite catalyst via the electrodeposition method and its application in HSP. The catalyst electrosynthesis consisted of using Zn anode/cathode, with an effective surface area of 17 cm2, at 0.5 A, 2 h, 200 g of zeolite clinoptilolite (ZC), 1 L of distilled water, 2 g of NaCl as support electrolyte, pH 7.1 and at room temperature. In total, 2.2 mg Zn/g TiO2-Zn(II)-ZC was obtained; this modification reduces the TiO2 bandgap and enhances the generation of e−/h+ pairs through solar photoactivation. The photocatalyst system employed a channel parabolic concentrator (CPC) reactor, enabling efficient utilization of solar energy. The heterogeneous photocatalytic degradation of DXM was investigated: the operational parameters were the initial concentration of DXM in aqueous solution, hydraulic retention time (HRT), and ratio catalyst mass/solution volume (M/V). The main response variables were DXM concentration and chemical oxygen demand (COD). Additionally, the treatment system was evaluated using real wastewater from the chocolate industry. The main contribution of this work is the electrosynthesis of the catalyst. Electrodeposition is an in situ dissolution method that can be carried out at room temperature, natural pH, and in the absence of intermediate phases that impurify the products, obtaining small crystals with a large surface area. Another advantage is the direct and uniform deposition of metal of high purity. The sol-gel, the co-precipitation, and the solid-phase reaction methods are among the primary techniques used for synthesizing Zn-doped TiO2, enhancing photocatalytic activity, particularly in the visible light region. In general terms, these methods present specific operating conditions; for example, the use of precursors, high temperatures (300–1000 °C), acid pH, complexity in reagent handling, and longer synthesis times.
2. Materials and Methods
2.1. Methods
A commercial injectable solution of dexamethasone phosphate (Metax® SON’S Laboratory, Atlixcayotl, Puebla, Mexico, 8 mg/2 mL) was used to prepare a standard solution at a concentration of 160 mg/L. The solution was analyzed using a UV–Vis spectrophotometer (Cary Varian 1E, Cary, NC, USA), software WinLab over a wavelength range of 200–800 nm to determine the maximum absorbance (λmax), which was observed at 243 nm. Calibration standards were prepared at concentrations of 4, 8, 12, 16, and 20 mg/L.
Samples of DXM solution and chocolate industry wastewater samples (DXM-WW) were characterized for various physicochemical parameters. COD was measured using the Hach method 8000 (range: 3–150 mg/L COD), and total organic carbon (TOC) was determined using the Hach Method 10173 (range: 20–150 mg/L C). Total phosphorus was analyzed using LCK348 (range: 0.5–5 mg/L P-PO43−), and phosphate using the Hach method for the 1.5–15 mg/L PO43− range. Nitrate and nitrite concentrations were determined using Hach methods 8039 (0.1–30 mg/L NO3−-N) and 8507 (0.002–1.000 mg/L NO2-N), respectively. IR spectra were obtained using a Shimadzu Affinity-15 FTIR spectrometer 8 (Shimadzu Europe Duisburg, Duisburg, Germany) equipped with an ATR compartment for functional group identification, Software: Lab Solution IR.
High-performance liquid chromatography (HPLC) analysis was performed using an Agilent Technologies, (Santa Clara, CA, USA), 1260 Infinity LC system with a diode array detector (DAD). Chromatographic separation was achieved on a Zorbax SB C18 analytical column (5 μm, 150 mm × 4.6 mm) using an isocratic mobile phase of HPLC-grade water and acetonitrile at a flow rate of 1 mL/min. The column temperature was maintained at 30 °C, and DXM was detected at 275 nm.
2.2. Calibration Curve and Electrochemically Modification
Commercial zeolite clinoptilolite (ZC) was washed and dried at room temperature. Grains with sizes ranging from 0.5 to 2.5 cm were selected for catalyst preparation. The electrosynthesis of the catalyst was performed in a 2 L electrochemical batch cell. The cell contained 60 g of TiO2 powder (Avantor Performance Materials) consisting of a mixed phase of anatase and rutile, 200 g of ZC, 1 L of distilled water, and 2 g of NaCl (Avantor Performance Materials) as supporting electrolyte. A monopolar electrochemical configuration was employed, using an array of Zn-Zn anode/cathode electrodes, each measuring 3.4 cm3, with an effective surface area of 17 cm2. The process was conducted at room temperature (pH 7.1) by applying a current of 0.5 A for 2 h. After synthesis, the material was thermally treated at 550 °C for 20 min using a Thermolyne Thermo Scientific—F6010 muflle furnace (Thermo Scientific, Waltham, MA, USA). The resulting catalyst was designated as TiO2-Zn(II)-ZC.
Characterizations of both ZC and TiO
2-Zn(II)-ZC were performed by X-ray diffraction (XRD) using a Siemens D5000 diffractometer (Siemens, Munich, Germany) equipped with a copper-anode X-ray tube. Infrared (IR) spectroscopy and scanning electron microscopy (SEM) coupled with energy-dispersive X-ray spectroscopy (EDS) were carried out using a JEOL JSM-6610LV instrument (Oxford Instruments, Oxford, UK). The point of zero charge (P
zc) was determined according to the method reported by Castañeda-Juarez et al. [
22]. The Zn content deposited on TiO
2-Zn(II)-ZC was determined by atomic absorption (AA) following acid digestion with a 2:1 mixture of HNO
3 and HCl using a CEM microwave digestion system (CEM Corporation, Matthews, NC, USA).
2.3. Heterogeneous Solar Photocatalysis Process (HSP)
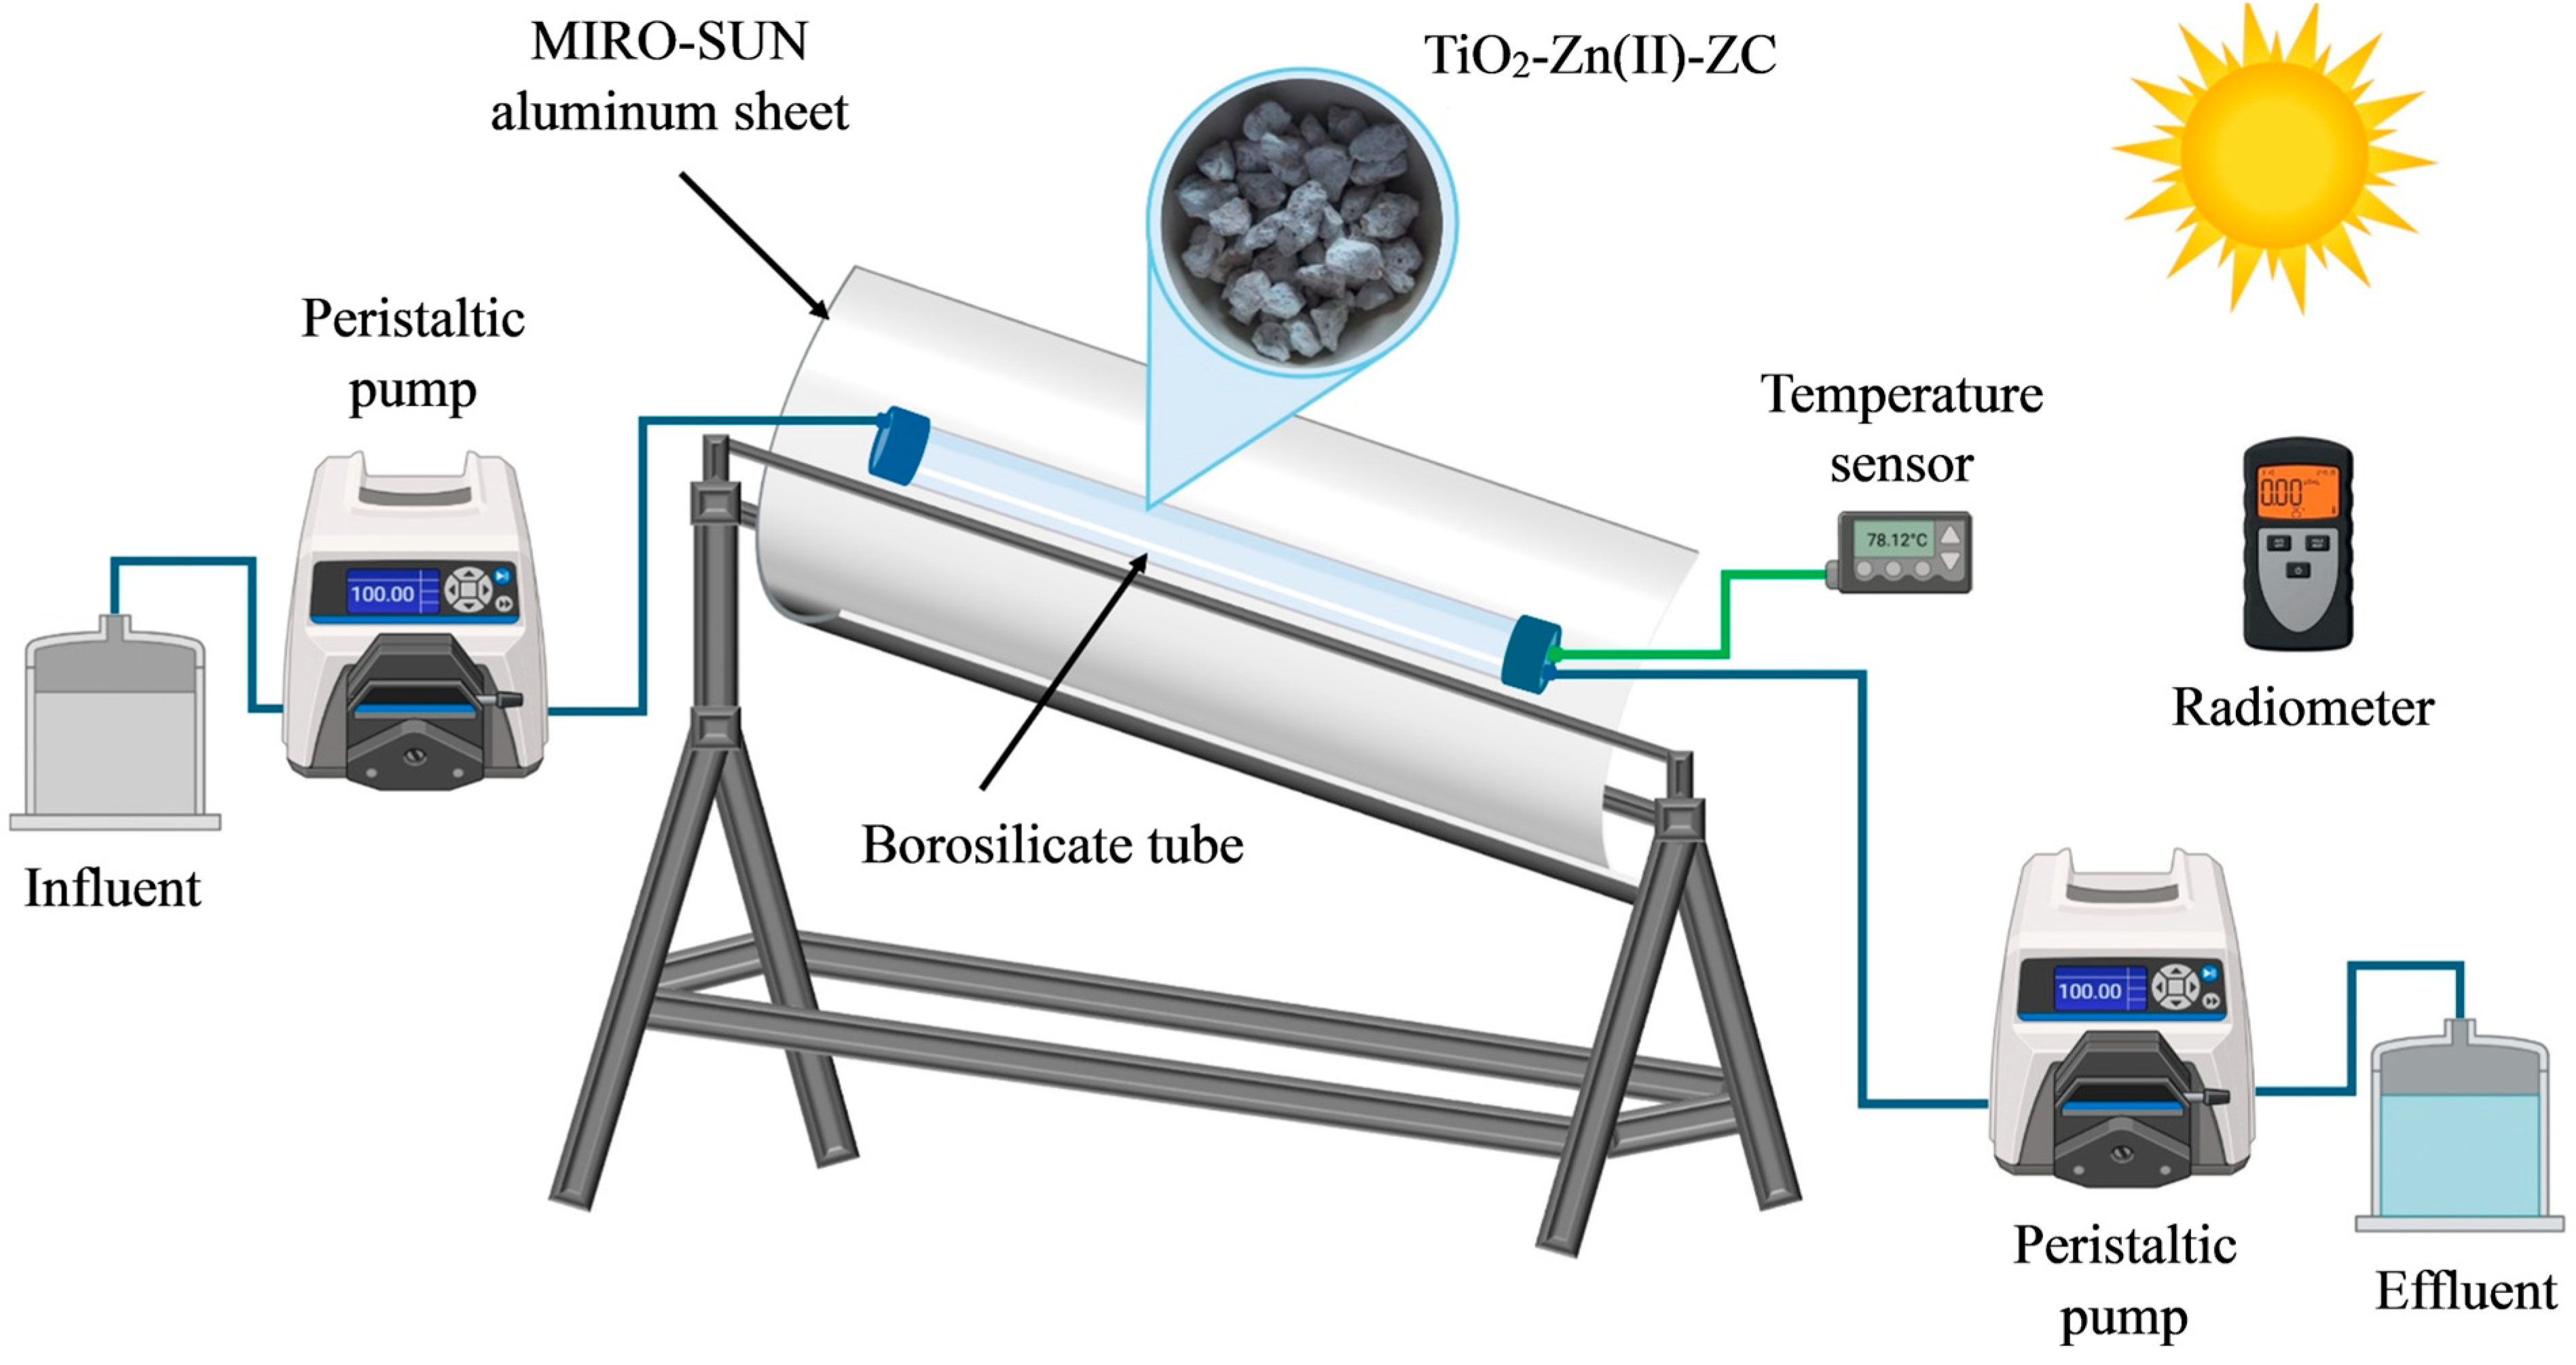
The TiO
2-Zn(II)-ZC catalyst was packed in a borosilicate glass tube with 88% light transmittance and installed within a channel parabolic collector (CPC) reactor. The CPC was constructed using Alanod Miro-Sun
® aluminum sheets (Ennepetal, Germany) shaped into a 60° parabolic profile, as shown in
Figure 2. Photocatalytic trials were conducted between 11:30 a.m. and 2:30 p.m. to maximize solar irradiance. UV-A radiation was continuously monitored using a PMA2100 UV radiometer (Solar Light Company, Glenside, PA, USA). The sensor featured a spectral response range from 320 to 400 nm and a resolution of 0.001 mW/cm
2 to 200 mW/cm
2.
The accumulated energy (QUV) by the CPC was estimated using Equation (5):
where
n is the accumulated energy per unit volume (kJ/L), Δt
n is the time (s), A
CS is the area of solar radiation capture (m
2),
VER is the volume (L), and
is the incident solar irradiation (W/m
2) [
23].
2.3.1. Experimental Design
Response surface methodology, using a Box–Behnken design was employed to optimize the photocatalytic process, with statistical analysis performed using Statgraphics Centurion 19 software. Three independent variables were investigated at three levels each (
Table 1): initial DXM concentration (5, 10, and 15 mg/L), hydraulic retention time (HRT: 30, 45, and 60 min), and catalyst M/V ratio of 0.5, 1.0, and 1.5 mg/L. The experimental matrix comprised 15 runs, including five degrees of freedom for error estimation (
Table S1, Supplementary Materials). The response variables evaluated were DXM concentration, determined by UV–Vis spectrophotometry, and COD.
To evaluate the contribution of individual components to the photocatalytic system, three control experiments were conducted: (a) Photolysis: a DXM solution (12.5 mg/L) was exposed to solar radiation for 60 min without the catalyst; (b) DXM at 12.5 mg/L, catalyst mass/solution volume (1.0 mg/L) in absence of UV light; and (c) Photocatalysis under artificial UV light: a DXM solution (12.5 mg/L) was treated with the catalyst (1.0 mg/L) under UV radiation provided by a GS-T5.003 lamp (5 W, λ = 380–400 nm, irradiance: 16 W/m2).
2.3.2. Removal of DXM from Chocolate Industry Wastewater
A treated sample of chocolate industry wastewater was spiked with DXM at a concentration of 12.5 mg/L to evaluate the performance of the HSP process under real matrix conditions (the effluent was selected because of its high content of BOD, COD, and solids) to evaluate the interaction and behavior of DXM in the presence of organic matter. The sample was characterized according to the parameters described in
Section 2.1. Photocatalytic treatment was subsequently carried out using the optimized operating conditions previously determined through response surface methodology with Statgraphics Centurion 19 software.
2.3.3. Kinetic Reaction
Kinetic experiments were performed under the optimal conditions for DXM degradation, as determined by the Box–Behnken design. Aliquots were collected at 5-minute intervals over a 60-minute period (5–60 min) and analyzed using UV–Vis spectrophotometry, HPLC, and COD measurements for both the aqueous solution and DXM-WW. For kinetic modeling, first-order, second-order, and the two-stage BMG models (Equations (6)–(8)) were applied. Model performance was evaluated based on the relationship between accumulated energy and DXM concentration. Kinetic constants were calculated using Statistica 10 StatSoft® software.
First-order kinetic model:
Second-order kinetic model:
BMG Model:
where C
0 is the initial concentration, C
t is the concentration at reaction time t, and m and b are the constants of the BMG model.
3. Results
3.1. Electrosynthesis of Zeolite and Characterization
Figure 3 presents the SEM micrographs of the raw ZC and the synthesized TiO
2-Zn(II)-ZC catalyst.
Figure 3a shows the surface morphology of ZC. In
Figure 3b, the zeolite particles are visibly coated with TiO
2, indicating successful deposition. The synthesis method does not appear to alter the structural integrity of zeolite, which primarily functions as a support material.
Figure 3c reveals TiO
2 agglomerates on the zeolite surface, and
Figure 3d displays distinct bright spots attributed to the presence of zinc, indicating successful Zn incorporation into the TiO
2 structure supported on the ZC.
According to the EDS analysis summarized in
Table 2, the major elements identified in TiO
2-Zn(II)-ZC initial are oxygen (50.80%), silicon (6.63%), titanium (35.7%), and zinc (3.66%), the value of oxygen is significantly higher in TiO
2-Zn(II)-ZC than in ZC, which could be due to oxidation of the surface of the crystals while removing the flux with water [
24]. Other elements present in smaller proportions include aluminum, potassium, iron, and calcium.
Figure S1 (Supplementary Materials) shows EDS spectra.
Zinc concentration was determined by AA for the following samples: (a) natural ZC (0.0066 mg Zn/g ZC), (b) Zn on TiO
2 (0.0126 mg Zn/g TiO
2), and (c) TiO
2-Zn(II)-ZC (2.2 mg Zn/g). These results confirmed that the combined electrosynthesis and thermal treatment was effective in immobilizing Zn on the ZC support. The calcination temperature (550 °C) enhanced photocatalytic activity, and the electrodeposition method helped prevent the presence of organic residues on the catalyst surface [
25].
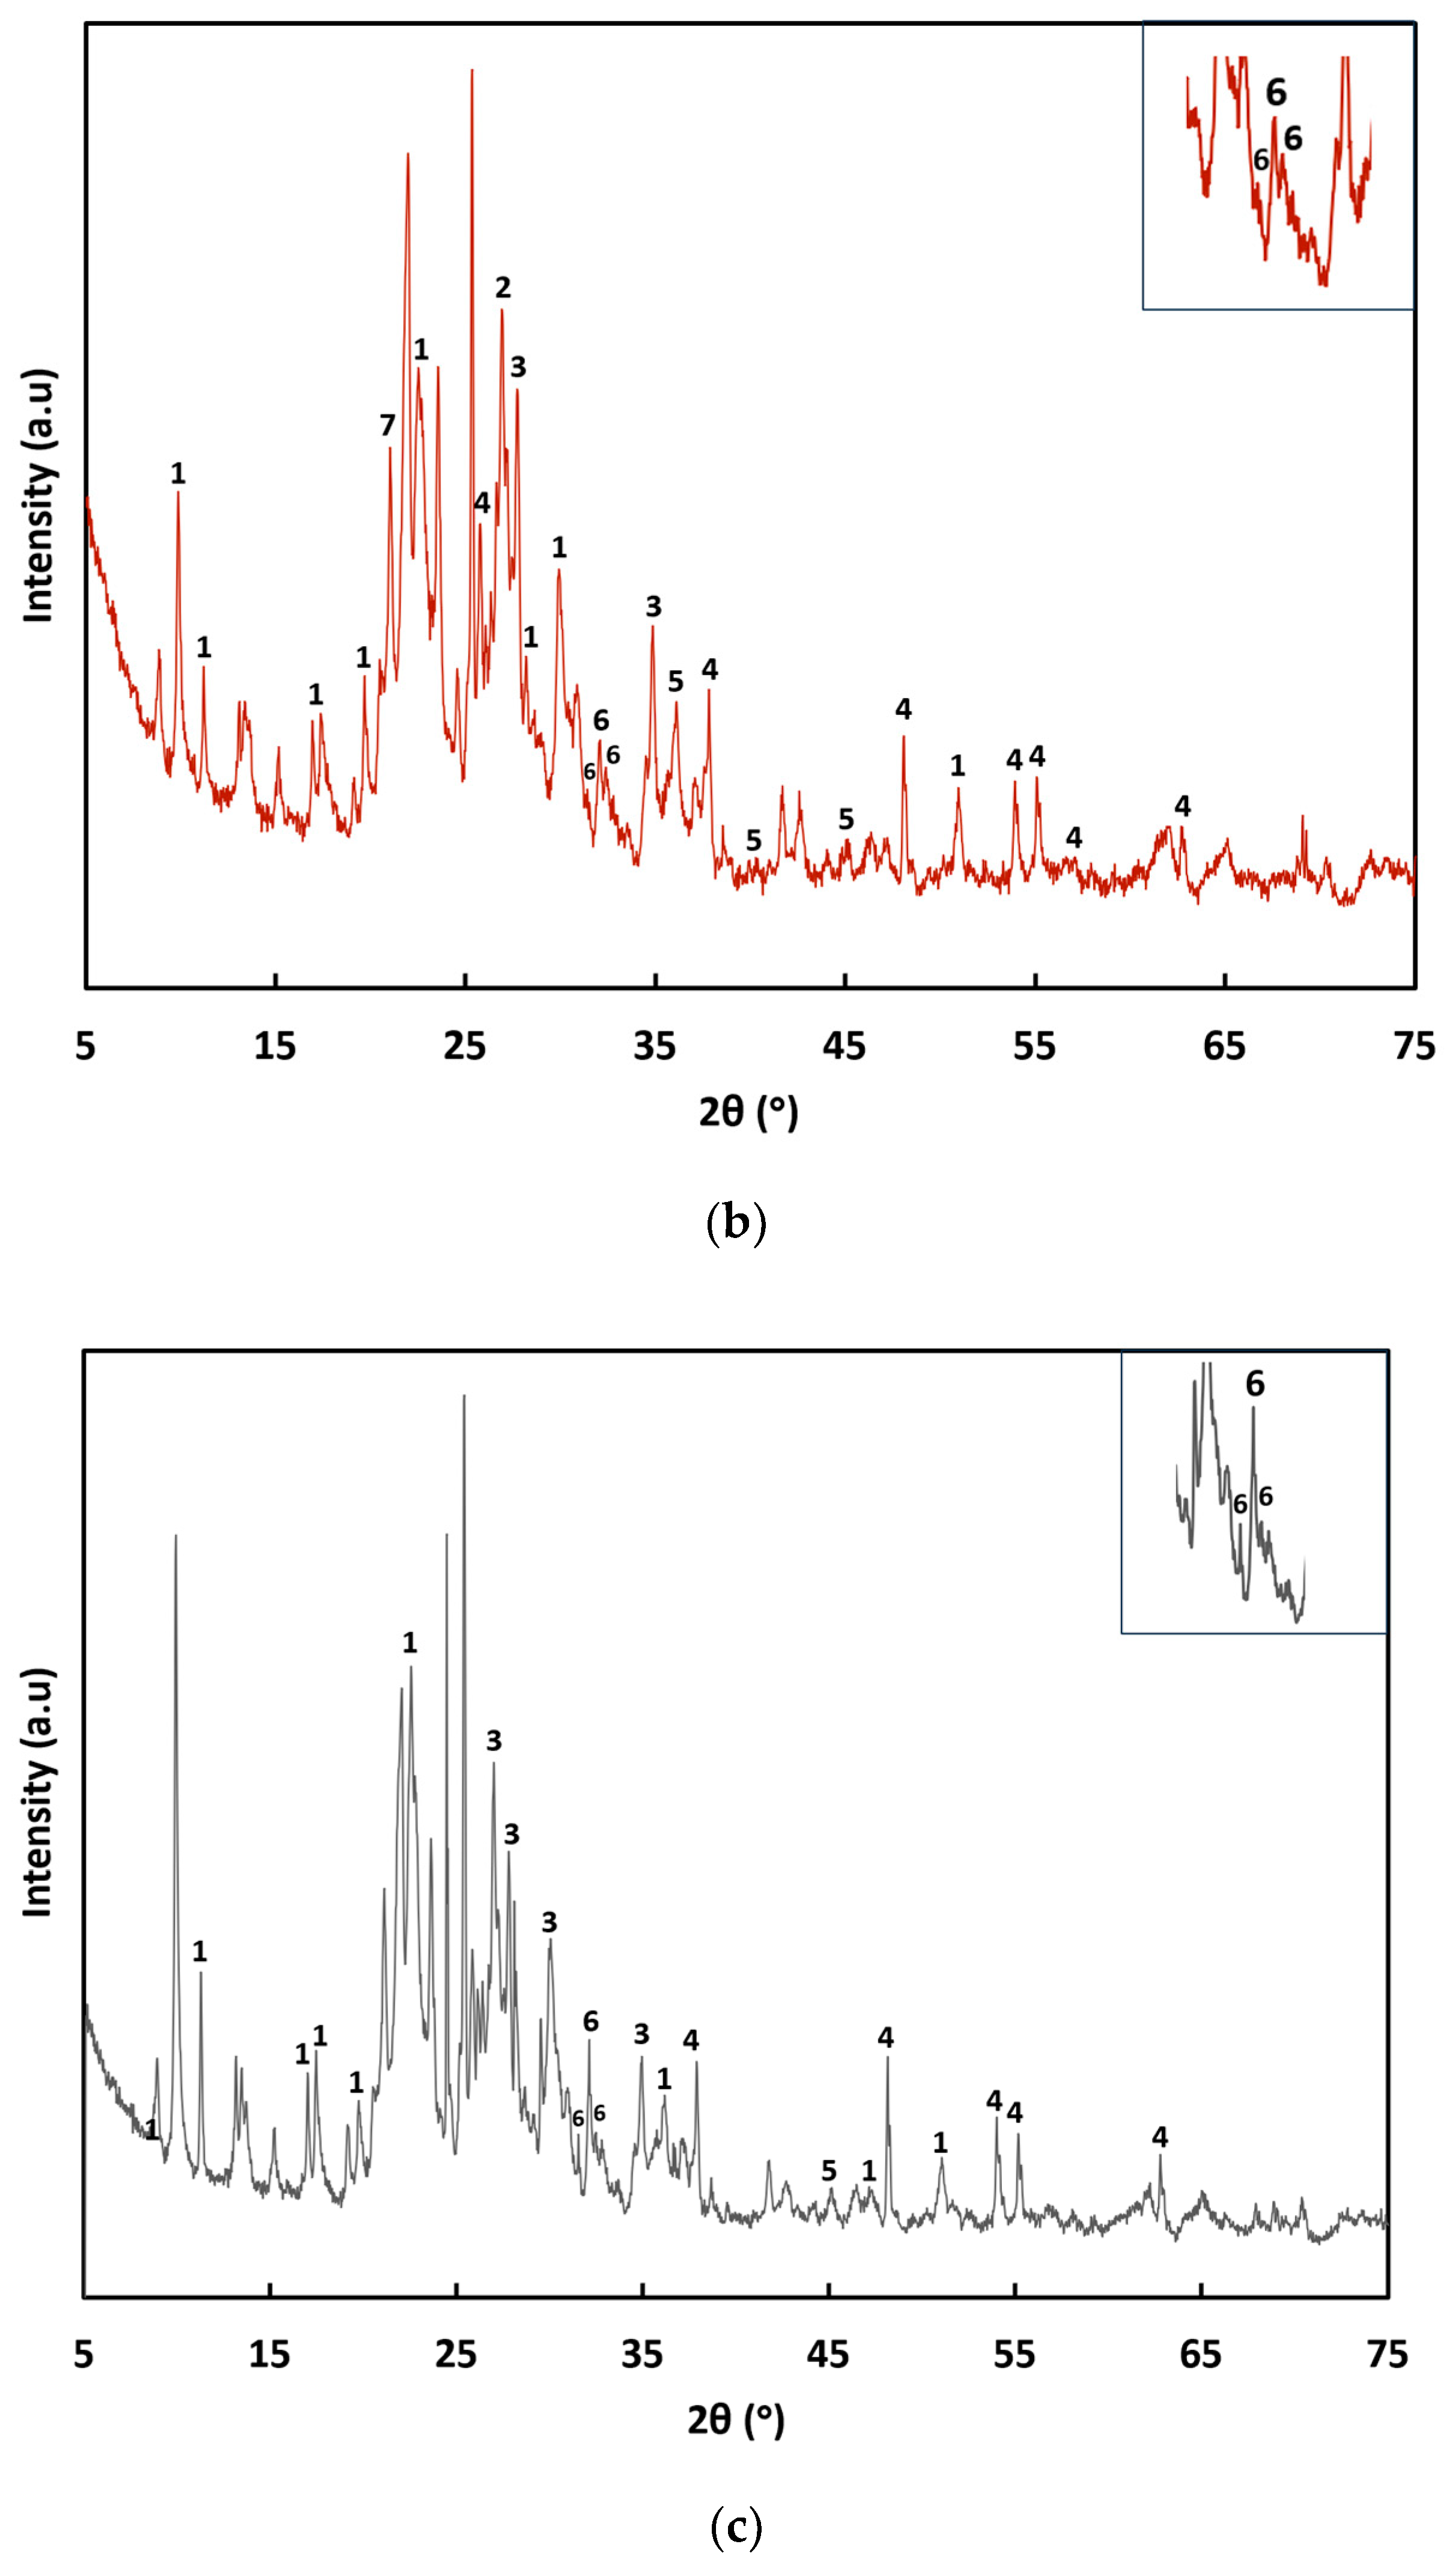
Figure 4 shows XRD pattern of the (a) ZC, (b) TiO
2-Zn(II)-ZC, and (c) TiO
2-Zn(II)-ZC after DXM degradation. In the XRD pattern of the TiO
2-Zn(II)-ZC composite, diffraction peaks at 2θ = 25.78°, 37.78°, 48.05°, 53.88°, 55.11°, 57.16°, and 62.85° correspond to the anatase phase of TiO
2. Peaks at 2θ = 36.01°, 39.31°, and 45.21° are associated with the rutile phase. The anatase form is typically more photocatalytically active than rutile due to a higher density of localized states, increased surface-adsorbed
•OH radicals, and a lower rate of e
−/h
+ recombination [
25]. Additionally, peaks at 2θ = 31.50°, 32.05°, and 32.20° indicating the presence of the hexagonal crystalline structure of ZnO are identified [
26]. The phase that contributes to catalytic activity is anatase. In the initial characterization of TiO
2-Zn(II)-ZC (
Figure 4b), a mixture of anatase and rutile is observed where the peaks with the highest intensity correspond to anatase.
Figure 4c shows the XRD of TiO
2-Zn(II)-ZC after DXM degradation, where only the anatase phase is identified while preserving its crystal structure, while the rutile phase loses crystallinity and the intensity of the peaks decreases considerably.
According to the Joint Committee on Powder Diffraction Standards (JCPDS), the peaks observed in the XRD diffractograms correspond to silicon oxide (JCPDS 05-0490), quartz (JCPDS 47-1144), clinoptilolite (JCPDS 13-0304, 47-1870), albite (JCPDS 02-0515), and TiO2 in the anatase phase (JCPDS 02-0387). Following the doping and support processes, characteristic peaks of TiO2 and clinoptilolite remained visible in the diffractograms.
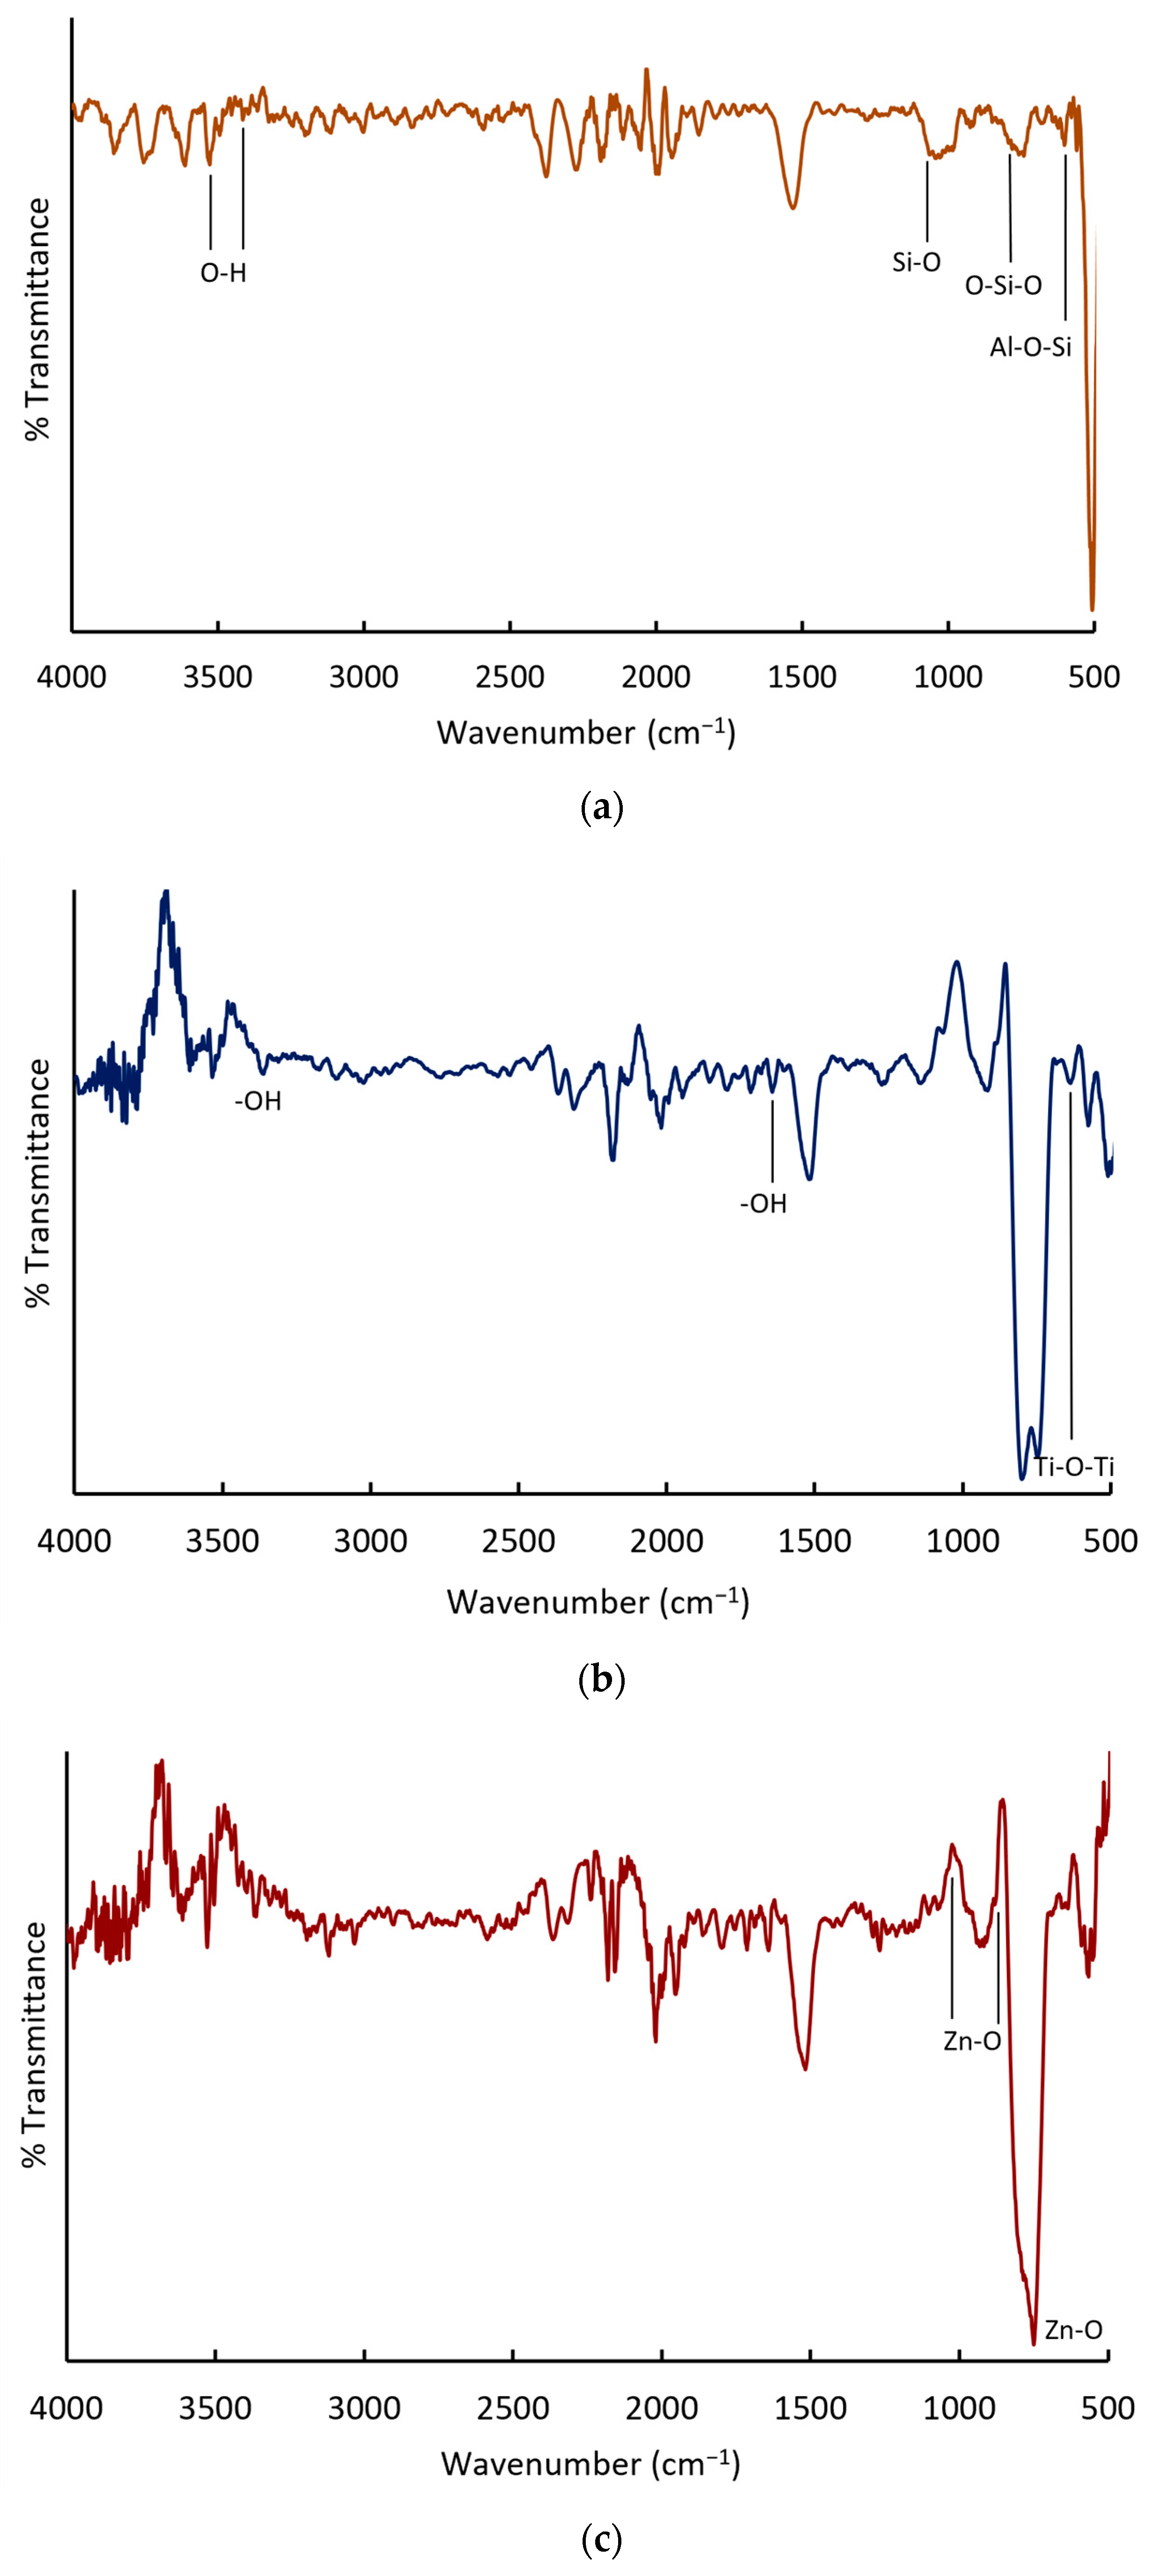
Figure 5 presents the IR spectra of the following: (a) ZC, (b) TiO
2, and (c) TiO
2-Zn(II)-ZC. In
Figure 5a, a band at 599 cm
−1 is observed, corresponding to torsional vibrations of Al−O−Si bonds in the zeolite structure. In
Figure 5b, bands associated with the stretching vibrations of −OH groups and the scissor-like bending vibrations of water protons adsorbed on the TiO
2 surface are evident. Additionally, bands in the low-frequency region (500–633 cm
−1) are characteristic of Ti−O−Ti bonding.
Figure 5c confirms the presence of Zn−O bonds, with absorption bands at 1033, 876, 749, and 521 cm
−1. These bands overlap with those associated with Ti−O−Ti, indicating successful Zn incorporation into the TiO
2 matrix.
Table S2 (Supplementary Materials) summarizes the observed wavenumbers and their corresponding functional group assignments for ZC, TiO
2 y TiO
2-Zn(II)-ZC.
3.2. Characterization of DXM Aqueous Solution
DXM aqueous solutions were prepared at concentrations of 5, 10, and 15 mg/L for the experimental design. Corresponding COD values were determined at 38, 56, and 76 mg/L, respectively, showing a direct correlation between initial DXM concentration and COD. These COD values may also reflect the presence of excipients commonly added to pharmaceutical formulations alongside the active ingredient.
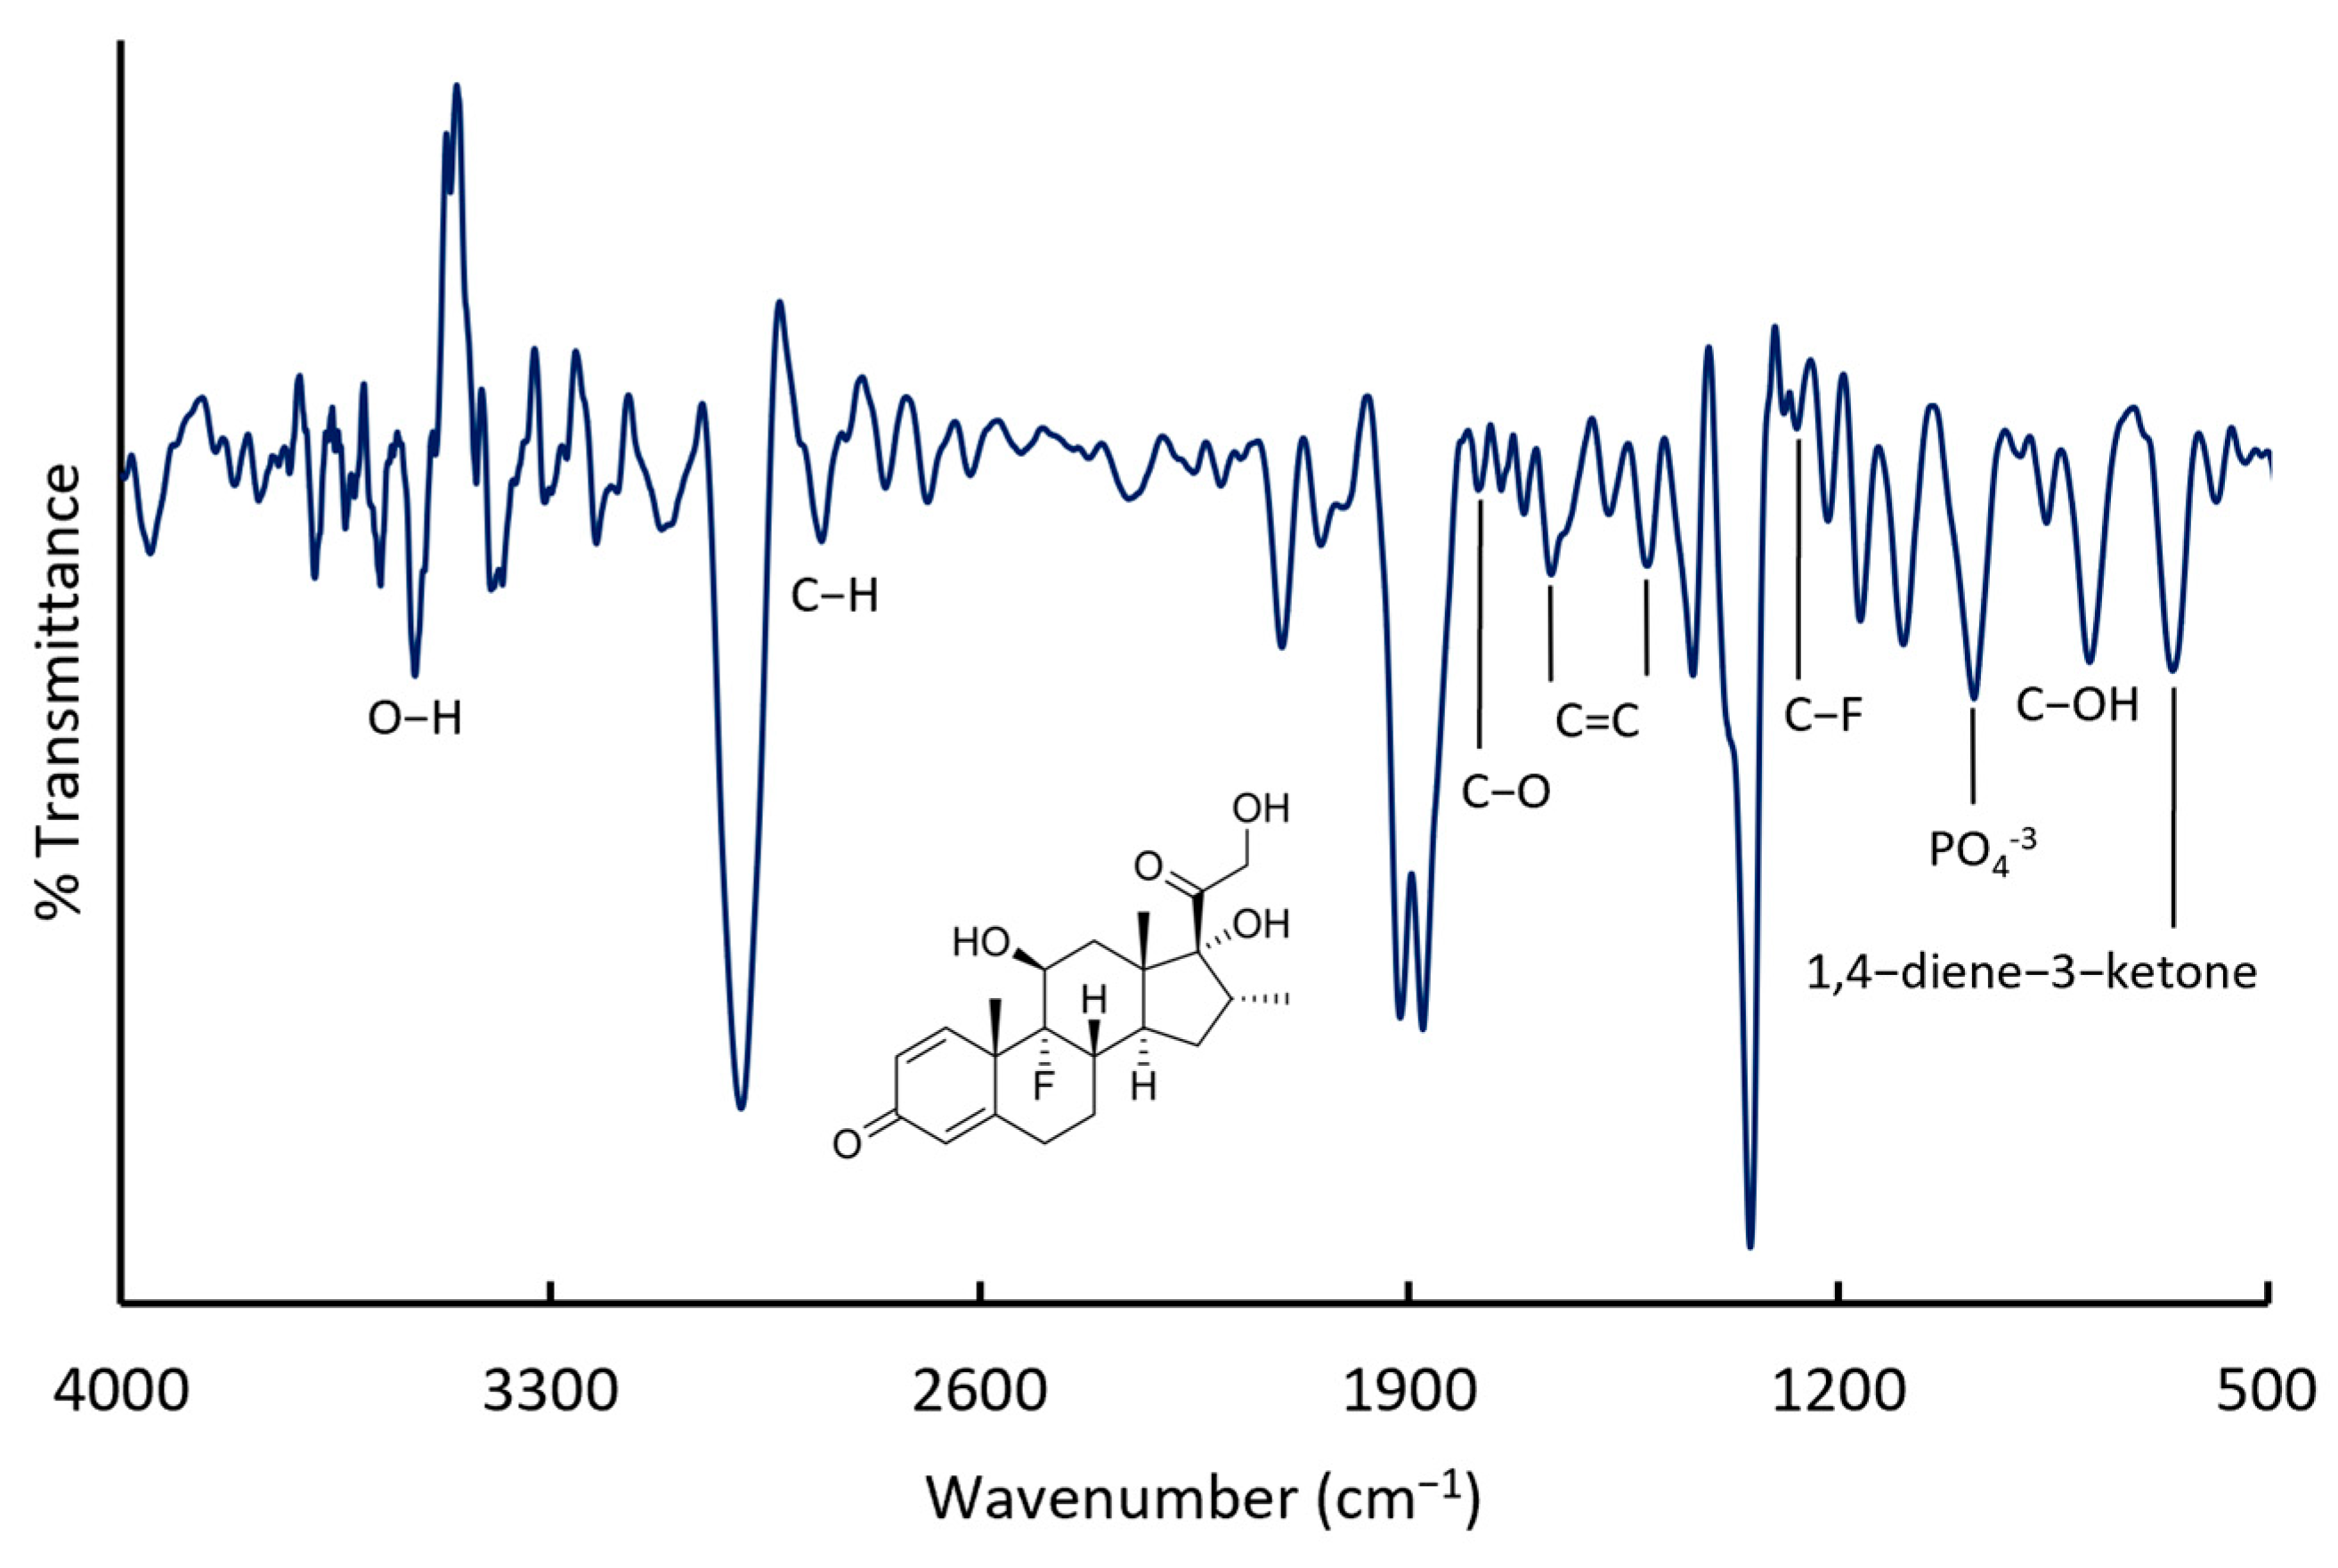
Figure 6 presents the IR spectrum of the injectable DXM solution. Key absorption bands include those at 1767 and 1667 cm
−1, corresponding to the stretching vibration of aliphatic ester and ketone carbonyl (C=O) groups. Broad bands at 3526 and 3377 cm
−1 are attributed to the O−H stretching, while a strong C−F single bond is identified between 1100 and 1000 cm
−1, with characteristic overtones observed between 2600 and 2100 cm
−1. Additional bands at 2983 cm
−1 are attributed to the C−H stretching vibrations. Peaks at 1710, 1162, and 1091 cm
−1 correspond to C−O stretching vibrations of hydroxyl and ether groups [
27]. The bands at 1568 and 1661 cm
−1 are assigned to C=C bonds in cyclic compounds, while the band at 1092 cm
−1 indicates the presence of C−OH groups. A distinctive band at 866 cm
−1 corresponds to 1,4−diene−3−ketone bond vibrations. Finally, the band at 1100 cm
−1 is characteristic of phosphate groups.
Table S3 (Supplementary Materials) summarizes the observed wavenumbers and their associated functional groups in the DXM aqueous solution.
3.3. Heterogeneous Solar Photocatalysis Process
HSP process was used to study the degradation of DXM, with optimal conditions determined through a Box–Behnken experimental design. The highest removal efficiencies, 70% for DXM and 63.16% for COD, were achieved in Experiment 6 (
Table 3). This experiment was conducted with an initial DXM concentration of 5 mg/L, HRT of 30 min, and M/V ratio of 1.0 mg/L; the corresponding operational conditions included a temperature of 64.58 °C, accumulated energy 134.66 kJ/L, and incident radiation of 41.48 W/m
2 (
Table 3).
In the HSP process, various factors influence removal efficiency. According to the ANOVA results (
Table S4, Supplementary Materials), the most significant factors were the initial DXM concentration (
p = 0.0436) and interaction between concentration and HRT (
p = 0.0477). Other factors, including temperature, the presence or absence of UV light, and the M/V ratio, also affected the process but to a lesser extent. These key and secondary factors are discussed in detail below.
3.3.1. Concentration Initial Effect
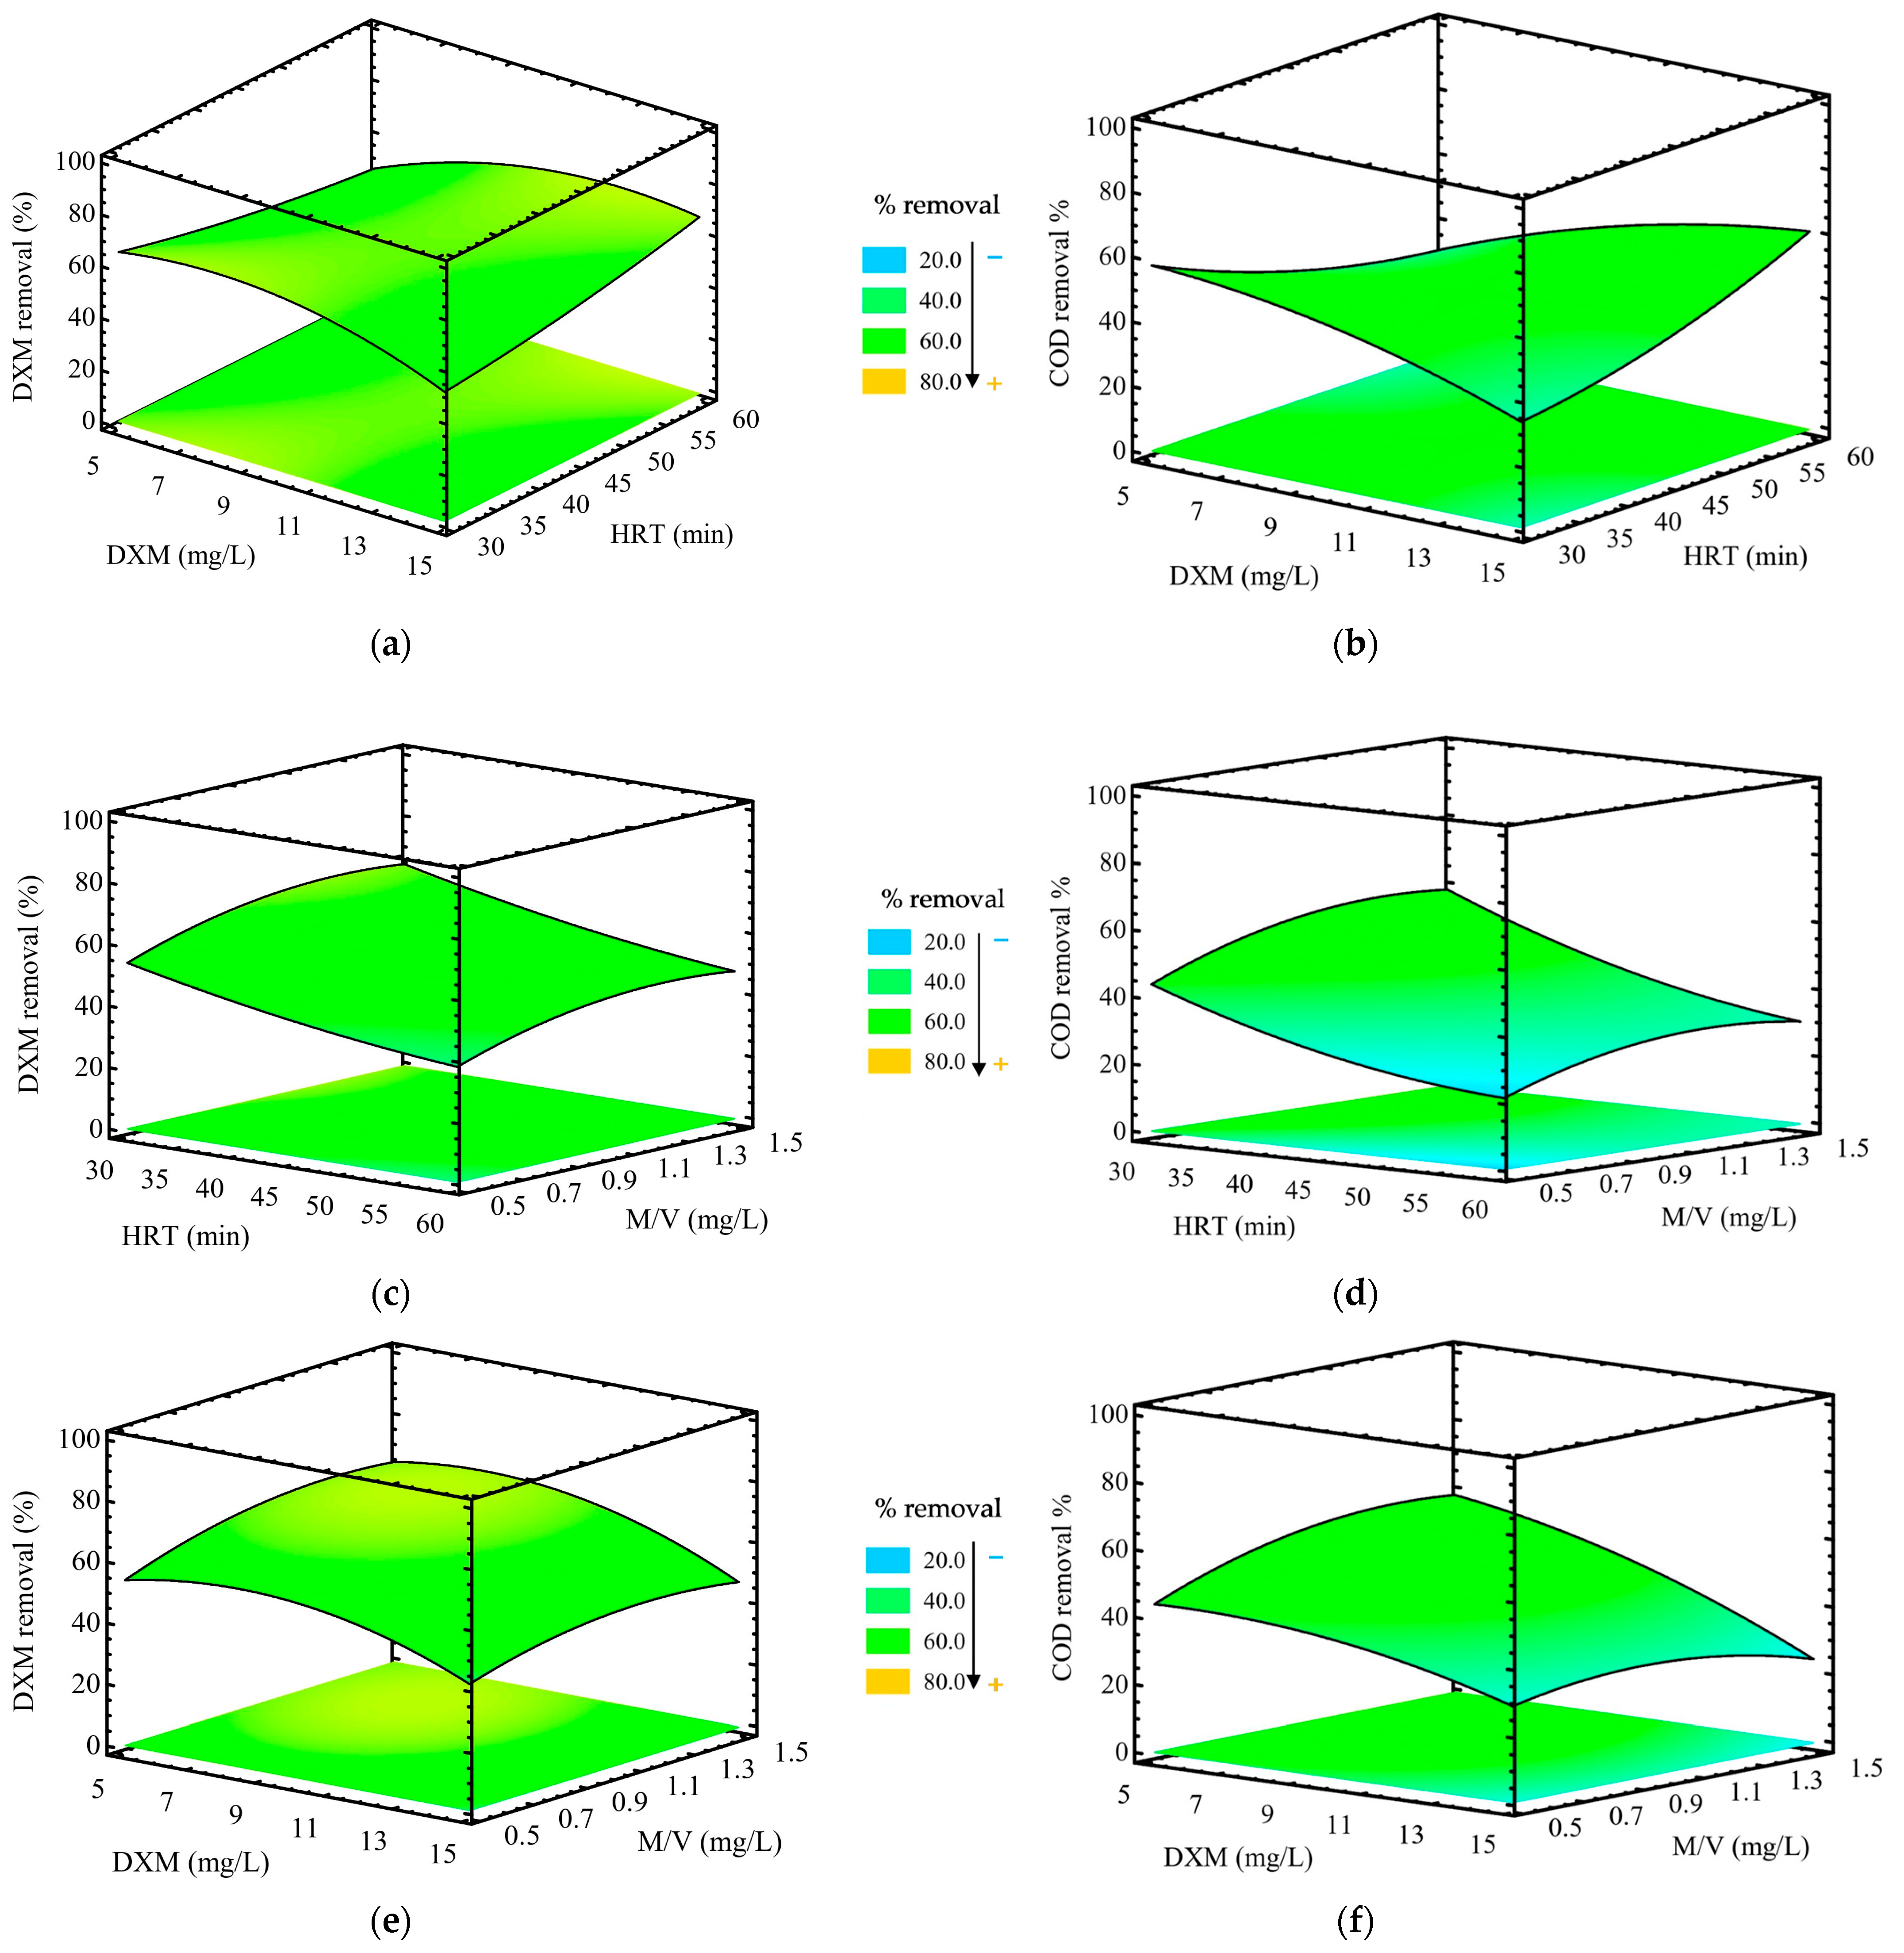
According to the response surface plots, an increase in DXM concentration from 5 mg/L to 15 mg/L (at a constant M/V ratio of 1.0 mg/L) resulted in a decrease in removal efficiency from 70% to 44% (
Figure 7a). A similar trend was observed for COD removal, which declined from 63.16% at lower concentrations to 22.37% at higher concentrations of DXM (
Figure 7b). This reduction in efficiency is likely due to the saturation of active sites on the TiO
2-Zn(II)-ZC catalyst at higher pollutant concentrations, which hinders effective interaction between the catalyst and DXM molecules [
28]. A comparable effect was reported by Pazoki et al. [
29] who investigated the degradation of DXM (5–30 mg/L) using an Ag/TiO
2 photocatalyst (1500 mg/L) under UV irradiation (100–200 nm, 20 W) at pH 3 and 35 °C in a 600-mL batch reactor with an HRT of 240 min. The process achieved a removal efficiency of 77.6% for DXM.
Wilk et al. [
30] evaluated the efficiency of heterogeneous photocatalysis under simulated sunlight for the degradation of DXM at a concentration of 1 mg/L using three photocatalysts: TiO
2 anatase, TiO
2 Degussa P25, and ZnO. Among them, TiO
2 Degussa P25 exhibited the highest photocatalytic activity, achieving 98.93% DXM degradation within 10 min. The experimental conditions included 100 mg/L of Degussa P25 TiO
2 at pH 7, simulated sunlight using a 150 W xenon lamp, continuous stirring, and a batch reactor setup.
3.3.2. Hydraulic Retention Time Effect
The removal efficiencies for DXM and COD increased with HRT, reaching a plateau at 60 min. However, based on the Box-Benhken experimental design, the highest removal rates, 70% for DXM and 63.16% for COD, were achieved within 30 min at an M/V ratio of 1.0 mg/L, an initial DXM concentration of 5 mg/L, and pH 5 (
Figure 7c,d). A longer HRT allows for more effective contact between pollutants and the photocatalyst, enhancing the extent of photocatalytic degradation [
31]. Ghenaatgar et al. [
5] reported complete removal of 5 mg/L DXM after 140 min using 1500 mg/L ZrO
2 at pH 3. Pazoki et al. [
29] achieved 77.6% removal of DXM (C
o = 5 mg/L) after 240 min with 1500 mg/L Ag-doped TiO
2 at pH 3 under a 20-W UV lamp.
3.3.3. Mass/Volume Ratio Effect
As shown in
Figure 7e,f, the catalyst M/V ratio significantly affects the removal efficiencies of DXM and COD. At a low M/V ratio of 0.5 mg/L, removal efficiencies range from 38−58% for DXM and 18–40% for COD. Increasing the catalysts dosage increases the number of active sites available on the TiO
2-Zn(II)-ZC surface and promotes the generation of reactive species such as hydroxyl and superoxide radicals. However, exceeding the optimal catalyst concentration can lead to a decline in removal efficiency. Excess catalyst may scatter or block incident light, limiting photon absorption and reducing photocatalytic activity. Additionally, high catalyst concentrations may promote particle agglomeration, which decreases the effective surface area available for photon absorption and pollutant interaction, ultimately lowering the degradation rate [
32,
33].
3.3.4. Temperature Effect
Temperature plays a crucial role in determining the efficiency of photocatalytic processes. At the start of the experiments, ambient temperatures ranged from 17–23 °C. During the HSP, temperatures increased because of solar exposure, reaching 37.75–74.76 °C, depending on the climatic conditions. At 37.75 °C, the removal efficiencies were 44% for DXM and 22.37% for COD. At the highest recorded temperature of 74.76 °C, efficiencies improved to 63.33% for DXM and 55.26% for COD. The highest removal rates, 70% for DXM and 63.16% for COD were observed in Experiment 6, conducted at 64.58 °C. These results indicate that photocatalytic performance improves with increasing temperature up to an optimal point. However, increasing the optimal temperature may lead to increased recombination of photogenerated e−/h+ pairs, thereby reducing the availability of these charge carriers for photocatalytic reactions.
While most photocatalytic processes are typically conducted near room temperature, the exothermic nature of pollutant degradation and recombination reactions can lead to a gradual rise in system temperature, further influencing the reaction kinetics and efficiency.
However, the rate of photodegradation tends to decrease after exceeding an optimal temperature. This decline is primarily attributed to exothermic nature of pollutant adsorption, which becomes less favorable at higher temperatures, thereby limiting the overall degradation efficiency. According to the literature, adverse effects on photocatalytic performance have been observed at temperatures approaching or exceeding 80 °C [
34,
35].
3.3.5. Effect of pH
Interpreting the effect of pH on the efficiency of the photodegradation process is complex due to the involvement of three reaction mechanisms. DXM degradation may proceed via hydroxyl radical (
•OH) attack, direct oxidation by photogenerated h
+, or direct reduction by conducting band e
−. The contribution of each pathway depends on both the chemical nature of the pollutant and the pH of the solution. pH influences the photocatalytic process in several ways: it alters the charge distribution at the solid–liquid interface (i.e., electrical double layer), affects the surface charge of the photocatalyst relative to its P
zc, and modifies the sorption–desorption behavior of DXM. These changes, in turn, impact the separation and recombination dynamics of photogenerated e
−/h
+ pairs, ultimately influencing degradation efficiency [
32].
In this study, the Pzc of the TiO2-Zn(II)-ZC catalyst was determined to evaluate its interaction with the DXM solution. The Pzc is defined as the pH at which the catalyst surface has a net neutral charge. When the solution pH is lower than the Pzc (8.39 for TiO2-Zn(II)-ZC), the catalyst surface is positively charged; when the pH is higher, the surface becomes negatively charged. The initial pH of the DXM solution was 5.0, and for DXM-WW, it was 7.5, both below the Pzc. Therefore, under these conditions, the catalyst surface remained positively charged.
DXM has two pKa values: pKa
1 = 1.8 and pKa
2 = 6.18. At pH values above its pKa, DXM exists predominantly in its ionized (negatively charged) form. Since both working pH values (5.0 and 7.5) are above pKa
1 and one is above pKa
2, DXM is partially ionized at pH 5 and fully ionized at pH 7.5. This establishes favorable electrostatic attraction between the negatively charged DXM molecules and positively charged catalyst surface, promoting adsorption and enhancing photocatalytic degradation. pH influences the dominant reactive species. At lower pH values, photogenerated h
+ plays a major role in oxidation, whereas at neutral or higher pH,
•OH are the primary oxidizing agents [
32]. In both cases, pH affects the surface charge, adsorption behavior, and recombination of photogenerated e
−/h
+ pairs, thus impacting the overall photocatalytic performance [
33].
3.3.6. Effect of UV Light and Accumulated Energy
UV light plays a critical role in the photodegradation of pollutants, as the degradation efficiency is strongly related to light intensity. Higher light intensities enhance the generation of reactive oxygen species and reduce the recombination rate of photogenerated e
–/h
+ pairs [
18].
In this study, all Box–Behnken experiments were conducted under UV radiation, with an intensity range of 30.08–50.89 W/m
2 and accumulated energy ranging from 132.89 to 304.48 kJ/L. The highest removal efficiencies were obtained at an incident UV intensity of 41.48 W/m
2, and an accumulated energy of 134.66 kJ/L, using 5 mg/L initial DXM concentration, 30 min HRT, and M/V ratio of 1.0 mg/L. Maniakova et al. [
36] studied the degradation of a pharmaceutical mixture containing carbamazepine (CBZ), diclofenac, and trimethoprim (200 µg/L each) in both deionized water and real wastewater. The Fe
2+/H
2O
2/ethylenediamine acid (EDDS)/sunlight process achieved 98% CBZ removal from wastewater within 60 min, with a cumulative solar energy input of 5.6 kJ/L.
3.4. Multiple Response Optimization
Statgraphics Centurion 19 software was used for multiple response optimization. This methodology was used for the identification of optimal configurations of experimental factors to simultaneously achieve the desired outcomes for multiple response variables, specifically, DXM concentration (measured by UV–Vis spectroscopy) and COD, targeted for maximization (
Table 4).
An optimization experiment was conducted under the following conditions: 12.5 mg/L initial DXM concentration, HRT of 60 min, and M/V ratio of 1.0 mg/L. Under these conditions, the maximum removal efficiencies achieved were 80% for DXM and 85.29% for COD, at an accumulated energy of 325.12 kJ/L. The experimental data were fitted using polynomial regression models, yielding Equations (9) and (10) for DXM degradation and COD removal, respectively.
In these equations, variables A, B, and C represent the initial DXM concentration (mg/L), TRH (min), and M/V ratio (mg/L), respectively.
The model adjusted for DXM degradation presented an R
2 = 0.80, considered acceptable in response surface studies [
37,
38], indicating that the model adequately describes experimental variability and allows its use for optimization purposes. In contrast, the COD model showed an R
2 = 0.65, reflecting a limited fit due to the comprehensive nature of this parameter, which includes both the target pollutant and oxidation byproducts, generating greater dispersion in the data. Therefore, while the DXM model can be considered predictive, COD results should be interpreted with caution and complemented with additional analyses.
3.5. Individual Effects
The individual effects were evaluated under the same conditions as those obtained in the multiple response optimization.
3.5.1. Photolysis Effect
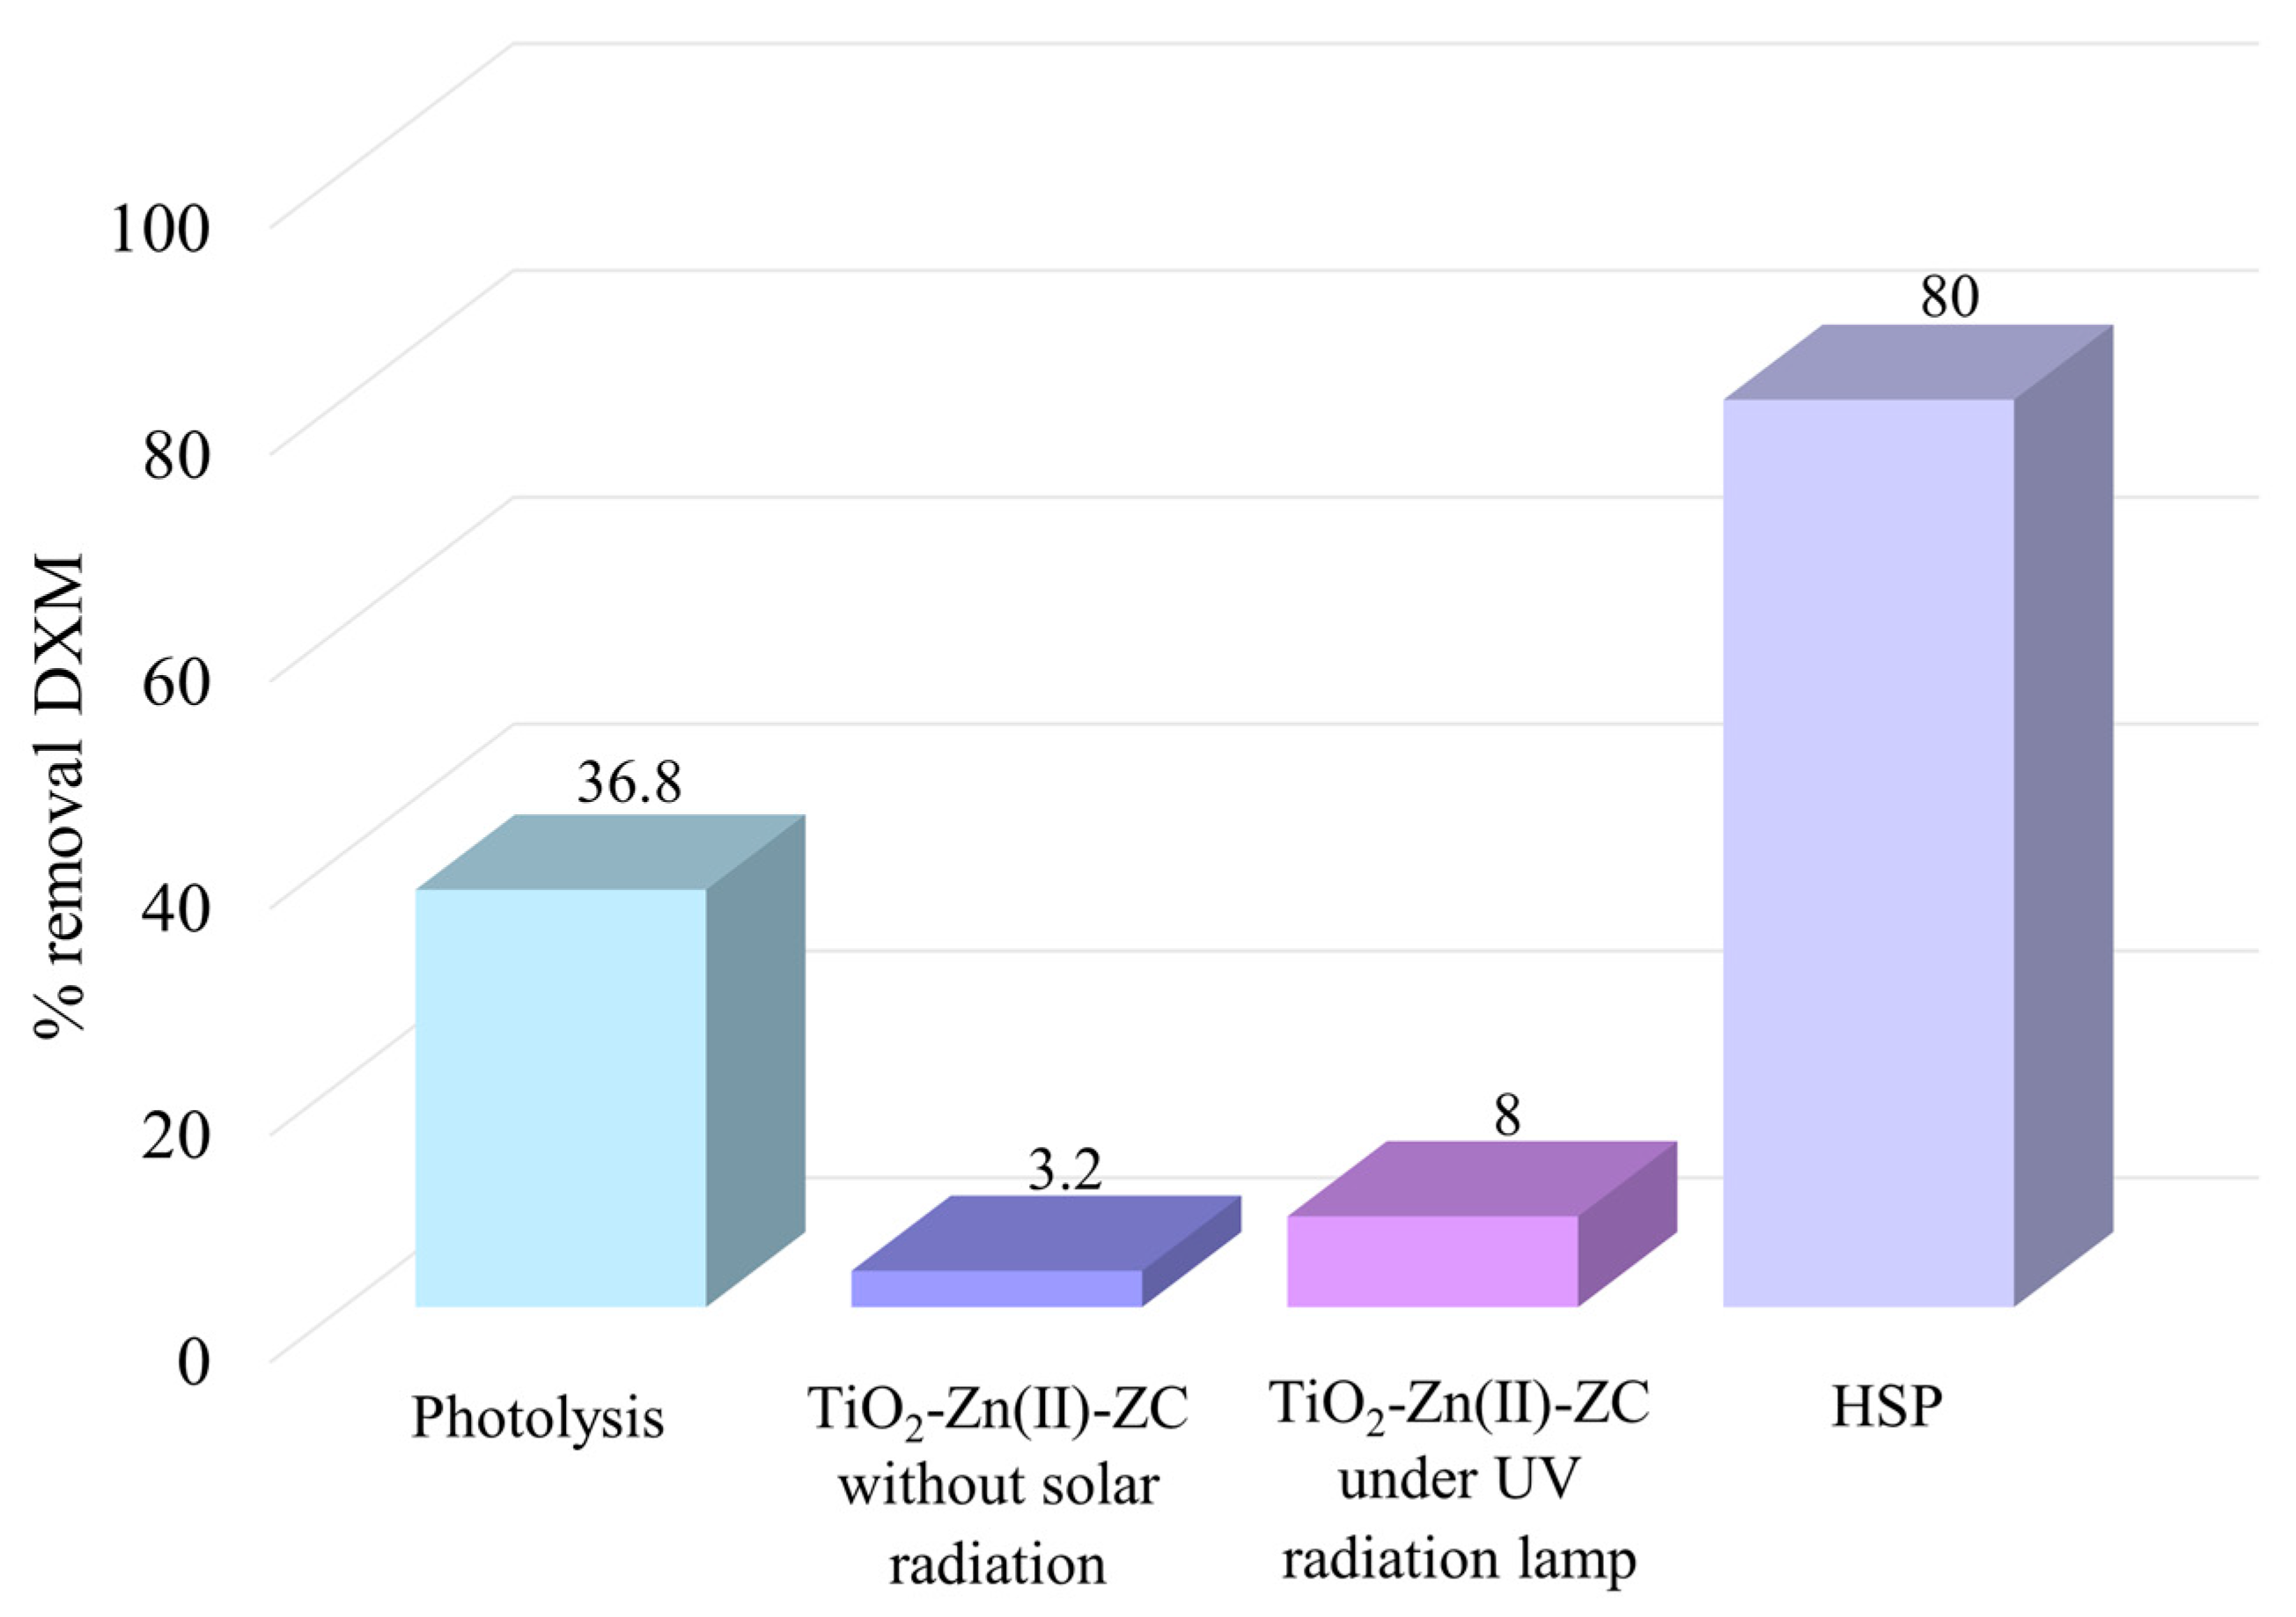
Photolysis treatment was conducted using an initial DXM concentration of 12.5 mg/L, without the addition of catalyst, at HRT of 60 min. The UV-A radiation intensity was 45.90 W/m
2, with an accumulated energy of 193.18 KJ/L. Under these conditions, a removal efficiency of 36.8% for DXM was achieved. This partial degradation is attributed to the chemical structure of DXM, which enables absorption in the UV-A region and part of the visible spectrum. Such absorption promotes the photolysis of specific bonds, particularly C−O and C−H, leading to partial molecular breakdown under solar irradiation [
8].
3.5.2. Effect of Catalyst (TiO2-Zn(II)-ZC) Without Solar Radiation
The experiment was performed using an initial DXM concentration of 12.5 mg/L, HRT of 60 min, and a catalyst M/V ratio of 1 mg/L TiO
2-Zn(II)-ZC, in the absence of solar radiation. Under these conditions, the DXM removal efficiency was only 3.2%. This result confirms that the TiO
2-Zn(II)-ZC photocatalyst requires UV irradiation to activate the generation of e
−/h
+ pairs and the subsequent formation of reactive oxidative species such as
•OH and O
2•− radicals, which are essential for the degradation of organic compounds [
17].
3.5.3. Effect of Catalyst TiO2-Zn(II)-ZC Under UV Radiation Lamp
The treatment was conducted at a DXM concentration of 12.5 mg/L, with HRT of 60 min, a catalyst M/V ratio of 1mg/L TiO
2-Zn(II)-ZC, and exposure to a GS-T5.003 lamp (5 W, λ = 380–400 nm and 16 W/m
2). Under these conditions, the DXM removal efficiency was low, achieving only 8%. Photocatalytic activity occurs when the energy of incident photon is equal to or greater than the bandgap energy of the photocatalyst, enabling the generation of e
–/h
+ pairs [
39]. According to Liu et al. [
40] TiO
2-Zn doped materials exhibit photocatalytic activity at λ > 429 nm. Therefore, the low efficiency observed in this experiment is associated with insufficient power and spectral output of the UV lamp, which did not provide adequate energy to initiate photocatalytic reactions. Asgari et al. [
41] achieved 87% DXM removal using a UV/H
2O
2/MgO system under optimized conditions: 20 mg/L DXM, 0.5 mM H
2O
2, 30 min of HRT, pH = 3, and 55W UV radiation.
Figure 8 presents a comparative overview of the individual effects and optimization of the HSP process on DXM degradation.
3.6. Kinetic Parameters
The kinetics of DXM degradation were evaluated in 12.5 mg/L DXM-WW under the optimal conditions established through multiple response optimization: 12.5 mg/L DXM, HRT of 60 min, and a catalyst M/V ratio of 1.0 mg/L TiO
2-Zn(II)-ZC. Along with COD and DXM measurements by UV–Vis, HPLC analysis was performed to monitor degradation.
Figure 9 shows the kinetics of degradation of the aqueous DXM solution (
Figure 9a) and DXM-WW (
Figure 9b), showing the relationship between DXM concentration vs. and accumulated energy in the system. The maximum DXM removal achieved was 88.71% for the aqueous solution and 67.88% for DXM-WW. In both cases, equilibrium was achieved at approximately 100 kJ/L of accumulated energy.
Table 5 shows the kinetic constants and coefficients of determination (R
2) for the first-order, second-order, and BMG models applied to both the aqueous DXM solution and DXM-WW. Among these, the BMG model showed the best fit, as reflected by the R
2 values for the aqueous solution: DXM = 0.9021, COD = 0.9837, and HPLC = 0.9875. For the DXM-WW system, the BMG model also exhibited a stronger fit for UV–Vis and HPLC results (DXM = 0.9671 and HPLC = 0.9811), whereas COD was described by the first-order model (R
2 = 0.9728). The results are summarized in
Table 5.
The BMG model characterizes the two-stage kinetics typical of AOPs. In this model, the parameter
m represents the degradation rate governed by
•OH generation, and
b corresponds to the maximum achievable DXM removal. Typically, higher values of
m and
b indicate a slower degradation, whereas lower values reflect faster kinetics and more efficient degradation [
42].
Grilla et al. [
12] investigated DXM degradation through simultaneous electrochemical oxidation and simulated solar irradiation, using a boron-doped diamond anode and a stainless-steel cathode in a 0.1 M NaSO
4 electrolyte. Under conditions of 0.5 mg/L DXM, 0.2 A/m
2 current density, 150 mg/L persulfate, 60 min HRT, and natural solution pH, they achieved 95% DXM removal with a pseudo-first-order rate constant of K = 0.194 min
−1. Shookohi et al. [
13] evaluated DXM removal using an UV/S
2O
82−/Al
2O
3 process. At 20 mg/L DXM, pH = 3, 0.5 nM persulfate, 30 min HRT, and 55 W UV lamp, they reported a rate constant of K= 0.0878 min
−1.
3.7. DXM-Wastewater Treatment
To evaluate the effectiveness of the HSP process in treating DXM-WW, a comprehensive physicochemical characterization was performed. The experiments were conducted under optimized conditions: 12.5 mg/L DXM, HRT of 60 min, and a catalyst M/V ratio of 1.0 mg/L.
Table 6 presents the results for both DXM aqueous solution and DXM-WW, before and after HSP treatment.
For the DXM aqueous solution, the HSP system demonstrated high removal efficiencies for organic contaminants: with 80% DXM removal by UV–Vis and 88.71% by HPLC, as well as COD removal of 85.29%, and COT removal of 82.86%. BOD5 decreased from 5.56 to 2.67 mg/L, and the biodegradability index increased from 0.081 to 0.267. In terms of inorganic parameters, the process exhibited excellent removal efficiencies, with nitrates, nitrites, and sulfates being removed by 100%. Chlorides were removed by 55.67%, and total phosphorus and phosphates by 11.59% and 7.16%, respectively. Additionally, the pH increased from 5.0 to 6.5 after treatment, which may contribute to the improved removal of weak acids and bases such as nitrates, sulfates, and chlorides.
For the DXM-WW, the HSP process demonstrated notable treatment efficiency under optimized conditions; 90.40% DXM removal by UV–Vis, 67.88% DXM by HPLC, 93.02% COD, and 92.38% TOC were achieved. BOD5 decreased significantly from 18 mg/L to 4 mg/L (a 77.77% reduction), and the biodegradability index improved from 0.209 to 0.667. Color and turbidity removal was 84.22% and 69.38%, respectively. Regarding inorganic compounds, the following removal efficiencies were observed; nitrates 33.22%, nitrites 58.55%, chlorides 14.15%, sulfates 45.56%, and phosphates 35.22%. Total phosphorus increased from 6.520 mg/L to 8.456 mg/L after treatment. The pH of DXM-WW remained stable at 7.5 after treatment.
According to the results in aqueous solution, the HSP process promotes DXM degradation (88.71% HPLC). Meanwhile, in DXM-WW, the removal was decreased to 67.88%, due to the matrix complexity. The removal of COD and TOC were higher in DXM-WW than aqueous solution, because these organic parameters quantify the biodegradable organic matter and persistent (DXM).
3.8. Mechanism
The activation of TiO
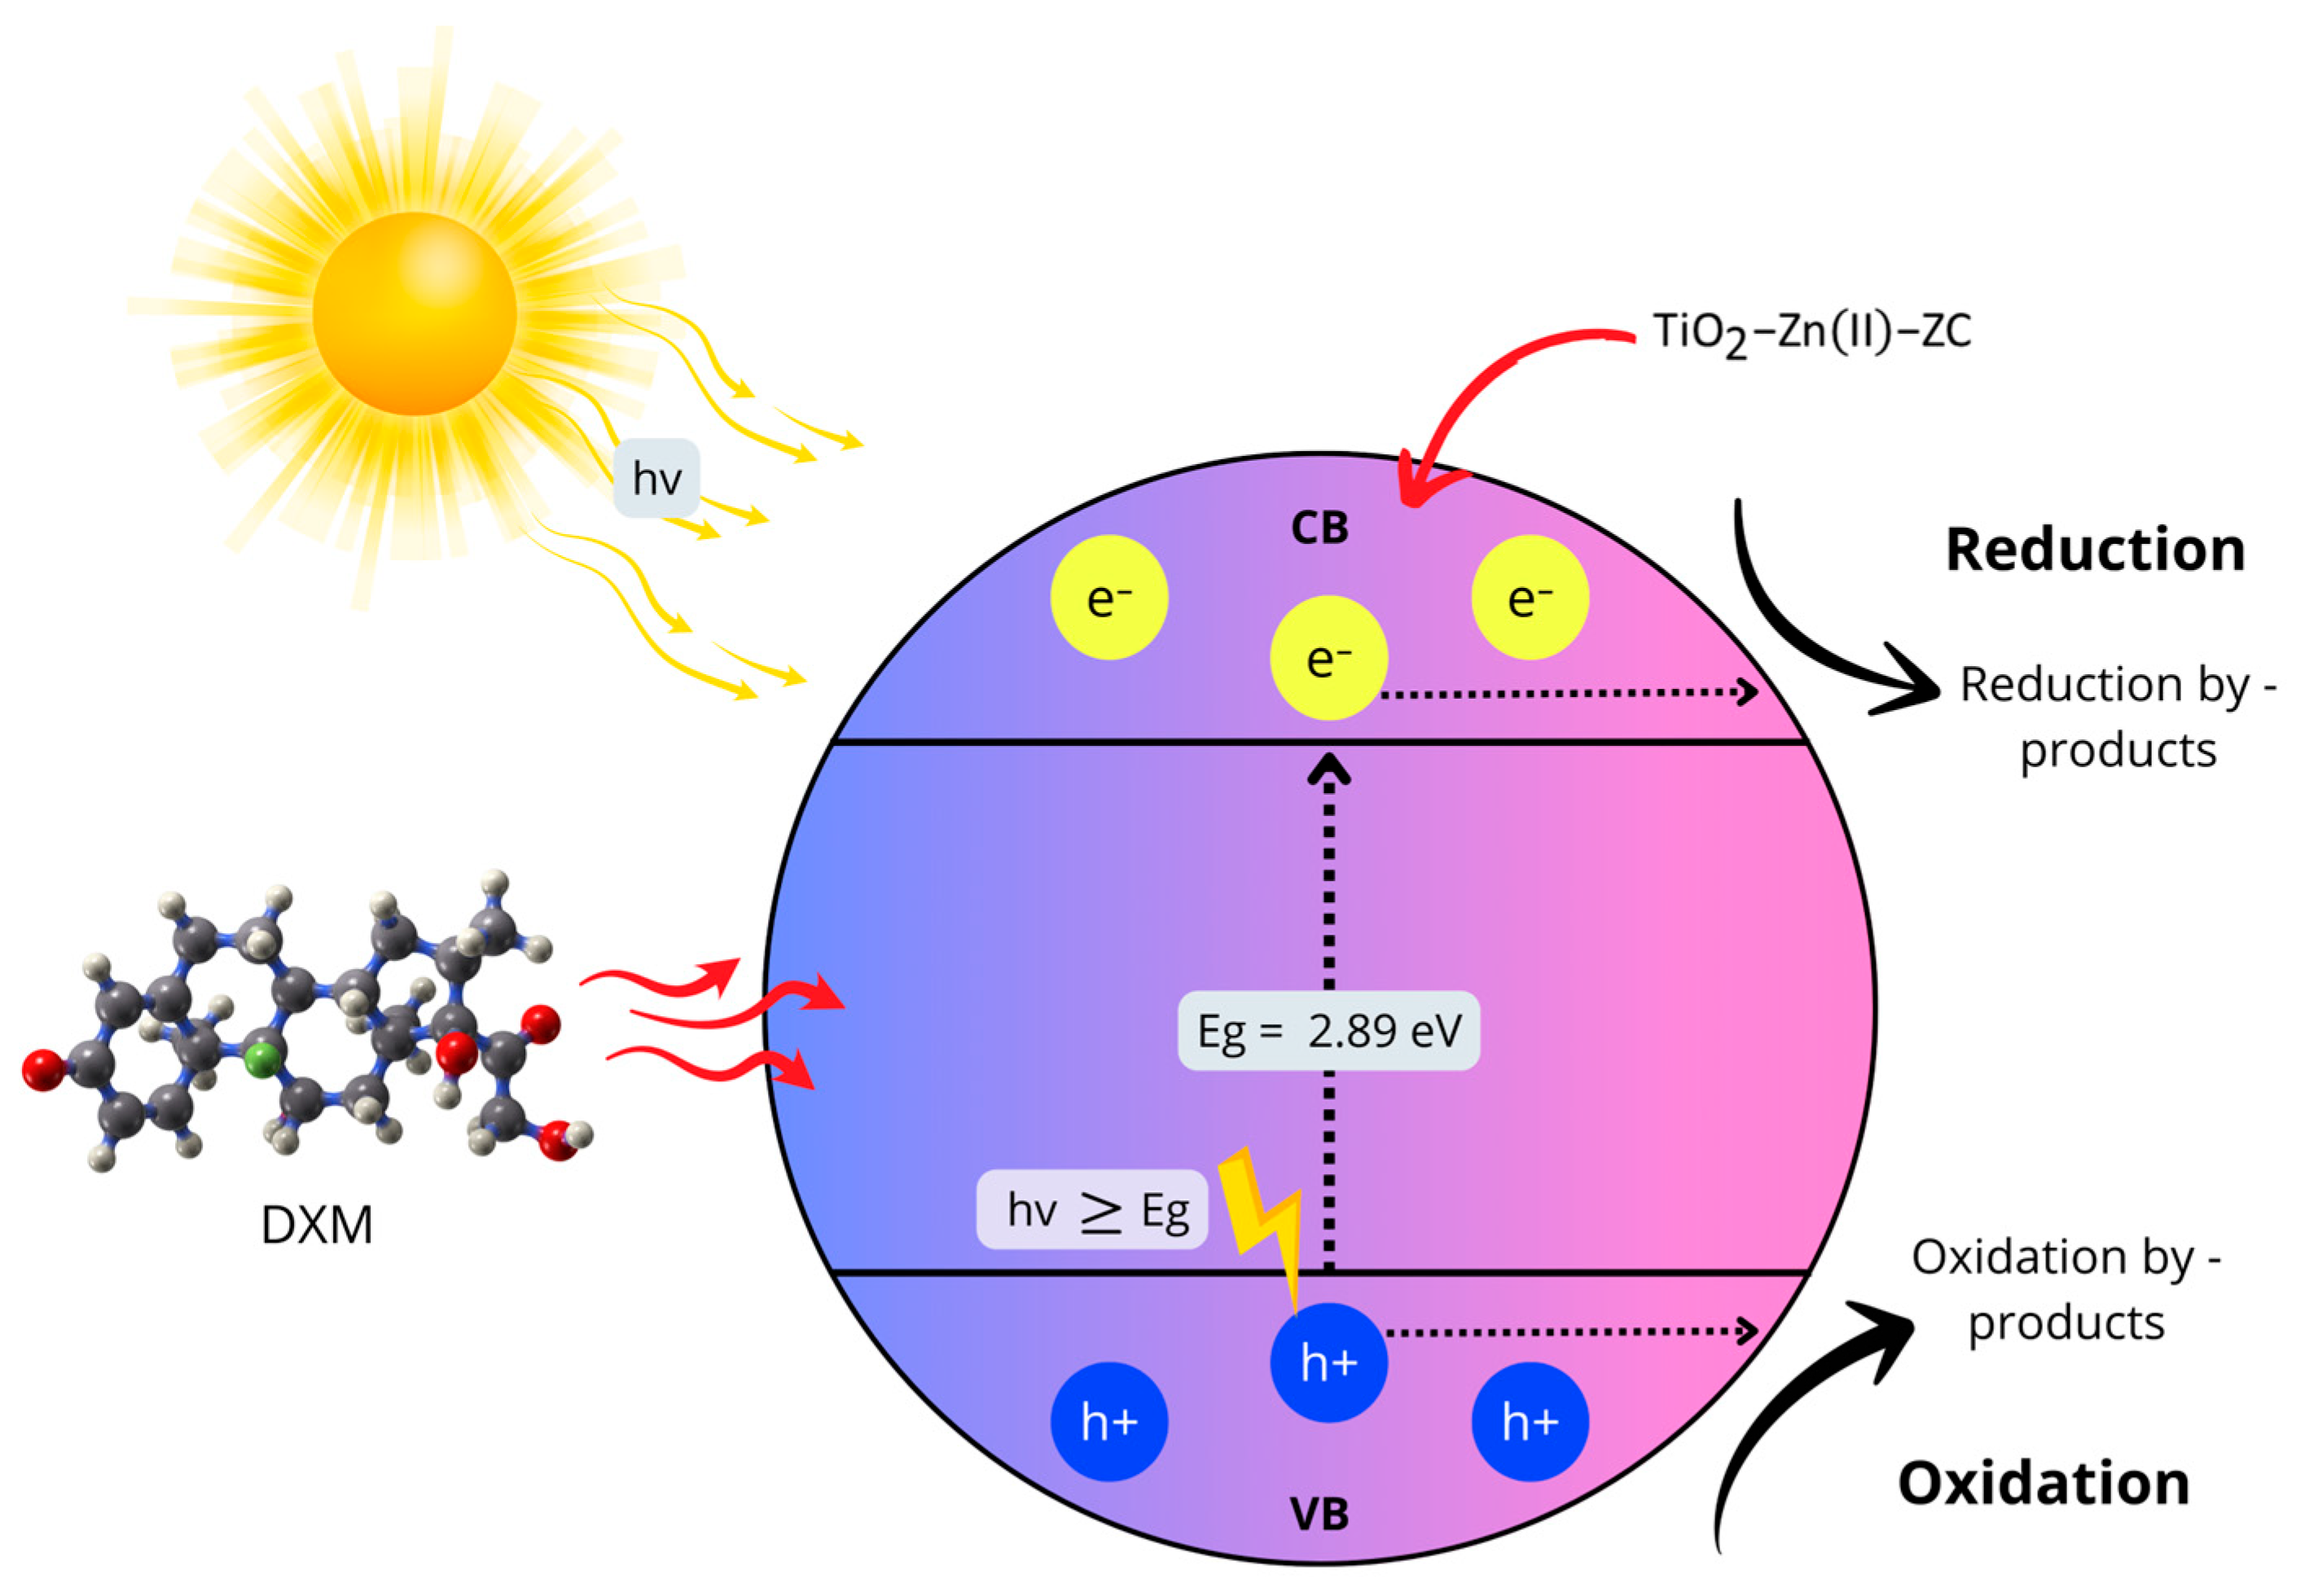
2 is dependent on the wavelength of the incident radiation and the bandgap of the material, the energy difference between the VB and CB. Photocatalytic activation occurs when the energy of the incoming photon (hν) is equal to or greater than the bandgap energy (Equation (11)), enabling the generation of e
−/h
+ pairs. Once excited, the positive h
+ in the VB can oxidize surface-bound water molecules or HO
− radicals, which are highly reactive oxidizing agents in photocatalytic processes (Equations (12) and (13)). Meanwhile, photogenerated e
− in the CB can reduce dissolved oxygen, forming superoxide anion radicals (Equation (14)). These reactive oxygen species, including
•OH, HO
•2, O
2•− and H
2O
2, can also form through subsequent chain reactions, outlined in Equations (14)–(20), sustaining the radical based degradation cycle as long as light energy is available. The
•OH radical is considered the primary oxidizing species for the photocatalytic degradation of organic pollutants. However, the efficiency of the photocatalytic process can be significantly reduced by the recombination of e
−/h
+ pairs, which dissipates energy as heat rather than enabling redox reactions. Therefore, suppressing
recombination is essential for enhancing photocatalytic performance.
An electron in the CB can participate in the reduction of DXM while a hole in the VB can facilitate its oxidization [
39]. However, in heterogeneous photocatalysis, oxidative pathways are generally more dominant and efficient than reductive pathways (
Figure 10).
Based on previous reports [
43], as well as IR and fluorescence spectroscopy analysis before and after HSP treatment (
Figures S2 and S3, Supplementary Materials), a mechanism for DXM degradation was proposed. The degradation follows a non-selective oxidation pathway predominantly driven by interactions with
•OH. Due to its high electronegativity, F attracts electrons and can form bonds with Zn species supported on the zeolite surface, facilitating adsorption and reaction acceleration. In the initial phase of HSP process, hydrolysis leads to the cleavage of F and phosphate groups from the DXM molecule (C
22H
31FO
8P) [
29]. Subsequently,
•OH radicals targets the electron-rich methylene groups and double bonds within the molecular rings of DXM, initiating oxidative ring-opening reactions. This results in the formation of lower molecular weight intermediates such as C
11H
14O
5 and (C
10H
18O
4). Further decarboxylation and oxidation steps yield compounds including C
9H
16O
4, C
8H
16O
2, C
6H
14O
2, and C
4H
8O
3. The ultimate degradation products are acetic acid (C
2H
4O
2), formaldehyde (CH
2O), and carbon dioxide (CO
2) [
41], indicating a progressive reduction in molecular weight of the by-products during the photocatalytic reaction [
44].
4. Conclusions
In this study, the synthesis of a modified TiO2-Zn-clinoptilolite catalyst via the electrodeposition method and its application in HSP for the degradation of aqueous DXM and DXM-WW were evaluated.
The synthesis and application of TiO2-Zn(II)-ZC by the electrodeposition method successfully reduced the bandgap of TiO2, enabling the utilization of solar irradiation for the generation of e−/h+ pairs and reactive oxidative species such as •OH, H2O2, and O2•−, which facilitated the effective photodegradation of DXM and improved wastewater quality.
Multiple response optimization identified the optimal conditions in aqueous solution: 12.5 mg/L DXM, HRT of 60 min, and M/V ratio 1.0 mg/L, achieving maximum removal efficiencies: 88.71% DXM (HPLC), 85.29% COD, and 82.86% TOC, under conditions of 67 °C, 325.12 kJ/L accumulated energy, and 38.77 W/m2 incident radiation.
For DXM-WW enriched with 12.5 mg/L DXM, removal efficiencies reached 67.88% DXM (HPLC), 93.02% COD, and 92.38% TOC, with the biodegradability index increasing from 0.209 to 0.667, at 69.4 °C, 434.51 kJ/L, and incident radiation of 50.47 W/m2.
These results demonstrate that the catalyst synthetized TiO2-Zn(II)-ZC by electrodeposition was highly efficient in the removal DXM in aqueous solution and wastewater.

