Article

Effects of Drying Methods on Drying Characteristics and Physicochemical Quality of Turnip Slices (Brassica rapa L.)

1
College of Engineering, China Agricultural University, Beijing 100083, China
2
College of Mechanical and Electrical Engineering, Tarim University, Alar 843300, China
3
Department of Bioresource Engineering, McGill University, Ste. Anne de Bellevue, QC H3A 0G4, Canada
4
Department of Food Process Engineering, National Institute of Technology Rourkela, Rourkela 769008, India
*
Author to whom correspondence should be addressed.
Processes 2025, 13(9), 2773; https://doi.org/10.3390/pr13092773
Submission received: 27 July 2025 / Revised: 24 August 2025 / Accepted: 27 August 2025 / Published: 29 August 2025
(This article belongs to the Section Food Process Engineering)

Abstract

To identify the optimal drying methods for turnip slices, vacuum freeze-drying (VFD), air impingement drying (AID), infrared-assisted hot air drying (IR-HAD), and conventional hot air drying (HAD) were evaluated. The physicochemical properties of dried samples were comprehensively assessed under varied drying conditions. The results demonstrated that AID achieved the shortest drying time (240 min). At identical temperatures, AID samples exhibited significantly lower total color difference (ΔE) compared with IR-HAD and HAD, alongside superior retention of total phenols and enhanced antioxidant activity. VFD yielded the highest quality attributes, including optimal rehydration capacity, maximal phenol retention, and the strongest antioxidant activity (DPPH: 16.56 ± 0.26 μmol Trolox/g; FRAP: 13.99 ± 0.04 μmol Trolox/g). SEM analysis revealed that VFD produced a loose, porous microstructure, explaining its enhanced rehydration. Overall, both AID (efficiency) and VFD (quality) show promise for industrial turnip processing.

Graphical Abstract

1. Introduction

Turnip (Brassica rapa L.), a biennial herbaceous plant of the Brassicaceae family, is characterized by its globular roots and is cultivated worldwide. According to Food and Agriculture Organization (FAO) data, global turnip production reached 42.14 million tons in 2022, with China ranking first (18.68 million tons), followed by Uzbekistan (3.92 million tons), the United States (1.38 million tons), and Russia (1.36 million tons). In China, cultivation is primarily concentrated in Xinjiang and Tibet [1]. As a nutritious cruciferous vegetable, turnip is recognized as a traditional medicinal and edible homologous food [2,3,4]. Chemically, it is rich in dietary fiber, vitamin C, minerals, phenols, glucosinolates, and other bioactive components [5,6,7]. Pharmacological studies confirm its antioxidant, anti-diabetic, and anti-cancer properties [8,9,10], supporting its historical use in Chinese folk medicine for treating asthma, fatigue, cough, hypoxia, and other diseases [11,12].
Fresh turnips typically exhibit a high moisture content of approximately 92% (wet basis), rendering them prone to rapid germination and quality deterioration at ambient temperatures post-harvest. This degradation significantly compromises their nutritional value, pharmacological potential, and commercial viability [13]. To address these preservation challenges, drying technologies have been widely employed to reduce the moisture content to approximately 13% (wet basis), effectively inhibiting microbial growth and retarding deterioration reactions. Among the conventional drying methods, hot air drying (HAD) remains prevalent in fruit and vegetable processing due to its cost-effectiveness, utilizing convective heat transfer mechanisms. However, this method presents notable limitations, including prolonged drying duration, inferior product quality, and substantial nutrient degradation [14,15]. The factors affecting HAD mainly include drying temperature, wind velocity, and medium relative humidity [16]. Infrared drying offers distinct advantages in processing time reduction through rapid thermal energy transfer. Nevertheless, its efficacy is constrained by the material’s inherent optical properties and structural characteristics [17,18]. To optimize drying performance, hybrid systems combining infrared radiation with convective hot air have demonstrated synergistic effects, enhancing both processing efficiency and product quality [19,20]. Air impingement drying (AID) represents another advanced technique characterized by enhanced drying kinetics. This method employs high-velocity hot air jets directed at the material’s surface, creating a boundary layer that accelerates moisture removal [21]. Successful applications have been documented for various agricultural products including strawberry slices [22], kiwifruit [23], and American ginseng [24]. For premium quality preservation, vacuum freeze-drying (VFD) has emerged as a superior alternative. By facilitating direct sublimation of ice crystals under reduced pressure, VFD optimally maintains structural integrity, chromatic characteristics, and nutritional profiles [25]. This technology has been effectively implemented in the dehydration of apple slices [26], strawberries [27], carrot slices [28], and peach slices [29].
Given the significant nutritional and medicinal value of turnip and the critical need for drying, the quality and drying efficiency of dried turnip can be improved through appropriate drying technology. To find a feasible drying technology for turnip, the effects of different drying methods such as IR-HAD, AID, HAD, and VFD on the drying kinetics, physicochemical properties, and microstructure of turnip slices were explored in this work. The findings aim to establish a scientific foundation for turnip drying and provide practical insights for selecting appropriate drying methods to enhance product quality.

2. Materials and Methods

2.1. Raw Materials

Fresh turnips (Brassica rapa L.) were sourced from Alar, Xinjiang, China, and stored in the refrigerator (4 ± 1 °C) for no more than one week. In order to ensure the reliability of the results, turnips from the same batch with no mechanical damage and uniform size were selected for the experiment. Before the experiments, the turnips were removed from refrigerator and equilibrated to ambient temperature. Surface impurities were rinsed with tap water, and residual moisture was removed using tissue paper. The turnips were then uniformly sliced to dimensions of 5.0 ± 0.2 mm thickness and 40.0 ± 1.0 mm diameter. The initial moisture content of turnips was found to be 92.00% ± 0.85 (wet basis), which was estimated by vacuum drying at 70 °C for 24 h following the AOAC standard method [30].

2.2. Drying Experiments

Four distinct drying methods were employed in this study: HAD, AID, IR-HAD, and VFD. Prior to each drying experiment, the respective drying equipment was preheated to achieve stable operational conditions. Approximately 300 g of prepared turnip slices was evenly distributed on stainless steel wire mesh trays and loaded into the drying chambers. Throughout the drying process, sample weights were recorded at 30 min intervals until the moisture content reached the target value of <13% (wet basis). To ensure experimental reliability, all drying trials were conducted in triplicate. Schematic diagrams of the four drying systems are presented in Figure 1.

2.2.1. Hot Air Drying (HAD)

HAD experiments were conducted in a laboratory-scale electrically heated blast drying oven (DHG-9140A, Shanghai Yiheng Technology Co., Ltd., Shanghai, China). The samples were spread evenly in a single layer on a drying tray. The drying temperature was 60 °C, and the air velocity during the drying process was set to 1 m/s [31]. The schematic diagram of the HAD setup is shown in Figure 1a.

2.2.2. Air Impingement Drying (AID)

The second set of turnip drying experiments was carried out in the air impingement dryer. The AID experimental setup and its working principle have been described in detail by Liu et al. [32]. On the basis of preliminary experiments, the AID temperature was set at 60 °C, and the air velocity was set at 3 m/s. The structural sketch of the equipment is shown in Figure 1b.

2.2.3. Infrared Heating-Assisted Hot Air-Drying (IR-HAD)

The experiments were conducted using an infrared heating-assisted hot air dryer (STC Taizhou Senttech Infrared Technology Co., Ltd., Taizhou, China). The dryer’s details have been described in detail by Zhang et al. [33]. The dryer features 3 parallel infrared tubes uniformly distributed at the top of the drying chamber, with 18 annular airflow nozzles arranged in an array configuration above the infrared heating elements. On the basis of preliminary optimization trials, the operational parameters were set to a drying air temperature of 60 °C and an air velocity of 3 m/s, with an infrared lamp distance of 13 cm from the material’s surface. The schematic diagram of the dryer is shown in Figure 1c.

2.2.4. Vacuum-Freeze Drying (VFD)

Turnip slices were first pre-frozen at −50 °C for 3 h in a vacuum freeze-dryer (Model LGJ-25C, Sihuan Scientific Instrument Co., Ltd., Beijing, China), followed by VFD under the following conditions: cold trap temperature maintained at −50 °C, heating plate temperature set to 30 °C, and chamber pressure held at 20 Pa. The experimental setup is illustrated in Figure 1d.

2.3. Drying Characteristics

The weight loss of turnip slices during drying was recorded, and the moisture ratio (MR) at different time points was calculated using the following equation [34]
M R = M t M e M 0 M e
where M0 represents the initial moisture content on a dry basis (d.b.) of the material, in g/g; Mt is the moisture content (d.b.) at drying time t, in g/g; and Me indicates the equilibrium moisture content.
The drying rate (DR), representing the speed of moisture removal, was calculated using the following equation [35]
DR = M t 1 M t 2 t 2 t 1
where t1 and t2 are the drying times, in min; M t 1 and M t 2 are the dry basis moisture contents of the material at drying times t1 and t2, respectively, in g/g (d.b.).
The effective moisture diffusivity (Deff), describing the water removal capacity through diffusion, was calculated using Fick’s second law following Equation (3) [36]
MR = 8 π 2 exp π 2 D e f f r 2 t
where Deff stands for the effective moisture diffusivity, in m2/s; r is the volume equivalent radius of turnip slices, in m; and t is the drying time, in s. Deff could be calculated by the natural logarithm from through the following Equation (4):
ln   MR   =   ln 8 π 2 π 2 D e f f r 2 t
And the Deff could be obtained as shown in Equation (5)
D eff = r 2 π 2 k
where k is the slope value of the regression line between ln MR versus drying time.
The Weibull and Page models were subsequently used for fitting the drying kinetics of turnip slices according to Equations (6) and (7), respectively
MR = exp ( k t n )
MR = exp t α β
where t is the drying time, in h; n and k are the model constants; and α and β are the scale parameter and shape parameter, respectively.
The fit of the model between the predicted data and the experimental values was conducted by coefficient of determination (R2), root mean square error (RMSE), and reduced chi-square ( χ 2 ) tests, which were calculated by the following
R 2 = 1 i = 1 n M R p r e , i M R exp , i 2 i = 1 n M R p r e , i ¯ M R exp , i 2
χ 2 = i = 1 n M R p r e , i M R exp , i 2 n z
R M S E = 1 n i = 1 n M R p r e , i M R exp , i 2
where MRpre,i is the experimental values, MRexp,i is the predicted values, and n is the number of experiences.

2.4. Texture

The hardness of the turnips was determined by a texture profile analyzer (TA. XTPLUS/50, Stable Micro System, Surrey, UK). Each turnip slice was placed on a flat plate with a round hole in the center, and then a P/2 cylindrical probe was used to puncture the turnip at a test speed of 0.5 mm/s to a depth of 5 mm. Hardness was recorded from the maximum force fracturing of the sample [37].

2.5. Rehydration Ratio (RR)

Dried turnip slices were rehydrated following Zhou et al.’s method [38] with slight modifications. A 10 g sample was immersed in 200 mL of distilled water at 40 °C for 2 h, with the temperature maintained by a water bath. The rehydration ratio was calculated using Equation (11) [39]
R R = m 2 m 1
where RR is the rehydration ratio, in g/g; m1 and m2 are the mass of turnip slices before and after rehydration, respectively, in g.

2.6. Microstructure Measurement

Dried turnip samples were sectioned into 2 mm × 2 mm × 1 mm pieces with a scalpel, mounted on aluminum stubs using conductive adhesive, and gold-coated for 50 s in a vacuum with an ion sputter coater (E-1010, Hitachi, Tokyo, Japan). Surface morphology was observed by scanning electron microscopy (SEM) (SU3500, Hitachi, Japan) at a 10 kV accelerating voltage at 100×, 200×, and 300× magnifications.

2.7. Color Measurement

The colorimetric values (L*, a*, b*) of turnip slices were measured using a LabScan XE spectrophotometer. The total color difference (ΔE*) between the dried and fresh turnip samples was calculated by Equation (12) [40]
Δ E * = ( L 0 * L * ) 2 + ( a 0 * a * ) 2 + ( b 0 * b * ) 2
where L* represents the lightness value, a* represents the redness/greenness value, and b* represents the yellowness/blueness value; L0*, a0*, and b0* represent the color parameters of the fresh turnip slices, respectively.

2.8. Determination of Total Phenolic Content (TPC)

Extractions were prepared following Zhou et al. [38] with modifications. Briefly, 0.6 g (±0.01 g) of the pulverized sample was mixed with 10 mL of 70% (v/v) ethanol and ultrasonicated for 30 min (in triplicate). After centrifugation (10,000× g, 4 °C, 10 min), supernatants were collected as extracts. TPC was determined using the Folin–Ciocalteu method [41]. Specifically, 1 mL of the extract was mixed with 1 mL of Folin–Ciocalteu reagent and 4 mL of distilled water and incubated for 5 min (dark, room temperature), followed by the addition of 4 mL 10% Na2CO3 and 60 min incubation (dark). Absorbance was measured at 750 nm using a spectrophotometer (TU-1810, Beijing Purkinje General Instrument Co., Ltd., Beijing, China). TPC was expressed as gallic acid equivalents per gram of dry weight (GAE, mg/g DW).

2.9. Antioxidant Capacity Determination

Antioxidant capacity was evaluated using two methods: (1) DPPH radical scavenging activity, and (2) ferric reducing antioxidant power (FRAP). The extraction followed the same protocol as phenolic compounds. The results were expressed as μmol Trolox equivalents (TE/g DW), with triplicate determinations.
DPPH scavenging activity was determined following Brand-Williams et al. [42] with modifications. Briefly, each sample extract was mixed with a 0.1 mM DPPH solution and incubated in the dark (30 min, room temperature), and the absorbance was measured at 517 nm using a spectrophotometer (TU-1810, Beijing Purkinje General Instrument Co., Ltd.).
For the FRAP assay [36], the sample extract was mixed with 10 mM TPTZ, 0.1 M acetate buffer (pH 3.6), and 20 mM FeCl3 (10:1:1, v/v/v), then incubated at 37 °C in the dark for 30 min. Absorbance was measured at 593 nm using a spectrophotometer (TU-1810, Beijing Purkinje General Instrument Co., Ltd.).

2.10. Statistical Data Analysis

The experimental data were statistically analyzed and compared by ANOVA and Duncan’s multiple range test using SPSS statistical software (version 26.0, IBM Corp., Armonk, NY, USA). The results on drying and quality are presented as the mean ± standard deviation (SD) of three determinations. Statistical significance was set at the 5% probability level (p < 0.05).

3. Results and Discussion

3.1. Drying Characteristics Analysis

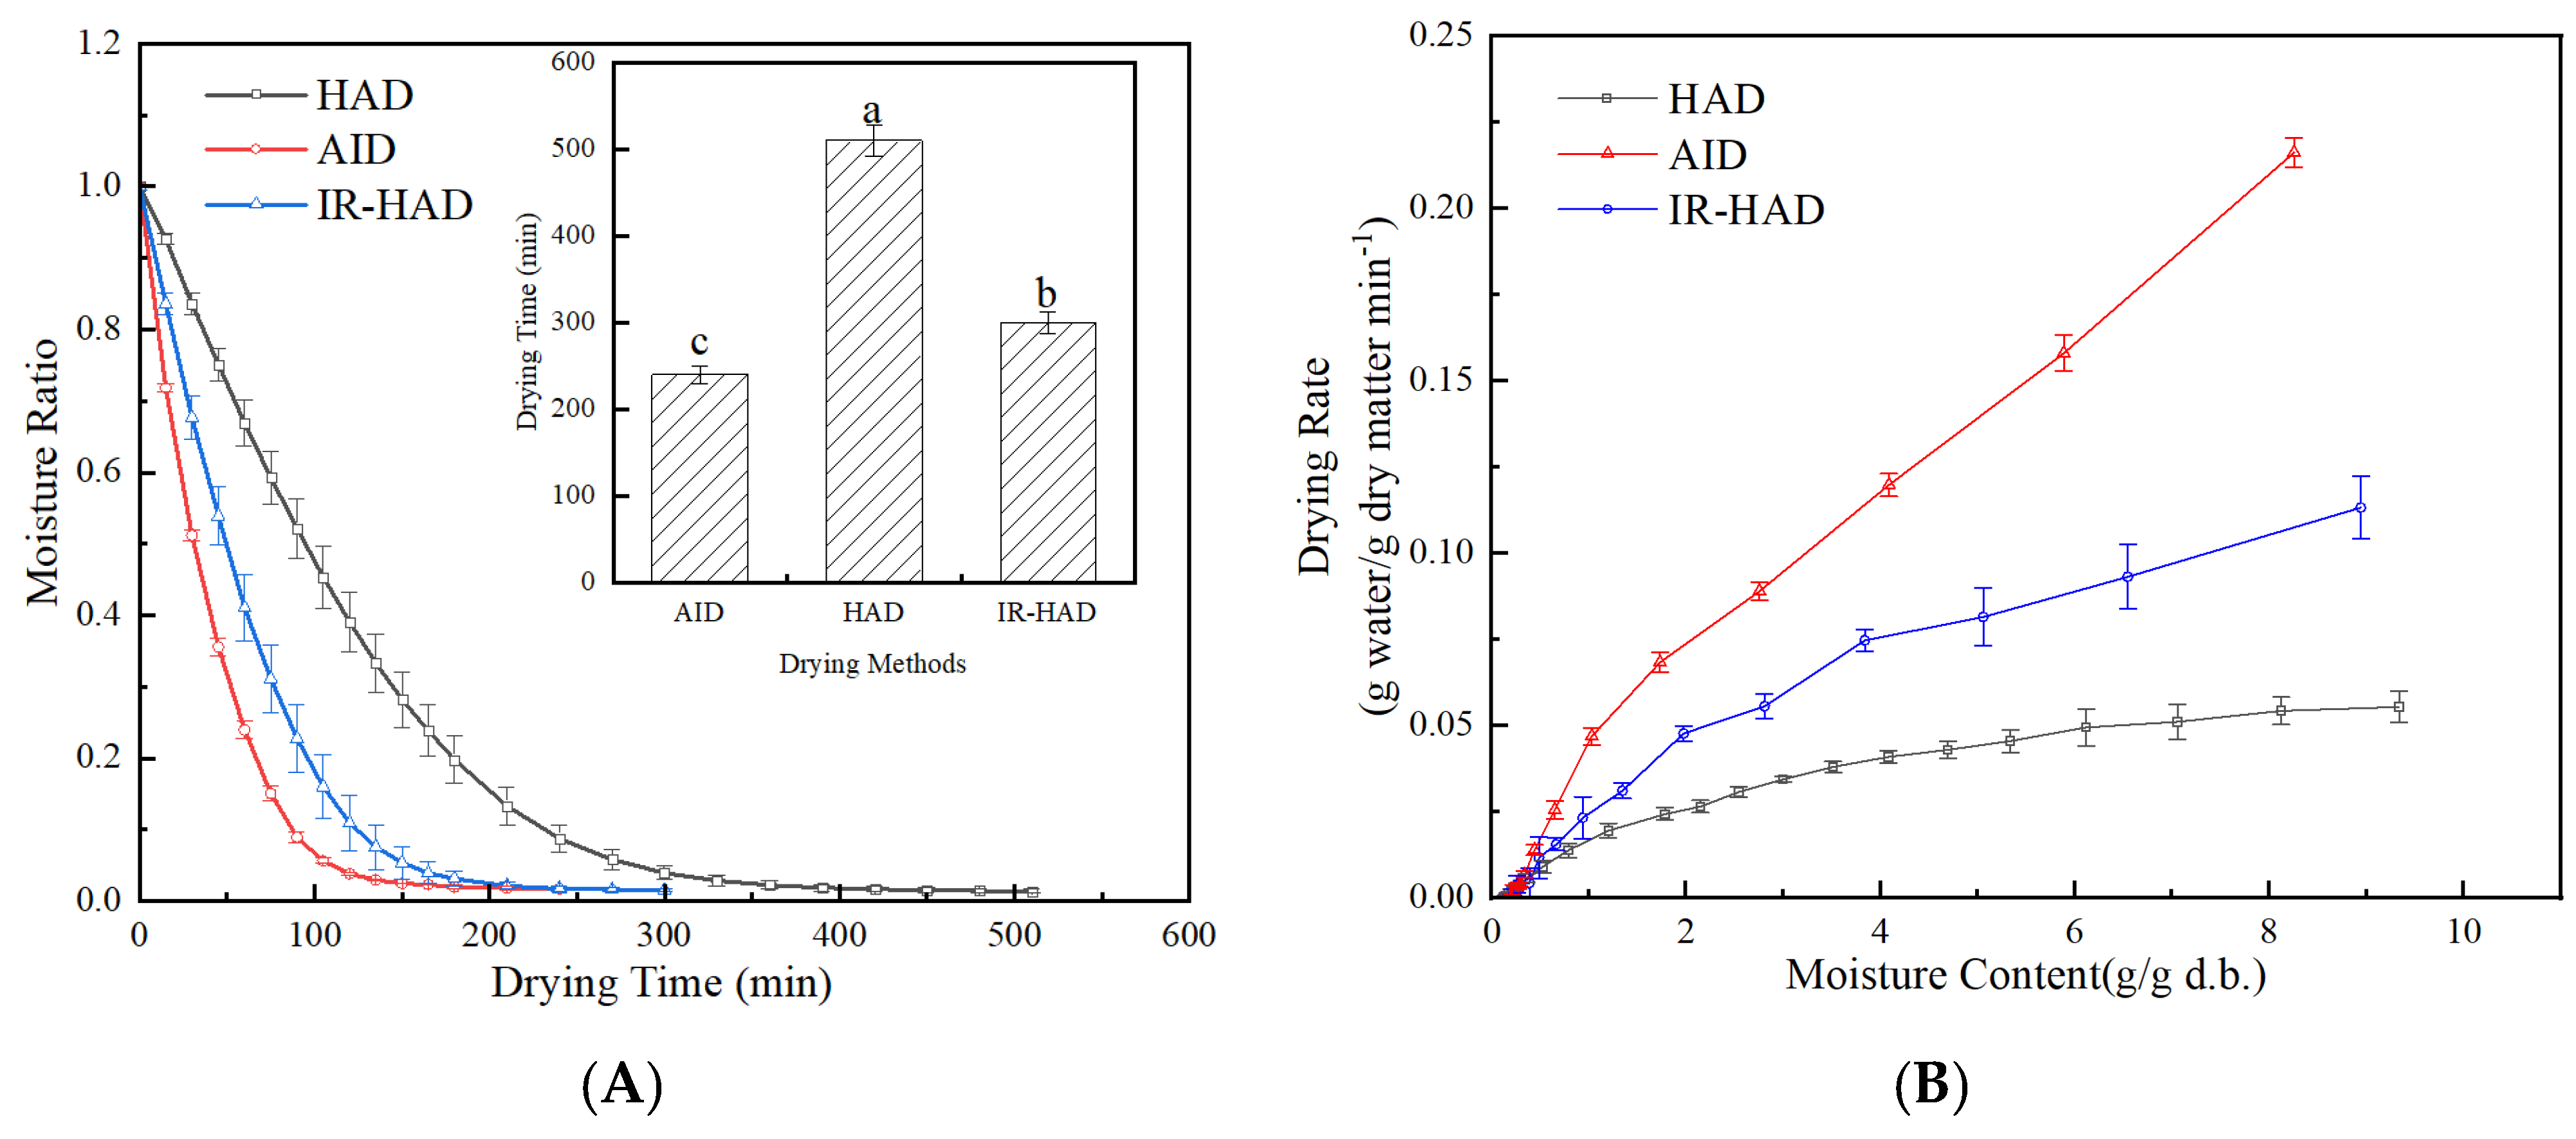
The effects of various drying techniques on the moisture content and drying rate curves of turnip slices dried at 60 °C are shown in Figure 2. As expected, the moisture content decreased with the extension of drying time, which was simulated by the Weibull and Page models. As shown in Table 1, the predicted data fit well with the experimental data, with high R2 (0.9988~0.9994) and low χ2 (0.5954 × 10⁻⁴~1.08444 × 10⁻⁴) and RSEM (0.11 × 10⁻²~0.14 × 10⁻²) values. Figure 2A demonstrates that the different drying methods had a significant (p < 0.05) effect on the time required to reach the final moisture content. The drying times of HAD, AID, and IR-HAD were 510 min, 240 min, and 300 min, respectively. HAD required the longest drying time (510 min), while AID showed the shortest drying time (240 min). Compared with HAD and IR-HAD, the drying times of AID were shortened by 52.9% and 20%, respectively. This was mainly due to the high air velocity, short air flow, and thin boundary layer between the surface of the material and the air, which usually has a high convective heat transfer coefficient [43]. For the AID of turnips, the rapid airflow and high convective heat transfer coefficient enabled more efficient heat transfer in a shorter time, thereby promoting faster water evaporation. Generally, shorter drying times are associated with lower energy consumption. As an energy-intensive industrial process, drying accounts for approximately 7–15% of total industrial energy use [36]. Therefore, a comprehensive evaluation of drying technologies should explicitly incorporate energy efficiency considerations. Future research should prioritize the development of strategies to enhance energy efficiency in drying processes, thereby contributing significantly to energy conservation and carbon emission reduction in industrial operations.
Deff, a function of the moisture content at the same temperature, reflects the dehydration ability of the material under drying conditions. Deff values are assumed to be constant at a given temperature, even though they in fact vary with moisture content. As presented in Table 1, the effective moisture diffusivity values for AID, IR-HAD, and HAD were 4.863 × 10⁻⁸, 4.068 × 10⁻⁸, and 4.863 × 10⁻⁸ m2/s, respectively. These results align with the general principle of dehydration, where lower effective moisture diffusivity corresponds to longer drying times.
For the Weibull model, the scale parameter (α) of AID was significantly lower (p < 0.05) than that of HAD at a drying temperature of 60 °C. The α value decreased from 124.035 in HAD to 42.618 in AID, indicating a shorter drying time. The shape parameter (β) reflects the drying rate during the initial stage, with a lower β value corresponding to a higher initial drying rate. As shown in Table 1, the β values for AID, IR-HAD, and HAD were 1.099, 1.234, and 1.269, respectively, suggesting that AID had the highest initial drying rate. This result is consistent with the drying kinetic curve presented in Figure 2.
For the Page model, the n values exceeded 1 across all drying methods, suggesting the occurrence of super-diffusion behavior. The k value of AID was significantly higher (p < 0.05) than that of IR-HAD and HAD. Since the k value represents the initial drying rate, a larger k corresponds to a faster drying rate at the beginning stage.
The relationship between the drying rate and moisture content of turnip slices under different drying methods is shown in Figure 2B. At the identical drying temperature (60 °C), AID demonstrated a significantly higher drying rate than both IR-HAD and HAD (p < 0.05). Throughout the drying process, the drying rate progressively decreased with reducing moisture content. The entire drying process of turnip slices occurred in the falling rate period, indicating that internal water diffusion dominated the process [19]. In AID drying, the drying rate peaked during the initial stage owing to the rapid airflow impinging on the material surface, which promoted substantial moisture loss [44]. However, during the later drying stage, IR-HAD exhibited a higher drying rate than AID. This phenomenon primarily occurred because infrared radiation could penetrate the material’s surface during IR-HAD, providing additional driving force for internal moisture migration and thereby accelerating moisture transfer [45]. Consequently, while the total drying times for AID and IR-HAD were comparable, their drying rate profiles differed substantially across various drying stages.

3.2. Rehydration Ratio and Texture

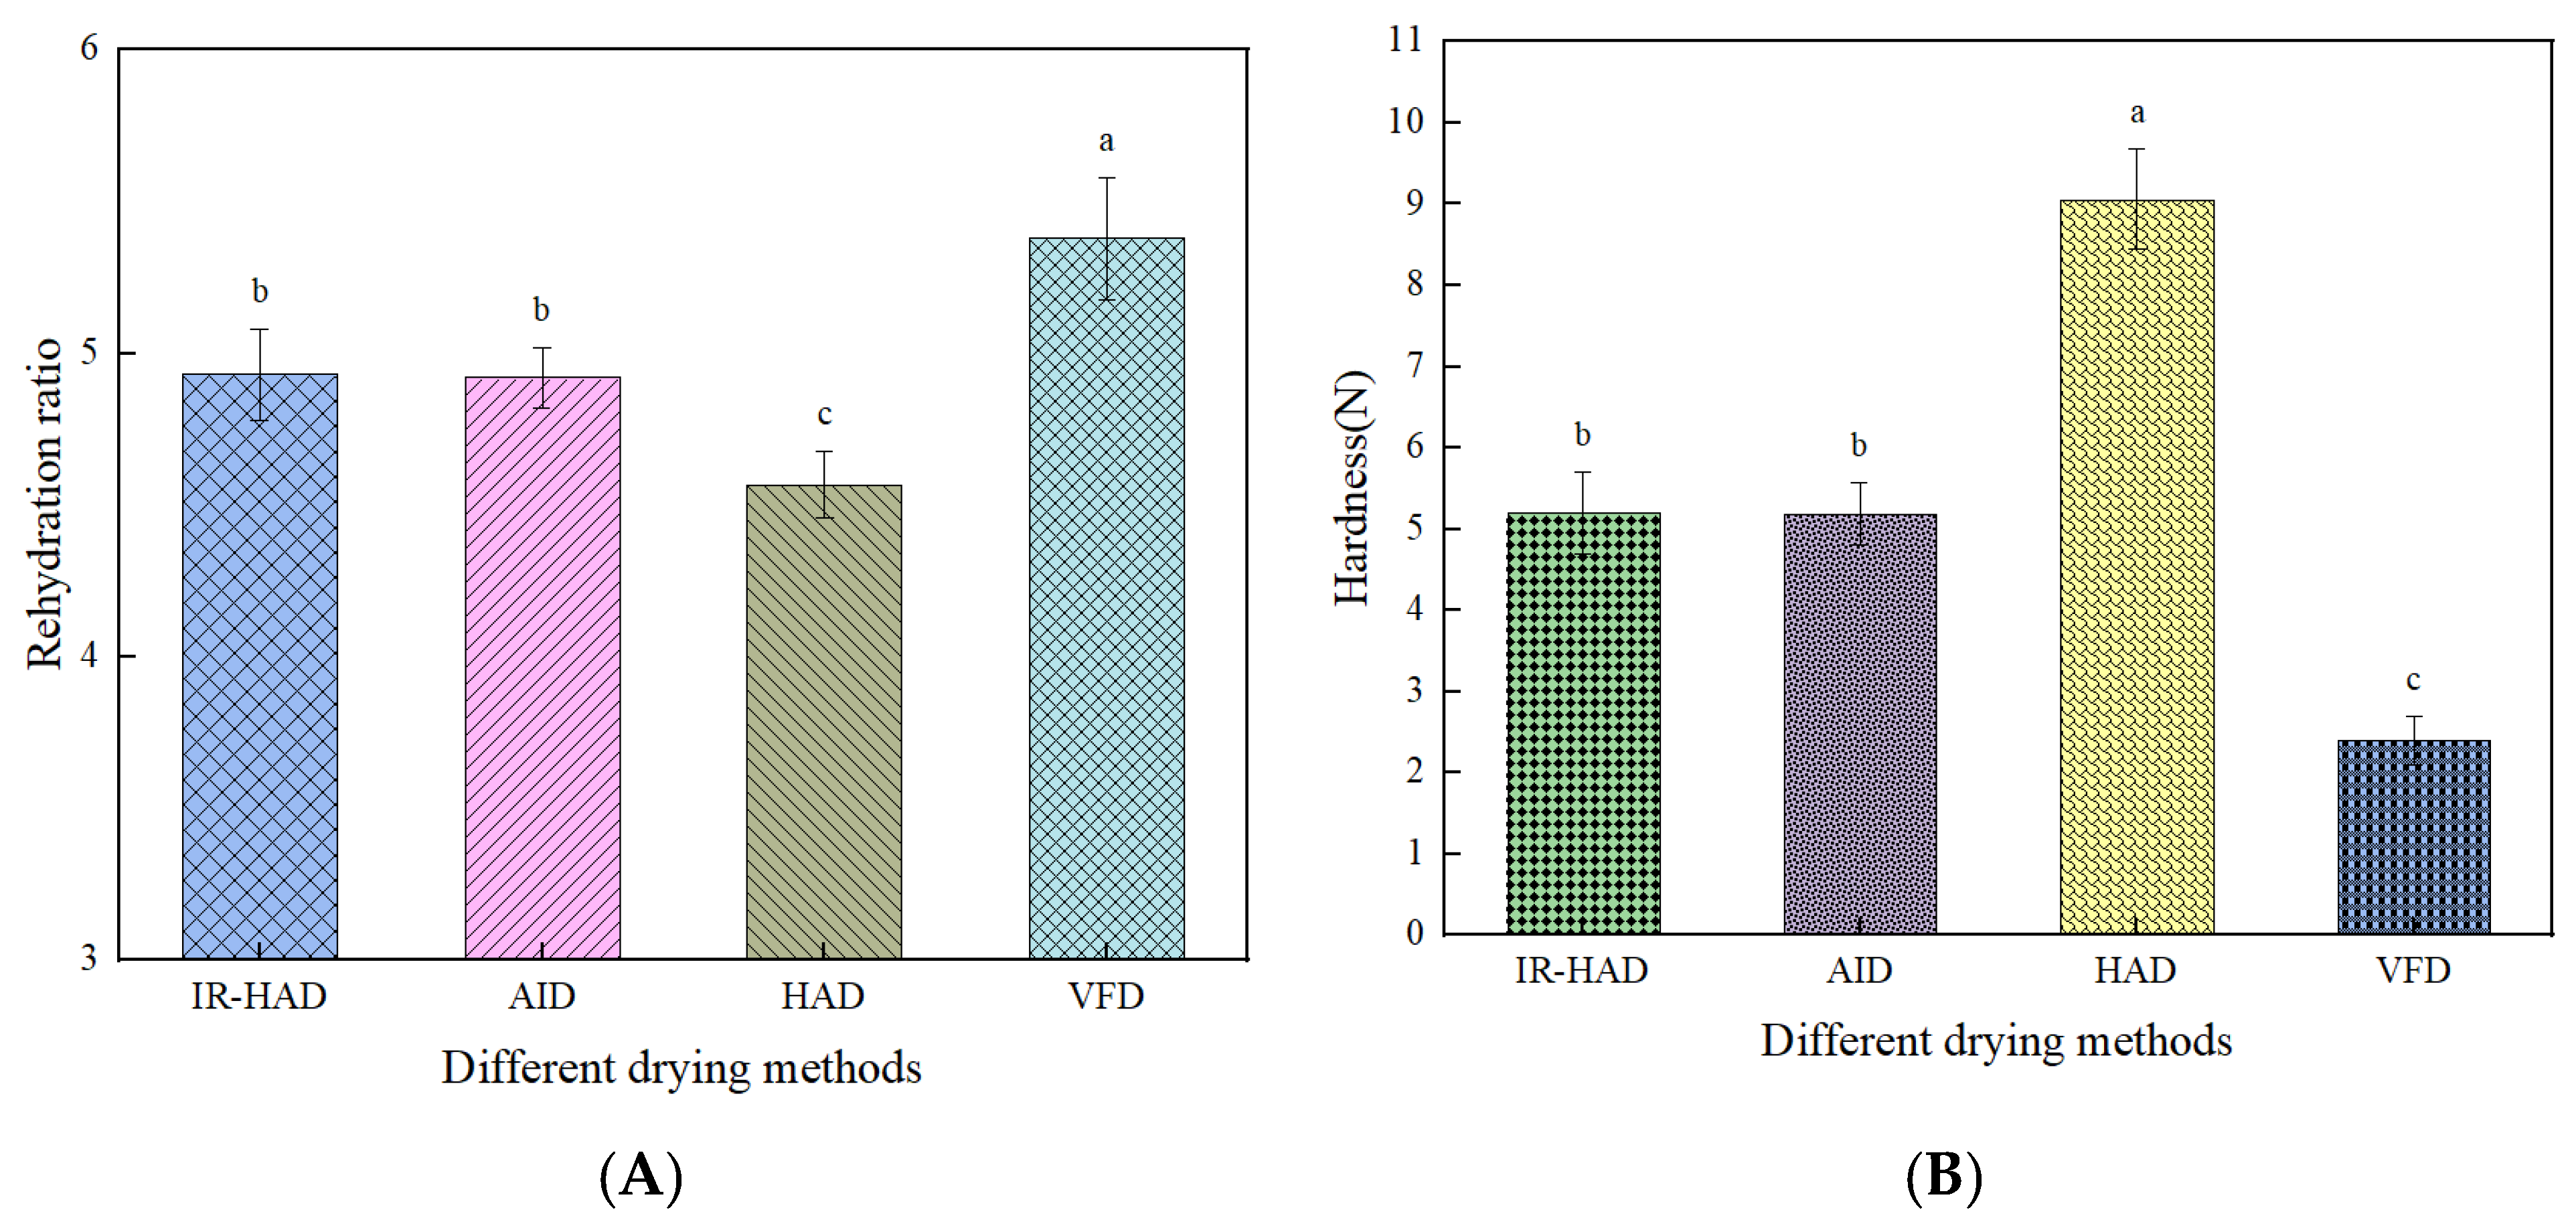
Rehydration capacity, defined as the degree to which dried products regain their original fresh state upon rehydration, serves as a crucial indicator reflecting structural changes in the product [46]. A higher rehydration ratio corresponds to less structural damage in the dried product and consequently better product quality [47]. As shown in Figure 3A, the rehydration rate of turnip slices varied significantly among different drying methods. VFD-treated turnip slices exhibited the highest rehydration rate, while AID and IR-HAD showed comparable rehydration capacities. HAD samples demonstrated the lowest rehydration capacity. The vacuum and freeze-drying environment better preserved the microstructure of turnip slices, forming a stable solid matrix that maintained the original cellular structure. This structural integrity allowed for more efficient water reabsorption [48]. The freeze-drying process created a porous, well-organized structure that significantly enhanced rehydration ability. In contrast, the other three drying methods caused varying degrees of structural collapse in turnip slices, thereby impeding water absorption. Among these, HAD showed the most severe structural damage and lowest rehydration capacity, which can be attributed to its prolonged drying duration.
Texture is a physical property determined by the composition and microstructure of turnip, and the drying method has a great influence on the texture [32]. The hardness of the sample after drying by different drying methods is shown in Figure 3B. It can be seen that different drying methods have a significant effect on the hardness of turnip slices (p < 0.05). The hardness of HAD samples was the largest (9.06 ± 0.62 N). The analysis may be due to the long drying time, the serious collapse of tissue cells, and the surface being crusted by continuous heat. After VFD, turnips had the lowest hardness (2.39 ± 0.77 N) due to the moisture sublimating during the freeze-drying process, forming a loose and porous structure [49]. Those with strong rehydration capacity had the lowest hardness, and those with weak rehydration capacity had the highest hardness.

3.3. Microstructure by SEM

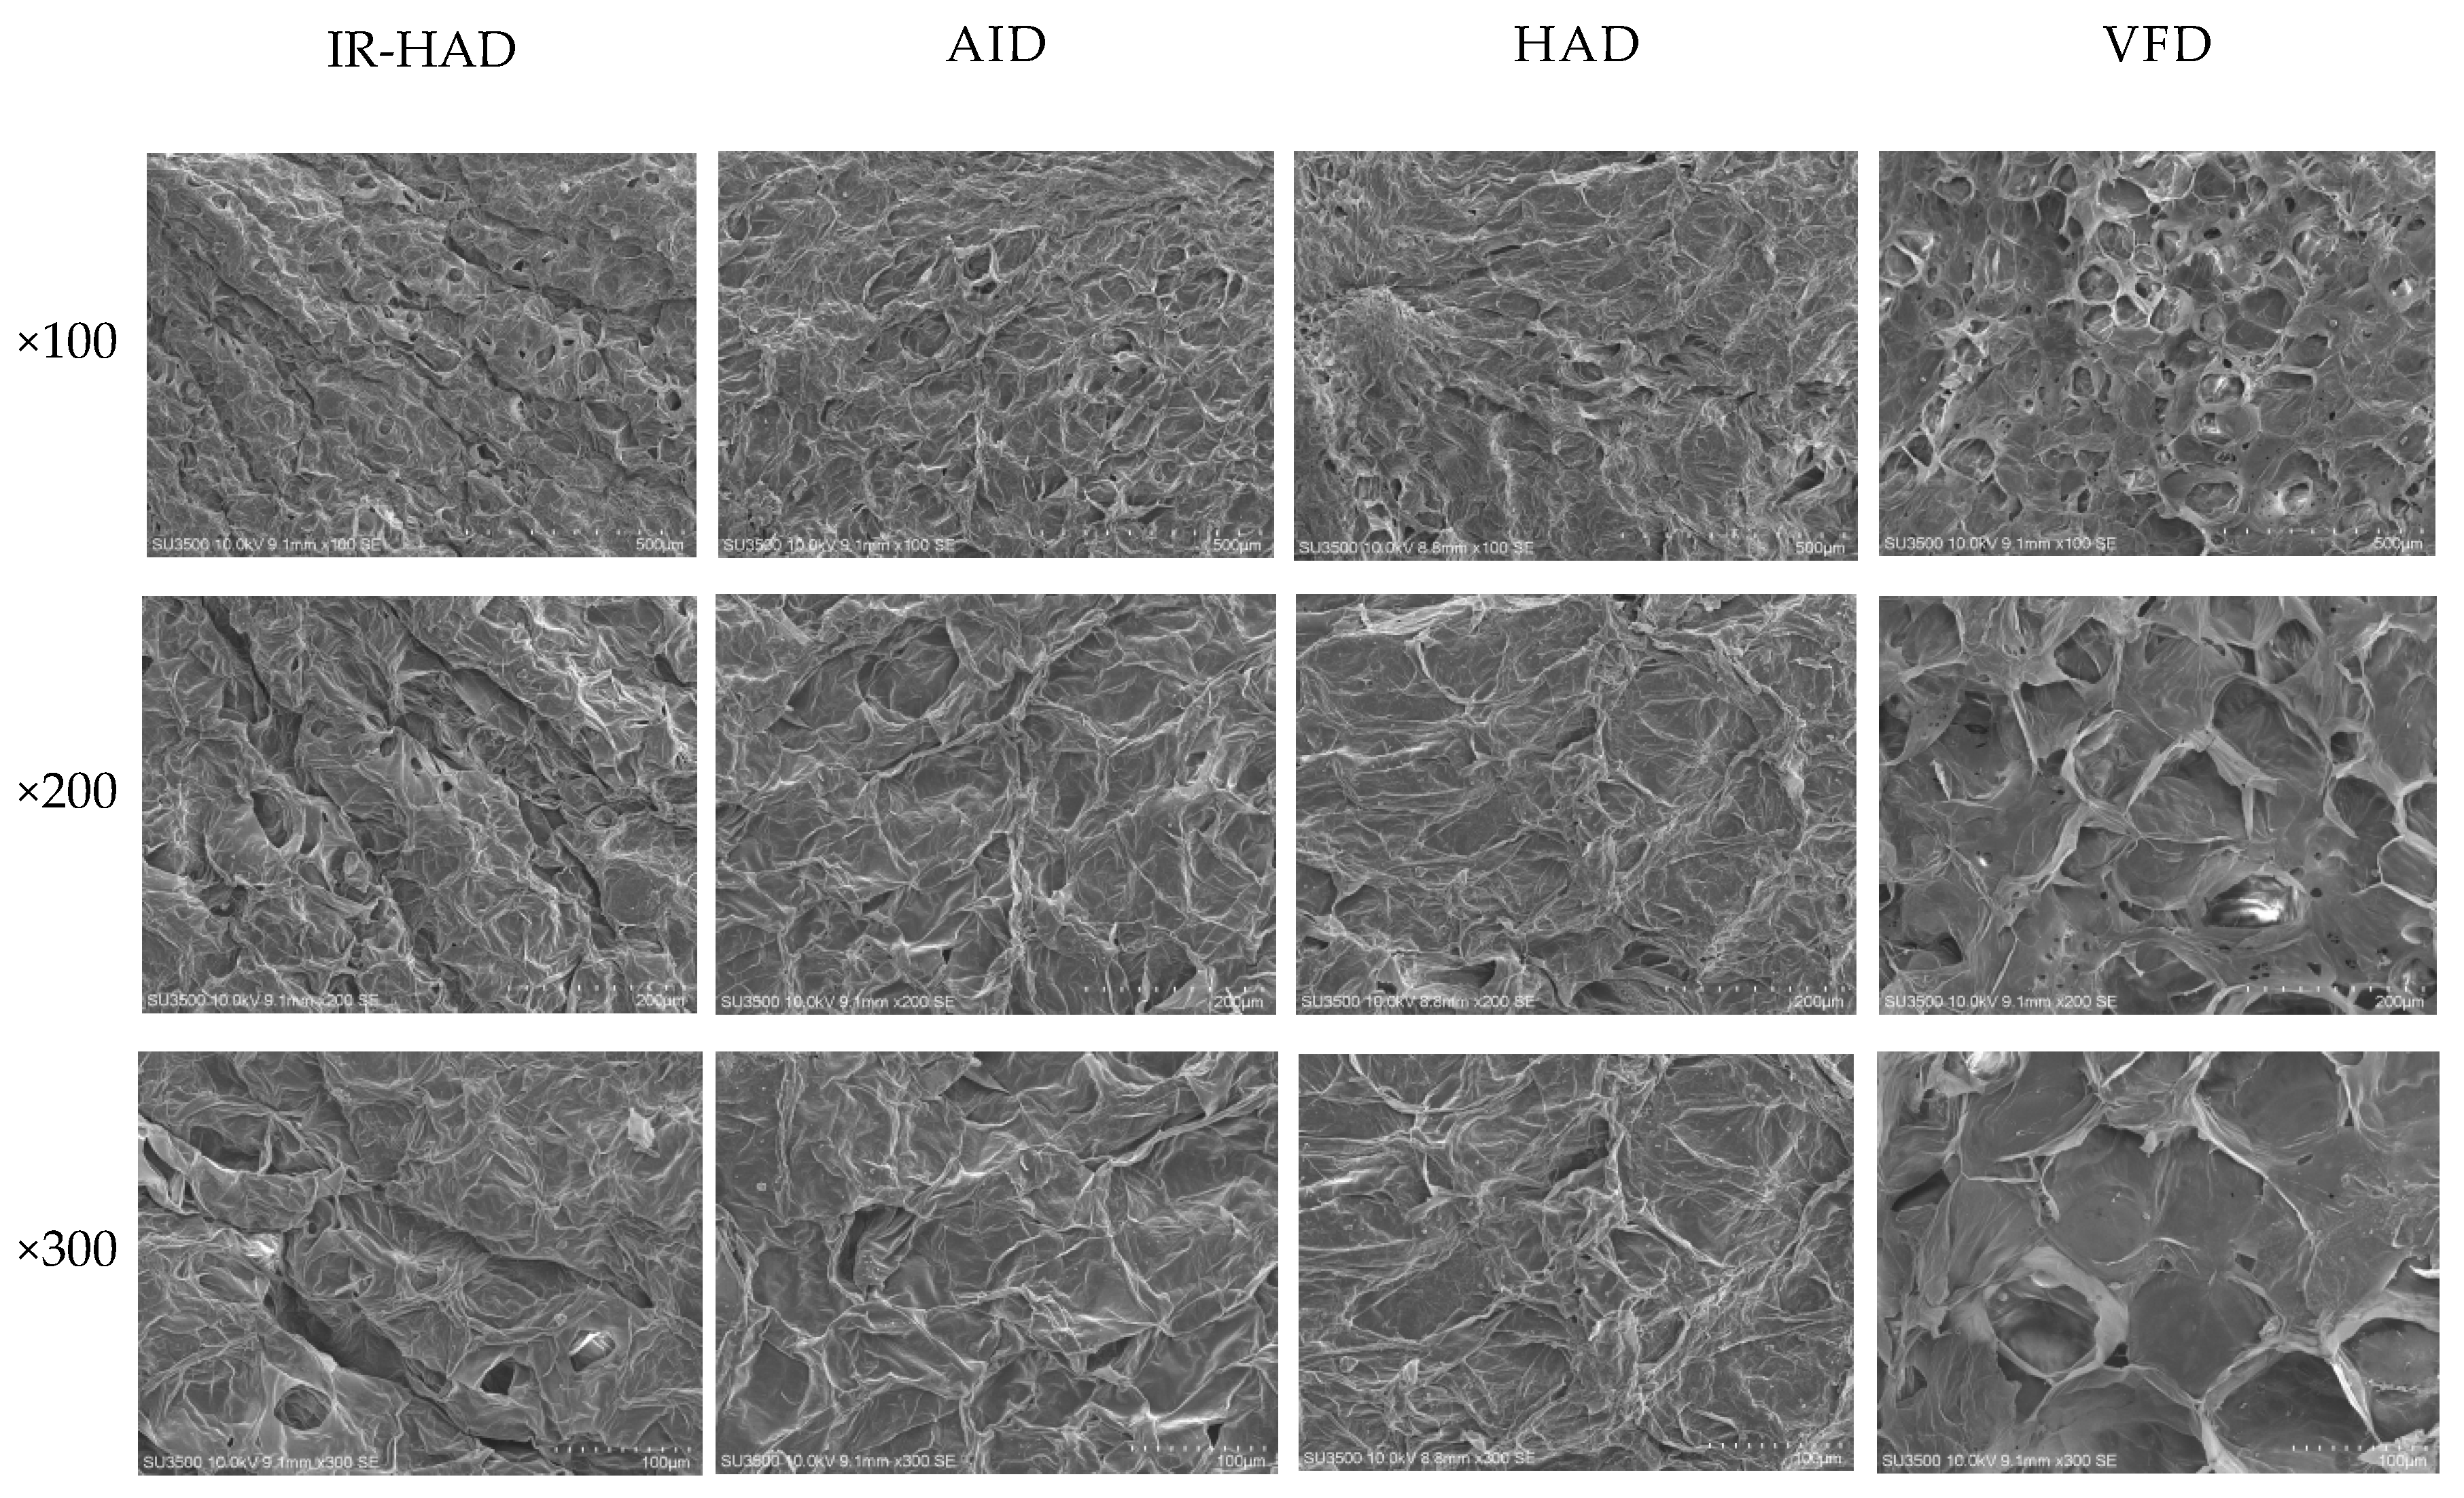
Microstructure can reflect the quality of dried products. The microstructure analysis can help us to understand the mechanism of mass change of the material at the cellular level, thereby improving the drying performance [50]. The SEM images of turnip slices were obtained to explore the effect of different drying methods on the microstructure, as shown in Figure 4. The changes in microstructure were mainly manifested in the size and uniformity of microcracks, holes, and cavities. There was crusting on the surface of hot air-drying materials—which may be due to the long drying time—the cell wall was seriously damaged, the pore structure in the drying process was seriously collapsed, and the surface pores disappeared. Li et al. [31]. discovered a similar phenomenon, observing that the tissue cells of Cistanche deserticola were damaged severely at a 60 °C drying temperature. There were apparent folds on the surface of the turnip after IR-HAD, which may be due to the fact that the energy of infrared radiation was absorbed by the surface. The moisture on the surface of a turnip slice evaporates rapidly. The internal moisture migration speed was much smaller than the speed of surface water evaporation, thus forming folds on the surface. After VFD, the structure of the turnip slices collapsed slightly, a relatively intact cell structure was retained, and the pore size was similar and evenly distributed. This was because the sublimation of water from a solid state to a gaseous state in freeze-drying did not destroy the complete structure of the cell, so the microstructure was loose and porous. This is also why turnip chips were less hard and had higher rehydration capacity after VFD.

3.4. Color

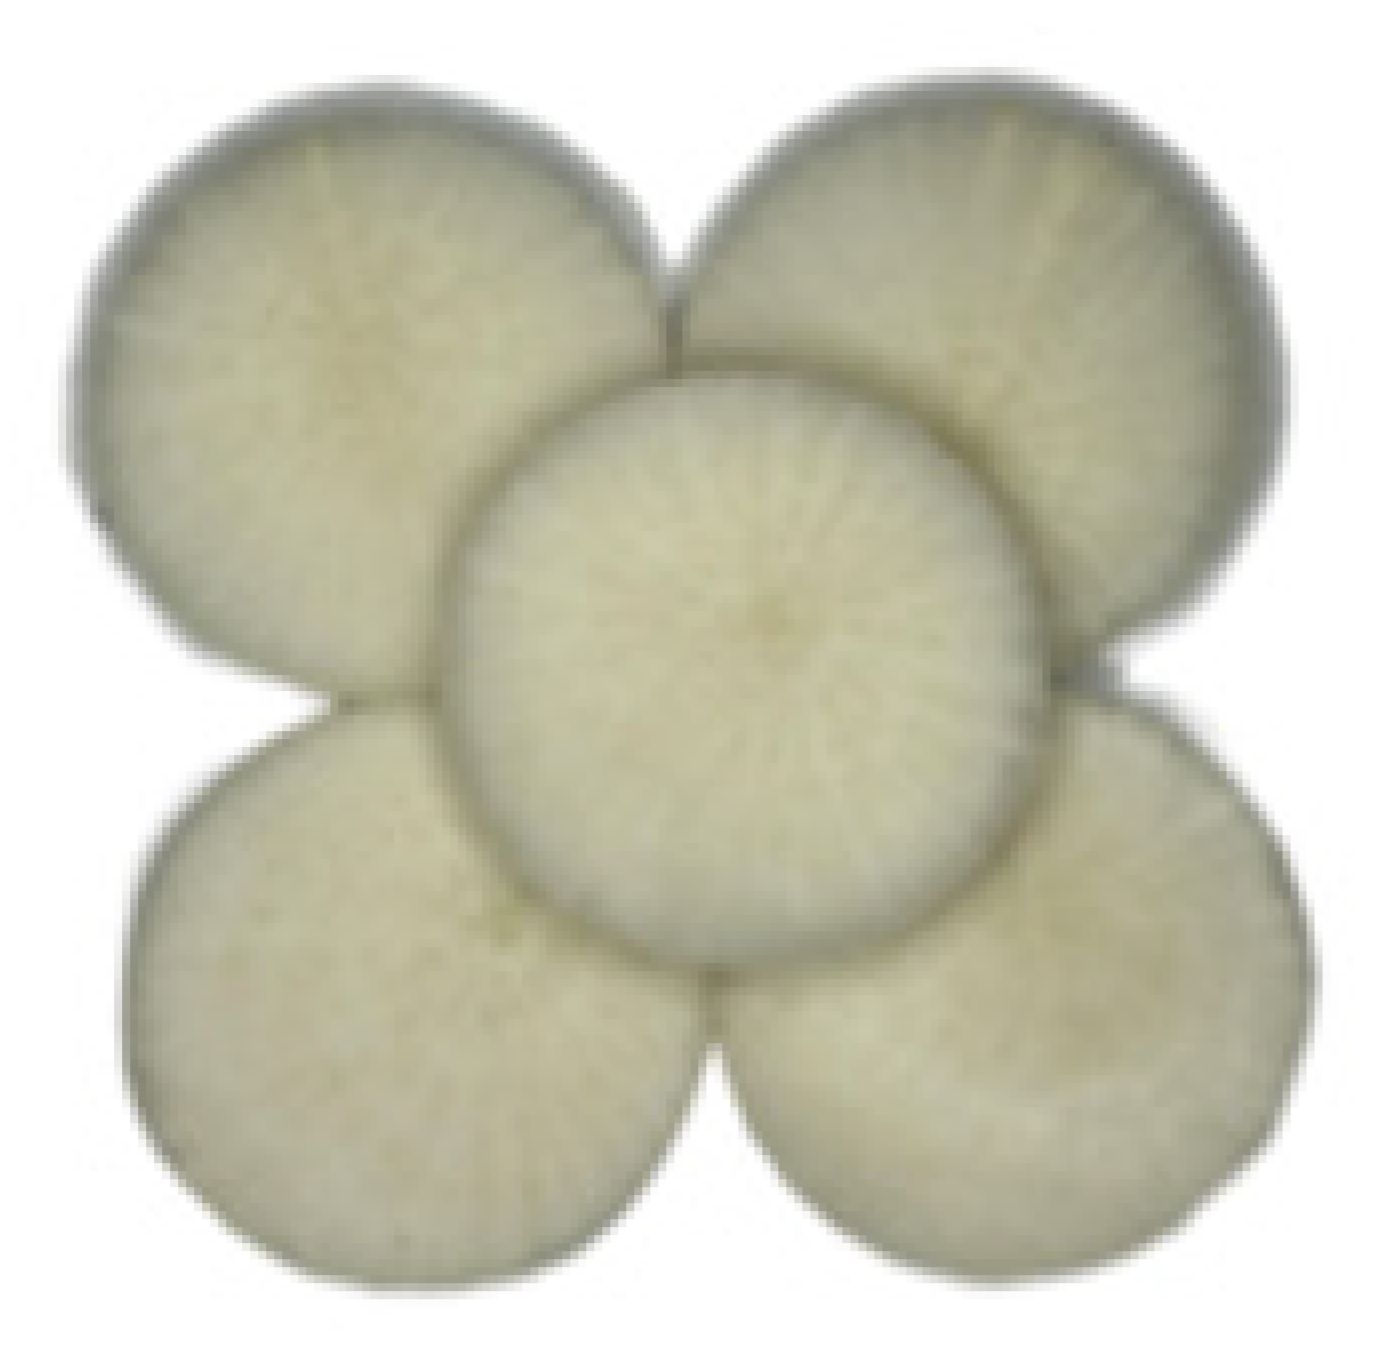
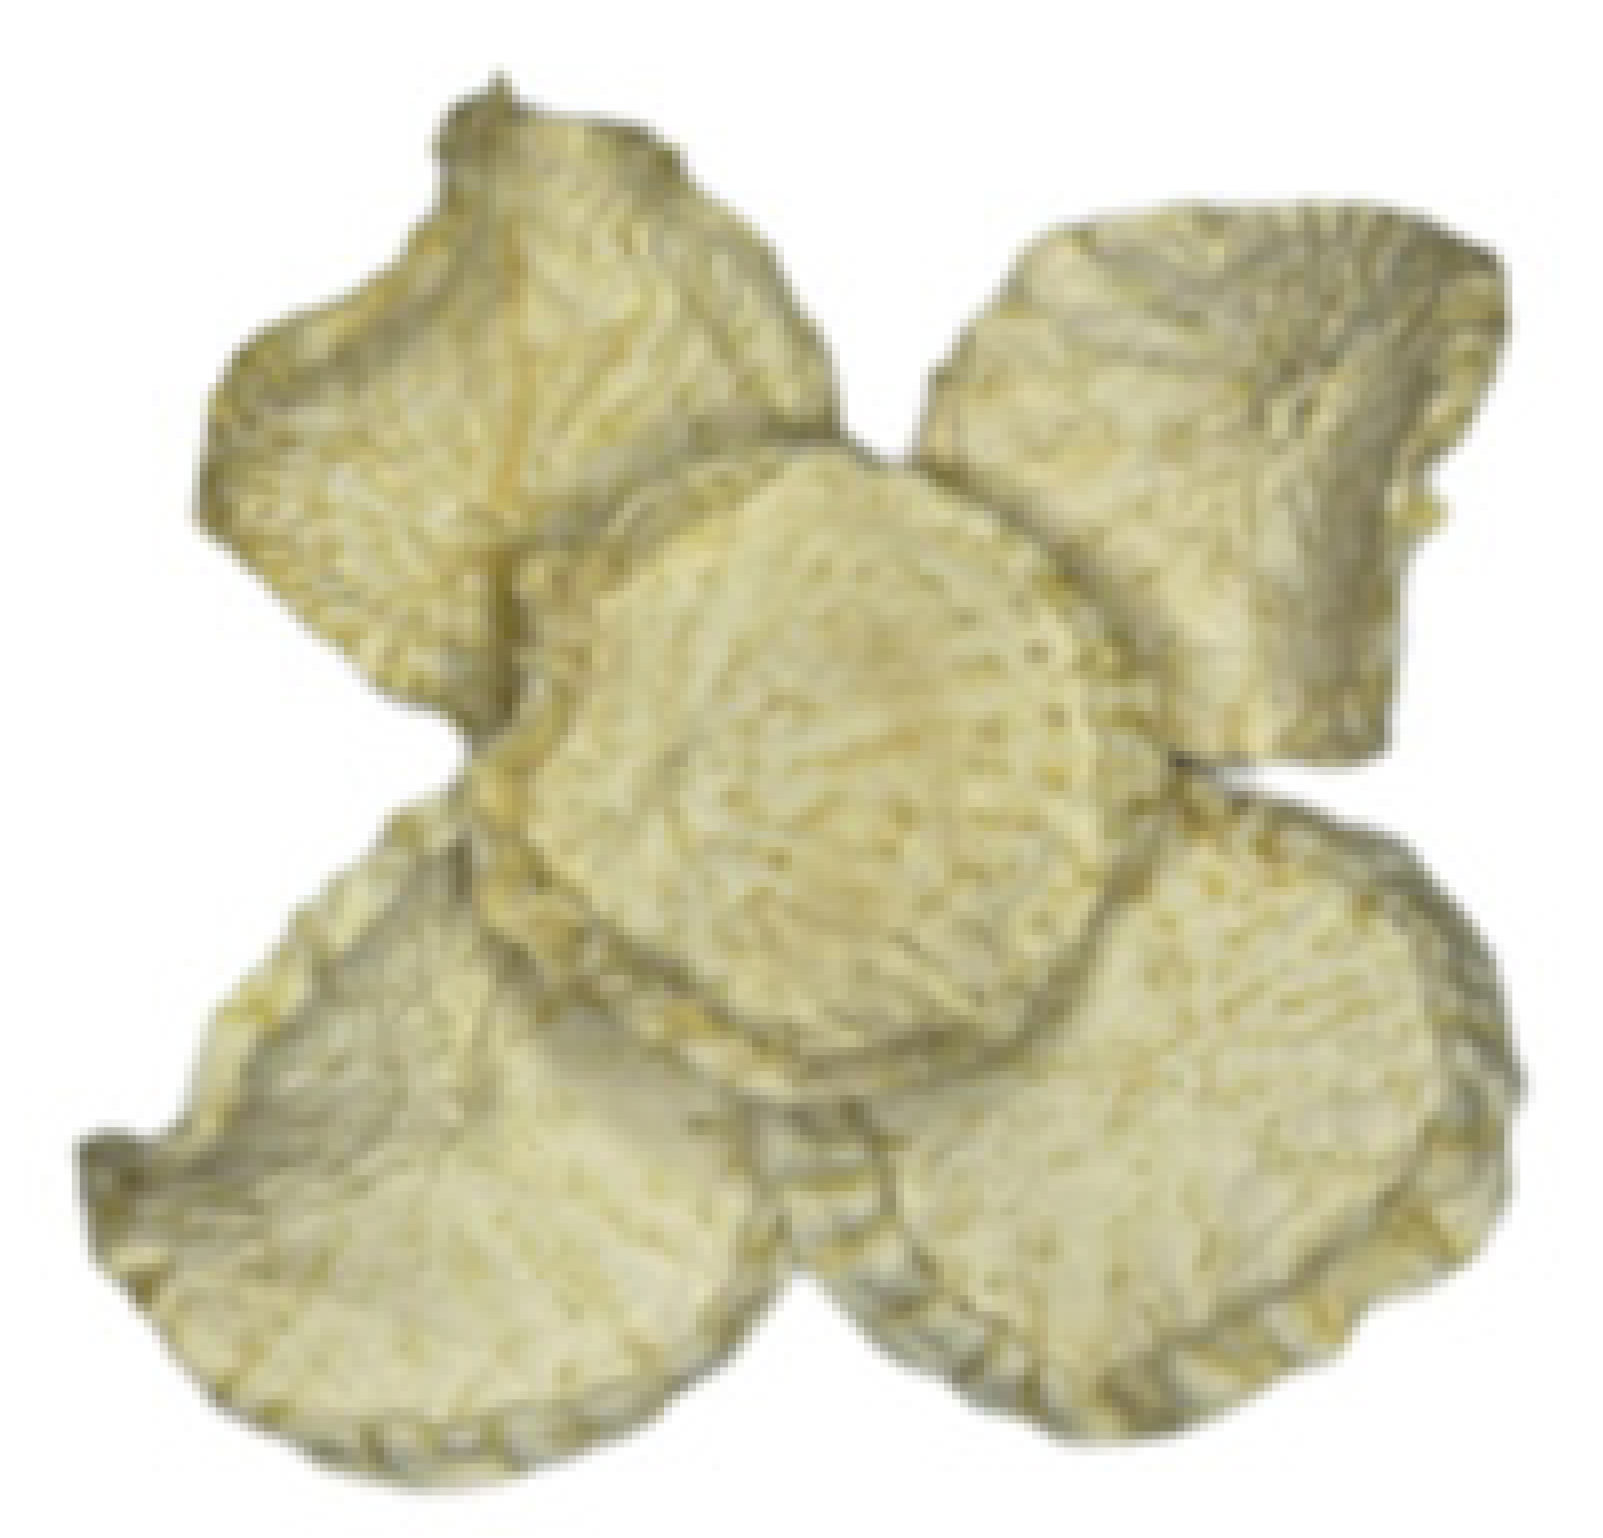
Color is an important index used to evaluate the quality of dry products, and it has an important impact on the market value and consumption choice of products [51,52]. The values of L*, a*, b*, and ΔE, along with the corresponding images for different drying methods, are presented in Table 2. After VFD drying, the L* value was the highest and the b* value was the lowest compared with the other samples. This may be due to the drying environment being at a low temperature under vacuum freezing, which can inhibit the occurrence of browning and the Maillard reaction, and VFD improving the brightness and whiteness of turnip slices. Similar results have been reported for garlic drying by Zheng et al. [53], who found that the lightness value of garlic slices increased from 79.36 ± 0.68 to 91.57 ± 0.41. IR-HAD samples showed the lowest L* (85.24 ± 1.18), highest b* (15.22 ± 0.69), and highest ΔE values (14.98 ± 0.64). This resulted from infrared radiation damaging the surface structure, as evidenced by microstructural analysis. The uneven moisture distribution between internal and external regions, combined with sustained high surface temperatures, accelerated browning reactions. Bondaruk et al. [54] found that when the ΔE value is greater than 5, the change in color is noticeable to the observer. The higher the ΔE value, the greater the color change during the drying process. The ΔE values of IR-HAD and HAD were both greater than 5, which were 14.98 ± 0.64 and 10.24 ± 0.83, respectively, indicating that the color after drying changed significantly (p < 0.05). The ΔE values of VFD and AID were less than 5, which were 2.88 ± 0.26 and 4.96 ± 0.43, respectively, indicating that the VFD and AID samples were close to the color of fresh turnip slices.
The images in the table demonstrate that VFD-treated turnips exhibited minimal shrinkage and deformation, whereas other thermal drying methods caused significant structural changes in the samples. This phenomenon occurs because thermal drying induces rapid surface water evaporation, while internal moisture migration cannot keep pace with surface water loss. Consequently, the resulting surface shrinkage generates stress that leads to substantial shape alteration [53].

3.5. Total Phenolic Content

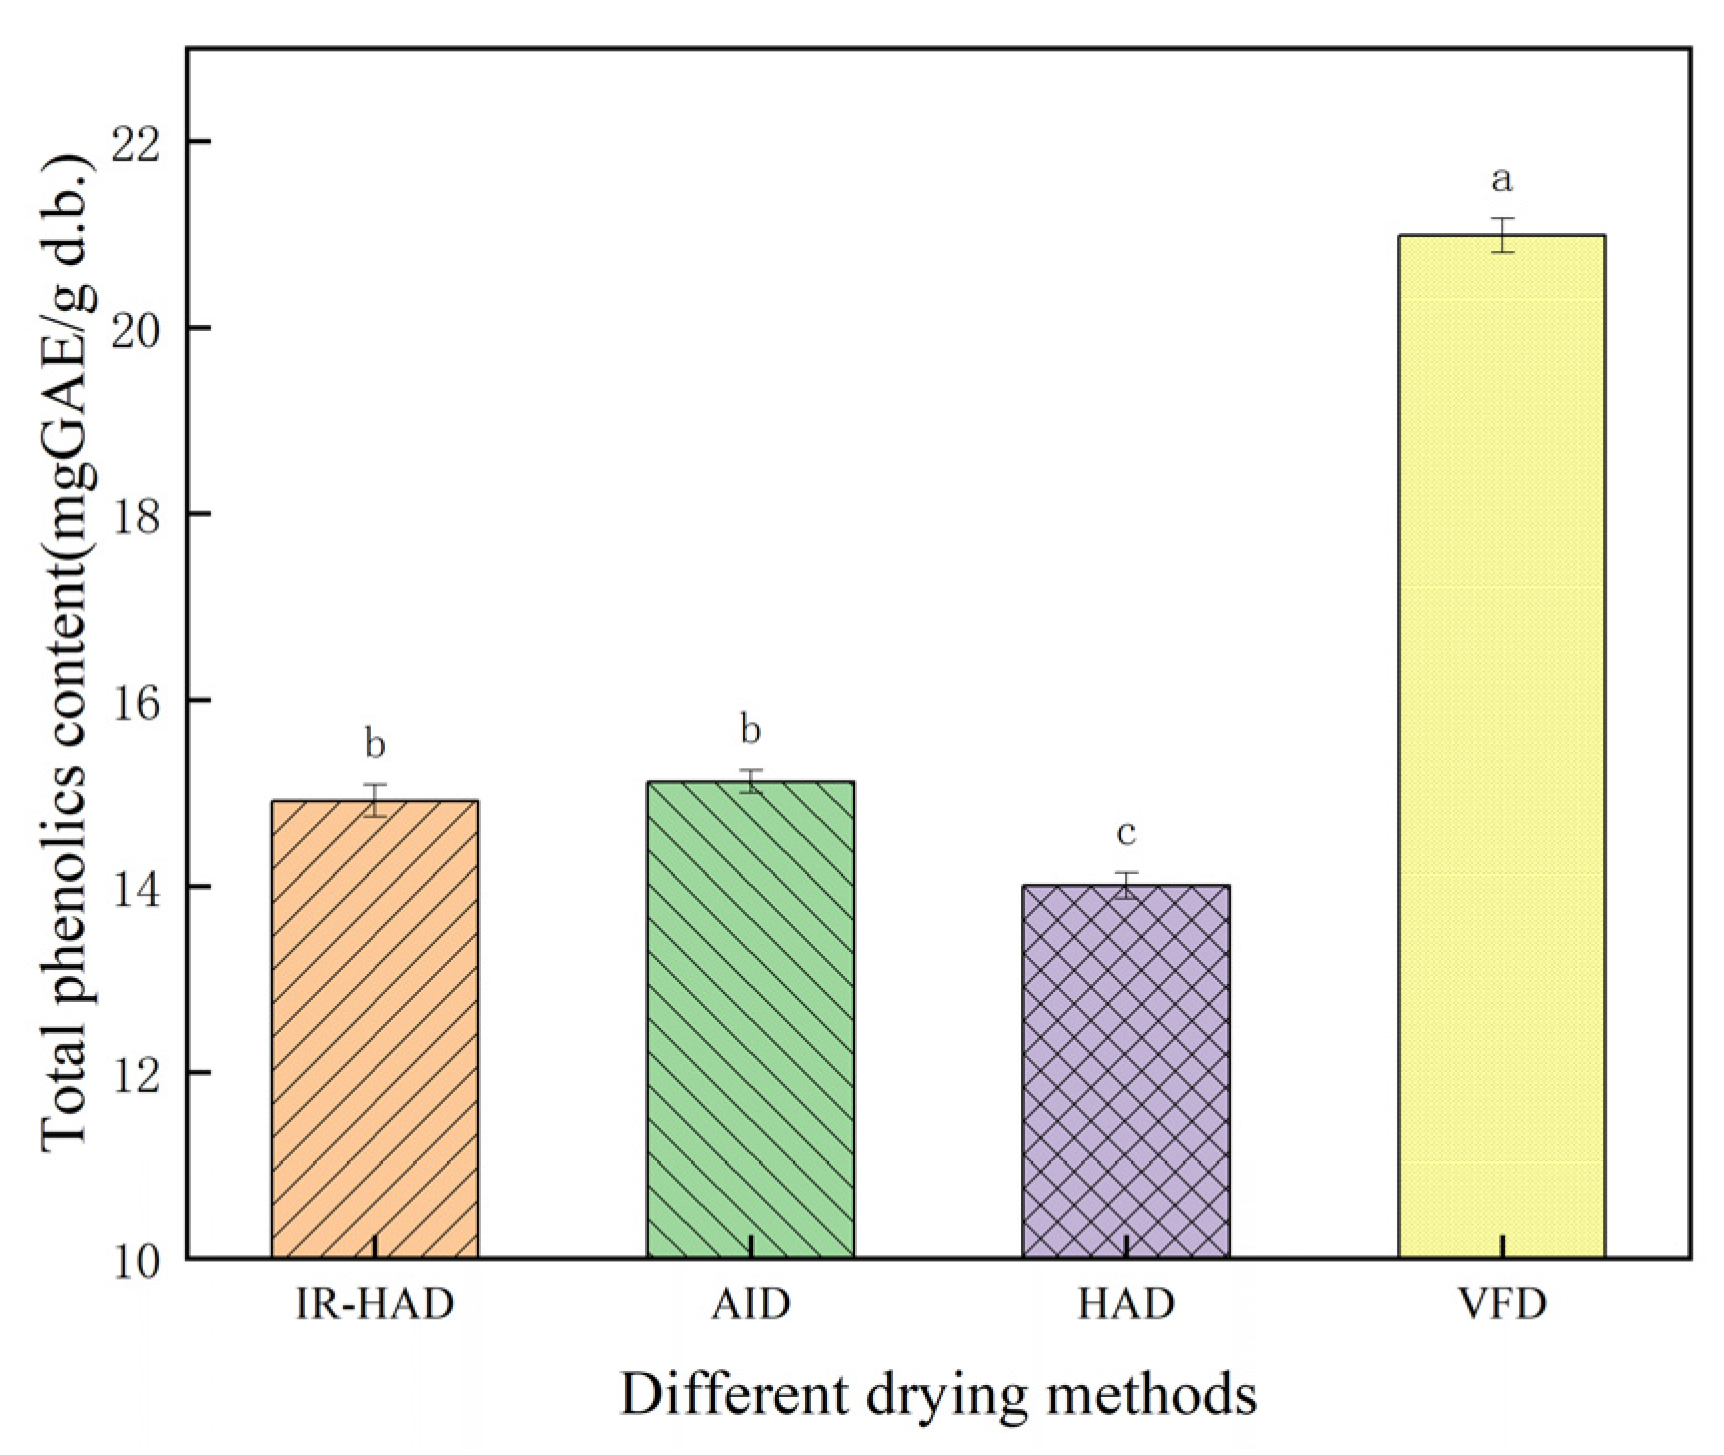
Various preclinical in vivo animal and in vitro cell culture studies have shown that antioxidant substances and antioxidant capacity can prevent various peroxidation-related diseases [55]. Phenols are closely related to antioxidant activity [56]. Statistical analysis showed that different drying methods significantly affected the total phenol content of turnip. As shown in Figure 5, in IR-HAD, AID, and HAD, the retention of total phenols was 14.92 ± 0.07, 15.12 ± 0.02, and 14.01 ± 0.04 mg/g, respectively. The total phenol retention of VFD was 20.98 ± 0.09 mg/g. This was significantly higher than that of other drying methods, probably because the low-temperature vacuum environment helps to retain heat-sensitive and oxidizing components [57]. Although thermal drying accelerates phenolic degradation, its shorter processing time partially offsets this negative effect. Similar results were reported in a study of apple drying, where drying temperature and drying time affected the product’s nutrient retention [58].

3.6. Antioxidant Activity In Vitro

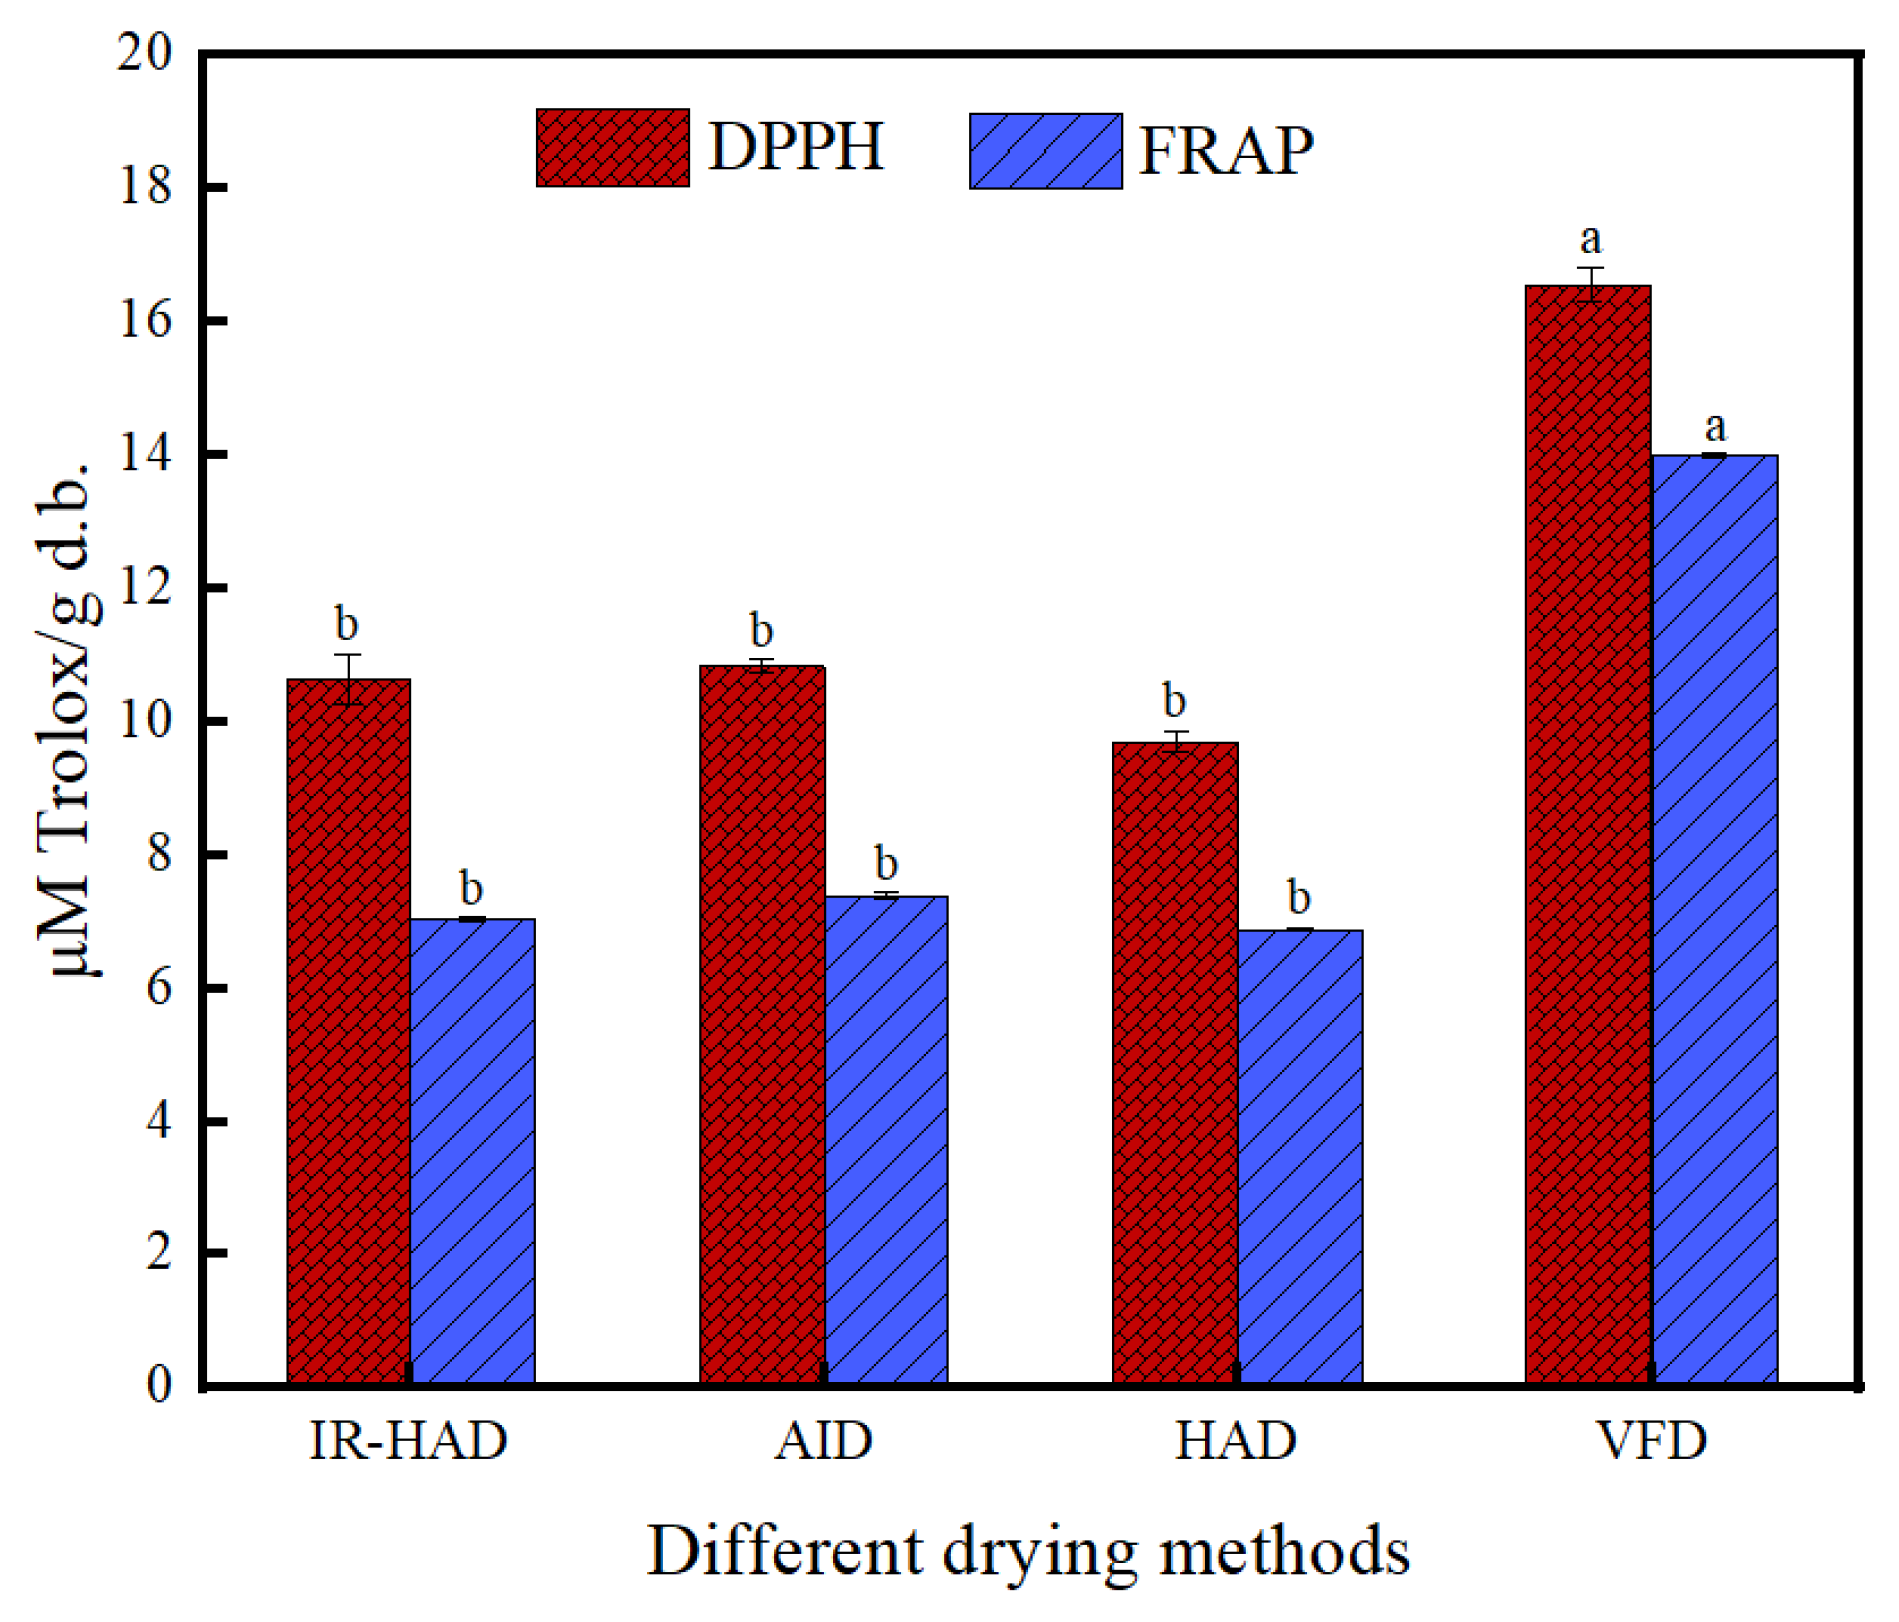
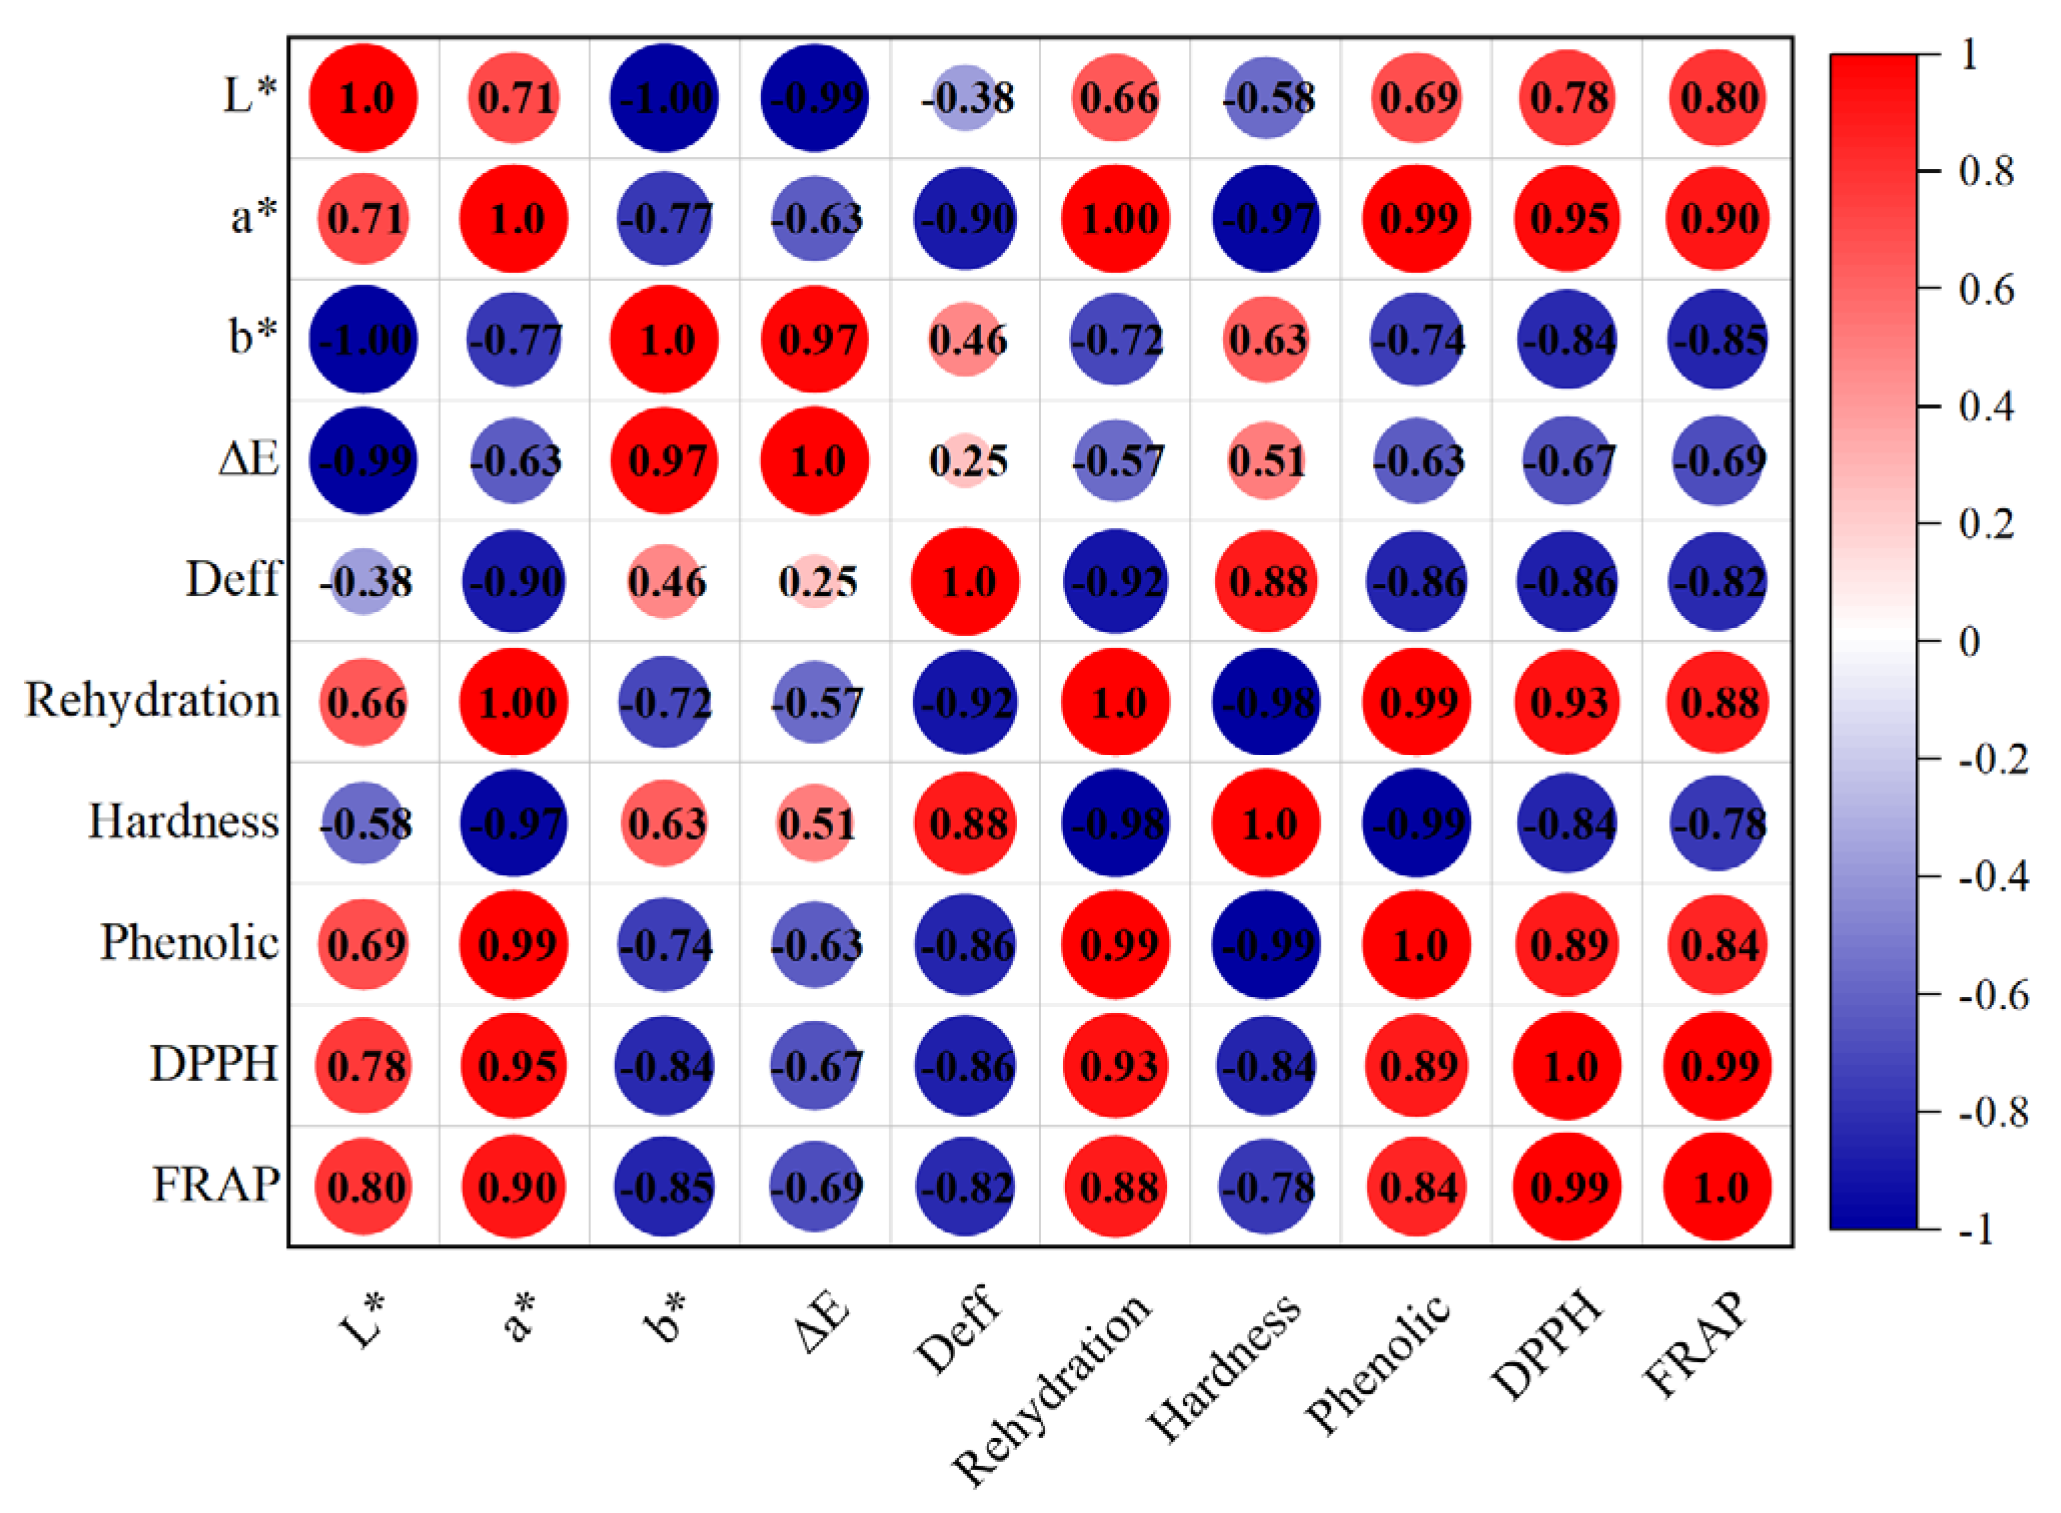
The healthy properties of fruits/vegetables in preventing diseases are based on the antioxidant capacity to reduce oxidative damage in the body through scavenging free radicals [59]. As shown in Figure 6, there were significant differences in the DPPH and FRAP radical scavenging abilities of turnip with different drying methods. The DPPH and FRAP radical scavenging capacities were the strongest for the VFD samples, which were 16.56 ± 0.26 μmol Trolox/g and 13.99 ± 0.04 μmol Trolox/g, respectively. This may be due to the formation of ice crystals during VFD that disrupted the cell structure’s integrity and increased the release of intracellular antioxidant active substances. Shireen et al. [60] found similar phenomena in the study of the drying process of mangoes. The antioxidant activity of hot air drying was low, possibly due to the degradation of active antioxidant substances promoted by prolonged thermal processing. The antioxidant activity of different drying methods showed the same trend as that of total phenol content, suggesting that phenolic compounds might play a dominant role in the antioxidant activity, consistent with the result in goji berry by Zhang et al. [61]. As shown in Figure 7, significant correlations (p < 0.05) were observed between DPPH and TPC, and between FRAP and TPC, consistent with the findings by Liu et al. [62], who reported that the antioxidant activity was significantly correlated with TPC.

4. Conclusions

This study investigated the effects of four drying methods, namely IR-HAD, AID, HAD, and VFD, on the drying kinetics, physicochemical properties, and microstructure of turnip slices. The results showed that different drying methods significantly affected the overall quality of dried turnip slices (p < 0.05). AID showed the shortest drying time, while VFD required the longest duration. The SEM analysis revealed that VFD produced a well-structured porous network, resulting in superior rehydration capacity. Furthermore, VFD-treated samples exhibited minimal non-enzymatic browning, the smallest color deviation, the highest phenolic compound retention, and the strongest antioxidant activity among all samples. Among the thermal processing technologies, the overall quality of AID was better than that of IR-HAD and HAD; the color difference was smaller, and the active ingredient retention was higher. The current research results showed that the turnip slices obtained by VFD had the best quality, but the drying time of VFD was long and the cost was high. The drying process needs to be further optimized to improve its potential for industrial application. On the other hand, AID has the potential for industrial applications due to its short drying time and low cost.

Author Contributions

Conceptualization, F.Y. and H.X.; methodology, J.Z.; software, F.Y.; validation, A.S.M., X.Y. and P.P.S.; formal analysis, J.N.; investigation, H.X.; resources, X.W.; data curation, F.Y.; writing—original draft preparation, F.Y.; writing—review and editing, H.X.; visualization, J.Z.; supervision, C.H.; project administration, X.Y.; funding acquisition, H.X. All authors have read and agreed to the published version of the manuscript.

Funding

This research is supported by the National Key Research and Development Program of China (2024YFD2101404).

Data Availability Statement

The original contributions presented in this study are included in the article. Further inquiries can be directed to the corresponding author.

Conflicts of Interest

The authors declare no conflicts of interest.

References

  1. Xue, Y.-L.; Chen, J.-N.; Han, H.-T.; Liu, C.-J.; Gao, Q.; Li, J.-H.; Li, D.-J.; Tanokura, M.; Liu, C.-Q. Multivariate analyses of the physicochemical properties of turnip (Brassica rapa L.) chips dried using different methods. Dry. Technol. 2019, 38, 411–419. [Google Scholar] [CrossRef]
  2. Yang, J.; Lou, J.; Zhong, W.; Li, Y.; He, Y.; Su, S.; Chen, X.; Zhu, B. Chemical Profile of Turnip According to the Plant Part and the Cultivar: A Multivariate Approach. Foods 2023, 12, 3195. [Google Scholar] [CrossRef]
  3. Hamidi Moghaddam, R.; Mansouripour, S.; Soltani, M. Functional Set-Type Yogurt Prepared Using Turnip Extract (Brassica Rapa L.): Physicochemical, Antioxidant, Microbiological, Rheological, Microstructural, and Sensory Characteristics. J. Food Meas. Charact. 2023, 18, 1204–1217. [Google Scholar] [CrossRef]
  4. Kong, D.; Wang, Y.; Li, M.; Liu, X.; Huang, M.; Li, X. Analysis of drying kinetics, energy and microstructural properties of turnips using a solar drying system. Sol. Energy 2021, 230, 721–731. [Google Scholar] [CrossRef]
  5. Cao, Q.; Wang, G.; Peng, Y. A critical review on phytochemical profile and biological effects of turnip (Brassica rapa L.). Front. Nutr. 2021, 8, 721733. [Google Scholar] [CrossRef]
  6. Paul, S.; Geng, C.A.; Yang, T.H.; Yang, Y.P.; Chen, J.J. Phytochemical and Health-Beneficial Progress of Turnip (Brassica rapa). J. Food Sci. 2018, 84, 19–30. [Google Scholar] [CrossRef] [PubMed]
  7. Taghinezhad, E.; Kaveh, M.; Szumny, A. Optimization and Prediction of the Drying and Quality of Turnip Slices by Convective-Infrared Dryer under Various Pretreatments by RSM and ANFIS Methods. Foods 2021, 10, 284. [Google Scholar] [CrossRef]
  8. Khalil, M.N.A.; Afifi, S.M.; Eltanany, B.M.; Pont, L.; Benavente, F.; El-Sonbaty, S.M.; Sedeek, M.S. Assessment of the effect of drying on Brassica greens via a multiplex approach based on LC-QTOF-MS/MS. molecular networking, and chemometrics along with their antioxidant and anticancer activities. Food Res. Int. 2024, 180, 114053. [Google Scholar] [CrossRef] [PubMed]
  9. Gao, Q.; Zhou, X.J.; Ma, R.; Lin, H.; Wu, J.L.; Peng, X.; Tanokura, M.; Xue, Y.L. Hydrogen peroxide modification affects the structure and physicochemical properties of dietary fibers from white turnip (Brassica Rapa L.). Sci Rep. 2021, 11, 1024. [Google Scholar] [CrossRef]
  10. Xue, Y.-l.; Han, H.-t.; Liu, C.-j.; Gao, Q.; Li, J.-h.; Zhang, J.-h.; Li, D.-J.; Liu, C.-q. Multivariate analyses of the volatile components in fresh and dried turnip (Brassica rapa L.) chips via HS-SPME–GC–MS. J. Food Sci. Technol. 2020, 57, 3390–3399. [Google Scholar] [CrossRef]
  11. Zhou, Y.; Li, Z. Anti-fatigue activities and phytochemical compositions of turnip (Brassica rapa L.) extracts. Phcog. Mag. 2021, 17, 857–864. [Google Scholar] [CrossRef]
  12. Hamed, Y.S.; Ahsan, H.M.; Hussain, M.; Ahmad, I.; Tian, B.; Wang, J.; Zou, X.G.; Bu, T.; Ming, C.; Rayan, A.M.; et al. Polysaccharides from Brassica rapa root: Extraction, purification, structural features, and biological activities. A review. Int. J. Biol. Macromol. 2024, 254 Pt 3, 128023. [Google Scholar] [CrossRef]
  13. Feng, Y.; Xu, B.; ElGasim, A.; Yagoub, A.; Ma, H.; Sun, Y.; Xu, X.; Yu, X.; Zhou, C. Role of Drying Techniques on Physical, Rehydration, Flavor, Bioactive Compounds and Antioxidant Characteristics of Garlic. Food Chem. 2021, 343, 128404. [Google Scholar] [CrossRef]
  14. Chen, Y.N.; Li, M.; Dharmasiri, T.S.K.; Song, X.Y.; Liu, F.; Wang, X. Novel ultrasonic-assisted vacuum drying technique for dehydrating garlic slices and predicting the quality properties by low field nuclear magnetic resonance. Food Chem. 2020, 306, 125625. [Google Scholar] [CrossRef]
  15. Thuwapanichayanan, R.; Prachayawarakorn, S.; Kunwisawa, J.; Soponronnarit, S. Determination of effective moisture diffusivity and assessment of quality attributes of banana slices during drying. LWT-Food Sci. Technol. 2011, 44, 1502–1510. [Google Scholar] [CrossRef]
  16. Ju, H.Y.; El-Mashad, H.M.; Fang, X.M.; Pan, Z.; Xiao, H.W.; Liu, Y.H.; Gao, Z.J. Drying Characteristics and Modeling of Yam Slices under Different Relative Humidity Conditions. Dry. Technol. 2016, 34, 296–306. [Google Scholar] [CrossRef]
  17. Rojas, M.L.; Augusto, P.E. Ethanol and Ultrasound Pre-Treatments to Improve Infrared Drying of Potato Slices. Innov. Food Sci. Emerg. Technol. 2018, 49, 65–75. [Google Scholar] [CrossRef]
  18. Pawar, S.B.; Pratape, V.M. Fundamentals of Infrared Heating and Its Application in Drying of Food Materials: A Review. J. Food Process Eng. 2017, 40, 12308. [Google Scholar] [CrossRef]
  19. Deng, L.Z.; Yang, X.H.; Mujumdar, A.S.; Zhao, J.H.; Wang, D.; Zhang, Q.; Wang, J.; Gao, Z.J.; Xiao, H.W. Red Pepper (Capsicum annuum L.) Drying: Effects of Different Drying Methods on Drying Kinetics, Physicochemical Properties, Antioxidant Capacity, and Microstructure. Dry. Technol. 2018, 36, 893–907. [Google Scholar] [CrossRef]
  20. Zhang, J.; Zheng, X.; Xiao, H.; Li, Y.; Yang, T. Effect of Combined Infrared Hot Air Drying on Yam Slices: Drying Kinetics, Energy Consumption, Microstructure, and Nutrient Composition. Foods 2023, 12, 3048. [Google Scholar] [CrossRef]
  21. Boy, V.; Ben Khalifa, W.; Drevillon, L.; Lemee, Y.; Lendormi, T.; Lanoiselle, J.L. Air impingement and intermittent drying: Application to apple and to mango. Can. J. Chem. Eng. 2021, 99, 120–134. [Google Scholar] [CrossRef]
  22. Jiang, D.L.; Wang, Q.H.; Huang, C.; Sutar, P.P.; Lin, Y.W.; Okaiyeto, S.A.; Lin, Z.F.; Wu, Y.T.; Ma, W.M.; Xiao, H.W. Effect of various different pretreatment methods on infrared combined hot air impingement drying behavior and physicochemical properties of strawberry slices. Food Chem. X 2024, 22, 101299. [Google Scholar] [CrossRef] [PubMed]
  23. Li, M.; Ai, Z.; Xiao, H.; Mowafy, S.; Pei, Y.; Liu, Y. Improvement of drying efficiency and physicochemical quality of kiwifruit slices using infrared-assisted tilted tray air impingement drying. Dry. Technol. 2023, 41, 1159–1170. [Google Scholar] [CrossRef]
  24. Wang, D.; Dai, J.W.; Ju, H.Y.; Xie, L.; Xiao, H.W.; Liu, Y.H.; Gao, Z.J. Drying Kinetics of American Ginseng Slices in Thin-Layer Air Impingement Dryer. Int. J. Food Eng. 2015, 11, 701–711. [Google Scholar] [CrossRef]
  25. Ma, Y.; Yi, J.; Jin, X.; Li, X.; Feng, S.; Bi, J. Freeze-Drying of Fruits and Vegetables in Food Industry: Effects on Phytochemicals and Bioactive Properties Attributes—A Comprehensive Review. Food Rev. Int. 2022, 39, 6611–6629. [Google Scholar] [CrossRef]
  26. Wang, X.; Zhou, D.; Li, M.; Zheng, J.; Jiang, L.; Li, R.; Wang, S. Developing a two-stage strategy in the dehydration treatment of fresh apple slices: Combined freeze and radio frequency-vacuum drying. Innov. Food Sci. Emerg. Technol. 2024, 92, 103596. [Google Scholar] [CrossRef]
  27. Zhang, X.; Wang, Y.; Nian, R.; Li, Q.; Zhu, D.; Cao, X. Effects of ultrasonic pretreatment on drying characteristics and water migration characteristics of freeze-dried strawberry. Food Chem. 2024, 450, 139267. [Google Scholar] [CrossRef]
  28. Fan, D.; Chitrakar, B.; Ju, R.; Zhang, M. Effect of ultrasonic pretreatment on the properties of freeze-dried carrot slices by traditional and infrared freeze-drying technologies. Dry. Technol. 2020, 39, 1176–1183. [Google Scholar] [CrossRef]
  29. Wang, J.-R.; Wu, X.-Y.; Cui, C.-B.; Bi, J.-F. Effect of osmotic dehydration combined with vacuum freeze-drying treatment on characteristic aroma components of peach slices. Food Chem. X 2024, 22, 101337. [Google Scholar] [CrossRef]
  30. AOAC. Official Methods of Analysis, 15th ed.; Association of Official Analytical Chemists: Washington, DC, USA, 1990. [Google Scholar]
  31. Li, C.; Ren, G.; Zhang, L.; Duan, X.; Wang, Z.; Ren, X.; Chu, Q.; He, T. Effects of different drying methods on the drying characteristics and drying quality of Cistanche deserticola. LWT-Food Sci. Technol. 2023, 184, 115000. [Google Scholar] [CrossRef]
  32. Liu, Z.L.; Bai, J.W.; Wang, S.X.; Meng, J.S.; Wang, H.; Yu, X.L.; Gao, Z.J.; Xiao, H.W. Prediction of energy and exergy of mushroom slices drying in hot air impingement dryer by artificial neural network. Dry. Technol. 2020, 38, 1959–1970. [Google Scholar] [CrossRef]
  33. Zhang, Y.; Zhu, G.; Li, X.; Zhao, Y.; Lei, D.; Ding, G.; Ambrose, K.; Liu, Y. Combined medium- and short-wave infrared and hot air impingement drying of sponge gourd (Luffa cylindrical) slices. J. Food Eng. 2020, 284, 110043. [Google Scholar] [CrossRef]
  34. Jia, Z.; Liu, Y.; Xiao, H. Deep Learning Prediction of Moisture and Color Kinetics of Apple Slices by Long Short-Term Memory as Affected by Blanching and Hot-Air Drying Conditions. Processes 2024, 12, 1724. [Google Scholar] [CrossRef]
  35. Ju, H.-Y.; Vidyarthi, S.K.; Karim, M.A.; Yu, X.-L.; Zhang, W.-P.; Xiao, H.-W. Drying quality and energy consumption efficient improvements in hot air drying of papaya slices by step-down relative humidity based on heat and mass transfer characteristics and 3D simulation. Dry. Technol. 2022, 41, 460–476. [Google Scholar] [CrossRef]
  36. Wang, H.; Liu, Z.-L.; Vidyarthi, S.K.; Wang, Q.-H.; Gao, L.; Li, B.-R.; Wei, Q.; Liu, Y.-H.; Xiao, H.-W. Effects of different drying methods on drying kinetics, physicochemical properties, microstructure, and energy consumption of potato (Solanum tuberosum L.) cubes. Dry. Technol. 2020, 39, 418–431. [Google Scholar] [CrossRef]
  37. Sun, W.; Li, M.; Zhang, Y.; Ai, Z.; Lei, D.; Pei, Y.; Liu, Y. Effect of different drying techniques on drying characteristics, physical quality, and active components of Citri reticulatae pericarpium, and the correlation between physiochemical quality. Ind. Crops Prod. 2023, 204 Pt B, 117350. [Google Scholar] [CrossRef]
  38. Zhou, Y.H.; Pei, Y.P.; Sutar, P.P.; Liu, D.H.; Deng, L.Z.; Duan, X.; Liu, Z.L.; Xiao, H.W. Pulsed vacuum drying of banana: Effects of ripeness on drying kinetics and physicochemical properties and related mechanism. LWT-Food Sci. Technol. 2022, 161, 113362. [Google Scholar] [CrossRef]
  39. Aradwad, P.P.; Thirumani Venkatesh, A.K.; Mani, I. Infrared Drying of Apple (Malus Domestica) Slices: Effect on Drying and Color Kinetics, Texture, Rehydration, and Microstructure. J Food Process Eng. 2023, 46, e14218. [Google Scholar] [CrossRef]
  40. Guo, X.; Hao, Q.; Qiao, X.; Li, M.; Qiu, Z.; Zheng, Z.; Zhang, B. An Evaluation of Different Pretreatment Methods of Hot-Air Drying of Garlic: Drying Characteristics, Energy Consumption and Quality Properties. LWT-Food Sci. Technol. 2023, 180, 114685. [Google Scholar] [CrossRef]
  41. Deng, L.-Z.; Xiong, C.-H.; Pei, Y.-P.; Zhu, Z.-Q.; Zheng, X.; Zhang, Y.; Yang, X.-H.; Liu, Z.-L.; Xiao, H.-W. Effects of various storage conditions on total phenolic, carotenoids, antioxidant capacity, and color of dried apricots. Food Control 2022, 136, 108846. [Google Scholar] [CrossRef]
  42. Brand-Williams, W.; Cuvelier, M.E.; Berset, C. Use of a free radical method to evaluate antioxidant activity. LWT-Food Sci. Technol. 1995, 28, 25–30. [Google Scholar] [CrossRef]
  43. Benzie, I.F.F.; Strain, J.J. The ferric reducing ability of plasma (FRAP) as a measure of “antioxidant power”: The FRAP assay. Anal. Biochem. 1996, 239, 70–76. [Google Scholar] [CrossRef] [PubMed]
  44. Ai, Z.; Mowafy, S.; Liu, Y. Comparative analyses of five drying techniques on drying attributes, physicochemical aspects, and flavor components of Amomum villosum fruits. LWT-Food Sci. Technol. 2022, 154, 112879. [Google Scholar] [CrossRef]
  45. Xu, H.; Wu, M.; Wang, Y.; Wei, W.; Sun, D.; Li, D.; Zheng, Z.; Gao, F. Effect of combined infrared and hot air drying strategies on the quality of Chrysanthemum (Chrysanthemum morifolium Ramat.) cakes: Drying behavior, aroma profiles and phenolic compounds. Foods 2022, 11, 2240. [Google Scholar] [CrossRef]
  46. Marques, L.G.; Prado, M.M.; Freire, J.T. Rehydration characteristics of freeze-dried tropical fruits. LWT-Food Sci. Technol. 2009, 42, 1232–1237. [Google Scholar] [CrossRef]
  47. Xiao, H.W.; Bai, J.W.; Xie, L.; Sun, D.W.; Gao, Z.J. Thin-Layer Air Impingement Drying Enhances Drying Rate of American Ginseng (Panax quinquefolium L.) Slices with Quality Attributes Considered. Food. Bioprod. Process 2015, 94, 581–591. [Google Scholar] [CrossRef]
  48. Geng, Z.; Zhu, L.; Wang, J.; Yu, X.; Li, M.; Yang, W.; Hu, B.; Zhang, Q.; Yang, X. Drying sea buckthorn berries (Hippophae rhamnoides L.): Effects of different drying methods on drying kinetics, physicochemical properties, and microstructure. Front. Nutr. 2023, 10, 1106009. [Google Scholar] [CrossRef] [PubMed]
  49. Wang, B.; Sun, P.; Chen, B.; Sajjad, U.; Yan, W. Influence of the process parameters on the energy conservation and quality of the kiwi fruit subjected to vacuum freeze drying. Case Stud. Therm. Eng. 2022, 33, 101935. [Google Scholar] [CrossRef]
  50. Li, X.; Zhang, Y.; Zhang, Y.; Liu, Y.; Gao, Z.; Zhu, G. Relative humidity control during shiitake mushroom (Lentinus edodes) hot air drying based on appearance quality. J. Food Eng. 2022, 315, 110814. [Google Scholar] [CrossRef]
  51. Pathare, P.B.; Opara, L.U.; Al-Said, F. Colour Measurement and Analysis in Fresh and Processed Foods. Food Bioprocess Technol. 2013, 6, 36–60. [Google Scholar] [CrossRef]
  52. Xiao, H.W.; Law, C.L.; Sun, D.W.; Gao, Z.J. Color Change Kinetics of American Ginseng (Panax quinquefolium) Slices during Air Impingement Drying. Dry. Technol. 2014, 32, 418–427. [Google Scholar] [CrossRef]
  53. Zheng, Z.-A.; Wang, S.-Y.; Wang, H.; Xiao, H.; Liu, Z.-L.; Pan, Y.-H.; Gao, L. Comparative Study on the Influence of Various Drying Techniques on Drying Characteristics and Physicochemical Quality of Garlic Slices. Foods 2023, 12, 1314. [Google Scholar] [CrossRef]
  54. Bondaruk, J.; Markowski, M.; Aszczak, W. Effect of drying conditions on the quality of vacuum-microwave dried potato cubes. J. Food Eng. 2007, 81, 306–312. [Google Scholar] [CrossRef]
  55. Du, Y. Intervention mechanisms of cold plasma pretreatment on the quality, antioxidants and reactive oxygen metabolism of fresh wolfberries during storage. Food Chem. 2024, 431, 137106. [Google Scholar] [CrossRef]
  56. Qin, L.; Wang, H.; Zhang, W.; Pan, M.; Xie, H.; Guo, X. Effects of different drying methods on phenolic substances and antioxidant activities of seedless raisins. LWT-Food Sci. Technol. 2020, 131, 109807. [Google Scholar] [CrossRef]
  57. Ghafoor, K.; Al Juhaimi, F.; Özcan, M.M.; Uslu, N.; Babiker, E.E.; Ahmed, I.A.M. Total phenolics, total carotenoids, individual phenolics and antioxidant activity of ginger (Zingiber officinale) rhizome as affected by drying methods. LWT-Food Sci. Technol. 2020, 126, 109354. [Google Scholar] [CrossRef]
  58. Vega-Gálvez, A.; Ah-Hen, K.; Chacana, M.; Vergara, J.; Martínez-Monzó, J.; García-Segovia, P.; Lemus-Mondaca, R.; Di Scala, K. Effect of temperature and air velocity on drying kinetics, antioxidant capacity, total phenolic content, colour, texture and microstructure of apple (var. Granny Smith) slices. Food Chem. 2012, 132, 51–59. [Google Scholar] [CrossRef] [PubMed]
  59. Betoret, E.; Netoret, N.; Rocculi, P.; Rosa, M.D. Strategies to improve food functionality: Structure-property relationships on high pressures homogenization, vacuum impregnation and drying technologies. Trends Food Sci. Technol. 2015, 46, 1–12. [Google Scholar] [CrossRef]
  60. Akther, S.; Jothi, J.S.; Badsha, R.; Rahman, M.; Das, G.B.; Alim, A. Drying methods effect on bioactive compounds, phenolic profile, and antioxidant capacity of mango powder. J. King Saud Univ.-Sci. 2023, 35, 102370. [Google Scholar] [CrossRef]
  61. Zhang, A.A.; Xie, L.; Wang, Q.H.; Xu, M.Q.; Pan, Y.; Zheng, Z.A.; Lv, W.Q.; Xiao, H.W. Effect of the ripening stage on the pulsed vacuum drying behavior of goji berry (Lycium barbarum L.): Ultrastructure, drying characteristics, and browning mechanism. Food Chem. 2024, 442, 138489. [Google Scholar] [CrossRef]
  62. Liu, Z.L.; Xie, L.; Zielinska, M.; Pan, Z.; Deng, L.Z.; Zhang, J.S.; Gao, L.; Wang, S.Y.; Zheng, Z.A.; Xiao, H.W. Improvement of drying efficiency and quality attributes of blueberries using innovative far-infrared radiation heating assisted pulsed vacuum drying (FIR-PVD). Innov. Food Sci. Emerg. Technol. 2022, 77, 102948. [Google Scholar] [CrossRef]
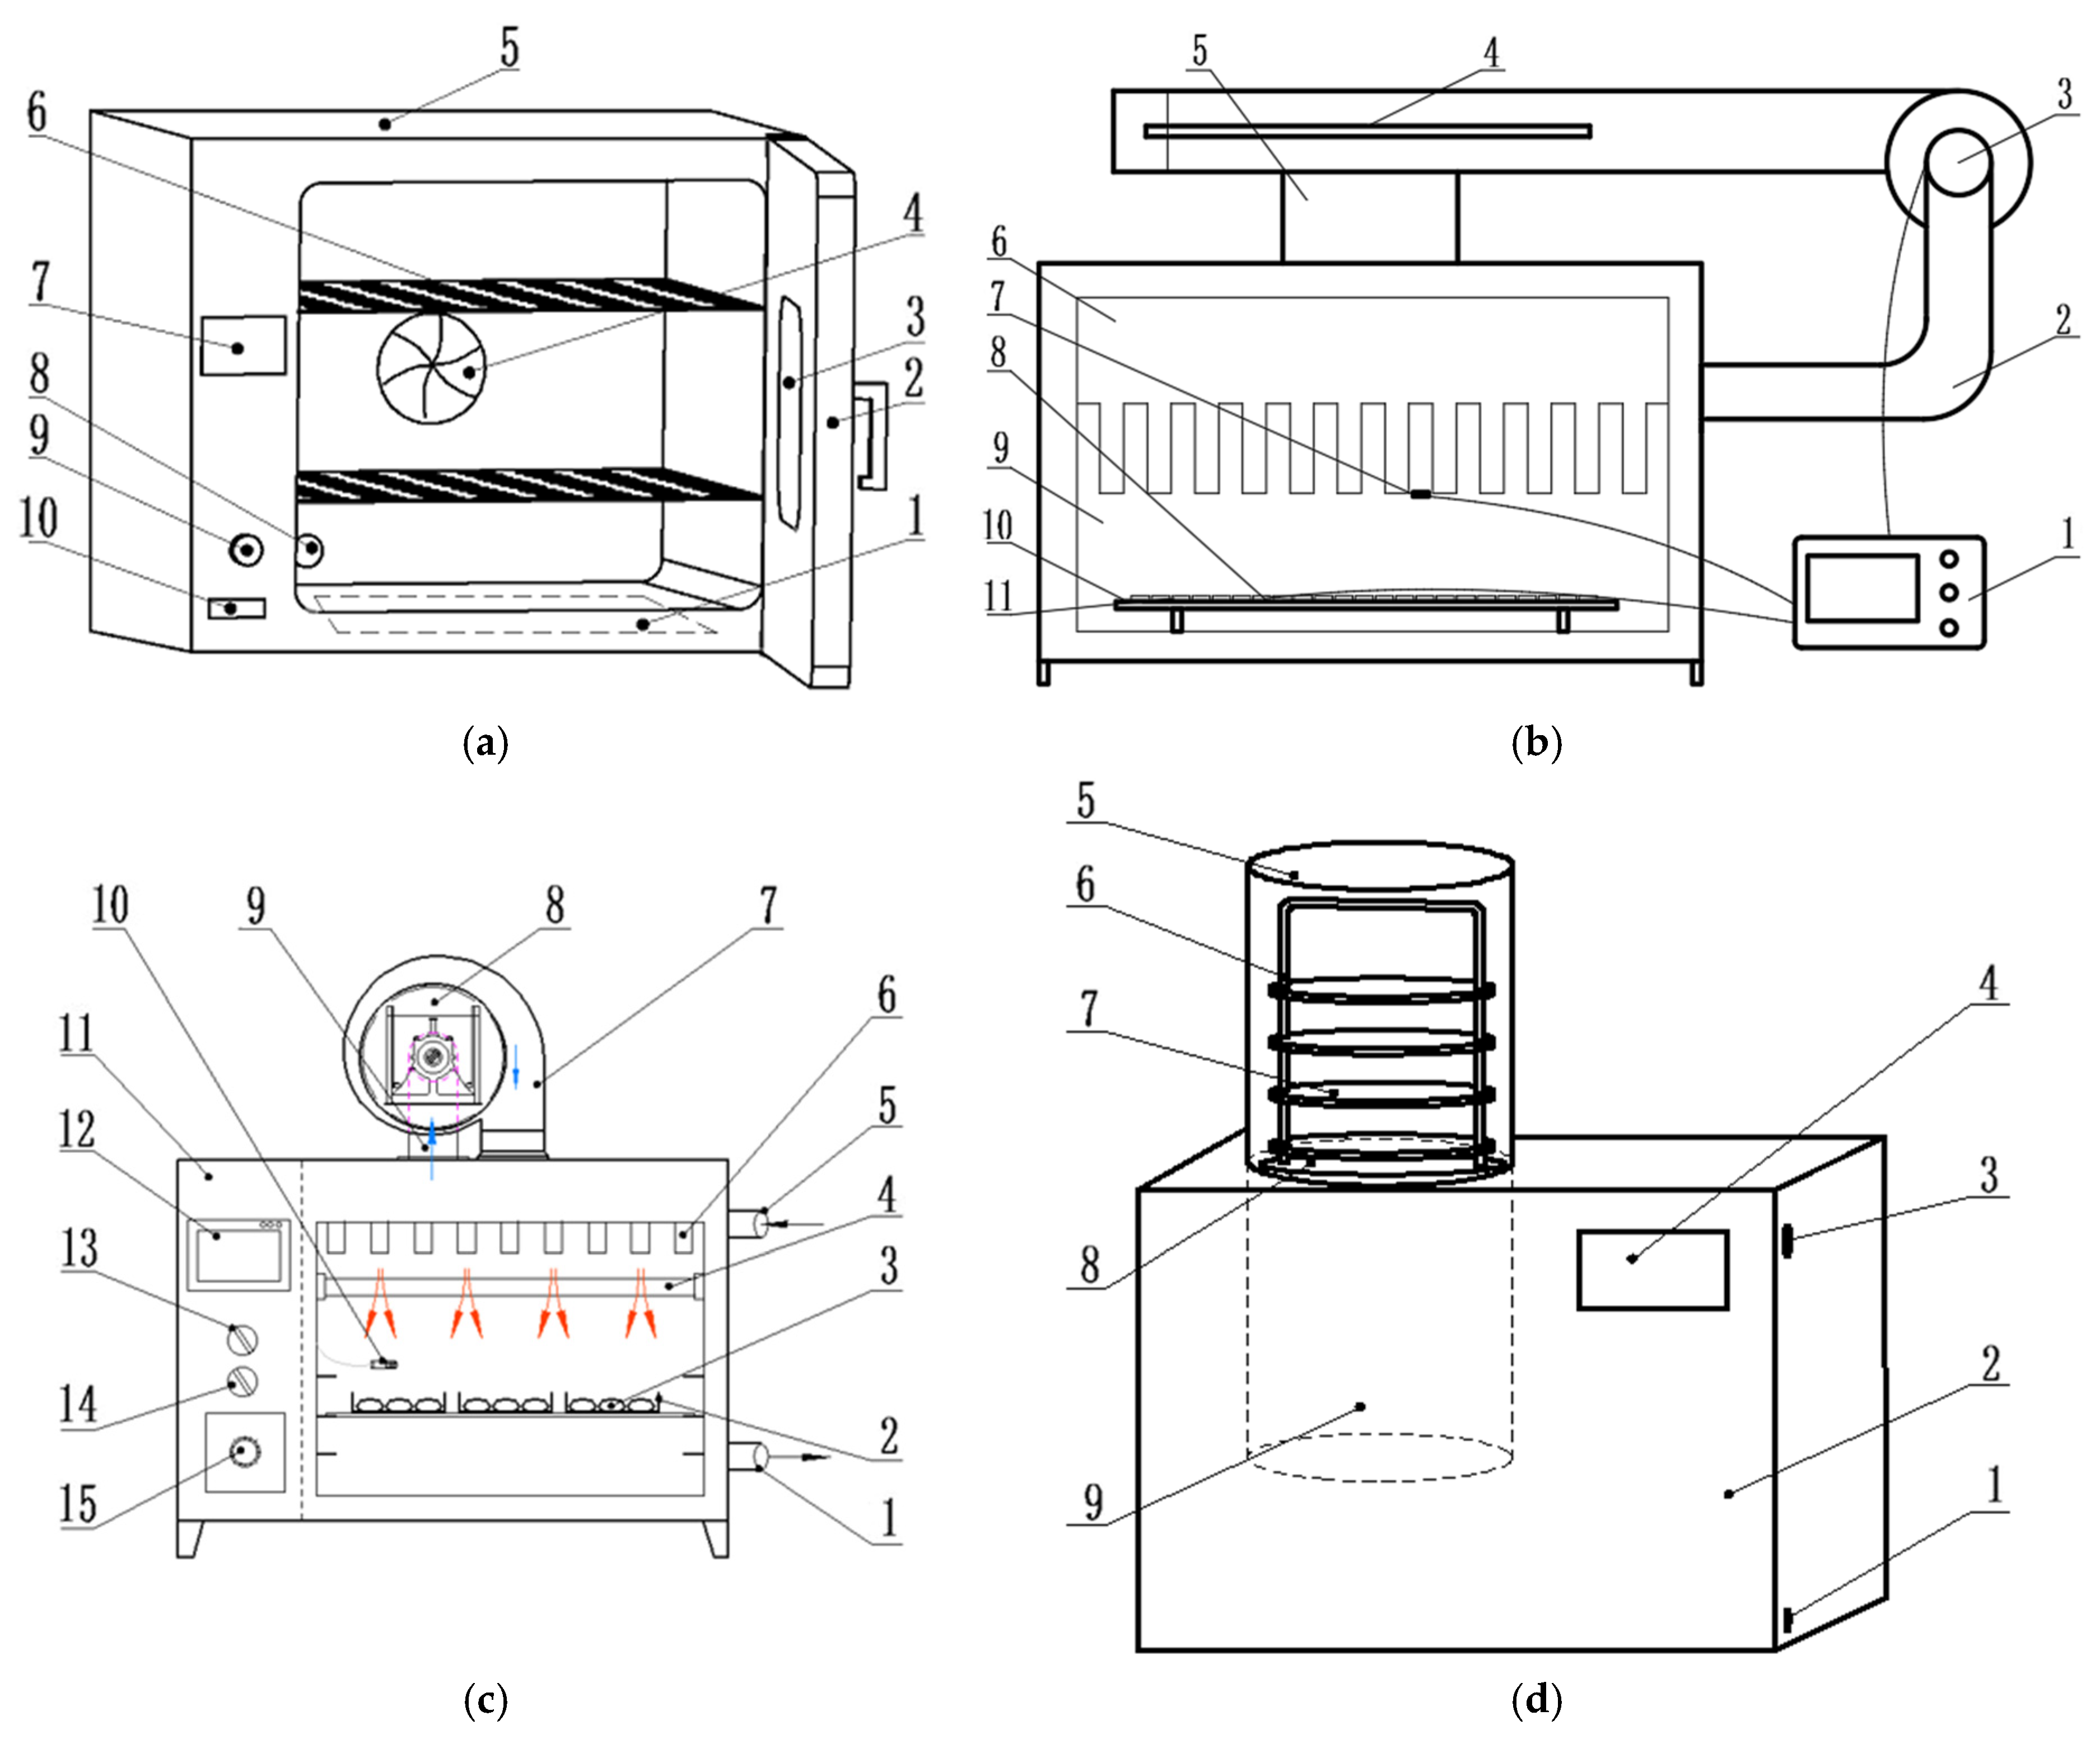
Figure 1. The schematics of the dryers. (a) Schematic diagram of equipment used for hot air drying (HAD): 1, electric heater; 2, box door; 3, observation window; 4, fan; 5, box; 6, material tray; 7, screen; 8, air discharging port; 9, fan switch; 10, electric switch. (b) Schematic diagram of equipment used for air impingement drying (AID): 1, main control unit; 2, drying air recycle channel; 3, centrifugal fan; 4, electric heater; 5, drying air channel; 6, air inlet circulating pipe; 7, air velocity sensor; 8, temperature sensor; 9, drying chamber; 10, sample tray; 11, sample. (c) Schematic diagram of the equipment used for infrared assisted hot air drying (IR-HAD): 1, wet discharging port; 2, stainless steel tray; 3, samples; 4, infrared heating tubes; 5, air inlet port; 6, spray nozzle; 7, air inlet duct; 8, centrifugal fan; 9, return air duct; 10, temperature sensor; 11, control cabinet; 12, touchscreen; 13, lamps switch; 14, power supply control switch; 15, fan switch. (d) Schematic diagram of equipment used for vacuum freeze-drying (VFD): 1, water outlet pipeline; 2, freeze-dryer box; 3, vacuum regulation; 4, touch screen; 5, isolation cover; 6, the lift handle; 7, cargo tray; 8, the separate carrier plates; 9, cold traps.
Processes 13 02773 g001
Figure 2. Drying curves and total drying time (A) and drying rate curves (B) of turnip slices under three different drying methods. The different letters (a–c) indicate statistically significant differences at p < 0.05.
Processes 13 02773 g002
Figure 3. Rehydration ratio (A) and hardness (B) of turnip slices under three different drying methods. The different letters (a–c) indicate statistically significant differences at p < 0.05.
Processes 13 02773 g003
Figure 4. The microstructure of turnip slices dried under different methods at 100×, 200×, and 300× magnifications.
Processes 13 02773 g004
Figure 5. Total phenolic content of turnip slices under different drying methods. The different letter (a–c) indicates statistically significant difference at p < 0.05.
Processes 13 02773 g005
Figure 6. The antioxidant activity of turnip slices under different drying methods. The different letters (a–b) indicate statistically significant differences at p < 0.05.
Processes 13 02773 g006
Figure 7. Pearson correlation analysis between the quality attributes.
Processes 13 02773 g007
Table 1. Fitting results of drying kinetics for turnip slices (Brassica rapa L.) under various methods.
ModelsDrying MethodParameters
αβχ2/(×10−4)R2RMSEDeff/(10−8, m2·s−1)
WeibullHAD124.03565 ± 0.6601.26917 ± 0.01370.59540.99940.00132.467
AID42.61838 ± 0.532551.09985 ± 0.023230.10840.99880.00144.863
IR-HAD65.0599 ± 0.522671.23456 ± 0.018730.78520.99920.00114.068
knχ2/(×104)R2RMSEDeff/(108, m2·s1)
PageHAD0.00221 ± 0.000161.26819 ± 0.0150.59560.99940.00132.467
AID0.01612 ± 0.001561.10004 ± 0.024551.08440.99880.00144.863
IR-HAD0.00579 ± 0.000501.23399 ± 0.020140.78520.99920.00114.068
Note: α and β are the scale parameter and shape parameter in the Weibull model, respectively; k and n are the empirical constants in the Page model.
Table 2. Images and color parameters of turnip (Brassica rapa L.) under various methods.
FreshIR-HADAIDHADVFD
ImageProcesses 13 02773 i001Processes 13 02773 i002Processes 13 02773 i003Processes 13 02773 i004Processes 13 02773 i005
L 93.53 ± 0.36 a85.24 ± 1.18 d91.58 ± 0.28 b88.39 ± 0.99 c94.67 ± 0.40 a
a −3.82 ± 0.30 b−3.72 ± 0.91 b−3.55 ± 0.35 b−5.21 ± 0.44 c−1.34 ± 0.10 a
b 2.80 ± 0.08 d15.22 ± 0.69 a7.33 ± 0.55 c11.54 ± 0.34 b1.88 ± 0.18 d
Δ E 14.98 ± 0.64 a4.96 ± 0.43 c10.24 ± 0.83 b2.88 ± 0.26 c
Note: Different letters within a row denote significant differences (p < 0.05).
Disclaimer/Publisher’s Note: The statements, opinions and data contained in all publications are solely those of the individual author(s) and contributor(s) and not of MDPI and/or the editor(s). MDPI and/or the editor(s) disclaim responsibility for any injury to people or property resulting from any ideas, methods, instructions or products referred to in the content.