Abstract
This research presents an experimental analysis of the influence of atmospheric pressure plasma on the performance of a micro horizontal-axis wind turbine blade. The investigation was conducted using an NACA 4412 airfoil equipped with a dielectric barrier discharge (DBD) plasma actuator. The electrodes were configured asymmetrically, with a 2 mm gap and copper electrodes that are 0.20 mm in thickness. A high voltage of 6 kV was applied, resulting in a current of 0.071 mA and a power output of 0.426 W. Optical emission spectroscopy identified the excited components through the interaction of the high-voltage AC electric field with air molecules: , , , and O. The electrohydrodynamic force mainly results from the observed charged ions that, when accelerated by the electric field, transfer momentum to neutral molecules via collisions, leading to the formation of the observed jet plasma. The findings indicated a notable enhancement in aerodynamic performance attributable to the electrohydrodynamic (EHD) flow generated by the plasma. The estimated electrohydrodynamic force ( N) is capable of maintaining the flow attached to the airfoil surface, thereby augmenting flow circulation and, consequently, enhancing the lift force. According to blade element theory, the lift and drag coefficients directly influence the torque and mechanical power generated by the wind turbine rotor. Schlieren imaging was utilized to observe alterations in air density and flow patterns. Lissajous curve analysis was used to examine the electrical discharge behavior, showing that only 7.04% of the input power was converted into heat. This indicates that nearly all input electric energy was transformed into EHD force by the atmospheric pressure plasma. Compared to traditional aerodynamic control methods, DBD actuators are a feasible alternative for small wind turbines due to their lightweight design, absence of moving parts, ability to be surface-embedded without altering blade geometry, and capacity to generate active, dynamic flow control with reduced energy consumption.
1. Introduction
The rising demand for electrical energy and the urgent need to reduce the harmful effects of unchecked fossil fuel use are driving the search for more environmentally friendly, safe, and affordable energy sources. In this context, wind energy emerges as a feasible option among renewable sources for electricity production.
Wind turbines are crucial devices that transform wind energy into electricity. Generally, this process occurs in two main steps: First, the rotor of the wind turbine captures the kinetic energy of the wind and converts it into mechanical shaft energy, characterized by angular speed and torque. Next, the electrical generator, driven by the drive-train, converts the mechanical power into electrical power. The technical performance and economic viability of the wind turbine are essential for its sustainability. It must meet key criteria, such as efficient energy production, safe operation throughout its lifespan (about 20 years), and the ability to generate electricity at a cost competitive with other energy sources. Additionally, the costs related to construction, installation, and maintenance must be commensurate with the power generation capacity of the turbine [1].
Although large wind turbines are efficient in certain environments and have advanced technological development, their use may be limited in urban and residential areas due to space and regulatory restrictions. In contrast, small wind turbines are designed to fit into smaller, more densely populated areas, making them more suitable for deployment in urban, rural, and distributed grid settings. These turbines provide a flexible and versatile solution for small-scale electricity generation, making them an attractive option for addressing local energy needs and helping to transition toward a more sustainable and decentralized energy system. Additionally, a small wind turbine could be a practical option for distributed power generation in urban and remote areas due to its low cost, ease of maintenance, and ability to be integrated into smart energy management systems [2]. However, urban areas may experience various turbulence conditions and changes in wind direction, which can potentially affect their performance and structural integrity [3,4,5]. So, their performance under turbulent wind conditions and the effects of urban obstacles remain major challenges. Furthermore, startup difficulties at low wind speeds limit their use in urban areas where the average wind speed is usually below 4 m/s [6,7,8].
In recent years, monitoring, evaluating, and improving small wind energy conversion systems to boost power output has become a primary research goal [9,10]. Among the various options, two types of devices used to enhance aerodynamic performance stand out—passive and active flow control. Passive flow control devices, such as vortex generators, wings, lip spoilers, diffusers, and flaps, are designed to reduce pressure drag and boost the driving force. They do not require electrical power to operate; however, their contribution is limited. On the other hand, active flow control devices, such as moving body actuators, plasma actuators, and fluidic actuators, involve adding or subtracting momentum to the main flow to interact with the boundary layer and delay its separation [11,12].
In the search for solutions for airflow control and low-speed wind harnessing, various high-lift devices have been explored [13,14,15]. Among them, DBD plasma actuators have emerged as a promising technology to facilitate wind turbine startup at low wind speeds. These actuators use electrical discharges to generate plasma that induces airflow over the surface where they are installed [16,17].
Numerical studies have characterized EHD forces through direct measurements of thrust and induced flow velocity [18,19,20]. These investigations aim to improve plasma actuator efficiency by maximizing momentum transfer and wind-induced speeds, which in turn increase lift generation on airfoils. Various optimization strategies have been explored, notably the tailoring of high-voltage waveform parameters.Among geometry-based methods, notched electrode configurations have shown particular effectiveness, as they promote a more uniform ionization front along the actuator surface, resulting in smoother surface flow and higher thrust levels.
An experimental analysis presented by Versailles et al. [21] examined the potential of plasma actuators to increase the lift coefficient of wind turbine blades. This study reported a enhancement in lift, emphasizing the positive role of plasma actuators in high wind speed conditions and their capacity to control turbine power output.
On the other hand, the Schlieren system has become a widely used technique for visualizing changes in the refractive index of light, which are proportional to the fluid’s density gradient [22,23]. This optical method allows for detecting thermal disturbances and compression waves generated by DBD plasma actuators, establishing itself as an effective tool for analyzing these phenomena during operation. Previous research has shown that DBD plasma actuators can delay the separation point on airfoils, leading to improved lift coefficients [24,25,26,27]. However, there is limited experimental data on its application to low-power wind turbine profiles and the actual energy balance of the technique.
This research aims to experimentally analyze airflow under atmospheric pressure plasma generated by asymmetric DBD actuators. The tests were conducted on a NACA 4412 airfoil. This study intends to evaluate the feasibility of using this type of active flow control to keep airflow attached to surfaces, thereby reducing the cut-in wind speed and increasing the capacity factor of small wind turbines, which are typically installed in urban areas with turbulent, low wind speeds. The Schlieren system was used to visualize the density field created by plasma actuators and to provide a qualitative assessment of flow induction caused by the EHD effect. The electrohydrodynamic force, by increasing the airflow circulation on the airfoil, can help overcome startup torque at low wind speeds, enabling the system to overpower the resistive torque of the drive-train and generator. Therefore, the findings could provide valuable insights into the design and operation of small wind turbines.
The work is divided into six main sections. First, a brief review of the current state of the art in topics related to this research is presented. Section 2 describes the mathematical formulations used to achieve the main results. The technical facilities used for conducting the experimental tests and the methodology employed in the research are described in Section 3. The results of the experimental tests are analyzed in Section 4, followed by a discussion of the findings in Section 5. This study concludes with the main findings and recommendations for future research.
2. Mathematical Formulation
This section explains the mathematical foundations used to obtain the results shown in this research, including the following:
- Calculating power dissipation from Lissajous curves and its connection to the discharge modality;
- Quantifying how the measured power affects the flow compared to body-force models;
- Providing a detailed explanation of the process for converting displacement fields into density maps, including the correlation parameters involved, and
- Blade element theory.
2.1. Instantaneous Electric Power and Lissajous Curves
The instantaneous power in an alternating current (AC) circuit is obtained by Equation (1):
where is the electric power; is the potential difference; and is the electric current.
On the other hand, Lissajous curves are patterns created by combining two perpendicular harmonic motions. These curves help analyze phase and frequency relationships between two signals, particularly in oscilloscope measurements. They are described by the following parametric equations:
where are the amplitudes of the signals in the x and y axes; are the angular frequencies (); are phase shifts; and t denotes time. For DBD plasma actuators, the dissipated power is calculated from the area enclosed by the voltage–charge curve on an oscilloscope as [28,29]:
The integral can be calculated numerically, for example, using Simpson’s rule with an even number of sub-intervals, n.
The shape of the curve (asymmetrical lobes, additional loops) relates to different discharge modes (barrier versus corona) and, thereby, variations in EHD efficiency.
2.2. Body Force Modeling (BFM) Method
From Enloe et al. [30], the volumetric body force applied by atmospheric pressure plasma on the airflow is modeled as follows:
where is the electrohydrodynamic force; is the electrical field; and depends on the charged species density. By correlating electric power, P, with , the increase in local flow velocity, , can be estimated, and consequently, the change in aerodynamic coefficients, such as
where is the lift coefficient per unit length; is the drag coefficient per unit length; is the air density; and c is the chord length of the airfoil.
2.3. Image Processing and Density Maps
The displacement fields were computed using a standard PIV-like approach with normalized cross-correlation (NCC) between consecutive Schlieren images and . Each pair of images was divided into interrogation windows of size pixels with 50% overlap, corresponding to a spatial resolution of pixels. The temporal resolution was set to between frames.
To reduce edge effects and improve correlation peak detection, each interrogation window was weighted by a two-dimensional Gaussian window function:
where is the standard deviation controlling the effective width of the Gaussian kernel, typically chosen as , with w denoting the window size.
The normalized cross-correlation for each window was computed as follows:
where are the integer pixel displacements that maximize within the search range. Sub-pixel accuracy was obtained by fitting a 2D Gaussian peak to the correlation surface. The resulting displacement vectors were interpolated over the full field to construct the velocity map , which was subsequently converted into a density map using the simplified relation .
- Apply normalized cross-correlation with a Gaussian window of size w (e.g., pixels) and 50% overlap, with temporal resolution (e.g., 5 ms).
- Determine the optimal displacement in each window by
- Interpolate the vectors to form a local velocity map, then convert to a density map using the simplified equation of state .
This procedure quantifies density and velocity gradients induced by the EHD flow, which are directly related to changes in and .
2.4. Blade Element Theory
A wind turbine rotor consists of airfoils that generate lift by virtue of the pressure difference across the airfoil. Blade element theory refers to an analysis of forces at a section of the blade, as a function of blade geometry [31]; see Figure 1. Lift and drag coefficients allow comparison of aerodynamic characteristics regardless of airfoil size or flow conditions. They are calculated by normalizing forces using dynamic pressure and a reference area as follows:
where and are the lift and drag coefficients, respectively; and are the incremental lift and drag forces of the blade element, respectively; is the relative wind velocity; and is the blade element span length.

Figure 1.
Airfoil element from the blade geometry of a horizontal-axis wind turbine [31].
From Figure 1, the perpendicular (this contributes to the rotor axial thrust) and tangential (this contributes to the rotor drive) forces exerted by the wind on the wind turbine rotor can be identified. Using Equations (11) and (12), the aerodynamic forces are described as follows:
where is the incremental force normal to the plane of rotation; is the incremental force tangential to the circle swept by the rotor; is the angle of relative wind; and B is the blade number of the rotor. The differential torque, , caused by the tangential force operating at a distance, r, from the center is given by the following:
The differential mechanical power of the rotor, , as a function of the aerodynamic coefficients, is defined in Equation (16). Manwell et al. [31] provide a more detailed description of the blade element method.
On the other hand, the capacity factor of a wind turbine, , at a specific site is defined as the ratio of the actual energy produced by the turbine to the energy it could have produced if it operated at its rated power, over a certain period of time. Therefore,
where is the cut-in wind speed, which is the minimum wind speed required for a wind turbine to start generating electricity; is the cut-out wind speed, which is the maximum wind speed at which a wind turbine safely shuts down to prevent damage; is the power curve of the wind turbine as a function of wind speed; is a wind speed probability distribution used to represent the wind resource, such as the Rayleigh distribution or Weibull distribution; is the rated power of the wind turbine; and is the study time, usually one year (8760 h).
3. Materials and Methods
DBD plasma actuators are electronic devices designed to control aerodynamics by attaching flow to surfaces and delaying the transition from laminar to turbulent flow, as shown in Figure 2. A simple plasma actuator consists of two electrodes separated by a dielectric material. One electrode is exposed to the surrounding air, while the other is asymmetrically located on the opposite side of the dielectric and is grounded to complete the circuit. By applying a high-voltage discharge to the electrodes, they energize the surface from the exposed electrode to the encapsulated one, thereby creating an atmospheric pressure plasma. Plasma affects airflow through interactions between charged (excited) particles and neutral particles in the surrounding air [17]. When a plasma actuator is activated, two major phenomena occur in the surrounding air, as follows:
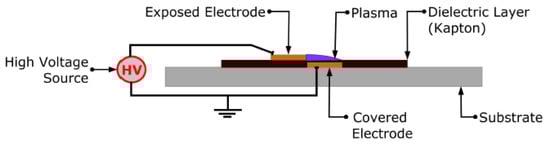
Figure 2.
Simple setup for dielectric barrier discharge plasma actuators used in airflow control [16].
- The formation of an EHD force; and
- The generation of thermal effects between the electrodes.
The EHD force results from the exchange of momentum between charged and neutral particles, leading to the formation of a tangential wall jet along the plasma actuator’s surface [32,33]. In turn, the thermal effects produced by the plasma actuator include two heating mechanisms: heating of the dielectric material and Joule dissipation [23,34].
On the other hand, the methodology was designed to analyze how airflow is affected by DBD actuators and to evaluate their effectiveness in harnessing wind energy for SHAWT; see Figure 3. Therefore, the main steps involve developing and implementing DBD plasma actuators on an airfoil of the SHAWT blade, focusing on

Figure 3.
Methodology employed in developing the research.
- Airfoil selection;
- Installation, parameterization, and instrumentation of DBD plasma actuators; and
- Flow visualization through optical systems.
3.1. Airfoil Selection
In order to properly select the airfoil for a wind turbine rotor blade design, it is essential to establish design priorities, such as
- High lift coefficient;
- High slope of the lift coefficient curve as a function of angle of attack;
- Low drag coefficient; and
- High aerodynamic efficiency ( ratio) over a wide range of angles of attack.
Determining the lift and drag coefficients of an airfoil is crucial for understanding its performance in a small wind turbine. These coefficients depend on the angle of attack, , and Reynolds number, . Small wind turbines operate within Reynolds numbers ranging from to [35,36]. Numerical analyses were performed using QBlade 2.0.7 software [37] and the Airfoil Tools website (http://airfoiltools.com/search/index, accessed on 15 January 2025), focusing on five commonly used airfoils in the development of small wind turbines [38,39,40], which are listed below:
- NACA 4412;
- NACA 6021;
- NACA 0012;
- NACA 0015; and
- S1210.
The selection of specific airfoils was based on their common use in the design of SHAWT, ensuring the relevance and applicability of the study’s results. These airfoils were chosen to accurately reflect the aerodynamic features needed for optimal performance in these wind turbines. Figure 4 shows how lift and drag coefficients vary with the angle of attack for the five examined airfoils at . Although curves assist in visualizing overall trends in the airfoil’s aerodynamic properties, selecting the optimal airfoil for designing a small wind turbine rotor requires further analysis.

Figure 4.
Airfoil polar graph showing lift and drag coefficients for the five studied airfoils at : (a) Behavior of the lift coefficient, , as a function of the angle of attack, ; and (b) Behavior of the drag coefficient, , as a function of the angle of attack, .
For a thorough evaluation, it is important to consider the lift-to-drag ratio, , known as aerodynamic efficiency. This metric allows for an accurate comparison of airfoils, accounting for both their ability to produce lift and the losses caused by aerodynamic drag. Therefore, analyzing the ratio is a key step in choosing the most suitable airfoil, as it helps maximize the tangential force and minimize the normal force of a SHAWT rotor, as shown in Equations (13) and (14), respectively.
Figure 5 shows that the S1210 airfoil has the highest ratio within the to angle-of-attack range. However, the NACA 4412 airfoil also exhibits a high ratio, though slightly lower than those recorded by S1210. It is worth noting that, compared to other airfoils like NACA 6021, 0012, and 0015, the NACA 4412 maintains a more consistent ratio between and , indicating stable performance under these conditions.
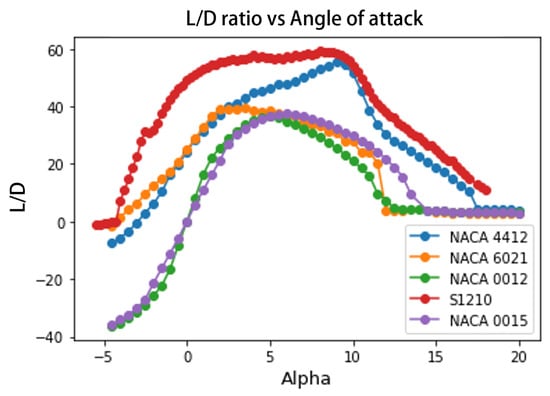
Figure 5.
Airfoil polar plot displaying the lift-to-drag ratio for the five studied airfoils at .
The selection of the airfoil for this work was based on a comprehensive analysis considering both aerodynamic performance criteria and the practical feasibility of manufacturing the airfoil and implementing DBD plasma actuators. Although the S1210 airfoil demonstrated better aerodynamic efficiency, the final decision was to use the NACA 4412 airfoil due to its lower geometric complexity, especially at the trailing edge. In contrast, the more complex geometry of the S1210 airfoil poses significant manufacturing challenges and difficulties in installing the plasma actuators.
3.2. Installation and Setup of DBD Plasma Actuators
The efficiency of the DBD plasma actuator in flux induction relies on precise configuration and proper instrumentation. In order to maximize momentum transfer from ions to neutral gas molecules and achieve optimal velocities, careful tuning of the physical parameters of the DBD actuator, as well as the discharge voltage and frequency, is essential. In these actuators, the asymmetric placement of the electrodes creates an electric field that triggers plasma formation on the dielectric surface. Charged particles, when accelerated, transfer their momentum to the neutral air molecules around them, producing thrust in the direction tangential to the airfoil surface. The optimal placement of the electrodes is crucial for system efficiency and depends on factors such as the length of the coated electrode and the applied voltage.
Previous studies, such as the one conducted by Matsuda et al. [26], have found that the highest induced velocities occur when the spacing between the electrodes, g, and the length of the encapsulated electrode, , follows the empirical relationship:
This ratio suggests that the electrode gap should stay within this range because too much separation reduces the plasma generation area. At larger distances, the weaker electric field limits plasma formation and decreases the acceleration of charged particles, which affects the actuator’s efficiency.
Figure 6 displays the schematic of the DBD plasma actuator. The device features a 0.1 mm thick polyimide (Kapton) film as a dielectric and two electrodes: one exposed, made of copper with a thickness of 0.2 mm, and another grounded, covered with 0.1 mm Kapton tape to prevent disruptive discharges on the bottom surface. Copper was selected as the electrode material due to its high electrical conductivity, which is significantly higher than that of aluminum. This allows plasma to be generated at a lower voltage, reducing Joule heating and decreasing the risk of actuator damage during operation. Based on previous experimental tests [41] and the empirical relationship in Equation (18), the gap between the electrodes was set at 2 mm. A neon light transformer with a 15 kV output, connected to a STACO ENERGY model 1010B variac (Staco Energy Products Co., Dayton, OH, USA), was used to generate high-voltage discharges. This setup and parameter selection aimed to optimize plasma generation and flow induction, ensuring efficient and controlled operation of the DBD plasma actuator.

Figure 6.
Schematic of DBD plasma actuator, showing the arrangement of the polyimide (Kapton) film and copper electrodes.
Figure 7a shows the placement of the actuator at the leading edge of the NACA 4412 airfoil to generate and control flow within the boundary layer. The airfoil was produced using additive manufacturing with 3D printing and polylactic acid (PLA) filament. Then, the DBD plasma actuator was embedded into the airfoil surface. The choice of the leading edge for installing the actuator is based on the need to directly influence how the airflow initially interacts with the airfoil surface. This approach alters the airfoil’s aerodynamic behavior, promotes boundary-layer re-energization, and reduces flow separation under low Reynolds-number conditions.

Figure 7.
DBD plasma actuator configuration on the NACA 4412 airfoil. (a) Schematic diagram of the plasma actuator mounted on the leading edge airfoil; (b) Plasma actuator mounted on the airfoil, operating at 6 kV and 0.071 mA. The device has an exposed electrode measuring 10 mm, an encapsulated electrode measuring 15 mm, and a 2 mm gap.
Figure 7b shows the actual implementation of the DBD plasma actuator. Experimental testing of this setup will assess its effect on airfoil aerodynamic efficiency, helping to determine the plasma actuators’ ability to improve aerodynamic performance in SHAWT. The figure also shows the prototype plasma actuator installed on the leading edge of the NACA 4412 airfoil, where a voltage of 6 kV was applied, producing visible plasma between the electrodes. The voltage applied to the actuator was monitored using a data acquisition system based on the ATmega328p microcontroller (Microchip Technology Inc., Chandler, AZ, USA), along with a ZMPT101B AC voltage sensor (Zhiyuan Electronics Co., Ltd., Chongqing, China) and a multimeter with high-voltage measurement tips. The current consumed by the plasma actuator was measured with a non-invasive SCT-013-100 current sensor (YHDC, Beijing, China). This instrumentation allowed for accurate recording of the electrical parameters, providing key information about the actuator’s behavior under different operating conditions.
Additionally, spectroscopic characterization of the plasma was carried out using an Ocean Optics SB2000 spectrometer (Ocean Insight, Orlando, FL, USA) to analyze the emitted optical spectrum and identify the main ionized species. This analysis is essential for understanding the efficiency of the energy transfer between the electric field and the surrounding air flow.
The wiring diagram of the electronic devices used in the instrumentation of the DBD plasma actuator is shown in Figure 8. The combination of electrical and spectroscopic data collection methods provides a comprehensive characterization of plasma behavior, offering a solid experimental foundation to evaluate the actuator’s effect on the aerodynamics of the NACA 4412 airfoil.

Figure 8.
Schematic of the DBD plasma actuator setup and instrumentation. The diagram uses different line colors to distinguish between power supply connections (red/black) and instrumentation lines (yellow/green), helping to avoid confusion between high-voltage circuits and data acquisition systems.
3.3. Schlieren Optical Technique
Schlieren optical is a method used to photograph fluid flow. This technique employs a single parabolic mirror (either converging or diverging), a point light source, and a high-resolution camera, arranged strategically to capture variations in air density caused by the interaction of plasma with the surrounding flow. To improve the quality of Schlieren images, the light source and camera were aligned along the mirror’s optical axis, reducing the reflection angle and ensuring an optimal light path. The distance between the camera and the light source was adjusted to minimize aberrations and enhance contrast and sharpness in the flow visualization. A critical component of this system is the optical blade, positioned at the mirror’s focal plane. Proper positioning of the blade enables partial blocking of light refracted by flux density differences, thereby enhancing contrast variations in the captured image. This study experimentally determined that blocking of the light at the focal point offers the best depiction of air density gradients caused by the plasma actuator.
Figure 9 illustrates the schematic of the experimental setup used to visualize the flow produced by the DBD actuator. This setup allows for detailed analysis of plasma effects on air movement, offering important insights into the boundary layer development and how the flow interacts with the airfoil. For illuminating the Schlieren system, a 5 W LED light source was used, partially blocked by an opaque surface with a 0.5 mm diameter aperture to produce a well-defined light beam. This setup improves resolution in visualizing air density variations. The optical system includes a spherical mirror measuring 150 mm in diameter with a focal length of 500 mm. Choosing a mirror with these specifications enhances the detection of flow disturbances caused by the plasma actuator. A square blade was employed to block refracted light rays, increasing the system’s sensitivity to air density gradients. For image capture, a Sony digital camera (Sony Corporation, Tokyo, Japan) with an effective resolution of 1280 × 800 pixels was used, ensuring a clear representation of the aerodynamic effects produced by the plasma actuator.
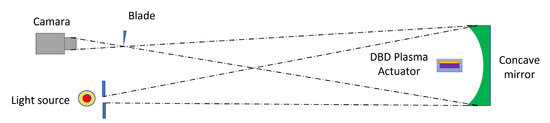
Figure 9.
Schematic of the Schlieren optical setup designed in this work for analyzing the flow induced by the DBD plasma actuator.
Figure 10a illustrates the experimental setup, showing the arrangement of the optical elements and the precise alignment of the light source, mirror, and camera. The integration of these components provides a solid method for visually analyzing the airflow altered by the plasma actuator. This experimental setup allows for the assessment of how the flow interacts with the airfoil, providing essential data for boundary layer control analysis.

Figure 10.
Experimental Schlieren setup and DBD actuator configuration: (a) an optical bench used for Schlieren visualization; and (b) airfoil configuration with mounted plasma actuator.
Figure 10b shows the mounting of the airfoil equipped with the DBD plasma actuator. The airfoil was placed on an elevated base and aligned with the circumference of the spherical mirror, ensuring that the light beam hits the area of interest directly. Precise alignment and centering of the airfoil are essential for optimal imaging in the Schlieren system. This setup enables us to analyze the flow behavior induced by the plasma actuator with high resolution, providing valuable insights into the interaction between the plasma and the boundary layer.
4. Results
4.1. Characterization of Optical Spectrum and Electrical Parameters of DBD Plasma Actuator
Measurements of the optical spectrum and electrical parameters of the plasma produced by the DBD actuator system were performed using the instrumentation setup shown in Figure 8. The results obtained are presented and analyzed below.
In Figure 11, the optical spectrum of the plasma generated by the DBD actuator under a high-voltage alternating current (AC) discharge is shown. This analysis is crucial for understanding plasma composition and behavior because excited species directly influence the actuators’ ability to modify the boundary layer on the airfoil. The peaks with higher intensity correspond to ionized particles in the plasma, indicating the excitation of different chemical species. The following excited species were identified:
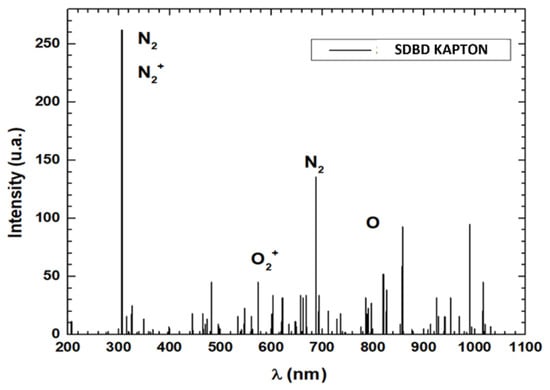
Figure 11.
Optical emission spectrum of plasma produced by the DBD actuator.
- Excited nitrogen molecules ();
- Molecular nitrogen ions ();
- Molecular oxygen ions ();
- Neutral oxygen atoms (O).
These charged and excited particles, when exposed to the applied electric field, transfer momentum to neutral molecules through collisions, generating the net EHD force responsible for the observed aerodynamic effects. Therefore, the spectral signatures not only confirm plasma generation but also offer insight into the mechanisms that connect electrical power input to enhanced aerodynamic performance.
Furthermore, spectroscopic analysis identified major emission lines of (391 nm) and O* (777 nm). The relative intensities of these peaks were used to estimate local charged-particle density via Boltzmann plots. Regions with stronger emission correspond to higher -field gradients and, thus, maximum , which aligns with the zones of greatest observed in density maps.
Figure 12a shows the plasma discharge created between the electrodes of the DBD actuator when a high-voltage AC is applied. Meanwhile, Figure 12b displays the electrical parameters measured during operation. The following values were obtained:

Figure 12.
Electrical characterization of the DBD plasma actuator: (a) plasma discharge between the electrodes, and (b) electric current and voltage measurements.
- Applied electric potential (AC): 6 kV
- Circulating current: 0.071 mA
- Inlet power: 0.426 W
These values indicate the low energy demand of the plasma actuator, making it suitable for applications in active aerodynamics. Additionally, electrical analysis helps evaluate the stability and efficiency of the plasma actuator system.
Electrical characterization of the DBD plasma actuators enabled assessment of the relationship between the applied voltage and the current in the system. A key method for understanding the discharge dynamics is the use of Lissajous curves, which visually illustrate the phase relationship between voltage and the charge accumulated on the actuator dielectric. This analysis is essential for determining the energy behavior of the system and estimating the power dissipated. Figure 13 shows the Lissajous curve derived from experimental data. The shape of the curve depends on the amplitude of the applied voltage, the frequency of the excitation signal, and the capacitance of the actuator. Its analysis enables the evaluation of the power dissipated in the system and the efficiency of the ionization process in the discharge.

Figure 13.
Lissajous curve representing the relationship between voltage and load in the DBD actuator.
In order to quantify the heat energy dissipated, Simpson’s integration method was used to estimate the area enclosed by the Lissajous curve. This value indicates the power lost relative to the total electrical power supplied to the actuator. The analysis results are shown in Table 1. It is observed that at an applied voltage of 6 kV, the measured circulating current in the system is 0.071 mA, corresponding to a total power of 0.426 W. Equation (19) was used to calculate the percentage of power lost as heat during one cycle of the DBD plasma actuator. This calculation was based on the area within the Lissajous curve, which shows the energy absorbed and dissipated in the dielectric during each excitation cycle. The results indicate that about 7.04% of the total power supplied is lost as heat, implying that a significant portion of the energy is not converted into useful EHD force.

Table 1.
Electrical parameters of the DBD plasma actuator.
This thermal energy dissipation mainly results from resistive losses in the dielectric and the Joule effect in the electrodes, as well as the capacitive coupling dynamics of the system. Reducing these losses is essential to improving the efficiency of DBD plasma actuators in flow control applications, which can be achieved by optimizing electrode geometry, choosing the right dielectric material, and adjusting the excitation frequency.
Although the measured thermal loss accounts for just 7.04% of the input power (0.426 W), the remaining W is converted into EHD work on the fluid. The magnitude of the electrohydrodynamics force was determined using the following empirical model:
where is a conversion coefficient for DBD actuators with similar geometric characteristics and operating conditions [42,43]. is the effective power. Substituting into the above expression, . This EHD force directly drives the observed and coefficients, Equations (8) and (9), respectively.
4.2. Experimental Results of the Schlieren System
The use of optical systems in studying DBD plasma actuators enables analysis of two key phenomena. First, it helps detect changes in fluid density, specifically air. Second, it allows visualization of the pressure distribution near the electrodes. In this study, the flow dynamics induced by varying the applied voltage were examined, along with the thermal effects caused by Joule heating of the electrodes. This optical method provides detailed insights into the interaction between plasma and surrounding fluid, enhancing understanding of the flow and thermal behaviors caused by DBD plasma actuators.
Figure 14 shows a series of images taken with the Schlieren system, which lets us observe the behavior of the induced airflow and identify the EHD phenomenon. These images provide detailed insights into how the DBD plasma actuators interact with the surrounding air, aiding in the analysis of their impact on flow dynamics. This optical method is essential for assessing how effectively actuators generate and control aerodynamic flow. In Figure 14a, the airfoil is shown with the plasma actuator off, where the ambient laboratory conditions stay the same, with no notable change in air density or flow. In contrast, in Figure 14b, when a high voltage (kV) discharge is applied, a visible variation in air density appears, caused by the flow induced by the plasma actuator through EHD effects. Figure 14a illustrates an increase in the flow intensity induced by the DBD plasma actuator, accompanied by turbulent behavior associated with changes in the applied voltage. However, when reaching an optimal voltage, as seen in Figure 14c (6 kV), the flow shifts from turbulent to laminar. This change appears through small shock waves in the flow, which eventually stabilize completely. Finally, in Figure 14c, the induced flow becomes completely laminar, removing turbulence. At this point, the flow sticks to the airfoil, confirming the effectiveness of DBD plasma actuators in accurately modifying and controlling the airflow around it.
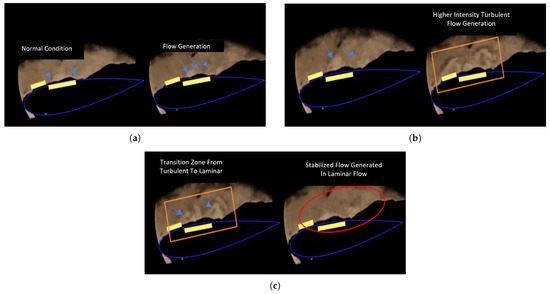
Figure 14.
Schlieren visualization of the NACA 4412 airfoil with DBD plasma actuator. The figure illustrates the optical observations obtained under various operating conditions, highlighting the impact of plasma actuation on the flow field and delineating the transition and stabilization regions. (a) Flow visualization under normal and activated plasma conditions; (b) activated plasma displaying higher-intensity turbulent flow (orange box); (c) flow transition and stabilization: from turbulent to laminar transition zone (orange box) and stabilized laminar region (red ellipse).
Utilizing the Schlieren imaging system, real-time observation of the flow evolution induced by the DBD plasma actuators was achieved, with adjustments made to the electrical discharge on the electrodes. To improve the detection of flux density variations, image processing techniques employing computer vision systems were applied. OpenCV library 4.9.0 (OpenCV.org, Redwood City, CA, USA; https://opencv.org, accessed on 15 January 2025) and Python libraries 3.11 (Python Software Foundation, Wilmington, DE, USA; https://www.python.org, accessed on 15 January 2025) were used to generate graphical representations of the flux density changes attributable to the actuators.
To quantify the intensity of the induced flux, two images were compared—the processed image obtained using Schlieren and a reference image taken before applying the electrical voltage. Figure 15B displays the reference image used to compare and measure changes in flux density caused by the DBD plasma actuators. Image processing involves subtracting the reference image from the image captured during actuator activation (Figure 15A), which highlights variations in air density caused by the EHD effect. After this subtraction, a color scale is used to visually represent the magnitude of the flux density changes. In Figure 15C, the resulting image from this process is shown, where regions with higher color intensity indicate greater variations in air density. This method provides a clearer and more measurable visualization of the flow induction produced by the DBD plasma actuators in response to changes in the applied voltage.
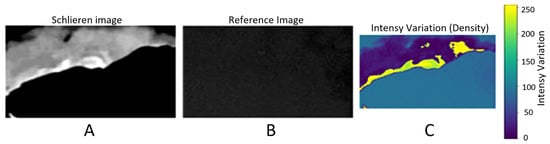
Figure 15.
Image processing to analyze the intensity variations of the generated flow. (A) Schlieren image displaying density gradients caused by plasma actuation. (B) Reference image without actuation, used as a baseline. (C) Processed map of intensity changes, highlighting density fluctuations in the flow field.
Figure 16 shows the plots of how airflow density varies due to the DBD plasma actuators based on the applied voltage intensity. These plots enable detailed analysis of how the electric field affects flow dynamics near the airfoil. In the first graph, shock waves indicate the transition of airflow from turbulent to laminar flow. This behavior is directly related to the voltage applied to the plasma actuator electrodes and the resulting electrohydrodynamic interactions with neutral air particles. The color scale highlights areas with the greatest disturbances, offering important insights into the magnitude and direction of the induced flux. The lower graph, which includes a colorimetric scale, illustrates the effect of the stabilized induced flow. During this process, air particle excitation causes momentum transfer, helping the flow become predominantly laminar. The intensity of the colors in this visualization reflects the air density distribution and clearly shows the evolution of the induced flow around the airfoil. These images are crucial for understanding how DBD plasma actuators interact with flow over the airfoil, allowing us to evaluate their efficiency and improve their design for future flow control and aerodynamic enhancements.

Figure 16.
Variation in flux density induced by plasma actuators in response to changes in the applied voltage intensity.
4.3. Integration and Scalability of the Comprehensive Small Wind Turbine System and Distributed Network Approach
The experimental results from this study demonstrate that DBD plasma actuators are capable of locally modifying the aerodynamic characteristics of a NACA 4412 airfoil by inducing flow through electrohydrodynamic (EHD) forces. Although the methodology was evaluated at a laboratory scale on a segment of a wind turbine blade, its integration into comprehensive systems presents promising prospects for active flow control applications in small wind turbines.
Figure 17 presents a flowchart of multiscale integration. Initially, the deployment of plasma actuators as distributed active control devices on turbine blades should be considered, enabling the dynamic modulation of flow adhesion based on wind conditions. This approach could be incorporated into an embedded control system architecture, managed by real-time optimization algorithms that selectively activate or deactivate specific actuation zones to maximize the lift coefficient and delay flow separation. Such a system would be particularly advantageous in urban or complex environments characterized by prevalent and variable aerodynamic disturbances. Furthermore, the localized impact of plasma can be integrated into a multi-scale model, wherein optimization at the airfoil level (microscale) contributes to improved performance of the entire rotor (mesoscale) and ultimately enhances the overall energy efficiency of the wind turbine (macroscale). This hierarchical approach can be managed using Computational Fluid Dynamics simulation tools in conjunction with electrical models of the plasma, representing an important avenue for future system integration development.

Figure 17.
Representation of multiscale integration.
On the other hand, in distributed generation applications such as microgrids powered by renewable energy, enhancing turbine performance through active flow control can provide significant benefits. Installing plasma actuators on small wind turbines—used on rooftops, in residential areas, or at charging stations—would boost energy collection in low wind conditions, thereby extending the effective operating range of these devices. However, scaling up the system for industrial use presents specific technological challenges. These include managing the thermal aspects of the plasma system, ensuring electronics reliability in varying environmental conditions, and integrating efficient, compact high-voltage power supplies. Likewise, developing adaptive control strategies based on flow or pressure sensors will be vital to guarantee the system’s robust and autonomous operation.
5. Discussion
The results from this work provide strong experimental evidence of the potential of DBD-type plasma actuators as active flow control devices in aerodynamic applications. Visualization of the flow with the Schlieren optical system allows observing the transition from a turbulent to a predominantly laminar regime as the applied voltage increases. This transition demonstrates the EHD effect produced by the actuators, consistent with previous studies documented in the boundary layer control literature.
From an energetic perspective, the results of electrical characterization and the construction of Lissajous curves showed that approximately 7.04% of the energy supplied is dissipated as heat. This relatively low percentage indicates good efficiency of the discharge system in converting electrical energy into useful aerodynamic momentum. Additionally, optical spectroscopy identified excited species such as , , and oxygen atoms, confirming the stable generation of plasma under atmospheric conditions.
Computational analysis of the Schlieren images, processed with computer vision techniques, provided both qualitative and quantitative estimates of flow density changes. This data is crucial for evaluating the development of the plasma-induced jet and its interaction with the airfoil boundary layer.
The selection of the NACA 4412 airfoil, although not the most theoretically efficient, was justified by its simpler geometry and easier manufacturing process. Using the actuator at the leading edge of the airfoil effectively influenced flow behavior at low Reynolds numbers, which is especially significant for small wind turbines in urban settings. The estimated electrohydrodynamic force () is capable of maintaining the flow attached to the airfoil surface, thereby augmenting flow circulation and, consequently, enhancing the lift force. According to blade element theory, the lift and drag coefficients directly influence the torque and mechanical power generated by the wind turbine rotor, as demonstrated in Equations (15) and (16). Consequently, the lift-to-drag ratio is an essential parameter for enhancing the aerodynamic performance of the wind turbine.
Finally, the proposed multi-scale integration of the DBD system into a complete wind turbine, along with its potential use in distributed power grids, shows a promising direction. However, for practical implementation, challenges such as thermal management, miniaturization of high-voltage sources, and developing sensor-based adaptive control systems will need to be addressed.
6. Conclusions
This study conducted an experimental analysis of how atmospheric pressure plasma modifies airflow on a small wind turbine airfoil. The Schlieren visualization method provided a detailed view of the airflow generated by the DBD plasma actuators, illustrating the transition from turbulent to laminar flow as the voltage increased.
The electrohydrodynamic force on the airflow was estimated to be . It was visually observed that the flow remains attached to the surface due to this force. The increased airflow circulation and adherence over the airfoil directly boost the coefficient, thereby helping to improve rotor startup torque at low wind speeds.
This research highlights the importance of selecting the right airfoil and configuring the DBD plasma actuator by considering factors like geometry and materials. Adjusting these elements is essential to enhance system performance and advance the development of aerodynamic efficiency technologies, such as low-power wind turbines. In this case, the tests were conducted on a device that has a 0.1 mm thick polyimide (Kapton) film as a dielectric, with two electrodes—one exposed, made of copper with a thickness of 0.2 mm, and the other grounded, covered with 0.1 mm Kapton tape to prevent disruptive discharges on the bottom surface.
Despite the promising results obtained, some key areas require further research. First, the stability and durability of plasma and dielectric materials should be tested under various environmental conditions and over extended periods of use. Additionally, integrating a load cell-based data acquisition system to directly measure plasma-induced changes in lift and drag is essential. This will enable more precise validation of the actual aerodynamic effects on the airfoil. Furthermore, combining computational fluid dynamics (CFD) simulations with electrical models of the plasma, along with the development of real-time adaptive control strategies, is a strategic direction for effectively implementing these actuators in small wind turbines.
Author Contributions
Conceptualization, R.C.-A.; Methodology, H.M. and E.R.-T.; Validation, H.M.; Formal analysis, E.R.-Z., H.M., E.R.-T., A.B.-O. and R.C.-A.; Investigation, E.R.-Z.; Writing—original draft, E.R.-Z.; Writing—review & editing, E.R.-T., A.B.-O. and R.C.-A.; Supervision, H.M. and R.C.-A. All authors have read and agreed to the published version of the manuscript.
Funding
This research was partially funded by Tecnológico Nacional de México, research project 22996.25-P, and Universidad Nacional Autónoma de México, research project DGAPA IN102225.
Data Availability Statement
The original contributions presented in this study are included in the article. Further inquiries can be directed to the corresponding author.
Acknowledgments
The authors gratefully acknowledge the financial support provided by SECIHTI through the fellowship 4032835, granted to Eder Ricoy-Zárate. The authors acknowledge the assistance provided by Edna Vázquez Vélez, Osvaldo Flores Cedillo, Hector Hugo Hinojosa Galvan, and Juana Romero Vergara for the technical support.
Conflicts of Interest
The authors declare no conflicts of interest.
References
- Bianchini, A.; Bangga, G.; Baring-Gould, I.; Croce, A.; Cruz, J.I.; Damiani, R.; Erfort, G.; Simao Ferreira, C.; Infield, D.; Nayeri, C.N.; et al. Current status and grand challenges for small wind turbine technology. Wind. Energy Sci. 2022, 7, 2003–2037. [Google Scholar] [CrossRef]
- Sunderland, K.; Woolmington, T.; Conlon, M.; Blackledge, J. Urban deployment of small wind turbines: Power performance and turbulence. In Proceedings of the 48th International Universities Power Engineering Conference (UPEC, 2013), Dublin, Ireland, 2–5 September 2013. [Google Scholar] [CrossRef]
- Tummala, A.; Velamati, R.K.; Sinha, D.K.; Indraja, V.; Krishna, V.H. A review on small scale wind turbines. Renew. Sustain. Energy Rev. 2016, 56, 1351–1371. [Google Scholar] [CrossRef]
- Van Treuren, K.W. Current Status and Future Challenges for Small Horizontal Axis Wind Turbines. J. Eng. Gas Turbines Power 2019, 141, 090801. [Google Scholar] [CrossRef]
- Anup, K.; Whale, J.; Urmee, T. Urban wind conditions and small wind turbines in the built environment: A review. Renew. Energy 2019, 131, 268–283. [Google Scholar] [CrossRef]
- Monjardín-Gámez, J.d.J.; Campos-Amezcua, R.; Gómez-Martínez, R.; Sánchez-García, R.; Campos-Amezcua, A.; Trujillo-Franco, L.G.; Abundis-Fong, H.F. Large eddy simulation and experimental study of the turbulence on wind turbines. Energy 2023, 273, 127234. [Google Scholar] [CrossRef]
- Abohela, I.; Sundararajan, R. Analytical Review of Wind Assessment Tools for Urban Wind Turbine Applications. Atmosphere 2024, 15, 1049. [Google Scholar] [CrossRef]
- Alam, F.; Jin, Y. The Utilisation of Small Wind Turbines in Built-Up Areas: Prospects and Challenges. Wind 2023, 3, 418–438. [Google Scholar] [CrossRef]
- Clavijo-Camacho, J.; Gomez-Ruiz, G.; Ruiz-Rodriguez, F.J.; Sanchez-Herrera, R. A modular IGBT power stack - based and open hardware framework for small wind turbines assessment. Sustain. Energy Technol. Assess. 2024, 66, 103804. [Google Scholar] [CrossRef]
- Clavijo-Camacho, J.; Gomez-Ruiz, G.; Sanchez-Herrera, R.; Magro, N. Remote Real-Time Monitoring and Control of Small Wind Turbines Using Open-Source Hardware and Software. Appl. Sci. 2025, 15, 6887. [Google Scholar] [CrossRef]
- Lahoz, M.; Nabhani, A.; Saemian, M.; Bergada, J.M. Wind Turbine Enhancement via Active Flow Control Implementation. Appl. Sci. 2024, 14, 11404. [Google Scholar] [CrossRef]
- Mertz, B.E.; Corke, T.C. Single-dielectric barrier discharge plasma actuator modelling and validation. J. Fluid Mech. 2011, 669, 557–583. [Google Scholar] [CrossRef]
- Benard, N.; Jolibois, J.; Moreau, E. Lift and drag performances of an axisymmetric airfoil controlled by plasma actuator. J. Electrost. 2009, 67, 133–139. [Google Scholar] [CrossRef]
- Zhang, X.; Cui, Y.; Tay, C.M.J.; Khoo, B. Flow field generated by a dielectric barrier discharge plasma actuator in quiescent air at initiation stage. Chin. J. Aeronaut. 2021, 34, 13–24. [Google Scholar] [CrossRef]
- Akansu, Y.; Karakaya, F.; Şanlısoy, A. Active Control of Flow around NACA 0015 Airfoil by Using DBD Plasma Actuator. EPJ Web Conf. 2013, 45, 01008. [Google Scholar] [CrossRef]
- Khoshkhoo, R.; Jahangirian, A. Flow separation control over airfoils using DBD plasma body force. J. Braz. Soc. Mech. Sci. Eng. 2014, 38, 2345–2357. [Google Scholar] [CrossRef]
- Benard, N.; Debien, A.; Moreau, E. Time-dependent volume force produced by a non-thermal plasma actuator from experimental velocity field. J. Phys. D Appl. Phys. 2013, 46, 245201. [Google Scholar] [CrossRef]
- Belan, M.; Messanelli, F. Compared ionic wind measurements on multi-tip corona and DBD plasma actuators. J. Electrost. 2015, 76, 278–287. [Google Scholar] [CrossRef]
- Sato, S.; Sakurai, M.; Ohnishi, N. Enhancement of electrohydrodynamic force with AC bias voltage in three-electrode dielectric barrier discharge plasma actuators. J. Appl. Phys. 2022, 132, 113301. [Google Scholar] [CrossRef]
- Yu, H.; Zheng, J. Numerical investigation of control of dynamic stall over a NACA0015 airfoil using dielectric barrier discharge plasma actuators. Phys. Fluids 2020, 32, 035103. [Google Scholar] [CrossRef]
- Versailles, P.; Ghosh, S.; Vo, H.D.; Masson, C. Preliminary Assessment of Wind Turbine Blade Lift Control via Plasma Actuation. Wind. Eng. 2011, 35, 339–356. [Google Scholar] [CrossRef]
- Su, C.; Wang, S.; Shih, C.; Yang, Y. Visualization of hot flows of tall space fires in model experiments with Schlieren Photography technique. SpringerPlus 2016, 5, 1744. [Google Scholar] [CrossRef] [PubMed]
- Greenblatt, D.; Pfeffermann, O.; Keisar, D.; Göksel, B. Wells Turbine Stall Control Using Plasma Actuators. AIAA J. 2021, 59, 765–772. [Google Scholar] [CrossRef]
- Göksel, B.; Greenblatt, D.; Rechenberg, I.; Paschereit, C.O. Plasma actuators for active flow control. In Proceedings of the German Aerospace Congress, Friedrichshafen, Germany, 26–29 September 2005; Volume III. pp. 1831–1837. [Google Scholar] [CrossRef]
- Rezaei, H.; Kazemi, M.; Saeedi, M.; Jahangirian, A.; Mani, M. Experimental investigation of the effects of different DBD plasma actuators on the aerodynamic performance of the NACA0012 airfoil. J. Phys. D Appl. Phys. 2025, 58, 115210. [Google Scholar] [CrossRef]
- Matsuda, T.; Maeda, T.; Kamada, Y.; Ushigusa, T.; Kobayashi, H.; Tanaka, M. Application of flow control using plasma actuator to horizontal axis wind turbine. J. Phys. Conf. Ser. 2020, 1618, 052022. [Google Scholar] [CrossRef]
- Tanaka, M.; Kubo, N.; Kawabata, H. Plasma actuation for leading edge separation control on 300-kW rotor blades with chord length around 1 m at a Reynolds number around 1.6 × 10⁶. J. Phys. Conf. Ser. 2020, 1618, 052013. [Google Scholar] [CrossRef]
- Kaneko, T.; Chen, Q.; Harada, T.; Hatakeyama, R. Structural and reactive kinetics in gas–liquid interfacial plasmas. Plasma Sources Sci. Technol. 2011, 20, 034014. [Google Scholar] [CrossRef]
- Roth, J.R. Aerodynamic flow acceleration using paraelectric and peristaltic electrohydrodynamic effects of a One Atmosphere Uniform Glow Discharge Plasma. Phys. Plasmas 2003, 10, 2117–2126. [Google Scholar] [CrossRef]
- Enloe, C.L.; McLaughlin, T.E.; VanDyken, R.D.; Kachner, K.D.; Jumper, E.J.; Corke, T.C.; Post, M.; Haddad, O. Mechanisms and Responses of a Dielectric Barrier Plasma Actuator: Geometric Effects. AIAA J. 2004, 42, 595–604. [Google Scholar] [CrossRef]
- Manwell, J.F.; McGowan, J.G.; Rogers, A.L. Wind Energy Explained: Theory, Design and Application, 2nd ed.; Wiley: Hoboken, NJ, USA, 2009. [Google Scholar]
- Gilbart, B.; Dickenson, A.; Walsh, J.L.; Hasan, M.I. Dominant heating mechanisms in a surface barrier discharge. J. Phys. D Appl. Phys. 2021, 54, 175202. [Google Scholar] [CrossRef]
- Shen, L.; Chen, Z.; Wen, C.Y. Thermal Effect on the Performance of an Alternating-Current Dielectric-Barrier-Discharge Plasma Actuator. AIAA J. 2020, 58, 3368–3377. [Google Scholar] [CrossRef]
- Starikovskiy, A.; Meehan, K.; Persikov, N.; Miles, R. Static and dynamic stall control by NS SDBD actuators. Plasma Sources Sci. Technol. 2019, 28, 054001. [Google Scholar] [CrossRef]
- Singhal, A.; Castañeda, D.; Webb, N.; Samimy, M. Control of Dynamic Stall over a NACA 0015 Airfoil Using Plasma Actuators. AIAA J. 2018, 56, 78–89. [Google Scholar] [CrossRef]
- Zhu, Z.; Fradera-Soler, P.; Jo, W.; Liu, F. Numerical simulation of the flow around a square cylinder under plasma actuator control. Phys. Fluids 2021, 33, 123611. [Google Scholar] [CrossRef]
- Marten, D.; Wendler, J. QBlade Guidelines v0.6; Technical University of Berlin: Berlin, Germany, 2013. [Google Scholar]
- Natarajan, K.; Suthakar, T. Insight aerodynamic analysis on small-scale wind turbines airfoils for low Reynolds number applications. Environ. Prog. Sustain. Energy 2022, 41, e13807. [Google Scholar] [CrossRef]
- Venkateswaran, V.K.; Fernandez-Gamiz, U.; Portal-Porras, K.; Blanco, J.M. Numerical study on aerodynamics of small scale horizontal axis wind turbine with Weibull analysis. Sci. Rep. 2024, 14, 26790. [Google Scholar] [CrossRef]
- Çay, A. Energy consumption and energy saving potential in clothing industry. Energy 2018, 159, 74–85. [Google Scholar] [CrossRef]
- Jukes, T.N. Smart control of a horizontal axis wind turbine using dielectric barrier discharge plasma actuators. Renew. Energy 2015, 80, 644–654. [Google Scholar] [CrossRef]
- Moreau, E. Airflow control by non-thermal plasma actuators. J. Phys. D Appl. Phys. 2007, 40, 605–636. [Google Scholar] [CrossRef]
- Boeuf, J.P.; Lagmich, Y.; Unfer, T.; Callegari, T.; Pitchford, L.C. Electrohydrodynamic force in dielectric barrier discharge plasma actuators. J. Phys. D Appl. Phys. 2007, 40, 652–662. [Google Scholar] [CrossRef]


Disclaimer/Publisher’s Note: The statements, opinions and data contained in all publications are solely those of the individual author(s) and contributor(s) and not of MDPI and/or the editor(s). MDPI and/or the editor(s) disclaim responsibility for any injury to people or property resulting from any ideas, methods, instructions or products referred to in the content. |
© 2025 by the authors. Licensee MDPI, Basel, Switzerland. This article is an open access article distributed under the terms and conditions of the Creative Commons Attribution (CC BY) license (https://creativecommons.org/licenses/by/4.0/).