Abstract
In gas drilling operations, the blooey line is highly susceptible to erosion-induced leakage. This study focuses on the use of field-welded V-shaped elbows in blooey lines, establishing a numerical method for erosion prediction and validating its accuracy through experimental data. The numerical results reveal that, due to the inclined configuration of the V-shaped elbow, particles from the central inlet flow directly impact the outer wall of the outlet pipe opposite the inlet, and then rebound and strike the inner wall. Meanwhile, solid particles near the pipeline wall on both sides of the inclined plane collide with the outer wall and exit in a helical flow pattern along the outlet pipe. The maximum erosion rate (3.6 × 10⁻⁴ kg/(m2·s)) occurs at the intersection of these spiral particle flows. Based on erosion predictions under various operating conditions, an empirical formula was established to correlate the erosion rate with the gas injection rate at a rate of penetration (ROP) of 1 m/h, along with corresponding conversion relationships for different ROPs. The predicted residual thickness of the V-shaped elbow showed a 6.8% relative error compared to field measurements. The proposed method can be programmed to enable real-time monitoring of the residual wall thickness and the remaining service life of the blooey line before leakage occurs, assisting field operators in determining optimal pipeline replacement schedules to ensure operational safety.
1. Introduction
Gas drilling technology, known for its advantages such as a high rate of penetration (ROP) and prevention of well leakage, is widely applied in highly abrasive or fractured formations. To enhance well construction efficiency and reduce costs, a specific oilfield in China has integrated gas drilling technology with a factory drilling model to address well leakage issues encountered during surface drilling. Following a blooey line rupture causing a severe gas drilling accident that resulted in a blowout and fire at Well Qionglai-1 in Sichuan [1,2], safety requirements mandated the use of large-diameter blooey lines with minimal right-angle elbows. However, due to the constraints of wellsite layouts, the use of field-welded V-shaped elbows (Figure 1) has become necessary. After the blooey line is led out by the rotating control head (RCH), it is supported by a bracket mounted on the mud tank and guided by a deflection block. Only V-shaped elbows can be welded on-site for ground-level turns, ultimately directing the blooey line to the cuttings pond. To ensure the smooth execution of gas drilling operations and avoid interruptions caused by blooey line washouts, it is particularly important to develop a method that can quickly determine the residual thickness and remaining service life of these V-shaped elbows.
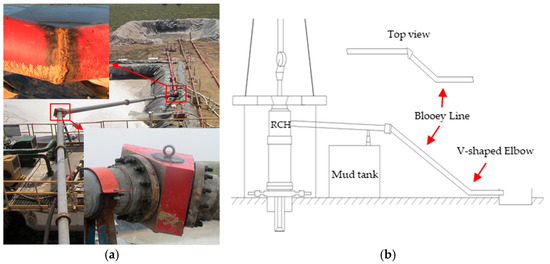
Figure 1.
Layout of the blooey line: (a) field installation photograph; (b) schematic diagram.
Regarding pipeline erosion and puncture leaks, three main research methods are used: erosion theory research, physical experiments, and numerical simulations. In 1873, Reynolds proposed a solid particle erosion theory to explain the phenomenon of erosion wear [3]; in 1960, Finnie established the first theoretical model to predict the erosion rate based on particle velocity and impact angle [4]; and in 1991, Nesic was the first to use computational fluid dynamics (CFD) technology to analyze pipeline erosion–corrosion problems [5]. Since then, CFD technology has been widely applied to erosion research. Nowadays, scholars often combine physical experiments with numerical simulations to reveal the mechanisms and evolution processes of erosion. For example, Putra used CFD methods and experimental testing to predict erosion problems in offshore pipelines and risers [6]. Alghurabi investigated the erosion characteristics of screen pipes using four different erosion models in Fluent software [7]. Farokhipour analyzed the erosion of four common pipe fittings under varying sand concentrations, demonstrating that plugged tees exhibited superior erosion resistance and that sand concentration significantly impacted erosion rates [8,9]. Khan studied the effect of sand fineness concentration on 90° elbow erosion mechanisms, revealing that erosion hotspots migrate downstream with increasing sand concentration in slug flow conditions [10]. Through combined experimental and numerical approaches, Haider evaluated the influence of particle size and wall rebound models on erosion predictions, finding that existing models tend to overpredict erosion and proposing improved wall rebound models that better match experimental results [11,12]. Previous studies have significantly advanced the understanding of the mechanisms of erosion in drilling components.
In 2011, during a gas drilling operation at Well Qionglai-1 in Sichuan, a high-pressure and high-production gas layer was encountered, leading to a blowout and fire caused by the bursting of the blooey line hose. This incident resulted in casualties and significant economic losses [13]. Subsequently, researchers have paid more attention to the safety issues present in blooey lines. Meng et al. conducted an on-site investigation to analyze the cause of the explosion accident at Well Qionglai-1. They determined that the immediate cause was the blockage of the blooey line by rock cuttings, which led to a high-pressure buildup and the subsequent rupture of the pipeline. The tee in the blooey line had experienced severe erosion, causing a reduction in wall thickness. Under high pressure, the pipeline explosively burst outward at the thinned section. The specific location of the wall thinning was confirmed through numerical simulation methods [1,2]. Lian et al. studied the mechanism of blooey line elbow erosion during gas drilling when encountering high-production gas layers. Using CFD methods and oilfield test methods, they determined a quantitative relationship between the extreme erosion rate and the elbow angle under gas limit flow rates of 100 × 104 m3/d and 50 × 104 m3/d [14,15]. Based on the operational conditions of the gas gathering station in Daqing Oilfield, Lin et al. conducted a gas–solid erosion experiment using a full-scale elbow. They validated the erosion results obtained from CFD simulations and employed the gray correlation method to assess the factors influencing elbow erosion. The factors were ranked in descending order of impact as follows: gas flow rate, bend diameter ratio, particle mass flow, and particle size [16]. Liu et al. utilized CFD methods to investigate the erosion characteristics of the blooey lines used in gas drilling in the Sichuan–Chongqing region. They found that the most severe erosion occurred at the first joint between the rotary control head and the ground pipeline within the blooey line, which intensified as the gas injection rate increased. Additionally, in their study, the T-joint demonstrated superior erosion resistance compared to the elbow joint [17]. Ming statistically analyzed the four most commonly used methods for connecting blooey lines used in the Sichuan–Chongqing and Tarim regions. He found that 42 puncture leak accidents occurred in 194 gas drilling operations, accounting for 21.6% of the total, and used CFD methods to calculate the erosion rate and impact force of different structural elbows, establishing a calculation method for the blowout limit capacity of blooey lines [18]. Feng [19] and Wen [20] used CFD methods to analyze the impact of structural parameters (pipe diameter, turn angle, and bend diameter ratio) and working condition parameters (particle velocity, particle volume fraction, and particle diameter) on elbow section erosion. They proposed an improved structure to reduce the erosion of right-angle elbows, providing a theoretical reference for the safe use of blooey lines. Chen analyzed the erosion resistance of different elbows and the characteristics of the gas–solid coupling vibrations of a blooey line under the action of impact force, creating an optimized structure for blooey lines suitable for use in the Sichuan–Chongqing region [21]. Although the above studies used a combination of experiments and numerical calculations to analyze the factors affecting the erosion of blooey lines, they did not further explore how to apply these research results to monitor and predict their service life, thereby establishing reasonable replacement schedules. This study therefore focuses on the use of V-shaped elbows in blooey lines that are susceptible to erosion. Utilizing an established erosion calculation method, the quantitative relationship between erosion rate and changes in operational parameters is investigated. Furthermore, a programmable method is developed for the real-time calculation of the residual wall thickness and remaining service life of a blooey line. This approach enables gas drilling operators to quickly predict the residual thickness, formulate optimal replacement schedules, and ensure the safe operation of blooey lines.
2. Methods
2.1. Mathematical Model
2.1.1. Governing Equations for the Continuous Phase
When gas carrying rock cuttings flows in the blooey line, the following continuity and momentum equations are established [22].
In the equations, ρ is the gas density (kg/m3); ui is the velocity in the i-direction (m/s); t is the time (s); p is the static pressure (Pa); τij is the stress tensor; gi is the gravitational acceleration in the i-direction (m/s2); and i and j are parameter subscripts, taking values of 1, 2, and 3, corresponding to the components in the x, y, and z directions, respectively.
2.1.2. Governing Equations for the Discrete Phase
When rock cuttings are transported by gas through the blooey line, they are subjected to various forces, including their own gravity and the drag force exerted by the gas. Although other additional forces also act on the particles, their magnitudes are negligible compared to the drag force. The governing equations for the discrete phase are as below [22].
In the equations, u is the velocity of the continuous phase (m/s); up is the velocity of the discrete phase (m/s); ρp is the particle density (kg/m3); dp is the particle diameter (m); Re is the relative Reynolds number; CD is the drag coefficient; Fi is other forces in the i-direction (N); and a1, a2, and a3 are constants.
2.1.3. Erosion Wear Equation
The erosion of a blooey line by rock cuttings is represented by Equation (4). This formula primarily considers the influence of factors such as the velocity of the solid discrete phase particles, mass flow rate, impact angle, and particle diameter on the erosion wear of the pipe wall [22].
In the equation, R is the erosion rate per unit area of the wall (kg/(m2·s)); N is the number of impacting particles per unit area; Mp is the mass flow rate of the impacting particles (kg/s); c(dp) is the shape function of the particle diameter; ƒ(θ) is the impact angle function; θ is the impact angle of the particles on the wall (°); A is the area of the wall calculation unit (m2); and n is the velocity exponent.
2.1.4. Service Life Before Leakage
The remaining service life before leakage occurrence can be calculated based on the wall thickness and erosion rate:
In the formula, t is the remaining time to leakage (h); ρc is the wall density (kg/m3); δ is the wall thickness (m); and R is the erosion rate (kg/(m2·s)).
To evaluate the overall erosion condition of the blooey line’s V-shaped elbow, the total erosion quantity is defined as
In the formula, Vk is the erosion quantity (kg/s); Rk is the erosion rate (kg/(m2·s)); k is the ROP value (m/h); and A is the pipe wall area (m2).
2.2. Erosion Model Validation
Bourgoyne experimentally characterized erosion mechanisms in standard 90° elbows and established a service life prediction model for gas–sand flow conditions. When applied to the experimental data given in Table 1, this model predicted a service life of 402 s [23]. To validate the computational approach adopted in this study, parallel simulations of the identical elbow geometry were conducted using ANSYS 11 (ANSYS China Co., Ltd., Beijing, China). While Bourgoyne’s model omits particle size and concentration effects, Chen’s comprehensive study demonstrated through combined experimental and numerical analysis that erosion rates stabilize when particle counts exceed 50,000 [24]. The present simulations confirmed this behavior, with 50,000 and 60,000 particles producing nearly equivalent erosion rates of 0.173 kg/(m2·s) and 0.171 kg/(m2·s), respectively. The implementation of Equation (5) yielded corresponding service lives of 432 s and 437 s—deviating by only 7.5% and 8.7% from Bourgoyne’s reference values. This close agreement strongly supports the validity of the erosion modeling methodology employed in this work (Figure 2).

Table 1.
Key parameters for numerical simulation.
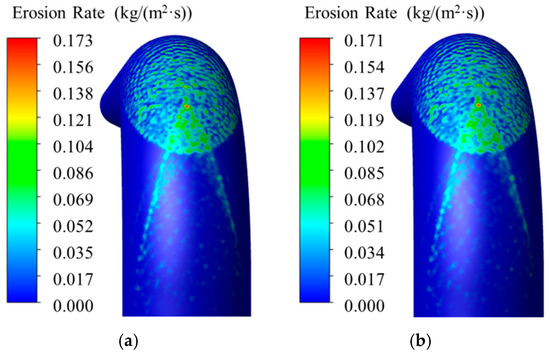
Figure 2.
Erosion rate contours under different particle counts: (a) 50,000 particles; (b) 60,000 particles.
2.3. Particle Size Analysis of Rock Cuttings
Chen’s study demonstrated that, when the solid particle count exceeds 50,000, the influence of particle number or size on erosion becomes negligible, with erosion depending solely on particle volume fraction [24]. However, when particle counts fall below 50,000, the quantity of particles significantly affects erosion rates. In gas drilling applications, the ROP varies according to different formation types, resulting in corresponding variations in solid particle production. To accurately characterize particle-induced erosion in blooey lines, a thorough analysis of drilling cutting composition is essential. This analysis enables the precise determination of mass fractions for different particle sizes in numerical simulations.
The well was drilled using an air hammer, with a maximum air injection rate of 240 m3/min and a maximum ROP of 12 m/h. The particle size distribution of the collected rock cuttings was evaluated via sieve analysis. According to the “particle size effect” in cutting erosion, the erosion wear rate increases with particle size within a small range. However, when the particle size exceeds a certain critical value, the erosion wear rate remains nearly constant or changes minimally. Particles of excessively small size possess insufficient kinetic energy to exceed the elastic limit of the pipeline material during impact, thereby failing to induce material damage [25]. Consequently, standard sieves with mesh sizes of 18, 24, 30, 45, 60, 80, 150, and 300 (Anping Lvruo E-commerce Co., Ltd., Hengshui, China) were sequentially selected to analyze the gas drilling cuttings, as shown in Figure 3a,b. The collected gas-drilled rock samples comprise a mixture of rock cuttings with varying particle sizes.
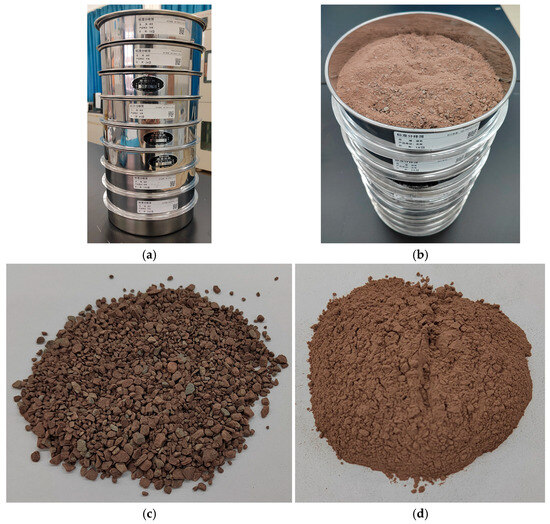
Figure 3.
Sieve analysis of gas-drilled rock cuttings. (a) Standard sieve; (b) rock cutting sample; (c) particles with a diameter greater than 1.41 mm; (d) particles with a diameter less than 0.08 mm.
Figure 4 shows a histogram and the cumulative distribution curve of particle size composition after drying, sieving, and weighing. Particles with a diameter greater than 1.41 mm account for approximately 38.86%, followed by those with a diameter less than 0.08 mm (19.44%) and those in the range of 0.08 to 0.17 mm (13.62%). Representative drill cutting particles are presented in Figure 3c,d. This particle size distribution provides the initial composition for subsequent numerical calculations.
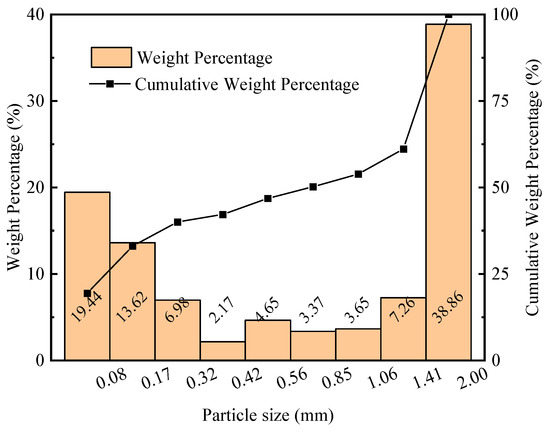
Figure 4.
Histogram and cumulative distribution curve of particle size composition.
3. Discussion of Results
3.1. Flow Field Analysis of V-Shaped Elbow
The blooey line was constructed using a modified 9 5/8-inch casing with a wall thickness of 11.05 mm and an inner diameter of φ222.4 mm. A three-dimensional model of the flow field domain was established based on the structural dimensions of the V-shaped elbow welded on-site, as shown in Figure 5. To avoid interference from boundary conditions on the elbow region during the calculation process, the inlet pipe length was set to 600 mm, and the outlet pipe length was set to 1800 mm. The blooey line configuration features a 30° inclination angle between its central axis plane and the horizontal plane, with a 152° intersection angle between the inlet and outlet pipes. Following Zhao’s mesh sensitivity analysis method [26], boundary layer refinement was implemented at the pipe walls to ensure the grid independence of the computational results, as illustrated in Figure 5c.

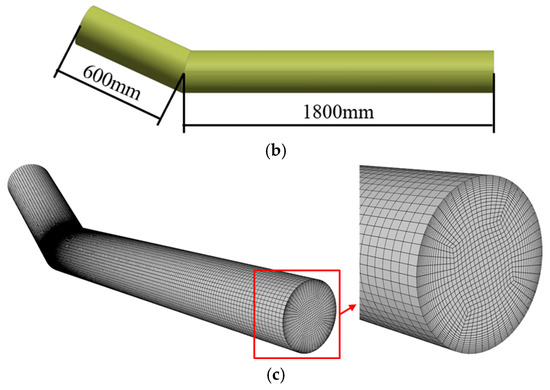
Figure 5.
Flow field domain model and mesh model of the V-shaped elbow. (a) Top view; (b) front view; (c) mesh model.
In the numerical simulation, the V-shaped elbow’s boundary conditions were configured according to its actual installation position in the blooey line. The inlet was set with a gas injection rate of 170 m3/min, while the outlet boundary condition was defined as atmospheric pressure. For modeling the particle–wall interactions, the stochastic rebound model developed by Grant and Tabakoff was employed to accurately simulate the complex collision behavior between solid particles and the elbow surface. The ROP was set to 1 m/h, and the mass flow rate of the rock cuttings was calculated as 0.1 kg/s based on the bit size. The volume fraction of the rock cuttings in the gas flow was 1.6 × 10⁻⁵; the mass fractions of particles of various sizes are shown in Table 2. For computational accuracy, the representative particle diameter for each sieve fraction was taken as the arithmetic mean of adjacent standard test sieve apertures. The pressure, velocity, and erosion contour diagrams inside the V-shaped elbow were obtained through calculations, as shown in Figure 6.

Table 2.
Mass fractions of cutting particles by size class.
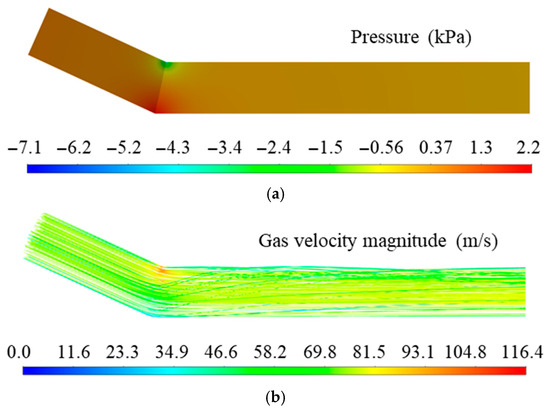
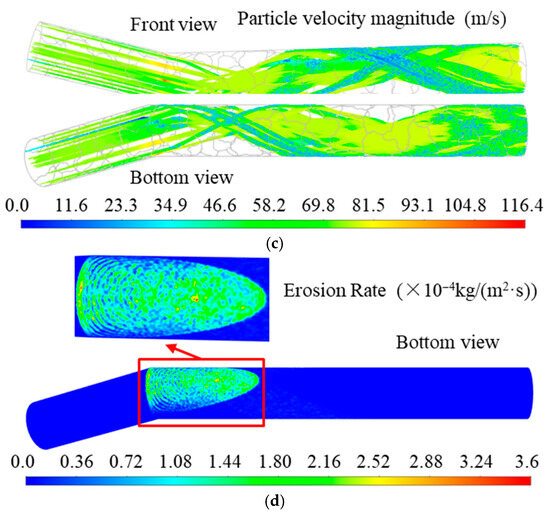
Figure 6.
Numerical calculation results. (a) Pressure profile diagram; (b) gas path line diagram; (c) particle track diagram; (d) erosion rate diagram.
As shown in Figure 6a, the pressure on the midsection of the entire V-shaped elbow fluctuates around 0.3 kPa. However, a localized low-pressure zone appears on the inner side of the elbow corner, while a localized high-pressure zone appears on the outer side of the corner, with the maximum pressure reaching only 2.2 kPa. According to the gas state equation, the overall gas compression in the V-shaped elbow is negligible, justifying the treatment of the gas as an incompressible fluid in this computational study.
Figure 6b shows the streamline diagram of the gas flow, where the color of the streamlines represents the gas velocity. The gas enters the V-shaped elbow in a laminar state, and at the bend section, due to its low mass, the majority of flow directly turns and exits the elbow while a minor portion impacts the upper wall after flow deflection. The maximum gas velocity occurs on the inner side of the V-shaped elbow bend, reaching approximately 116.4 m/s. A localized low-velocity zone appears on the outer side of the bend, and these two regions coincide with the localized high-pressure and low-pressure zones in Figure 6a, consistent with the principle of conversion between kinetic and potential energy described by Bernoulli’s equation.
Correspondingly, the trajectory of the rock cuttings carried by the gas is shown in Figure 6c. When the gas carrying rock cuttings passes through the bend of the V-shaped elbow, the gas, due to its low mass, directly changes direction. In contrast, the rock cuttings, due to their larger mass and higher kinetic energy and inertia, separate from the gas and directly impact the outer wall of the outlet pipe of the V-shaped elbow. Figure 6b shows that in the high-velocity zone, the high-speed gas flow causes the cutting particles to accelerate, though their velocity decreases after passing through this zone. Particles in the central region of the inlet pipe directly impact the outer wall of the outlet pipe opposite the inlet, and then rebound to strike the inner wall. However, in regions A and B near the side walls (Figure 5a), located away from the inclined plane of the blooey line axis, particles form helical trajectories along the outer wall after impact, gradually losing velocity while continuously eroding the pipe wall. At the intersection of these spiral particle flows from both sides, combined with particles from the inlet center, the maximum erosion rate reaches approximately 3.6 × 10⁻⁴ kg/(m2·s), as shown in Figure 6d. The erosion zone originates from the V-shaped elbow weld seam and extends symmetrically forward along the outer wall of the outlet pipe facing the inlet.
3.2. Effect of Operation Parameters on Erosion
3.2.1. Influence of Gas Injection Rate on Erosion
During factory batch drilling, the drill bit and formation lithology remain unchanged in the surface section, and the same blooey line is used. To better monitor the service life of the blooey line, numerical calculations were performed to determine the rate and quantity of erosion under different gas injection rates and ROPs, as shown in Figure 7.
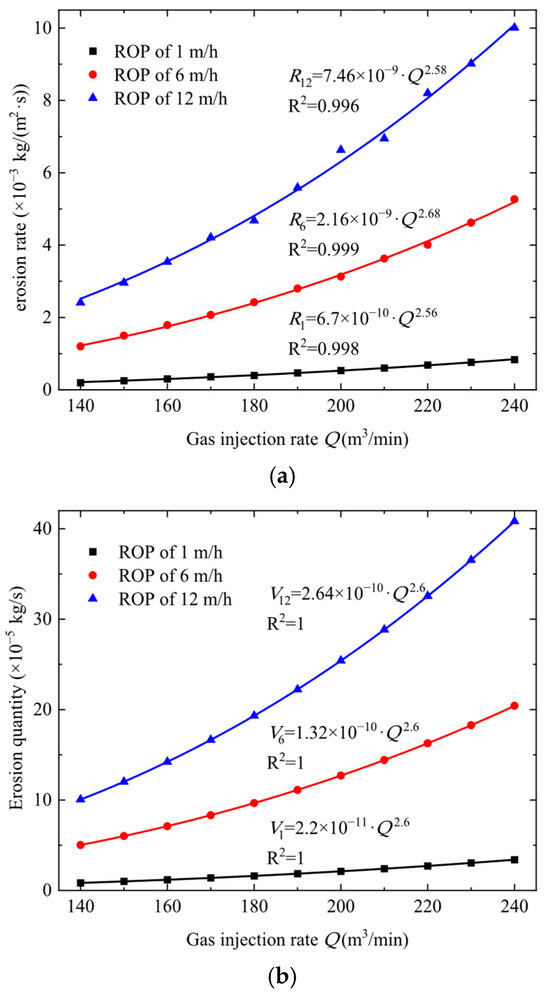
Figure 7.
Erosion rate and quantity under different gas injection rates. (a) Erosion rate; (b) erosion quantity.
When the ROP k = 1 m/h, the erosion rate R1, as a function of the gas injection rate Q, is fitted as
In the formula, R1 is the erosion rate at k = 1 m/h (kg/(m2·s)), and Q is the gas injection rate (m3/min).
In Figure 8, the erosion rate Rk and erosion quantity Vk under the same gas injection rate Q are plotted on the same graph, showing a linear relationship. The fitted relationship is
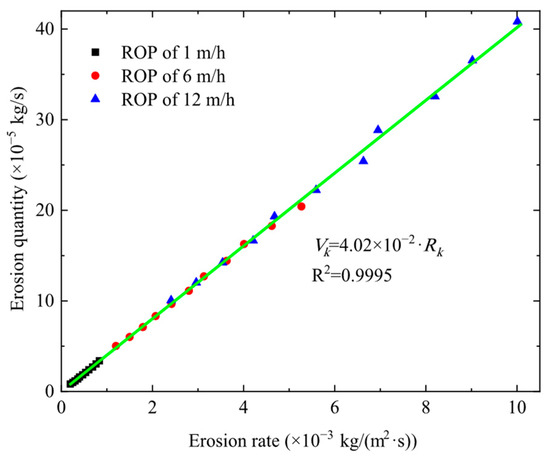
Figure 8.
Relationship between erosion rate and erosion quantity under the same gas injection rate.
Using the erosion rate at k = 1 m/h as a baseline, the erosion rates under other ROP conditions are divided by the erosion rate at the same gas injection rate and k = 1 m/h, defining the parameter β.
The erosion rates at ROP values of 3 m/h, 6 m/h, and 12 m/h are compared to the erosion rate at k = 1 m/h, and the scatter plots of the ratios under different gas injection rates Q are shown in Figure 9. The scatter points for the same ROP are fitted into horizontal lines, and the fitted values for different ROPs are listed in Table 3.
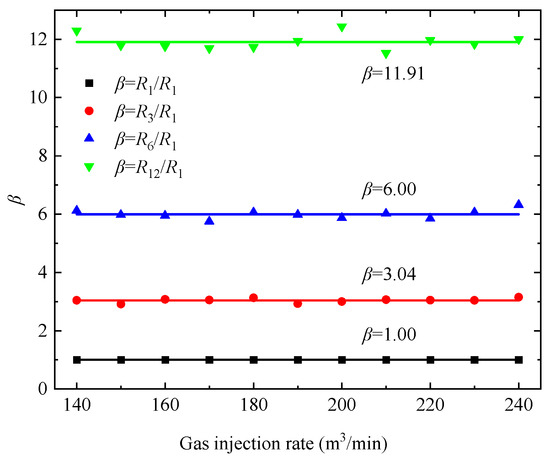
Figure 9.
Relationship between relative erosion rate and gas injection rate.

Table 3.
Fitted values of relative erosion rates under different ROPs.
Based on the fitted values in Table 3, the relationship between k and the relative erosion rate β is plotted in Figure 10, showing a linear relationship with a ratio of 1, meaning the relative erosion rate equals the ratio of the ROP, as follows:
β = k
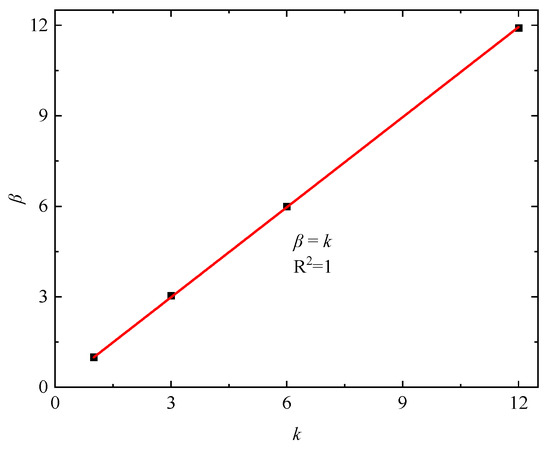
Figure 10.
Relationship between ROP and relative erosion rate.
Based on the above analysis, the erosion rate, Rk, under different ROPs, k, and gas injection rates, Q, can be calculated using the erosion rate at k = 1 m/h (Equation (7)):
The erosion rates obtained through numerical simulations and Equation (11) when k = 8 m/h are compared in Figure 11 and Table 4. The results show good agreement, with the maximum error occurring at a gas injection rate of 160 m3/min, with a value of 4.8%.
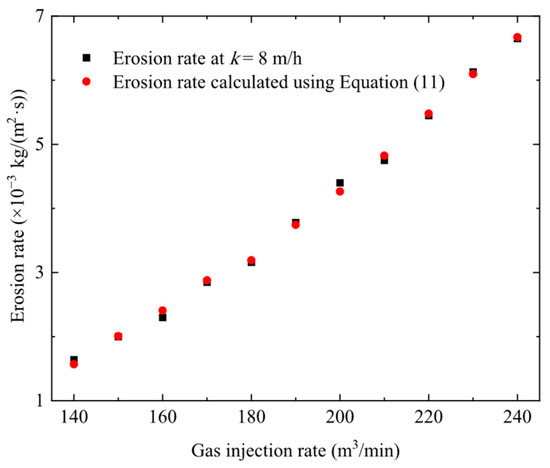
Figure 11.
Distribution of erosion rate differences at k = 8 m/h.

Table 4.
Erosion rates at k = 8 m/h calculated by two methods.
3.2.2. Influence of ROP on Erosion
According to Equation (10), the ratio of erosion rates under different ROPs equals the ratio of the corresponding ROPs. At ROPs of 1 m/h, 6 m/h, and 12 m/h, the number of rock cuttings in the gas flow varies, and as the number of particles impacting the blooey line wall per unit time increases, erosion intensifies. The influence of the ROP on erosion rate and quantity is shown in Figure 12. As the ROP increases, the erosion rate and quantity increase linearly, providing a theoretical basis for calculating both parameters under different ROPs using the erosion rate at k = 1 m/h (Equation (7)).
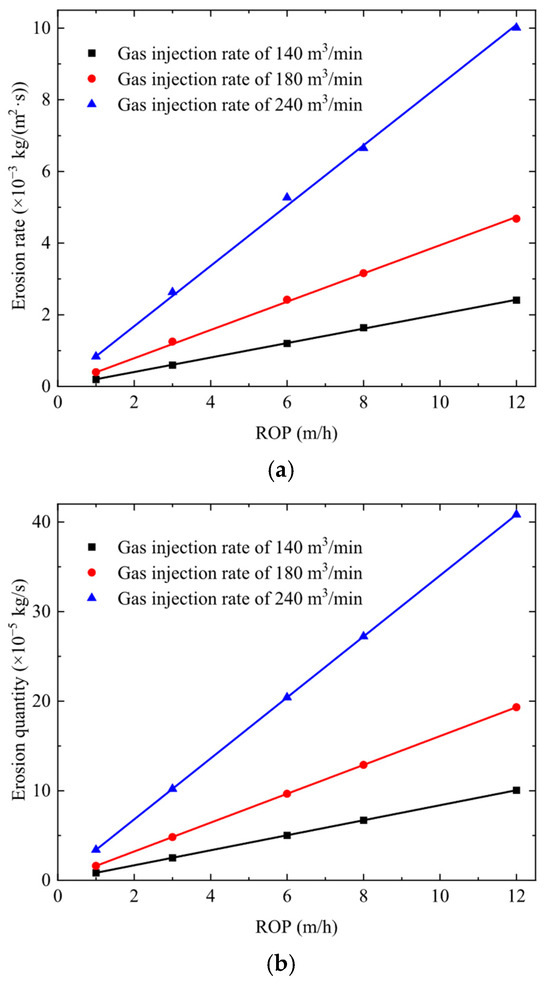
Figure 12.
Erosion rate and quantity under different ROPs. (a) Erosion rate; (b) erosion quantity.
3.3. Prediction of Blooey Line Service Life
3.3.1. Calculation Method for Residual Wall Thickness
During gas drilling operations, to avoid the occurrence of non-drilling time due to blooey line leaks, field engineers need to use thickness gauges irregularly to inspect the wall thickness of erosion-prone areas, which increases uncertainty in operational safety. To effectively monitor the blooey line’s working condition, a theoretically valid monitoring method needs to be provided.
Given the wall thickness and density of the blooey line, the residual wall thickness δt or the remaining time to leakage tk can be calculated based on the erosion rate Rk under different working conditions:
In the formula, tk is the remaining time to leakage at ROP k (h); ρc is the wall density (7850 kg/m3); δ is the wall thickness (0.01105 m); t0 is the working time at ROP k (h); and δt is the residual wall thickness after working t0 h at ROP k (m).
During the first 4 h of gas drilling with a gas injection rate of 170 m3/min and an average ROP of 2.86 m/h, the wall thickness of the V-shaped elbow was measured, as shown in Figure 13. The inlet wall thickness decreased from 11.05 mm to 10.3 mm, while the wall thickness in the severely eroded area of the outlet pipe decreased from 11.05 mm to 9.92 mm.
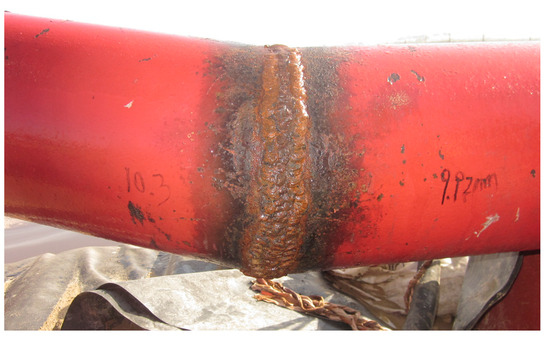
Figure 13.
Monitoring blooey line wall thickness during gas drilling.
When substituting Q = 170 m3/min, k = 2.86 m/h, and t0 = 4 h into Equations (11) and (13), the predicted wall thickness due to erosion thinning was 9.25 mm, compared to the actual value of 9.92 mm, resulting in a relative error of 6.8%. Considering calculation and measurement errors, this relative error is acceptable for engineering applications.
In practical applications, programs can be developed based on Equations (11) and (13) to calculate the residual wall thickness of a blooey line in real time under varying ROPs, enabling the determination of reasonable elbow replacement times and preventing leakage accidents.
3.3.2. Calculation Method for Remaining Time to Leakage
For gas drilling operators, the remaining service life of the blooey line can also be quickly assessed by monitoring the remaining time to leakage. By substituting Equation (7) into Equation (12), the remaining time to leakage t1 at k = 1 m/h under different gas injection rates can be obtained, as shown in Table 5.

Table 5.
Remaining time to leakage at k = 1 m/h.
When the gas injection rate is constant, the calculation formula for the remaining time to leakage can be established as follows:
In the formula, tk is the remaining time to leakage at the current ROP k (h); m is the number of ROPs during drilling; ks is the s-th ROP (m/h); and ts is the working time at the ROP ks (h).
During drilling operations, field personnel can quickly calculate the remaining time to leakage using Table 5 and Equation (14). For example, at a gas injection rate of 170 m3/min and a current ROP of 2.5 m/h, the remaining time to leakage is t2.5 = 66.9/2.5 = 26.7 h. If the ROP increases to 3.5 m/h after 2 h of drilling at 2.5 m/h, the remaining time to leakage becomes t3.5 = (66.9 − 2 × 2.5)/3.5 = 17.6 h. This quick calculation can assist field personnel in determining the optimal timing for elbow replacement, such as during gas circulation interruptions for connecting drill pipes or rig moves, thereby effectively reducing the non-drilling time caused by blooey line leakage.
4. Conclusions
Through this study, the following conclusions are obtained:
- In the inclined V-shaped elbow of a blooey line, particles from the central region of the inlet pipe directly impact the outer wall of the outlet pipe opposite the inlet. Meanwhile, cutting particles near the pipe walls in regions further away from the inclined plane of the blooey line axis form helical flows along the outlet pipe after impacting its outer wall, resulting in the maximum erosion rate occurring at the intersection of these spiral flows. After four hours of actual drilling operation, the measured wall thickness at this location reduced to 9.92 mm, while the predicted residual thickness was 9.25 mm, showing a relative error of 6.8%.
- In gas drilling, the erosion rate and erosion quantity of the V-shaped elbow increase with the gas injection rate following a power function trend, and the rate of increase accelerates as the gas injection rate rises.
- Based on the established calculation formulas of the erosion rate and quantity under different working conditions (referencing the erosion rate at 1 m/h ROP), a computational method was developed for the real-time calculation of residual wall thickness and remaining service life in the V-shaped elbows of blooey lines. The method provides gas drilling engineers with a quick calculation formula to estimate the remaining service life and determine the proper replacement timing for these elbows.
- The methodology for calculating the residual wall thickness of a V-shaped elbow in a blooey line can be extended to other elbows and bends in blooey lines, providing a basis for their programmatic management.
Author Contributions
Conceptualization, X.C.; Investigation, W.S.; Methodology, Y.G. and Q.W.; Software, T.L.; Writing—original draft, Y.G.; Writing—review and editing, C.W. All authors have read and agreed to the published version of the manuscript.
Funding
This research was funded by the Youth Innovation Talent Projects in Ordinary Universities of Guangdong Province (grant number 2023KQNCX045) and the Science and Technology Plan Projects of Maoming City (grant number 2022028).
Data Availability Statement
The raw data supporting the conclusions of this article will be made available by the authors on request.
Conflicts of Interest
The authors declare no conflicts of interest.
References
- Meng, Y.F.; Wu, S.J.; Chen, X.Y.; Zhang, Y.P.; Wang, Z.N.; Wang, X.H. Analysis on the nitrogen drilling accident of Well Qionglai 1 (I): Major inducement events of the accident. Nat. Gas Ind. 2016, 2, 548–564. [Google Scholar] [CrossRef][Green Version]
- Meng, Y.F.; Wu, S.J.; Chen, X.Y.; Zhang, Y.P.; Wang, Z.N.; Wang, X.H. Analysis on the nitrogen drilling accident of Well Qionglai 1 (II): Restoration of the accident process and lessons learned. Nat. Gas Ind. 2016, 2, 565–574. [Google Scholar] [CrossRef][Green Version]
- Reynolds, O. On the action of a blast of sand in cutting hard material. London Edinb. Dublin Philos. Mag. J. Sci. 1873, 46, 337–343. [Google Scholar] [CrossRef]
- Finnie, I. Erosion of surfaces by solid particles. Wear 1960, 3, 87–103. [Google Scholar] [CrossRef]
- Nesic, S.; Postlethwaite, J. Hydrodynamics of disturbed flow and erosion-corrosion. Part I: Single-phase flow study. Can. J. Chem. Eng. 1991, 69, 698–703. [Google Scholar] [CrossRef]
- Putra, I.W.E.; Chien, T.C.; Badaruddin, M.F.; Isa, M.H.; Hou, C.X.; Dongjie, L.; Sun, D. Sand erosion mitigation for offshore pipeline and riser—erosion prediction by computational fluid dynamic CFD analysis and experimental testing. In Proceedings of the Offshore Technology Conference Asia, Virtual and Kuala Lumpur, Malaysia, 22–25 March 2022. [Google Scholar]
- Alghurabi, A.; Mohyaldinn, M.; Jufar, S.; Younis, O.; Abduljabbar, A.; Azuwan, M. CFD numerical simulation of standalone sand screen erosion due to gas-sand flow. J. Nat. Gas Sci. Eng. 2021, 85, 103706. [Google Scholar] [CrossRef]
- Farokhipour, A.; Mansoori, Z.; Rasoulian, M.A.; Rasteh, A.; Saffar-Avval, M.; Ahmadi, G. Study of particle mass loading effects on sand erosion in a series of fittings. Powder Technol. 2020, 373, 118–141. [Google Scholar] [CrossRef]
- Farokhipour, A.; Mansoori, Z.; Rasteh, A.; Rasoulian, M.A.; Saffar-Avval, M.; Ahmadi, G. Study of erosion prediction of turbulent gas-solid flow in plugged tees via CFD-DEM. Powder Technol. 2019, 352, 136–150. [Google Scholar] [CrossRef]
- Khan, R.; Ya, H.H.; Pao, W.; Abd Majid, M.A.; Ahmed, T.; Ahmad, A.; Alam, M.A.; Azeem, M.; Iftikhar, H. Effect of sand fines concentration on the erosion-corrosion mechanism of carbon steel 90° elbow pipe in slug flow. Materials 2020, 13, 4601. [Google Scholar] [CrossRef] [PubMed]
- Haider, G.; Arabnejad, H.; Shirazi, S.A.; McLaury, B.S. A mechanistic model for stochastic rebound of solid particles with application to erosion predictions. Wear 2017, 376–377, 615–624. [Google Scholar] [CrossRef]
- Haider, G.; Othayq, M.; Zhang, J.; Vieira, R.E.; Shirazi, S.A. Effect of particle size on erosion measurements and predictions in annular flow for an elbow. Wear 2021, 476, 203579. [Google Scholar] [CrossRef]
- Liu, D.; Yang, P.; Deng, K.; Tian, S.; Yan, H.; Li, H. Dynamic response of aerodynamic flutter of blooie line during gas drilling in mountain areas. AIP Adv. 2025, 15, 015018. [Google Scholar] [CrossRef]
- Lian, Z.; Chen, X.; Lin, T.; Ming, X.; Zheng, J. Study on erosion mechanism of bending joint in blooey line. J. Southwest Pet. Univ. (Sci. Technol. Ed.) 2014, 36, 150–156. [Google Scholar]
- Zhang, Y.; Lian, Z.; Abdelal, G.F.; Lin, T. Numerical and experimental investigation on flow capacity and erosion wear of blooey line in gas drilling. J. Energy Resour. Technol. 2018, 140, 054501. [Google Scholar]
- Lin, Y.; Huang, G.; Deng, K.; Liu, B.; Zhang, X.; Mei, Z. Simulation Study on Gas-solid Erosion of 90° Elbow Based on Full-sized Physical Experiment. J. Saf. Environ. 2023, 23, 4325–4334. [Google Scholar]
- Liu, H.; Mou, H.; Liu, S.; Zhang, Y. Study on erosion of vulnerable section of blooey line in gas drilling. Lubr. Eng. 2019, 44, 81–88. [Google Scholar]
- Ming, X. Research and Safety Evaluation on Ultimate Discharge Capability of Blooey Line Used in High Production Gas Well. Ph.D. Thesis, Southwest Petroleum University, Chengdu, China, 2014. [Google Scholar]
- Feng, G. Analysis of Erosion Failure and Deformation of Blooey Line in Gas Drilling. Master’s Thesis, Southwest Petroleum University, Chengdu, China, 2014. [Google Scholar]
- Wen, S. Study on Erosion Mechanism of Wellhead Equipment in Gas Drilling. Master’s Thesis, Southwest Petroleum University, Chengdu, China, 2015. [Google Scholar]
- Chen, W. Study on Erosion and Vibration Characteristics of Sand Discharge Manifold of Gas Drilling Under Extreme Working Conditions in Mountainous Environment. Master’s Thesis, Southwest Petroleum University, Chengdu, China, 2023. [Google Scholar]
- Sun, L. ANSYS Fluent 2020 Engineering Case Studies; Peking University Press: Beijing, China, 2021; pp. 146–169. [Google Scholar]
- Bourgoyne, A.T. Experimental study of erosion in diverter systems due to sand production. In Proceedings of the SPE/IADC Drilling Conference, New Orleans, LA, USA, 6–9 March 1989. [Google Scholar]
- Chen, X.; McLaury, B.S.; Shirazi, S.A. Application and experimental validation of a computational fluid dynamics (CFD)-based erosion prediction model in elbows and plugged tees. Comput. Fluids 2004, 33, 1251–1272. [Google Scholar] [CrossRef]
- Lin, J.; Shen, T. Discussion on relation between boundary layer and erosion by striking of particles. J. Hydrodyn. 1991, 1, 72–76. [Google Scholar]
- Zhao, X.; Cao, X.; Xie, Z.; Cao, H.; Wu, C. Numerical study on the particle erosion of elbows mounted in series in the gas-solid flow. J. Nat. Gas Sci. Eng. 2022, 104, 104423. [Google Scholar] [CrossRef]
Disclaimer/Publisher’s Note: The statements, opinions and data contained in all publications are solely those of the individual author(s) and contributor(s) and not of MDPI and/or the editor(s). MDPI and/or the editor(s) disclaim responsibility for any injury to people or property resulting from any ideas, methods, instructions or products referred to in the content. |
© 2025 by the authors. Licensee MDPI, Basel, Switzerland. This article is an open access article distributed under the terms and conditions of the Creative Commons Attribution (CC BY) license (https://creativecommons.org/licenses/by/4.0/).