Article

Research on Hole-Cleaning Technology Coupled with Prevention and Removal of Cuttings Bed

1
Hubei Key Laboratory of Oil and Gas Drilling and Production Engineering, Yangtze University, Wuhan 430100, China
2
School of Petroleum Engineering, Yangtze University, Wuhan 430100, China
3
CCDC Safety & Quality Research Institute, Guanghan 618300, China
*
Authors to whom correspondence should be addressed.
Processes 2025, 13(8), 2604; https://doi.org/10.3390/pr13082604
Submission received: 26 June 2025 / Revised: 6 August 2025 / Accepted: 14 August 2025 / Published: 18 August 2025
(This article belongs to the Section Energy Systems)

Abstract

To address the critical challenges of severe fragmentation in cuttings, persistent cuttings bed accumulation, and abrupt friction torque increases during horizontal well drilling of Jurassic continental shale oil formations in J Block, Sichuan Basin—rooted in the unique high clay content that induces colloidal stability of fine cuttings and resistance to conventional cleaning—this study innovatively proposes a coupled prevention–removal hole-cleaning technology. The core methodology integrates three synergistic components: (1) orthogonal numerical simulations to optimize drilling parameters, reducing the cuttings input rate by 43.48% through “hydraulic carrying + mechanical agitation” synergy; (2) a modified Moore model with horizontal section correction factors to quantify slip velocity of cuttings, lowering the prediction error from ±20% to ±5%; and (3) a helical groove cutting removal sub with 60 m optimal spacing, enhancing local turbulence intensity by 42% to disrupt residual cuttings bed. Field validation in Well J110-8-1H demonstrated remarkable improvements: a 50% reduction in sliding friction, a 25% decrease in rotational torque, and 40% shortening of the drilling cycle. This integrated technology fills the gap in addressing the “fragmentation–colloidal stability” dilemma in shale with high clay contents, providing a quantifiable solution for safe and efficient drilling in similar continental formations.

1. Introduction

1.1. Background and Significance

Against the backdrop of a global energy structure rapidly transitioning towards decarbonization, unconventional oil and gas resources have become crucial strategic alternatives for ensuring energy security [1,2,3]. China possesses particularly significant potential in continental shale oil and gas, with technically recoverable resources estimated at 25 billion tons of oil equivalent. While marine shale gas in the Sichuan Basin, which is China’s core exploration and development region, has achieved commercial production, the development of continental shale oil and gas faces significant technical hurdles.
However, J Block’s Jurassic shale has a clay content of 50%, leading to unique challenges: (1) Over 60% of cuttings fragment into <1 mm particles, which is three times higher than adjacent blocks. (2) Colloidal stability makes traditional hydraulic cleaning ineffective—the cuttings bed thickness reaches 12–15 mm under conventional parameters, which is 2–3 times that of low-clay formation [4,5,6,7]. This high clay content not only causes cuttings to fracture and disperse easily, forming dense beds, but also exacerbates other drilling challenges by altering reservoir properties [8,9]. A comparison between cuttings returned to the shale shaker from the J Block and an adjacent block is shown in Figure 1.
The high clay content in J Block’s Jurassic shale causes severe cuttings fragmentation: over 60% of cuttings are <1 mm, with compressive strength reaching only 12–18 MPa. These fine particles form stable colloids with drilling fluid, reducing settling velocity to 0.03 m/s and leading to a dense cuttings bed [10,11,12], increasing the drilling trouble time to 13.3% A comparison of operational efficiency metrics between the blocks is presented in Table 1.
Hole-cleaning technology plays a pivotal role in addressing the drilling difficulties encountered in the high-level clay formations of the J Block. Effective hole cleaning prevents cuttings bed formation, reduces friction and torque, minimizes downhole complications, and ultimately improves drilling efficiency, shortening the drilling cycle and lowering costs [13]. Optimizing hole-cleaning technology enables safe and efficient drilling, providing strong technical support for developing continental high-level clay formations. This is crucial for advancing the effective exploitation of continental shale oil and gas resources in the Sichuan Basin and safeguarding national energy security [14,15].
To clarify the uniqueness of cutting bed challenges in J Block, the formation mechanism is analyzed as follows: The Jurassic continental shale in J Block has a total clay content of 50%, which is significantly higher than that of the adjacent marine shale. This leads to two critical issues: (1) Cuttings fragmentation: Due to low compressive strength, over 60% of cuttings are <1 mm (Figure 1a), increasing the difficulty of solid control, and (2) Colloidal stability: Clay particles form stable colloids with drilling fluid, reducing the settling velocity to 0.03 m/s. Once deposited, a stratified structure forms, resisting conventional hydraulic cleaning. These characteristics necessitate a coupled prevention–removal strategy to address the persistent cutting bed problem.

1.2. State of the Art

1.2.1. Research on Key Drilling Parameter Influences

Hole cleaning is influenced by multiple factors, which have been extensively studied. Well inclination significantly impacts cuttings transport; the cuttings bed is most difficult to remove at inclinations between 30° and 60°. Within this range, the combined effects of gravity, buoyancy, and drag forces acting on cuttings are complex, facilitating bed formation. At lower inclinations, cuttings tend to slide towards the low side under gravity [16,17]. At higher inclinations (near horizontal), the carrying capacity of the drilling fluid increases. Numerical simulations have been used to analyze cutting trajectories and accumulation patterns at various inclinations in detail [18,19].
Drill string rotation also plays a vital role in hole cleaning. Rotation generates centrifugal and shear forces, aiding in the removal of cuttings. Increasing rotation speed (RPM) enhances agitation and carrying capacity; however, excessively high RPM can induce additional fluid turbulence, hindering efficient transport. Furthermore, abrupt changes in RPM can negatively impact cleaning efficiency [20,21,22]. Wang H (2022) quantified the relationship between drill string RPM and hole-cleaning effectiveness, providing a basis for RPM optimization in drilling operations [23].
Drilling fluid properties are critical for hole cleaning. Research shows that parameters such as plastic viscosity (PV), yield point (YP), flow behavior index (n), and consistency index (K) directly influence the fluid’s carrying capacity. For instance, higher PV and YP enhance cuttings suspension, but excessive viscosity increases circulation pressure losses [24,25]. Optimal fluid properties must be determined based on specific formation conditions and drilling practices [26]. Orun C B (2023) utilized a response surface methodology to develop an optimization model considering multiple formation factors and drilling parameters, effectively improving hole cleaning [27].
Flow rate is closely related to hole-cleaning performance. Increasing the flow rate raises annular velocity, enhancing cuttings transport and preventing bed formation. In practice, the flow rate must be optimized considering wellbore size, inclination, and cuttings characteristics. An insufficient flow rate leads to inadequate cuttings removal and bed formation, while an excessive flow rate risks severe wellbore erosion and instability [28,29]. Shirangi M G (2022) comprehensively studied the relationship between flow rate, hole-cleaning efficiency, and wellbore stability under various conditions using combined field tests and numerical simulations, offering scientific guidance for flow rate control [30,31,32,33,34].

1.2.2. Research Status of Mathematical Models

The development of mathematical models for hole cleaning has progressed through several stages. Early models were relatively simple and had limited predictive capability for cuttings transport and bed formation. Subsequent research incorporated increasingly complex factors, such as drilling fluid rheology, drill string motion, and wellbore geometry, into the models. Nevertheless, existing models still have limitations. The Moore cuttings slip velocity model, for example, does not comprehensively account for certain real-world conditions when calculating slip velocity [35]. Hu W (2024) proposed introducing correction factors, such as a drill string collision factor for horizontal sections, to enhance model accuracy. Continuous validation and optimization against field data and simulations are essential to improve predictive capability. By fitting experimental data and theoretical analysis, suitable ranges for factors like the horizontal drill string collision factor have been determined, significantly improving the accuracy of the Moore model in complex scenarios [36,37,38].

1.2.3. Advances in Cleaning Tool Development

Various cutting bed cleaning tools, such as cutting removal subs, have been developed to address hole-cleaning challenges. These tools feature specific designs to disturb and remove the cutting bed during drilling. However, practical applications reveal limitations. Some tool designs are suboptimal, resulting in poor bed breakup and removal efficacy. Additionally, insufficient wear resistance leads to tool damage during extended use, reducing lifespan and cleaning performance [39]. Furthermore, optimizing the placement and number of cleaning tools is necessary to enhance effectiveness over long intervals. For instance, the optimal spacing for cuttings removal subs depends on factors like the cuttings settling rate, annular velocity, and tool disturbance range, which vary with wellbore size and inclination [40,41,42,43].

1.2.4. Research Innovation Positioning

Existing studies focus on either hydraulic parameter optimization or mechanical tool design, but have not yet addressed the dual challenges of fine cuttings fragmentation and colloidal stability in shale with high clay contents. Our study fills this gap by (1) coupling parameter optimization and mechanical disturbance to form a closed-loop control and (2) revealing the synergistic effect of “high flow rate + high RPM” for fine cuttings transport, which is absent in single-factor studies.

2. Materials and Methods

2.1. Materials

2.1.1. Cutting Samples

Cutting samples were collected from Well J64-2H in J Block and Well FY8-3H in the adjacent block via a shale shaker, cleaned with deionized water, and dried at 60 °C. Key properties of J Block cuttings are as follows:
  • Density: 2.25 g/cm3.
  • Particle size distribution: 0.1–5 mm.
  • Clay mineral composition: 35% montmorillonite, 10% illite, and 5% kaolinite.
  • Compressive strength: 12–18 MPa.

2.1.2. Drilling Fluid Properties

The water-based drilling fluid used in simulations and field tests had the following properties:
  • Density: 1.9 g/cm3.
  • Plastic viscosity: 30–50 mPa·s.
  • Flow behavior index: 0.65.
  • Consistency index: 0.45 Pa·sn.
  • Gel strength: 2.337 Pa.

2.2. Methods

2.2.1. Numerical Simulation of Cutting Transport

A solid–liquid two-phase flow model was established for the horizontal section of Well J64-2H based on Doron’s two-layer flow theory to characterize the stratified flow behavior of the cuttings bed and carrier fluids. The model considers drilling fluid density, viscosity, and multi-sized cuttings distribution, with the drilling fluid treated as the continuous phase and cuttings treated as the discrete phase.
Continuous phase: Navier–Stokes equations for momentum conservation were combined with the Realizable k-ε turbulence model to calculate turbulent viscosity:
ρ t + ( ρ u u ) = p + ( μ e f f ( u + u T ) ) + ρ g + F p l
where ρ is the fluid density, (g/cm3); u is the fluid velocity vector, (m/s); p is the pressure, (Pa); μ e f f is the effective dynamic viscosity, (Pa·s); and F p l is the interphase force, (N/m3).
Discrete phase: This phase involves the trajectory tracking of individual particles, considering gravity, buoyancy, drag force, and collision force:
m p d v p d t = π d p 3 6 ( ρ p ρ ) g + 1 2 C d ρ A p u v p ( u v p ) + F c o l l i s i o n
where m p is the particle mass, (g); v p is the particle velocity, (m/s); d p is the particle diameter, (cm); and F c o l l i s i o n is the collision force, (N).
Notably, the Lagrangian model in this study is specifically applied to the initial stage of cuttings transport, where the cuttings concentration is <8%. This concentration is within the applicable range of the model. For high-concentration cuttings beds that may form locally, this study relied on the helical groove sub to mechanically disperse them into low-concentration particles before transport, ensuring consistency with the model’s applicability.
For parameter optimization, Equation (1) calculates the annular carrying capacity under different flow rates, and Equation (2) quantifies cuttings settlement velocity under varying RPM/ROPs, providing key parameters that can predict bed thickness.
Focusing on the horizontal section of Well J64-2H in this block, a numerical model of the solid–liquid two-phase flow in the annulus was established. This model, based on Doron’s two-layer flow theory, incorporated drilling fluid density, viscosity, and cuttings particle size distribution. Model assumptions were validated against the following field data: (1) concentrations of cuttings in parameter optimization simulations were constrained to <8% and (2) Herschel–Bulkley parameters were calibrated via rotational viscometer tests, ensuring their reliability in effective viscosity calculations. A note is provided on simulation methods for cuttings bed prevention: The parameter optimization simulations focus on preventing cuttings bed formation by optimizing drilling parameters. These simulations rely on analytical calculations of cuttings settlement velocity and do not require 3D grid division, as their core goal is to quantify how parameter adjustments reduce the accumulation of cuttings along the 2500 m wellbore. The two million grids mentioned here are exclusively for local CFD simulation of the helical groove sub to illustrate its working mechanism, which is independent of the parameter optimization for prevention. This separation ensures that the prevention-oriented parameter optimization remains focused on its core goal: guiding drilling parameter adjustments to minimize initial cuttings bed formation. Boundary conditions were set as follows:
  • Turbulence Model: The Realizable k-ε model with enhanced wall treatment to capture near-wall flow characteristics.
  • Cuttings Properties: Density 2.25 g/cm3; sphericity factor 0.6; and particle size distribution = 0.1–5 mm.
  • Inlet condition: Velocity inlet with cuttings concentration = 0.05 kg/m3.
  • Outlet condition: Pressure outlet with free flow.
  • Wall condition: No-slip boundary for the wellbore and drill pipe walls: roughness = 0.05 mm.
Note: This section includes two independent simulation types: (1) Parameter optimization simulation: This predicts cuttings bed thickness along the 2500 m wellbore using Doron’s two-layer flow theory, focusing on how drilling parameters prevent bed formation. It does not involve the helical groove sub and uses analytical calculations. (2) Local CFD simulation: Only models in the 1 m range around the helical groove sub illustrate its turbulence mechanism, unrelated to the full wellbore bed thickness prevention (Parameter optimization). The parameter optimization in this section focuses on the “prevention” of a cutting bed via drilling parameters, independent of the helical groove sub. The CFD simulation focuses on the “removal” of the residual bed by the sub. The two form a coupled technology but use separate simulation methods.

2.2.2. Parameters and Optimization

Necessity of Parameter Optimization
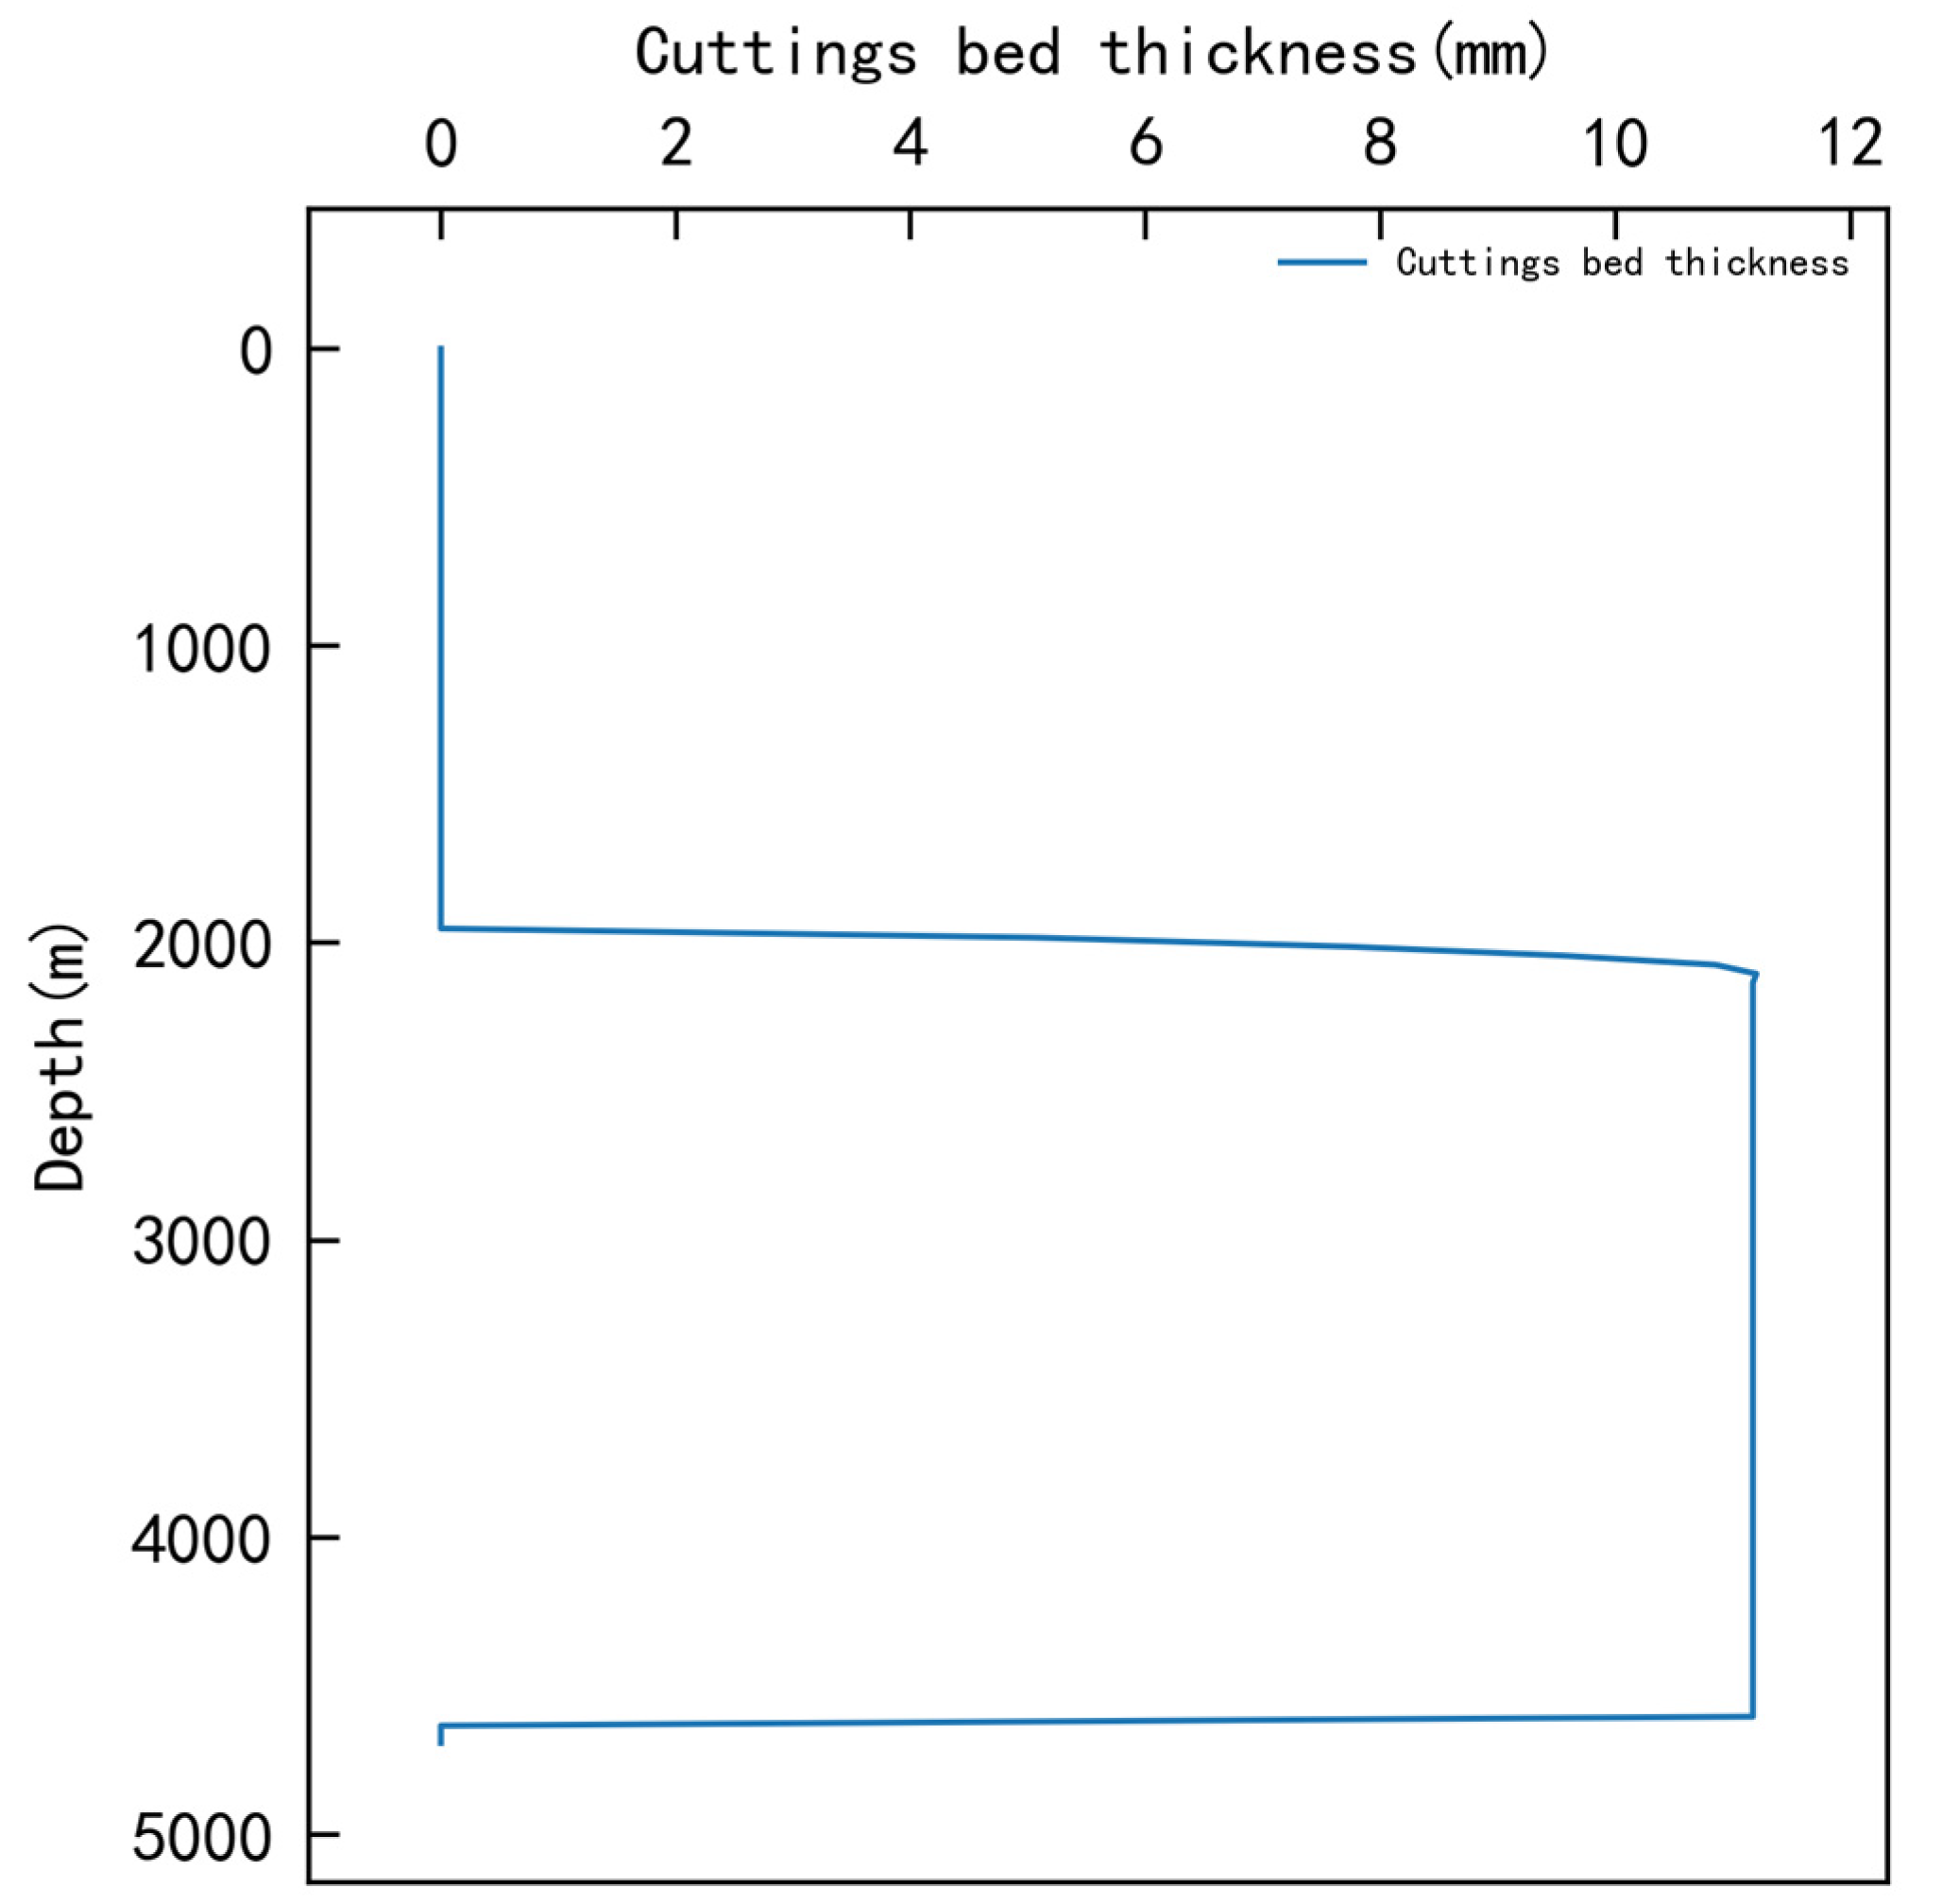
To verify the rationality of initial drilling parameters, numerical simulation was conducted for the horizontal section of Well J64-2H under empirical parameters (flow rate = 1760 L/min; RPM = 90; ROP = 23 m/h; plastic viscosity = 40 mPa·s). The simulation focused on evaluating cuttings bed thickness and revealed that the initial parameters led to severe accumulation of cuttings (Figure 2), confirming the need for systematic optimization.
Single-Factor Optimization Design
Given the high clay content in J Block, which causes fine cuttings to form stable colloids, four key parameters affecting cuttings transport were selected for single-factor optimization: flow rate, RPM, ROP, and plastic viscosity. The simulation protocol involved fixing three parameters at initial levels, varying one parameter within a practical range, and evaluating cuttings bed thickness to identify optimal levels.
Orthogonal Simulation Design
An L9 orthogonal simulation was designed with four factors (flow rate, RPM, ROP, and plastic viscosity) to optimize cuttings bed thickness, as shown in Table 2.

2.2.3. Mechanical Cuttings Removal Tool Design

To address residual cuttings bed accumulation in horizontal sections, where optimized drilling parameters alone are insufficient due to low annular velocity near the wellbore wall, a helical groove cuttings removal sub was designed. This tool synergizes with hydraulic cleaning by mechanically disrupting settled cuttings, ensuring continuous hole cleaning in long horizontal intervals of J Block.
During drilling, especially as the horizontal section lengthens, cuttings bed problems become more pronounced. Due to the high inclinations in the build and horizontal sections, relying solely on optimized drilling parameters for hole cleaning has significant limitations. Failure to promptly remove accumulated cuttings leads to the further fragmentation of the drill string, generating harmful fine solids that increase the risk of the pipe becoming stuck and reducing drilling speed.
Tool Structure and Material Specifications
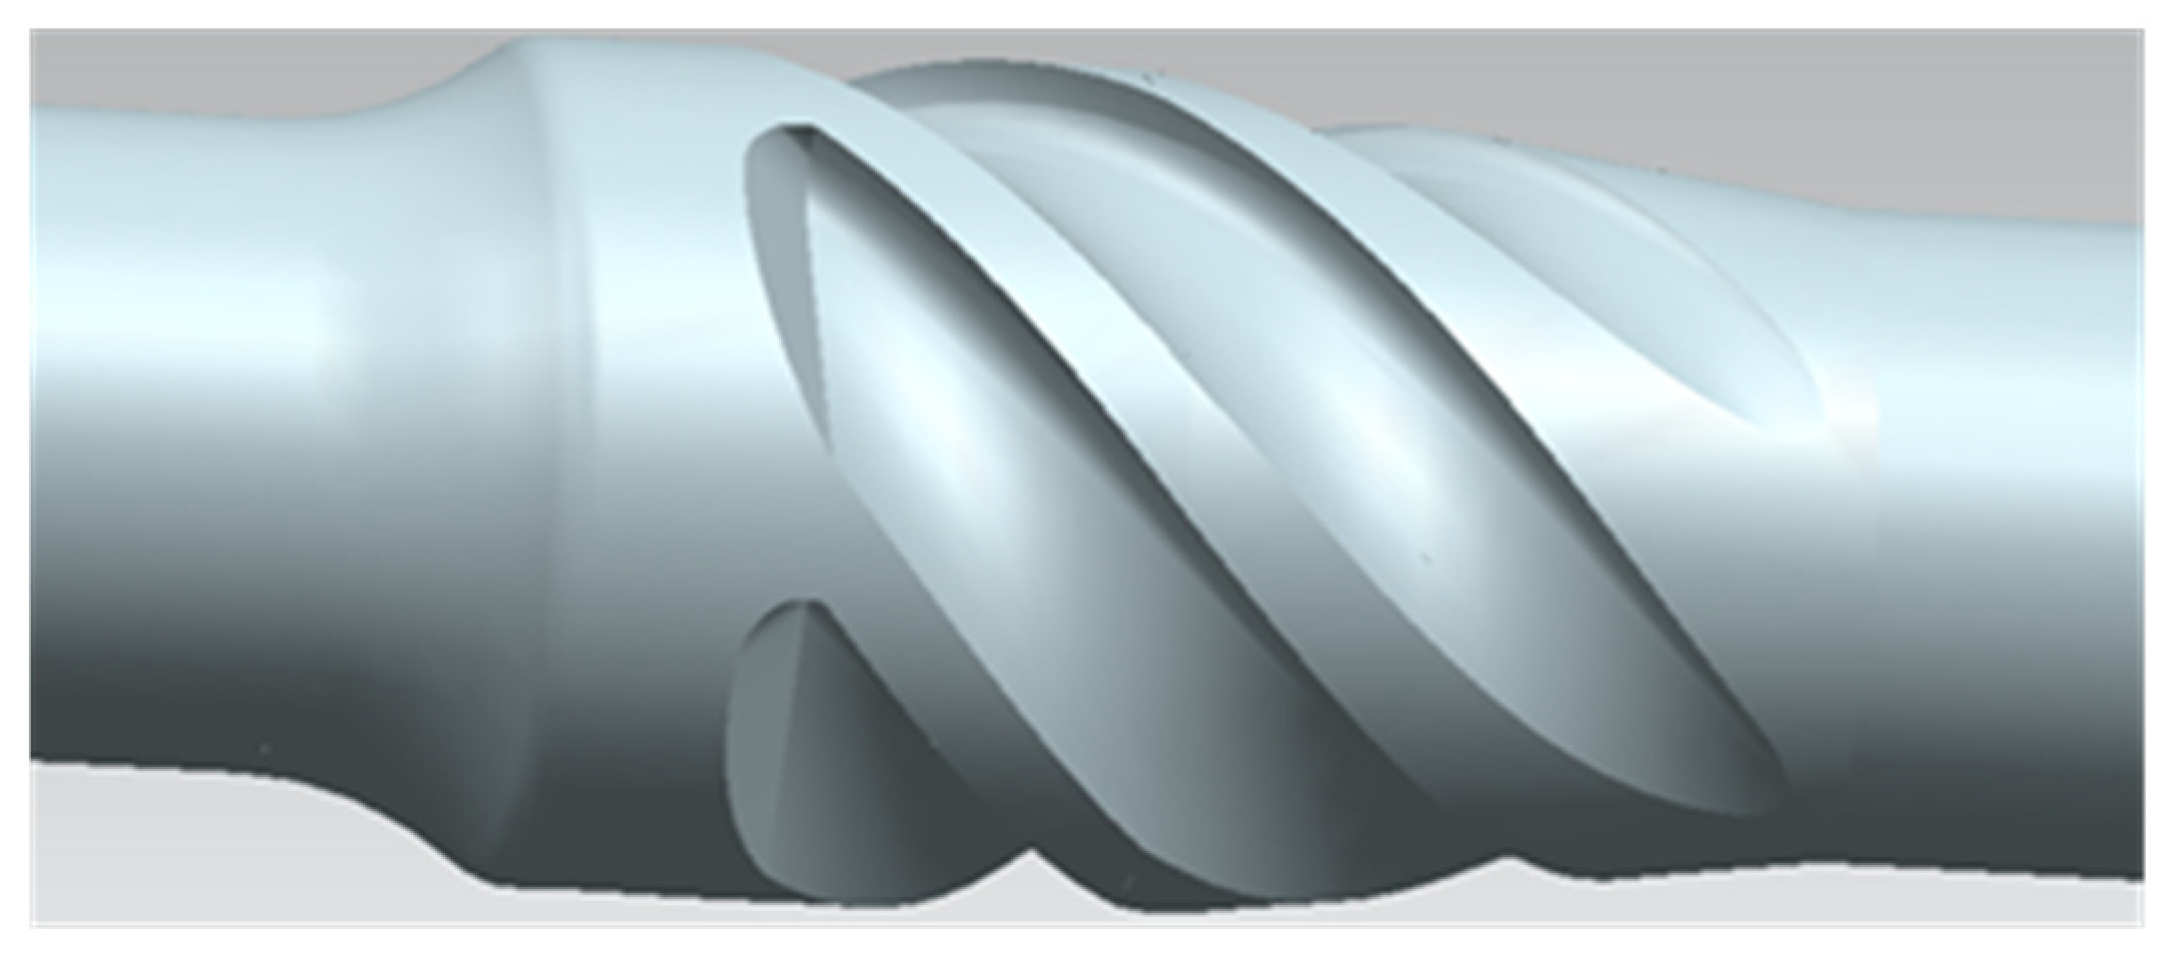
The cuttings removal sub (Figure 3) features a cylindrical body with evenly spaced helical grooves, which is designed based on the computational fluid dynamics simulations of annular flow patterns in J Block’s formation of shale with high clay content. Key structural parameters:
  • Groove geometry: Trapezoidal cross-section with a depth of 8 mm, width of 12 mm, and helix angle of 30°.
  • Body dimensions: Outer diameter 190 mm and length 500 mm, with threaded connections of 4½ IF for compatibility with standard drill pipes.
  • Material: A 4140-alloy steel with a wear-resistant coating to withstand abrasive cuttings in J Block.
Working Mechanism
When rotated with the drill string, the helical grooves induce radial fluid flow toward the wellbore wall, generating turbulent eddies with a maximum tangential velocity of 2.8 m/s. This turbulence disrupts the stratified cuttings bed structure through the following actions:
  • Shearing action: A groove-induced flow creates shear stress at the bed surface, breaking cohesive bonds between fine clay-rich cuttings.
  • Lifting effect: Eddies generate upward velocity components that suspend dislodged cuttings, enhancing their transport via the main annular flow.
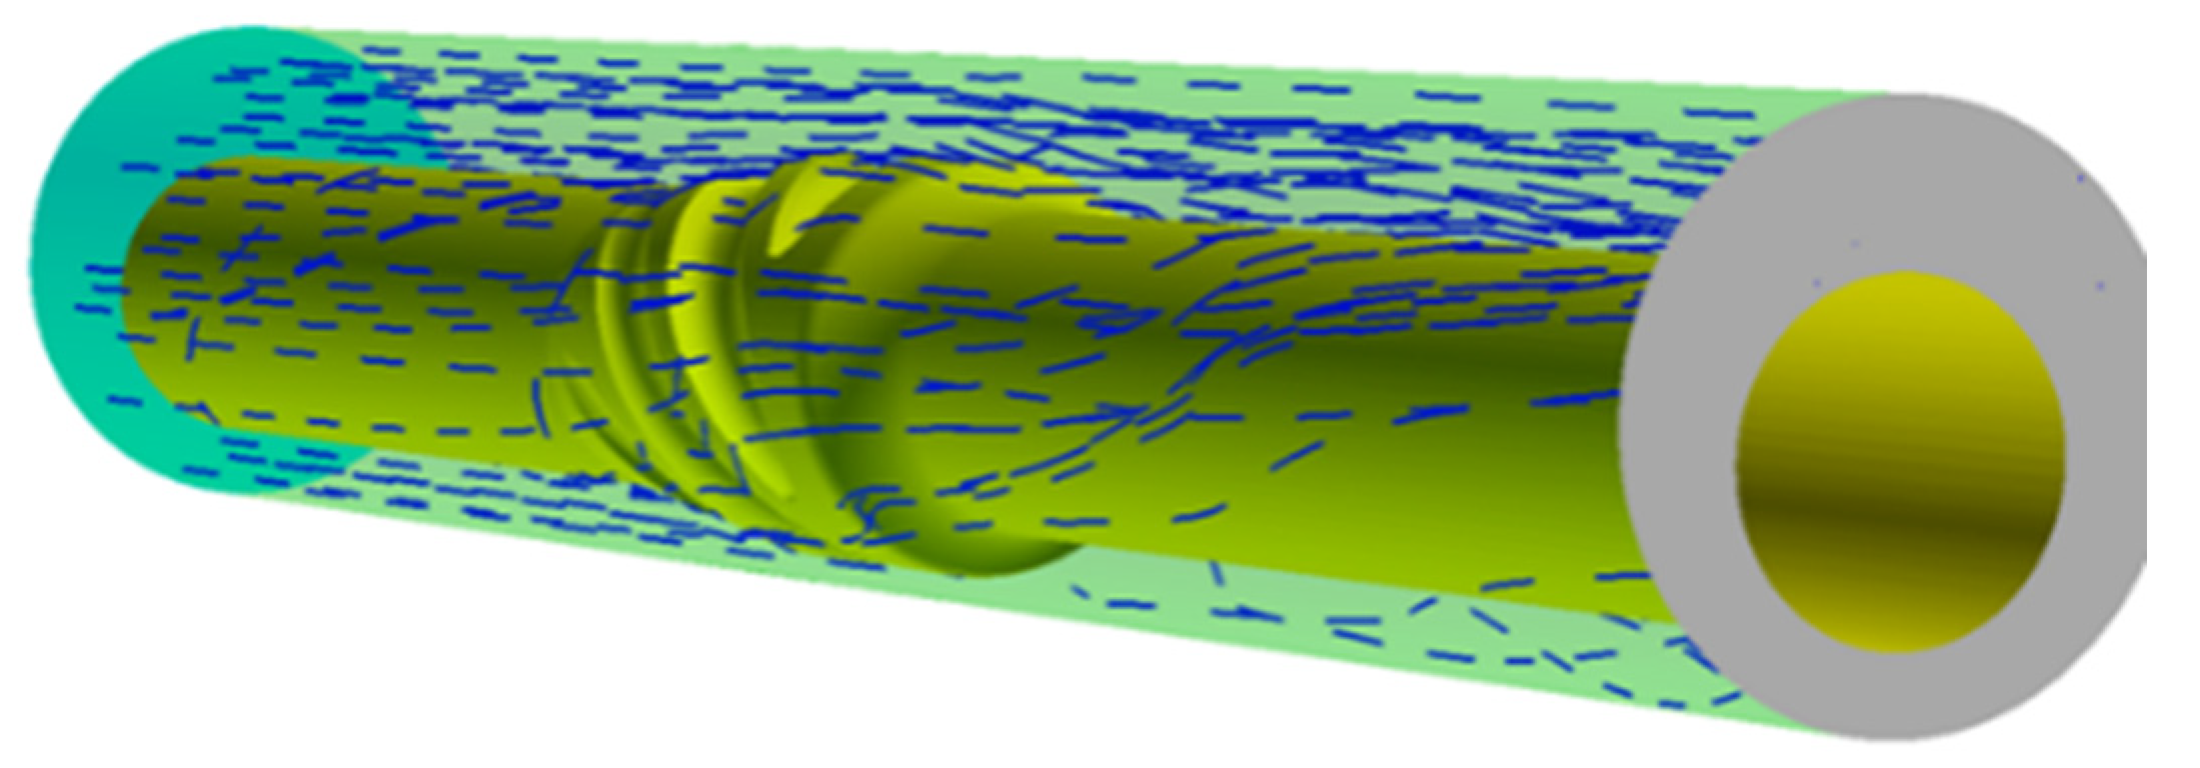
Simulations confirmed the tool’s effective disturbance range: within 0.8 m of the sub, the cuttings bed erosion rate increased by 42% compared to the bare drill pipe. Figure 4 flow field simulations reveal that the helical groove induces a swirl number of 0.85, corresponding to 42% turbulence enhancement. Dimensional analysis converts this swirl intensity to an acceleration factor β = 1 + 0.42 × 0.66, directly linking complex flow patterns to the simplified spacing formula.
Theoretical Basis for Spacing Calculation
The optimal spacing of cuttings removal subs is derived from the Moore cuttings slip velocity model [35], which is a classic method for predicting cuttings transport efficiency in annular flow. The model calculates the terminal slip velocity v s of cuttings in drilling fluid, which is critical for determining how far cuttings can be transported before re-sedimentation.
The core formula of the original Moore model for slip velocity in vertical wells is as follows:
V s = d s 2 ρ s ρ f g 18 μ e ,
where d s is the average cutting diameter, (mm); ρ s is the cutting density, (g/cm3); ρ f is the drilling fluid density, (g/cm3); g is the gravitational acceleration, (m/s2); and μ e is the effective viscosity of drilling fluid, (Pa·s).
Equation (3) is the core formula of the traditional Moore model for calculating cutting slips velocity in vertical wells. It serves as the theoretical baseline for this study, but neglects the effect of drill string collision in a horizontal section. Thus, we modified it to adapt to horizontal well conditions.
For horizontal sections, the original Moore model was modified to account for the following factors:
  • Drill string collision effect: Horizontal wellbores induce frequent collisions between the drill string and wellbore, reducing actual slip velocity by ~30% compared to vertical conditions [36].
  • Tool-induced turbulence: The helical groove sub enhances local flow velocity, extending the effective transport distance of dislodged cuttings.
The modified spacing formula integrates these factors:
L o p t = α β D h v a sin θ   v s ,
where v s is the corrected slip velocity in horizontal section (0.005218 m/s, derived from field data); α is the carrying factor; β is the acceleration factor; D h is the hydraulic diameter; v a is the annular velocity; and θ is the well inclination.
Equation (4) is the optimized spacing formula for horizontal sections, integrating correction factors α and β to account for drill string collision and tool-induced turbulence. Its key role is to calculate the optimal tool spacing for J Block by inputting field parameters and ensuring cuttings disturbed by one tool are transported to the next tool’s range before re-sedimentation.
To account for drill string eccentricity in horizontal sections, an eccentricity correction factor Υ = 1 − 0.3 ε was introduced, modifying the formula as follows:
L o p t = α β Υ D h v a sin θ   v s ,
This correction enables the model to adapt to varying eccentricity conditions, enhancing the field applicability of spacing calculations.

3. Results

3.1. Parameter Optimization Results

3.1.1. Single-Factor Optimization Results

To identify the individual impact of key parameters, single-factor simulations were conducted by varying one parameter while keeping others at initial levels.
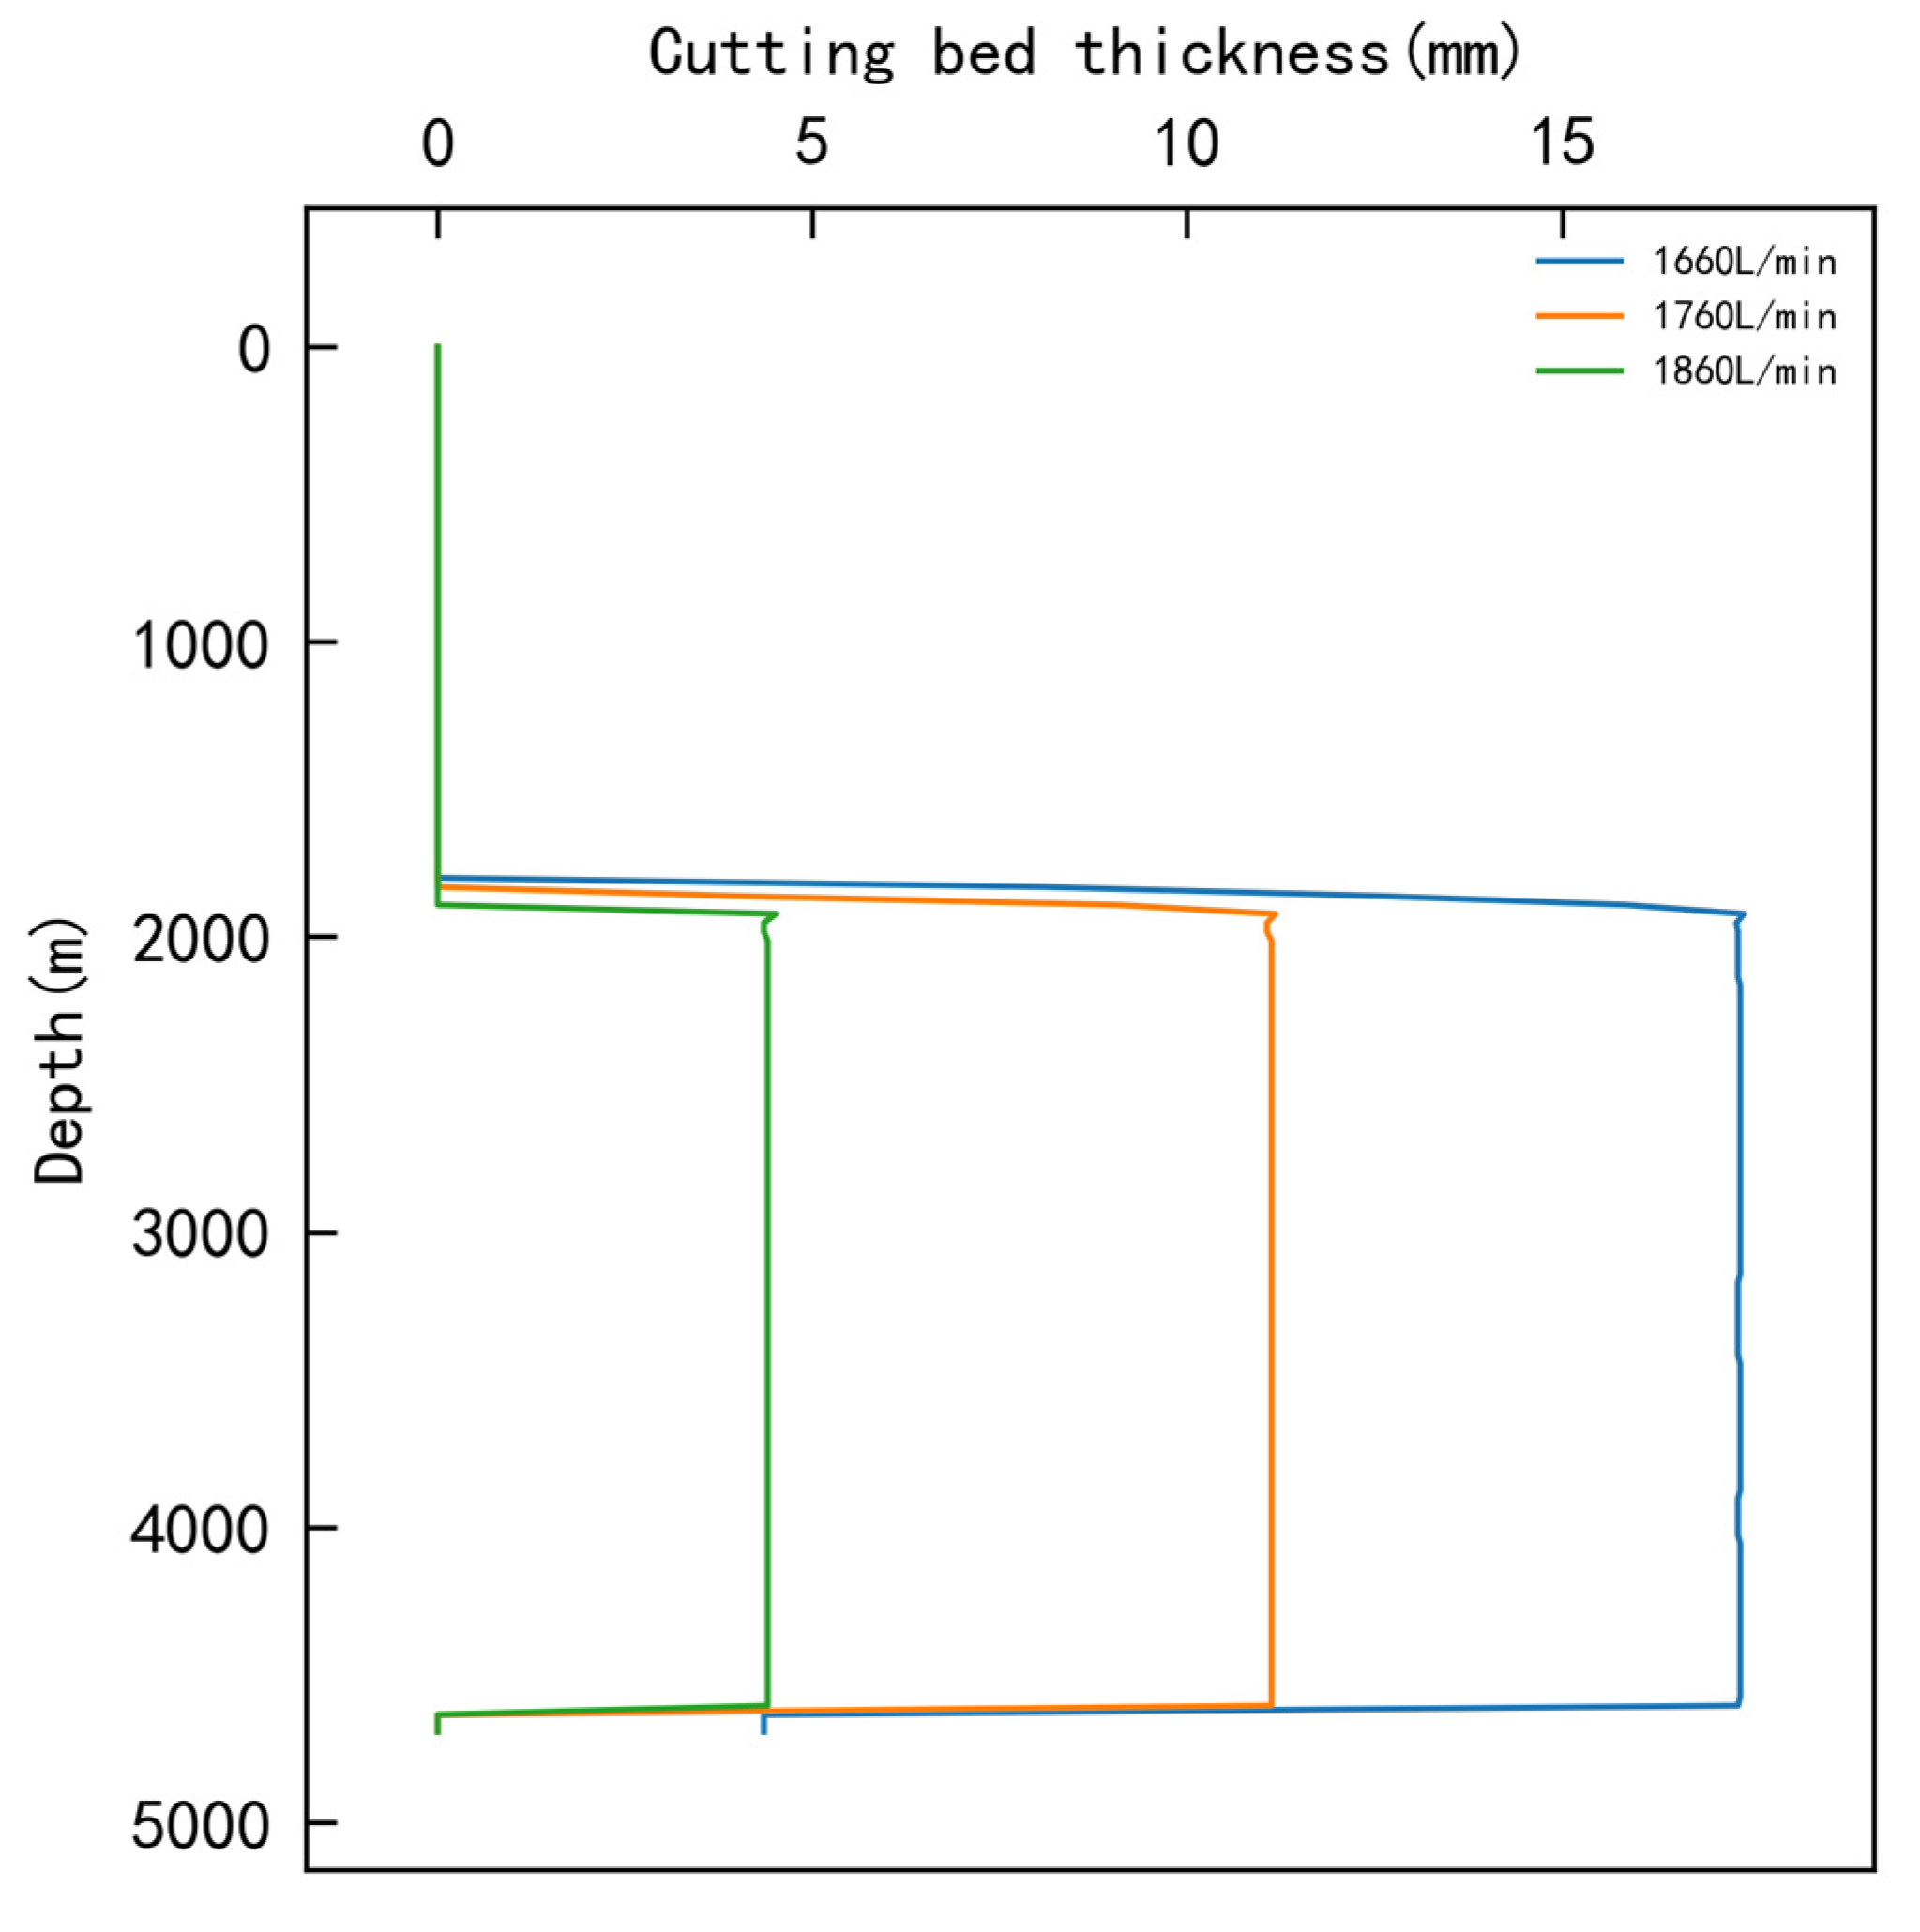
The flow rate varied within 1660–1860 L/min, alongside other parameters fixed. The simulation recorded the cuttings bed thickness at each level to determine the optimal flow rate (Figure 5).
Simulations with RPM = 90, ROP = 23 m/h, and plastic viscosity = 40 mPa·s showed that increasing the flow rate reduced the cuttings bed thickness. At 1860 L/min, the bed thickness was minimized, with a 59.62% reduction compared to the initial 1760 L/min. This confirmed that higher annular velocity (1.254 m/s at 1860 L/min) enhanced cuttings transport capacity.
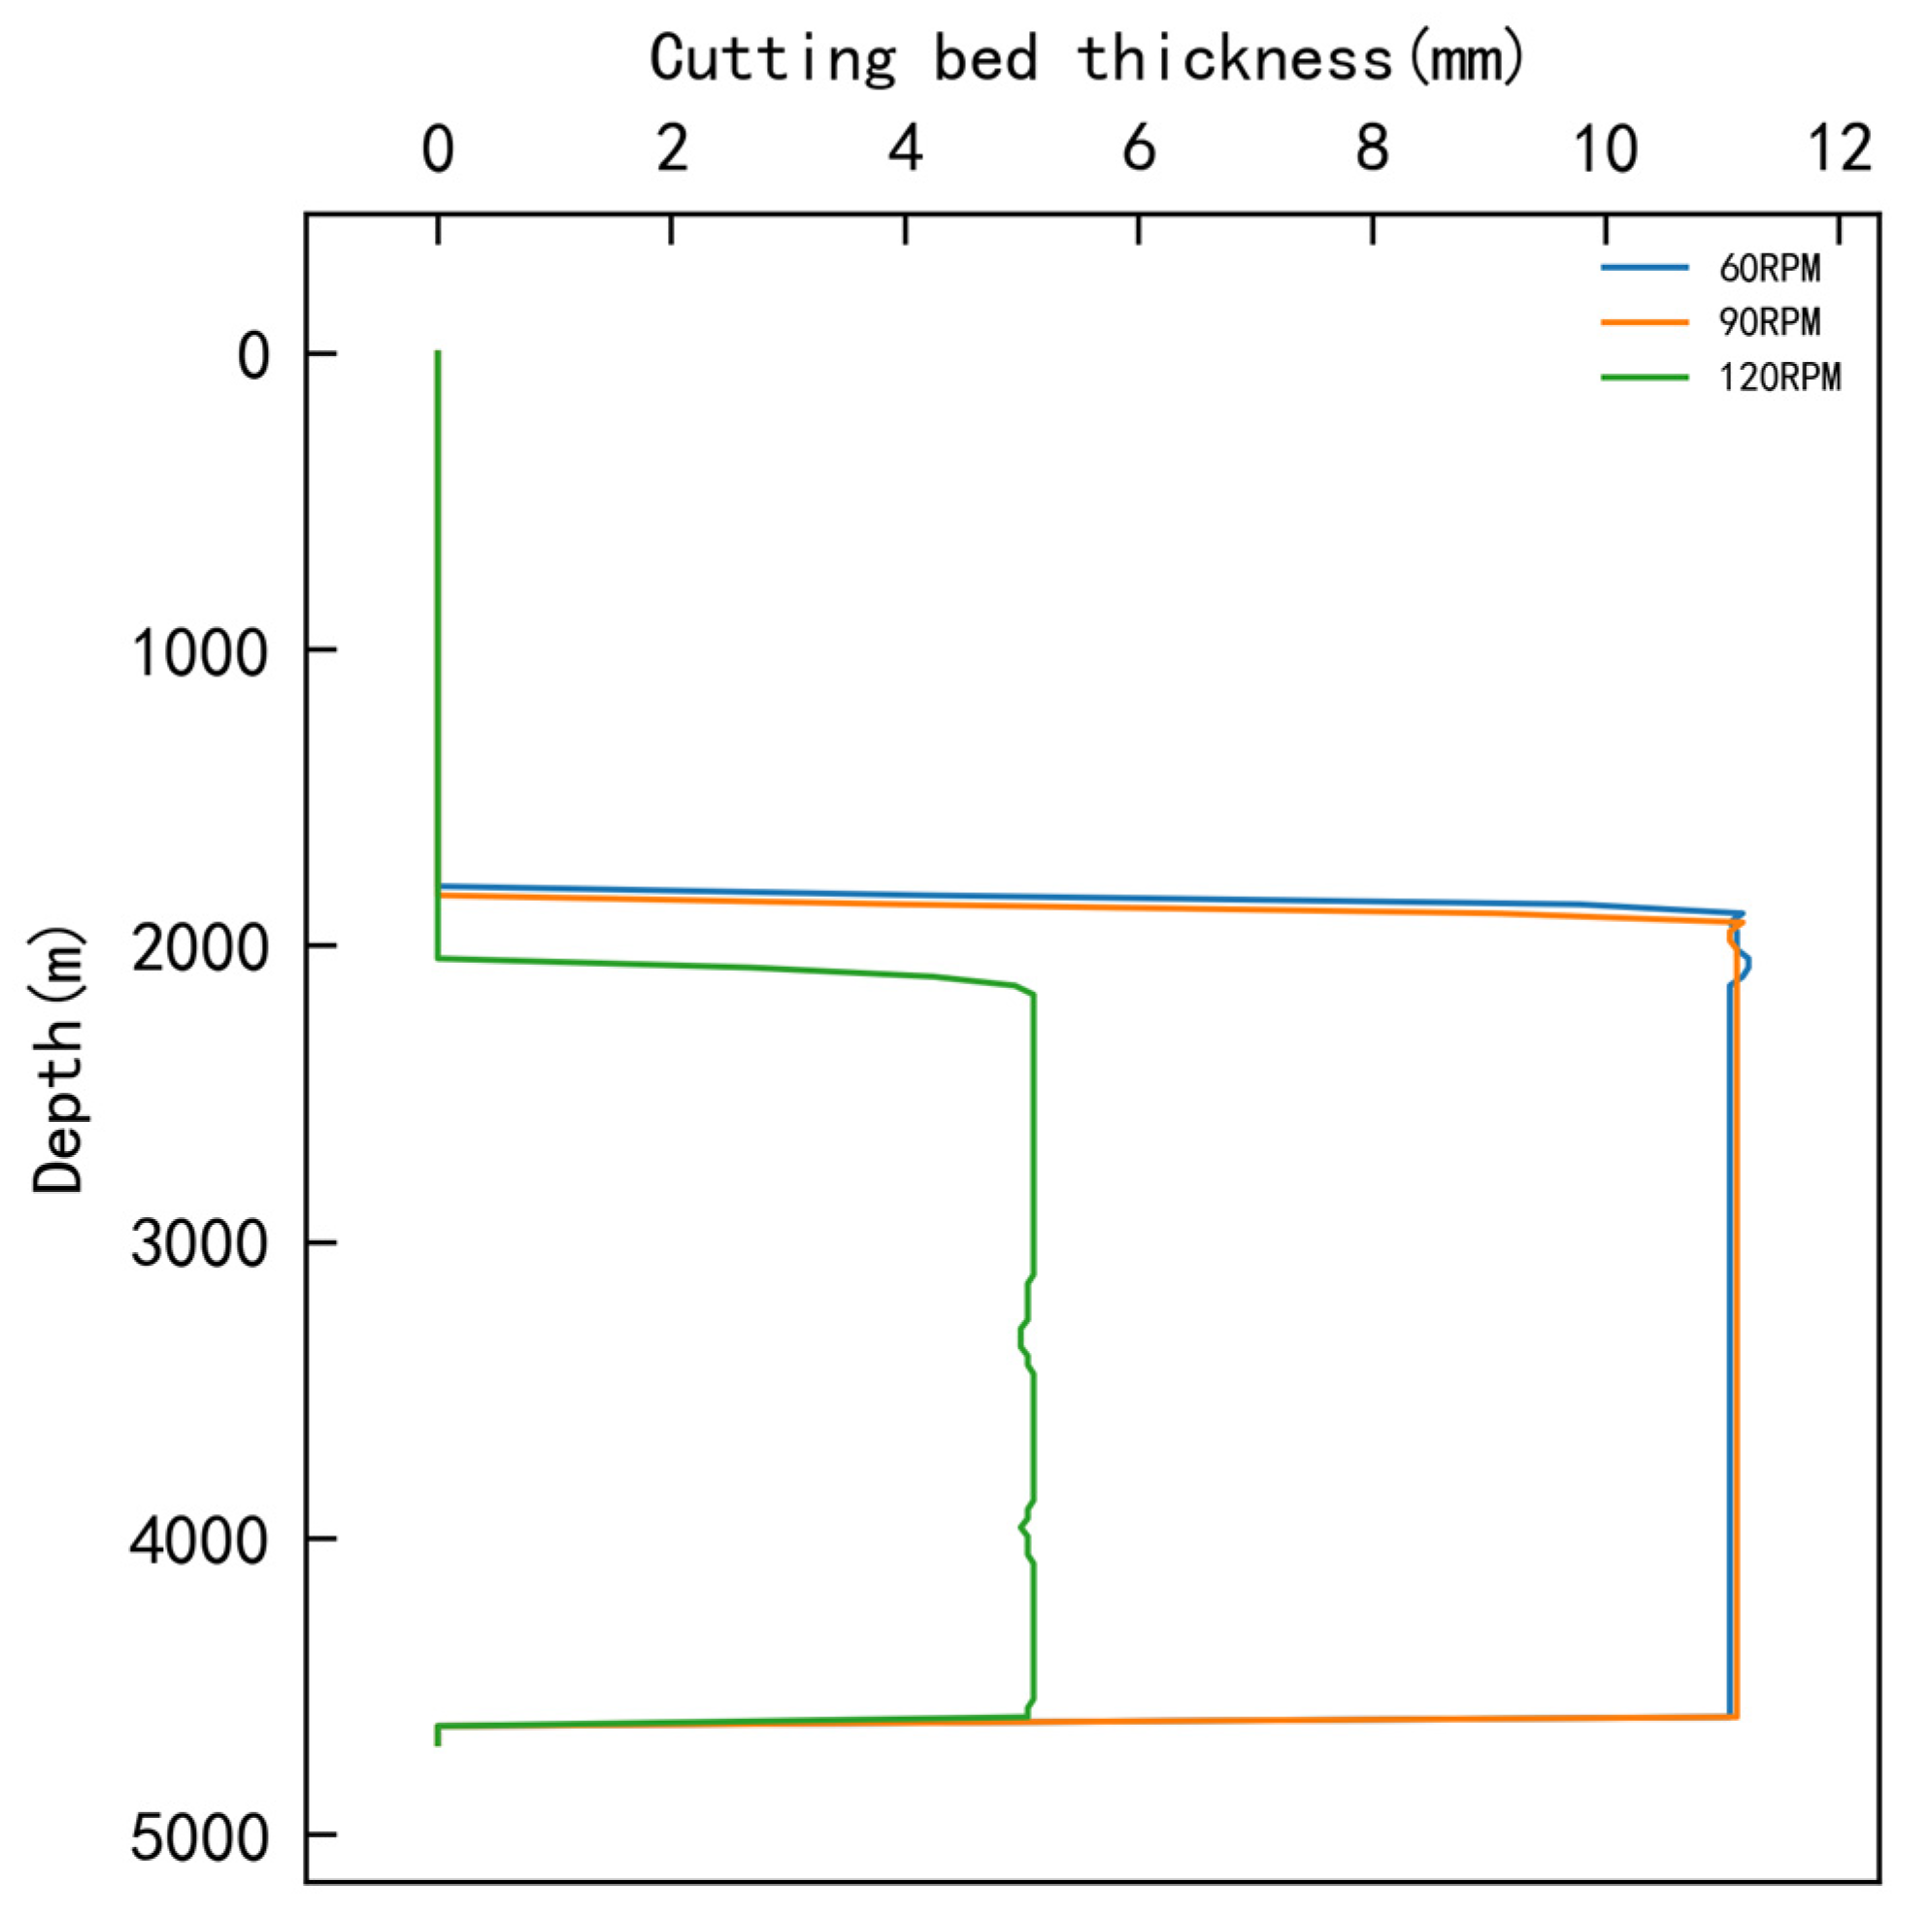
RPM optimization is shown in Figure 6.
With flow rate = 1760 L/min, ROP = 23 m/h, and plastic viscosity = 40 mPa·s, increasing RPM from 60 to 120 significantly reduced the bed thickness. The optimal RPM was 120, achieving a 75.89% reduction in thickness compared to 60 RPM, which can be attributed to enhanced fluid turbulence and cuttings agitation.
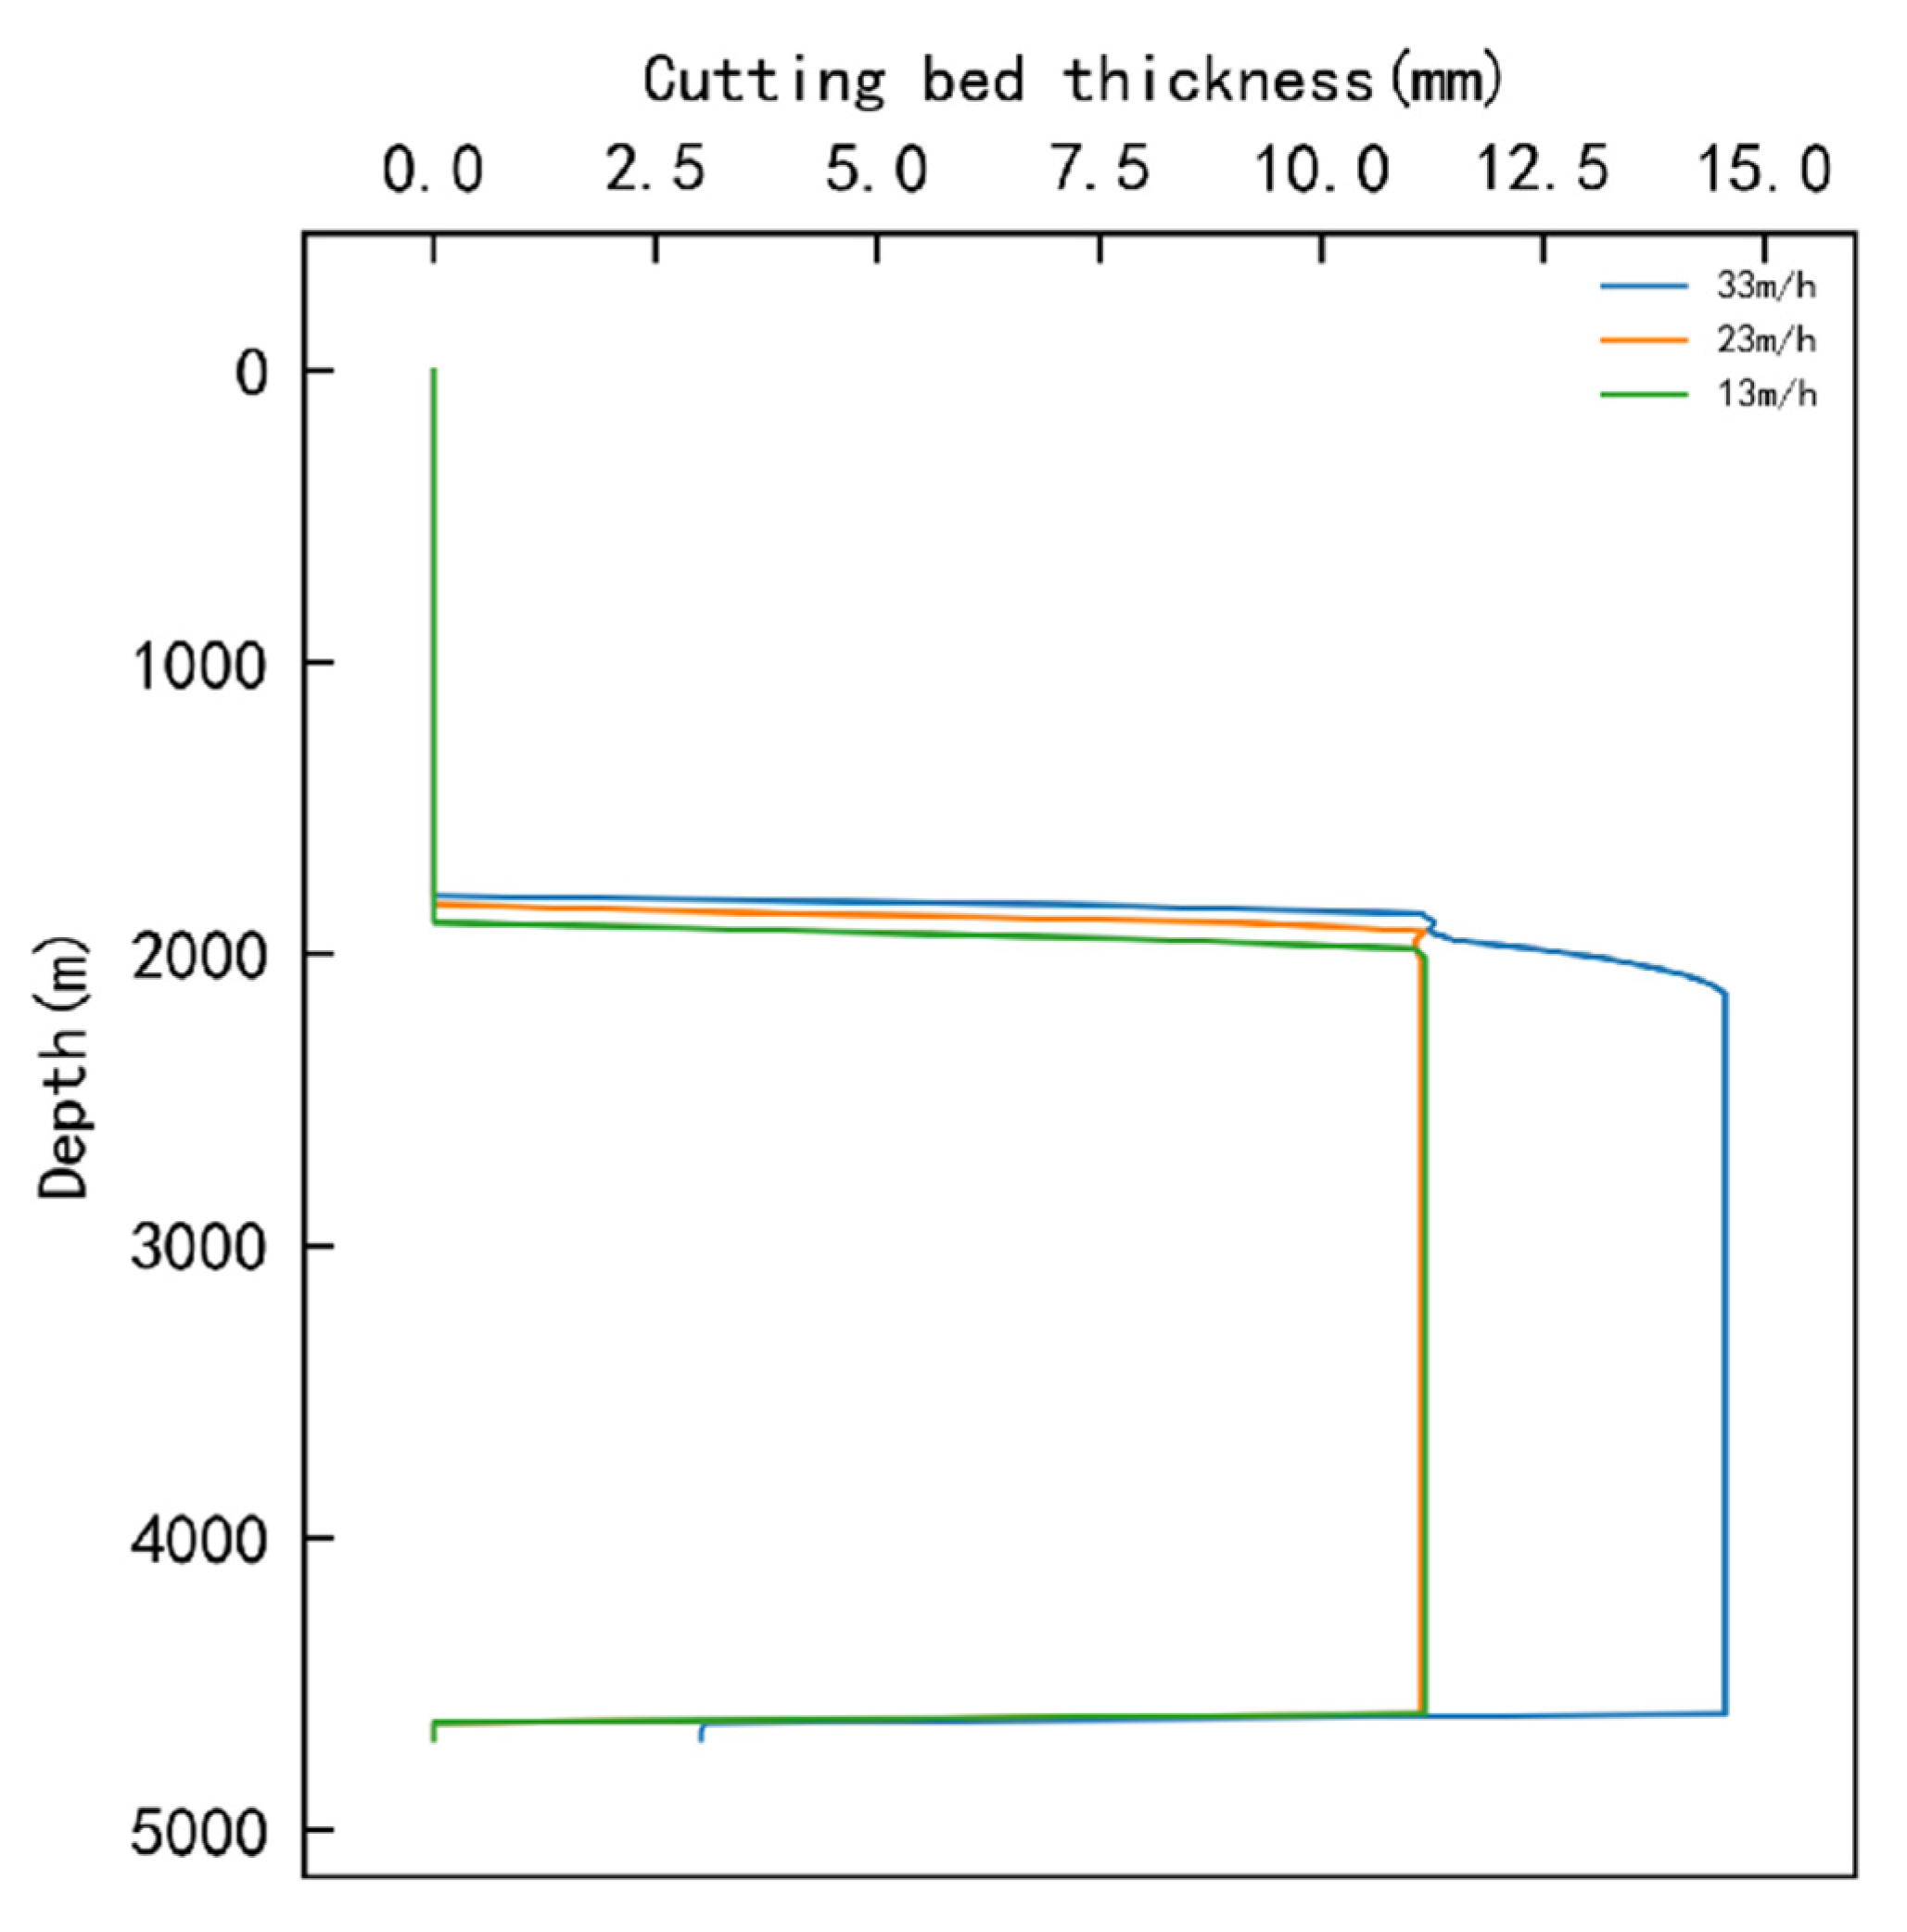
ROP optimization is shown in Figure 7.
Under flow rate = 1760 L/min, RPM = 90, and plastic viscosity = 40 mPa·s, lowering the ROP from 33 m/h to 13 m/h reduced the cuttings input rate. At 13 m/h, bed thickness decreased by 75.89% compared to 33 m/h, as slower penetration rates matched the cuttings transport capacity of the drilling fluid.
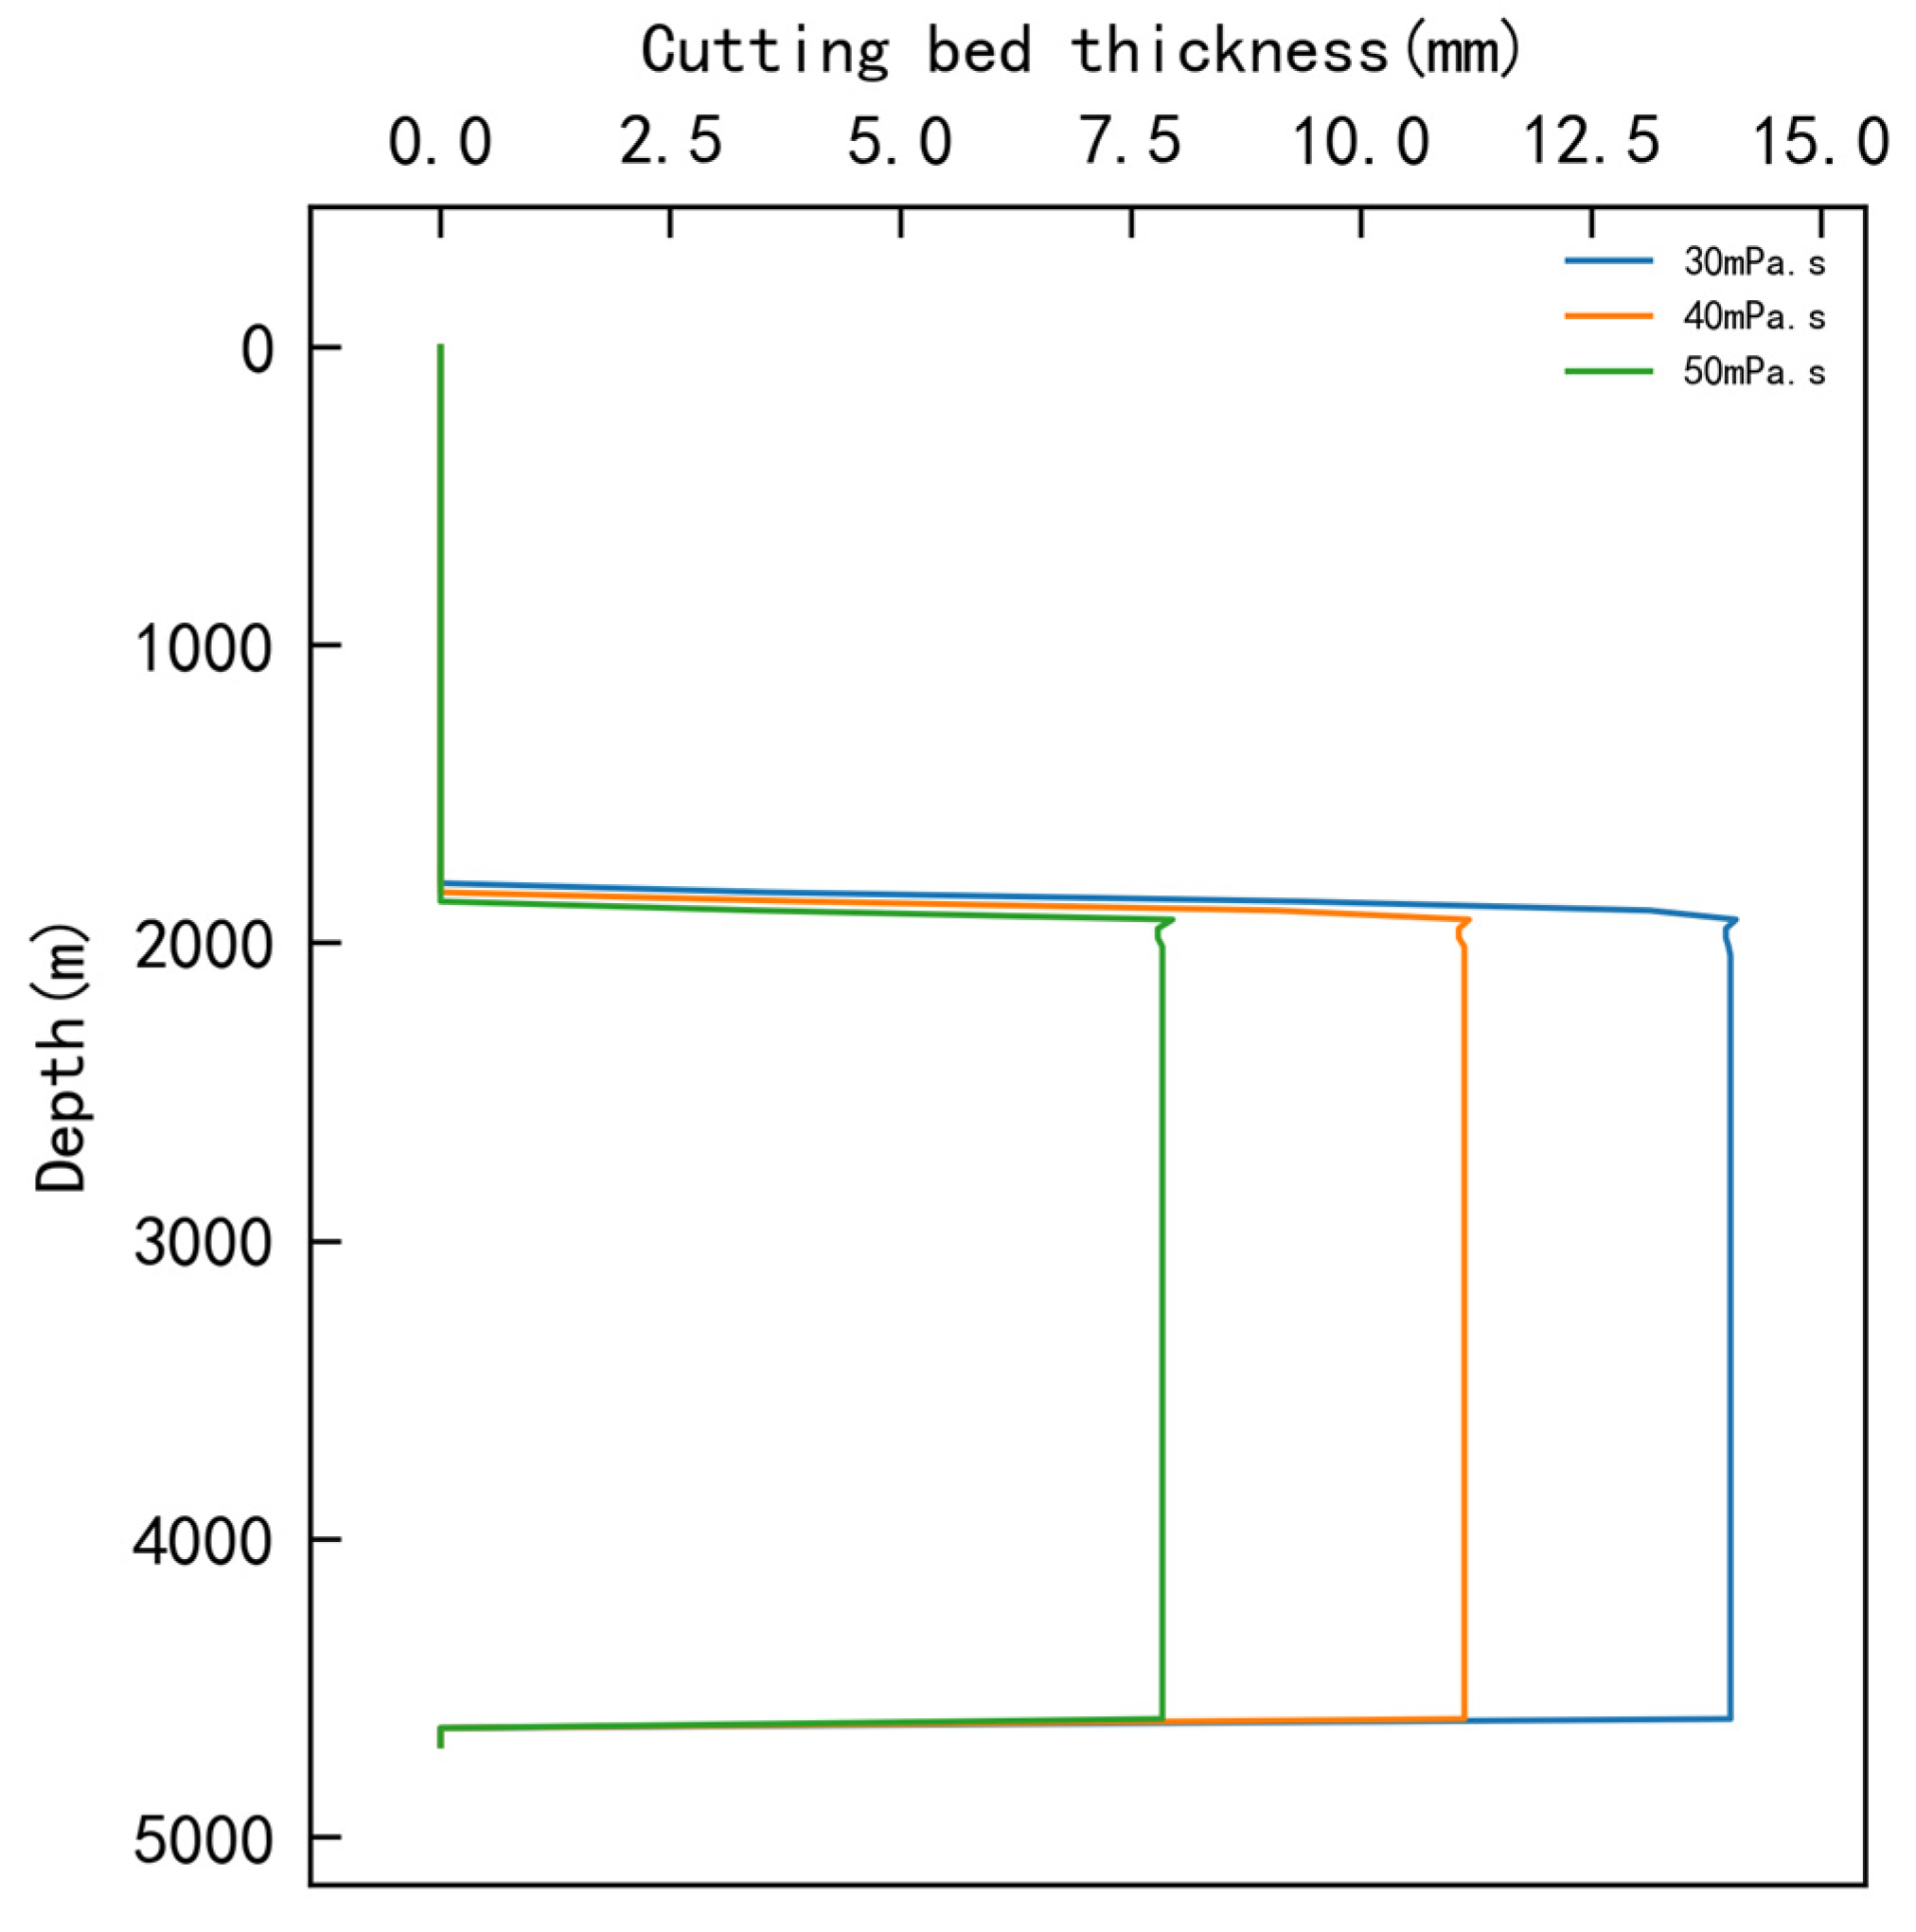
Plastic viscosity optimization is shown in Figure 8.
This plastic viscosity adjustment corresponds to variations in Herschel–Bulkley parameters: when plastic viscosity increased from 30 to 50 mPa·s, the consistency index K increased from 0.3 to 0.5 Pa·sn, leading to a 27% increase in effective viscosity. This confirmed that the simulation integrated Herschel–Bulkley rheology to quantify suspension capacity. The optimal viscosity was 50 mPa·s, resulting in a 62.07% reduction in bed thickness compared to 30 mPa·s, due to enhanced shear force for fine cuttings in J Block.

3.1.2. Orthogonal Optimization Results

Optimal Parameter Combination
Single-factor optimization did not account for parameter interactions. Thus, an L9 orthogonal simulation was designed, and the simulation results are shown in Table 3.
Influence Ranking of Factors
Based on the new orthogonal simulation data results, main effect analysis was conducted on each factor to clarify their degree of influence on the thickness of the cuttings bed. We calculated the mean values of the cuttings bed thickness at different levels of each factor and determined the order of influence by calculating the range. The calculation and analysis of the mean values and ranges of the cuttings bed thickness at different levels of each factor are shown in Table 4.
A low rate was the most critical factor, as higher annular velocity directly enhanced cuttings carrying capacity.
Synergistic Effect
Notably, the interaction between flow rate and RPM was significant. At 1860 L/min and 90 RPM, the cuttings bed thickness was minimized to 4.4 mm, which is lower than the sum of individual optimal effects. This confirmed that “high flow rate + moderate RPM” synergistically improved cleaning efficiency by balancing turbulence intensity and energy consumption, which is critical for J Block’s fine cuttings caused by the high clay content.
This optimal parameter combination directly reflects the core of our novel coupled technology: “prevention through parameter optimization”. By synergistically enhancing the annular carrying capacity and cuttings agitation, it reduces the cuttings input rate by 43.48%—a result that validates the innovation of integrating hydraulic and mechanical disturbance for shale formations with a high clay content. Rotational viscometer tests showed that at 50 mPa·s plastic viscosity, the Zeta potential of colloidal cuttings increased from −15 mV to −32 mV, explaining the synergistic effect of “high viscosity + high RPM” in suppressing the settlement.

3.2. Optimal Spacing Calculation Results

Based on the modified Moore model and parameters of Well J64-2, the optimal spacing of cuttings removal subs was calculated as follows: L o p t = α β D h v a sin θ v s .
(1)
Input Parameters of Well J64-2H:
  • Hole diameter = 215.9 mm; drill pipe outer diameter = 127 mm → hydraulic diameter D h = 215.9 − 127 = 88.9 mm.
  • Optimized flow rate = 1860 L/min → annular velocity v a = 1.254 m/s.
  • Average diameter of cuttings = 4.2 mm; corrected slip velocity in horizontal section v s = 0.005218 m/s.
  • Well inclination θ = 90° (horizontal section) → sin θ = 1.
  • Tool factors: α = 1.12 and β = 1.28.
(2)
Calculation Process and Results:
Parameters were substituted into the modified spacing formula:
L o p t = 1.12 × 1.28 0.0889 × 1.254 1 × 0.005218     60.49   m .
(3)
Field Adjustment:
Considering the standard drill pipe joint length (9.6 m/stand), the optimal spacing was practically adjusted to 60 m (6 stands) to align with field operation norms. This adjustment ensured compatibility with drilling string assembly while maintaining the designed cleaning efficiency.
The calculated spacing of 60 m embodies the removal component of our coupled technology. It bridges the parameter optimization and mechanical tool design, ensuring that disturbed cuttings by the sub are continuously transported while avoiding re-sedimentation, which is a key challenge in shale horizontal sections.

3.3. Field Application Validation

To validate the integrated technology, a field application was conducted in Well J110-8-1H as follows:
(1)
Horizontal section drilling parameters: Flow rate ≥ 1860 L/min; rotation speed ≥ 120 RPM; and ROP ≤ 13 m/h.
(2)
Installation of spiral groove cuttings removal subs was conducted, spaced at approximately every two stands (the closest practical spacing to the calculated 60.49 m), totaling 34 subs.
(3)
Key performance indicators before and after application are compared in Table 5 (sliding drilling) and Table 6 (rotating drilling).
Table 5. Comparison of sliding friction before and after technology application.
ConditionInterval
(m)
WOB (Ton)Sliding Friction
(Ton)
Pick-up Drag After Orienting (Ton)
Before App3702–370610–123030
3725–373010–124030
3792–3795104035
3822–38298–105040
After App4017–40216–101024
4041–40476–101224
4070–40766–101224
4110–41156–101424
4214–42186–101224
4226–42306–101425
Table 6. Comparison of rotational torque before and after technology application.
ConditionInterval (m)WOB (Ton)Rotational Torque (kN·m)
Before App3706–372510–1220
3730–37921022
3795–38228–1024
3829–3841824
After App4021–4041610–20
4047–40546–810–18
4076–40826–810–18
4115–42146–810–16
4218–42266–810–16
4230–42696–810–18
Comparison of data before and after technology application in Well J110-8-1H reveals substantial improvements:
(1)
Before Application: Severe drag was encountered during oriented sliding drilling. A weight on bit (WOB) of 8–12 tons was needed to achieve differential back-up pressure across the mud motor. Pick-up drag after completing oriented sections ranged from 30 to 40 tons. Rotating torque ranged from 20 to 24 kN·m.
(2)
After Application: During oriented drilling, adding 6–10 tons of WOB achieved motor differential back-up pressure. Pick-up drag after orienting decreased to 10–20 tons. Rotating torque decreased to 10–16 kN·m, with some intervals up to 18–20 kN·m.
The 50% reduction in sliding friction and 25% decrease in torque directly validate the synergistic effect of our coupled technology: optimized parameters reduced initial cuttings deposition, while 60 m spaced subs disrupted the residual beds, addressing the “fragmentation-colloidal stability” dilemma of J Block’s shale together.
These results demonstrate a significant improvement in hole-cleaning conditions and a marked reduction in friction and torque following the application of the integrated cuttings bed prevention and removal technology.

4. Discussion

4.1. Comparative Analysis with Previous Research

(1)
Advancements in Model Correction: This study reduced the error of the Moore cuttings slip velocity model from ±20% to ±5% by introducing a horizontal section drill string collision correction factor. This aligns with Chen Ye’s [38] conclusion regarding the impact of drill string collision on secondary cuttings fragmentation, but our work quantitatively establishes the direct influence of the correction factor on slip velocity, addressing the neglect of dynamic collisions in horizontal wells using traditional models. In contrast, prediction models for cuttings bed height, such as that formulated by Zongyu et al. [43], which omit drill string collision parameters, exhibit prediction deviations of 15–20% in Block J.
(2)
Synergistic Effect of Parameter Optimization: The optimal parameter combination (flow rate ≥ 1860 L/min; rotation speed ≥ 120 RPM; and ROP ≤ 13 m/h) reduced the cuttings input rate by 43.48%, significantly suppressing bed formation. This finding corroborates Gharib’s conclusion that an increased flow rate enhances cuttings transport capacity. However, our study is the first to demonstrate, through orthogonal simulation, the necessity of synergistic optimization of flow rate, rotation speed, and ROP. Only increasing the flow rate in Block J’s high-level clay formations risks wellbore instability, while the tri-parameter synergy maximizes cleaning efficiency and ensures wellbore stability.
(3)
Engineering Innovation in Mechanical Removal: The subspacing model resolves the issue of cuttings re-sedimentation. By introducing the carrying factor (α) and acceleration factor (β), the model quantifies the influence of tool disturbance range on cutting transport distance. While Nour et al. [44] proposed machine learning for optimizing tool spacing, their model relies on historical data and does not account for real-time drilling parameter variations. In contrast, our model can be directly embedded within drilling control systems for dynamic adjustment. Compared to Akhshik (2015)’s CFD-DEM model [12], our model demonstrated the following. (1) Computational efficiency: Our model has a 2 h/parameter set vs. 48 h for CFD-DEM, making it suitable for real-time field adjustment in J Block; (2) Field applicability: Our simplified formula integrates into conventional drilling software while CFD-DEM requires specialized teams; and (3) Accuracy balance: a ±5% error in J Block high-level clay conditions meets engineering needs.

4.2. Practical Significance of the Technological Breakthrough

The core value of this technology lies in the closed-loop synergy between prevention and removal. Parameter optimization reduces cutting input at the source and lowers initial bed packing density. Mechanical removal precisely disrupts residual bed structure, preventing the reorganization and re-compaction of fine particles. Field application in Well J110-8-1H achieved a 50% reduction in sliding friction and a 40% shortening of the drilling cycle. The economic impact is substantial: based on Block J’s average daily drilling cost of CNY 1.2 million, single-well savings amount to approximately CNY 24 million. More importantly, the complexity rate decreased from 13.3% to below 5%, providing crucial technical assurance for unlocking the production potential of continental shale oil in the Sichuan Basin.

4.3. Limitations of the Study

Despite promising results, the following limitations warrant attention:
(1)
Model Applicability Boundary: The modified Moore model performs inadequately in sections with dogleg severity (DLS) > 7°/30 m. High DLS exacerbates drill string eccentricity, altering annular flow patterns. The current model lacks an eccentricity correction term.
(2)
Tool Performance Dependency: The carrying factor (α) and acceleration factor (β) require laboratory calibration for specific sub-designs. In practice, if tool wear exceeds 15%, α can decrease to 0.98–1.05, potentially causing spacing errors of up to ±8 m.
(3)
Limited Coupling with Dynamic Mud Properties: This study assumed stable drilling fluid properties. However, as noted by David et al. [45], fluid properties are prone to dynamic changes in shale formations with high clay contents. Plastic viscosity fluctuations exceeding 20% could adversely impact the prediction accuracy of cuttings slip velocity.
In summary, this integrated technology provides a practical solution for hole cleaning in shale formations with a high clay content.

5. Conclusions

The following future directions can address the above limitations:
(1)
Develop an Adaptive Spacing Model: Integrate real-time downhole torque monitoring data to establish a dynamic feedback mechanism for adjusting sub spacing.
(2)
Extend the Model for High-DLS Sections: Introduce a drill string eccentricity correction coefficient to establish quantitative relationships between DLS, eccentricity, and slip velocity.
(3)
Integrate into Intelligent Drilling Systems: Embed the parameter optimization and mechanical removal modules within intelligent drilling platforms. Combine this with Gharib’s drilling fluid digital twin concept to achieve closed-loop control of the entire hole-cleaning process.
In summary, this study provides a quantifiable solution for hole cleaning in continental shale formations with high clay contents through the synergistic innovation of drilling parameter optimization and mechanical cuttings removal. Future efforts must overcome the challenges of adaptability in complex wellbore geometries, driving this technology towards greater intelligence and self-adaptation.

Author Contributions

Conceptualization, D.Y., H.G., X.S. and Y.X.; methodology, D.Y., H.G. and Y.X.; software, D.Y., H.H. and Q.D.; validation, D.Y., H.G., Q.D. and H.H.; formal analysis, D.Y., H.G. and Q.D.; investigation, Y.X. and X.S.; resources, H.G., Y.X. and D.Y.; data curation, J.L.; writing—original draft preparation, D.Y., X.S. and Y.X.; writing—review and editing, H.G., H.H., Q.D. and J.L.; visualization, H.H.; supervision, H.G.; project administration, D.Y. and Y.X.; funding acquisition, D.Y. All authors have read and agreed to the published version of the manuscript.

Funding

This research received no external funding.

Data Availability Statement

The original contributions presented in this study are included in the article. Further inquiries can be directed to the corresponding author(s).

Conflicts of Interest

The authors declare no conflict of interest.

References

  1. Zhang, Y.; Li, Y.; Pan, S.Q.; Zhao, Z.F.; Jing, Z.H.; Wang, X.T. Astronomical Cyclological Constraints on Carboniferous-Permian Organic Matter Enrichment in North China. J. Sedimentol. 2024. [Google Scholar] [CrossRef]
  2. Zhao, L.; Xian, B.Z.; Yu, Z.Y.; Shi, F.H.; Fang, H.L. Study on the enrichment of organic matter in continental shale under the constraint of astronomical cycles: A case study of the lower Lianger subcommittee in the Fuxing area of Sichuan Basin. Acta Sedimentol. Sin. 2023, 8. [Google Scholar] [CrossRef]
  3. Chen, C.; Guan, Q.; Chen, X.; Li, C.D.; Ye, Y.H.; Wu, J.; Jiao, K.; Liang, H.R.; Wan, Y. Driving Mechanism of Shale Organic Matter Enrichment in Wufeng Formation-Longmaxi Formation in Weiyuan Area under Astronomical Orbital Period. Pet. Geol. Dev. Daqing 2025. [Google Scholar] [CrossRef]
  4. Wei, W.; Wenbin, S.H.I.; Xiaoping, F.U.; Xie, J.T.; Ni, K. Oil and gas enrichment regularity of conti-nental shale of Lianggaoshan Formation of Middle Jurassic in Fuling area, Sichuan Ba-sin. Nat. Gas Geosci. 2022, 33, 764–774. [Google Scholar] [CrossRef]
  5. Yang, Y.; Yang, J.; Yang, G.; Tao, S.; Ni, C.; Zhang, B.; He, X.; Lin, J.; Huang, D.; Liu, M.; et al. New research progress of Jurassic tight oil in cen-tral Sichuan Basin, SW China. Pet. Explor. Dev. 2016, 43, 954–964. [Google Scholar] [CrossRef]
  6. Zecheng, W.; Yizuo, S.H.I.; Long, W.E.N.; Jiang, H.; Jiang, Q.; Huang, S.; Xie, W.; Li, R.; Jin, H.; Zhang, Z.; et al. Exploring the potential of oil and gas re-sources in Sichuan Basin with Super Basin Thinking. Pet. Explor. Dev. 2022, 49, 977–990. [Google Scholar]
  7. Xinhua, M.A.; Jun, X.I.E. The progress and prospects of shale gas exploration and devel-opment in southern Sichuan Basin, SW China. Pet. Explor. Dev. 2018, 45, 172–182. [Google Scholar]
  8. Pedrosa, C.; Saasen, A.; Ytrehus, J.D. Fundamentals and physical principles for drilled cuttings transport—Cuttings bed sedimentation and erosion. Energies 2021, 14, 545. [Google Scholar] [CrossRef]
  9. Qu, J.; Sun, X.; Yan, T.; Chen, Y.; Hu, Q. A novel prediction model for cuttings bed height in horizontal and deviated wells. J. Nat. Gas Sci. Eng. 2021, 95, 104192. [Google Scholar] [CrossRef]
  10. Li, X.; Fan, Y.; Li, J.; Su, X.; Zhan, S.; Hu, G.; He, Y.; Zhang, M. Research on the Influence of a Cuttings Bed on Drill String Fric-tion Torque in Horizontal Well Sections. Processes 2022, 10, 2061. [Google Scholar] [CrossRef]
  11. Pedrosa, C.; Lund, B.; Opedal, N.; Ytrehus, J.D.; Saasen, A. Experimental bench-scale study on cuttings-bed erosion in horizontal wells. J. Energy Resour. Technol. 2023, 145, 053101. [Google Scholar] [CrossRef]
  12. Akhshik, S.; Behzad, M.; Rajabi, M. CFD–DEM approach to investigate the effect of drill pipe rotation on cuttings transport behavior. J. Pet. Sci. Eng. 2015, 127, 229–244. [Google Scholar] [CrossRef]
  13. Al-Rubaii, M.; Al-Shargabi, M.; Al-Shehri, D.; Yadav, A.S. Hole Cleaning during Drilling Oil and Gas Wells: A Review for Hole-Cleaning Chemistry and Engineering Parameters. Ad-Vances Mater. Sci. Eng. 2023, 2023, 6688500. [Google Scholar] [CrossRef]
  14. Mahmoud, H.; Hamza, A.; Nasser, M.S.; Hussein, I.A.; Ahmed, R.; Karami, H. Hole cleaning and drilling fluid sweeps in horizontal and deviated wells: Comprehensive review. J. Pet. Sci. Eng. 2020, 186, 106748. [Google Scholar] [CrossRef]
  15. Hu, W.; Zhang, J.; Guan, N.; Zhu, H. Cuttings Transport Characteristics and Multi-Objective Optimization Design of a Novel Hole Cleaning Tool. Geoenergy Sci. Eng. 2025, 254, 214053. [Google Scholar] [CrossRef]
  16. Chen, D.C.K. New drilling optimization technologies make drilling more efficient. In Proceedings of the PETSOC Canadian International Petroleum Conference, Calgary, AB, Canada, 8–10 June 2004. PETSOC, 2004: PETSOC-2004-020. [Google Scholar]
  17. Boyou, N.; Haddad, A.S.; Rafati, R.; Aboulrous, A.A.; Alsabagh , A. Comprehensive Review on Wellbore Cleaning: Analyzing Factors, Simulation Models, and Emerging Technologies for Enhanced Drilling Efficiency. J. Pet. Min. Eng. 2024, 26, 7–36. [Google Scholar] [CrossRef]
  18. Ramsey, M.S. Practical Wellbore Hydraulics and Hole Cleaning: Unlock Faster, More Effi-Cient, and Trouble-Free Drilling Operations; Gulf Professional Publishing: Houston, TX, USA, 2019. [Google Scholar]
  19. Dosunmu, A.; Orun, C.; Anyanwu, C.; Ekeinde, E. Optimization of hole cleaning using dynamic real-time cuttings monitoring tools. In Proceedings of the SPE Nigeria Annual International Conference and Exhibition, Lagos, Nigeria, 4–6 August 2025. SPE 2015: SPE-178373-MS. [Google Scholar]
  20. Wang, H.; Huang, H.; Bi, W.; Ji, G.; Zhou, B.; Zhuo, L. Deep and ultra-deep oil and gas well drilling technolo-gies: Progress and prospect. Nat. Gas Ind. B 2022, 9, 141–157. [Google Scholar] [CrossRef]
  21. Katende, A.; Segar, B.; Ismail, I.; Sagala, F.; Saadiah, H.H.A.R.; Samsuri, A. The effect of drill–pipe rotation on improving hole cleaning using polypropylene beads in water-based mud at different hole angles. J. Pet. Explor. Prod. Technol. 2020, 10, 1253–1262. [Google Scholar] [CrossRef]
  22. Yeo, L.; Feng, Y.; Seibi, A.; Temani, A.; Liu, N. Optimization of hole cleaning in horizontal and inclined wellbores: A study with computational fluid dynamics. J. Pet. Sci. Eng. 2021, 205, 108993. [Google Scholar] [CrossRef]
  23. Sanchez, R.A.; Azar, J.J.; Bassal, A.A.; Martins, A.L. Effect of Drillpipe Rotation on Hole Cleaning During Directional-Well Drilling. SPE J. 1999, 4, 101–108. [Google Scholar] [CrossRef]
  24. Saasen, A.; Løklingholm, G. The effect of drilling fluid rheological properties on hole cleaning. In Proceedings of the SPE/IADC Drilling Conference and Exhibition, Galveston, TX, USA, 26–28 February 2002. SPE 2002: SPE-74558-MS. [Google Scholar]
  25. Adari, R.B.; Miska, S.; Kuru, E.; Bern, P.; Saasen, A. Selecting drilling fluid properties and flow rates for effective hole cleaning in high-angle and horizontal wells. In Proceedings of the SPE Annual Technical Conference and Exhibition, Houston, TX, USA, 1–4 October 2000. SPE 2000: SPE-63050-MS. [Google Scholar]
  26. Orun, C.B.; Akpabio, J.U.; Agwu, O.E. Drilling fluid design for depleted zone drilling: An integrated review of laboratory, field, modelling and cost studies. Geoenergy Sci. Eng. 2023, 226, 211706. [Google Scholar] [CrossRef]
  27. Caenn, R.; Darley, H.C.H.; Gray, G.R. Composition and Properties of Drilling and Comple-Tion Fluids; Gulf Professional Publishing: Houston, TX, USA, 2011. [Google Scholar]
  28. Zhou, Y.; He, Y.; Li, Z.; Ju, G. Hole cleaning performance of v-shaped hole cleaning device in horizontal well drilling: Numerical modeling and experiments. Appl. Sci. 2022, 12, 5141. [Google Scholar] [CrossRef]
  29. Kjøsnes, I.; Løklingholm, G.; Saasen, A.; Syrstad, S.O.; Agle, A.; Solvange, K.-A. Successful water based drilling fluid design for optimizing hole cleaning and hole stability. In Proceedings of the SPE/IADC Middle East Drilling Technology Conference and Exhibition, Abu Dhabi, United Arab Emirates, 20–22 October 2003. SPE 2003: SPE-85330-MS. [Google Scholar]
  30. Luo, Y.; Bern, P.A.; Chambers, B.D. Flow-rate predictions for cleaning deviated wells. In Proceedings of the SPE/IADC Drilling Conference and Exhibition, New Orleans, LA, USA, 18–21 February 1992. SPE 1992: SPE-23884-MS. [Google Scholar]
  31. Noah, A.Z. Optimizing drilling fluid properties and flow rates for effective hole clean-ing at high-angle and horizontal wells. J. Appl. Sci. Res. 2013, 9, 705–718. [Google Scholar]
  32. Sayindla, S.; Lund, B.; Ytrehus, J.D.; Saasen, A. Hole-cleaning performance comparison of oil-based and water-based drilling fluids. J. Pet. Sci. Eng. 2017, 159, 49–57. [Google Scholar] [CrossRef]
  33. Busahmin, B.; Saeid, N.H.; Alusta, G.; Zahran, E.-S.M.M. Review on hole cleaning for horizontal wells. ARPN J. Eng. Appl. Sci. 2017, 12, 4697–4708. [Google Scholar]
  34. Shirangi, M.G.; Aragall, R.; Osgouei, R.E.; May, R.; Furlong, E.; Dahl, T.G.; Thompson, C.A.; Furlong, T. Development of digital twins for drilling fluids: Local velocities for hole clean-ing and rheology monitoring. J. Energy Resour. Technol. 2022, 144, 123003. [Google Scholar] [CrossRef]
  35. Iyoho, A.W.; Horeth, I.J.M.; Veenkant, R.L. A computer model for hole-cleaning analy-sis. J. Pet. Technol. 1988, 40, 1183–1192. [Google Scholar] [CrossRef]
  36. Hu, W.; Zhang, J.; Xu, B.; Zhu, H. Numerical simulation and experimental study of hole cleaning. Tunn. Undergr. Space Technol. 2024, 147, 105697. [Google Scholar] [CrossRef]
  37. Cayeux, E.; Mesagan, T.; Tanripada, S.; Zidan, M.; Fjelde, K.K.K. Real-time evaluation of hole-cleaning condi-tions with a transient cuttings-transport model. SPE Drill. Complet. 2014, 29, 5–21. [Google Scholar] [CrossRef]
  38. Chen, Y.; Sun, X.; Yan, T.; Yao, D.; Duan, R. Experimental study on micron-sized sand particles transport in the water flow path of hydrates production wellbore. J. Nat. Gas Sci. Eng. 2020, 73, 103088. [Google Scholar] [CrossRef]
  39. Ji, G.; Wang, H.; Huang, H.; Meng, Z.; Cui, L.; Guo, W. Design and test of a cuttings bed remover for horizontal wells. Nat. Gas Ind. B 2021, 8, 412–419. [Google Scholar] [CrossRef]
  40. Peng, S.; Huang, W.J.; Gao, D.L. Hole cleaning evaluation and installation spacing opti-mization of cuttings bed remover in extended-reach drilling. Pet. Sci. 2024, 21, 2005–2022. [Google Scholar] [CrossRef]
  41. Liu, Z.; Liu, G.; Hu, Z.; Feng, D.; Zhu, T.; Bian, R.; Jiang, T.; Jin, Z. Lithofacies types and assemblage features of continental shale strata and their implications for shale gas exploration: A case study of the Middle and Lower Jurassic strata in the Sichuan Basin. Nat. Gas Ind. B 2020, 7, 358–369. [Google Scholar] [CrossRef]
  42. Saasen, A.; Omland, T.H.; Ekrene, S.; Brévière, J.; Villard, E.; Kaageson-Loe, N.; Tehrani, A.; Cameron, J.; Freeman, M.A.; Growcock, F.; et al. Automatic measurement of drilling fluid and drill-cuttings properties. SPE Drill. Complet. 2009, 24, 611–625. [Google Scholar] [CrossRef]
  43. Lu, Z.Y.; Wu, B.C.; Shi, J.G.; Xi, C.M.; Wei, K. A Multiparameter Coupled Prediction Model for Annular Cuttings Bed Height in Horizontal Wells. Geofluids 2022, 2022. [Google Scholar] [CrossRef]
  44. Nour, M.; Elsayed, K.S.; Mahmoud, O. A supervised machine learning model to select a cost-effective directional drilling tool. Sci. Rep. 2024, 14, 26624. [Google Scholar] [CrossRef]
  45. David, C.E.; Zimmerman, W.R. Pore structure model for elastic wave velocities in fluid-saturated sandstones. J. Geophys. Res. Solid Earth 2012, 117, B7. [Google Scholar] [CrossRef]
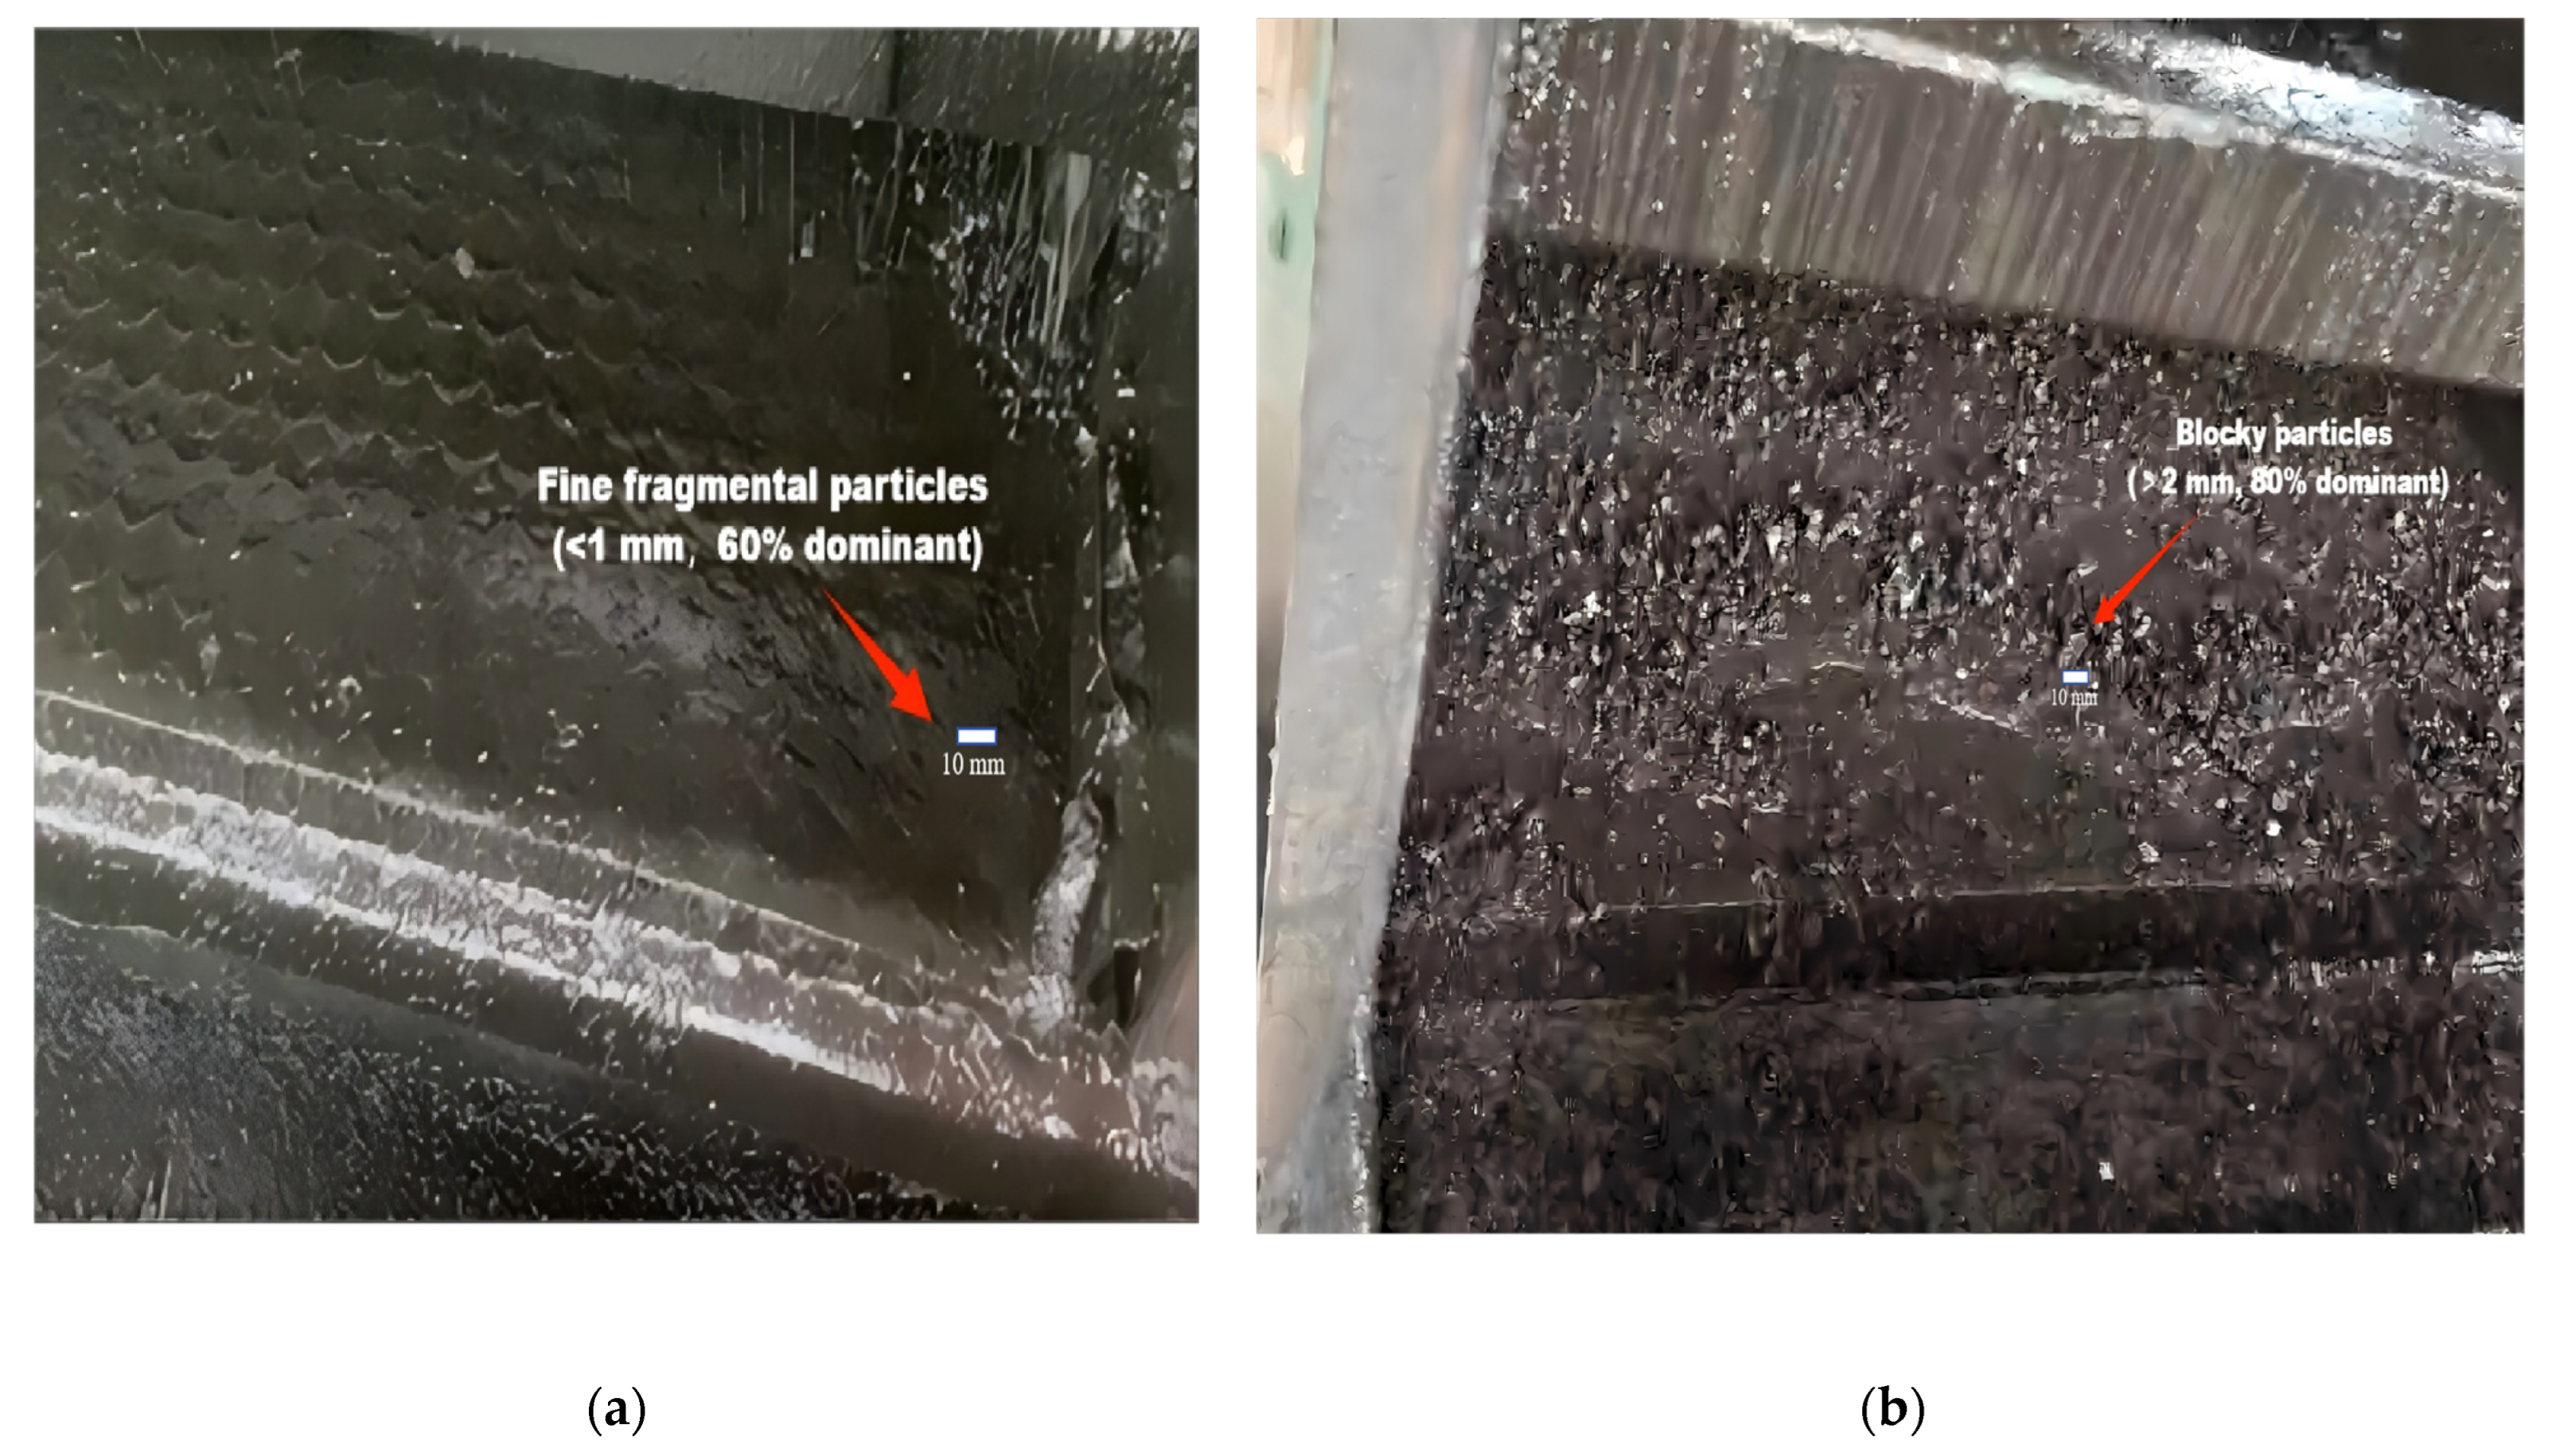
Figure 1. Morphological comparison of cuttings from J Block and adjacent block. (a) Cutting samples from J Block, showing fine, flaky particles dominated by <1 mm fragments due to high clay content. (b) High-resolution updated image of cuttings from adjacent block, characterized by coarser, intact particles with >2 mm fragments accounting for 80%.
Processes 13 02604 g001
Figure 2. Cuttings bed thickness along 2500 m wellbore simulated by parameter optimization model, under initial drilling parameters. This model predicts bed formation trends to guide parameter optimization for prevention, showing severe accumulation under empirical parameters.
Processes 13 02604 g002
Figure 3. Spiral groove of cutting removal sub.
Processes 13 02604 g003
Figure 4. Schematic of turbulent eddy formation near the helical grooves of the cutting removal sub.
Processes 13 02604 g004
Figure 5. Simulation of the formation of cuttings bed under different flow rates.
Processes 13 02604 g005
Figure 6. Simulation of cuttings bed formation under different RPMs.
Processes 13 02604 g006
Figure 7. Simulation of cuttings bed formation under different ROPs.
Processes 13 02604 g007
Figure 8. Simulation of cuttings bed formation under different levels of plastic viscosity.
Processes 13 02604 g008
Table 1. Drilling performance comparison between J Block and adjacent blocks.
BlockTD
(m)
HLS Length
(m)
ROP
(m/h)
Vertical Sec.
(d)
Build/Tangent + HLS
(d)
Drilling Cycle
(d)
Trouble Time
(%)
Remarks
J Block462616676.1514.495410113.3Early development
Adjacent 2013421515325.022040854.64Early development
Adjacent 20254956213220.626.325.228.92.63Mature technology
Table 2. Factors and levels for L9 orthogonal simulation.
FactorLevel 1Level 2Level 3
Flow rate (L/min)166017601860
Rotating speed (RPM)6090120
ROP (m/h)132333
Plastic viscosity (mPa·s)304050
Table 3. Results of multi-factor orthogonal simulation.
No.Flow Rate
L/min
Rotating Speed
RPM
ROP
m/h
Plastic Viscosity
mPa·s
Cuttings Bed Thickness
mm
1166060133019.22
2166090234018.28
31660120335017.37
4176060235011.17
5176090333015.09
61760120134011.73
7186060334011.14
818609013504.4
9186012023306.23
The orthogonal results that identified the optimal combination are as follows: flow rate = 1860 L/min; RPM = 120; ROP = 13 m/h; and plastic viscosity = 50 mPa·s. This combination reduced the cuttings input rate from 0.8423 m3/h to 0.4761 m3/h, which is a 43.48% reduction.
Table 4. Analysis of multi-factor orthogonal simulation.
FactorLevel 1 Mean
(mm)
Level 1 Mean
(mm)
Level 1 Mean
(mm)
Range
(mm)
Order of Influence
Flow rate (L/min)18.2912.6610.597.71
Rotating speed (RPM)13.8412.5711.782.062
ROP (m/h)11.7811.8914.532.754
Plastic viscosity (mPa·s)13.5113.5311.172.363
Range analysis revealed the order of impact on cuttings bed thickness: flow rate range = 7.7 mm; RPM range = 2.06 mm; plastic viscosity range = 2.36 mm; ROP range = 2.75 mm.
Disclaimer/Publisher’s Note: The statements, opinions and data contained in all publications are solely those of the individual author(s) and contributor(s) and not of MDPI and/or the editor(s). MDPI and/or the editor(s) disclaim responsibility for any injury to people or property resulting from any ideas, methods, instructions or products referred to in the content.