Abstract
To address the difficulty in the characterization of the geomechanical properties of reservoirs in petroleum engineering using the traditional formula, due to the complexity of the reservoir, this study proposes a framework of inverse analysis to characterize the geomechanical properties of reservoirs formed through hydraulic fracturing by combining the XGBoost, multi-objective particle swarm optimization (MOPSO), and numerical models. XGBoost was used to generate a surrogate model to approximate the physical model, and the numerical model was used to generate a dataset for XGBoost. MOPSO is regarded as an optimal technology to deal with the conflict between multi-objective functions in inverse analysis. On comparing the results between the actual geomechanical properties and those obtained by using traditional inverse analysis, the proposed framework accurately characterizes the geomechanical parameters of reservoirs obtained through hydraulic fracturing. This provides a feasible, scientific, and promising way to characterize reservoir formation in petroleum engineering, as well as a reference for other fields of engineering.
1. Introduction
The geomechanical properties of the surrounding rock mass of oil–gas reservoirs are critical for its simulation, the design and stability analysis of the wellbore, and production planning in petroleum engineering [1,2,3]. Various technologies and methods have been developed to identify the geomechanical properties of rock formations. Hydraulic fracturing is regarded as one of the most effective techniques to determine the in situ stress and geomechanical parameters of rock formations [4,5,6,7,8]. Moreover, the inverse analysis method provides an excellent means of identifying their geomechanical properties by combining the physical model of the rock structure with the data monitored on site. However, it remains challenging to determine the geomechanical properties of rock formations due to the uncertainty and complexity of geological conditions [9,10,11,12].
Inverse analysis determines the geomechanical properties of the rock formation by minimizing the discrepancy between the monitored data and the information predicted by a surrogate model at different monitoring sites based on techniques of optimization. The latter and the physical model are two critical components of inverse analysis (Figure 1). Inverse analysis has recently been widely adopted in rock engineering to determine in situ stress and the geomechanical properties of rock formation [13,14,15,16,17,18,19,20]. However, it is difficult to determine the mapping function of the response of the rock formation and its corresponding geomechanical properties that are used to characterize the rock mass due to the complexity, nonlinearity, and uncertainty of the physical model. Various surrogate models, ranging from traditional models of mathematical regression to machine learning models, have been proposed to represent the physical model, which in turn approximates the response of the rock formation when it is subjected to engineering-related measures. To improve the efficiency and accuracy of the surrogate model, we used the extreme gradient boosting (XGBoost) model, an ensemble learning technology, in this study in place of the physical model during inverse analysis. The XGBoost model delivered excellent generalization-related performance and solved the problem of overfitting [21,22]. Traditional techniques of single-objective optimization have been commonly applied to inverse analysis to identify the geomechanical properties of rock formation. However, it is challenging to balance its approximate effect on different monitored sites by using single-objective optimization due to the complexity of rock engineering. We used multi-objective particle swarm optimization (MOPSO) for inverse analysis in this study, as it delivered excellent performance in global search and satisfies the requirements of engineering practice [23,24].
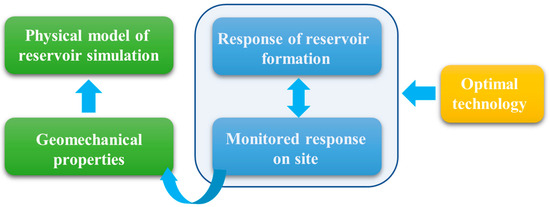
Figure 1.
The basic framework of inverse analysis.
The data obtained from monitoring are critical for inverse analysis. The deformation of the rock mass can be easily and accurately obtained, and thus is used in rock engineering in general. Hydraulic fracturing is a widely used and reliable technology in petroleum engineering to capture the geomechanical properties of rock formations based on pressure. Two classic formulae for the breakdown of the rock formation have been developed in the literature to describe its geomechanical properties [5,25]. However, the pore pressure, which is critical for deep boreholes, is not accounted for in these formulae. To compensate for the resulting disadvantage, some improved methods have been developed to deal with the pore pressure [25,26,27,28]. Schmitt and Zoback [25] proposed a generalized formula for hydrofracture-induced breakdown to consider poroelastic effects. However, these methods require prior knowledge of certain poroelastic properties, such as the Poisson’s ratio and poroelastic Biot coefficient of the rock, that are not easy to accurately determine in engineering owing to a lack of high-quality core samples [29]. To overcome the shortcomings of the traditional formulae for breakdown, researchers have developed some methods of inverse analysis by combining artificial neural networks, the Gaussian process, support vector machines, genetic algorithms, particle swarm optimization, and by monitoring data on the borehole pressure to characterize the in situ stress and elastic parameters [1,9]. However, this technology has the disadvantages of overfitting, poor generalization-related performance, and the tendency to be trapped in the local minimum solution. To overcome these disadvantages, we used XGBoost and MOPSO to develop a method of inverse analysis for determining the geomechanical properties of the rock formation from hydraulic fracturing based on the borehole pressure.
The technique of optimization used is also critical to the efficiency and accuracy of inverse analysis. Various optimization technologies, including methods of intelligent optimization, have been applied to inverse analysis. Single-objective optimization is most commonly used in inverse analysis at present [30]. It is challenging to use in case of multiple differences between the monitoring data and the predicted information. Various methods have been proposed to solve the problem of multi-objective optimization in engineering. A frequently used method converts multiple objectives into a single objective for optimization by using such techniques as the ε-constraint approach, the penalty function, and the minimum–maximum method [31]. In this study, we proposed a highly efficient technique of multi-objective optimization for inverse analysis based on XGBoost, and we used MOPSO here for optimization in inverse analysis. Eventually, the geomechanical properties of the rock formation were accurately characterized based on the proposed method and the wellbore pressure during the hydraulic fracturing process. The research results of this study can not only accurately characterize and predict the geomechanical properties of the formation, but also provide guidance for the design and optimization of hydraulic fracturing under complex geological conditions.
2. Method
The technique of optimization and the physical model are two critical components of inverse analysis. It is challenging to obtain an analytical solution for physical models in reservoir engineering due to the nonlinearity and complexity of rock formations. Numerical methods are thus commonly used to approximate the physical model needed to compute the response of the reservoir formation. However, because numerical models are costly, surrogate models have been developed to replace them and improve the efficiency of inverse analysis. We used ensemble learning to construct the surrogate model in this study. To overcome the disadvantage of traditional single-objective optimization, we used MOPSO for optimization, and combined it with ensemble learning to develop our method of inverse analysis.
2.1. Ensemble Learning
Ensemble learning is an efficient machine learning method that aggregates the results of different machine learning-based approaches (including decision trees and artificial neural networks) to enhance the accuracy, efficiency, and capability of generalization of the algorithm. Ensemble learning uses two prevalent technologies, i.e., bagging and boosting. Bagging can improve the overall predictive accuracy by combining multiple predictions obtained by training a single model on multiple subsets of the training data. Compared with bagging, boosting improves predictive performance by iteratively combining weak learners with each model to yield strong learners. Commonly used boosting methods include gradient boosting, adaptive boosting (AdaBoost), and eXtreme gradient boosting (XGBoost). We used the latter here to represent the complex nonlinear relationships between the geomechanical properties of the rock formation and its response to hydraulic fracturing.
The XGBoost algorithm is an efficient and flexible machine learning-based technique. Chen and Guestrin [32] used the gradient boosting decision tree (GBDT) to avoid overfitting the results while maintaining a high computational speed. The XGBoost algorithm continues to add trees to the given structure to fit the residual between the prediction in the previous iteration and the actual results (Figure 2). It then takes the sum of results from multiple decision trees to generate the final prediction. XGBoost improves the efficiency of training by parallelizing the feature selection of each decision tree and avoids overfitting by using random sampling. It has been applied to various engineering fields.

Figure 2.
The logical construction of the XGBoost algorithm.
The loss function of the XGBoost algorithm uses a second-order Taylor expansion, and contains a regularization term to reduce variance, improve efficiency, and prevent overfitting. The following equations define the loss function:
where is the predicted residual of the th sample in the th iteration, and are the th sample and the regularization term, respectively, is the score of the leaf node, and and represent the number of leaf nodes and the coefficient of the sum of weights regularized by the regularization term of all leaf nodes, respectively. The GBDT algorithm is used when the regularization term is zero.
2.2. Multi-Objective Particle Swarm Optimization
Problems of multi-objective optimization are often encountered in engineering. A multi-objective optimization problem can be presented in the following form. It is minimized or maximized as follows:
subject to
where , , and denote the objective function, the optimal variables, and the number of objective functions, respectively, is an n-dimensional vector, and n is the number of optimal variables. and denote the lower and upper limits of the th optimal variable, and are the inequality and equality constraints, and, and are their numbers, respectively.
In general, multi-objective optimization problems do not have a globally unique optimal solution but a set of non-dominant solutions. These non-dominant solutions define the Pareto front of the problem at hand. The traditional technique of optimization can reflect only the main objective based on the priorities assigned to a single objective function. We used MOPSO to solve the problem of multi-objective optimization. It is an excellent technique to this end, and is based on the Pareto-optimal solution and particle swarm optimization.
MOPSO was developed by Coello et al. [33], and has been successfully applied to multi-objective optimization [34,35,36,37,38]. It originates from the traditional PSO, which is one of the most widely used approaches to optimization in engineering, and has the same procedure. A swarm of particles is initiated by using random vectors of the design variable and the corresponding velocity vectors. The algorithm then iteratively updates the vectors as follows:
where and are the vector of the design variable and the velocity vector of the th particle in the th step, respectively, is the best solution vector (design variable) of the ith particle in first t steps, is an archive of vectors of the globally best solution (globally best archive) among all particles in the first steps, and , , and are parameters that are determined by the user.
MOPSO obtains the Pareto frontiers, a set of non-dominant solutions collected in a repository, and substitutes them for a single global optimal solution. This is used to guide the population to search for the optimal Pareto frontier to ensure its diversity. A flowchart of the MOPSO algorithm is shown in Figure 3, and the procedure is as follows:
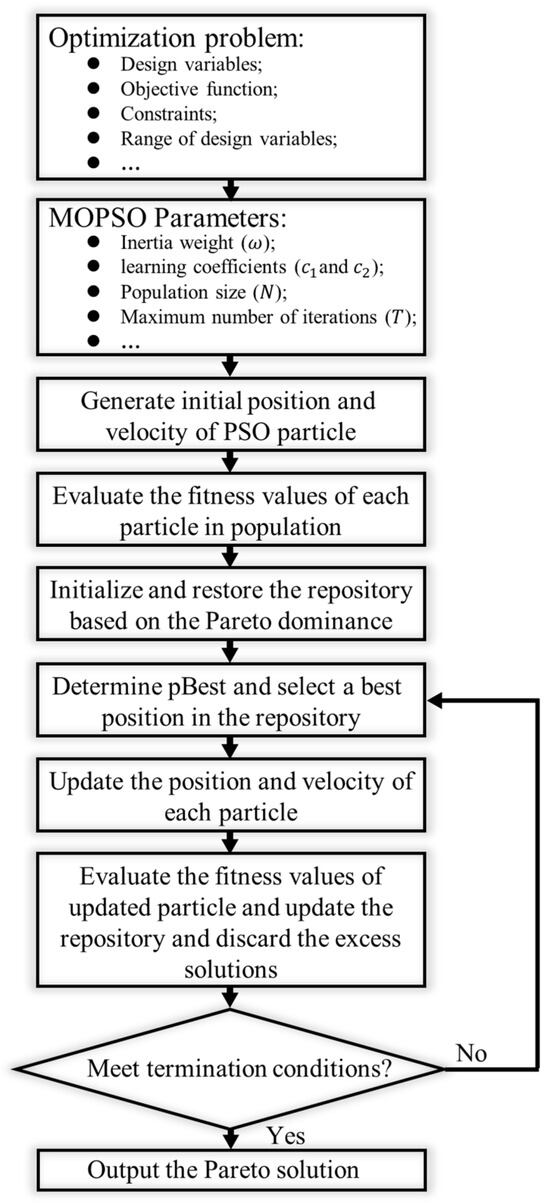
Figure 3.
The flowchart of the MOPSO algorithm.
Step 1: Evaluate and analyze the optimal problem, and specify the objectives, the corresponding design variables, and constraints.
Step 2: Set the parameters of MOPSO, i.e., the population size (), maximum number of iterations (), personal and global learning coefficients ( and ), and inertial weight ().
Step 3: Randomly initialize the position and velocity of each particle in the particle swarm.
Step 4: Calculate the fitness value of each particle in the swarm.
Step 5: Initialize the repository and predefine its size. Select the non-dominant solutions based on Pareto dominance and save them in a repository.
Step 6: Determine the best particle in the repository and obtain its global best position.
Step 7: Update the position and velocity of each particle by using Equations (7) and (8).
Step 8: Calculate the updated fitness value of each particle and update the repository based on Pareto dominance. If the number of non-dominant solutions surpasses the predefined size of the repository, abandon the excess solutions.
Step 9: If the maximum number of iterations arrives, terminate the MOPSO procedure and output the non-dominant solutions from the repository; otherwise, go to step 6.
The final output of the MOPSO algorithm is called the Pareto-optimal solution, and is represented as the Pareto-optimal frontier.
2.3. Characterization of Geomechanical Properties Using XGBoost
The physical model and technique of optimization are two essential components of inverse analysis. An inverse analysis is developed to identify the geomechanical properties of rock formations by XGBoost, MOPSO, and the monitored borehole pressure. XGBoost was used to approximate the physical model for improving the efficiency of inverse analysis, while MOPSO was used to optimize the results to enhance the robustness and performance of the method in terms of the global search.
XGBoost is employed to build the surrogate model to approximate the physical model, and to capture the complex relationship between the pressure and geomechanical properties of reservoir formations. The XGBoost-based surrogate model can be represented by using as follows:
where = (,,…,) is a vector of the geomechanical properties (e.g., in situ stress, Young’s modulus, and joint parameters), and = (,,…,) is a -dimensional vector of borehole pressure.
To obtain , we implemented the XGBoost algorithm based on a known dataset. The dataset (samples) is critical for building . We used a numerical model to generate the training and test samples.
2.4. Procedure of the Proposed Method
The geomechanical properties can be obtained in inverse analysis by minimizing the discrepancy between the actual pressures of hydraulic fracturing and the predicted pressures by XGBoost. To use MOPSO to search for unknown geomechanical properties, the necessary objective function is established as follows:
where is the th objective function, denotes the pressure predicted the XGBoost model, and and denote the th monitored pressure-related data item and the number of monitored pressure points (objective function), respectively.
Once XGBoost has captured the complex functional relationship between the borehole pressures and the geomechanical properties, replaces the physical model to determine the borehole pressures. MOPSO is used to determine the Pareto-optimal solution based on the objective functions, which present the difference between the pressure calculated by XGBoost and that measured in hydraulic fracturing. Figure 4 shows a flowchart of the proposed method of inverse analysis, the procedure of which is as follows:
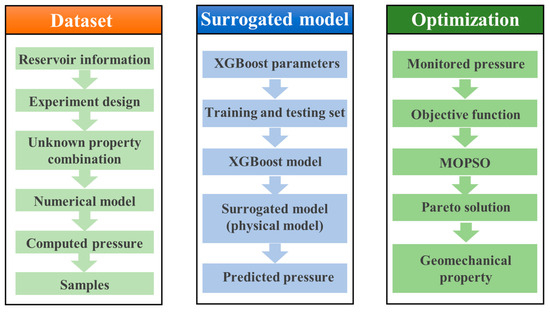
Figure 4.
The proposed method of inverse analysis based on XGBoost and MOPSO.
Step 1: Analyze and determine the data on the reservoir formation, including unknown (which needs to be solved by inverse analysis) and known information in the numerical model, parameters of XGBoost and MOPSO, and the range of values representing the properties of the rock formation.
Step 2: Generate the combination of unknown parameters by using the design of the experiment, compute the borehole pressure for each combination of parameters, and then obtain the dataset for XGBoost.
Step 3: Split the above dataset into training and testing samples for XGBoost, and construct the XGBoost-based surrogate model for inverse analysis.
Step 4: Activate the MOPSO algorithm to search for the Pareto-optimal solution for the geomechanical properties based on the objective functions.
Step 5: Obtain the geomechanical properties of the reservoir formation based on the Pareto-optimal solution.
3. Results
3.1. Numerical Simulation of Hydraulic Fracturing
It is necessary, but challenging, to characterize the geomechanical properties of reservoir formations for oil and gas exploration [39]. Hydraulic fracturing is a useful tool to this end, and does so based on the borehole pressure. Extended leak-off tests (XLOTs), which are a kind of in situ tests of hydraulic fracturing, are generally performed on new wells to characterize the geomechanical properties (Young’s modulus, Poisson’s ratio, parameters of joints, and in situ stress) of reservoir formations for petroleum engineering. The ideal pressure–time/volume curve obtained from XLOTs under two pressure cycles can be found from reference [2]. As the XLOT continued, the fluid pressure in the wellbore increased beyond the leak-off pressure (LOP) until the formation breakdown pressure (FBP), which is also known as the fracture initiation pressure (FIP), was obtained. A new fracture was generated in the reservoir formation, and led to a rapid reduction in pressure. The generated fracture then propagated along the maximum in situ stress under a stable pressure, called the fracture propagation pressure (FPP). When pumping was stopped, a decline in the pressure was observed. This decreased pressure is called the instantaneous shut-in pressure (ISIP), and is commonly used to determine the minimum in situ stress.
Hydraulic fracturing technology has been widely applied to estimate the in situ stress, and the generalized equation for hydrofracturing-induced breakdown [25]:
Considering the poroelastic effect can be expressed as:
where is the breakdown pressure, and and denote the maximum and minimum horizontal in situ stresses, respectively. , , , and are the tensile strength of the rock, pore pressure, Biot poroelastic parameter, and Poisson’s ratio, respectively.
The performance of the XLOT in simulations of the reservoir depends on the natural and induced hydraulic fractures as well as their interactions with the rock formation31. The rock formation is regarded as an elastic and isotropic material in the model of hydraulic fracturing, and the Coulomb slip model is used to simulate the deformation of the fractures. For a system of joints with a spacing and a difference of pressure between them, the rate of flow in a single fracture of length can be obtained according to the cubic law of flow in fracture as follows [40,41]:
where , , and denote the rate of flow, the dynamic viscosity, and the length of a single joint, respectively. denotes the contact hydraulic aperture, which can be determined as follows:
where denotes the aperture of the joint under zero normal stress and is its normal displacement and is related to the normal stress and the properties of the rock formation.
The normal stiffness () can be obtained by using the following equation:
where and are the effective normal increment and the increment in the normal displacement, respectively.
A numerical example is employed to verify the performance of the proposed method by determining the geomechanical properties of a given reservoir formation based on hydraulic fracturing. According to references [40,41,42,43], the test of hydraulic fracturing was implemented on a 2D plane strain model by simulating the injection of water into the well of a deep reservoir. The size of the model was 44 m × 44 m under the maximum () and minimum () horizontal in situ stresses, and the vertical in situ stress (). The depth and diameter of the wellbore were 1800 m and 0.2 m, respectively (Figure 5). The outer reservoir formation was assumed to move and rotate freely in all directions according to the boundary conditions of the numerical model. During the test, a given pre-existing fracture was perpendicular to the minimum horizontal in situ stress, and passed through the center of the borehole (Figure 5).
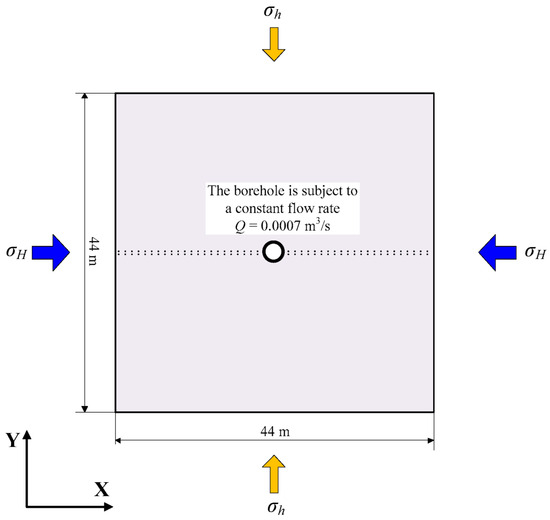
Figure 5.
The size and geometric shape of the problem domain.
The second ISIP and FBP/FRP are typically used to characterize the geomechanical properties of the reservoir formation during hydraulic fracturing. We characterized the in situ stress ( and ) and the properties of the joints (, , , and ) based on the borehole pressure (FBP, FRP, and second ISIP). We simulated two sets of joints (Figure 6). The properties of the rock, joints, and hydraulic fracturing tests are listed in Table 1 and Table 2, excluding the unknown properties that needed to be determined by inverse analysis. A numerical model was used to generate the dataset for XGBoost. Fluid was first injected into the wellbore from the center of the model at a specified constant rate of flow. A numerical simulation was then conducted at = 60 min with different geomechanical properties to obtain the corresponding wellbore pressures. Finally, 40 items of data, 30 of which were used as training samples and 10 as testing samples [44], were generated for XGBoost. And XGBoost’s hyperparameters: Learning rate is 0.1, maximum tree depth is 5, the number of iteration is 300, minimum sum of instance weights required in a child node is 1, the fraction of training data used for each boosting iteration is 0.8, the fraction of features sampled for constructing each tree is 0.8, and the coefficient of L2 regularization is 1.
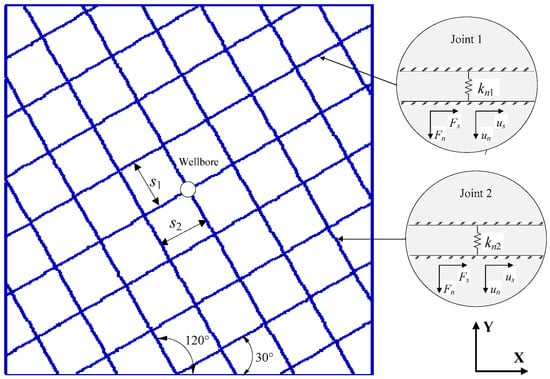
Figure 6.
The fracturing patterns and the characterization parameters of the joints.

Table 1.
Parameters of rock formation and properties for hydraulic fracturing.

Table 2.
Input parameters of the joints during simulation.
3.2. Verification of XGBoost Performance
XGBoost is applied to represent the complex relationship between the monitored pressure and the geomechanical properties of the reservoir formation. The performance of the XGBoost model is shown in Figure 7a. The pressure predicted by it was in excellent agreement with the monitored pressure, which proved that the XGBoost model could accurately identify the complex relationship between the pressure and geomechanical properties of the rock formation. Therefore, it was feasible to use it to approximate the physical model, which is costly and time consuming, during inverse analysis. To verify the capability of generalization of XGBoost, we used it to predict the geomechanical properties of the testing samples. Figure 7b verifies its generalization-related performance.
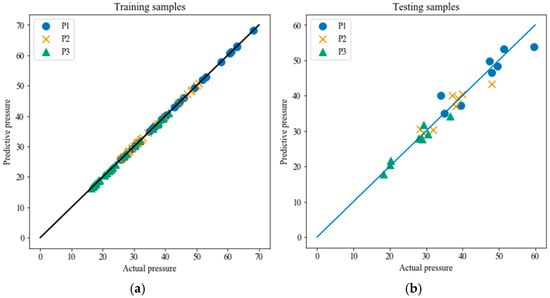
Figure 7.
The comparison between the monitored pressure and that predicted by XGBoost. (a) Training samples of the XGBoost model; (b) testing samples of the XGBoost model.
3.3. Characterization of Geomechanical Properties
We defined three objective functions based on three differences in the pressure between the predictions of XGBoost and the monitored pressure. These objective functions and the constraints imposed by the inverse analysis are presented in Equation (17). Following the application of XGBoost, MOPSO was used to optimize the results. The multi-objective optimization problem was formulated as follows:
The value range of variable X in the above equation is:
where ( = 1, 2, 3) represents the objective functions, , , and are the FBP, FRP, and ISIP, respectively, and ( = 1, …, 6) represents the horizontal in situ stress ( and ), normal stiffness of the joints ( and ), and the spacing between them ( and ), respectively.
The set of synthetic pressures obtained by the numerical model is regarded as the monitored data to determine the geomechanical properties of the rock formation. Table 3 lists the geomechanical properties obtained by the synthetic numerical model. The pressure was obtained by the numerical model based on the wellbore pressure as follows: fracture-induced breakdown pressure = 36.99 MPa, fracture-induced reopening pressure = 28.8 MPa, and the second instantaneous shut-in pressure = 19.32 MPa. Following this, MOPSO was implemented to search for the geomechanical properties according to the proposed method. The MOPSO parameters are that the number of particles is 100, the number of iterations is 100, the coefficients of weight, c1 and c2 are 0.5, 0.8 and 0.9, respectively. Finally, the Pareto-optimal solutions of the geomechanical properties of the rock formation were obtained, and are listed in Table 3. The Pareto fronts of the solutions are shown in Figure 8, The Pareto front consisted of two points, which showed that MOPSO can determine the geomechanical properties. Unlike, single-objective optimization problems, multi-objective optimization problems did not have a global and unique best solution, but instead yielded the Pareto-optimal solution. In other words, the solution dominated (), which means that was “not worse” than over all objective functions, and was better than at least an objective function. It was difficult to obtain the best solution in engineering due to the complexity of reservoir formations. The proposed method of multi-objective optimization, is thus in complete agreement with engineering practice.

Table 3.
The results of the proposed method, and their comparison with empirical data and the results of single.
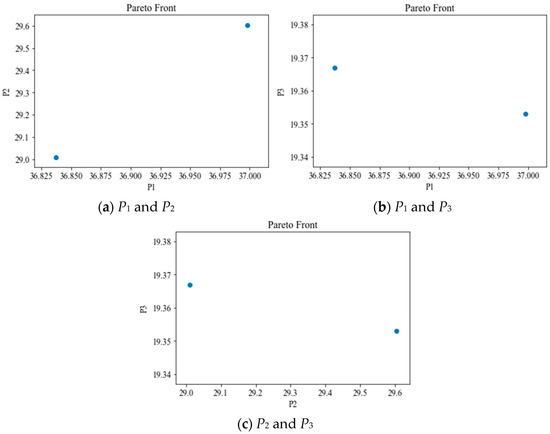
Figure 8.
The Pareto-optimal solution obtained through inverse analysis. (a) Pareto front of P1 and P2; (b) Pareto front of P1 and P3; (c) Pareto front of P2 and P3.
To investigate the performance of the proposed method, Figure 9 shows the geomechanical properties and the corresponding pressure obtained by it, and compares them with those of the single-objective method of optimization. It shows that the Pareto-optimal geomechanical properties obtained by the proposed method were almost in complete agreement with the actual values. This means that our method was able to accurately characterize the geomechanical properties of the rock formation and the pattern underlying the monitored data. It provided a feasible and promising approach to identify the geomechanical properties and characterize the pattern of pressure. Figure 10 shows the pressure-time curve obtained during the hydraulic fracturing test based on different geomechanical properties of the rock formation. The curve predicted by our method was in excellent agreement with the actual curve. Moreover, our method obtained two Pareto-optimal solutions, where this conformed to the complexity, uncertainty, and non-uniqueness of solutions in reservoir engineering. Multi-objective inverse analysis thus provided an excellent, scientific, and promising tool for the oil and gas industry to determine the geomechanical properties of rock formations.
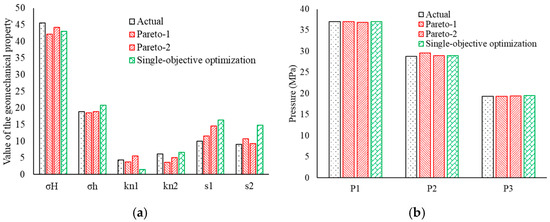
Figure 9.
The obtained geomechanical properties and corresponding pressures. (a) Geomechanical properties; (b) corresponding pressures.
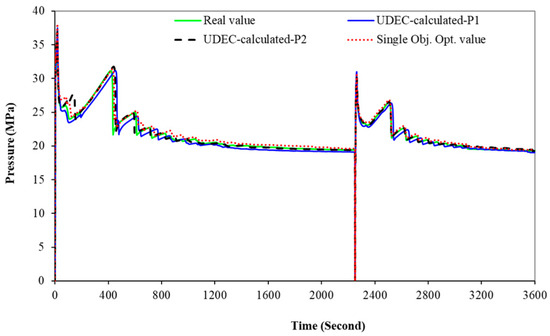
Figure 10.
Comparison of the curves of fracture based on different geomechanical properties.
In this study, the process of convergence of the proposed method was to further verify its performance. Figure 11 shows variations in the geomechanical properties of the rock formation determined by it with the number of iterations. It is evident that the population was randomly distributed in the search space in the initial generation, and converged to the Pareto-optimal solution to the problem in the 100th iteration. This showed that our method exhibited excellent convergence. The objective function and the corresponding pressure had a similar pattern to the geomechanical properties (Figure 12). This proved that the proposed method of inverse analysis accurately characterized the geomechanical properties of reservoir formations.
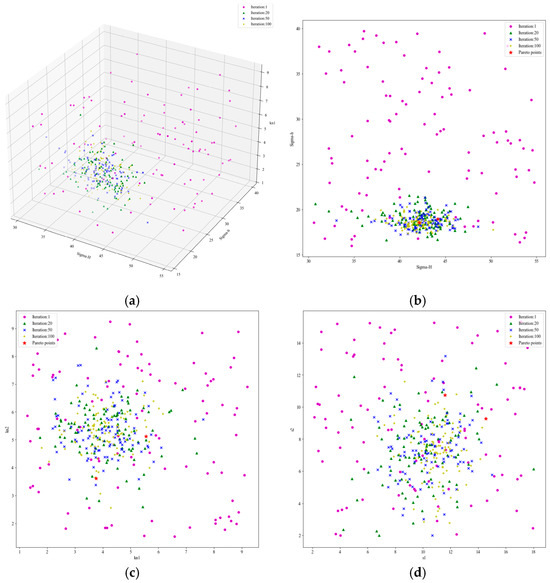
Figure 11.
Variations in geomechanical properties with the number of iterations. (a) ,
and
; (b)
and
; (c)
and ; (d)
and .
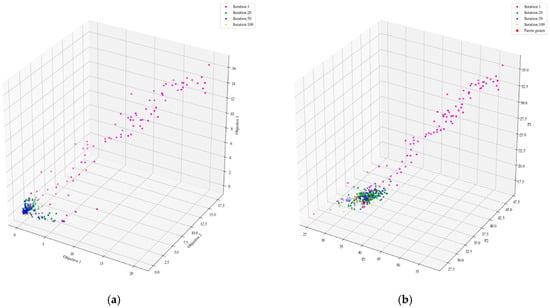
Figure 12.
Variations in the objective function and the corresponding pressure with the number of iterations. (a) ,
and ; (b)
,
and
.
4. Discussion
4.1. Correlation Analysis
To study the relation between the geomechanical properties of the rock formation and pressure, Figure 13 shows the correlation between them. The minimum horizontal in situ stress had the most significant influence on the pressure. Figure 14 shows the importance of features of the geomechanical properties with respect to the corresponding pressure based on the XGBoost model. It is clear from it that XGBoost was able to adequately characterize the complex relationship between the pressure and the corresponding geomechanical properties. It thus provided an excellent surrogate model to approximate the physical model for enhancing the efficiency and accuracy of inverse analysis.
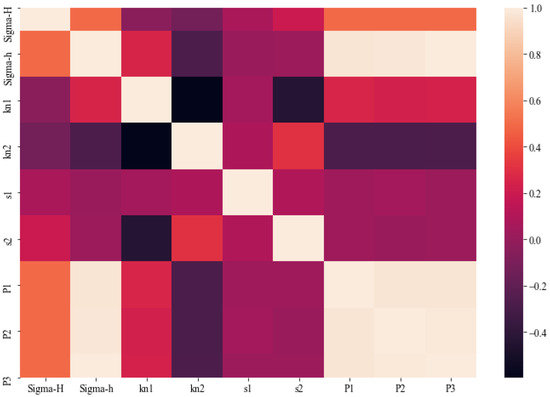
Figure 13.
The correlation between geomechanical properties and pressure.

Figure 14.
The importance of features of geomechanical properties. (a) ; (b)
; (c) .
4.2. Relationship Analysis Between Geomechanical Properties and Pressures
The physical model is an essential component of inverse analysis, we used an XGBoost-based surrogate model to approximate the physical model here. Figure 15 shows the complex non-linear relationship between the in situ stress and the corresponding pressure based on the XGBoost model. XGBoost was able to accurately characterize the complex nonlinear functional mapping between the geomechanical properties and the corresponding pressure.
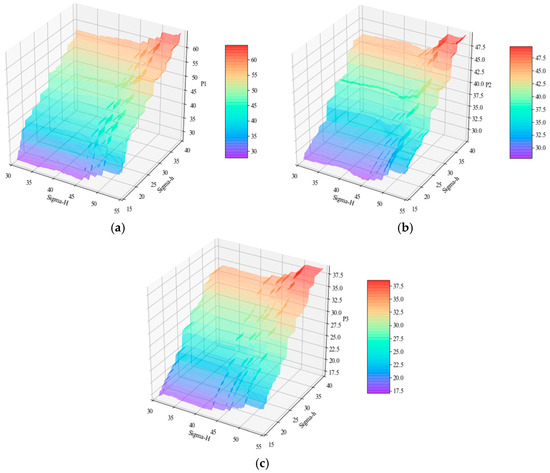
Figure 15.
Relationship between the horizontal in situ stress and the corresponding pressure. (a) , and ; (b) , and ; (c) , and .
4.3. Performance of Proposed Method
To verify the performance of our method, we determined the variations in the geomechanical properties of the rock formation and the corresponding pressure with the number of iterations of the simulation. Figure 16 shows the results. In the initial iterations, the population of particles representing the geomechanical properties was randomly distributed in the search space. Over time, it converged to certain points (Pareto-optimal solution). The distribution of the geomechanical properties was not uniform in the search space, but almost followed the normal distribution. The corresponding pressure exhibited a similar pattern (Figure 17). In contrast to single-objective optimization, where the result converged to one point, the proposed method converged over a certain zone with some uncertainty. This shows that our method was consistent with engineering practice, and considered the complexity and uncertainty of reservoir engineering.
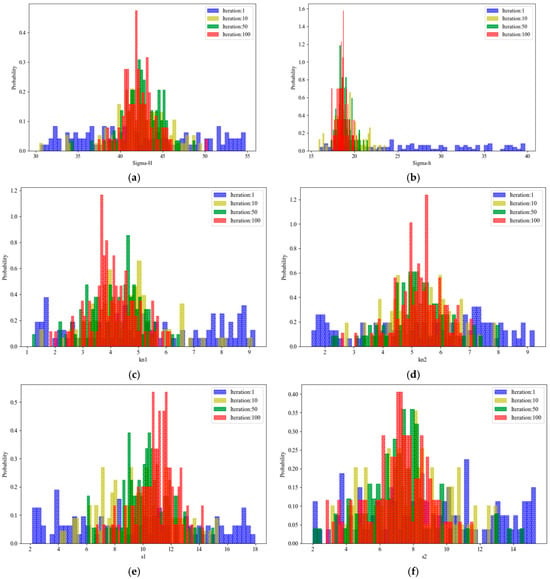
Figure 16.
Variations in geomechanical properties with the number of iterations. (a) ; (b) ; (c) ; (d) ; (e) ; (f) .
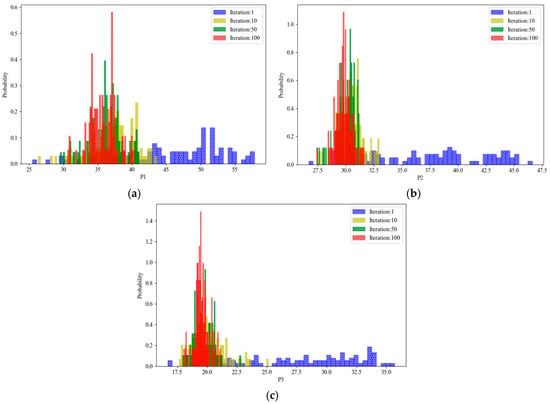
Figure 17.
Variations in pressure with the number of iterations. (a) ; (b) ; (c) .
5. Conclusions
This study proposed a multi-objective optimization-based technique of inverse analysis to characterize the geomechanical properties of rock formations based on XGBoost, MOPSO, and a numerical model. We successfully applied it to a numerical example to determine the geomechanical properties of a reservoir formation to illustrate its performance. The proposed framework used XGBoost to capture the complex relationship between the geomechanical properties of the rock formation and the corresponding pressure, and used the numerical model to enhance the efficiency of inverse analysis. MOPSO was used as the optimization technique when searching for geomechanical properties, and we compared the geomechanical properties obtained by our Pareto-optimal solution with the results of monitoring and the traditional technique of optimization to verify its feasibility. The following conclusions were drawn:
- (1)
- Determining the geomechanical properties of reservoir formations is critical to the petroleum engineering and is a challenging task due to the complexity of rock and geological conditions. This study applied multi-objective optimization and inverse analysis to determining geomechanical properties from hydraulic fracturing. The developed method characterized well the geomechanical properties and provide a promising way to determine the geomechanical properties of reservoir formations.
- (2)
- XGBoost was used to capture the complex relationship between the geomechanical properties of the reservoir formation and the corresponding pressure during hydraulic fracturing. The properties obtained by our method were in excellent agreement with the monitored values during hydraulic fracturing. XGBoost improved the efficiency of our framework, and was used to approximate the physical model during inverse analysis. It provided a reasonable surrogate model for inverse analysis.
- (3)
- Inverse analysis was essential for determining the geomechanical properties of reservoir formations. However, it was a problem of multi-objective optimization, with conflicting objectives at different monitoring points. Traditional single-objective optimization for inverse analysis deals with multiple objectives by transforming them into a single objective function and ignoring the conflict between them. We used MOPSO for optimization, and to determine the Pareto-optimal solution of the geomechanical properties. This better agreed with engineering practice.
- (4)
- Accurately capturing the geomechanical properties and the corresponding pressure during inverse analysis was challenging. Our XGBoost-based surrogate model was a promising tool for determining the Pareto-optimal solution.
- (5)
- It was difficult to determine the maximum horizontal in situ stress when the coefficient of pore elasticity was considered in the traditional formula for breakdown-induced fracture. Our framework for inverse analysis characterized the maximum horizontal in situ stress according to the borehole pressure without needing to determine the poroelastic coefficient. This was important for calculating the geomechanical properties of hydraulic fracturing in practice. The proposed framework thus was practical and accurate, and could be easily used to determine the geomechanical properties of reservoir formations based on hydraulic fracturing.
Author Contributions
Conceptualization, S.Z. and Z.R.; methodology, S.Z.; software, H.Z.; validation, L.Z., B.L. and X.W.; formal analysis, Z.R.; investigation, H.Z. and S.Z.; resources, S.Z.; data curation, L.Z.; writing—original draft preparation, H.Z.; writing—review and editing, S.Z.; visualization, X.W.; supervision, Z.R.; project administration, S.Z.; funding acquisition, H.Z. All authors have read and agreed to the published version of the manuscript.
Funding
This research was funded by the National Natural Science Foundation of China (42377174), the Natural Science Foundation of Shandong Province (ZR2022ME198), the Henan Province Science and Technology Research Project (242102320370, 232102320192), the Key Scientific Research Project of Higher Education Institutions in Henan Province (24B560002), and the Henan Province Research and Practice Key Project on Teaching Reform in Higher Education (2024SJGLX0157).
Data Availability Statement
The data presented in this study are available on request from the corresponding authors.
Conflicts of Interest
The authors declare no conflicts of interest.
Abbreviations
The following abbreviations are used in this manuscript:
| XGBoost | extreme gradient boosting |
| MOPSO | multi-objective particle swarm optimization |
| GBDT | gradient boosting decision tree |
| XLOTs | extended leak-off tests |
References
- Zhang, S.; Yin, S. Determination of in Situ Stresses and Elastic Parameters from Hydraulic Fracturing Tests by Geomechanics Modeling and Soft Computing. J. Pet. Sci. Eng. 2014, 124, 484–492. [Google Scholar] [CrossRef]
- White, A.J.; Traugott, M.O.; Swarbrick, R.E. The Use of Leak-off Tests as Means of Predicting Minimum in situ Stress. Pet. Geosci. 2002, 8, 189–193. [Google Scholar] [CrossRef]
- Gangrade, R. Quantifying Spatial Geotechnical Uncertainty to Advance the Practice of Risk Assessment and Decision-Making for Tunnel Projects. Ph.D. Thesis, Colorado School of Mine, Golden, CO, USA, 2021. [Google Scholar]
- Fang, Z.; Khaksar, A. Complexity of Minifrac Tests and Implications for In situ Horizontal Stresses in Coalbed Methane Reservoirs. In Proceedings of the International Petroleum Technology Conference, Bangkok, Thailand, 15–17 November 2011; pp. 1–13. [Google Scholar] [CrossRef]
- Haimson, B.C.; Charles, F. Initiation and Extension of Hydraulic Fractures in Rocks. SPE J. 1967, 7, 310–318. [Google Scholar] [CrossRef]
- Haimson, B.C. The Hydrofracturing Stress Measuring Method and Recent Field Results. Int. J. Rock Mech. Min. Sci. Geomech. Abstr. 1978, 15, 140. [Google Scholar] [CrossRef]
- Puller, J.W.; Mills, K.W.; Jeffrey, R.G.; Walker, R.J. In situ Stress Measurements and Stress Change Monitoring to Monitor Overburden Caving Behaviour and Hydraulic Fracture Pre-Conditioning. Int. J. Min. Sci. Technol. 2016, 26, 103–110. [Google Scholar] [CrossRef]
- Xu, H.; Sang, S.; Yang, J.; Jin, J.; Hu, Y.; Liu, H.; Ren, P.; Gao, W. In situ Stress Measurements by Hydraulic Fracturing and Its Implication on Coalbed Methane Development in Western Guizhou, SW China. J. Unconv. Oil Gas Resour. 2016, 15, 1–10. [Google Scholar] [CrossRef]
- Zhao, H.; Ru, Z.; Zhu, C. Determination of the Geomechanical Parameters and Associated Uncertainties in Hydraulic Fracturing by Hybrid Probabilistic Inverse Analysis. Int. J. Geomech. 2017, 17, 04017115. [Google Scholar] [CrossRef]
- Zhao, H.; Li, S.; Zang, X.; Liu, X.; Zhang, L.; Ren, J. Uncertainty Quantification of Inverse Analysis for Geomaterials Using Probabilistic Programming. J. Rock Mech. Geotech. Eng. 2024, 16, 895–908. [Google Scholar] [CrossRef]
- Wang, X.; Pan, J.; Wang, K.; Mou, P.; Li, J. Fracture variation in high-rank coal induced by hydraulic fracturing using X-ray computer tomography and digital volume correlation. Int. J. Coal Geol. 2022, 252, 103945. [Google Scholar] [CrossRef]
- Wang, Z.; Fu, X.; Pan, J.; Deng, Z. Effect of N2/CO2 injection and alternate injection on volume swelling/shrinkage strain of coal. Energy 2023, 275, 127377. [Google Scholar] [CrossRef]
- Kabwe, E.; Banda, W.; Bowa, V.M.; Kabwe, E. Back Analysis of the Strainburst Associated Rock Fragment Ejection in an Underground Crosscut. Tunn. Undergr. Space Technol. 2023, 140, 105286. [Google Scholar] [CrossRef]
- Walton, G.; Sinha, S. Challenges Associated with Numerical Back Analysis in Rock Mechanics. J. Rock Mech. Geotech. Eng. 2022, 14, 2058–2071. [Google Scholar] [CrossRef]
- Bertuzzi, R. Back-Analysing Rock Mass Modulus from Monitoring Data of Two Tunnels in Sydney, Australia. J. Rock Mech. Geotech. Eng. 2017, 9, 877–891. [Google Scholar] [CrossRef]
- Yazdani, M.; Sharifzadeh, M.; Kamrani, K.; Ghorbani, M. Displacement-Based Numerical Back Analysis for Estimation of Rock Mass Parameters in Siah Bisheh Powerhouse Cavern Using Continuum and Discontinuum Approach. Tunn. Undergr. Space Technol. 2012, 28, 41–48. [Google Scholar] [CrossRef]
- Oreste, P. Back-Analysis Techniques for the Improvement of the Understanding of Rock in Underground Constructions. Tunn. Undergr. Space Technol. 2005, 20, 7–21. [Google Scholar] [CrossRef]
- Gioda, G.; Jurina, L. Numerical Identification of Soil-structure Interaction Pressures. Int. J. Numer. Anal. Methods Geomech. 1981, 5, 33–56. [Google Scholar] [CrossRef]
- Sakurai, S.; Takeuchi, K. Back Analysis of Measured Displacements of Tunnels. Rock Mech. Rock Eng. 1983, 16, 173–180. [Google Scholar] [CrossRef]
- Pichler, B.; Lackner, R.; Mang, H.A. Back Analysis of Model Parameters in Geotechnical Engineering by Means of Soft Computing. Int. J. Numer. Methods Eng. 2003, 57, 1943–1978. [Google Scholar] [CrossRef]
- Xia, W.; Liu, B.; Xiang, H. Prediction of Liquid Accumulation Height in Gas Well Tubing Using Integration of Crayfish Optimization Algorithm and XGBoost. Processes 2024, 12, 1788. [Google Scholar] [CrossRef]
- Zhao, B.; Liao, W. Lithology Identification of Buried Hill Reservoir Based on XGBoost with Optimized Interpretation. Processes 2025, 13, 682. [Google Scholar] [CrossRef]
- Yang, L.; Huang, W.; Guo, C.; Zhang, D.; Xiang, C.; Yang, L.; Wang, Q. Energy Power System Considering Flexibility Constraints. Processes 2022, 10, 1401. [Google Scholar] [CrossRef]
- Alzahrani, A.; Hafeez, G.; Ali, S.; Murawwat, S.; Khan, M.I.; Rehman, K.; Abed, A.M. Multi-Objective Energy Optimization with Load and Distributed Energy Source Scheduling in the Smart Power Grid. Sustainability 2023, 15, 9970. [Google Scholar] [CrossRef]
- Schmitt, D.R.; Zoback, Z.M. Poroelastic Effects in the Determination of the Maximum Horizontal Principal Stress in Hydraulic Fracturing Tests—A Proposed Breakdown Equation Employing a Modified Effective Stress Relation for Tensile Failure. Int. J. Rock Mech. Min. Sci. Geomech. Abstr. 1989, 26, 499–506. [Google Scholar] [CrossRef]
- Medlin, W.L.; Masse, L. Laboratory Investigation of Fracture Initiation Pressure and Orientation. Soc. Pet. Eng. J. 1979, 19, 129–144. [Google Scholar] [CrossRef]
- Rice, J.R.; Cleary, M.P. Some Basic Stress Diffusion Solutions for Fluid-Saturated Elastic Porous Media with Compressible Constituents. Rev. Geophys. 1976, 14, 227–241. [Google Scholar] [CrossRef]
- Detournay, E.; Cheng, A.H.-D. Poroelastodynamic Response of a Borehole in a Non-Hydrostatic Stress Field. Int. J. Rock Mech. Min. Sci. 1988, 2, 171–182. [Google Scholar] [CrossRef]
- Ocak, I.; Seker, S.E. Estimation of Elastic Modulus of Intact Rocks by Artificial Neural Network. Rock Mech. Rock Eng. 2012, 45, 1047–1054. [Google Scholar] [CrossRef]
- Dong, H.; Yang, G.; Guo, K.; Xu, J.; Liu, D.; Han, J.; Shi, D.; Pan, J. Predicting Water Flowing Fracture Zone Height Using GRA and Optimized Neural Networks. Processes 2024, 12, 2513. [Google Scholar] [CrossRef]
- Nujoom, R.; Mohammed, A.; Wang, Q. A Sustainable Manufacturing System Design: A Fuzzy Multi-Objective Optimization Model. Environ. Sci. Pollut. Res. 2018, 25, 24535–24547. [Google Scholar] [CrossRef]
- Chen, T.; Guestrin, C. XGBoost: A Scalable Tree Boosting System. In Proceedings of the KDD ’16: Proceedings of the 22nd ACM SIGKDD International Conference on Knowledge Discovery and Data Mining, New York, NY, USA, 13–17 August 2016; pp. 785–794. [Google Scholar] [CrossRef]
- Coello, C.A.C.; Pulido, G.T.; Lechuga, M.S. Handling Multiple Objectives with Particle Swarm Optimization. IEEE Trans. Evol. Comput. 2004, 8, 256–279. [Google Scholar] [CrossRef]
- Zeinalzadeh, A.; Mohammadi, Y.; Moradi, M.H. Optimal Multi Objective Placement and Sizing of Multiple DGs and Shunt Capacitor Banks Simultaneously Considering Load Uncertainty via MOPSO Approach. Int. J. Electr. Power Energy Syst. 2015, 67, 336–349. [Google Scholar] [CrossRef]
- Mofid, H.; Jazayeri-Rad, H.; Shahbazian, M.; Fetanat, A. Enhancing the Performance of a Parallel Nitrogen Expansion Liquefaction Process (NELP) Using the Multi-Objective Particle Swarm Optimization (MOPSO) Algorithm. Energy 2019, 172, 286–303. [Google Scholar] [CrossRef]
- Pareek, C.M.; Tewari, V.K.; Machavaram, R. Multi-Objective Optimization of Seeding Performance of a Pneumatic Precision Seed Metering Device Using Integrated ANN-MOPSO Approach. Eng. Appl. Artif. Intell. 2023, 117, 105559. [Google Scholar] [CrossRef]
- Bouchaala, A.; Merroun, O.; Sakim, A. A MOPSO Algorithm Based on Pareto Dominance Concept for Comprehensive Analysis of a Conventional Adsorption Desiccant Cooling System. J. Build. Eng. 2022, 60, 105189. [Google Scholar] [CrossRef]
- Sun, X.; Han, X.; Liu, C.; Zhang, Z.; Chen, X. MOPSO-Based Structure Optimization on RPV Sealing Performance with Machine Learning Method. Int. J. Press. Vessel. Pip. 2023, 206, 105059. [Google Scholar] [CrossRef]
- Jiang, X.W.; Wan, L.; Wang, X.S.; Liang, S.H.; Hu, B.X. Estimation of Fracture Normal Stiffness Using a Transmissivity-Depth Correlation. Int. J. Rock Mech. Min. Sci. 2009, 46, 51–58. [Google Scholar] [CrossRef]
- Zhang, X.; Last, N.; Powrie, W.; Harkness, R. Numerical Modelling of Wellbore Behaviour in Fractured Rock Masses. J. Pet. Sci. Eng. 1999, 23, 95–115. [Google Scholar] [CrossRef]
- Witherspoon, P.; Wang, J.; Iwai, K.; Gale, J. Validity of Cubic Law for Fluid Flow in a Deformable Rock Fracture. Water Resour. Res. 1980, 16, 1016–1024. [Google Scholar] [CrossRef]
- Li, L.; Li, Z.; Han, H.; Liu, C.; Li, Y.; Zhao, W.; Wang, J.; Bao, Z. Multifractal Analysis of Tight Sandstone Using Micro-CT Methods: A Case from the Lower Cretaceous Quantou Formation, Southern Songliao Basin, NE China. Fractal Fract. 2025, 9, 336. [Google Scholar] [CrossRef]
- Wang, F.; Yang, K.; Zai, Y. Multifractal characteristics of shale and tight sandstone pore structures with nitrogen adsorption and nuclear magnetic resonance. Pet. Sci. 2020, 17, 1209–1220. [Google Scholar] [CrossRef]
- Zhang, S.; Yin, S.; Wang, F.; Zhao, H. Characterication of In Situ Stress State and Joint Poperties from Extended Leak-Off Tests in Fractured Reservoirs. Int. J. Geomech. 2017, 17, 04016074. [Google Scholar] [CrossRef]
Disclaimer/Publisher’s Note: The statements, opinions and data contained in all publications are solely those of the individual author(s) and contributor(s) and not of MDPI and/or the editor(s). MDPI and/or the editor(s) disclaim responsibility for any injury to people or property resulting from any ideas, methods, instructions or products referred to in the content. |
© 2025 by the authors. Licensee MDPI, Basel, Switzerland. This article is an open access article distributed under the terms and conditions of the Creative Commons Attribution (CC BY) license (https://creativecommons.org/licenses/by/4.0/).