Abstract
Free radicals in G-361 human melanoma malignum control cells and the cells cultured with simvastatin were examined by EPR spectroscopy. The proliferation of the cells was determined. The aim of this work was to examine the influence of simvastatin used at different concentrations in the G-361 cell culture on its free radicals. The concentrations of simvastatin—0.1 μM, 1 μM, 3 μM, and 5 μM—were tested. EPR spectra of free radicals were measured by an X-band (9.3 GHz) spectrometer. Amplitudes, integral intensities, linewidths, and g factors were determined. Melanin biopolymers are the main source of o-semiquinone free radicals in G-361 human melanoma malignum cells, for which the EPR lines show characteristic g values of 2.0046–2.0059, but also, free radicals occurring in other cellular structures may contribute to these signals. The amount of free radicals decreases after interactions of simvastatin with the G-361 cells, and this effect depends on the concentration of simvastatin. The highest amounts of free radicals exist in G-361 cells cultured with simvastatin at concentrations of 3 μM and 5 μM. The relatively lower amounts of free radicals occur in G-361 cells cultured with simvastatin at concentrations of 0.1 μM and 1 μM. The fast spin–lattice relaxation processes exist in the control G-361 cells and in the cells cultured with simvastatin, regardless of simvastatin concentration.
1. Introduction
Melanin biopolymers are known as paramagnetic polymers containing o-semiquinone free radicals [1,2,3,4,5,6,7,8,9,10]. Free radicals of melanin are of particular importance in cancer cells where they occur [11,12,13,14,15,16]. Free radicals, as very active molecules with unpaired electrons, can influence the course of cancer processes in cells [11,12,13,14,15,16]. During cancer cell division, reactive oxygen species are produced, which are responsible for the formation of further free radicals and oxidative stress. Free radicals can damage DNA, proteins, and enzymes. Free radicals initiate the process of lipid peroxidation. On the other hand, large numbers of free radicals can inhibit the growth of cancer cells [11]. The earlier spectroscopic studies using the electron paramagnetic resonance (EPR) phenomenon have shown that under the influence of therapeutic substances, changes occur in the free radical system of cancer cells [17,18,19]. The EPR method showed radical changes in the case of A-375 human melanoma malignum cells [17] and A-2058 cells [18], after treating them with simvastatin. Simvastatin (Figure 1), a statin drug, functions predominantly as an inhibitor of hydroxymethylglutaryl-coenzyme A (HMG-CoA) reductase, resulting in a reduction in cholesterol levels. However, in addition to this primary effect, studies of the structure–activity relationship (SAR) of simvastatin indicate its key role in anticancer activity. The lactone ring of simvastatin (in its active form, it is hydrolyzed to β-hydroxy carboxylic acid) determines the binding of statins to the active site of the enzyme, leading to the inhibition of its activity. This process not only reduces cholesterol levels but also inhibits the mevalonate pathway, thereby decreasing the production of other molecules, including farnesyl and geranylgeranyl pyrophosphate. This affects the functions of proteins (Ras, Rho, Myc) that are involved in the regulation of growth and proliferation of cells, including cancer cells. The lactone ring in simvastatin has been shown to exert its effects on other signaling pathways associated with the functioning of the cytoskeleton and Rho GTPase proteins. This, in turn, limits the ability of cancer cells to migrate and metastasize. Simvastatin’s lipophilicity affects its penetration into cancer cells. In contrast to hydrophilic statins, their transport does not require the presence of transporters. Furthermore, simvastatin has been shown to induce oxidative stress in cancer cells, which in turn activates caspase 3- and 9-dependent apoptosis pathways. Statins can impede angiogenesis by increasing the inhibitory effect of TNF-α on tumor growth [20,21,22]. Studies on the possibility of using simvastatin in cancer cases are required. Simvastatin may support processes leading to the inhibition of the development of cancer cells.
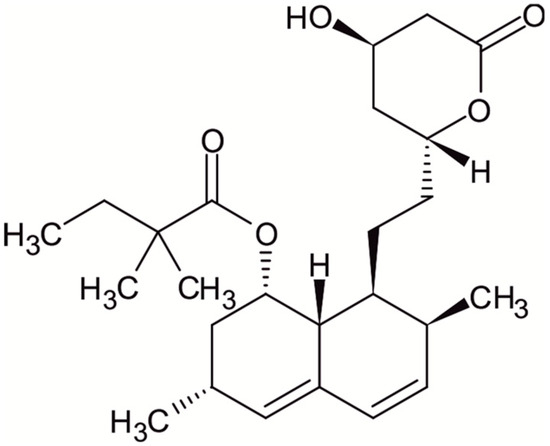
Figure 1.
Chemical structure of simvastatin.
The observed effect of simvastatin on free radicals in A-375 [17] and A-2058 [18] cancer cells led us to become interested in free radical changes in the other cancer cells. The aim of this work was to examine the influence of simvastatin used at different concentrations in the G-361 cell culture on its free radicals. Quantitative and qualitative studies of free radicals were carried out, as well as comparative tests of free radical changes with changes in G-361 cell proliferation. The measurements and analyses performed were aimed at finding the concentration of simvastatin at which the strong destruction of cancer cells occurs and how this effect is correlated with free radicals in cells. Free radicals, on the one hand, can initiate cancer processes, but on the other hand, free radicals can destroy cancer cells. Therefore, the answer to the question of whether simvastatin affects the generation of free radicals in G-361 melanoma malignum cells was considered important for cancer therapy.
2. Materials and Methods
2.1. In Vitro Studies of the Cytotoxicity Effect of Simvastatin
2.1.1. Cell Culture
In vitro studies were performed on the human malignant melanoma cell (G-361) purchased from the American Type Culture Collection (ATCC®). G-361 cells (ATCC No. CRL-1424™) were cultured in McCoy’s 5A medium containing L-glutamine and sodium bicarbonate, supplemented with 10% fetal bovine serum (PAA Laboratories GmbH), 20 mM HEPES, 100 U/mL of penicillin, and 100 μg/mL of streptomycin (Sigma-Aldrich, Taufkirchen, Germany). The culture was carried out at 37 °C in a humidified atmosphere with 5% CO2.
2.1.2. Sulforhodamine B Assay
The in vitro cytotoxic effect of simvastatin (SIM; Sigma-Aldrich, Taufkirchen, Germany) was determined by means of an SRB assay (In Vitro Toxicology Assay Kit, Sulforhodamine B-based; Sigma-Aldrich, Taufkirchen, Germany).
Simvastatin was dissolved in dimethyl sulfoxide (DMSO; Sigma Aldrich) as a 10 mM stock solution. The stock solution was diluted with culture medium to obtain working solutions. The final DMSO concentration in culture medium was adjusted to 0.2%. G-361 cells were seeded in 96-well plates at an initial density of 2 × 10³ cells per well in 200 µL of culture medium. After 24 h of incubation, the SIM at concentrations of 0.1 μM, 0.3 μM, 1 μM, 3 μM, 10 μM, and 20 μM was added to the wells. Control cultures were treated with medium alone (0.2% DMSO). Cells with the tested compound were incubated for 72 h. Next, the culture medium was removed, and the cells were fixed in 10% trichloroacetic acid (TCA; 100 µL/well) for 1 h at a temperature of 4 °C. The TCA solution was then removed, and the plates were washed with deionized water (three times) and dried. The cells were then stained with 0.4% sulforhodamine B (50 µL/well) for 30 min. The excess of dye was washed out three times with 300 μL/well of 1% acetic acid solution. In total, 200 μL of 10 mM Tris base solution was used to dissolve the protein-bound dye. The absorbance was measured at 570 nm and 690 nm (reference wavelength) using the MRX Revelation plate reader (Dynex Technologies, Chantilly, VA, USA).
2.2. Measuring Equipment and Software
In the study of free radicals in G-361 human melanoma malignum cells, an electron paramagnetic resonance spectrometer from Radiopan (Poznań, Poland) was used. An appropriate procedure was followed to prepare cells for EPR spectra measurements. Melanoma G-361 cells (3 million/dish) were incubated in culture medium with selected concentrations of simvastatin for 72 h on 15 mL dishes. Next, the medium was removed, and the cells were washed with sterile PBS. Then 1 mL of PBS was added, and the cells were scraped off in an ice bath. The cell suspension in PBS was placed into a thin-walled glass capillary with an outer diameter of 1 mm and then centrifuged (250× g, 1 min, 4 °C) to separate cells from liquid. The height of the layer of cells formed at the bottom of the capillary was measured. The cells in the capillary were placed inside the resonator and their EPR spectrum was measured. The spectrometer operated in the X-band (9.3 GHz) range with magnetic modulation of 100 kHz. The cells were placed in thin-walled glass measuring tubes with an outer diameter of 1 mm. During the EPR spectra measurements, additional work was carried out with a rapid numerical data acquisition system using a Rapid Scan Unit from Jagmar (Kraków, Poland).
The magnetic induction B of the field was measured by the nuclear magnetic resonance NMR recorder from EPRAD (Poznań, Poland). The microwave frequency was obtained with an MCM 101 recorder from EPRAD (Poznań, Poland).
The total microwave power generated by the klystron in the microwave bridge was 70 mW. The microwave power was changed, in the range from 2.2 mW to 70 mW, using an attenuator. Smaller attenuations correspond to higher microwave power values according to the following formula [23,24]:
where Mo—the total microwave power produced by klystron (70 mW), and M—the microwave power used during the measurement of the EPR spectrum.
attenuation [dB] = 10 lg[Mo/M]
In quantitative studies of free radicals, low microwave power (2.2 mW) was used to avoid the effect of microwave saturation of the EPR line.
The spectroscopic computer programs from Jagmar (Kraków, Poland), LabVIEW 8.5 from National Instruments (Austin, TX, USA), Origin (OriginLab, Northampton, MA, USA), and Microsoft Excel (Redmond, WA, USA) were useful during the research.
2.3. Analysis of the EPR Spectra of Cells
The amplitude (A), integral intensity (I), linewidth (ΔBpp), resonance magnetic induction (Br), and g factor of the EPR spectra of the tested cells were analyzed. Amplitude (A), linewidth (ΔBpp), and the resonance magnetic induction (Br) are marked on the example EPR spectrum in the form of the first derivative of absorption shown in Figure 2. The integral intensity (I) of the EPR lines was determined approximately as [23,24,25]
where A—the amplitude and ΔBpp—the linewidth of the EPR lines. The amplitude (A) and integral intensities (I) of the EPR lines increase with increasing free radical concentrations in the preparations [18,19,20,21,22,23]. Magnetic interactions affect the linewidth (ΔBpp) of the EPR line [25,26,27]. The spectroscopic splitting factor g was determined as [24,25,26,27]
where h—Planck constant, ν—microwave frequency, μB—Bohr magneton, and Br—resonance magnetic induction.
I = A(ΔBpp)2
g = hν/µBBr
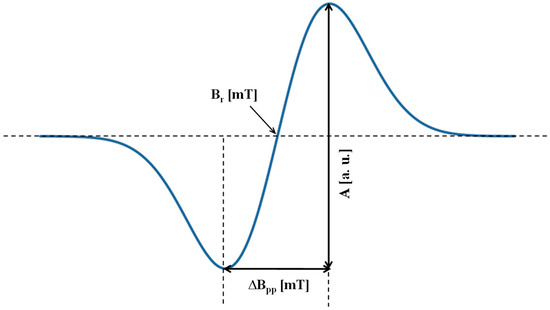
Figure 2.
The spectral parameters: amplitude (A) and linewidth (ΔBpp) of EPR line, and resonance magnetic induction (Br), marked on the example first-derivative EPR spectrum.
The measurement errors were determined by the total differential method. The maximum errors of the measured parameters were determined. Changes in parameters smaller than the maximum error value were not taken into account in the discussion.
3. Results and Discussion
3.1. Cytotoxicity Effect of Simvastatin
In order to estimate the cytotoxic activity of simvastatin, various concentrations of the compound from 0.1 to 20 μM were added to the medium, and cells were cultured for 72 h (Figure 3). The presence of 0.1 μM, 0.3 μM, and 1 μM of simvastatin did not cause significant differences in cell growth compared to the culture without SIM (p > 0.05). The G361 cell growth decreased after treatment with simvastatin at concentrations of 3 μM and 5 μM. Nevertheless, the cytotoxic effect of 3 μM and 5 μM of simvastatin was comparable. The significant inhibition of cell growth was observed for cultures treated with drug concentrations of 10 μM and 20 μM. The IC50 value, after 72 h of G-361 cell treatment with simvastatin, was 6.72 μM. Similar results were obtained for melanoma A-2058 cells treated with simvastatin [18]. However, simvastatin caused a stronger decrease in cell proliferation in the case of A-375 cells [17].
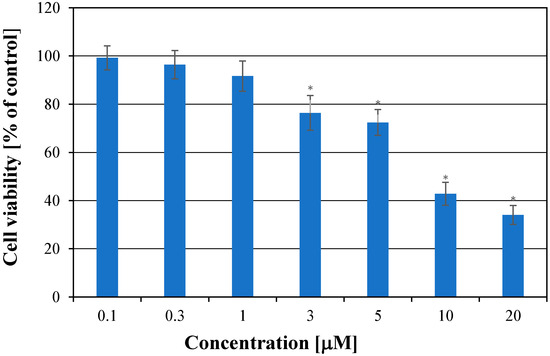
Figure 3.
Cytotoxic effect of simvastatin on melanoma cells after 72 h of treatment. Each bar represents the mean + SD; * p < 0.05 relative to the control.
The morphology of the G-361 melanoma cells for the control cells and for the cells cultured with simvastatin at different concentrations is shown in Figure 4A–D. After 72 h of incubation, no changes in morphology were observed in the cells treated with 1 μM of simvastatin (Figure 4B) compared to the control cells (Figure 4A), indicating their good viability. The strong damage of the cells was visible in the culture with simvastatin added at a concentration of 20 μM (Figure 4D).
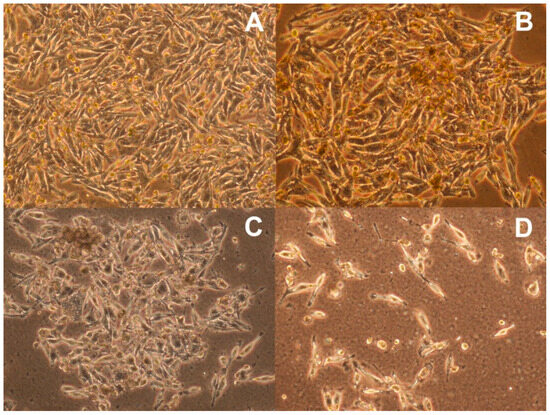
Figure 4.
Morphology of G-631 human melanoma malignum: (A) control cells and the cells cultured with simvastatin at concentrations of (B) 1 μM, (C) 5 μM, and (D) 20 μM (magnification ×100).
3.2. Effect of Simvastatin on Free Radicals in G-361 Melanoma malignum Cells
The EPR spectra measurements carried out showed the occurrence of free radicals in the control G-361 human melanoma malignum cells as well as in the G-361 cells treated with simvastatin. The EPR spectra of the examined G-361 melanoma malignum cells are summarized in Figure 5A–D. The presentation of the EPR spectra (Figure 5A–E) has an illustrative character. Quantitative results with respect to sample amounts are presented in Table 1. Free radicals of the control cells and cells cultured with simvastatin absorb microwaves in a magnetic field, which results in the appearance of EPR signals. The EPR spectra differ in the parameters. The parameters of the EPR spectra of the control G-361 melanoma malignum cells and the cells cultured with simvastatin at different concentrations—0.1 μM, 1 μM, 3 μM, and 5 μM—are compared in Table 1. Table 1 compares the following parameters, integral intensity (I), g factor, and linewidths (ΔBpp), for the microwave unsaturated EPR lines recorded with the low power of 7 mW.
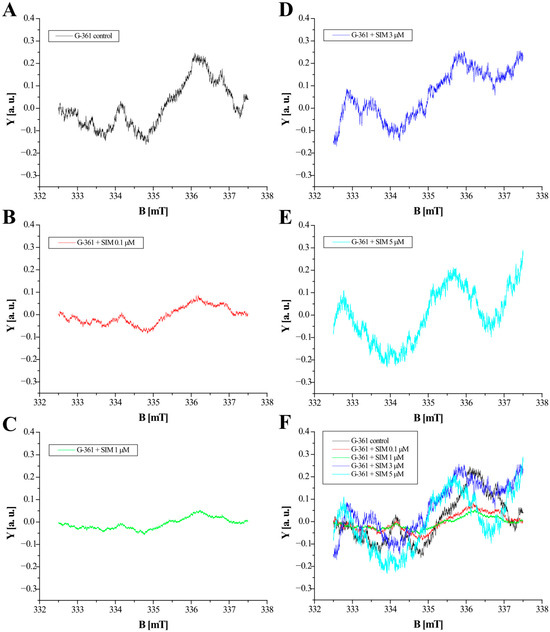
Figure 5.
EPR spectra of G-361 melanoma malignum cells: (A) Control cells and the cells cultured with simvastatin (SIM) at concentrations of (B) 0.1 μM, (C) 1 μM, (D) 3 μM, and (E) 5 μM. The comparison of the EPR spectra of all the tested samples (F). The spectra shown in this figure were measured with a microwave power of 62 mW. B means magnetic induction of the field generated by an electromagnet. Y are the spectral values at a given magnetic induction B.

Table 1.
The parameters of the EPR spectra of the control G-361 melanoma malignum cells and the cells cultured with simvastatin (SIM) at different concentrations: 0.1 μM, 1 μM, 3 μM, and 5 μM. I—integral intensity of EPR line; g—the spectroscopic splitting factor; ΔBpp—linewidth of EPR line. The data provided concern EPR spectra recorded with a microwave power of 7 mW.
The value of the g factor of 2.0059 (Table 1) of the EPR spectrum of the control G-361 cells is that of o-semiquinone free radicals [1,2,3,4,5,6]. The unpaired electron in these free radicals is located on the oxygen atoms. The EPR signal of the control G-361 cells is probably mainly due to the o-semiquinone free radicals of melanin biopolymers because the EPR lines of these radicals have a similar g factor. It is to be expected that other free radicals are also present in these cells, but in much smaller amounts, which are not visible in the spectrum dominated by o-semiquinone free radicals. The g factor for the EPR line G-361 cells cultured with simvastatin in concentrations—0.1 μM, 1 μM, 3 μM, and 5 μM—takes values in the range of 2.0046–2.0059 (Table 1), which are also characteristic for o-semiquinone free radicals. It can be assumed that the recorded EPR spectra of the studied cells originate mainly from o-semiquinone free radicals of melanin, but also, free radicals occurring in other cellular structures may contribute to these signals. The reactions of simvastatin with G-361 cells therefore take place within the o-semiquinone free radicals. The earlier EPR research results, for example [28], showed that medicinal substances bind to melanin via free radicals. After the binding of drugs to melanin, the amplitudes of the EPR spectra of o-semiquinone free radicals were changed. The correlation with the melanin concentration was not examined. This is an interesting problem for future studies. The mechanism of action of simvastatin with G361 cells was not explained by the performed EPR studies. The possibility of interactions of simvastatin with the o-semiquinone free radicals in G-361 cells by its binding to melanin by free radicals, the recombination of free radicals, and other reactions should also be taken into account in further research. It was obtained in this work that the integral intensity (I) of the EPR line of the control G-361 cells is 8.4 [a. u.], whereas the integral intensities of the EPR lines of the cells cultured with simvastatin were lower in the range of 1.8–7.2 [a. u.] (Table 1). The amount of free radicals in the tested G-361 cells depends on the concentration of simvastatin (Table 1). The integral intensities (I) of the EPR lines of G-361 cells for the lower concentrations of simvastatin (0.1 μM and 1 μM) used in the cell culture are similar (2.3 and 1.8 [a. u.]). The integral intensity (I) increased with increasing of the concentration of simvastatin. For concentrations of simvastatin of 3 μM and 5 μM, the values of integral intensities (I) were 4.3 and 7.2 [a. u.], respectively. The results of the study of the amount of free radicals in G-361 cells (Table 1) correlate well with the results of the study of cell proliferation (Figure 3) and morphology (Figure 4). For higher concentrations of simvastatin at 3 μM and 5 μM, a strong decrease in proliferation (Figure 3) and damage of the cells (Figure 4) was observed, and at the same time, the integral intensity (I) increased (Table 1), which indicates the destruction of G-361 cells by the formed free radicals. From the point of view of cancer therapy, simvastatin probably destroys cells with the participation of free radicals or cell death produces free radicals. The obtained results should be considered preliminary, and this phenomenon requires further research. The flow cytometry should be used to normalize the free radical per cell count. The studies conducted so far only indicate changes in the EPR spectra of G-361 cells caused by simvastatin.
The EPR spectra of G-361 cells untreated and treated by simvastatin are the broad lines with a range of linewidth (ΔBpp) from 1.16 [mT] to 1.38 [mT] (Table 1). Probably, dipolar interactions between unpaired electrons of free radicals in these cells are the reason for such large linewidth values. The linewidths (ΔBpp) depend on microwave power. The effect of microwave power on the linewidths (ΔBpp) of the EPR spectra of the control G-361 melanoma malignum cells and the cells cultured with simvastatin at different concentrations—0.1 μM, 1 μM, 3 μM, and 5 μM—was compared in Figure 6. The linewidths (ΔBpp) of all measured EPR lines, for both control cells and cells treated with simvastatin, increase with increasing microwave power used during the measurements. The highest values of linewidths (ΔBpp), especially at higher microwave powers, were obtained for the spectra of the control G-361 cells (Figure 6).
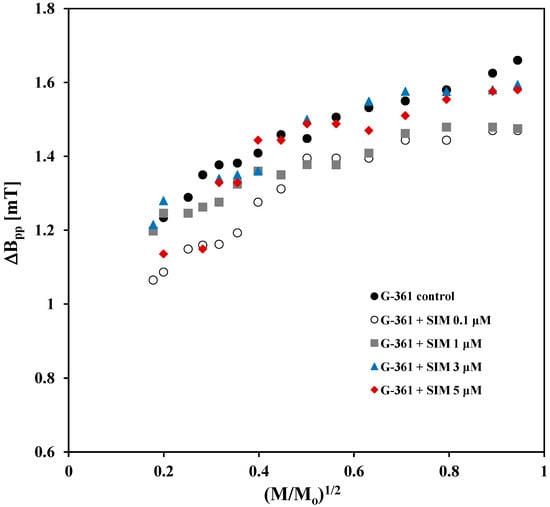
Figure 6.
Comparison of the effect of microwave power on the linewidths (ΔBpp) of the EPR spectra of the control G-361 melanoma malignum cells and the cells cultured with simvastatin (SIM) at different concentrations: 0.1 μM, 1 μM, 3 μM, and 5 μM. M and Mo—the microwave power used during the measurement of the EPR spectrum and the total microwave power produced by the klystron (70 mW), respectively.
The effect of microwave power on the amplitudes (A) of the EPR spectra of the control G-361 melanoma malignum cells and the cells cultured with simvastatin at different concentrations—0.1 μM, 1 μM, 3 μM, and 5 μM—is compared in Figure 7. The amplitudes (A) for all the tested cells increased with increasing microwave power. These changes in amplitudes (A) with increasing microwave power are characteristic of the fast spin–lattice relaxation processes with the participation of unpaired electrons in the cells. Simvastatin does not change the speed of the spin–lattice relaxation in G-361 melanoma malignum cells.
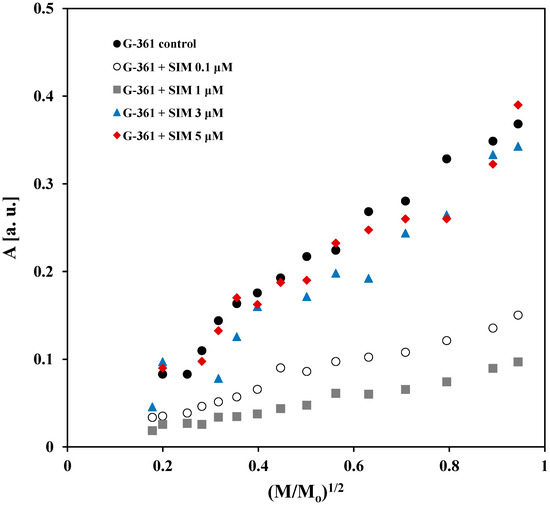
Figure 7.
Comparison of the effect of microwave power on the amplitudes (A) of the EPR spectra of the control G-361 melanoma malignum cells and the cells cultured with simvastatin (SIM) at different concentrations: 0.1 μM, 1 μM, 3 μM, and 5 μM. M and Mo—the microwave power used during the measurement of the EPR spectrum and the total microwave power produced by the klystron (70 mW), respectively.
The studies of stable free radicals in cells were performed before and after the exposure to simvastatin. The EPR signals of o-semiquinone free radicals of melanin with the characteristic g factors from 2.0046 to 2.0059 were measured for the examined cells. The changes after the interaction of simvastatin on the G-361 cells occurred in these lines, which indicates the involvement of melanin free radicals in the interaction of simvastatin on the tested cells. In this work, reactive oxygen radical species were not examined by the continuous wave EPR spectrometer because their lifetime is a fraction of a second. A very interesting investigation into the pulsed methods may be advisable in future work.
The low-frequency EPR spectrometer with microwaves of 1 GHz pointed out that the EPR signal increases with increasing melanin content in melanoma samples [29]. This effect was expected because the higher amount of melanin is accompanied by the higher amount of o-semiquinone free radicals. Referring to our research, we do not expect simvastatin to significantly alter melanin levels in our cells. Such studies, confirming or rejecting the hypothesis, could be designed in the future. In our X-band (9.3 GHz) EPR study, the same types of G-361 human malignum melanoma cells were examined to determine the changes in the EPR line of free radicals after treatment of these cells by simvastatin. In the tested system, changes in its free radicals occur under the influence of the selected substance, simvastatin. Complex processes occur in the tested object, and the measured EPR signal reflects their final effect. Regular changes in the free radical signal magnitude with a simvastatin dose cannot be expected. Simvastatin acts on whole cells, causes changes in them, and probably binds to melanin in cells with the participation of free radicals, as indicated by our previous studies of drug binding to melanin [28]. The changes in the amount of melanin in the studied G-361 cells under the influence of simvastatin are interesting and such studies should be carried out as a continuation of our work. Free radical transformations occurring in the complex system of G361 cells were presented, but we are aware that a precise description of the radical processes requires many further studies.
The obtained results of the proliferation studies and spectroscopic studies of free radicals in G-361 human melanoma malignum cells, before and after simvastatin action, clearly indicate the potential of simvastatin in the treatment of this type of tumor. Simvastatin, by causing changes in the free radical system in G-361 cells, may initiate their destruction through the participation of free radicals. The effect of simvastatin on free radicals in G-361 cells depends on the concentration of this compound. It was pointed out that the study of microwave radiation absorption by free radicals in G-361 cells may be important for the assessment of the role of simvastatin as an anticancer drug.
4. Conclusions
Taking into account the g coefficient values obtained in this study (2.0046 to 2.0059) and the known g values for the EPR lines of melanin, it can be assumed that the o-semiquinone free radicals of melanin biopolymers mainly occur in G-361 human melanoma malignum cells. The number of unpaired electrons equals the number of free radicals decreasing after simvastatin has acted on the G-361 cells, depending on the amount of this compound used in the culture of G-361 cells. The highest amounts of free radicals exist in G-361 cells cultured with simvastatin at concentrations of 3 μM and 5 μM, while the relatively lower amounts of free radicals occur in the cells treated with simvastatin at concentrations of 0.1 μM and 1 μM. Unpaired free radical electrons rapidly interact with the lattice in both the control G-361 cells and the simvastatin-treated cells, regardless of simvastatin concentration. Probably, simvastatin not only acts on o-semiquinone free radicals in the G-361 melanoma malignum cells but also produces reactive oxygen species and influences the formation of free radicals by changing cell metabolism. The examination of free radical formation and its interactions in cancer cells should be continued. Our studies of a preliminary nature should be expanded to include other anticancer drugs and several cell lines. Current studies only concern the approximation of the interaction of simvastatin with G361 cells. The interactions of simvastatin with cancer cells also require further investigation in order to fully explain their mechanisms.
Author Contributions
Conceptualization, E.C.; methodology, E.C., M.Z., and B.P.; formal analysis, E.C., M.Z., and B.P.; investigation, E.C., M.Z., and B.P.; data curation, E.C. and M.Z.; writing—original draft preparation, E.C., M.Z., and B.P.; writing—review and editing, E.C., M.Z., and B.P.; supervision, E.C. All authors have read and agreed to the published version of the manuscript.
Funding
These studies were supported by the Medical University of Silesia in Katowice (Poland), grant no. BNW-1-070/N/4/F and BNW-1-104/K/4/F.
Data Availability Statement
The EPR data obtained in this study are available upon request from the authors.
Conflicts of Interest
The authors declare no conflicts of interest.
References
- Sarna, T.; Swartz, H.M.; Zadlo, A. Interaction of Melanin with Metal Ions Modulates Their Cytotoxic Potential. Appl. Magn. Reson. 2022, 53, 105–121. [Google Scholar] [CrossRef]
- Meredith, P.; Sarna, T. The physical and chemical properties of eumelanin. Pigment. Cell Res. 2006, 19, 572–594. [Google Scholar] [CrossRef]
- Sarna, T.; Żądło, A. Interaction of iron ions with melanin. Acta Biochim. Pol. 2019, 66, 459–462. [Google Scholar] [CrossRef]
- Chodurek, E.; Pilawa, B. Application of EPR spectroscopy in qualitative and quantitative examinations of paramagnetic centers in melanin. Ann. Acad. Med. Siles 2022, 76, 21–30. [Google Scholar] [CrossRef]
- Charlier, N.; Desoil, M.; Gossuin, Y.; Gillis, P.; Gallez, B. Electron paramagnetic resonance imaging of melanin in honey bee. Cell Biochem. Biophys. 2020, 78, 123–126. [Google Scholar] [CrossRef]
- Mostert, A.B.; Rienecker, S.B.; Noble, C.; Hanson, G.R.; Meredith, P. The photoreactive free radical in eumelanin. Sci. Adv. 2018, 4, eaaq1293. [Google Scholar] [CrossRef]
- Pukalski, J.; Marcol, N.; Wolan, N.; Płonka, P.M.; Ryszka, P.; Kowalski, T.; Latowski, D. Detection of a pheomelanin-like pigment by EPR spectroscopy in the mycelium of Plenodomus biglobosus. Acta Biochim. Pol. 2020, 67, 295–301. [Google Scholar] [CrossRef]
- Al Khatib, M.; Costa, J.; Baratto, M.C.; Basosi, R.; Pogni, R. Paramagnetism and Relaxation Dynamics in Melanin Biomaterials. J. Phys. Chem. B 2020, 124, 2110–2115. [Google Scholar] [CrossRef] [PubMed]
- Chodurek, E.; Zdybel, M.; Pilawa, B.; Dzierżewicz, Z. Examination by EPR spectroscopy of free radicals in melanins isolated from A-375 cells exposed on valproic acid and cisplatin. Acta Pol. Pharm. Drug Res. 2012, 69, 1334–1341. [Google Scholar]
- Chodurek, E.; Zdybel, M.; Pilawa, B. Application of EPR spectroscopy to examination of free radicals in melanins from A-375 and G-361 human melanoma malignum cells. J. Appl. Biomed. 2013, 11, 173–185. [Google Scholar] [CrossRef]
- Bartosz, G. Druga Twarz Tlenu: Wolne Rodniki w Przyrodzie; PWN: Warszawa, Poland, 2021. [Google Scholar]
- Čipak Gašparović, A. Free Radical Research in Cancer. Antioxidants 2020, 9, 157. [Google Scholar] [CrossRef]
- Hussain, S.; Hofseth, L.; Harris, C. Radical causes of cancer. Nat. Rev. Cancer 2003, 3, 276–285. [Google Scholar] [CrossRef]
- Liou, G.-Y.; Storz, P. Reactive oxygen species in cancer. Free Radic. Res. 2010, 44, 479–496. [Google Scholar] [CrossRef]
- Gutowski, M.; Kowalczyk, S. Study of free radical chemistry: Their role and pathophysiological significance. Acta Biochim. Pol. 2013, 60, 1–16. [Google Scholar] [CrossRef] [PubMed]
- Domann, F.E. Aberrant Free Radical Biology Is a Unifying Theme in the Etiology and Pathogenesis of Major Human Diseases. Int. J. Mol. Sci. 2013, 14, 8491–8495. [Google Scholar] [CrossRef] [PubMed]
- Zdybel, M.; Chodurek, E.; Pilawa, B. Application of EPR spectroscopy to determine the influence of simvastatin concentration on free radicals in A-375 human melanoma malignum cells. Toxicol. In Vitro 2019, 61, 104620. [Google Scholar] [CrossRef] [PubMed]
- Zdybel, M.; Chodurek, E.; Pilawa, B. Effect of simvastatin in different concentrations on free radicals in A-2058 human melanoma malignum cells-EPR studies. J. Cell. Biochem. 2019, 120, 2483–2492. [Google Scholar] [CrossRef]
- Sainz, R.M.; Lombo, F.; Mayo, J.C. Radical decisions in cancer: Redox control of cell growth and death. Cancers 2012, 4, 442–474. [Google Scholar] [CrossRef]
- Ahmadi, M.; Amiri, S.; Pecic, S.; Machaj, F.; Rosik, J.; Łos, M.J.; Alizadeh, J.; Mahdian, R.; da Silva Rosa, S.C.; Schaafsma, D.; et al. Pleiotropic effects of statins: A focus on cancer. Biochim. Biophys. Acta Mol. Basis Dis. 2020, 1866, 165968. [Google Scholar] [CrossRef]
- Duarte, J.A.; Barros, A.L.B.D.; Leite, E.A. The potential use of simvastatin for cancer treatment: A review. Biomed. Pharmacother. 2021, 141, 111858. [Google Scholar] [CrossRef]
- Buccioli, G.; Testa, C.; Jacchetti, E.; Pinoli, P.; Carelli, S.; Ceri, S.; Raimondi, M.T. The molecular basis of the anticancer effect of statins. Sci. Rep. 2024, 14, 20298. [Google Scholar] [CrossRef]
- Dyrek, K. Elektronowy rezonans paramagnetyczny. In Fizyczne Metody Badań w Biologii, Medycynie i Ochronie Środowiska; Hrynkiewicz, A.Z., Rokita, E., Eds.; PWN: Warszawa, Poland, 2013; pp. 136–159. [Google Scholar]
- Pilawa, B.; Ramos, P. Spektroskopia EPR. Ćwiczenia Dla Studentów Analityki Medycznej i Medycyny; Śląski Uniwersytet Medyczny w Katowicach: Katowice, Poland, 2017. [Google Scholar]
- Stankowski, J.; Hilczer, W. Wstęp do Spektroskopii Rezonansów Magnetycznych; PWN: Warszawa, Poland, 2005. [Google Scholar]
- Zawada, K. Zastosowanie spektroskopii EPR w farmacji i medycynie. Farm. Pol. 2009, 65, 224–228. [Google Scholar]
- Weil, J.A.; Bolton, J.R. Electron Paramagnetic Resonance: Elementary Theory and Practical Applications, 2nd ed.; John Wiley & Sons: New York, NY, USA, 2007. [Google Scholar]
- Buszman, E.; Pilawa, B.; Zdybel, M.; Wrześniok, D.; Grzegorczyk, A.; Wilczok, T. Paramagnetic centers in DOPA-melanin-dihydrostreptomycin complexes. Acta Phys. Pol. A 2005, 108, 353–356. [Google Scholar] [CrossRef]
- Mignion, L.; Desmet, C.M.; Harkemanne, E.; Tromme, I.; Joudiou, N.; Wehbi, M.; Baurain, J.-F.; Gallezed, B. Noninvasive detection of the endogenous free radical melanin in human skin melanomas using electron paramagnetic resonance (EPR). Free Radic. Biol. Med. 2022, 190, 226–233. [Google Scholar] [CrossRef]
Disclaimer/Publisher’s Note: The statements, opinions and data contained in all publications are solely those of the individual author(s) and contributor(s) and not of MDPI and/or the editor(s). MDPI and/or the editor(s) disclaim responsibility for any injury to people or property resulting from any ideas, methods, instructions or products referred to in the content. |
© 2025 by the authors. Licensee MDPI, Basel, Switzerland. This article is an open access article distributed under the terms and conditions of the Creative Commons Attribution (CC BY) license (https://creativecommons.org/licenses/by/4.0/).