Abstract
This study investigates the adsorption performance of activated carbon (AC) derived from food and agricultural waste, specifically coffee grounds, coffee skin, bamboo, and palm leaves, for the removal of two antibiotics: amoxicillin (AMX) and sulfamethoxazole (SMX). The ACs were synthesized via KOH and ZnCl2 chemical activation and characterized through BET surface area analysis, thermal stability, electrical conductivity, SEM, EDS, and FTIR. Among all samples, bamboo-derived AC (B-AC) exhibited superior properties, such as the highest surface area (860 m2/g), thermal stability (855 °C), conductivity (0.063 S/cm), and adsorption capacities (292.6 mg/g for AMX and 195.7 mg/g for SMX). SEM and EDS analyses confirmed successful antibiotic adsorption with morphological and elemental changes, while FTIR spectra indicated interaction with surface functional groups. Adsorption data were best described by the Langmuir and Dubinin–Radushkevich isotherm models, suggesting a monolayer physical adsorption process dominated by micropore filling (E < 8 kJ/mol). In contrast, BET and Flory–Huggins models exhibited poor fit, confirming the absence of multilayer or partition-based adsorption mechanisms. Kinetic modeling showed that AMX followed a pseudo-second-order model, while SMX exhibited a more complex adsorption behavior. Thermodynamic studies confirmed that both processes were spontaneous, with AMX adsorption being endothermic and entropy-driven and SMX being exothermic but favorable. These findings demonstrate the high potential of B-AC as a low-cost, eco-friendly, and efficient adsorbent for pharmaceutical removal from water, supporting circular economy and sustainability goals.
1. Introduction
Agricultural and food wastes are among the most pressing global challenges today, posing serious environmental and economic burdens that hinder progress toward sustainable development goals. Food waste undermines food security while contributing significantly to environmental degradation. On the other hand, agricultural waste, when effectively recycled and utilized, offers significant environmental benefits and can serve as a cornerstone. Agricultural waste includes a broad spectrum of non-food residues from agricultural operations, such as crop residues (e.g., husks, leaves, straws, bagasse), animal waste (e.g., excreta, bedding), by-products from food processing, and even hazardous components like pesticide residues [1,2,3]. Efficient management of agricultural waste is crucial to reduce environmental and health risks and achieve zero-waste agriculture. Valorizing these residues transforms waste into valuable resources, contributing to energy security, environmental protection, and the bioeconomy. As agriculture remains one of the largest biomass producers, bioeconomic strategies for agricultural waste management (AWM) address key challenges, such as underutilized livestock excreta and open-field biomass burning, while promoting value-added production, rural employment, and sustainable farming practices [3,4].
Food waste is generated by consumer, retail, or service-level actions, including the disposal of both edible and inedible components via composting, anaerobic digestion, or landfilling [5]. The magnitude of food waste generation is alarming: over 59 million tons of food waste are generated annually in the EU—132 kg per person—while 42 million people face food insecurity [6,7]. Globally, nearly one-third of food produced is lost or wasted, with 14% lost from post-harvest to retail stages [5]. Households generate more than half (54%) of the EU’s food waste [6].
As a result, food production and consumption increasingly impact the environment. To address this, the European Commission launched the Circular Economy Action Plan in 2020 and revised the Circular Economy Monitoring Framework in 2023 to include new indicators on material footprint and resource efficiency [8,9]. This framework emphasizes converting low-cost biomass residues into high-value products, aligning with the shift from a carbon-based fossil economy to a renewable, bio-based economy.
Biorefineries—integrated industrial systems using diverse biomass sources like lignocellulosic feedstocks—are central to this transition, producing energy, biofuels, biochemicals, and other products [10]. Among promising materials emerging from biomass valorization is activated carbon (AC), synthesized from agricultural by-products [11]. AC, with its high porosity and adsorption capacity, is crucial for water purification, air treatment, gas separation, catalysis, and energy storage, representing a multi-billion-dollar market [11,12]. Preferred precursors are low-cost, lignocellulosic materials with high carbon and low ash contents [13].
Various techniques for producing AC from agricultural waste include physical and chemical activation, hydrothermal carbonization, and microwave radiation [14,15,16,17]. Physical activation involves carbonization followed by steam or carbon dioxide (CO2) treatment [18], while chemical activation uses agents like phosphoric acid (H3PO4), potassium hydroxide (KOH), or zinc chloride (ZnCl2) [18,19]. Hydrothermal carbonization at 180–250 °C is environmentally friendly [16], and microwave-assisted synthesis offers rapid, energy-efficient production [17]. A broad range of plant parts, bark, leaves, husks, shells, and flowers are viable AC precursors [18].
Notably, coffee is the second most traded commodity after oil [20]. Coffee processing generates considerable biowaste, including spent coffee grounds and husks, which currently lack profitable uses and pose disposal challenges [21], with global coffee waste reaching around 9.34 million tons in 2016/17 [20]. Both types have shown promising adsorption capacities [22]. Similarly, bamboo’s high carbon content and porous structure offer excellent adsorption and electrochemical properties, making it ideal for filtration and purification [23]. The palm industry also generates large amounts of biomass waste (leaves, petioles, panicles, etc.) that serve as low-cost adsorbents for pollutants [24]. AC can be produced from all these agricultural and food wastes and represents a sustainable, economic alternative to traditional precursors, supporting the principles of circular economy and reducing dependence on non-renewable resources.
Today, due to the rapid growth of the world population and the increase in pollutants from the medical, mining, food, automotive, and petroleum industries, the protection and purification of water resources are of great importance [25,26,27]. AC finds applications in water treatment, catalysis, environmental remediation, energy storage, and medicine [18,28,29]. Water contamination by pharmaceuticals, particularly antibiotics, is a major concern, as it contributes to antimicrobial resistance (AMR), recognized by the WHO as a top global public health threat [28]. Conventional treatment systems fail to remove antibiotics effectively, achieving as low as 5% removal, whereas AC offers a viable adsorption-driven remediation solution [30,31].
The US Food and Drug Administration (FDA) has given approval to the prescription antibacterial medication amoxicillin (AMX) to treat several bacterial diseases, including genitourinary tract infections, skin and respiratory infections, ear, nose, and throat infections, and community-acquired pneumonia. It is a member of the class of aminopenicillins, which were created by incorporating an amino group into penicillin to boost its potency against bacteria resistant to antibiotics [32].
One of the common sulfonamides used in human medicine is sulfamethoxazole (SMX). Dihydropteroate synthase, a folic acid precursor that aids in bacterial development, is inhibited by this bacteriostatic antibiotic. SMX has long been utilized as a stand-alone medicinal drug since receiving approval from the US Food and Drug Administration in 1961. Since bacterial resistance to SMX has increased, it is now used in conjunction with other medications known as trimethoprim (TMX) [33].
Based on data from the U.S. Centers for Disease Control and Prevention (CDC), Definitive Healthcare reports that healthcare providers in the U.S.A. will prescribe approximately 270 million antibiotic prescriptions in 2023, with AMX accounting for 18.26% [34]. In the same report, the rate of SMX prescriptions ranked sixth place with 4.5%.
Several experimental and analytical studies have been conducted for the removal of AMX and SMX by adsorption using AC derived from commercial, plant-based, or agricultural wastes [28,35,36,37,38]. Studies have shown that adsorption isotherms play a critical role in understanding the mechanisms of interaction between adsorbate molecules and adsorbent surfaces. Adsorption isotherms define the relationship between the amount adsorbed and equilibrium concentration, providing insights into surface characteristics, adsorption capacity, and the adsorption mechanism. Proper modeling distinguishes between physical and chemical adsorption, evaluates efficiency, and optimizes adsorbance [39,40,41].
Adsorption equilibrium modeling is essential to comprehending the removal capability of AMX and SMX onto ACs obtained from agricultural waste. Langmuir, Freundlich, Dubinin–Radushkevich (D-R), Temkin, Flory–Huggins, and Brunauer–Emmett–Teller (BET) are the six most used models for AC adsorption. The Langmuir model assumes monolayer adsorption on uniform sites [42,43], while the Freundlich model describes multilayer adsorption on heterogeneous surfaces [44]. The D-R model differentiates between physical and chemical adsorption without assuming surface uniformity [45]. The Temkin model accounts for adsorbate–adsorbent interactions, proposing a linear decrease in adsorption heat with increasing surface coverage [46]. The Flory–Huggins model evaluates surface coverage and adsorption feasibility, especially when adsorbate and adsorbent sizes differ [47]. Finally, the BET model extends the Langmuir theory to multilayer adsorption [48,49]. In existing literature, these six isotherm models have been widely applied in adsorption studies using AC for AMX and SMX antibiotics [35,37,50,51]. However, there is no comprehensive study including these six isotherm models for both antibiotics.
The United Nations and the European Union, through frameworks such as the Sustainable Development Goals [52], the European Green Deal [53], and the Circular Economy Action Plan [54], are primarily addressing the interlinked challenges of agriculture and food losses and waste reduction, and water pollution and treatment. Initiatives like the “Food Supply Chain Ecosystems for Sustainability—FOOD CHASE” Project [55] contribute by promoting sustainability along the food chain and developing innovative cross-sectoral training and solutions to minimize food loss and waste.
To support these global sustainability goals, this study investigates the production and application of AC derived from coffee waste, coffee husks, bamboo, and palm leaves for AMX and SMX adsorption from aqueous media within the FOOD CHASE Project framework, aiming to protect water resources and combat emerging micropollutants. To elucidate the adsorption behavior of AMX and SMX onto ACs derived from coffee grounds (CG-AC), coffee skin (CS-AC), bamboo (B-AC), and palm leaves (PL-AC), six absorption equilibrium models, including Langmuir, Freundlich, Dubinin–Radushkevich (D–R), Temkin, Flory–Huggins, and Brunauer–Emmett–Teller (BET) isotherms, were applied, and their linear parameters were systematically calculated. In addition to isotherm modeling, this study also incorporated Fourier-transform infrared spectroscopy (FTIR) and scanning electron microscopy (SEM) analyses to investigate the surface chemistry and morphological features of the prepared activated carbons. These characterization techniques provided valuable insights into functional groups and surface porosity, which are directly linked to adsorption performance. Moreover, kinetic and thermodynamic analyses were conducted to elucidate adsorption mechanisms, rate-limiting steps, and thermodynamic parameters during the adsorption process. These complementary evaluations not only strengthened the scientific rigor of the study but also provided a holistic understanding of the adsorption behavior of AMX and SMX onto various bio-based activated carbon materials. Unlike previous studies that focused either on single biomass sources or limited characterization, this study includes a comparative analysis of various food- and agricultural-waste-derived activated carbons and highlights bamboo-derived AC as a high-performance, sustainable adsorbent for pharmaceutical removal. A dual chemical activation method using KOH and ZnCl2 and extensive multi-model analysis further strengthen the novelty of this work.
2. Materials and Methods
The research methodology was carried out under two main headings:
- Characterization of activated carbon (AC) from four different biomass sources, including surface area, thermal stability, and electrical conductivity analysis; batch adsorption experiments; and application of six isotherm models to determine the adsorption mechanism.
- Thermodynamic and kinetic analyses based on expanded experimental parameters using the AC sample with the best adsorption performance.
2.1. Chemicals and Materials
AMX (A8523, Sigma-Aldrich, St. Louis, MO, USA) and SMX (PHR1126, Sigma-Aldrich) antibiotics were selected as representative emerging contaminants in this study. AMX has the molecular formula C16H19N3O5S and a molecular weight of 365.4 g/mol. It exhibits a maximum absorption at 230 nm in the UV spectrum. According to chemical safety data, AMX is classified as an irritant and poses both health and environmental hazards. SMX has the molecular formula C10H11N3O3S and a molecular weight of 253.28 g/mol. Its maximum absorption occurs at 254 nm. It is also categorized as an irritant and presents a potential environmental hazard [25,29,30].
AMX was chosen due to its widespread use in treating various bacterial infections and accounts for 18.26% of total human antibiotic use. SMX is an antibiotic that has been used since 1961 and ranks sixth in total antibiotic use. These two antibiotics represent a large proportion of total antibiotic use, around 23% in the United States alone [31].
KOH (417661, 45 wt.% in H2O, Sigma-Aldrich), ZnCl2 (208086, Sigma-Aldrich), acetic acid (CH3COOH, Sigma-Aldrich), and hydrochloric acid (HCl) (Merck 100317, hydrochloric acid fuming 37% for analysis EMSURE®, Rahway, NJ, USA) were used for activation. All the compounds were at least reagent and certified material grade (>95% purity).
2.2. AC Preparation
Coffee grounds (CG), coffee skin (CS), bamboo (B), and palm leaves (PL) were collected from coffee, yarn, and botanic companies in Denizli Province, washed thoroughly with deionized water, dried at 60 °C for 24 h, and ground into fine powder, separately.
In chemical activation of carbon, commonly used chemical activating agents are KOH, NaOH, K2CO3, ZnCl2, or H3PO4 [18,19]. Instead of using only KOH or ZnCl2 for the activation of carbon powder, a combination of KOH and ZnCl2 was used sequentially to obtain AC from the salak wedi (Salacca Zalacca) plant, and much higher pore volume was obtained with this multi-level activation [56]. In this study, the samples were chemically activated using KOH and ZnCl2 together.
Both activation agents were used simultaneously in this study. The combined chemical activation using KOH and ZnCl2 was chosen to synergistically enhance porosity and surface functionalization. KOH primarily facilitates micropore formation through carbon lattice etching, while ZnCl2 contributes to mesoporosity and structural stability by promoting dehydration and crosslinking during pyrolysis. This dual approach is reported to improve adsorption properties, compared to single-agent activation methods. In one pot, a 22% (in wt.) solution was formed with 40 nm of ZnCl2 in 1% (in wt.) acetic acid solution. In another container, 1 N of KOH solution was prepared. For each precursor, 3 g was placed into a separate container. The raw materials were first impregnated with 5 mL of ZnCl2 followed by 5 mL of KOH at ambient temperature. The impregnated samples were then heat-treated in a muffle furnace at 450 °C under standard atmosphere for 2 h to increase porosity. The activated carbon samples were washed with 0.1 M HCl and deionized water until a neutral pH (6–7) was obtained and subsequently dried at 105 °C for 12 h. The ACs were named depending on the source as coffee grounds (CG-AC), coffee skin (CS-AC), bamboo (B-AC), and palm leaves (PL-AC).
2.3. AC Characterization
The Brunauer–Emmett–Teller (BET) method was used to determine the specific surface area. Adsorbent samples were degassed at 200 °C for 12 h to remove moisture and contaminants. Nitrogen absorption–desorption isotherms were recorded at 77 °K using a surface area analyzer (Meritics, Horiba SA, Irvine, CA, USA). The micropore surface area was determined by subtracting the micropore surface area from the total BET surface area [36].
A small amount (10–15 mg) of the adsorbent material was analyzed using a thermogravimetric analysis (TGA, Perkin Elmer Pyris 1 Thermogravimetric Analyzer, Waltham, MA, USA) instrument. The sample was heated from 25 °C to 950 °C at a heating rate of 25 °C/min under a nitrogen atmosphere. The temperature corresponding to 50% weight loss was designated as the thermal degradation temperature [57].
Adsorbent samples were pressed into cylindrical pellets (10 mm diameter, 2 mm thickness) using a hydraulic press under 5 tons of pressure. The electrical conductivity was measured using a four-point probe system (The Ossila Four-Point Probe, T2001A5, Sheffield, UK). Measurements were conducted at room temperature, and the conductivity was calculated using Equation (1) [58]:
where σ is the conductivity (S/cm), R is the resistance (Ω), A is the cross-sectional area (cm2), and L is the sample thickness (cm).
All measurements were conducted in ten replicates, and the average values were reported.
In this study, based on four different starting materials, the microstructures of activated carbons obtained from bamboo and coffee waste were investigated by scanning electron microscopy (SEM). SEM analysis was conducted on the prepared samples using a Zeiss Supra V40 FESEM device (Zeiss, Oberkochen, Germany) operating at 20 kV at Pamukkale University Advanced Research Center (ILTAM). Following preliminary experiments, B-AC was selected due to its prominent characteristics, and detailed SEM-EDS analysis was performed before and after AMX and SMX adsorptions.
Additionally, FTIR analysis was performed for B-AC before and after AMX and SMX adsorption. Functional groups on the surface of activated carbon samples were determined using Fourier-transform infrared (FTIR) spectroscopy (Nicolet iS50, Thermo Scientific, Waltham, MA, USA) equipped with an attenuated total reflectance (ATR) accessory. The spectra were recorded in the range of 4000–400 cm−1. All analyses were performed at Pamukkale University Advanced Research Center (ILTAM).
2.4. Batch Adsorption Experiments
Stock solutions of AMX and SMX were prepared in distilled water. Adsorption experiments were performed using AMX and SMX solutions with concentrations ranging from 10 to 250 mg/L, employing 25 mg of AC derived from coffee grounds (CG-AC), coffee skin (CS-AC), bamboo (B-AC), and palm leaves (PL-AC) under optimized conditions: 25 °C, 25 mL solution volume, pH 5, and 120 min of contact time. Initial and final antibiotic concentrations were measured using a UV-Vis spectrophotometer at 252 nm [57].
The amount of antibiotics adsorbed (mg/g) at 24 h, qe (mg/g), was estimated based on Equation (2), and percentage removal was calculated using Equation (3) [43]:
where Ci is the initial concentration (mg/L), Ce is the final concentration (mg/L), V is the solution volume (L), and m is the adsorbent mass (g). Batch adsorption experiments were repeated 10 times and averaged.
Following the first set of experiments, the experimental parameters were expanded for B-AC, which yielded optimal results, and experiments were repeated at 20, 30, 40, and 50 °C temperatures; 15, 45, 90, and 120 min contact times; and 25, 100, and 250 mL solution volumes. Each condition was tested in duplicate, and the average values were used. After batch experiments, SEM and EDS experiments were performed at 20 °C, 120 min contact times, and 250 mL solution volumes. For this purpose, solutions containing AMX and SMX were first filtered through filter paper and then dried at 105 °C for 12 h. The procedures are illustrated in Figure 1.
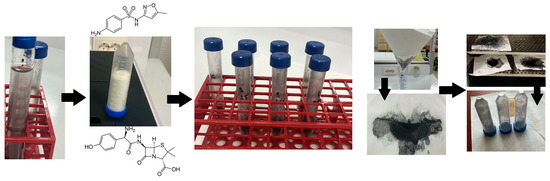
Figure 1.
Illustration of SEM and EDS sample preparation after adsorption experiments.
2.5. Adsorption Isotherms and Modeling
The equilibrium relationship between adsorbed and unadsorbed quantities is described by several published formulae. To elucidate the adsorption behavior of AMX and SMX onto ACs derived from coffee grounds (CG-AC), coffee skin (CS-AC), bamboo (B-AC), and palm leaves (PL-AC), six commonly used adsorption isotherm models were applied using linear methods to determine the most suitable model for describing antibiotic adsorption, including Langmuir, Freundlich, Dubinin–Radushkevich (D–R), Temkin, Flory–Huggins, and Brunauer–Emmett–Teller (BET). These models are presented below (Equations (4)–(17)). The best-fitting isotherm was determined by using all the model outputs [41].
For linear models, the applicability of isotherm models to adsorption behaviors was evaluated by the correlation coefficient (R2), which is widely used in the evaluation of isotherm accuracies and is usually determined by the least squares method [23,43,48]:
Here, qe,exp is the experimental equilibrium adsorption capacity (mg/g), qe,calc is the predicted adsorption capacity from the isotherm model (mg/g), and . is the mean of experimental values.
Chi-square analysis (χ2) is a statistical method that is used to measure the difference between the values of experimental data and the values predicted by isotherm models. It is particularly useful in regression analysis, where traditional R2 values may not fully capture the accuracy of the fit. A lower χ2 value indicates a better fit of the model to the experimental data [59]. Using the solver add-in functions of Microsoft Excel 2010, nonlinear regression was carried out by optimizing the corresponding coefficient of correlation between the anticipated isotherms and the experimental data. The χ2 value was calculated using the Equation (5):
where qe,exp is the experimental equilibrium adsorption capacity (mg/g), qe,calc is the predicted adsorption capacity from the isotherm model (mg/g), and N is the amount of data. A χ2 value close to zero indicates an excellent fit between the model and experimental data, while higher values suggest poor agreement.
2.5.1. Langmuir Isotherm
The Langmuir isotherm model, one of the most widely used in adsorption studies, assumes that adsorption occurs on a homogeneous surface with a finite number of identical sites, each capable of holding only one adsorbate molecule. The process reaches equilibrium when the rate of adsorption equals the rate of desorption, resulting in monolayer coverage without interactions between adsorbed molecules. This model is particularly applicable to systems where adsorbent surfaces exhibit uniform energy distribution and no lateral interactions among adsorbed species. The Langmuir equation was used in this study to evaluate the adsorption of AMX and SMX onto the AC surfaces [36,42,43]. In this context, as can be seen in Equation (6), qe (mg/g) denotes the quantity of antibiotics adsorbed onto the adsorbent, Ce (mg/L) represents the equilibrium concentration of the antibiotic in solution, while Q0 (mg/g) and bL (L/mg) are the Langmuir constants associated with adsorption capacity and adsorption energy, respectively. Q0 and bL were derived from the slope and intercept of the linear graphs of Ce/qe against Ce.
Equation (6) was linearized to obtain the following:
2.5.2. Freundlich Isotherm
Adsorption on heterogeneous surfaces with sites of different affinities, where multilayer adsorption might take place, is described by the Freundlich model. Stronger binding sites are presumably occupied first, and as site occupation increases, the binding strength presumably diminishes. The following Equation (8) can be used to express the Freundlich adsorption isotherm, with KF being a constant representing the adsorption capacity and nF a constant depicting the adsorption intensity. The following is an expression for the Freundlich model [44,60]:
Equation (8) can be linearized as follows:
2.5.3. Dubinin and Radushkevich Isotherm
The Dubinin and Radushkevich (D-R) isotherm model, which is used to identify whether the adsorption process is physical or chemical in origin, was also applied to the acquired equilibrium results. The adsorption energy can be computed using the model. Because the D-R model does not imply a uniform surface or a constant adsorption potential, it is either more general or less specific than the Langmuir model. The following is an expression for the D-R equation [45]:
The linearized D-R equation can be rewritten as follows:
Here, Xm is the maximum adsorption capacity (mg/g), β is the constant related to adsorption energy (mol2/J2), and ε is the Polanyi potential, which is calculated using the following Equation (12):
Here, R is a gas constant in kJ/mol, and T is the temperature in Kelvin. If ln qe is plotted against ε2, β and Xm are obtained from the slope and intercept of the linear model. The average adsorption energy, E (kJ/mol), is also calculated as follows:
2.5.4. Temkin Isotherm
Based on the idea that the free energy of adsorption is a function of surface coverage, the Temkin isotherm predicts how the adsorbent and sorbate would interact. The Temkin isotherm model is shown as follows: T is the absolute temperature (K), R is the gas constant (8.314 J/mol·K), aTE is the Temkin isotherm constant (L/g), and bTE is the Temkin constant associated with the heat of adsorption (J/mol) [46].
The following is the Temkin equation in linear form:
Plotting the curve for qe and ln Ce allowed for the calculation of both constants, aTE and bTE.
2.5.5. Flory–Huggins Isotherm
The practicality and spontaneous nature of the adsorption process can be used to indicate the degree of surface-covering features of the sorbate on the sorbent, which are considered by the Flory–Huggins isotherm model. The following is the equation for the Flory–Huggins isotherm [47,61]:
where nFH is the Flory–Huggins model exponent, KFH is the Flory–Huggins model equilibrium constant, and Θ is the degree of surface covering. Θ can be computed using the following formula:
The linearized form of the equation is expressed as follows:
Plotting the curve between log(Θ/Ci) and log(1 − Θ) allowed for the calculation of the values of the constants KFH and nFH based on the slope and intercept.
2.5.6. Brunauer–Emmett–Teller Isotherm
The Brunauer–Emmett–Teller (BET) isotherm describes multilayer adsorption on solid surfaces and is an extension of the Langmuir model. Unlike monolayer models, BET considers that multiple layers of adsorbate molecules can accumulate on the adsorbent surface, which makes it particularly suitable for mesoporous and microporous materials such as AC. In liquid-phase adsorption studies, the BET equation helps determine the theoretical monolayer capacity and provides insights into surface heterogeneity and multilayer formation. In this study, the BET isotherm model was applied to evaluate the multilayer adsorption behavior of AMX and SMX onto agricultural waste-derived ACs. The nonlinear form of the BET equation is given as follows [48,49]:
Here, qs indicates theoretical monolayer capacity (mg/g), CBET is the BET constant, Cs is the saturation concentration (mg/L), and Ce is the equilibrium concentration (mg/L).
Adsorption isotherm models were fitted to the data to interpret the adsorption mechanism. Surface area and pore size distribution were correlated with adsorption capacity. This methodology ensures a comprehensive understanding of adsorption behavior, material properties, and practical applications of the prepared adsorbents.
2.6. Kinetic Studies
Evaluating the fit of experimental data to kinetic models also enables the identification of the rate-limiting step in the system and provides design parameters for real-world applications in wastewater treatment. Kinetic models provide insights into adsorption mechanisms and allow prediction of equilibrium time. They provide insights into whether the adsorption process is controlled by physical or chemical interactions and help in designing efficient adsorption systems for practical applications. Evaluating the fit of experimental data to kinetic models also enables the determination of potential rate-limiting steps in the system [41]. In this study, to investigate the adsorption kinetics of AMX and SMX onto the prepared B-AC, two widely used kinetic models were applied: the pseudo-first-order (PFO) and pseudo-second-order (PSO) models. These models were employed to evaluate the rate and mechanism of adsorption and to identify the best-fitting model for each antibiotic.
The PFO kinetic model assumes that the rate of occupation of adsorption sites is proportional to the number of unoccupied sites. Its linear form is expressed as follows [41]:
The PSO kinetic model, on the other hand, assumes chemisorption as the rate-limiting step and is represented by the following linear equation:
In these equations, qe (mg/g) and qt (mg/g) are the amounts of antibiotic adsorbed at equilibrium and at time t, respectively; k1 (1/min) is the PFO rate constant; and k2 (g/mg·min) is the PSO rate constant. Experimental data obtained from batch adsorption tests were fitted to both models using linear regression, and the correlation coefficients (R2) were used to assess the goodness-of-fit for each kinetic equation.
2.7. Thermodynamic Studies
Thermodynamic investigations provide essential insight into the nature of adsorption processes, particularly regarding spontaneity, enthalpic changes, and adsorbate–adsorbent interactions. In this study, thermodynamic parameters, such as the change in Gibbs free energy (ΔG°), enthalpy (ΔH°), and entropy (ΔS°), were calculated to evaluate the feasibility and mechanism of AMX and SMX adsorption onto B-AC. The temperature dependence of adsorption equilibrium was assessed using van’t Hoff plots, which enabled the estimation of ΔH° and ΔS° values. A negative ΔG° value indicates a spontaneous process, whereas the sign and magnitude of ΔH° reveal whether the adsorption is exothermic or endothermic. Understanding these thermodynamic properties is critical for predicting adsorption behavior under different environmental conditions and for designing scalable water treatment systems using sustainable adsorbents. The analysis builds upon literature findings where similar thermodynamic frameworks were applied to the adsorption of various contaminants on bio-based adsorbents [39,41].
To elucidate the adsorption mechanisms of AMX and SMX onto B-AC, thermodynamic parameters were evaluated at four different temperatures (293.15, 303.15, 313.15, and 323.15 K). The standard Gibbs free energy change (ΔG°), enthalpy change (ΔH°), and entropy change (ΔS°) were calculated using the van’t Hoff equation:
Distribution coefficient (Kd, mL/g) was also computed using the following equation:
These insights are crucial for scaling up adsorption systems for real-world applications, especially in treating antibiotic-contaminated effluents using sustainable materials.
3. Results and Discussion
3.1. Characterization Results
Figure 2 graphically shows the BET surface areas obtained for all samples. The BET surface area analysis revealed differences among the four types of activated carbon (AC) materials. CG-based samples exhibited surface areas ranging between 610 and 700 m2/g, while CS-based samples showed slightly lower values of 510–600 m2/g. Notably, the B series demonstrated the highest surface areas, ranging from 800 to 950 m2/g, indicating superior pore development. In contrast, PL samples exhibited surface areas similar to CS, also in the range of 510–600 m2/g. When comparing average values, material B stood out with the highest average surface area (~860 m2/g), followed by CG (~650 m2/g) and CS and PL, both averaging around ~550 m2/g. Among the tested materials, B-AC demonstrated the highest porosity and thus the greatest potential for adsorption-related application.
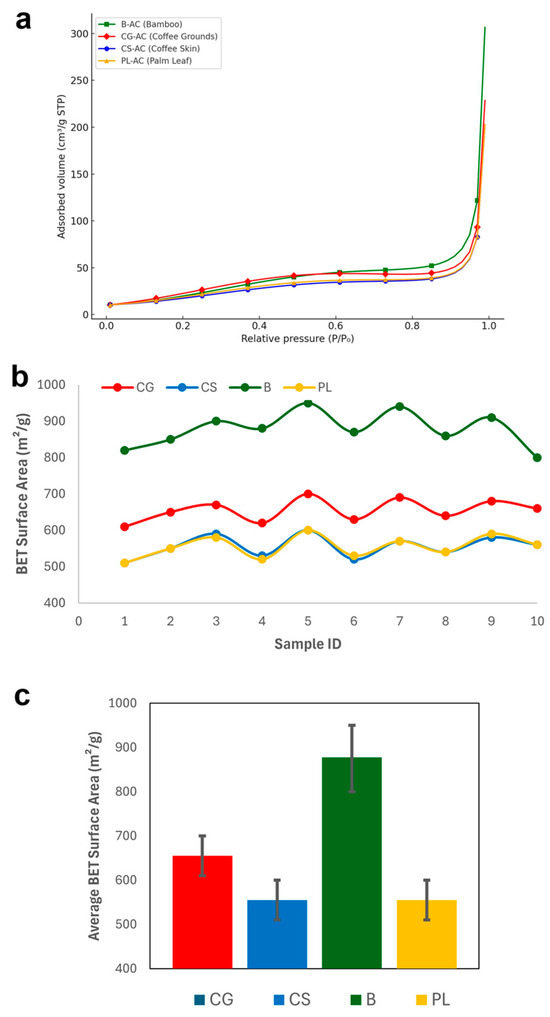
Figure 2.
N2 adsorption isotherms at 77 K of activated carbons (a), the BET surface areas obtained for all samples (b), and the average surface areas (c).
The BET surface areas obtained in this study are consistent with previous findings reported in literature. For instance, CG-derived AC activated with H3PO4 showed a surface area of 520.40 m2/g [60], while ZnCl2 activation resulted in 564.37 m2/g [54]. For CS, Tran et al. [62] reported a surface area of 743.79 m2/g using KOH, whereas Hernández Rodríguez et al. [63] achieved 383 m2/g with NaOH. B-derived carbons, especially from bamboo, exhibited higher surface areas with values of 976–1496 m2/g by physical methods [13] and even higher ranges of 1281.7–1532.8 m2/g with KOH activation [64]. In the case of PL, Islam et al. [24] reported a surface area of 540 m2/g using KOH, while a significantly lower value of 22.11 m2/g was observed with CaCl2 [65]. These comparisons validate the surface area trends observed in this study and emphasize the influence of precursor type and activation method on porosity.
Figure 3a shows TGA thermographs, and Figure 3b presents a comparative overview of thermal stability and electrical conductivity for the synthesized AC samples. A clear correlation is observed between thermal stability and electrical conductivity; samples with higher degradation resistance (e.g., B with ~855 °C) tend to exhibit enhanced electrical conductivity (0.063 S/cm). In contrast, samples like CG and PL, which exhibit lower thermal stability (~550–555 °C), also demonstrate reduced conductivity (~0.02 S/cm), which may be attributed to structural disorder and lower carbon purity.
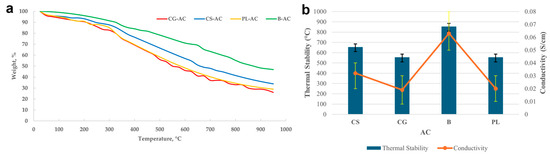
Figure 3.
TGA thermographs (a) and a comparative overview of thermal stability and electrical conductivity for the synthesized AC samples (b).
When surface area data are considered in parallel, the B-derived sample again stands out with the highest BET surface area (~860 m2/g), suggesting a well-developed porous structure that supports both electron transport and thermal integrity. Although the CG sample had a relatively high surface area (~650 m2/g), its moderate conductivity and thermal stability indicate that surface area alone is not a sufficient predictor of conductivity or thermal resilience. CS and PL displayed similar trends, with moderate surface areas (~550 m2/g), relatively lower conductivity, and intermediate thermal stability.
These results are in good agreement with literature findings. For example, in a study by Djeridi et al. [63] on olive stone-derived ACs, BET surface areas in the range of 532–1014 m2/g were reported, and conductivity enhancements were attributed to increased pore development and graphitic phase formation. Similarly, Adinaveen et al. [64] reported that AC derived from cotton cloth exhibited significant improvements in both surface area (~1193 m2/g) and electrical conductivity (up to 0.40 S/cm) when activated at 400–450 °C. Olive stone powders activated using H3PO4 were analyzed for CO2 adsorption by Djeridi et al. [63]. It was shown that the CO2 adsorption capacity of AC not only depends on the micropore volume but also strongly depends on the structural, textural, and electrical properties.
In this context, the B-based AC sample in our study demonstrates competitive performance in terms of both surface area and conductivity, highlighting its strong potential for use in adsorption and electrochemical applications.
Based on the results of TGA and electrical conductivity analyses, B-AC with the highest values and CG-AC with the lowest results were examined by SEM at 20,000× magnification, as shown in Figure 4a and 4b, respectively. BET surface area analysis confirmed that B-AC had the highest surface area, ranging from 800 to 950 m2/g, while CG-based samples showed higher surface area than both B- and CS-AC, with a surface area ranging from 610 to 700 m2/g. Although the microstructures of these two samples differ from each other, they contain a large number of nanoscale pores [65]. In the CG-AC sample, the particles showed a near-planar formation with very few gaps between them. In the B-AC sample, there were porosities between the particles, but the amount of porosity on the particle surfaces increased significantly. According to the surface area results and SEM examinations of both samples, these specimens were found to be essentially nanoporous because of KOH + ZnCl2 activation. Both the electrical conductivity and thermal stability of CG-AC, where the particles are close to each other and planar, were lower than B-AC. This implies that the microstructure of B-AC supports efficient ion diffusion within the porous network and may help in bettering the electrochemical performance of the devices [66].
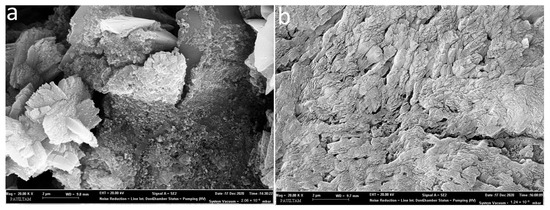
Figure 4.
SEM images of the B-AC (a) and CG-AC (b).
The SEM and EDS analyses conducted using 250 mL of solution revealed significant morphological and elemental changes on the B-AC surface before and after adsorption. Prior to adsorption (Figure 5a,d), B-AC exhibited a highly porous structure. After 120 min of AMX adsorption (Figure 5b,e), the SEM images showed considerable pore filling, resulting in reduced pore visibility on the activated carbon surface [36]. In contrast, following SMX adsorption (Figure 5c,f), the surface morphology became noticeably rougher, with SMX molecules appearing to adhere in a needle-like formation [67]. The EDS analysis further indicated a decrease in the elemental contents of oxygen (O), calcium (Ca), and potassium (K), while the carbon (C) content increased compared to the original B-AC. These results confirm the successful adsorption of AMX and SMX onto the B-AC surface.
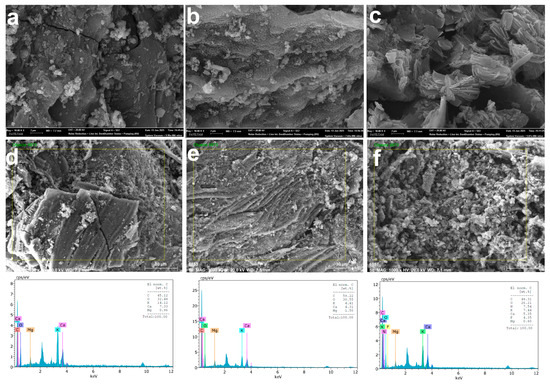
Figure 5.
SEM (a) and EDS analyses (b) of B-AC as the control group; SEM (c) and EDS analyses (d) of the results of 120 min of AMX; and SEM (e) and EDS analyses (f) of SMX adsorption after 120 min. The fluorine (F) element appearing in the EDS analysis for SMX is thought to be due to contamination.
The FTIR spectra of pristine B-AC and the samples after the adsorption of AMX and SMX are presented in Figure 6. The characteristic peaks and their shifts offer valuable insights into the functional groups involved in the adsorption process. The spectra of the original B-AC, AMX-loaded, and SMX-loaded samples in the region of 4000–1650 cm−1 exhibit similar baseline trends, indicating the preservation of the main carbon framework after adsorption. The small peaks observed between 2920 and 2840 cm−1 are attributed to the asymmetric and symmetric stretching vibrations of aliphatic C–H bonds, commonly arising from –CH2 and –CH3 groups. These bands suggest the presence of hydrocarbon chains associated with the activated carbon structure [68]. For SMX, the bands observed at approximately 1650 and 1540 cm−1 can be associated with aromatic C=C stretching vibrations, although these may also overlap with N–H bending or amide-related modes, depending on the molecular environment [69]. Additionally, the band at 1622 cm−1 may correspond to conjugated C=O stretching, possibly from carboxylic or amide groups, indicating interactions with oxygen-containing functionalities on the B-AC surface. The band observed at 1377 cm−1 in the B-AC and AMX spectra may be related to the C–H bending vibrations of methyl groups or the symmetric stretching of NO2 groups rather than directly to C=C stretching [70]. In the case of SMX adsorption, distinct bands were also observed: 1619 cm−1, which may correspond to C=C or C–N stretching vibrations; 1480 cm−1, associated with S=O asymmetric stretching (from sulfonamide groups); 1250 cm−1, attributed to sulfoxide functional groups; and a peak at 955 cm−1, related to O–H out-of-plane bending vibrations [67]. These spectral features indicate specific interactions between the sulfonamide structure of SMX and the surface functional groups of B-AC.
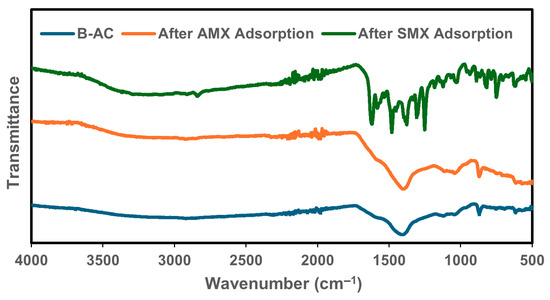
Figure 6.
FTIR full spectra for B-AC before adsorption and after AMX and SMX absorption.
3.2. Adsorption Performance of Synthesized ACs
The adsorption capacities of activated carbons (ACs) derived from coffee grounds (CG-AC), coffee skin (CS-AC), bamboo (B-AC), and palm leaves (PL-AC) were evaluated using amoxicillin (AMX) and sulfamethoxazole (SMX) as model pollutants. Experiments were conducted under optimized conditions using 25 mg of AC and antibiotic solutions ranging from 10 to 250 mg/L.
Adsorption isotherms on adsorbents for AMX and SMX can be seen in Figure 7a and 7b, respectively. As summarized in Table 1, the B-AC exhibited the highest adsorption capacities, reaching 180.3 mg/g for AMX and 145.7 mg/g for SMX. SEM results corroborate the porosity trends identified in BET analysis. The microstructure of B-AC has a positive effect on thermal stability and conductivity, as well as antibiotic adsorption performance. CG-AC followed with 115.3 mg/g for AMX and 95.3 mg/g for SMX. CS-AC and PL-AC showed relatively moderate adsorption capacities (~73–88 mg/g range), in agreement with their surface area values.
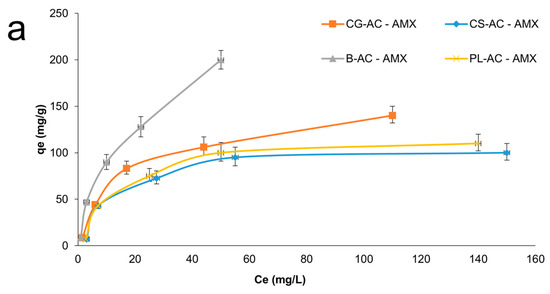
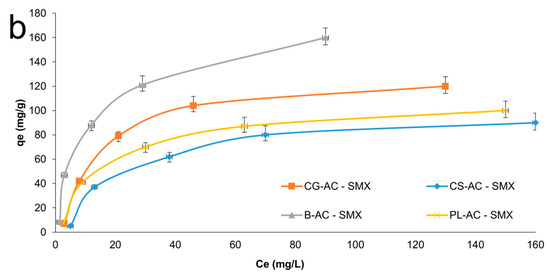
Figure 7.
Adsorption isotherms for AMX (a) and SMX (b) onto adsorbents.
When compared to literature values obtained with the same raw materials, the results support the efficiency of the activation strategy used in this study (KOH + ZnCl2). For instance, CG-AC activated with H3PO4, or ZnCl2 alone reached adsorption capacities of 333 mg/g for methyl orange (MO) and 279.3 mg/g for bentazone (BE), respectively [57,71]. Similarly, B-ACs have previously shown exceptional performance for dye and gas adsorption (e.g., 811.2–850.4 mg/g for methylene blue, 3.4 mmol/g for CO2) [13,72]. PL-ACs exhibited more variable results in literature, with adsorption capacities ranging from 53.25 to 91.32 mg/g, depending on the activation agent [24,73]. These findings affirm the competitive performance of the ACs synthesized in this study, particularly for pharmaceutical pollutant removal, and align well with or outperform previous results using similar biomass sources.

Table 1.
Amounts of adsorbed antibiotics obtained in this study and examples of literature studies with the same starting materials.
Table 1.
Amounts of adsorbed antibiotics obtained in this study and examples of literature studies with the same starting materials.
| Activation Agent | Surface Area (m2/g) | Adsorbed Waste | Adsorption Capacity (mg/g) | Reference | |
|---|---|---|---|---|---|
| CG | KOH + ZnCl2 | 650 | AMX | 115.3 | This study |
| SMX | 95.3 | ||||
| H3PO4 | 520.4 | MO 1 | 333 | [71] | |
| ZnCl2 | 564.366 | BE 2 | 279.33 | [57] | |
| CS | KOH + ZnCl2 | 550 | AMX | 83.3 | This study |
| SMX | 73.3 | ||||
| KOH | 743.791 | MB 3 | 314.05 | [62] | |
| NaOH | 383 | Ni(II) | 57.14 | [74] | |
| B | KOH + ZnCl2 | 860 | AMX | 180.3 | This study |
| SMX | 145.7 | ||||
| KOH | 1281.7–1532.8 | MB 3 | 811.2–850.4 | [13] | |
| CO2 | 1496 | CO2 | 3.4 (mmol/g) | [72] | |
| PL | KOH + ZnCl2 | 550 | AMX | 88.2 | This study |
| SMX | 78.1 | ||||
| KOH | 540 | PCT 4 | 70.85–91.32 | [24] | |
| CaCl2 | 22.113 | I 5 | 53.25 | [73] |
1 Methyl orange dyes, 2 bentazone, 3 methylene blue dyes, 4 paracetamol, 5 iodine.
3.3. Adsorption Equilibrium and Isotherm Models
The adsorption behavior of AMX and SMX onto ACs derived from CG-AC, CS-AC, B-AC, and PL-AC was investigated using six different isotherm models: Langmuir, Freundlich, Dubinin–Radushkevich (D–R), Temkin, Flory–Huggins, and Brunauer–Emmett–Teller (BET). The isotherm constants and fit parameters obtained from the linearized forms of each model are summarized in Table 2.
Table 2.
Isotherm constants of models for AMX and SMX adsorption onto adsorbents.
Among the tested models, the Langmuir isotherm yielded the highest correlation coefficient (R2) values, particularly CG-AC (0.9880) and PL-AC (0.9480), suggesting that the adsorption process follows monolayer coverage on a homogeneous surface. The maximum monolayer adsorption capacities (Q0) were determined as 292.6 mg/g for B-AC, 166.8 mg/g for CG-AC, 133.4 mg/g for PL-AC, and 119.7 mg/g for CS-AC, indicating that B-AC possesses the highest adsorption capacity for AMX. Moreover, the low Chi-square (χ2) values reinforce the adequacy of the Langmuir model in describing the adsorption equilibrium. It also provided good fits for the adsorption of SMX onto B-AC (R2 = 0.9462) and PL-AC (R2 = 0.9761), suggesting that monolayer adsorption predominates, particularly on these adsorbents. The maximum adsorption capacities (Q0) for SMX were highest for B-AC (195.7 mg/g), followed by CG-AC (156.9 mg/g), CS-AC (137.9 mg/g), and PL-AC (119.4 mg/g). The relatively low χ2 values further confirm the applicability of the Langmuir model, especially for B-AC and PL-AC.
The Freundlich model provided moderate fits for AMX compared to Langmuir, with the highest R2 observed for B-AC (0.9261). The Freundlich constants (nF) were greater than 1 for all adsorbents, confirming favorable adsorption processes. However, the relatively lower R2 values imply that surface heterogeneity is less influential than the uniform surface assumption proposed by the Langmuir model. For SMX, the model exhibited lower R2 values compared to Langmuir, ranging between 0.8079 and 0.8469 across the adsorbents. Although the nF values remained above 1, indicating favorable adsorption, the moderate R2 suggests that surface heterogeneity effects are present but less dominant.
The Dubinin–Radushkevich (D–R) model also demonstrated high R2 values for AMX, particularly for CS-AC (0.9847) and PL-AC (0.9691), suggesting that micropore filling mechanisms contribute to the adsorption process. The mean adsorption energy (E) values were below 8 kJ/mol for all materials, indicating that physical adsorption predominates in the AMX uptake by these ACs. It produced excellent fits for all adsorbents, with R2 values exceeding 0.95, notably for CS-AC (0.9783) and B-AC (0.9722) for SMX. This implies a dominant contribution of micropore filling in the adsorption mechanism. Furthermore, Es were all below 1 kJ/mol (0.1934–0.5462 kJ/mol), confirming that the adsorption of SMX occurs through physical interactions.
The Temkin model provided excellent fits for CG-AC (R2 = 0.9952) and strong fits for PL-AC (R2 = 0.9703) for AMX. The heat of adsorption constants (bTE) was moderate, supporting the conclusion that the adsorption involves physical forces rather than strong chemical bonding. The linear decrease in adsorption energy with increasing surface coverage, as assumed by Temkin, appears applicable to these systems. For SMX, the model also resulted in very high R2 values for all adsorbents, particularly for B-AC (0.9932) and PL-AC (0.9904), implying that the heat of adsorption decreases linearly with surface coverage. The bTE values support the conclusion that weak physical interactions govern the adsorption process.
In contrast, the Flory–Huggins model resulted in poor fits, with R2 values below 0.64 for AMX and 0.57 for SMX. The negative Chi-square values further highlight the inadequacy of this model for describing AMX and SMX adsorption onto the selected ACs and indicate the model’s inapplicability for modeling AMX and SMX adsorption onto these carbons.
Similarly, the BET model displayed extremely low R2 values and high deviations, indicating that multilayer adsorption mechanisms are negligible for AMX removal in the studied systems. Although high theoretical monolayer capacities (qs) were calculated (e.g., 391.9 mg/g for CG-AC), the low correlations suggest that these values are not reliable within the BET framework. In addition, the BET model showed extremely low R2 values (close to zero) and high deviations, demonstrating that multilayer adsorption is not a prevailing mechanism for SMX adsorption. Despite a relatively high theoretical qs value calculated for B-AC (258.12 mg/g), the poor fit suggests unreliable modeling by BET.
Overall, the adsorption of AMX onto CG-AC, CS-AC, B-AC, and PL-AC is best described by the Langmuir isotherm, indicating monolayer physical adsorption on homogeneous surfaces. B-AC exhibited the highest adsorption capacity among the adsorbents tested. The energy parameters and isotherm fittings consistently point towards physical adsorption mechanisms. Thus, B-AC appears to be the most promising material for AMX removal under the conditions studied. Parallel with these results, Abbas et al. [36], Limousi et al. [60], and Moussavi et al. [35], in their studies of AMX adsorption with AC, stated that based on the R2 criterion, the appropriate model for interpreting the data at equilibrium was described by the Langmuir isotherm.
The adsorption of SMX onto the studied ACs is best described by the Langmuir and D–R isotherm models, indicating a combination of monolayer adsorption on homogeneous surfaces and micropore filling mechanisms. B-AC once again demonstrated the highest adsorption capacity for SMX among the tested adsorbents. The energy analysis consistently indicated physical adsorption processes, aligning with the findings obtained for AMX. Wang et al. [38] evaluated the effectiveness in adsorbing the widely used organic contaminant SMX from water with synthesized AC with ZrO2/Fe3O4. The results indicated that the adsorption behavior was best characterized by the Langmuir isotherm. Ahmed et al. [75], in their study on the single and competitive sorption of sulfamethazine, sulfamethoxazole, and sulfathiazole on functionalized biochar, stated that the equilibrium data were well represented by Langmuir and Freundlich models for single solutes and the Langmuir model for competitive solutes. Li et al. [76] evaluated the removal ability of sulfamethoxazole (SMX) from aqueous solutions by biochar derived from rice straw (RS) and alligator flag (AF). The results showed that the sorption of SMX by biochar was well described using the Langmuir equation.
The BET and Flory–Huggins models showed poor fitting with extremely low R2 values (Table 2), indicating that these models are not suitable for describing the adsorption behavior of AMX and SMX onto B-AC. The poor fit of the BET model reinforces the absence of multilayer adsorption, consistent with a monolayer physisorption mechanism, which aligns with the dominance of monolayer coverage supported by the Langmuir model. Similarly, the poor fit of the Flory–Huggins model may imply that the adsorption mechanism does not follow a partitioning or surface coverage process typically assumed in polymer or heterogeneous adsorption systems. These results collectively confirm that the adsorption takes place primarily via monolayer physisorption on a relatively homogeneous surface.
3.4. Results of Kinetic Studies
Kinetic studies to clarify the adsorption mechanism were conducted using batch adsorption data obtained at different initial concentrations (25, 100, and 250 mg/L) and contact times ranging from 15 to 180 min, as seen in Figure 8. Adsorption kinetics provide crucial insights into the rate-controlling steps and potential adsorption mechanisms. In this context, the experimental data were analyzed using commonly employed kinetic models, including the pseudo-first-order (PFO) and pseudo-second-order (PSO) models. The fit of each model was assessed by calculating the regression coefficients (R2), and model parameters were extracted to interpret the nature of AMX and SMX uptake by B-AC. The kinetic behaviors of both AMX and SMX were explored to determine whether adsorption followed physisorption or chemisorption pathways and to identify any diffusion-related limitations during the adsorption process. Table 3 displays the kinetic constants that were calculated to describe the adsorption behavior.
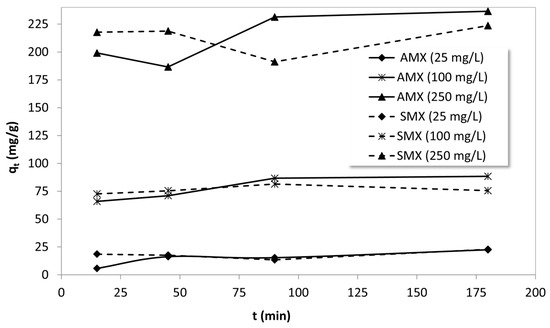
Figure 8.
The effect of contact time on the adsorption of AMX and SMX onto B-AC.
Table 3.
Kinetic parameters at different concentrations of AMX and SMX onto B-AC.
For AMX, the PSO model provided a better fit at low and moderate concentrations, especially at 25 mg/L (R2 = 0.886) and 100 mg/L (R2 = 0.797), indicating that chemisorption may be the rate-controlling step under these conditions. The calculated adsorption capacity values from the model (26.68 and 89.40 mg/g) were closer to the experimental values, further supporting this inference. However, at 250 mg/L, both models yielded poor fits (R2 < 0.2), suggesting that at high concentrations, the adsorption process may be influenced by more complex mechanisms such as multilayer formation, pore diffusion limitations, or adsorbent saturation. In contrast, SMX adsorption data showed poor correlation with both models across all concentrations, as evidenced by the extremely low R2 values. These low correlations indicate that SMX adsorption onto B-AC may follow a more complex, non-ideal kinetic pathway. The inconsistency and unexpected trends in kinetic constants may indicate that the adsorption mechanism for SMX is more heterogeneous and likely governed by a combination of processes such as surface heterogeneity, intra-particle diffusion, or possible desorption/resorption events during the experiment [77,78].
3.5. Results of Thermodynamic Studies
The standard Gibbs free energy change (ΔG°), enthalpy change (ΔH°), and entropy change (ΔS°) were calculated using the van’t Hoff equation, and the results are summarized in Table 4 and Figure 9.
Table 4.
Thermodynamic parameters for adsorption of AMX and SMX onto B-AC.
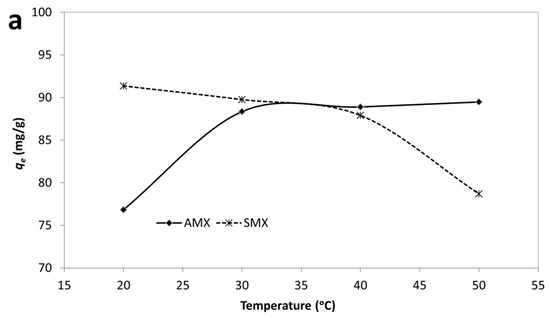
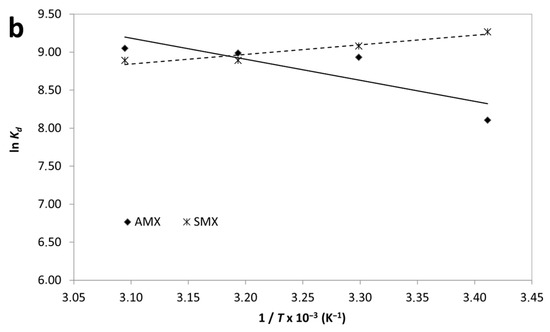
Figure 9.
Effect of temperature (a) and van’t Hoff plot (b) for adsorption of AMX and SMX onto B-AC.
According to results, the negative values of ΔG° for both AMX and SMX across all studied temperatures confirm that the adsorption processes are spontaneous in nature. Notably, the ΔG° values become more negative with increasing temperature, particularly for AMX, indicating that higher temperatures enhance the adsorption spontaneity. The adsorption of AMX was characterized by a positive enthalpy change (ΔH° = +23.08 kJ/mol) and a significant positive entropy change (ΔS° = 147.9 J/mol·K), suggesting that the process is endothermic and driven by an increase in randomness at the solid–liquid interface. This behavior suggests that the endothermic nature of antibiotic adsorption may be attributed to strong solute–adsorbent interactions and possible structural rearrangements within the adsorbent matrix. In contrast, SMX adsorption exhibited a negative enthalpy change (ΔH° = –10.44 kJ/mol) and a moderate positive entropy change (ΔS° =41.17 J/mol·K), indicating an exothermic but still spontaneous process. The moderate increase in entropy suggests that desolvation of SMX molecules and reorganization at the B-AC surface contributed to the observed thermodynamics. Furthermore, the enthalpy values for both adsorbates fall within the range generally associated with physisorption (<40 kJ/mol), supporting the earlier isotherm findings which suggested monolayer physical adsorption as the dominant mechanism. The higher ΔS° value for AMX compared to SMX may be indicative of a greater degree of molecular freedom or more extensive displacement of water molecules during adsorption. In short, thermodynamic data confirm that the adsorption of AMX is endothermic and entropy-driven, whereas SMX adsorption is exothermic but also thermodynamically favorable. These differences can be attributed to variations in molecular structure and interactions with the B-AC surface.
4. Conclusions
In this study, activated carbon (AC) materials were successfully synthesized from various food and agricultural wastes—namely coffee grounds, coffee skin, bamboo, and palm leaves—via combined KOH and ZnCl2 activation, and their performance in the adsorption of two common antibiotics, amoxicillin (AMX) and sulfamethoxazole (SMX), was evaluated.
Among the materials, bamboo-derived activated carbon (B-AC) demonstrated the most favorable properties, including the highest BET surface area (860 m2/g), thermal stability (855 °C), electrical conductivity (0.063 S/cm), and adsorption capacities (292.6 mg/g for AMX and 195.7 mg/g for SMX). SEM and EDS analyses confirmed successful antibiotic adsorption through observable changes in surface morphology and elemental composition, while FTIR spectra indicated specific interactions between the antibiotics and oxygen-containing surface functional group.
Isotherm modeling revealed that the Langmuir and Dubinin–Radushkevich models best described the adsorption process, suggesting monolayer physical adsorption dominated by micropore filling. In contrast, the poor fitting of the BET and Flory–Huggins models highlighted the absence of multilayer or partition-based mechanisms, further confirming the dominance of physisorption. Kinetic analysis showed that AMX adsorption followed the pseudo-second-order model, particularly at lower concentrations, implying chemisorption involvement, whereas SMX adsorption displayed more complex and heterogeneous kinetic behavior. Thermodynamic analysis verified that both adsorption processes were spontaneous, with AMX exhibiting endothermic and entropy-driven characteristics and SMX showing an exothermic yet favorable mechanism. The relatively low enthalpy values (<40 kJ/mol) supported the conclusion that both processes are governed by physisorption.
Overall, the study demonstrated that B-AC, due to its high adsorption capacity, structural stability, and cost-effective production from biomass waste, is a promising and sustainable material for the removal of pharmaceutical contaminants from aqueous environments. A comparative analysis with literature further confirmed that both the activation method and the biomass source significantly influence adsorbent performance. Future research should explore the effectiveness of B-AC in real or synthetic wastewater systems to validate its practical applicability under more complex environmental conditions.
Funding
This research is partially based on the works of the FOOD CHASE project co-funded by the European Union and European Education and Culture Executive Agency (EACEA) (grant number 101140250—ERASMUS-EDU-2023-PI-ALL-INNO). Views and opinions expressed are, however, those of the authors only and do not necessarily reflect those of the European Union or the European Education and Culture Executive Agency (EACEA). Neither the European Union nor EACEA can be held responsible for them.
Data Availability Statement
The data that support the findings of this study are available from the corresponding author upon reasonable request.
Acknowledgments
The author would like to thank Cem Gök, from the Department of Biomedical Engineering, Izmir Bakırçay University, Izmir, Türkiye, for his technical support and for his contribution to the evaluation of the application results of the isotherm models.
Conflicts of Interest
Author Arzum Işıtan was employed by the company Bilgece Mühendislik Geri Dönüşüm Ltd. Şti. The Bilgece Mühendislik Geri Dönüşüm Ltd. Şti. had no role in the design of the study; in the collection, analyses, or interpretation of data; in the writing of the manuscript, or in the decision to publish the results.
References
- Zielińska, M.; Bułkowska, K. Agricultural Wastes and Their By-Products for the Energy Market. Energies 2024, 17, 2099. [Google Scholar] [CrossRef]
- Arora, J.; Ramawat, K.G.; Mérillon, J.-M. Disposal of Agricultural Waste and Its Effects on the Environment, Production of Useful Metabolites and Energy: Potential and Challenges. In Environmental Impact, Useful Metabolites and Energy Production; Springer Nature: Singapore, 2023; pp. 3–20. [Google Scholar] [CrossRef]
- Koul, B.; Yakoob, M.; Shah, M.P. Agricultural Waste Management Strategies for Environmental Sustainability. Environ. Res. 2022, 206, 112285. [Google Scholar] [CrossRef]
- Awogbemi, O.; Kallon, D.V. Von Pretreatment Techniques for Agricultural Waste. Case Stud. Chem. Environ. Eng. 2022, 6, 100229. [Google Scholar] [CrossRef]
- Food and Agriculture Organization of the United Nations (FAO). The State of Food and Agriculture 2019—Moving Forward on Food Loss and Waste Reduction; FAO: Rome, Italy, 2019. [Google Scholar]
- EUROSTAT Food Waste and Food Waste Prevention—Estimates. Available online: https://ec.europa.eu/eurostat/statistics-explained/index.php?title=Food_waste_and_food_waste_prevention_-_estimates (accessed on 13 December 2024).
- European Commission Food Waste. Available online: https://food.ec.europa.eu/food-safety/food-waste_en (accessed on 13 December 2024).
- European Commission Circular Economy Action Plan. Available online: https://environment.ec.europa.eu/strategy/circular-economy-action-plan_en (accessed on 13 December 2024).
- Zabaniotou, A.; Kamaterou, P. Food Waste Valorization Advocating Circular Bioeconomy—A Critical Review of Potentialities and Perspectives of Spent Coffee Grounds Biorefinery. J. Clean. Prod. 2019, 211, 1553–1566. [Google Scholar] [CrossRef]
- Gallego-García, M.; Moreno, A.D.; Manzanares, P.; Negro, M.J.; Duque, A. Recent Advances on Physical Technologies for the Pretreatment of Food Waste and Lignocellulosic Residues. Bioresour. Technol. 2023, 369, 128397. [Google Scholar] [CrossRef]
- Ukanwa, K.S.; Patchigolla, K.; Sakrabani, R.; Anthony, E.; Mandavgane, S. A Review of Chemicals to Produce Activated Carbon from Agricultural Waste Biomass. Sustainability 2019, 11, 6204. [Google Scholar] [CrossRef]
- Gupta, V.K.; Ali, I. Environmental Water: Advances in Treatment, Remediation and Recycling, 1st ed.; Elsevier: Amsterdam, The Netherlands, 2013; ISBN 0444593993. [Google Scholar]
- Hirunpraditkoon, S.; Tunthong, N.; Ruangchai, A.; Nuithitikul, K. Adsorption Capacities of Activated Carbons Prepared from Bamboo by KOH Activation. World Acad. Sci. Eng. Technol. 2011, 78, 711–715. [Google Scholar]
- Nedjai, R.; Kabbashi, N.A.; Alam, M.Z.; Al-Khatib, M.F.R. Production and Characterization of Activated Carbon from Baobab Fruit Shells by Chemical Activation Using ZnCl2, H3PO4 and KOH. J. Phys. Conf. Ser. 2021, 2129, 012009. [Google Scholar] [CrossRef]
- He, X.; Zhang, T.; Xue, Q.; Zhou, Y.; Wang, H.; Bolan, N.S.; Jiang, R.; Tsang, D.C.W. Enhanced Adsorption of Cu(II) and Zn(II) from Aqueous Solution by Polyethyleneimine Modified Straw Hydrochar. Sci. Total Environ. 2021, 778, 146116. [Google Scholar] [CrossRef]
- Liu, G.; Xu, Q.; Abou-Elwafa, S.F.; Alshehri, M.A.; Zhang, T. Hydrothermal Carbonization Technology for Wastewater Treatment under the “Dual Carbon” Goals: Current Status, Trends, and Challenges. Water 2024, 16, 1749. [Google Scholar] [CrossRef]
- Hesas, R.H.; Daud, W.M.A.W.; Sahu, J.N.; Arami-Niya, A. The Effects of a Microwave Heating Method on the Production of Activated Carbon from Agricultural Waste: A Review. J. Anal. Appl. Pyrolysis 2013, 100, 1–11. [Google Scholar] [CrossRef]
- González-García, P. Activated Carbon from Lignocellulosics Precursors: A Review of the Synthesis Methods, Characterization Techniques and Applications. Renew. Sustain. Energy Rev. 2018, 82, 1393–1414. [Google Scholar] [CrossRef]
- Lua, A.C.; Yang, T. Effects of Vacuum Pyrolysis Conditions on the Characteristics of Activated Carbons Derived from Pistachio-Nut Shells. J. Colloid Interface Sci. 2004, 276, 364–372. [Google Scholar] [CrossRef] [PubMed]
- Murthy, P.S.; Madhava Naidu, M. Sustainable Management of Coffee Industry By-Products and Value Addition—A Review. Resour. Conserv. Recycl. 2012, 66, 45–58. [Google Scholar] [CrossRef]
- Oliveira, L.S.; Franca, A.S. An Overview of the Potential Uses for Coffee Husks. In Coffee in Health and Disease Prevention; Academic Press: Cambridge, MA, USA, 2015; pp. 283–291. [Google Scholar] [CrossRef]
- Jutakridsada, P.; Prajaksud, C.; Kuboonya-Aruk, L.; Theerakulpisut, S.; Kamwilaisak, K. Adsorption Characteristics of Activated Carbon Prepared from Spent Ground Coffee. Clean Technol. Environ. Policy 2016, 18, 639–645. [Google Scholar] [CrossRef]
- Wang, Y.X.; Ngo, H.H.; Guo, W.S. Preparation of a Specific Bamboo Based Activated Carbon and Its Application for Ciprofloxacin Removal. Sci. Total Environ. 2015, 533, 32–39. [Google Scholar] [CrossRef]
- Islam, M.A.; Nazal, M.K.; Akinpelu, A.A.; Sajid, M.; Alhussain, N.A.; Ilyas, M. High Performance Adsorptive Removal of Emerging Contaminant Paracetamol Using a Sustainable Biobased Mesoporous Activated Carbon Prepared from Palm Leaves Waste. J. Anal. Appl. Pyrolysis 2024, 180, 106546. [Google Scholar] [CrossRef]
- Rabbani, Y.; Shayesteh, H.; Haghshenas, N.; Safarzadeh Khosrowshahi, M. Investigation of Grafting Silane Coupling Agents on Superhydrophobicity of Carbonyl Iron/SiO2 Particles for Efficient Oil/Water Mixture and Emulsion Separation. Sci. Rep. 2023, 13, 788. [Google Scholar] [CrossRef]
- Shayesteh, H.; Khosrowshahi, M.S.; Mashhadimoslem, H.; Maleki, F.; Rabbani, Y.; Emrooz, H.B.M. Durable Superhydrophobic/Superoleophilic Melamine Foam Based on Biomass-Derived Porous Carbon and Multi-Walled Carbon Nanotube for Oil/Water Separation. Sci. Rep. 2023, 13, 4515. [Google Scholar] [CrossRef]
- Rabbani, Y.; Shariaty-Niassar, M.; Ebrahimi, S.A.S. The Effect of Superhydrophobicity of Prickly Shape Carbonyl Iron Particles on the Oil-Water Adsorption. Ceram. Int. 2021, 47, 28400–28410. [Google Scholar] [CrossRef]
- Zhang, X.; Guo, W.; Ngo, H.H.; Wen, H.; Li, N.; Wu, W. Performance Evaluation of Powdered Activated Carbon for Removing 28 Types of Antibiotics from Water. J. Environ. Manag. 2016, 172, 193–200. [Google Scholar] [CrossRef]
- Yahya, M.A.; Al-Qodah, Z.; Ngah, C.W.Z. Agricultural Bio-Waste Materials as Potential Sustainable Precursors Used for Activated Carbon Production: A Review. Renew. Sustain. Energy Rev. 2015, 46, 218–235. [Google Scholar] [CrossRef]
- European Commission DG Environment News Alert Service. “Science for Environment Policy”: European Commission DG Environment News Alert Service; The Science Communication Unit; The University of the West of England: Bristol, UK, 2023; Available online: https://environment.ec.europa.eu/news/growing-number-studies-detect-antibiotics-medicines-and-caffeine-groundwater-2023-03-08_en (accessed on 6 January 2025).
- European Commission EU Action on Antimicrobial Resistance—Council Recommendation on Stepping up EU Actions to Combat Antimicrobial Resistance in a One Health Approach 2023/C 220/01/9581/2023/INIT. Available online: https://health.ec.europa.eu/antimicrobial-resistance/eu-action-antimicrobial-resistance_en (accessed on 6 January 2025).
- The National Center for Biotechnology Information Amoxicillin. Available online: https://pubchem.ncbi.nlm.nih.gov/compound/33613 (accessed on 14 December 2024).
- The National Center for Biotechnology Information Sulfamethoxazole. Available online: https://pubchem.ncbi.nlm.nih.gov/compound/Sulfamethoxazole (accessed on 14 December 2024).
- Definitive Healthcare What Were the Most Prescribed Antibiotics of 2023? Available online: https://www.definitivehc.com/resources/healthcare-insights/most-prescribed-antibiotics (accessed on 10 May 2025).
- Moussavi, G.; Alahabadi, A.; Yaghmaeian, K.; Eskandari, M. Preparation, Characterization and Adsorption Potential of the NH4Cl-Induced Activated Carbon for the Removal of Amoxicillin Antibiotic from Water. Chem. Eng. J. 2013, 217, 119–128. [Google Scholar] [CrossRef]
- Abbas, M.; Trari, M. Removal of Amoxicillin from Wastewater onto Activated Carbon: Optimization of Analytical Parameters by Response Surface Methodology. Dose-Response Int. J. 2024, 22, 15593258241271655. [Google Scholar] [CrossRef] [PubMed]
- Zeng, Q.; Chen, K.; Huang, X.; Luo, S.; Wang, X.; Luo, D.; Gao, J.; Li, Y.; Huang, W.; Chen, C. Competitive Adsorption of Oxytetracycline and Sulfamethoxazole by Nanosized Activated Carbon in Aquatic Environments: Experimental Analysis and DFT Calculations. Chem. Eng. J. 2024, 499, 156375. [Google Scholar] [CrossRef]
- Wang, J.; Guo, L.; Xu, Z.; Chang, Q.; Xie, T.; Deng, S.; Li, X.; Zhang, L.; Li, K.; Zhu, G. Supporting Binary Metal-Organic Framework Derivatives within Wood-Based Activated Carbon Boosts Rapid Adsorption of Sulfamethoxazole from Aqueous Solutions. Colloids Surf. A Physicochem. Eng. Asp. 2025, 710, 136262. [Google Scholar] [CrossRef]
- Colakoglu, T.; Oral, A.E.; Aytas, S.; Yusan, S.; Kaptanoglu, I.G.; Gok, C.; Yoho, M.D. Preparation of New Alginate Capsules Enclosing Diatomite and Organic Extractants to Uptake Lanthanum. Hydrometallurgy 2023, 222, 106158. [Google Scholar] [CrossRef]
- Degirmenci, M.; Bulduk, I.; Akbel, E. Adsorptive Removal of Anticarcinogen Pazopanib from Aqueous Solutions Using Activated Carbon: Isotherm, Kinetic and Thermodynamic Studies. Sci. Rep. 2024, 14, 17765. [Google Scholar] [CrossRef]
- Gök, C. Equilibrium, Kinetic and Thermodynamic Studies of Europium Adsorption by Biopolymeric Composite. Int. J. Chem. Eng. Appl. 2017, 8, 334–339. [Google Scholar] [CrossRef][Green Version]
- Langmuir, I. The Adsorption of Gases on Plane Surfaces of Glass, Mica and Platinum. J. Am. Chem. Soc. 1918, 40, 1361–1403. [Google Scholar] [CrossRef]
- Gök, C.; Aytas, S.; Sezer, H. Modeling Uranium Biosorption by Cystoseira sp. and Application Studies. Sep. Sci. Technol. 2017, 52, 792–803. [Google Scholar] [CrossRef]
- Freundlich, H. Über Die Adsorption in Lösungen. Z. Für Phys. Chem. 1907, 57U, 385–470. [Google Scholar] [CrossRef]
- Dubinin, M.M.; Radushkevich, L.W. Equation of the Characteristic Curve of Activated Charcoal. Proc. Acad. Sci. USSR Phys. Chem. Sect. 1974, 55, 331–333. [Google Scholar]
- Temkin, M.I. Kinetics of Ammonia Synthesis on Promoted Iron Catalysts. Acta Physiochim. URSS 1940, 12, 327–356. [Google Scholar]
- Flory, P.J. Thermodynamics of High Polymer Solutions. J. Chem. Phys. 1942, 10, 51–61. [Google Scholar] [CrossRef]
- Ringot, D.; Lerzy, B.; Chaplain, K.; Bonhoure, J.P.; Auclair, E.; Larondelle, Y. In Vitro Biosorption of Ochratoxin A on the Yeast Industry By-Products: Comparison of Isotherm Models. Bioresour. Technol. 2007, 98, 1812–1821. [Google Scholar] [CrossRef] [PubMed]
- Brunauer, S.; Emmett, P.H.; Teller, E. Adsorption of Gases in Multimolecular Layers. J. Am. Chem. Soc. 1938, 60, 309–319. [Google Scholar] [CrossRef]
- Shikuku, V.O.; Jemutai-Kimosop, S. Efficient Removal of Sulfamethoxazole onto Sugarcane Bagasse-Derived Biochar: Two and Three-Parameter Isotherms, Kinetics and Thermodynamics. S. Afr. J. Chem. 2020, 73, 111–119. [Google Scholar]
- Jafari, K.; Heidari, M.; Fatehizadeh, A.; Dindarloo, K.; Alipour, V.; Rahmanian, O. Extensive Sorption of Amoxicillin by Highly Efficient Carbon-Based Adsorbent from Palm Kernel: Artificial Neural Network Modeling. Heliyon 2023, 9, e18635. [Google Scholar] [CrossRef]
- United Nations Department of Economic and Social Affairs. The 17 Goals|Sustainable Development. Available online: https://sdgs.un.org/goals (accessed on 6 January 2025).
- EC-European Commission. The European Green Deal; The European Commission: Brussels, Belgium, 2019. [Google Scholar]
- EC-European Commission. A New Circular Economy Action Plan for a Cleaner and More Competitive Europe; The European Commission: Brussels, Belgium, 2020. [Google Scholar]
- Food Supply-Chain Ecosystems for Sustainability Food Chase. Available online: https://foodchase.eu/ (accessed on 6 January 2025).
- Ardianti, A.; Faila, R.N. Characterization of Salak Wedi Activated Carbon Structure Using KOH and ZnCl2 Activator. Rotor 2023, 16, 1. [Google Scholar] [CrossRef]
- da Silva Rocha, B.C.; de Moraes, L.E.Z.; Santo, D.E.; Peron, A.P.; de Souza, D.C.; Bona, E.; Valarini, O. Removal of Bentazone Using Activated Carbon from Spent Coffee Grounds. J. Chem. Technol. Biotechnol. 2024, 99, 1342–1355. [Google Scholar] [CrossRef]
- Sirichaibhinyo, T.; Supchocksoonthorn, P.; Paoprasert, P.; Ummartyotin, S. The Electrical Conductivity of a Bacterial Cellulose and Polyaniline Composite Significantly Improved by Activated Carbon: A Nano-Based Platform for Electrodes. ChemEngineering 2024, 8, 87. [Google Scholar] [CrossRef]
- Terdputtakun, A.; Arqueropanyo, O.-a.; Sooksamiti, P.; Janhom, S.; Naksata, W. Adsorption Isotherm Models and Error Analysis for Single and Binary Adsorption of Cd(II) and Zn(II) Using Leonardite as Adsorbent. Environ. Earth Sci. 2017, 76, 777. [Google Scholar] [CrossRef]
- Limousy, L.; Ghouma, I.; Ouederni, A.; Jeguirim, M. Amoxicillin Removal from Aqueous Solution Using Activated Carbon Prepared by Chemical Activation of Olive Stone. Environ. Sci. Pollut. Res. 2017, 24, 9993–10004. [Google Scholar] [CrossRef]
- Huggins, M.L. Some Properties of Solutions of Long-Chain Compounds. J. Phys. Chem. 1942, 46, 151–158. [Google Scholar] [CrossRef]
- Tran, T.H.; Le, H.H.; Pham, T.H.; Nguyen, D.T.; La, D.D.; Chang, S.W.; Lee, S.M.; Chung, W.J.; Nguyen, D.D. Comparative Study on Methylene Blue Adsorption Behavior of Coffee Husk-Derived Activated Carbon Materials Prepared Using Hydrothermal and Soaking Methods. J. Environ. Chem. Eng. 2021, 9, 105362. [Google Scholar] [CrossRef]
- Djeridi, W.; Ouederni, A.; Mansour, N.B.; Llewellyn, P.L.; Alyamani, A.; El Mir, L. Effect of the Both Texture and Electrical Properties of Activated Carbon on the CO2 Adsorption Capacity. Mater. Res. Bull. 2016, 73, 130–139. [Google Scholar] [CrossRef]
- Adinaveen, T.; Vijaya, J.J.; Kennedy, L.J. Comparative Study of Electrical Conductivity on Activated Carbons Prepared from Various Cellulose Materials. Arab. J. Sci. Eng. 2016, 41, 55–65. [Google Scholar] [CrossRef]
- Guo, J.; Song, Y.; Ji, X.; Ji, L.; Cai, L.; Wang, Y.; Zhang, H.; Song, W. Preparation and Characterization of Nanoporous Activated Carbon Derived from Prawn Shell and Its Application for Removal of Heavy Metal Ions. Materials 2019, 12, 241. [Google Scholar] [CrossRef]
- Jain, A.; Tripathi, S.K. Nano-Porous Activated Carbon from Sugarcane Waste for Supercapacitor Application. J. Energy Storage 2015, 4, 121–127. [Google Scholar] [CrossRef]
- Elkomy, A.S.; Abdel-Wahab, M.S.; Shehata, N. A Comparison between Adsorption and Photocatalytic Degradation for the Management of Sulfamethoxazole in Water. Sci. Rep. 2025, 15, 13576. [Google Scholar] [CrossRef]
- Liu, Y.; Liu, X.; Dong, W.; Zhang, L.; Kong, Q.; Wang, W. Efficient Adsorption of Sulfamethazine onto Modified Activated Carbon: A Plausible Adsorption Mechanism. Sci. Rep. 2017, 7, 12437. [Google Scholar] [CrossRef]
- Pimentel, C.H.; Freire, M.S.; Gómez-Díaz, D.; González-Álvarez, J. Preparation of Activated Carbon from Pine (Pinus radiata) Sawdust by Chemical Activation with Zinc Chloride for Wood Dye Adsorption. Biomass Convers. Biorefinery 2023, 13, 16537–16555. [Google Scholar] [CrossRef]
- Mojoudi, N.; Mirghaffari, N.; Soleimani, M.; Shariatmadari, H.; Belver, C.; Bedia, J. Phenol Adsorption on High Microporous Activated Carbons Prepared from Oily Sludge: Equilibrium, Kinetic and Thermodynamic Studies. Sci. Rep. 2019, 9, 19352. [Google Scholar] [CrossRef] [PubMed]
- Tigrine, Z.; Benhabiles, O.; Merabti, L.; Chekir, N.; Mellal, M.; Aoudj, S.; Abdeslam, N.A.; Tassalit, D.; Lebouachera, S.E.I.; Drouiche, N. Sustainable Activated Carbon from Agricultural Waste: A Study on Adsorption Efficiency for Humic Acid and Methyl Orange Dyes. Sustainability 2024, 16, 9308. [Google Scholar] [CrossRef]
- Khuong, D.A.; Nguyen, H.N.; Tsubota, T. Activated Carbon Produced from Bamboo and Solid Residue by CO2 Activation Utilized as CO2 Adsorbents. Biomass Bioenergy 2021, 148, 106039. [Google Scholar] [CrossRef]
- Younes, S.M.; El Dakiky, B.M.; Sadik, E.R. Carbonization, Activation and Description of Activated Carbon from Palm Tree Leaves. Am. J. Anal. Chem 2022, 13, 331–345. [Google Scholar] [CrossRef]
- Rodiguez, M.H.; Yperman, J.; Carleer, R.; Maggen, J.; Daddi, D.; Gryglewicz, G.; Van der Bruggen, B.; Hernández, J.F.; Otero Calvis, A. Adsorption of Ni(II) on Spent Coffee and Coffee Husk Based Activated Carbon. J. Environ. Chem. Eng. 2018, 6, 1161–1170. [Google Scholar] [CrossRef]
- Ahmed, M.B.; Zhou, J.L.; Ngo, H.H.; Guo, W.; Johir, M.A.H.; Sornalingam, K. Single and Competitive Sorption Properties and Mechanism of Functionalized Biochar for Removing Sulfonamide Antibiotics from Water. Chem. Eng. J. 2017, 311, 348–358. [Google Scholar] [CrossRef]
- Li, T.; Han, X.; Liang, C.; Shohag, M.J.I.; Yang, X. Sorption of Sulphamethoxazole by the Biochars Derived from Rice Straw and Alligator Flag. Environ. Technol. 2015, 36, 245–253. [Google Scholar] [CrossRef] [PubMed]
- Gok, C. Neodymium and Samarium Recovery by Magnetic Nano-Hydroxyapatite. J. Radioanal. Nucl. Chem. 2014, 301, 641–651. [Google Scholar] [CrossRef]
- Aouay, F.; Attia, A.; Dammak, L.; Ben Amar, R.; Deratani, A. Activated Carbon Prepared from Waste Coffee Grounds: Characterization and Adsorption Properties of Dyes. Materials 2024, 17, 3078. [Google Scholar] [CrossRef] [PubMed]


Disclaimer/Publisher’s Note: The statements, opinions and data contained in all publications are solely those of the individual author(s) and contributor(s) and not of MDPI and/or the editor(s). MDPI and/or the editor(s) disclaim responsibility for any injury to people or property resulting from any ideas, methods, instructions or products referred to in the content. |
© 2025 by the author. Licensee MDPI, Basel, Switzerland. This article is an open access article distributed under the terms and conditions of the Creative Commons Attribution (CC BY) license (https://creativecommons.org/licenses/by/4.0/).