Article

Hydraulic Fracture Propagation Behavior in Tight Conglomerates and Field Applications

1
China ZhenHua Oil Company Limited, Beijing 100031, China
2
State Key Laboratory of Petroleum Resources and Prospecting, China University of Petroleum, Beijing 102249, China
*
Author to whom correspondence should be addressed.
Processes 2025, 13(8), 2494; https://doi.org/10.3390/pr13082494
Submission received: 16 July 2025 / Revised: 4 August 2025 / Accepted: 6 August 2025 / Published: 7 August 2025
(This article belongs to the Special Issue Structure Optimization and Transport Characteristics of Porous Media)

Abstract

The tight conglomerate oil reservoir in Xinjiang’s Mahu area is situated on the northwestern margin of the Junggar Basin. The reservoir comprises five stacked fan bodies, with the Triassic Baikouquan Formation serving as the primary pay zone. To delineate the study scope and conduct a field validation, the Ma-X well block was selected for investigation. Through triaxial compression tests and large-scale true triaxial hydraulic fracturing simulations, we analyzed the failure mechanisms of tight conglomerates and identified key factors governing hydraulic fracture propagation. The experimental results reveal several important points. (1) Gravel characteristics control failure modes: Larger gravel size and higher content increase inter-gravel stress concentration, promoting gravel crushing under confining pressure. At low-to-medium confining pressures, shear failure primarily occurs within the matrix, forming bypassing fractures around gravel particles. (2) Horizontal stress differential dominates fracture geometry: Fractures preferentially propagate as transverse fractures perpendicular to the wellbore, with stress anisotropy being the primary control factor. (3) Injection rate dictates fracture complexity: Weakly cemented interfaces in conglomerates lead to distinct fracture morphologies—low rates favor interface activation, while high rates enhance penetration through gravels. (4) Stimulation strategy impacts SRV: Multi-cluster perforations show limited effectiveness in enhancing fracture network complexity. In contrast, variable-rate fracturing significantly increases stimulated reservoir volume (SRV) compared to constant-rate methods, as evidenced by microseismic data demonstrating improved interface connectivity and broader fracture coverage.

1. Introduction

The tight conglomerate reservoirs in the Mahu Sag of Xinjiang’s Junggar Basin have been in production for over a decade [1]. Previous studies indicate that the Baikouquan Formation features widespread rock distribution, substantial reservoir burial depth, and significant vertical thickness, exhibiting strong heterogeneity. The reservoir contains diverse pore types, mainly including intragranular dissolution pores, intergranular dissolution pores, primary intergranular pores, and microfractures. Gray sandy conglomerates, sandstones, and pebbly sandstones show relatively well-developed porosity, whereas brown sandy conglomerates have higher clay content and poorly developed reservoir space. The reservoir exhibits low overall permeability due to predominantly narrow and complex throats. Pore-throat configurations are dominated by small pores with fine throats (46.22%) and medium pores with medium throats (30.25%), followed by micro-fine pores with micro-fine throats (15.13%); meanwhile, large pores with coarse throats are rare (8.4%). Thus, the study area is characterized as a tight conglomerate reservoir [2]. Production results confirm hydraulic fracturing as the key technology for conglomerate reservoir development [3,4,5]. Field experience has identified three primary challenges in tight conglomerate fracturing: (1) heterogeneous fracture network propagation; (2) fracture initiation difficulties in specific intervals, resulting in partial reservoir stimulation; and (3) suboptimal production uplift efficiency [6]. Cementation typically falls into two categories: calcareous cementation and argillaceous cementation. Based on the contact patterns between gravel particles, conglomerates can be classified into four types: grain-supported, multi-level grain-supported, grain–matrix-supported, and matrix-supported [7]. The depositional environment and diagenetic processes result in significant microscopic differences in conglomerate structures. The mineral composition and microstructure of conglomerates determine their mechanical characteristics. During hydraulic fracturing, the propagation of hydraulic fractures within the rock is significantly influenced by the rock’s cohesion and internal friction angle [8,9,10,11]. In conventional tight sandstones, the grain size is smaller, the degree of cementation is higher, and the rock is more compact, with smaller variations in mechanical properties among its components. In contrast, tight conglomerates are characterized by larger gravel particles, finer-grained matrix material, and lower overall cementation strength. Through laboratory experiments and field validation, this study investigates hydraulic fracture propagation mechanisms and develops methods for creating complex fracture networks in tight conglomerates, thereby providing theoretical support for the efficient development of tight conglomerate reservoirs.

2. Failure Patterns and Fracture Characteristics of Tight Conglomerates

The study utilized two sets of core samples obtained from the T1b3 and T1b1 sub-layers of the Baikouquan Formation in the Ma-X well block, both of which contained natural weak planes. The experiment consisted of two phases: (1) a strengthening stage, where confining pressure was applied at a low loading rate (1–2 MPa/min), followed by a 1 min pressure hold at 3 MPa to ensure complete closure of pre-existing fractures before further pressurization to target confining pressure; and (2) a compression stage conducted under stabilized confinement. The sample characteristics and experimental parameters are detailed in Table 1.
The fracture morphology of the first group of samples after the experiment is shown in Figure 1. Under the 0 MPa condition (control group), the conglomerate primarily exhibited natural fractures, mainly gravel-edge fractures. Due to uneven cement distribution during deposition, some poorly cemented areas developed erosion zones. When the confining pressure increased to 20 MPa, the rock’s overall compactness improved, causing the slight closure of gravel-edge fractures. However, fractures persisted due to unconformable contact between gravel and matrix resulting from absent cementation. The closure degree of primary weak planes in the matrix was higher than that of gravel-edge fractures. Notably, confining pressure increase did not affect pores and fractures caused by cementation deficiencies. At a confining pressure of 40 MPa, the sample fractured. The main manifestations included the following: matrix spalling, forming pores and cavities; the development of intra-gravel fractures within the gravel; the extension of gravel-edge fractures along the gravel; and the detachment of cement.
The fracture morphology following the second experimental series is presented in Figure 2. The second conglomerate group consists of weakly matrix-supported conglomerates with calcareous cementation, characterized by a deep burial depth and high cementation degree. When the confining pressure was 20 MPa, the rock reached its highest compaction density, producing only two small shear fractures. As the confining pressure increased to 60 MPa, significant changes occurred in the fracture morphology of the sample. First, the calcareous cement inside the sample detached, reducing the rock’s cementation strength. Two straight tensile fractures formed in the rock, accompanied by multiple clustered fractures. The straight tensile fractures predominantly extended around the matrix of large-grained gravel, exhibiting large geometric dimensions. When the confining pressure further increased to 80 MPa, the rock experienced fragmented failure. Large-grained gravel developed multiple transverse fractures under high confining pressure, cutting through the gravel itself. Perpendicular to these transverse fractures, larger vertical fractures formed, diagonally penetrating the entire sample. The failure mode of calcareous-cemented conglomerates differed markedly from that of the previous two groups of argillaceous conglomerates, with distinct gravel fragmentation patterns and fracture geometries. The two groups of samples primarily exhibited two fracture types: “edge-type” fractures (circum-gravel fractures) and “through-gravel” fractures.

3. Experimental Investigation of Hydraulic Fracture Propagation and Network Formation Mechanisms in Tight Conglomerate Reservoirs

3.1. Preparation of Artificial Tight Conglomerate Samples

The structural differences in conglomerates determine their distinct physicochemical properties compared to conventional sandstones, mudstones, and shales. Tight conglomerates are composed of three fundamental components: gravels, matrix, and cementation interfaces. Conventional cementation methods are primarily classified into two types: calcareous cementation and argillaceous cementation. Based on contact patterns between gravels, conglomerates can be categorized into four structural types: grain-supported, multistage grain-supported, matrix–grain-supported, and matrix-supported.
Due to variations in depositional environments and diagenetic processes, conglomerates exhibit significant microstructural heterogeneity. The mineral composition and microstructure of conglomerates fundamentally govern their mechanical characteristics. To ensure mineralogical consistency between artificial samples and natural specimens in experimental studies, X-ray diffraction (XRD) analysis was first conducted to determine the mineral composition of natural conglomerates, as presented in Table 2.
Since the surface of the Mahu well area is primarily Gobi terrain, where outcrops are severely eroded, conducting indoor experiments is difficult. Therefore, artificial conglomerate was used as a substitute for natural outcrops in laboratory tests. To ensure the reliability of artificial conglomerate as experimental samples, the preparation process aimed to maximize the similarity in mineral composition and mechanical properties between the samples and reservoir rocks, thereby reducing experimental errors and improving accuracy. According to the mineral composition analysis of the Baikouquan Formation conglomerate in the Mahu X well area, dense conglomerate consists of approximately 57% gravel by volume. The matrix contains less than 10% clay minerals, with the remainder primarily composed of three rock-forming minerals: quartz, plagioclase, and potassium feldspar.
The artificial samples were prepared by mixing cement with additives (containing feldspar components), quartz sand, and clay in a 4:5:1 ratio. In the Baikouquan Formation conglomerate of the Mahu X well block, the gravel components consist predominantly of high-hardness igneous rocks. For gravel selection, naturally formed and sorted igneous gravels collected from river channels were used as experimental samples due to their advantages of natural shaping and grading. A comparison of reservoir gravel characteristics versus experimental gravels is presented in Figure 3.
The reservoir conglomerates display diverse gravel morphologies, including elliptical, flattened, spindle-shaped, and rhombic forms, with a mean particle size ranging from 3 to 5 cm [12,13,14,15]. The fluvially collected gravels demonstrate high consistency with the sampled gravels in both morphological characteristics and median particle size distribution. To ensure adequate mechanical strength of the artificial specimens, early strength agents were incorporated to enhance cementation strength. Following curing, cylindrical samples (Φ 25 × 50 mm) were extracted for mechanical property testing, with the synthetic specimens’ mechanical parameters analyzed as presented in Table 3. The artificial samples maintained average values of 22.91 GPa for Young’s modulus, 0.248 for Poisson’s ratio, and 68.68 MPa for uniaxial compressive strength.

3.2. True Triaxial Hydraulic Fracturing Physical Simulation Experimental Protocol

3.2.1. Cluster-Controlled Dynamic Flow True Triaxial Fracturing Experimental System

The experimental system utilizes a custom-designed large-scale true triaxial physical simulation apparatus developed in-house for the comprehensive investigation of rock deformation and failure characteristics [16,17,18,19]. This integrated setup comprises the following: (1) a heavy-duty true triaxial loading frame capable of accommodating specimens up to 300 × 300 × 300 mm; (2) three independent servo-controlled stress intensifiers for precise application of principal stresses (σ1, σ2, and σ3) up to 100 MPa; (3) a 24-channel acoustic emission monitoring system with 1 MHz sampling frequency; (4) a multiparameter data acquisition system recording mechanical and hydraulic data at 200 kHz; (5) a high-pressure oil–water isolation unit rated for 70 MPa operation; and (6) a multi-cluster dynamic flow control module enabling simultaneous stimulation of up to five fracture clusters with individual flow rate control (±2% accuracy). The complete system configuration is illustrated in Figure 4.

3.2.2. Experimental Protocol for True Triaxial Hydraulic Fracturing Tests

The laboratory true triaxial large-scale physical simulation fracturing test program is presented in Table 4. All samples consisted of synthetic conglomerates, with experimental variables including horizontal stress difference, injection rate, and cluster spacing.

3.3. Description and Evaluation of Hydraulic Fracture Morphology

(1)
Impact of Horizontal Stress Anisotropy on Fracture Geometry
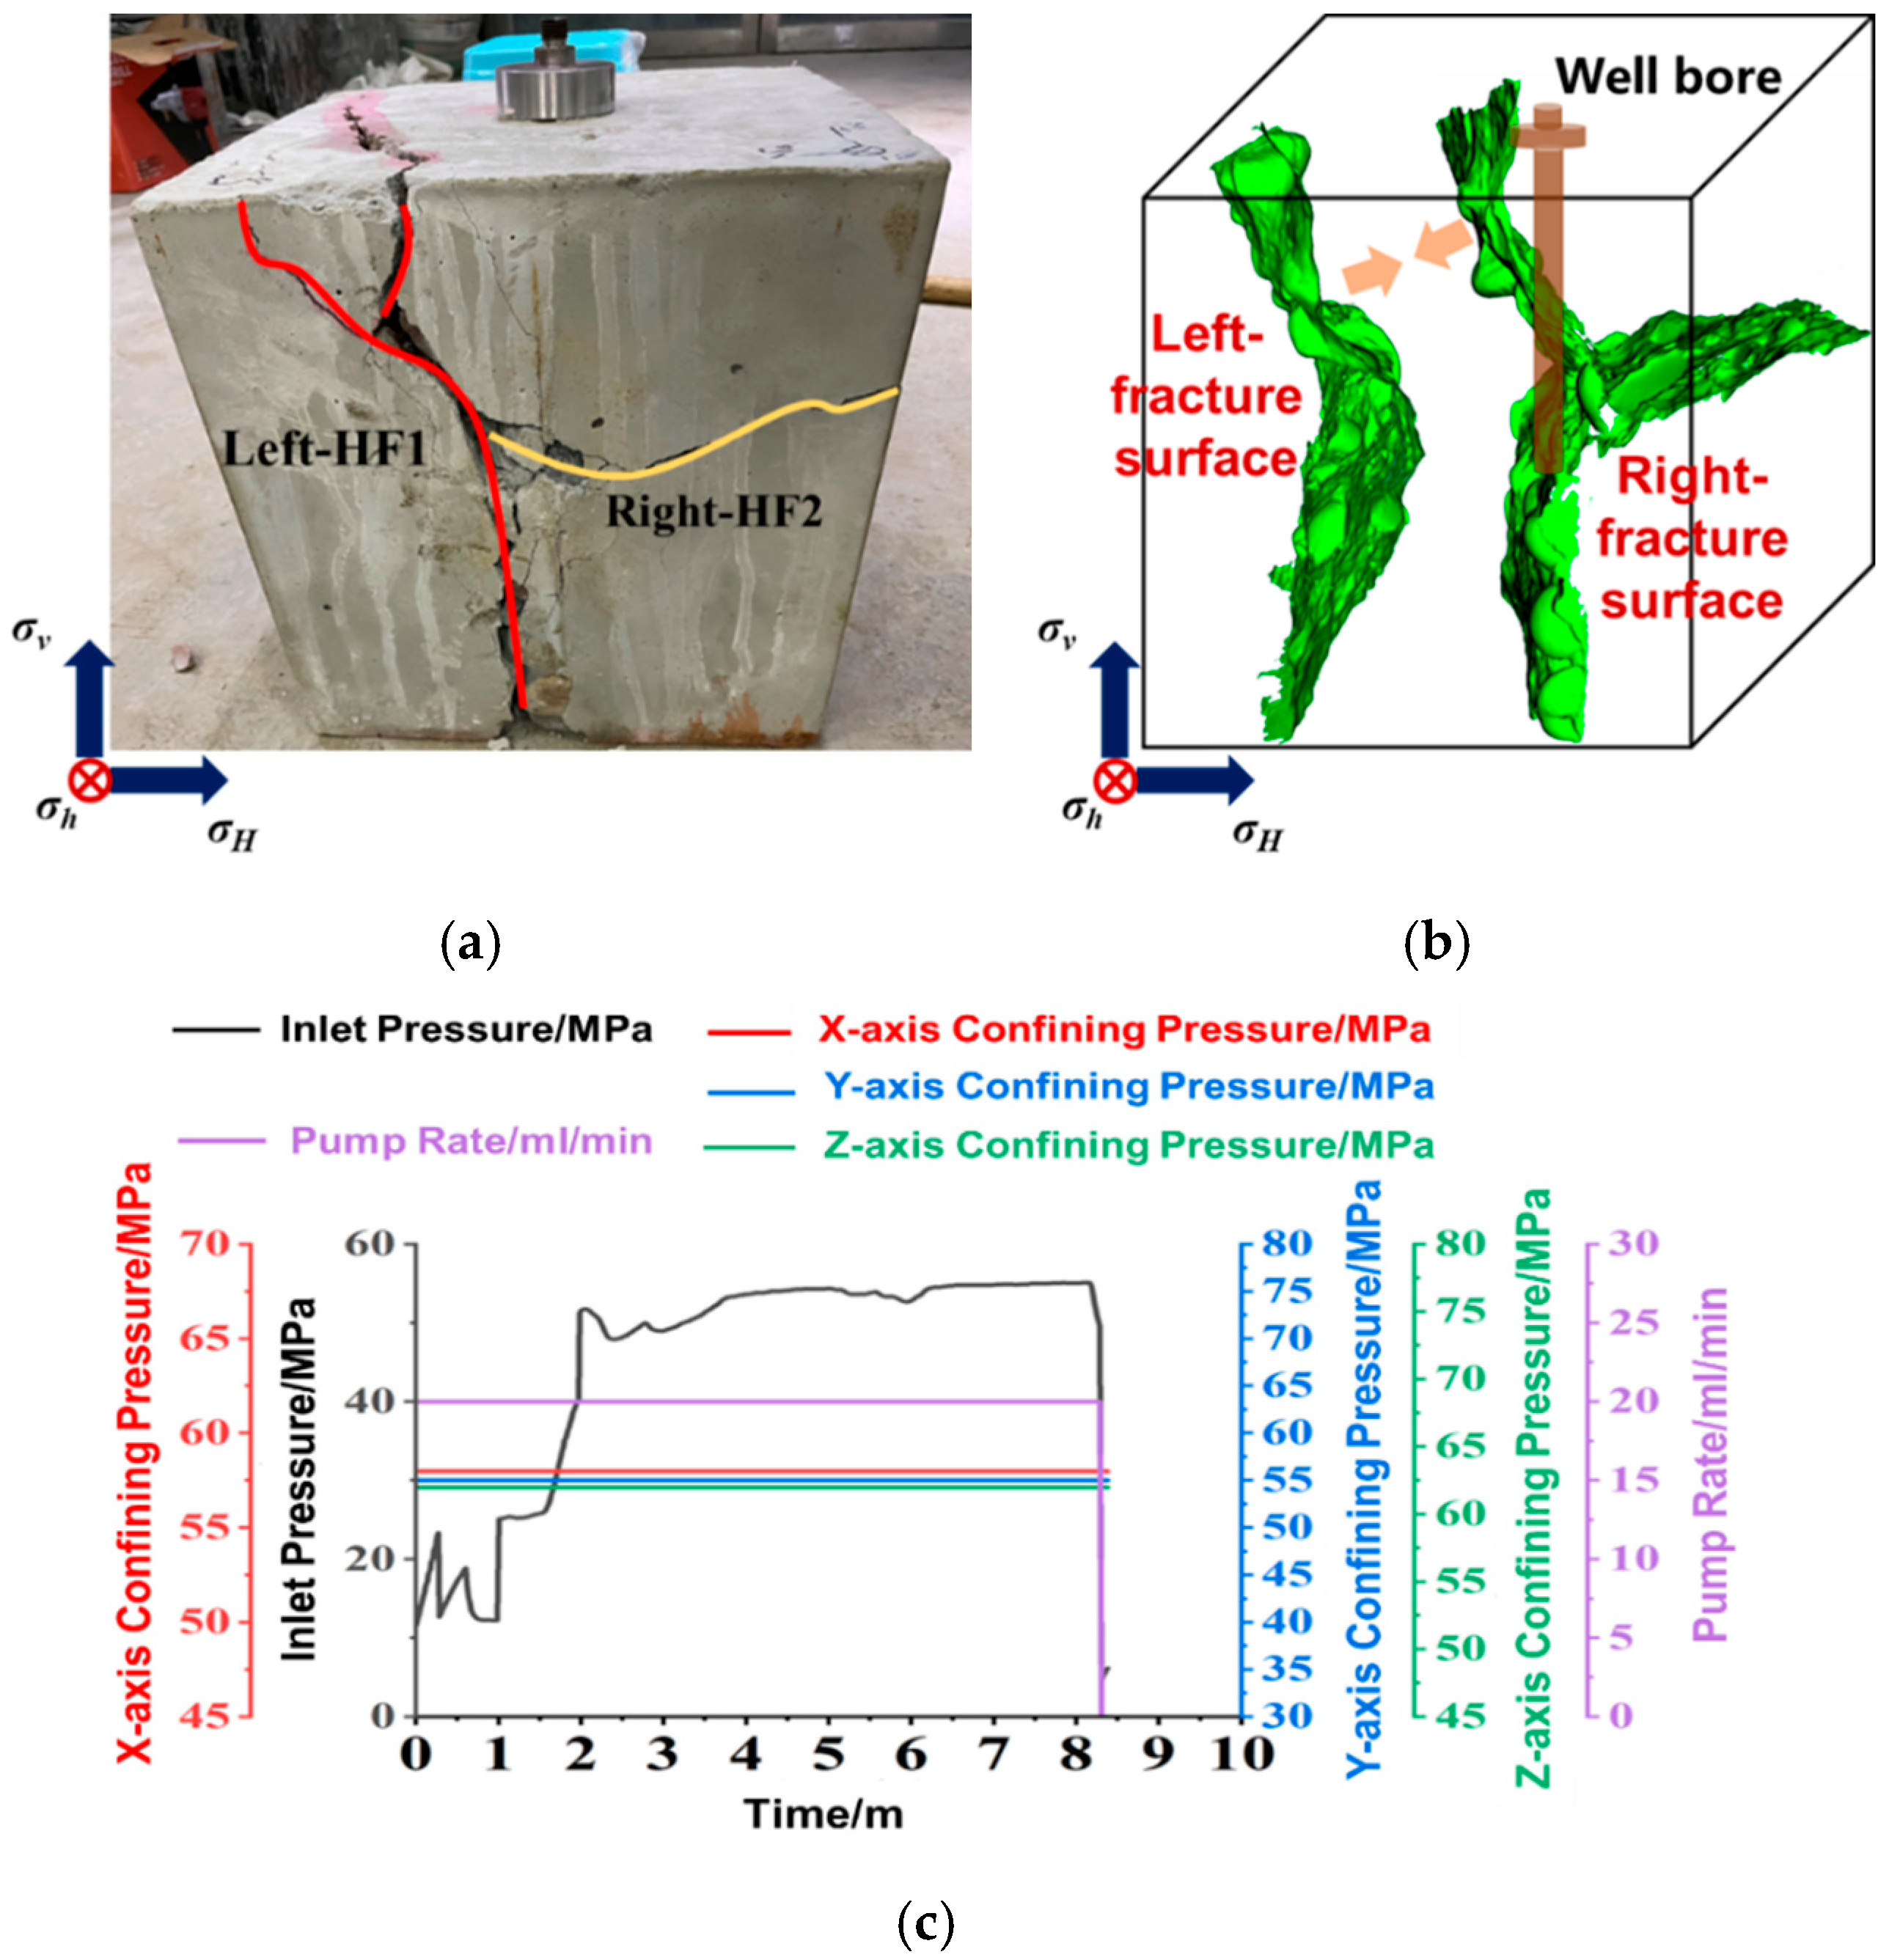
Hydraulic fracturing experiments were conducted on Samples 1–3 under horizontal stress differences of 4 MPa, 8 MPa, and 15 MPa to systematically evaluate stress anisotropy impacts. As demonstrated in Figure 5 for Sample G1, fractures initiated at the wellbore bottom and developed two distinct hydraulic fractures: HF1 propagated vertically parallel to the wellbore orientation, while HF2 extended vertically along the maximum horizontal stress direction. The relatively low stress difference resulted in wider fracture apertures and diminished stress control over fractured geometry. Fracture surface characterization via scanning (Figure 5b) revealed predominant circum-gravel propagation patterns, with fractures navigating around heterogeneously distributed gravels of varying sizes. Pressure curve analysis indicated a breakdown pressure of 55 MPa. Fracture network reconstruction yielded a total stimulated area of 1725.34 cm2, calculated through grid-based modeling of HF1 and HF2 as discrete planar fractures without considering fluid flow conditions.
When the horizontal stress difference increased to 8 MPa, the post-fracturing morphology of Sample G2 (Figure 6) exhibited distinct behavioral changes: The hydraulic fracture initiated at the wellbore bottom and propagated perpendicular to the wellbore along the σH direction, forming a single dominant transverse fracture. As shown in Figure 6a, the hydraulic fracture completely bisected the rock sample along the fracture plane, demonstrating both extensive vertical propagation and considerable fracture width. A secondary fracture developed parallel to the wellbore but terminated at the sample base. CT scanning revealed exclusive circum-gravel propagation patterns with no evidence of through-gravel fracture penetration. Sample G2 maintained a breakdown pressure of 55 MPa, with the single fracture plane area measuring 1374.082 cm2. Although natural fractures are absent in the target reservoir, the weakly cemented matrix provides substantial space for fracture dilation. Notably, both the 4 MPa and 8 MPa test conditions remained below the reservoir’s inherent stress anisotropy. Given that high stress differentials (15–20 MPa) represent a defining geological characteristic of the Mahu Sag, Sample G3 was tested at Δσh = 15 MPa to investigate fracture propagation under reservoir-representative stress conditions.
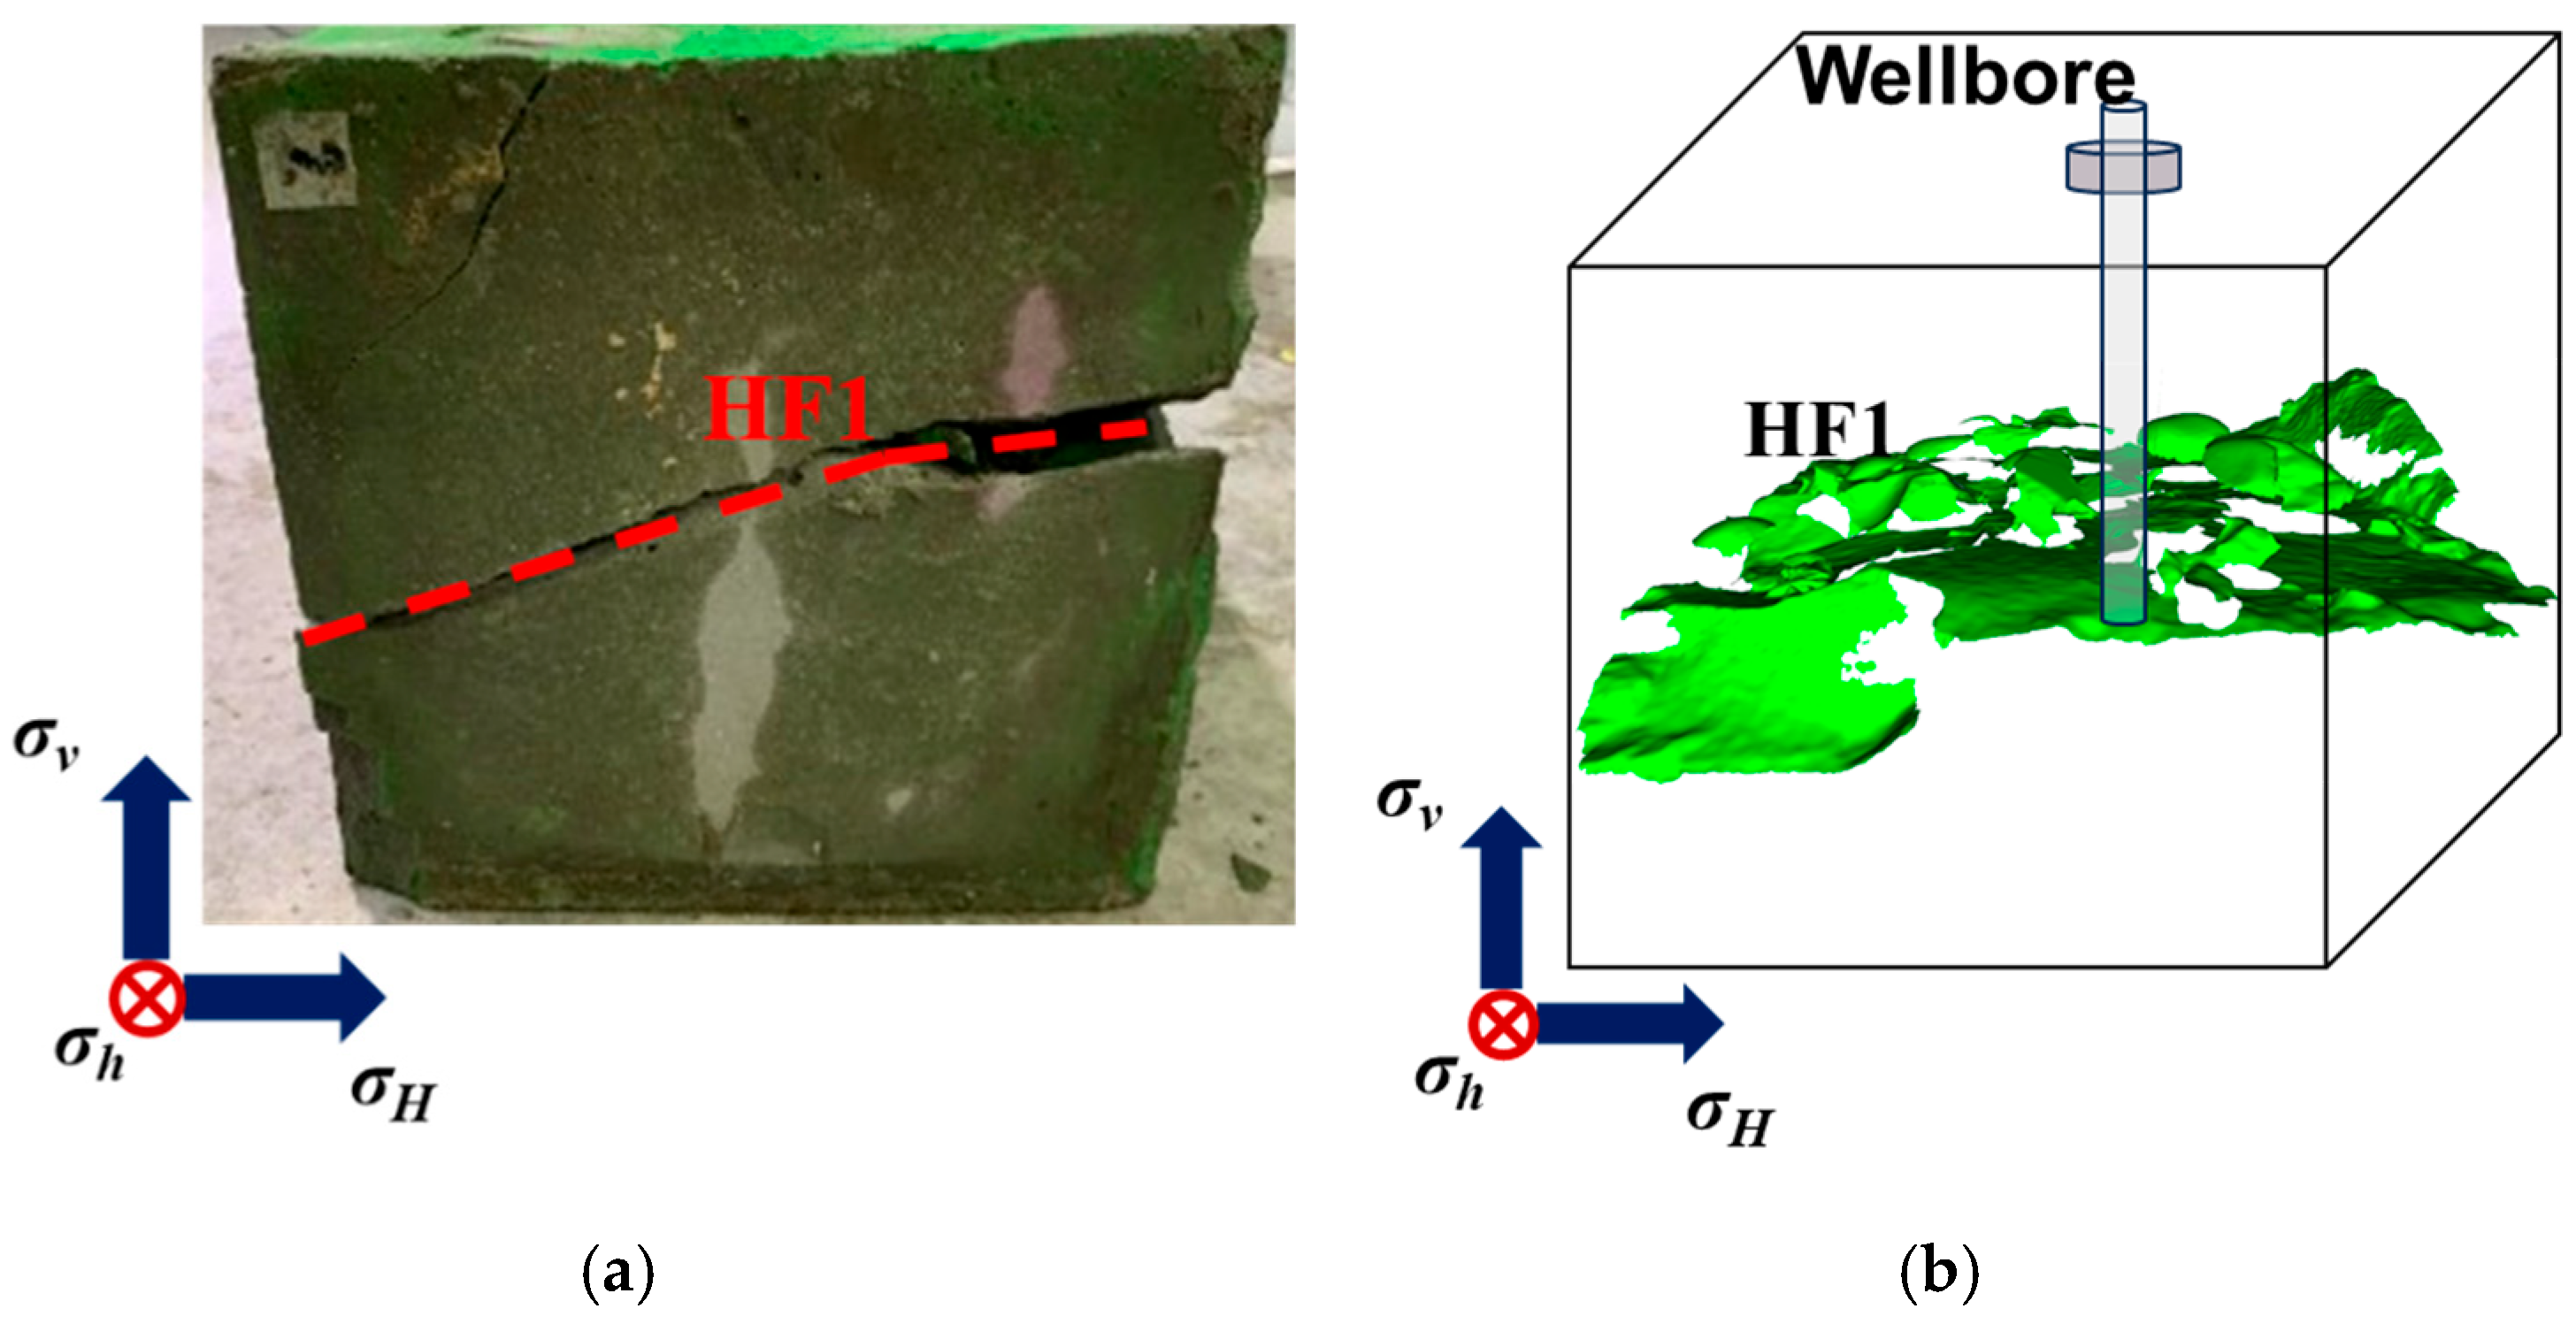
The post-fracturing fracture network morphology and fracture surface reconstruction of Group G3 samples are presented in Figure 7. The fracture morphology in these samples is relatively simple. Under a stress difference of 15 MPa, only a single transverse fracture forms along the direction of the maximum horizontal principal stress, with the fracture surface being nearly parallel to the maximum horizontal in situ stress.
Given that the study area contains virtually no developed bedding planes, and the reservoir lacks upper and lower barriers, the hydraulic fracture morphology under high stress-difference conditions exhibits remarkable uniformity. Fractures predominantly propagate around gravel particle edges. The Group G3 samples demonstrate a breakdown pressure of 63 MPa, with a corresponding fracture area of 1145.164 cm2.
(2)
Influence of Multi-Cluster Perforation on Fracture Morphology
The propagation of multi-cluster hydraulic fractures in a single stage was investigated using a clustered dynamic flow control experimental setup. While this apparatus can achieve uniform downhole flow distribution, uniform-flow fracturing conditions do not accurately represent actual field operations. Therefore, experiments were conducted under natural flow allocation conditions using two configurations: two clusters per stage with 6 cm cluster spacing, and three clusters per stage with 4 cm cluster spacing. The G4 group experiment comprised a laboratory-scale, two-cluster hydraulic fracturing test within a single stage.
The post-fracture morphology and pumping pressure curve of the sample are shown in Figure 8. Two fractures, HF1 and HF2, initiated simulated perforations A and B, respectively. At perforation A, fracture HF1 formed a transverse fracture parallel to the wellbore, extending along the direction of the maximum horizontal principal stress. At perforation B, a T-shaped fracture developed—the main branch of HF2 extended parallel to HF1, while a turning fracture propagated upward along the wellbore. Flow monitoring data revealed that the fluid intake of HF1 was twice that of HF2. Fracture reconstruction indicated that HF1 had a wider aperture with clear erosion marks, while HF2 had a narrower aperture due to lower fluid intake.
Both fracture surfaces exhibited noticeable gravel spalling, attributed to the weakly cemented rock sample. Under fluid erosion, fractures propagated around gravel particles, and the argillaceous components (acting as cement and filler) were washed away by the fracturing fluid, leading to gravel detachment. The pressure curve showed that fracture A initiated first at 53 MPa, while fracture B initiated later at nearly 60 MPa after HF1 had extended. This pressure difference was caused by varying gravel particle sizes at the initiation points—larger gravel exerted greater resistance to fracture initiation.
The fracture surface reconstruction diagram of G4-b revealed mutual inhibition between the two fractures. While the right half of HF2 extended downward, HF1 deflected away from the HF2 propagation direction. However, the left half of HF2 extended parallel to the maximum horizontal principal stress without deflection, and HF1 also maintained a parallel extension without attraction or repulsion. Under 6 cm cluster spacing, although two fractures were generated, their overall morphology remained simple, with no additional branch fractures. The post-fracture area was 2495.098 cm2.
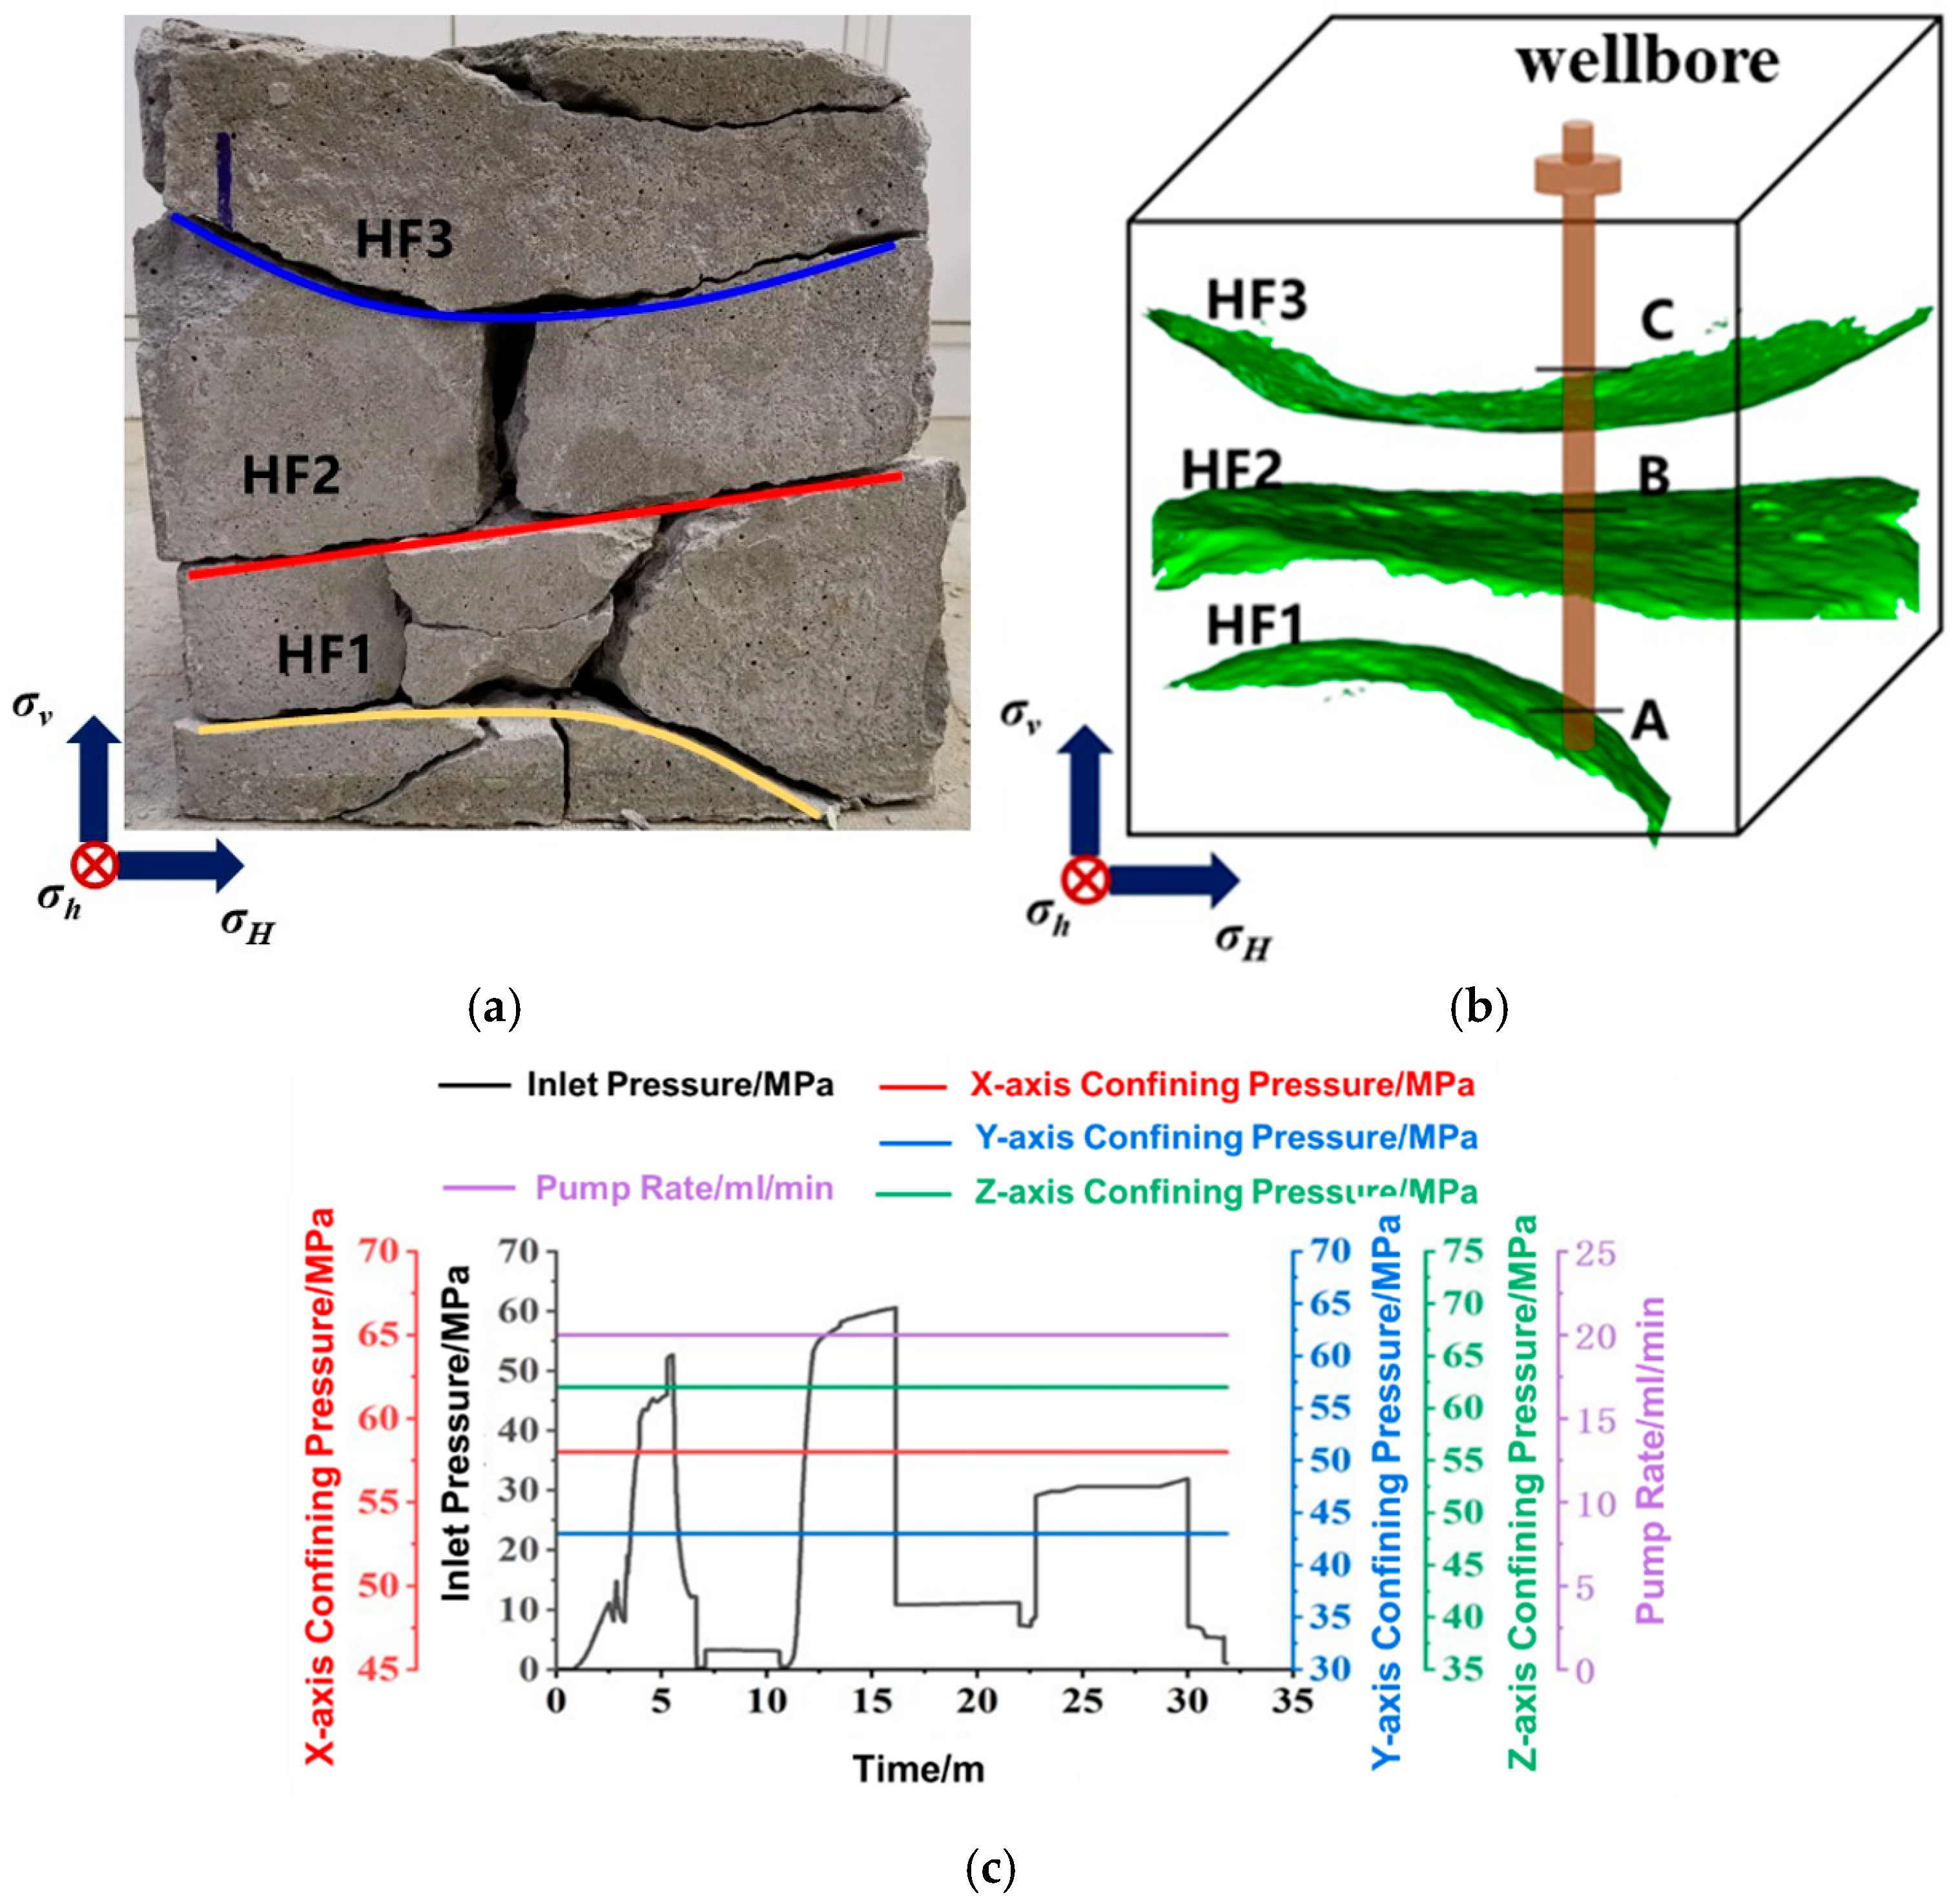
The G5 sample was subjected to a three-cluster fracturing test with a cluster spacing of 4 cm. The post-fracture morphology and pumping pressure curve of the G5 sample are shown in Figure 9.
As illustrated in Figure 9a, fractures HF1 and HF3 exhibit a crescent-shaped morphology, with their tips deflecting outward, while the central fracture HF2 extends parallel to the direction of the maximum horizontal principal stress. Under the 4 cm cluster spacing condition, the three fractures demonstrate significant mutual repulsion, attributed to stress interference from the middle fracture (HF2) on the two outer fractures (HF1 and HF3).
Flow monitoring data indicate that HF1 received the highest fluid intake under natural flow allocation, while HF2 and HF3 showed relatively similar but lower intake volumes. HF1 also developed a wider fracture aperture compared to HF2 and HF3. Under fluid erosion, the fracture surfaces contained numerous dislodged gravel particles, confirming that fracture propagation primarily followed a bypass path around the gravel. The post-fracture area was measured at 2555.6314 cm2.
Consistent with the G5 experiment results, laboratory tests under both two-cluster and three-cluster conditions confirmed that while fractures successfully initiated and propagated, no secondary branching fractures were observed. Each cluster generated a single, simple fracture morphology. Although multi-cluster fracturing increased the number of primary fractures within the stimulated stage, no additional branching fractures were detected around the main fractures, resulting in only marginal improvement to the total stimulated rock volume. Furthermore, increasing the number of perforation clusters within a stage (which reduces fracture spacing) amplifies fracture interference effects, thereby further constraining fracture complexity development.
(3)
Effect of Pumping Rate on Fracture Propagation
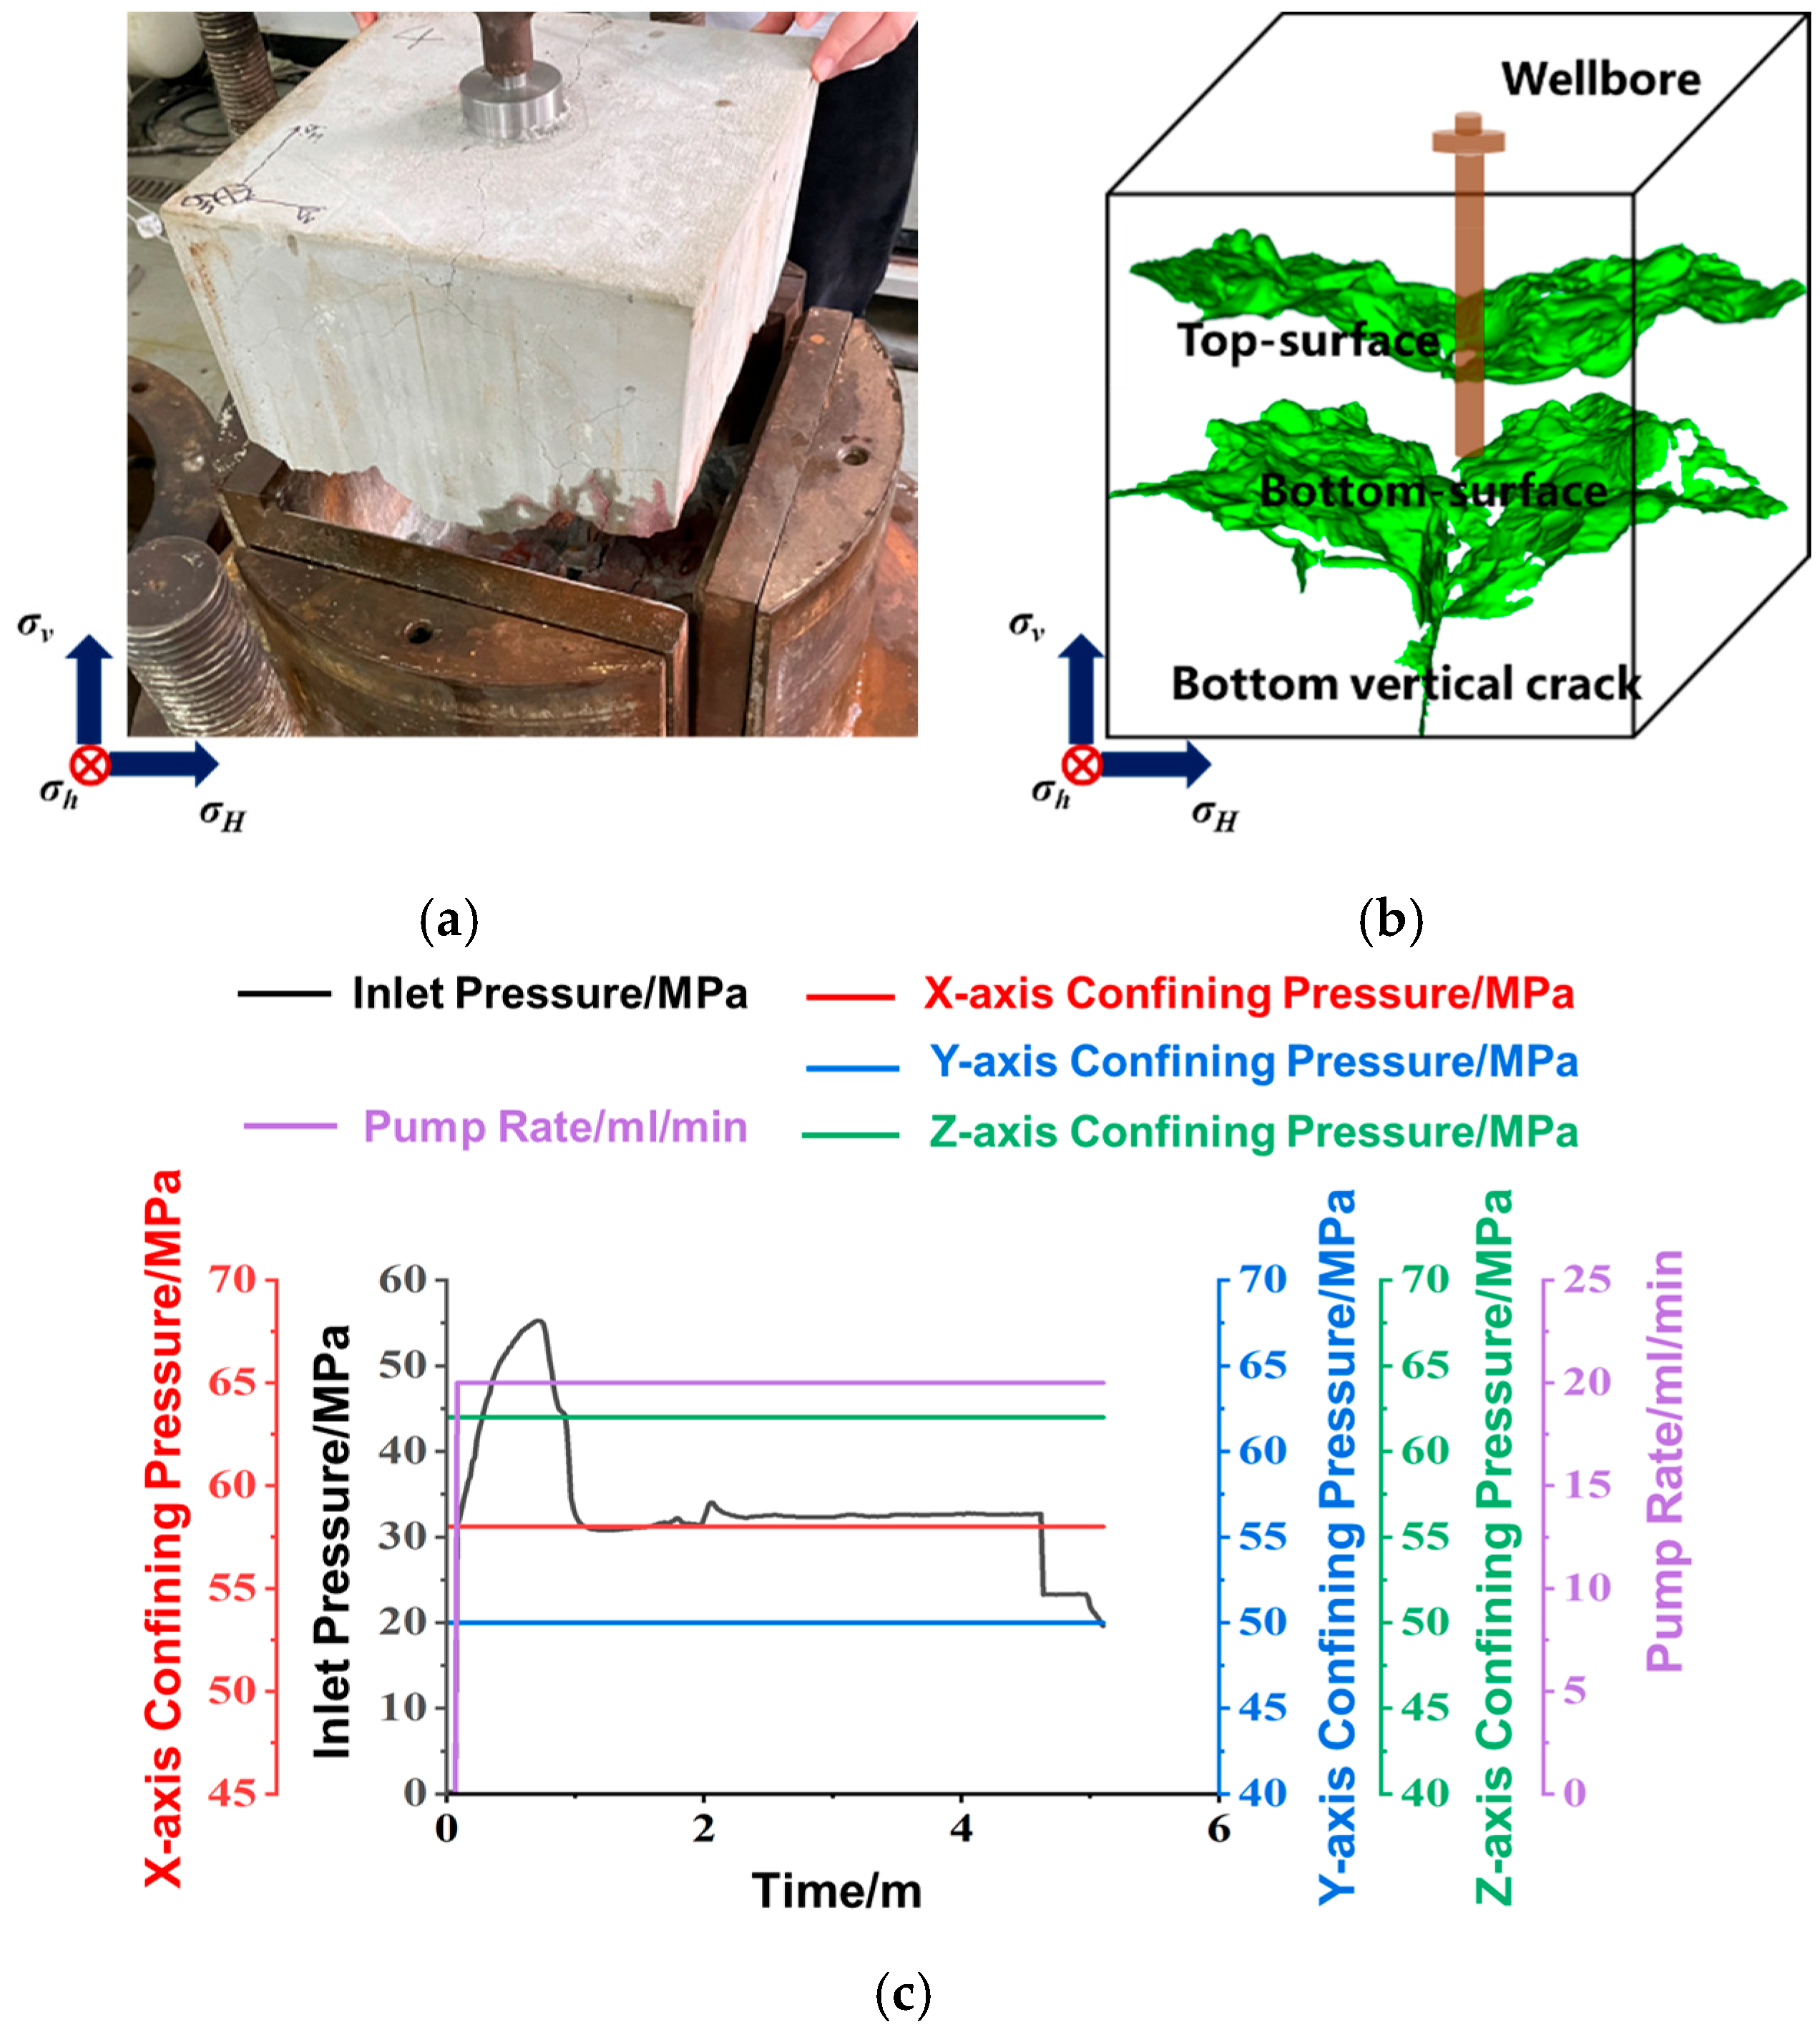
For the G6 sample in Figure 10, two distinct fractures were generated. The primary fracture initially propagated from the central region of the rock specimen along a direction parallel to the maximum horizontal principal stress. When this fracture extended to the weak planes within the sample, the low injection rate (15 mL/min) resulted in insufficient net pressure within the fracture, causing the fracture tip stress intensity factor to fall below the threshold required to penetrate the weak interfaces. Consequently, the fracture path deviated along the weak plane structures, bifurcating into upward and downward propagation directions. The fracture propagation terminated when these bifurcated fractures reached the upper and lower boundaries of the sample, achieving complete rock penetration.
The secondary fracture (HF1) developed due to inadequate cementation quality at the wellbore–rock interface, propagating in a direction perpendicular to the maximum horizontal principal stress. Pressure curve analysis indicated a breakdown pressure of 61 MPa for the G6 sample. Post-experiment examination of the split sample revealed that all fractures exhibited circumgranular propagation around gravel particles, with no observed transgranular penetration. The total post-fracture surface area measured 2115.6276 cm2.
Figure 11 displays the post-fracturing fracture network morphology of the G7 sample under variable-rate fracturing conditions, representing the most complex fracture geometry among all experimental specimens. The fractures propagated between upper and lower weak interfaces while the injection rate was progressively increased through three stages (10, 15, and 20 mL/min). During the initial 10 mL/min phase, fractures initiated from the rock’s central section and extended along the maximum horizontal principal stress direction due to stress anisotropy, exhibiting low propagation rates and poor gravel-penetration capability, as the limited hydraulic energy only permitted growth along paths of least resistance, allowing the fractures to access multiple weak interfaces. When the rate increased to 15 mL/min, enhanced weak-interface penetration enabled fractures to reach both upper and lower boundaries, with distinct pressure fluctuations visible on the pumping curve indicating fracture–gravel interactions that hindered propagation. At the final 20 mL/min stage, fractures horizontally extended along weak interfaces under stress anisotropy until reaching sample boundaries, with inlet pressure maintained between 55 and 80 MPa (the breakdown pressure measured 55 MPa during the 10 mL/min phase). Post-experiment examination revealed predominantly circumgranular fracture propagation with partial crushing of larger gravel particles, yielding a total fracture area of 2736.3542 cm2.
Under a high injection rate of 35 mL/min, the G8 sample exhibited a simple fracture morphology characterized by a single dominant fracture path (Figure 12). The fracture initiated at the rock’s central section and propagated parallel to the maximum horizontal principal stress direction under combined high-rate and high-stress difference conditions, terminating upon reaching the sample boundary with a breakdown pressure of 60 MPa, ultimately yielding a post-fracture area of 963.735 cm2.
The tight conglomerate’s fracture surface displayed significant gravel-related features: larger gravel particles either protruded or detached, creating surface depressions that generated discontinuous scanning surfaces during laser profilometry. These discontinuities unreconstructedly formed “fragments” in the fracture surface modeling process when protrusions/depressions exceeded certain dimensions, as interpolation algorithms failed to fully compensate for major scanning artifacts. Conversely, areas with smaller gravel sizes and lower gravel content permitted successful gap-filling through numerical interpolation, enabling complete surface reconstruction.
This case demonstrates how gravel-scale heterogeneity fundamentally controls fracture surface replicability, with particle size dictating the feasibility of digital reconstruction through its influence on scanning continuity. The high-rate condition’s simple fracture geometry, combined with gravel-dominated surface irregularities, presents unique challenges for quantitative morphology characterization that scale with constituent particle dimensions.
Figure 12 presents the post-fracture morphology of Sample G8 under a high injection rate of 35 mL/min. Under these conditions of large flow rate and high stress differential, the fracture exhibited a simple, single-path morphology. The fracture initiated from the central region of the rock specimen and propagated parallel to the direction of the maximum horizontal principal stress. Fracture propagation ceased upon reaching the sample surface, completing the fracturing process with a breakdown pressure of 60 MPa, resulting in a post-fracture surface area of 963.735 cm2.
The fracture surface in this tight conglomerate sample displayed significant gravel-related features, where larger gravel particles either protruded or became dislodged, creating substantial surface depressions. During laser scanning, these features generated discontinuous fracture surfaces. When the protrusions or depressions were particularly large, the discontinuity could not be fully reconstructed using interpolation algorithms, leading to fragmented “gaps” in the fracture surface model. However, in areas with smaller gravel sizes and lower gravel concentration, the scanning-induced missing data could be effectively compensated through interpolation methods.
This case highlights how gravel size distribution fundamentally affects fracture surface characterization, with larger particles creating reconstruction challenges that exceed the compensation capacity of standard interpolation techniques, while smaller particles allow for complete surface restoration through computational methods. The high-flow-rate condition produced simplified fracture geometry, but the gravel-dominated surface morphology introduced unique quantification complexities that were directly correlated with particle dimensions.

4. Variable-Rate Fracturing Optimization Design and Field Applications

The tight conglomerate reservoir in the study area exhibits limited natural fracture development, hindering the formation of complex fracture networks during hydraulic fracturing [20,21]. Given the reservoir’s significant burial depth and high horizontal stress anisotropy, experimental results indicate that hydraulic fracture propagation is predominantly controlled by the horizontal stress difference [22]. Under conditions of high horizontal stress contrast, hydraulic fractures preferentially propagate extensively along the direction of the maximum horizontal principal stress.
During hydraulic fracturing operations, elevated injection rates accelerate fracture propagation. The reservoir contains abundant gravels with heterogeneous size distribution and a weakly cemented matrix. When subjected to both high horizontal stress contrast and high-pressure/high-rate fluid injection, fractures demonstrate dual propagation behaviors: either penetrating through gravel particles or circumventing them. Despite the presence of numerous weakly cemented interfaces between gravels and matrix, the connection probability of fractures along these interfaces remains low under high stress contrast and high pumping rate conditions. This observation suggests substantial potential for further increasing the stimulated reservoir volume.

4.1. Mechanism of Production Enhancement by Variable-Rate Hydraulic Fracturing

Compared with conventional single high-rate hydraulic fracturing technology, the production enhancement mechanism of variable-rate hydraulic fracturing is mainly reflected in two aspects [22,23]:
(1)
Enhanced fracture geometry:
The variable-rate injection process generates additional fluctuating pressure within fractures, effectively increasing net pressure and improving fracture propagation capability. Under cyclic loading, the fatigue damage effect on rock (particularly in weakly cemented zones of tight conglomerates) creates localized stress concentration points, promoting microfracture initiation and significantly expanding the stimulated reservoir volume (SRV).
(2)
Reduced gravel structural strength and breakdown pressure:
During variable-rate stages, randomly distributed large gravel particles experience intensified fluctuating stresses, facilitating hydraulic fracture initiation and extension. The key difference from single high-rate fracturing lies in the following:
(i)
Oscillatory flow characteristics (pressure/rate modulation);
(ii)
Dynamic propagation pressure (peak-trough stress cycling).
Figure 13 illustrates 2D fluid pressure wave propagation in the reservoir. To model this phenomenon, we assume periodic wave transmission governed by fluid particle dynamics. The velocity potential, Φ (x,y,t, where x,y = fracture surface coordinates), describes this oscillatory flow, with its non-steady-state equation expressed as follows [23]:
Φ ( x , y , t ) = C 2 e 2 π λ sin ( 2 π λ x 2 π T t )
In Equation (1), C2 represents an undetermined coefficient to be resolved based on boundary conditions, λ denotes the wavelength (in meters), T is the wave period (in seconds), 2π/λ corresponds to the wavenumber (dimensionless), and 2π/T signifies the wave frequency (in Hz). The velocity potential equation can be decomposed into horizontal and vertical motion components to determine the trajectory of fluid particles.
The equation demonstrates that fluid pressure waves within fractures exhibit harmonic oscillation. This sinusoidal motion fundamentally enhances the hydraulic energy of fracturing fluid and intensifies mechanical fatigue damage to rock formations, thereby improving rock-breaking efficiency during hydraulic fracturing.
As illustrated in Figure 13, during variable-rate hydraulic fracturing, the fracturing fluid within the fracture exhibits an unsteady oscillatory flow. Consequently, the total flow pressure comprises two components: the injection pressure and the unsteady oscillatory pressure, expressed as follows [25]:
p f = p f s + p f w p f w = [ p w cosh ( γ l ) + i ρ c 2 γ A ω Q sinh ( γ l ) ] e 2 π λ y cos ( 2 π λ x 2 π T t )
In Equation (2), Pf represents the oscillating pressure (MPa); Pfs denotes the fluid pressure during injection (MPa); Pfw signifies the unsteady oscillating pressure of the fluid (MPa); ρ stands for the density of fracturing fluid (kg/m3); c indicates the propagation velocity of the pressure wave (m/s); Pw corresponds to the annular wellbore component of oscillating pressure (MPa); ω represents the operating frequency of fracturing pumps (Hz); and l refers to the bottomhole location (m). This equation demonstrates that by adjusting the displacement rate of fracturing pump assemblies, we can effectively modify the amplitude of bottomhole oscillating pressure, thereby enabling the determination of how variable-rate fracturing’s fracture extension pressure varies with both fracture length and flow duration.

4.2. Design of Variable-Rate Hydraulic Fracturing Program

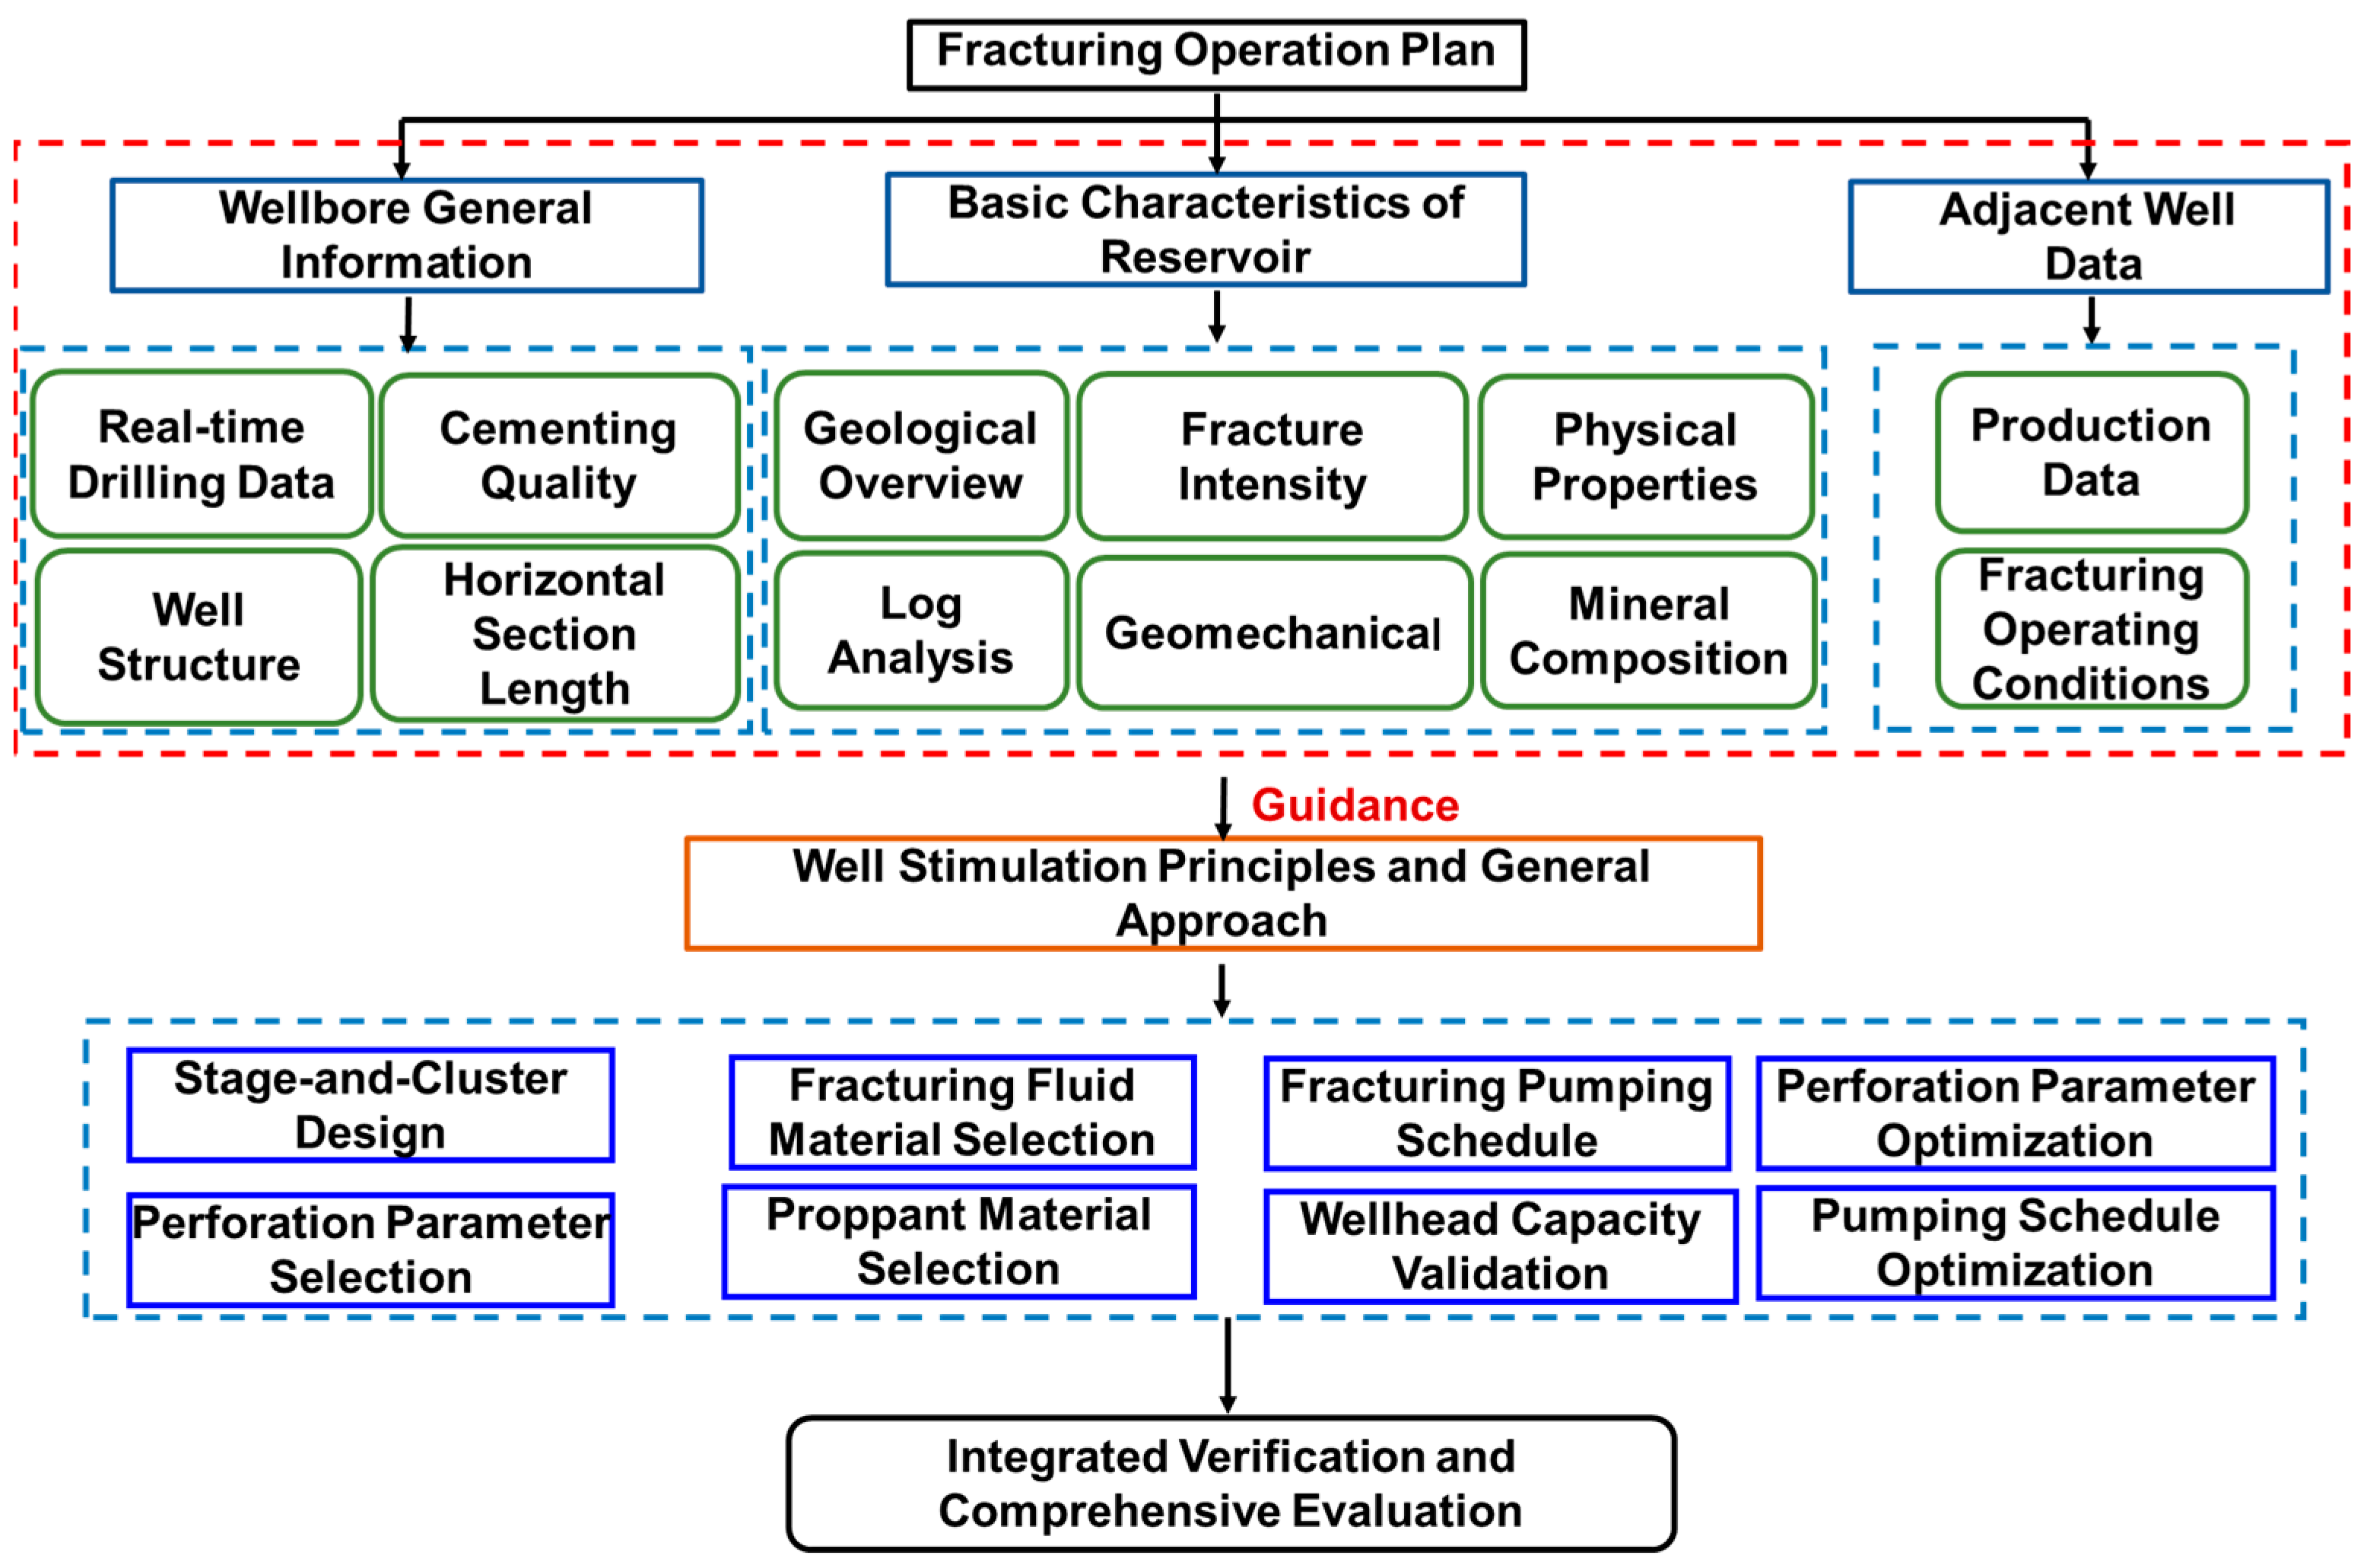
Fracturing design is a systematic engineering process consisting of two main components [25]: the design foundation and the determination of fracturing techniques and parameters. The second component focuses on operational specifications, encompassing stage/cluster design (the core of stimulation zoning), pumping schedule development (the central element and primary implementation basis of the entire design), perforation parameters, and optimization of fracturing fluids/proppants. Figure 14 illustrates the optimized workflow for this integrated fracturing design approach, where reservoir fundamentals guide technical parameter selection while maintaining operational feasibility.
Well T1 is located in the Xia 72 fault block of the Ma X well area on the northern slope of the Ma oilfield. The primary target reservoir is the T1b2 tight conglomerate formation with weak argillaceous matrix cementation. With a total depth of 5180 m, the well features a 1700 m horizontal section drilled through the middle of the 16.5 m thick T1b2 sand body.
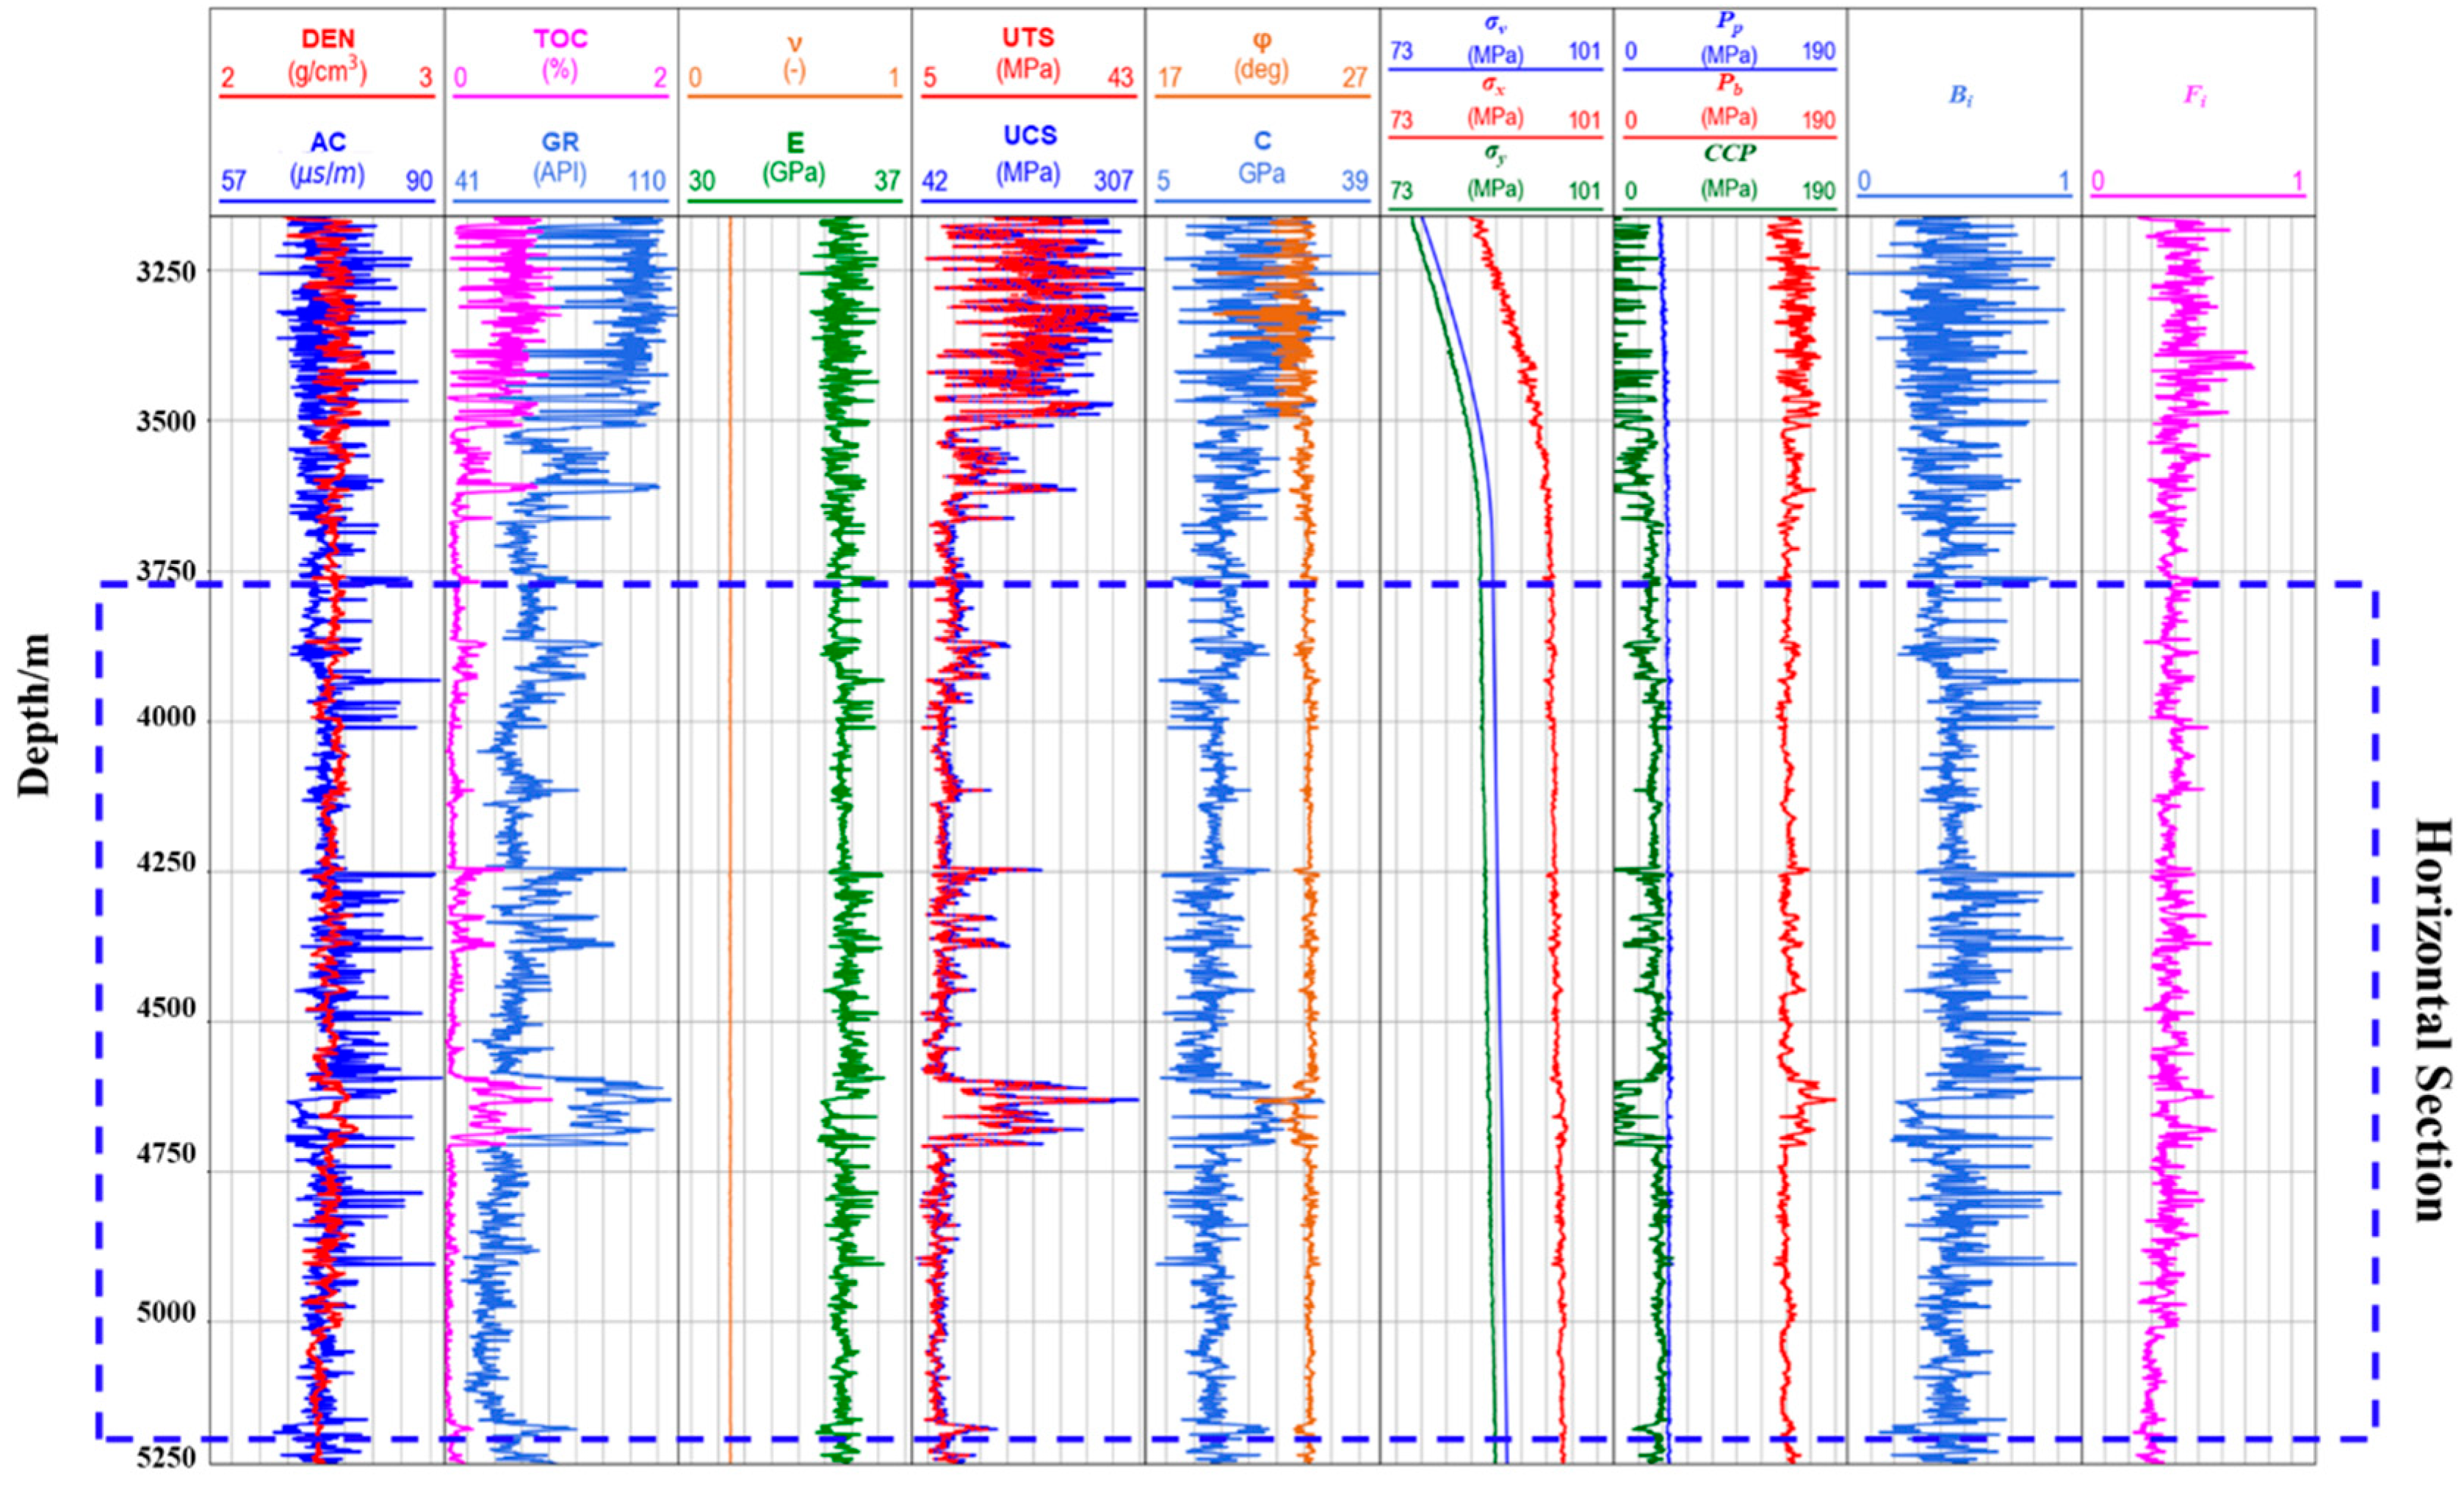
Initial log interpretation using Python-based analysis (Figure 15) classified reservoir quality, stress characteristics, brittleness index, and fracability coefficient along the horizontal section (3500–5200 m). The stress regime remains stable throughout, with overburden pressure (σv) at 74 MPa, maximum horizontal stress (σH) at 65 MPa, and minimum horizontal stress (σh) at 61 MPa (σv > σH > σh). The brittleness and fracability curves show coincident peaks, indicating optimal fracturing intervals where both indices are elevated. Reservoir classification reveals 30 m of Class I, 1500 m of Class II, and 170 m of Class III pay zones, with some reservoirs extending into the build-up section.
The horizontal section primarily targets Class II reservoirs as the key stimulation interval, requiring concentrated perforation clusters in these zones. Class III reservoirs appear discontinuously as interbeds within Class II zones, mainly near the toe. Based on Chapter 4’s fracture propagation modeling (optimal cluster spacing: 20–30 m), we recommend the following: 22-stage design with ~90 m stage length, three clusters per stage (except Stage 1 in Class III reservoirs: two clusters), perforation positioning maintaining safe distances from casing collars, and ramped-rate operation of 8 → 9 → 12 m3/min
This design prioritizes Class II reservoir coverage while addressing geomechanically heterogeneity through optimized cluster spacing and progressive rate intensification.

4.3. Pumping Pressure Curve Characteristics and Microseismic Event Description

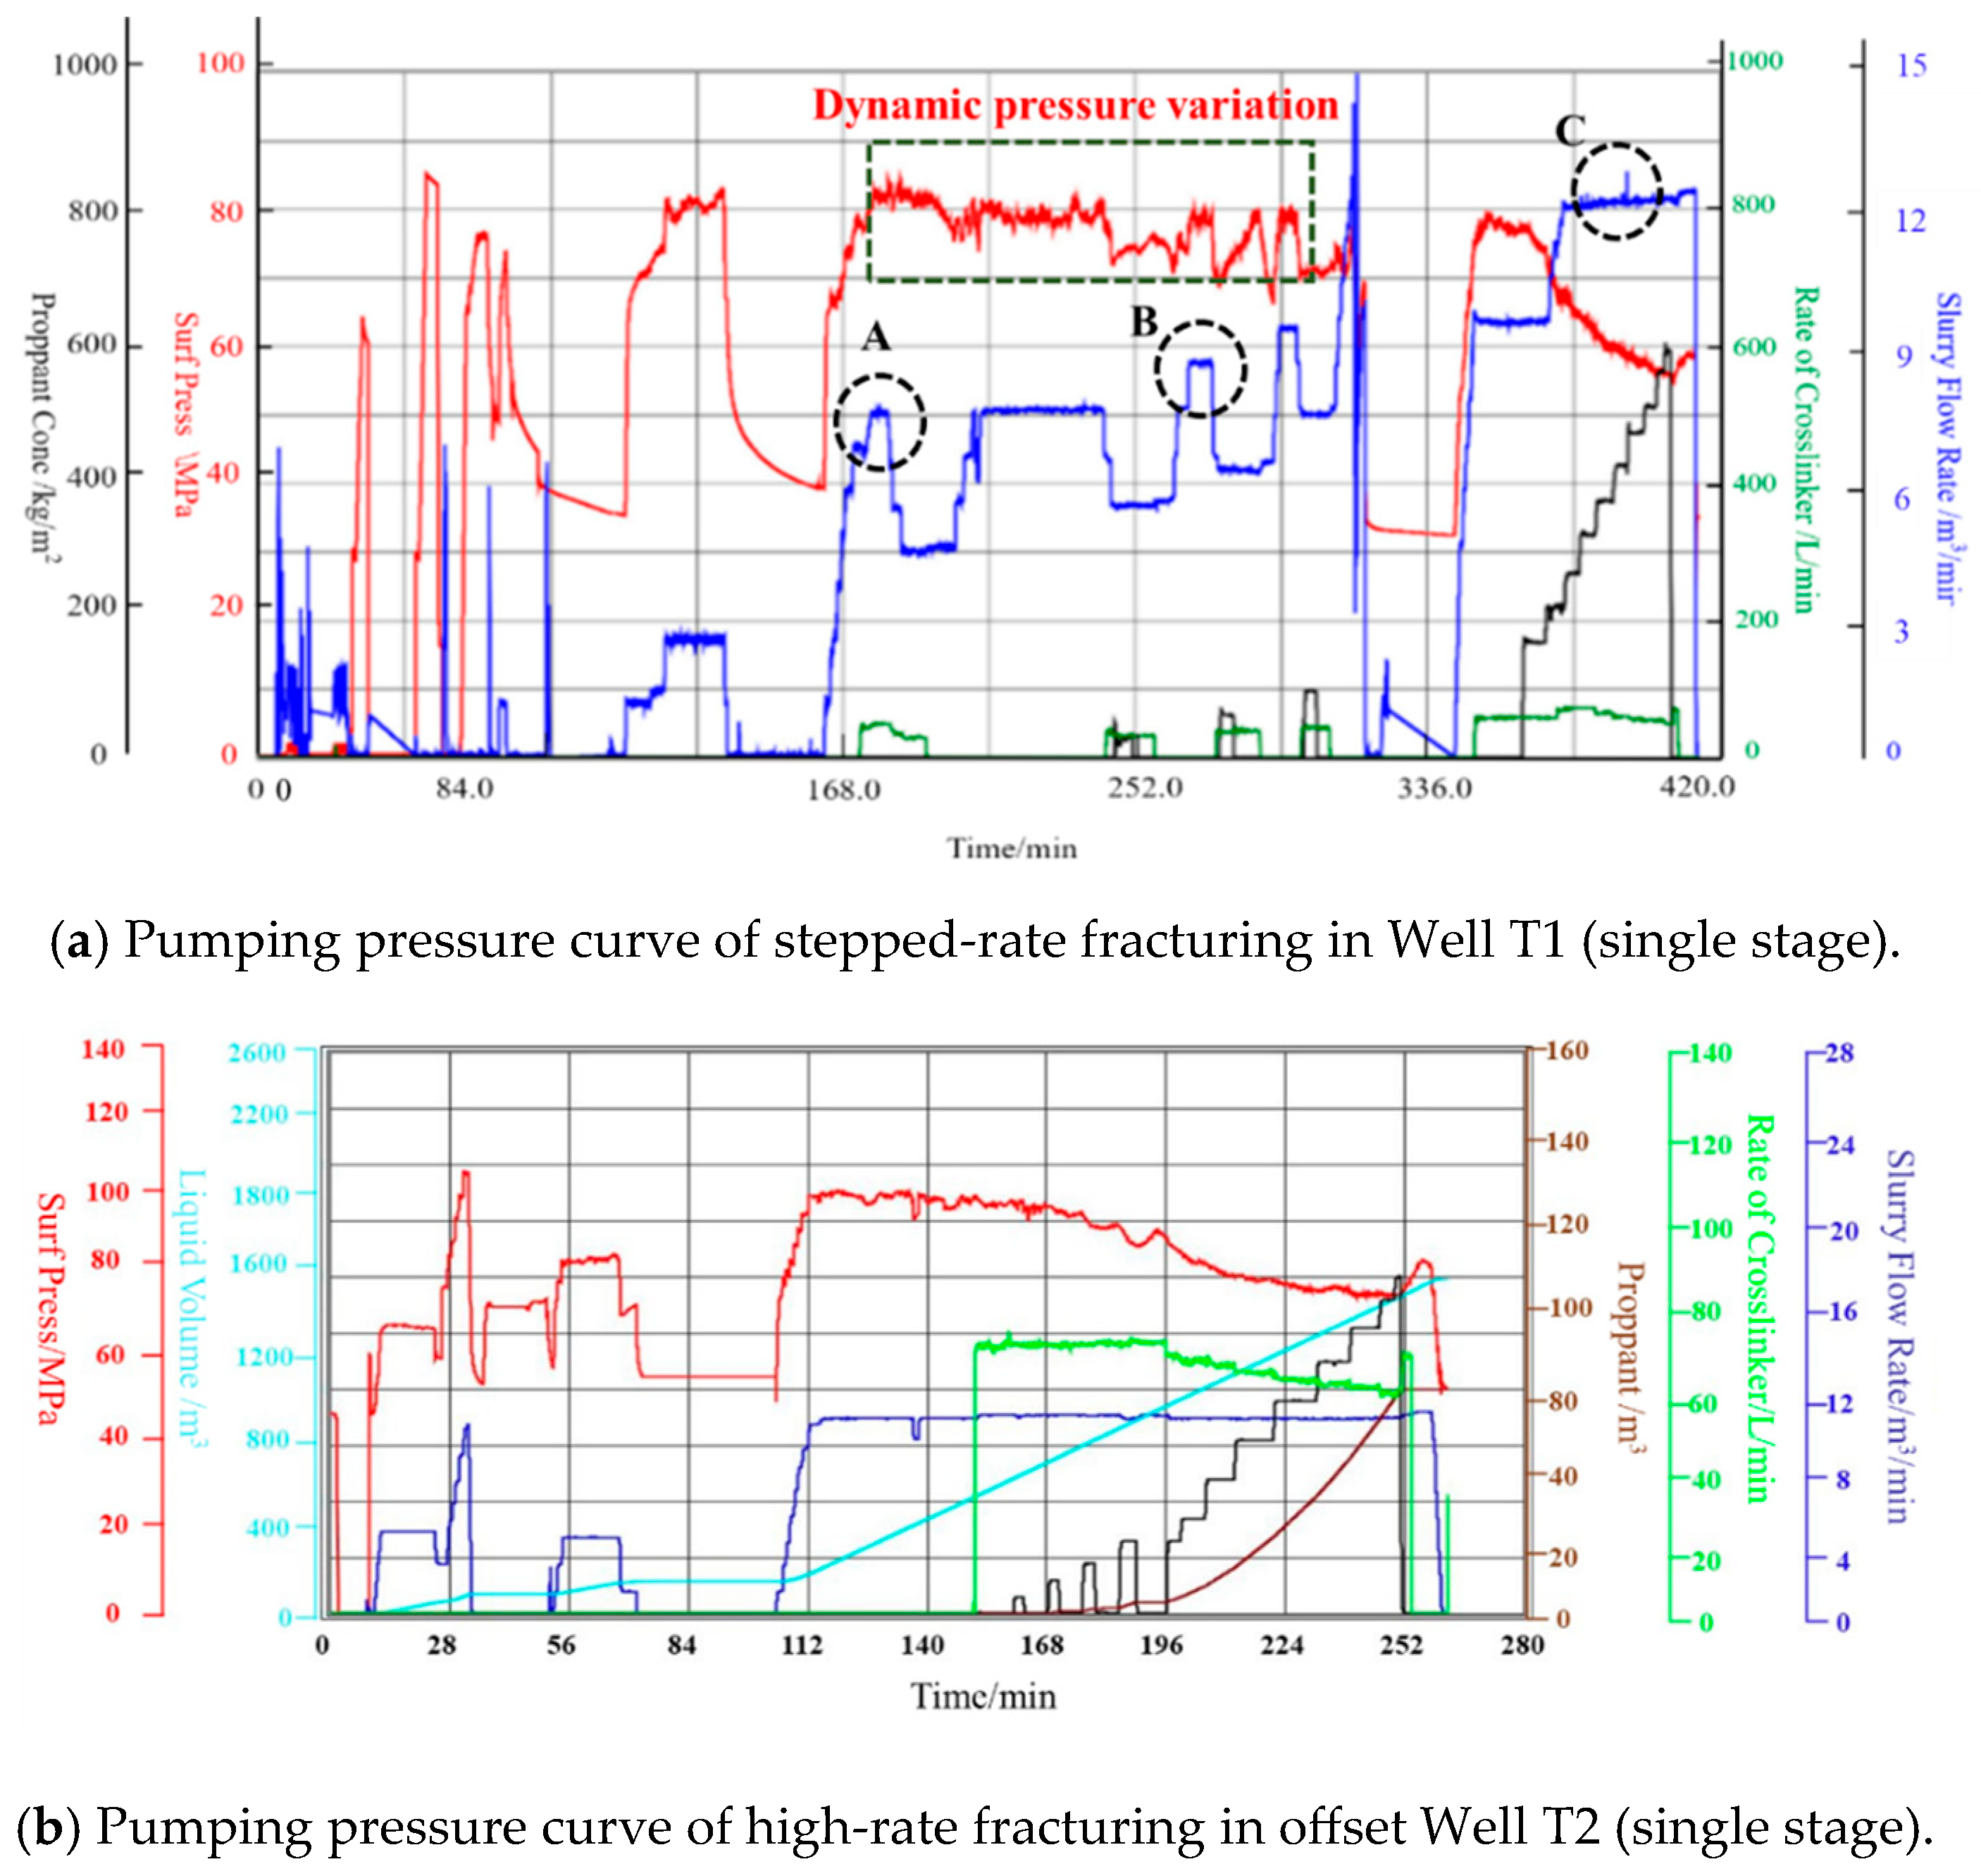
Figure 16 presents a comparative analysis of pumping pressure curves between Well T1 (variable-rate fracturing) and offset Well T2 (constant-rate fracturing) in the Ma X block. The variable-rate operation in Well T1 (Figure 16a) demonstrates three distinct phases: (1) During the 126 min circulation test phase preceding Point A, stable tubing pressure is maintained at 80 MPa, followed by a pressure decline with rate reduction, confirming effective inter-stage isolation. At Point A (8 m3/min), significant pressure fluctuations between Points A and B indicate fracture–gravel interactions where fractures likely bypassed large gravel particles while continuing propagation, exhibiting pressure characteristics consistent with Chapter 3’s peak fluctuation patterns. (2) The stepped pressure profile during the 9 m3/min phase (minimum pressure ~70 MPa) reflects continuous fracture extension. (3) Post-336 min, the rate increases to 12 m3/min during proppant loading and shows moderate pressure rise without stabilization, suggesting accelerated fracture propagation under stress anisotropy.
In contrast, Well T2’s conventional curve (Figure 16b) displays sustained 90 MPa pressure under constant 11 m3/min injection, with gradual decline during proppant stages. Comparative analysis reveals variable-rate fracturing’s advantages: (a) reduced breakdown pressure through controlled low-rate phases, generating strong pressure waves; (b) optimized fracture propagation velocity (slow extension at low rates versus rapid growth at high rates); and (c) enhanced rock-breaking efficiency via pressure fluctuations that mechanically fatigue weak planes, as established in preceding fundamental principles.
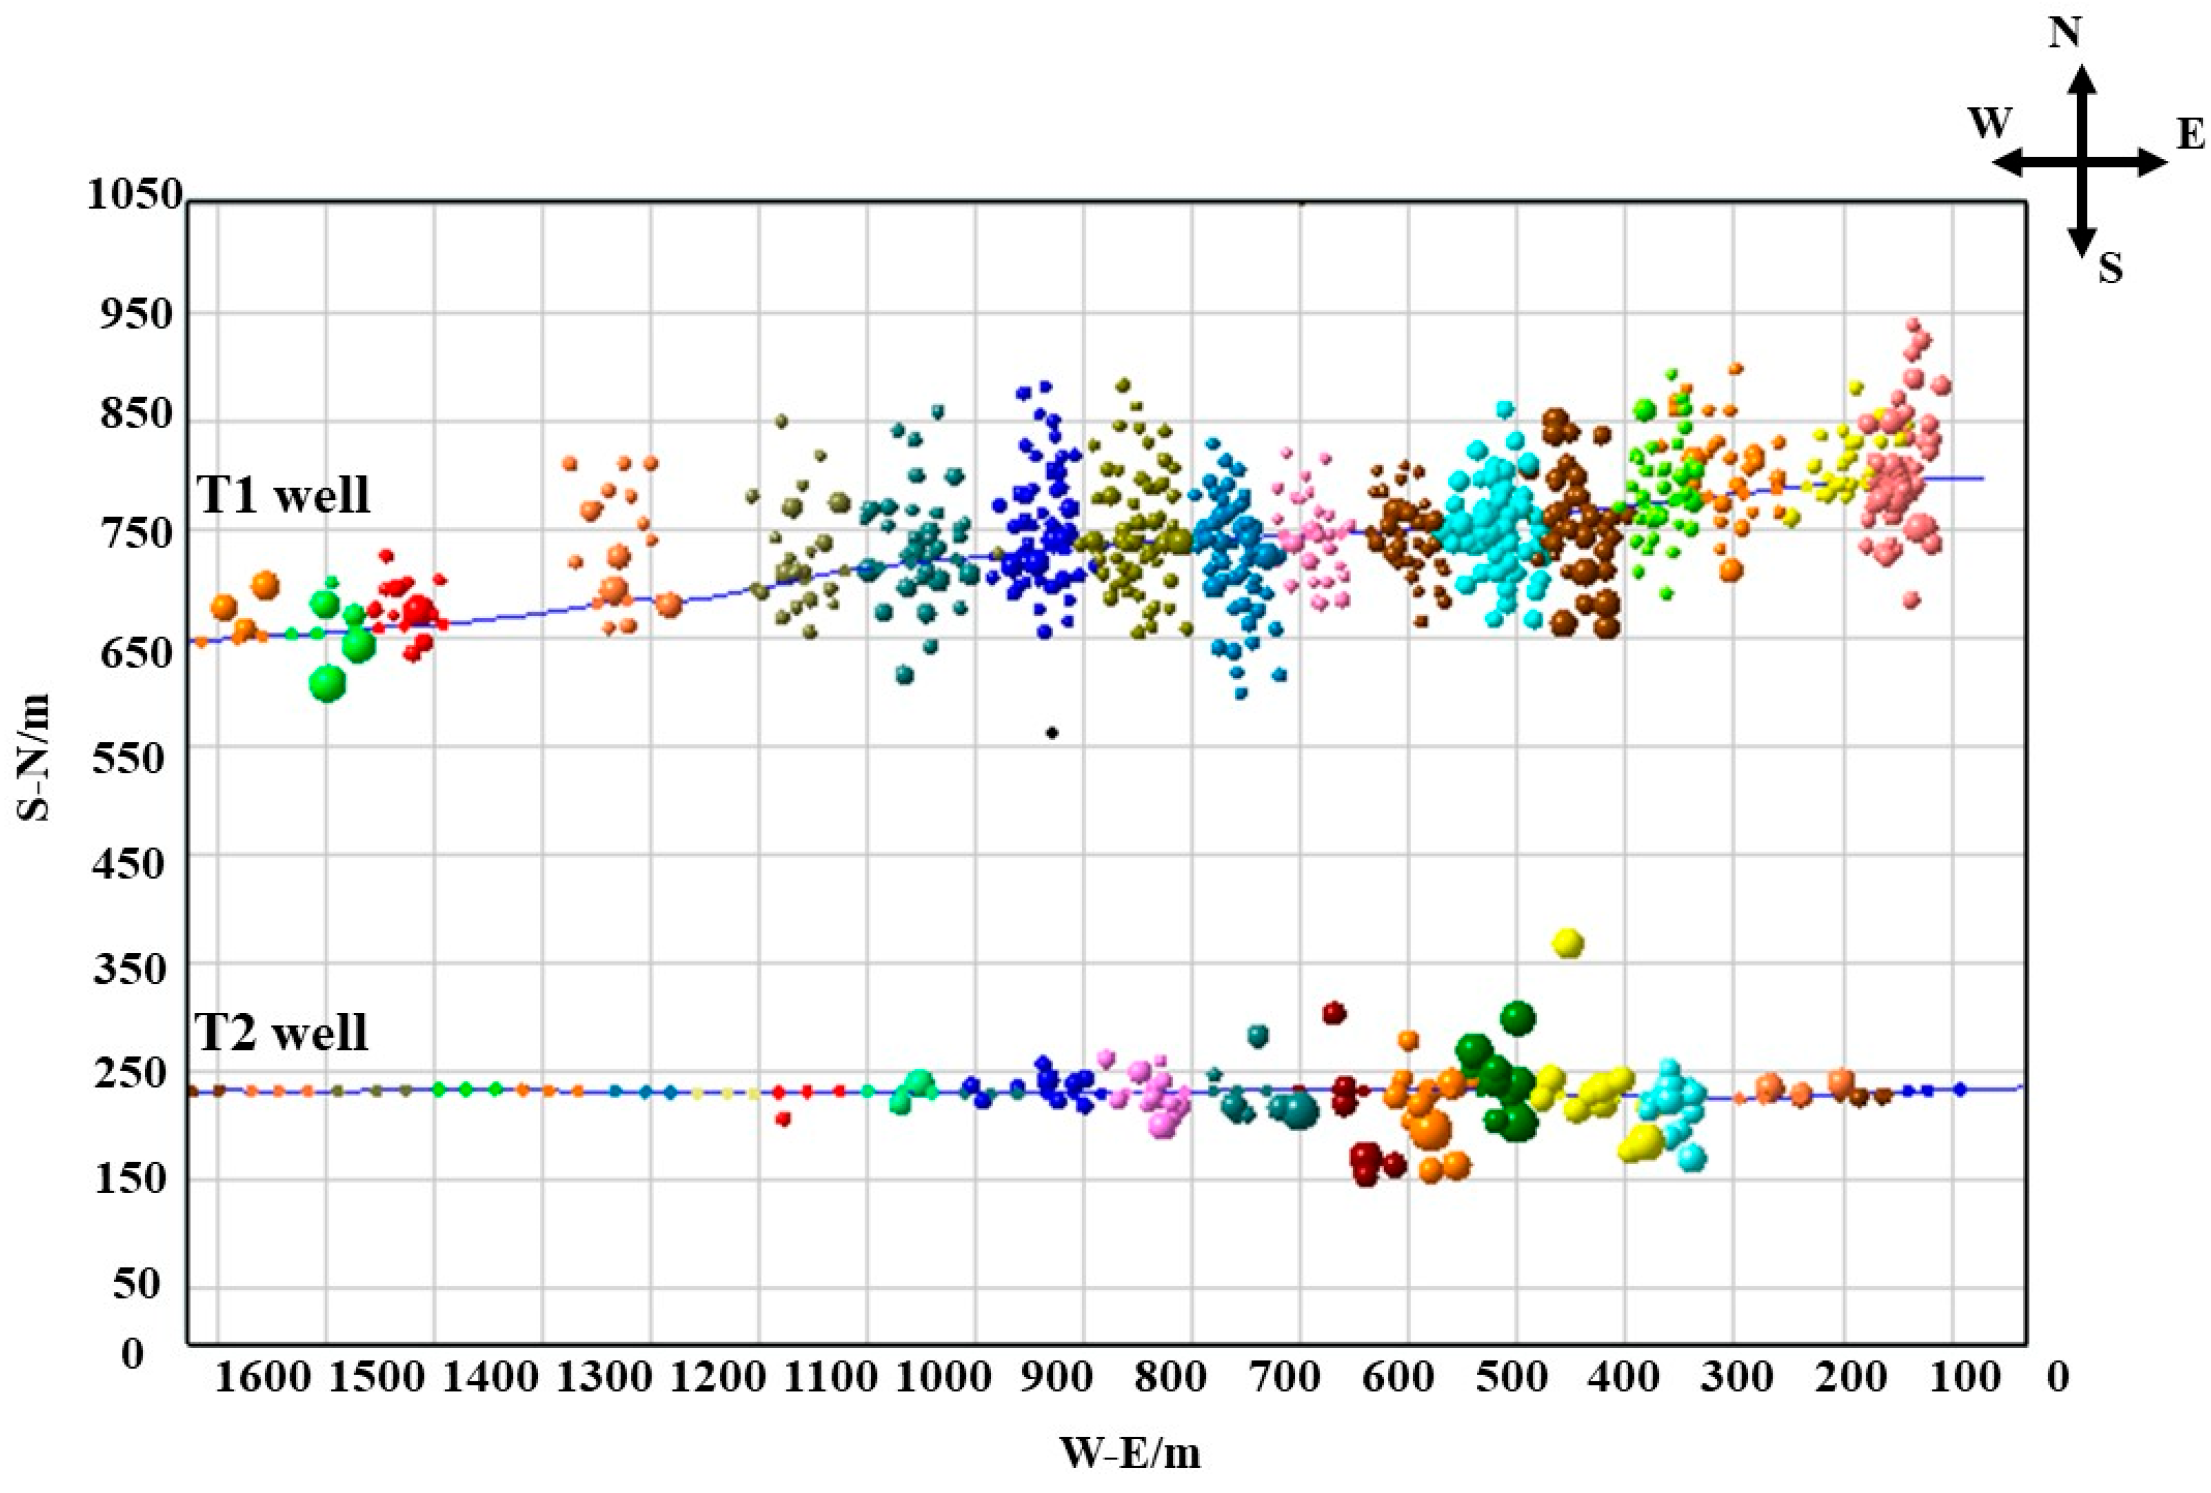
A comparative analysis of microseismic monitoring results between Well T1 (variable-rate fracturing) and Well T2 (constant-rate fracturing) was conducted to further evaluate the stimulation effectiveness of variable-rate technology, with both wells having comparable horizontal section lengths and targeting the same T1b2 weakly cemented argillaceous tight conglomerate reservoir (Figure 17). The results demonstrate significant differences: Well T1 exhibited clear microseismic events with fractures predominantly oriented north–south, showing asymmetric distribution along the wellbore, with an average half-length of 120 m and concentrated microseismic clusters within each stage. In contrast, Well T2 displayed sparse microseismic events primarily clustered near the toe section, with poor event detection in subsequent stages indicating limited stimulated reservoir volume (SRV), and shorter fracture half-lengths averaging 100 m. This microseismic comparison conclusively demonstrates the superior performance of variable-rate fracturing in weakly cemented conglomerate reservoirs, with 20% greater fracture half-length and significantly enhanced fracture network complexity compared to conventional constant-rate operations.

5. Analysis and Conclusions

This study focuses on the tight conglomerate reservoirs of the Baikouquan Formation in the Ma X well block. Through triaxial compression failure experiments and true triaxial hydraulic-fracturing physical simulation tests, we investigated the failure mechanisms of tight conglomerates and the controlling factors of fracture morphology. From a macroscopic perspective, we characterized the propagation patterns of hydraulic fractures in weakly cemented argillaceous tight conglomerates and analyzed the failure mechanisms and dominant factors influencing fracture geometry, providing a foundation for subsequent field trials of variable-rate fracturing. Based on these research findings, we developed an optimized fracturing treatment design workflow and conducted field tests of variable-rate hydraulic fracturing. By integrating post-fracturing microseismic monitoring data with pumping pressure curves, we evaluated the feasibility of applying variable-rate fracturing technology to enhance stimulated reservoir volume in tight conglomerate reservoirs. The key conclusions derived from this study are as follows:
(1)
Triaxial compression tests revealed that tight conglomerate failure occurs through two distinct mechanisms—shear failure followed by plastic failure, with the plastic phase predominantly characterized by gravel particle fragmentation; meanwhile, weakly cemented argillaceous tight conglomerates develop both circumgranular (around gravel) and transgranular (through gravel) fracture paths.
(2)
True triaxial hydraulic fracturing experiments using synthetic cores demonstrated that weakly cemented conglomerates primarily form circumgranular fractures during stimulation, with horizontal stress anisotropy (Δσ = σHσh) being the dominant factor controlling fracture propagation direction and geometry, while multi-cluster perforating showed minimal influence on fracture morphology.
(3)
The oscillatory pressure generated during variable-rate fracturing was identified as the key mechanism enhancing rock breakage efficiency, with staged rate variations proving particularly effective at reducing breakdown pressure in tight conglomerate reservoirs.
(4)
Comparative analysis confirmed that variable-rate fracturing significantly improves stimulated reservoir volume over conventional methods by 30–45%, achieved through enhanced activation of weakly cemented interfaces between gravel particles and superior fracture network coverage, as evidenced by 35% greater microseismic event density.

Author Contributions

Methodology, X.C.; data curation, Z.F.; writing—original draft, Z.W.; writing—review and editing, W.X. and S.W. All authors have read and agreed to the published version of the manuscript.

Funding

This research received no external funding.

Data Availability Statement

The original contributions presented in this study are included in the article. Further inquiries can be directed toward the corresponding author.

Conflicts of Interest

Zhenyu Wang, Wei Xiao, and Xianping Cao were employed by China ZhenHua Oil Company Limited. The remaining author declares that the research was conducted in the absence of any commercial or financial relationships that could be construed as potential conflicts of interest.

References

  1. Du, H.; Xu, J.; Li, X.; Lu, J.; Zhang, J.; Peng, Y.; Chen, J.; Wang, L. Development and deepening of profitable development of tight glutenite oil reservoirs in Xinjiang oilfield: Application of geology-engineering integration in Mahu area and its enlightenment. China Pet. Explor. 2018, 23, 15–26. [Google Scholar] [CrossRef]
  2. Li, H.; Wang, X.; Li, Z. Evaluation of pore structure and classification method of glutenite reservoirs: A case study of the Triassic Baikouquan Formation in the Mabei Slope Zone. Pet. Geol. Eng. 2025, 39, 1–7. [Google Scholar]
  3. Gong, Q.; Ni, G.; Lu, S. Analysis on Features and Controlling Factors of Reservoir in Baikouquan Formation of Wuerhe Oilfield, Junggar Basin. China Pet. Explor. 2010, 15, 11–16+84. [Google Scholar]
  4. Guo, H.; Dan, X.; Li, Y.; Zou, Z.; Wang, L. Lower Limits of Reservoir Physical Properties and Controlling Factors of Baikouquan Formation on the Northern Slope of Mahu Sag. Xinjiang Pet. Geol. 2018, 39, 63–69. [Google Scholar]
  5. Kuang, L.; Tang, Y.; Lei, D.; Wu, T.; Qu, J. Exploration of Fan-Controlled Large-Area Lithologic Oil Reservoirs of Triassic Baikouquan Formation in Slope Zone of Mahu Depression in Junggar Basin. China Pet. Explor. 2014, 19, 14–23. [Google Scholar]
  6. Kuang, Y.; Sima, L.; Qu, J.; Wen, D.; Chen, M.; Wu, F. Influencing factors and quantitative evaluation for pore structure of tight glutenite reservoir:a case of the Triassic Baikouquan Formation in Ma 131 well field, Mahu Sag. Lithol. Reserv. 2017, 29, 91–100. [Google Scholar]
  7. Li, G.; Qin, J.; Xian, C.; Fan, X.; Zhang, J.; Ding, Y. Theoretical understandings, key technologies and practices of tight conglomerate oilfield efficient development: A case study of the Mahu oilfield, Junggar Basin, NW China. Pet. Explor. Dev. 2020, 47, 1185–1197. [Google Scholar] [CrossRef]
  8. Li, J.; Wu, B.; Zhao, H.; Cheng, N.; Huang, J. Adaptability of horizontal well volume fracturing to tight conglomerate reservoirs in Mahu oilfield. China Pet. Explor. 2019, 24, 250–259. [Google Scholar]
  9. Liu, T.; Shi, S.; Zheng, Z.; Ji, Y.; Wang, L. Application of geology-engineering integration for developing tight oil in glutenite reservoir by horizontal wells in Mahu sag. China Pet. Explor. 2018, 23, 90–103. [Google Scholar]
  10. Qin, J.; Xian, C.; Zhang, J.; Liang, T.; Wang, W.; Li, S.; Zhang, J.; Zhang, Y.; Zhou, J. Characteristics of hydraulic fracture network in the tight conglomerate reservoir based on a hydraulic fracturing test site. Pet. Explor. Dev. 2025, 52, 217–228. [Google Scholar] [CrossRef]
  11. Khormali, A.; Ahmadi, S.; Aleksandrov, A.N. Analysis of reservoir rock permeability changes due to solid precipitation during waterflooding using artificial neural network. J. Pet. Explor. Prod. Technol. 2025, 15, 17. [Google Scholar] [CrossRef]
  12. Debotyam, M.; Jordan, C. A systematic interpretation of subsurface of proppant concentration from drilling mud returns: Case study from hydraulic fracturing test site (HFTS-2) in Delaware basin. In Proceedings of the Unconventional Resources Technology Conference, Houston, TX, USA, 26–28 July 2021. URTEC 2021-5189-MS. [Google Scholar]
  13. Maity, D.; Ciezobka, J. An Interpretation of Proppant Transport Within the Stimulated Rock Volume at the Hydraulic-Fracturing Test Site in the Permian Basin. SPE Reserv. Eval. Eng. 2019, 22, 477–491. [Google Scholar] [CrossRef]
  14. Tang, H.; Liang, H.; Zhang, L.; Qin, J.; Li, Y.; Zhang, J. Hydraulic fracture extension patterns of conglomerate reservoirs and relevant influencing factors. Acta Pet. Sin. 2022, 43, 871–884. [Google Scholar]
  15. Cai, W.; Feng, Y.; Yan, W.; Jiang, Q.; Meng, X.; Liu, K. Fracability Evaluation of Conglomerate Reservoirs in Baikouquan Formation in Ma-131 Well Block. Xinjiang Pet. Geol. 2022, 43, 194–199. [Google Scholar]
  16. Fan, M.; Jin, Y.; Fu, W.; Chen, M. Experimental study on fracture propagation behavior based on acoustic emission characteristics. Chin. J. Rock Mech. Eng. 2018, 37 (Suppl. S2), 3834–3841. [Google Scholar]
  17. Wang, L.; Yang, C.; Guo, Y.; Heng, S.; Wei, Y.; Hou, Z.; Li, D. Investigation on fracture initiation modes of horizontal wells based on laboratory hydraulic fracturing test. Chin. J. Rock Mech. Eng. 2015, 34 (Suppl. S2), 3624–3632. [Google Scholar]
  18. Xu, Y.; Lei, Q.; Chen, M.; Wu, Q.; Yang, N.; Wang, D.; Li, D.; Jiang, H. Progress and development of volume stimulation techniques. Pet. Explor. Dev. 2018, 45, 874–887. [Google Scholar] [CrossRef]
  19. Cheng, Y.; Wang, G.; Wang, R. Rock mechanics problems in horizontal well fracturing. Chin. J. Rock Mech. Eng. 2004, 23, 2463–2466. [Google Scholar]
  20. Zhang, J.; Zhang, C.; Zhang, Z.; Zhang, C.; Nie, X. Brittleness of tight gas reservoirs based on stress-strain curves. Lithol. Reserv. 2017, 29, 126–131. [Google Scholar]
  21. Whebell, R.J.; Moroney, T.J.; Turner, I.W.; Pethiyagoda, R.; McCue, S.W. Implicit reconstructions of thin leaf surfaces from large, noisy point clouds. Appl. Math. Model. 2021, 98, 416–434. [Google Scholar] [CrossRef]
  22. Maurel-Pantel, A.; Vosin, M.; Bui, Q.; Cocheteau, N.; Lebon, F.; Hochard, C. A cohesive zone model for fracture initiation and propagation of fused silica direct bonding interface. Eng. Fract. Mech. 2019, 219, 106649. [Google Scholar] [CrossRef]
  23. Bayat, M.; Ahmadi, H.R.; Kia, M.; Cao, M. Probabilistic seismic demand of isolated straight concrete girder highway bridges using fragility functions. Adv. Concr. Constr. 2019, 7, 183–189. [Google Scholar]
  24. Hou, B.; Chen, M.; Cheng, W.; Tan, P. Fracturing mechanism of shale gas reservoir with variable pump rates. Chin. J. Geotech. Eng. 2014, 36, 2149–2152. [Google Scholar]
  25. Yang, B.; Jiang, T.; Ding, Y.; Wang, Y.; Wang, S. Low damage fracturing technology for explo-ration wells in low porosity and permeability reservoirs. Pet. Explor. Dev. 2005, 32, 119–122. [Google Scholar]
Figure 1. Crack morphology of samples in 1 group after the experiment: (a) 0 MPa experimental condition, (b) 20 MPa experimental condition, and (c) 40 MPa experimental condition (dimensions: 15 cm (L) × 20 cm (W)).
Processes 13 02494 g001
Figure 2. Crack morphology of samples in group 2 after the experiment: (a) 0 MPa experimental condition, (b) 20 MPa experimental condition, (c) 40 MPa experimental condition, (d) 60 MPa experimental condition, and (e) 80 MPa experimental condition (dimensions: 15 cm (L) × 20 cm (W)).
Processes 13 02494 g002
Figure 3. Comparative analysis of in situ reservoir conglomerate versus synthetic laboratory analogs: (a) reservoir conglomerate and (b) experimental conglomerate.
Processes 13 02494 g003
Figure 4. Schematic diagram of the large-scale true triaxial experimental apparatus [14].
Processes 13 02494 g004
Figure 5. Fracture morphology and pump pressure curves of the G1 sample after hydraulic: (a) post-fracturing crack geometry, (b) crack geometry reconstruction, and (c) pump pressure curve.
Processes 13 02494 g005
Figure 6. Fracture morphology and pumping curve of the G2 sample after pressure: (a) post-fracturing crack geometry, (b) fracture morphology reconstruction, and (c) pump pressure curve.
Processes 13 02494 g006
Figure 7. Fracture morphology and pump pressure curve of the G3 sample after pressure: (a) post-fracturing crack geometry, (b) fracture morphology reconstruction, and (c) pump pressure curve.
Processes 13 02494 g007
Figure 8. Fracture morphology and pumping curve of the G4 samples after pressure: (a) post-fracturing crack geometry, (b) fracture morphology reconstruction, and (c) pump pressure curve.
Processes 13 02494 g008
Figure 9. Fracture morphology and pumping curve of the G5 sample after pressure: (a) post-fracturing crack geometry, (b) fracture morphology reconstruction, and (c) pump pressure curve.
Processes 13 02494 g009
Figure 10. G6 sample experimental conclusions: (a) post-fracturing crack geometry, (b) fracture morphology reconstruction, and (c) pump pressure curve.
Processes 13 02494 g010
Figure 11. G7 sample experimental conclusions: (a) post-fracturing crack geometry, (b) fracture morphology reconstruction, and (c) pump pressure curve.
Processes 13 02494 g011
Figure 12. G8 sample experimental conclusions: (a) post-fracturing crack geometry, (b) fracture morphology reconstruction, and (c) pump pressure curve.
Processes 13 02494 g012aProcesses 13 02494 g012b
Figure 13. Unsteady fluctuating flow of fracturing fluid in fractures [24].
Processes 13 02494 g013
Figure 14. Flow chart of optimal design of fracturing scheme.
Processes 13 02494 g014
Figure 15. Logging interpretation of reservoir in situ stress and compressibility coefficient in Well T1.
Processes 13 02494 g015
Figure 16. Comparison between variable displacement fracturing pump injection curve and conventional displacement fracturing pump injection curve.
Processes 13 02494 g016
Figure 17. Microseismic event monitoring of two wells.
Processes 13 02494 g017
Table 1. Sample statistics and experimental conditions for triaxial compression experiments.
SetTest NumberFormationTypeGravel HardnessMatrix HardnessExperimental Confining Pressure
GPaGPaMPa
11-1T1b3Clay matrix binding3.210.180
1-2T1b3Clay matrix binding20
1-3T1b3Clay matrix binding40
22-1T1b1Calcareous cementation3.141.560
2-2T1b1Calcareous cementation20
2-3T1b1Calcareous cementation40
2-4T1b1Calcareous cementation60
2-5T1b1Calcareous cementation80
Note: The mechanical parameters and particle size statistics of the experimental samples are averages.
Table 2. Rock mineral composition of the Triassic Baikouquan Formation.
Well IDLayerLithologyContent/%
Clay MineralsQuartzK-FeldsparPlagioclaseCalciteAnkeriteFerroan Calcite
MH01T1b3Conglomeratic sandstone5.6537.4814.2238.77(-)3.88(-)
T1b2Conglomeratic sandstone9.2352.498.7526.25(-)3.28(-)
MH 02T1b2Conglomeratic sandstone2.2958.8511.127.76(-)(-)(-)
MH 03T1b3Conglomeratic sandstone5.1553.0311.2227.54(-)3.06(-)
T1b2Conglomeratic sandstone6.3554.99.6926.91(-)2.15(-)
MH 04T1b3Conglomeratic sandstone8.9225.5815.3517.4(-)(-)32.75
T1b3Conglomeratic sandstone6.0555.269.9526.53(-)(-)2.21
T1b3Conglomeratic sandstone6.6246.6921.5525.14(-)(-)(-)
T1b3Conglomeratic sandstone6.1652.7810.5626.98(-)3.52(-)
T1b3Conglomeratic sandstone9.8438.823.9727.39(-)(-)(-)
T1b3Conglomeratic sandstone6.7833.785.8325.64(-)(-)27.97
T1b3Conglomeratic sandstone5.6544.269.3226.79(-)(-)13.98
MH 05T1b2Conglomeratic sandstone9.3552.610.0725.74(-)2.24(-)
MH 06T1b3Conglomeratic sandstone3.5544.9214.5330.396.61(-)(-)
MH 07T1b1Conglomeratic sandstone6.2132.62(-)57.09(-)4.08(-)
T1b2Conglomeratic sandstone8.7452.6510.5328.08(-)3.65(-)
T1b1Conglomeratic sandstone9.9742.5810.9532.85(-)(-)(-)
Mean(-)(-)6.8545.8412.3529.256.613.2319.23
Table 3. Comparative analysis of mechanical properties.
NumberElastic
Modulus/GPa
Poisson’s
Ratio/ν
Compressive
Strength/MPa
Sample20.010.2667.52
Artificial sample 1 25.620.2472.52
Artificial sample 2 23.380.2473.33
Artificial sample 3 19.530.2565.89
Artificial sample 4 24.510.2663.32
Artificial sample 5 23.360.2475.83
Artificial sample 6 21.060.2661.23
Table 4. Indoor large model hydraulic fracturing experimental plan.
NumberLabelingGravel
Size
Packing
Style
σH/MPaσh/MPaσV/MPaInjection
Rate/mL/min
Cluster
Spacing/cm
1G1Mixed sizeBulk disorder585462200
G2Mixed sizeBulk disorder585062200
G3Mixed sizeBulk disorder584362200
2G4Mixed sizeBulk disorder584362206 (Two clusters)
G5Mixed sizeBulk disorder584362204 (Three clusters)
3G6Mixed sizeBulk disorder584362150
G7Mixed sizeBulk disorder58436210/15/200
G8Mixed sizeBulk disorder584362350
Disclaimer/Publisher’s Note: The statements, opinions and data contained in all publications are solely those of the individual author(s) and contributor(s) and not of MDPI and/or the editor(s). MDPI and/or the editor(s) disclaim responsibility for any injury to people or property resulting from any ideas, methods, instructions or products referred to in the content.