Abstract
Phosphorus (P) release from reservoir sediments critically influences water quality and ecosystem stability. This study analyzed surface sediments from four representative zones to investigate phosphorus fraction distribution, key influencing factors, and implications for water quality. Results showed that total phosphorus (TP) content in sediments from main and tributary inflow zones was significantly higher than in open-water and transition zones. Inorganic phosphorus (IP) was the dominant form, with iron-bound phosphorus (Fe-P) accounting for 33.2–42.0% of IP. A strong correlation existed between P release and the Fe/P molar ratio; notably, when the ratio approached 10, phosphorus desorption increased significantly, indicating a shift from sink to source. Sediments with grain sizes <0.01 mm had the highest P release rates, suggesting particle size, Fe content, and hydrodynamics jointly regulate P mobilization. Using the Diffusive Gradients in Thin Films (DGT) technique, phosphorus release in inflow zones exceeded 1 g/m2 in all hydrological periods, contributing substantially to internal loading. Sediment-derived P primarily influenced bottom water, while surface water was more affected by external inputs. These findings highlight the spatial heterogeneity of P release and underscore the need for zone-specific management strategies in reservoir systems.
1. Introduction
Drinking water reservoirs serve as essential infrastructure for ensuring municipal water supply and promoting regional socio-economic development, and they are recognized as a key pillar of national water security strategies [1,2]. However, with the intensification of watershed development and continuous inputs of exogenous pollutants, nutrient accumulation—especially phosphorus (P)—has become increasingly prominent in many reservoirs [3,4]. Among various sources, sediments function as both sinks and potential internal sources of P. Internal P loading, primarily driven by the release of iron-bound phosphorus (Fe-P) under anoxic conditions, is known to elevate bottom water nutrient concentrations, reduce water transparency, and impair aquatic ecosystem functions [5,6]. Hydrodynamic disturbances and changes in redox potential exacerbate this process, further complicating water quality management in reservoir systems [7].
The release behavior of phosphorus is influenced by a combination of factors, including sediment composition, phosphorus speciation, and local hydrodynamic conditions [8]. This results in substantial spatial heterogeneity in internal phosphorus release within different reservoir zones. Despite numerous studies highlighting the significance of these factors, a systematic understanding of how sediment heterogeneity and coupled mechanisms interact to regulate P release remains insufficient. Without such knowledge, it is difficult to design effective early warning systems or formulate zone-specific management strategies for phosphorus pollution control. Consequently, recent research has increasingly focused on the spatial distribution patterns of sediments, the speciation of phosphorus, and their combined effects on release potential [9,10].
To address these challenges, researchers have employed advanced methods such as geomorphological remote sensing, hydrodynamic modeling, and sediment transport simulations. Hadian and Mosaedi [11] demonstrated the utility of remote sensing in estimating sediment concentrations, while Liu [12] developed a two-dimensional hydrodynamic-sediment transport model to explore the influence of upstream dam construction on flow and sediment distribution. Ruiping et al. [13] combined field surveys and numerical models to assess salinity and solute release processes in estuarine reservoirs. Remote sensing was also successfully used by Foteh et al. [14] to delineate surface area changes and sedimentation rates. Building on these studies, recent work has shifted toward nutrient dynamics in sediments. For instance, Yang et al. [15] applied DGT techniques to measure labile P fluxes under aerobic and anaerobic conditions, while Guo et al. [16] and Márquez-Pacheco and Hansen [17] examined P fractionation and redox sensitivity in sediment profiles. These studies collectively provide a multi-perspective foundation for understanding internal phosphorus loading processes.
Despite these advances, deep-water reservoirs present unique challenges due to their complex hydrodynamics and vertical stratification. During summer, thermal stratification forms a persistent thermocline that limits vertical mixing and oxygen transport, leading to hypoxic or anoxic conditions in the hypolimnion [18]. This environment promotes the reductive dissolution of Fe-P, significantly increasing the release of bioavailable phosphorus into bottom waters [19,20]. In contrast, surface waters are more directly affected by external inputs such as watershed runoff and precipitation events, which contribute to rapid and variable changes in P concentrations [21,22]. The spatial heterogeneity of hydrodynamic conditions across zones may lead to localized accumulation and abrupt release of phosphorus following the breakdown of stratification, thereby posing potential threats to drinking water quality and ecosystem stability.
In this study, Zhanghe Reservoir—a deep, thermally stratified drinking water source in Jingmen City, Hubei Province, China—was selected as the research site. Based on reservoir morphology and hydrological conditions, the study area was divided into four functional zones. Sediment core samples were collected during the dry, normal, and wet seasons to evaluate vertical profiles of sediment characteristics (e.g., water content, organic matter, grain size) and phosphorus fractions (Fe-P; calcium-bound phosphorus, Ca-P; inorganic phosphorus, IP; organic phosphorus, Org-P). The interactions between sediment grain size and metal elements were analyzed to explore their influence on P release potential. Phosphorus fluxes were quantified to identify high-risk release zones [23,24]. A three-dimensional evaluation framework was established, integrating spatial zoning, P speciation, and release risk to elucidate internal loading mechanisms. This framework is intended to support predictive assessments of water quality risk and provide a theoretical basis for the ecological regulation of drinking water reservoirs.
2. Materials and Methods
2.1. Study Area
Zhanghe Reservoir (111°51′–113°29′ E, 30°32′–31°36′ N) is situated in the northwestern part of the Jianghan Plain in Hubei Province, China (see Figure 1). Spanning the administrative regions of Jingmen, Xiangyang, and Yichang, it is a large-scale, multi-purpose reservoir primarily constructed for irrigation, with additional functions including municipal water supply, hydropower generation, and navigation. Construction commenced in July 1958, and the reservoir was completed and officially commissioned in April 1966.
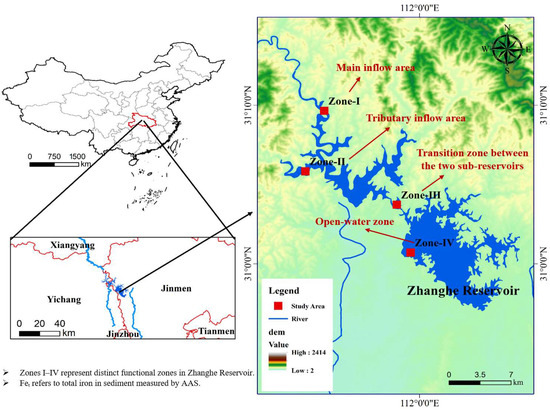
Figure 1.
Overview of sampling zones and study design.
The reservoir has a total storage capacity of 2.113 billion m3, comprising a beneficial storage capacity of 924 million m3 and a flood control storage capacity of 421 million m3. At the normal water level of 123.50 m, the reservoir covers a surface area of approximately 105.20 km2. The design flood limit water level is 122.60 m, while the flood control water level is 123.92 m. Zhanghe Reservoir is designed to withstand a 1-in-500-year flood event and is classified as a Class I reservoir under Chinese reservoir classification standards.
The irrigation district associated with the reservoir encompasses a natural area of 5544 km2, with a designed irrigation area of approximately 1736.8 km2 and an effective irrigation area of approximately 1556.7 km2. The region experiences a subtropical monsoon climate, with a long-term average annual temperature of 16.5 °C and a mean annual precipitation of approximately 987 mm, primarily occurring between April and September. Annual evaporation ranges from 700 to 1000 mm, with monthly values varying from a maximum of 150 mm to a minimum of 16.5 mm [25].
Zhanghe Reservoir serves as the sole drinking water source for more than 500,000 residents in the urban area of Jingmen City and also functions as a key irrigation source supporting grain production in the region.
2.2. Survey Equipment
In this study, the SYQ Terrestrial Waterbody Sediment Survey System was employed to conduct underwater topographic mapping and sediment detection in representative zones of the reservoir (see Figure A1). This system was used to investigate the spatial characteristics of underwater terrain and sediment distribution. Based on sonar principles, the system utilizes the differing penetration capacities and reflection behaviors of sound waves with varying frequencies but identical energy levels in a given medium. By emitting multi-frequency acoustic signals and receiving the reflected echoes through transducers, the system determines the sonar profile of bottom sediments by analyzing the time delays and frequency-dependent reflections in conjunction with the known velocity of sound in water.
This approach offers high spatial continuity and is particularly effective for estimating sediment thickness and volume when cross-sectional spacing is limited. In addition, high-frequency vibrating sediment coring drills were used to retrieve sediment cores from the reservoir bed. This equipment is widely utilized in soft sedimentary environments such as lakes, estuaries, and reservoirs, and it is capable of efficiently collecting structurally intact sediment profiles. The retrieved cores exhibited clear stratification, gradual interface transitions, and minimal disturbance, while the coring device itself is characterized by ease of operation and high sampling efficiency.
2.3. Water and Sediment Sample Collection
To capture the spatial heterogeneity of sediment and P distribution in Zhanghe Reservoir, the study area was divided into four representative zones (see Figure 1): Zone I (main inflow area), Zone II (tributary inflow area), Zone III (transition zone between the two sub-reservoirs), and Zone IV (open-water zone). The zoning scheme was established based on reservoir hydrodynamics, dominant flow paths, and sediment accumulation patterns. To account for temporal variability, sediment samples were collected during three key hydrological periods in 2024: the dry season, the normal-flow season, and the wet season (Table 1).

Table 1.
Sediment and water sample information at each sampling site.
Following sample collection, each sediment core was immediately sectioned into discrete layers for subsequent physicochemical analysis. Water samples were collected using a deep-water sampler, with 500 mL obtained per sampling event. All sediment and water samples were properly labeled, sealed, and preserved in accordance with standard protocols for environmental sample handling as outlined by the China National Standard HJ 493-2009 (Water Quality-Technical Specifications for Preservation and Handling of Samples) to ensure sample integrity [26]. The samples were transported to the laboratory within 8 h under controlled temperature conditions. This procedure was designed to maintain the stability of key physical and chemical properties, thereby enhancing the reliability and scientific validity of the subsequent analytical results.
2.4. Laboratory Analysis of Water and Sediment Samples
P fractions in the water column and overlying water of Zhanghe Reservoir were determined using the alkaline potassium persulfate digestion–molybdenum antimony anti-spectrophotometric method, as described by MC Almeida et al. [27]. The water content of sediment samples was measured using the oven-drying method at 105 °C [28], in which samples were dried to a constant weight and moisture content was calculated accordingly. The concentrations of heavy metals (Zn, Fe, Cd, Cr, Pb, As, Ni, and Cu) in surface sediments were determined using flame atomic absorption spectrophotometry (AAS, Shimadzu AA-6880, Shimadzu Corporation, Kyoto, Japan). A portion of the sediment samples was freeze-dried under vacuum, ground, and sieved through a 100-mesh (0.150 mm) screen for further analysis. The Fe concentration reported in this study represents total iron (Feₜ) in the sediment, measured following acid digestion and AAS analysis.
The organic matter content of the sediments was determined by the loss-on-ignition method at 550 °C, with samples ashed for 6 h prior to calculation. P fractions in sediment samples were analyzed following the SMT (Standards, Measurements, and Testing) protocol [29,30], as illustrated in Figure 2. Analytical precision was validated by repeated measurements of a certified standard sediment sample (GBW 07317-GSD-13), with the relative error of P concentration measurements maintained within 10% [31].
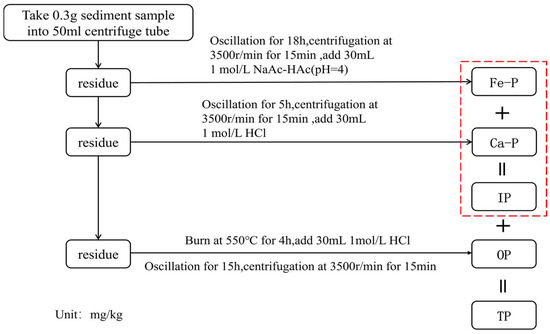
Figure 2.
Schematic diagram of the SMT-based sequential extraction procedure for P fractions in sediments.
The static sediment P release experiment, as described by Min et al. [32], is a widely used method for evaluating the potential release of P from sediments under undisturbed conditions (see Figure 2). The underlying principle involves simulating the sediment–water interface in the absence of external disturbances, thereby allowing the diffusion-driven release process to proceed naturally. By monitoring temporal changes in P concentrations in the overlying water, the sediment-to-water P flux can be quantified, as calculated using Equation (1).
In Equation (1), F represents the P release flux (mg·m−2·d−1); V is the volume of the overlying water in the incubation column (L); cn, c0, and cj−1 denote the P concentrations at the n-th sampling, the initial time (0), and the (j − 1)-th sampling, respectively (mg·L−1);* ca is the P concentration of the replenished water (mg·L−1); Vj−1 is the volume of water withdrawn during the (j − 1)-th sampling (L); S is the surface area of contact between the water and sediment (m2); and t is the incubation time (d).
The chemical speciation of heavy metals in surface sediments was determined using a modified Tessier sequential extraction procedure. This method involves the application of a series of selective reagents in order of increasing chemical reactivity to extract trace metal ions bound to distinct geochemical fractions. The procedure fractionates metals into five operationally defined phases: exchangeable, carbonate-bound, Fe/Mn oxide-bound, organic-bound, and residual. By targeting interactions between metal species and specific binding phases, this technique enables effective separation and quantification of heavy metal speciation within complex sediment matrices.
Grain size analysis of surface sediments was performed in the laboratory using a BT-9300ST (BUCHI Labortechnik AG, Flawil, Switzerland) laser diffraction particle size analyzer. The instrument features a resolution of 0.1 Φ and a measurement range of 0.1–500 μm. All measurements were conducted in triplicate, and the relative error of repeated tests was maintained below 3%, meeting the accuracy requirements for sedimentological analysis. Grain size classification followed the Udden–Wentworth scale [33], a widely accepted standard in sedimentology that defines particle size fractions based on logarithmic φ-scale intervals.
2.5. Phosphorus Pollution Assessment Methods
In this study, the double-membrane diffusion model was employed to estimate solute fluxes across the sediment–water interface. In this model, the ratio of the molecular diffusion coefficient to the membrane thickness (denoted as K) is used as a substitute for membrane thickness, which is typically difficult to determine directly. The model is based on the following three theoretical assumptions:
- (1)
- The system operates under relatively stable hydrodynamic conditions, with no significant disturbance at the sediment–water interface.
- (2)
- Within the double-membrane region, the solute concentration gradient along the diffusion direction is linear, and diffusion occurs under steady-state conditions.
- (3)
- The thickness of the diffusive boundary layer remains constant over time and is unaffected by physical disturbances.
Under these assumptions, nutrient losses due to sediment release can be considered negligible throughout the study period [34]. The mass transfer of contaminants across the sediment–water interface can be described using the theoretical framework of the double-membrane diffusion model. In this context, the solute flux N is governed by Fick’s First Law:
In Equation (2), N denotes the solute flux across the diffusive boundary layer (mg·m−2·d−1); D denotes the molecular diffusion coefficient of the solute in water (m2·d−1); δ denotes the thickness of the diffusive boundary layer (m); Cω denotes the equilibrium concentration of the contaminant in the aqueous phase (mg·L−1); and C denotes the concentration of the contaminant on the water side (mg·L−1).
The mass transfer coefficient K is defined as
Based on previous research [35], the value of K in this study was set to 1.2. According to the double-membrane diffusion model, the release flux of pollutants from the sediment can be calculated as follows:
The dynamic change in solute concentration in the overlying water can be described by a first-order kinetic model:
where dc/dt denotes the change rate of concentration in water over time; A donates the area of the sediment–water interface (m2).
From a mass balance perspective, the following expression also holds:
In Equation (6), V donates the volume of the overlying water (m3).
By integrating the above expression and assuming well-mixed conditions, the following exponential solution is derived:
Furthermore, this can be rearranged into a linear form for estimation of K:
Here, V/A represents the depth of the overlying water column in the experimental setup (m); t donates the diffusion time (d).
The total mass transferred during time t can be calculated as
In Equation (9), W donates the total mass of contaminant transferred from sediment to water during time t (mg).
2.6. Data Management and Analysis
All experimental data were organized using Microsoft Excel 365 and statistically analyzed with SPSS Statistics 25.0. Each measurement was performed in triplicate, and the results are reported as mean values with standard deviations (mean ± SD). Pearson correlation coefficients were calculated to assess the relationships between variables, and statistical significance was determined at the p < 0.05 level. Figures and graphs were generated using Origin 2021, while spatial distribution maps were produced with ArcGIS 10.2.
3. Results
3.1. Sediment Distribution Characteristics in Reservoir Sampling Zones
Zone I corresponds to the mainstream inflow area of the reservoir and functions as the primary conduit for both runoff and sediment input. The average water depth in this zone is approximately 14 m. Due to the substantial sediment load transported by inflowing water, Zone I exhibits pronounced sedimentation characteristics. Notably, sampling point ZH-2, located at the confluence of the mainstream and tributary, recorded the greatest sediment thickness among all eight sampling points, reaching 1.3 m (Figure 3).
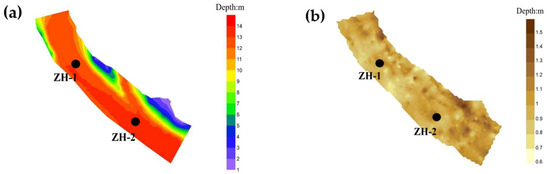
Figure 3.
Distribution of sediment and underwater topography in Zone I: (a) bathymetric chart; (b) Expected distribution chart.
Zone II represents the tributary inflow area, with sampling points ZH-3 and ZH-4 located within a typical backwater region. The average water depth in this zone is approximately 11 m, slightly shallower than that of Zone I. The average sediment thickness is around 1.0 m, also marginally lower than that observed in the mainstream inflow zone. Notably, sediment thickness at sampling point ZH-3 reaches 1.12 m. However, due to substantially lower runoff and sediment input compared to the mainstream, the overall sedimentation intensity in Zone II is reduced relative to Zone I (Figure 4).
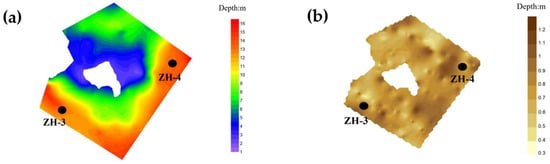
Figure 4.
Distribution of sediment and underwater topography in Zone II: (a) bathymetric chart; (b) expected distribution chart.
Zone III represents the confluence area of the two sub-reservoirs and is characterized as a typical hydrodynamic transition zone. The underwater topography in this region exhibits a channel-like structure, with greater depths in the center and shallower margins. The average water depth is approximately 8 m, with a maximum depth reaching 13 m. Pronounced longitudinal water exchange indicates continuous hydrodynamic disturbances, which hinder the long-term accumulation of sediments and result in relatively weak sedimentation capacity [36]. Consequently, the average sediment thickness in this zone is only 0.25 m, significantly lower than those recorded in Zones I and II (Figure 5).
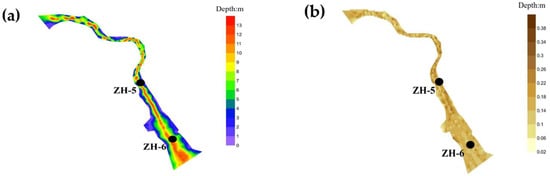
Figure 5.
Distribution of sediment and underwater topography in Zone III: (a) bathymetric chart; (b) Expected distribution chart.
Zone IV corresponds to the open-water area of the reservoir, located in its downstream section. This zone is characterized by a broad water surface and considerable depth, with an average water depth of approximately 20 m, reflecting the typical features of a deep reservoir body. Sediment accumulation in this zone is minimal, with relatively low sediment thickness and limited deposition capacity. The average sediment thickness is significantly lower than in the other zones, indicating weak sediment retention due to reduced sediment input and enhanced vertical mixing (Figure 6).
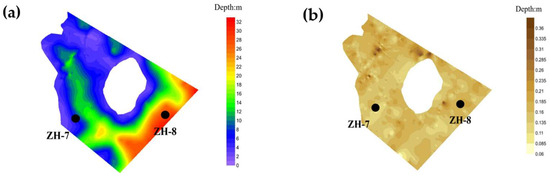
Figure 6.
Distribution of sediment and underwater topography in Zone IV: (a) bathymetric chart; (b) Expected distribution chart.
Sediment composition exhibited distinct spatial variation across the four zones (Figure 7a,b). In Zone I (ZH-2), the sediment was characterized by high silt (73%) and clay (6.6%) content, along with elevated organic matter (11.5%) and moisture (57.5%) levels. This combination reflects a typical “fine particle-high organic matter-high moisture” pattern, largely driven by inflow-induced deposition of fine suspended materials [37]. In Zone II, average silt (65%) and clay (5%) contents were slightly lower, and organic matter content averaged 9.3%. This is attributed to backwater conditions with slower flow velocities, which still favor the accumulation of organic-rich, moist sediments. In contrast, Zone III (ZH-6) showed a shift toward coarser particles, with sand reaching 58% and organic matter decreasing to 7.8%, indicating intensified hydrodynamic disturbance that hinders the deposition of fine materials [36]. Finally, Zone IV (ZH-8; sampling site ZH-8 was chosen to represent the open-water region of Zhanghe Reservoir due to its central location within the main reservoir body) sediments were dominated by sand (47%) and silt (49%), with the lowest organic matter (5.6%) and moisture (28%) content across all sites, suggesting limited depositional input and enhanced vertical mixing in the open-water region.
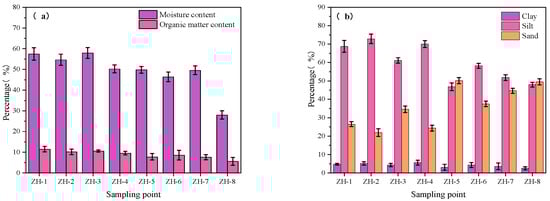
Figure 7.
Physicochemical properties of sediments at sampling sites: (a) moisture content and organic matter content; (b) percentage of each particle size class.
Overall, sediment moisture content exhibited a spatial trend of “high in the upstream zones and low in the downstream zones,” suggesting that sediment structure is regulated by a spatially coupled mechanism involving particle size distribution, hydrodynamic disturbances, and interactions between mineral particles and organic matter.
3.2. Composition Characteristics of Phosphorus Fractions in Reservoir Sediments
As shown in Figure 8a, sediment phosphorus in Zhanghe Reservoir was dominated by inorganic phosphorus (IP), accounting for 87.4%, 87.1%, 82.6%, and 86.6% of total phosphorus (TP) in Zones I through IV, respectively. Organic phosphorus (Org-P) contributed less, ranging from 12.5% to 14.4%. Among IP fractions, calcium-bound phosphorus (Ca-P) was predominant, comprising 57.4% to 66.8% of IP, with concentrations highest in Zone I (385.27 mg/kg) and Zone II (344.11 mg/kg) and much lower in Zone III (88.57 mg/kg) and Zone IV (40.66 mg/kg). Given its chemical stability, Ca-P poses a relatively low release risk under current environmental conditions [38].
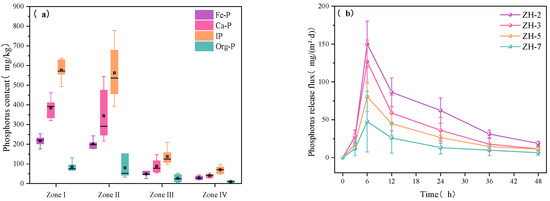
Figure 8.
(a) P fractions in sediments from typical zones; (b) P release fluxes at four sampling sites.
In contrast, iron-bound phosphorus (Fe-P) averaged 37.28% of IP and showed substantial spatial variation [39]. Its concentrations in Zones I (193.55 mg/kg) and II (176.58 mg/kg) were markedly higher than in Zones III (43.51 mg/kg) and IV (27.53 mg/kg), indicating that the mainstream and tributary inflow areas receive greater external inputs of reactive P. As Fe-P is sensitive to redox changes, its elevated presence in these zones suggests a higher potential for internal P release, particularly under anoxic or fluctuating oxygen conditions.
3.3. Vertical Distribution Characteristics of Different Phosphorus Fractions in Sediments
Considering the significant differences in average sediment accumulation thickness among the typical functional zones, one representative sampling point was selected from each of Zones I–IV to investigate the vertical distribution of P fractions under different sedimentary environments (see Figure 9). The results showed that Fe-P exhibited relatively high concentrations at the sediment–water interface across all sampling points, followed by a gradual decline with increasing sediment depth [40]. This pattern is attributed to the fact that P release is strongly influenced by external environmental factors such as temperature, pH, dissolved oxygen, and hydrodynamic disturbances [41]. Fluctuations in these factors can promote the mobilization of Fe-P from sediment particles, resulting in its accumulation near the interface.
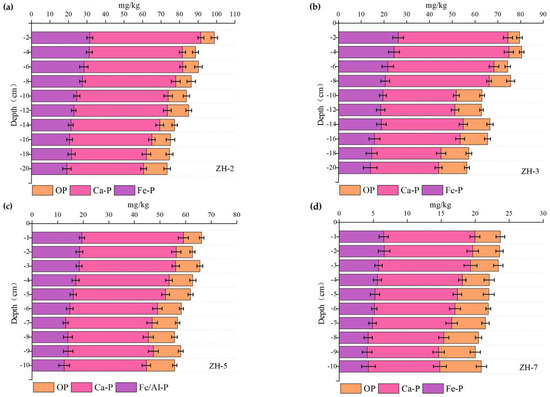
Figure 9.
Vertical distribution of different P fractions in sediments at sampling sites ZH−1, ZH−3, ZH−5, and ZH−7.
In contrast, Org-P displayed the opposite vertical trend, with relatively low concentrations at the sediment surface that increased progressively with depth, indicating its long-term stability and preservation in deeper sediment layers [35].
Specifically, at sampling point ZH-2 in Zone I, Fe-P and Ca-P concentrations in the 0-4 cm layer were 31.2 mg/kg and 60.2 mg/kg, respectively—the highest values observed among all zones—suggesting a strong influence from external inputs. In Zone II (sampling point ZH-3), the vertical distribution trends of P fractions were generally consistent with those observed at ZH-2, although overall concentrations were slightly lower. Notably, the Org-P content in ZH-3 increased from 5.1 mg/kg at the surface to 12.44 mg/kg in deeper layers, further supporting the hypothesis of vertical accumulation and stability of Org-P.
As shown in Figure 8b and Figure 10a, no clear correlation was observed between P release flux and the sedimentary forms of Org-P and Ca-P. A weak but statistically significant correlation was found with total IP content (R2 = 0.50, p < 0.05), suggesting that IP may play a limited role in influencing phosphorus mobility. In contrast, the strongest correlation was identified between P release flux and Fe-P, with a coefficient of determination of R2 = 0.70 (p < 0.05) (Figure 10d). This indicates that higher Fe-P content in sediments corresponds to an increased risk of P release in Zhanghe Reservoir [42]. The consistently strong correlation between Fe-P and P release flux suggests that Fe-P is not only a dominant storage form of P in sediments [43] but also represents a primary internal source of P under conditions of hydrodynamic disturbance or redox-driven release. These findings underscore the importance of Fe-P in internal P cycling and its relevance to eutrophication risk in shallow and stratified reservoirs.
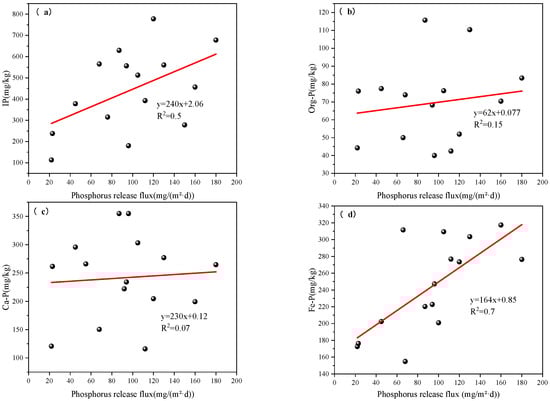
Figure 10.
Correlation analysis between sediment P release flux and different P fractions: (a) IP; (b) Org-P; (c) Ca-P; (d) Fe-P.
3.4. Influence of Heavy Metals on Phosphorus Release from Sediments
The chemical speciation and redox state of metals in sediments play a critical role in regulating the potential for P release [44]. Sediment samples were analyzed for eight heavy metals using flame atomic absorption spectrophotometry (Shimadzu AA-6880) (Table A1). Among them, Fe was the most abundant active metal and is recognized as a key factor influencing P release risk in aquatic sediments [45]. The correlation between Fe and TP contents in the sediments exhibited a zonal pattern. When TP content was below 0.25 mg/kg, a significant positive correlation was observed between TP and Fe concentrations (R2 = 0.50, p < 0.05) (Figure 11a). However, when TP content exceeded 0.25 mg/kg, the correlation became insignificant (R2 = 0.05, p > 0.05) (Figure 11b). This pattern suggests that Fe has a strong binding affinity for P at lower P concentrations, likely through the formation of Fe-P complexes [45]. However, once Fe adsorption sites are saturated, additional P tends to exist in alternative chemical forms, thereby modifying the P cycling pathways within the sediment matrix.
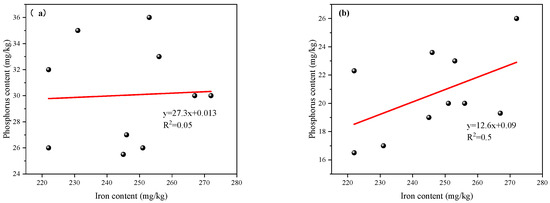
Figure 11.
Correlation between total P and iron content in surface sediments of the reservoir: (a) TP < 0.25 mg/kg: a significant positive correlation between TP and Fe concentrations; (b) TP ≥ 0.25 mg/kg: no significant correlation between TP and Fe concentrations.
The Fe:P molar ratio in sediments is also closely associated with the potential for P release [46,47]. As shown in Figure 12a, the average Fe:P ratios in the four zones were as follows: Zone IV (14.1) ≈ Zone III (13.8) > Zone I (8.35) ≈ Zone II (8.28). This inverse relationship indicates that as sedimentary P content increases, the corresponding Fe:P ratio decreases substantially.
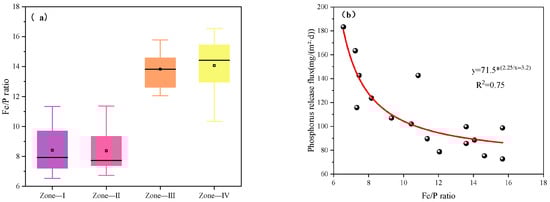
Figure 12.
Relationship between the Fe:P ratio in surface sediments and P release behavior: (a) Fe:P ratios across zones; (b) correlation between Fe:P ratio and P release rate.
The relatively higher Fe:P ratios in Zones III and IV suggest a lower risk of P release, whereas the lower ratios in Zones I and II imply a greater tendency for P desorption. When the Fe:P ratio approaches 10, the P release flux is observed to reach approximately 100 mg/(m2·d). As shown in Figure 12b, when the Fe:P ratio exceeds 10, the iron content in the sediment is sufficient to adsorb and stabilize P, thereby suppressing its release. Conversely, when the ratio falls below this threshold, the binding capacity of iron is diminished, resulting in elevated P mobility. These findings suggest that an Fe:P ratio of approximately 10 may represent a critical threshold, beyond which the sediment transitions from functioning as a P sink to acting as a net source of P to the overlying water.
3.5. Influence of Particle Size on Phosphorus Release from Sediments
According to the Udden–Wentworth grain size classification standard [33], sediment particle sizes were categorized as 0.5 mm, 0.08 mm, 0.01 mm, 0.005 mm, and 0.001 mm to investigate the influence of particle size on P release behavior.
As shown in Figure 13a, sediments in Zones I and II were dominated by silt and clay fractions, with fine particles (particle size < 0.01 mm) accounting for 75.1% and 65% of the total, respectively—significantly higher than the proportions observed in Zones III and IV, which ranged from 48% to 56%. This difference is attributed to the locations of Zones I and II in upstream depositional areas, which favor the accumulation of finer materials. In these two zones, silt and clay contents ranged from 62% to 74% and 5% to 7%, respectively, reflecting a distinct fine-particle aggregation pattern. In contrast, sediments in Zones III and IV exhibited a higher proportion of sand, ranging from 45% to 55%, indicative of coarser and more porous sediment textures.
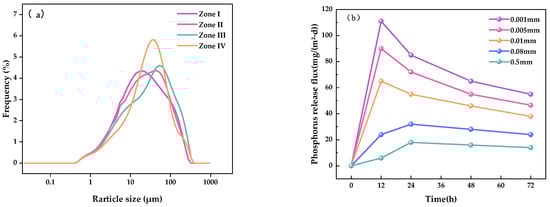
Figure 13.
Particle size distribution and P release rates in sediments from typical zones: (a) particle size composition; (b) P release rates.
Figure 13b illustrates that particle size significantly affects P release dynamics. Sediments with particle sizes < 0.01 mm exhibited the highest release rates, characterized by a rapid increase during the initial 12 h phase of the experiment. Maximum P fluxes of 110, 90, and 65 mg/(m2·d) were recorded at 12 h. By comparison, coarser sediment fractions (0.08 mm and 0.5 mm) showed delayed and reduced release rates, with fluxes reaching only 30 and 20 mg/(m2·d), respectively, at the 24 h mark. This behavior is attributed to the larger specific surface area and greater number of reactive sites associated with fine particles, which enhance P solubilization and diffusion [48].
Moreover, sedimentary environments enriched in fine particles and organic matter tend to maintain long-term anoxic or anaerobic conditions, further facilitating P release [49]. As a result, Zones I and II exhibit a higher potential for P release, while Zones III and IV—characterized by coarse-grained, loosely structured sediments with larger pore spaces—demonstrate relatively lower release potential.
These findings suggest that sediment particle size, in conjunction with organic matter and moisture content, are key controlling factors influencing the behavior and intensity of P release from sediments.
3.6. Phosphorus Release per Unit Area and Assessment of Pollution Risk in Sediments
Assuming an average ambient temperature of 16.5 °C, the double-membrane diffusion model was applied to estimate the average unit-area P release from sediments into the overlying water across different hydrological periods for Zones I-IV, based on Equation (8) (see Figure 14a).
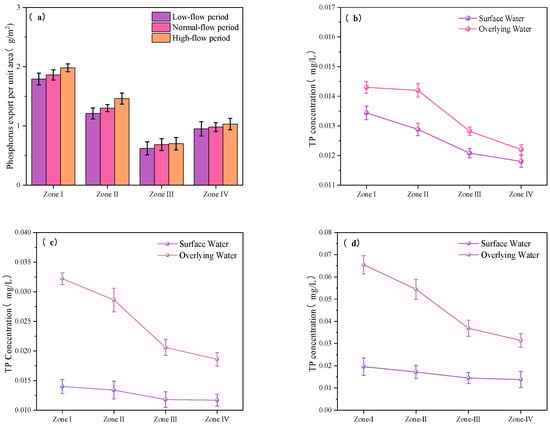
Figure 14.
Unit-area P release under different hydrological periods in Zones I–IV: (a) calculated release amounts; (b–d) TP concentrations in surface and overlying bottom water during dry, normal, and wet seasons.
During the dry season, overall release fluxes were relatively low. The unit-area P release values for Zones I to IV were 1.80 g/m2, 1.25 g/m2, 0.621 g/m2, and 0.95 g/m2, respectively. In the normal-flow period, although hydrodynamic conditions were moderately enhanced—conditions theoretically more favorable for P mobilization—the calculated release fluxes exhibited only slight increases, ranging from 0.03 to 0.08 g/m2. This suggests that P remained largely immobilized under these conditions.
In contrast, during the wet season, P release increased more markedly across all zones, reaching 2.08 g/m2, 1.53 g/m2, 0.70 g/m2, and 1.03 g/m2 for Zones I to IV, respectively—representing increases of 0.1 to 0.3 g/m2 compared to the normal-flow period. These results indicate that intensified hydrodynamic disturbances during the wet season enhance P desorption and diffusion from sediments into the overlying water [50].
Notably, the magnitude of P release across hydrological periods varied significantly among the zones, reflecting pronounced spatial heterogeneity. In Zones I and II, P release during the wet season increased by 0.28 g/m2 relative to the dry season, corresponding to relative increases of 15.5% and 22.4%, respectively. In contrast, increases in Zones III and IV during the same period were only 0.079 g/m2 and 0.17 g/m2, respectively. The magnitude of increase in Zones I and II was 2.4 to 3.2 times greater than that in Zones III and IV.
These findings suggest that Zones I and II are more susceptible to localized internal P pollution during high-flow periods. The elevated sediment-derived P release under wet-season conditions substantially increases P concentrations in the overlying water, posing a potential risk to reservoir water quality.
As shown in Figure 14b–d, across the typical functional zones of the reservoir during the dry, normal, and wet seasons, TP concentrations in the surface water layer ranged from 0.012 to 0.0205 mg/L, while TP concentrations in the overlying water immediately above the sediment ranged from 0.0125 to 0.0652 mg/L. Overall, surface water TP levels remained within the thresholds of the Class I water quality standard, indicating relatively favorable surface water conditions.
However, as a deep reservoir, Zhanghe Reservoir exhibits seasonal thermal stratification. During the wet season, elevated surface water temperatures reduce water density, while cooler, denser water remains at the bottom, creating a pronounced density gradient. This stratification limits vertical mixing and restricts the exchange of materials between layers. Concurrently, seasonal hypoxia commonly occurs in the bottom water [51,52], promoting the reductive dissolution and desorption of P fractions from sediments into the overlying water. As a result, TP concentrations in bottom waters during the wet season increase significantly, leading to a distinct vertical gradient in P concentrations.
Despite considerable seasonal variation in TP levels in the bottom overlying water, surface water TP concentrations remained relatively stable throughout the year. Only a slight increase was observed during the wet season, likely attributable to external inputs such as precipitation and surface runoff. In contrast, internal P release from sediments—although it can elevate TP concentrations in bottom waters—is modulated by sediment particle size, hydrodynamic conditions, and heavy metal interactions [8], and it has limited influence on surface water P levels.
Therefore, in addition to periodic dredging of sediments in zones identified as having high P release potential, greater attention should be given to the control of external inputs of P and organic matter from the watershed. Such integrated measures are essential for reducing the overall nutrient load and preventing eutrophication in the reservoir.
4. Conclusions
(1) P in the sediments of Zhanghe Reservoir was predominantly present in inorganic forms, with Fe-P identified as the most reactive fraction. Among all P species, Fe-P exhibited the strongest correlation with P release flux (R2 = 0.70). Zones I and II, characterized by high Fe-P content and substantial external inputs, showed enhanced P reactivity at the sediment–water interface, particularly during high-flow periods. These zones were identified as high-sensitivity areas for internal P pollution and eutrophication risk.
(2) The relationship between sedimentary Fe and TP content exhibited spatial heterogeneity. When TP concentrations were below 0.25 mg/kg and the Fe:P molar ratio was less than 10, the risk of P release increased markedly. During the high-flow season, P release per unit area was significantly elevated in Zones I and II, attributed to the prevalence of fine-grained particles and lower Fe:P ratios. Smaller particle sizes contributed to greater specific surface area, thereby enhancing P desorption and migration from sediments.
(3) TP concentrations in the surface water of Zhanghe Reservoir generally remained low and within the limits of Class I water quality standards, indicating favorable surface water quality conditions. However, during the wet season, pronounced thermal stratification and the development of hypoxic conditions in bottom waters facilitated enhanced P release from sediments, resulting in TP concentrations as high as 0.0652 mg/L in the near-bottom layer. Surface water TP fluctuations were primarily influenced by precipitation and runoff, reflecting intensified external nutrient loading. Although sediment-derived P release was affected by factors such as hydrodynamics, heavy metals, and sediment structure, its impact was largely confined to the bottom water layer. Therefore, management strategies should prioritize sediment dredging in high-sensitivity zones and reduction of external nutrient inputs from the watershed to maintain overall reservoir water quality.
Author Contributions
H.Z., C.Z., and Y.H.: Conceptualization, methodology, research, writing—original draft, visualization, and obtaining funding; J.Z.: methodology, research, and writing—review and editing; T.M. and N.Z.: Conceptualization, writing—review and editing, and supervision; T.Y., Y.Z., C.H., and L.S.: writing—original draft and writing—review and editing. All authors have read and agreed to the published version of the manuscript.
Funding
This research was funded by the Hubei Provincial Key Scientific Research Project on Water Resources “Study on the Distribution and Characteristics of Sediment Siltation in the Key Waters of Zhanghe Reservoir (HBSLKY202302)”.
Data Availability Statement
The original contributions presented in this study are included in the article. Further inquiries can be directed to the corresponding authors.
Conflicts of Interest
No potential conflict of interest was reported by the authors.
Correction Statement
This article has been republished with a minor correction to the Data Availability Statement. This change does not affect the scientific content of the article.
Abbreviations
| P | Phosphorus |
| TP | Total phosphorus |
| IP | Inorganic phosphorus |
| Fe-P | Iron-bound phosphorus |
| DGT | Diffusive gradients in thin films |
| Ca-P | Calcium-bound phosphorus |
| Org-P | Organic phosphorus |
| Fet | Total iron in sediment |
| R2 | Coefficient of determination |
| Zn | Metal zinc |
| Fe | Iron |
Appendix A
Table A1.
Heavy metal concentrations at different depths across representative functional zones of Zhanghe Reservoir (mg/kg).
Table A1.
Heavy metal concentrations at different depths across representative functional zones of Zhanghe Reservoir (mg/kg).
| Zone | Depth (cm) | Zn | Fe | Cd | Cr | Pb | As | Ni | Cu |
|---|---|---|---|---|---|---|---|---|---|
| I | 0~10 cm | 101.24 | 249.01 | 0.688 | 32.36 | 42.42 | 11.75 | 63.11 | 32.36 |
| 10~20 cm | 104.87 | 262.29 | 0.559 | 26.31 | 43.34 | 9.55 | 64.48 | 26.31 | |
| 20~30 cm | 98.61 | 218.37 | 0.698 | 32.83 | 39.96 | 11.92 | 59.45 | 32.83 | |
| 30~40 cm | 93.02 | 239.82 | 0.718 | 33.76 | 41.19 | 12.26 | 61.28 | 33.76 | |
| II | 0~10 cm | 107.09 | 219.91 | 0.407 | 92.58 | 31.09 | 15.33 | 52.44 | 34.29 |
| 10~20 cm | 89.00 | 228.03 | 0.590 | 134.29 | 29.33 | 14.46 | 50.78 | 49.74 | |
| 20~30 cm | 99.13 | 247.59 | 0.541 | 123.10 | 32.59 | 16.07 | 47.45 | 45.59 | |
| 30~40 cm | 104.92 | 267.73 | 0.604 | 137.34 | 34.10 | 16.81 | 48.28 | 50.87 | |
| III | 0~10 cm | 75.99 | 213.10 | 0.487 | 67.08 | 30.37 | 7.97 | 32.42 | 26.31 |
| 10~20 cm | 81.38 | 256.44 | 0.522 | 71.83 | 32.52 | 8.53 | 33.62 | 28.17 | |
| IV | 0~10 cm | 101.24 | 249.84 | 0.86 | 84.58 | 41.71 | 14.49 | 48.59 | 30.51 |
| 10~20 cm | 81.96 | 227.29 | 0.696 | 68.47 | 46.01 | 15.99 | 50.34 | 24.70 |
Appendix B

Figure A1.
Field survey tracks across representative functional zones during water quality monitoring.

Figure A2.
Schematic diagram of the static incubation experiment used to simulate phosphorus release from sediments under controlled redox conditions.
References
- Ding, X.; Dong, X.; Hou, B.; Fan, G.; Zhang, X. Visual platform for water quality prediction and pre-warning of drinking water source area in the Three Gorges Reservoir Area. J. Clean. Prod. 2021, 309, 127398. [Google Scholar] [CrossRef]
- Tang, X.; Zhai, A.; Ding, X.; Zhu, Q. Safety guarantee system of drinking water source in Three Gorges Reservoir area and its application in Huangjuedu drinking water source area. Sustainability 2019, 11, 7074. [Google Scholar] [CrossRef]
- Butler, M.J.; Yellen, B.C.; Oyewumi, O.; Ouimet, W.; Richardson, J.B. Accumulation and transport of nutrient and pollutant elements in riparian soils, sediments, and river waters across the Thames River Watershed, Connecticut, USA. Sci. Total Environ. 2023, 899, 165630. [Google Scholar] [CrossRef] [PubMed]
- Jin, G.; Onodera, S.; Saito, M.; Maruyama, Y.; Hayakawa, A.; Sato, T.; Aritomi, D. Vertical distribution of sediment phosphorus in Lake Hachirogata related to the effect of land reclamation on phosphorus accumulation. Environ. Technol. 2016, 37, 486–494. [Google Scholar] [CrossRef] [PubMed]
- Lin, J.; Zhao, Y.; Zhan, Y.; Wang, Y. Control of internal phosphorus release from sediments using magnetic lanthanum/iron-modified bentonite as active capping material. Environ. Pollut. 2020, 264, 114809. [Google Scholar] [CrossRef] [PubMed]
- Lin, J.; Li, Y.; Zhan, Y.; Wu, X. Combined amendment and capping of sediment with ferrihydrite and magnetite to control internal phosphorus release. Water Res. 2023, 235, 119899. [Google Scholar] [CrossRef]
- Tu, L.; Jarosch, K.A.; Schneider, T.; Grosjean, M. Phosphorus fractions in sediments and their relevance for historical lake eutrophication in the Ponte Tresa basin (Lake Lugano, Switzerland) since 1959. Sci. Total Environ. 2019, 685, 806–817. [Google Scholar] [CrossRef]
- Janicka, E.; Kanclerz, J.; Wiatrowska, K. Content and speciation of phosphorus in Lake Kórnickie. Water 2022, 14, 3234. [Google Scholar] [CrossRef]
- Wang, T.; Liu, J.; Xu, S.; Qin, G.; Sun, Y.; Wang, F. Spatial distribution, adsorption/release characteristics, and environment influence of phosphorus on sediment in reservoir. Water 2017, 9, 724. [Google Scholar] [CrossRef]
- Li, H.; Cai, Y.; Song, C.; Cao, Z.; Li, J.; Qin, Z.; Zhou, Y. Comparison of phosphorus migration and transformation characteristics in sediments of lakes within the Yangtze River basin and reservoirs on the Wujiang River. J. Soils Sediments 2024, 24, 991–1001. [Google Scholar] [CrossRef]
- Hadian, M.; Mosaedi, A. Application of remote sensing technology in sediment estimating entering the dam reservoirs due to floods. Shock. Vib. 2021, 1, 4469744. [Google Scholar] [CrossRef]
- Liu, W.C. Modelling the effects of reservoir construction on tidal hydrodynamics and suspended sediment distribution in Danshuei River estuary. Environ. Model. Softw. 2007, 22, 1588–1600. [Google Scholar] [CrossRef]
- Ruiping, S.; Yixuan, H.; Yiping, Z.; Yongchao, Z.; Tuqiao, Z. Salinity distribution and sediment flux in the estuarine Xuanmen Reservoir. Water Air Soil Pollut. 2020, 231, 1–10. [Google Scholar] [CrossRef]
- Foteh, R.; Garg, V.; Nikam, B.R.; Khadatare, M.Y.; Aggarwal, S.P.; Kumar, A.S. Reservoir sedimentation assessment through remote sensing and hydrological modelling. J. Indian Soc. Remote Sens. 2018, 46, 1893–1905. [Google Scholar] [CrossRef]
- Yang, X.; Zhang, R.; Wang, J.; He, K.; Chen, J. Fluxes and mechanisms of phosphorus release from sediments in seasonal hypoxic reservoirs: A simulation-based experimental study. J. Soils Sediments 2021, 21, 3246–3258. [Google Scholar] [CrossRef]
- Guo, P.; Lu, D.; Jiang, J.; Zhan, L.; Wang, R. Temporal-spatial distribution, environmental significance and release risks of phosphorus in the sediments of a tropical mountain’s deep drinking water reservoir in southeastern China. Chem. Speciat. Bioavailab. 2017, 29, 170–178. [Google Scholar] [CrossRef]
- Márquez-Pacheco, H.; Hansen, A.M. Internal phosphorus load in a Mexican reservoir through sediment speciation analysis. Environ. Sci. Pollut. Res. 2017, 24, 24947–24952. [Google Scholar] [CrossRef]
- Mao, Y.; He, Q.; Li, H.; Su, X.; Ai, H. Thermal structure-induced biochemical parameters stratification in a subtropical dam reservoir. Water Environ. Res. 2018, 90, 2036–2048. [Google Scholar] [CrossRef]
- Shou, C.Y.; Yue, F.J.; Zhou, B.; Fu, X.; Ma, Z.N.; Gong, Y.Q.; Chen, S.N. Chronic increasing nitrogen and endogenous phosphorus release from sediment threaten to the water quality in a semi-humid region reservoir. Sci. Total Environ. 2024, 931, 172924. [Google Scholar] [CrossRef]
- Lee, J.K.; Oh, J.M. A study on the characteristics of organic matter and nutrients released from sediments into agricultural reservoirs. Water 2018, 10, 980. [Google Scholar] [CrossRef]
- Dąbrowska, J.; Dąbek, P.B.; Lejcuś, I. Identifying surface runoff pathways for cost-effective mitigation of pollutant inputs to drinking water reservoir. Water 2018, 10, 1300. [Google Scholar] [CrossRef]
- Holas, J.; Holas, M.; Chour, V. Pollution by phosphorus and nitrogen in water streams feeding the Zelivka drinking water reservoir. Water Sci. Technol. 1999, 39, 207–214. [Google Scholar] [CrossRef]
- Wu, Z.; Wang, S. Release mechanism and kinetic exchange for phosphorus (P) in lake sediment characterized by diffusive gradients in thin films (DGT). J. Hazard. Mater. 2017, 331, 36–44. [Google Scholar] [CrossRef] [PubMed]
- Xu, Z.; Sun, W.X.; Li, Q.Q.; Han, Y.J.; Ma, W.W.; Li, T.; Zhu, M.X. Characterization of iron, sulfur, and phosphorus diagenesis in muddy sediments of the South Yellow Sea using the diffusive gradients in thin films (DGT) technique. Aquat. Sci. 2023, 85, 69. [Google Scholar] [CrossRef]
- Chen, Y.; Niu, J.; Sun, Y.; Liu, Q.; Li, S.; Li, P.; Li, Q. Study on streamflow response to land use change over the upper reaches of Zhanghe Reservoir in the Yangtze River basin. Geosci. Lett. 2020, 7, 6. [Google Scholar] [CrossRef]
- HJ 493—2009; Water Quality—Technical Regulation of the Preservation and Handling of Samples. China Environmental Science Press: Beijing, China, 2009.
- MC Almeida, I.; Oliva-Teles, M.T.; Alves, R.C.; Santos, J.; Pinho, R.S.; Silva, S.I.; Oliveira, M.B.P.P. Oilseeds from a Brazilian semi-arid region: Edible potential regarding the mineral composition. Foods 2020, 9, 229. [Google Scholar] [CrossRef]
- Capilla, X.; Bedell, J.P.; Schwartz, C.; Sterckeman, T.; Perrodin, Y.; Morel, J.L. The effects of drying temperature on the extractability of metals from dredged sediments. Soil Sediment Contam. 2007, 16, 383–396. [Google Scholar] [CrossRef]
- Loh, P.S.; Ying, C.Y.; Alnoor, H.I.M.; Huang, X.R.; Lou, Z.H.; Chen, X.G.; Jin, A.M. Comparative study on the elucidation of sedimentary phosphorus species using two methods, the SMT and SEDEX methods. J. Anal. Methods Chem. 2020, 1, 8548126. [Google Scholar] [CrossRef]
- Pardo, P.; Rauret, G.; López-Sánchez, J.F. Shortened screening method for phosphorus fractionation in sediments: A complementary approach to the standards, measurements and testing harmonised protocol. Anal. Chim. Acta 2004, 508, 201–206. [Google Scholar] [CrossRef]
- GBW 07317-GSD-13; Water Quality Standard Reference Material. China Standards Press: Beijing, China. Available online: http://www.bzw580.com/site/products/id/10084 (accessed on 19 June 2025).
- Min, W.; Sun, X.M.; Huang, S.L.; Tang, X.Q.; Scholz, M. Laboratory analyses of nutrient release processes from Haihe River sediment. Int. J. Sediment Res. 2012, 27, 61–72. [Google Scholar] [CrossRef]
- Rodríguez-Uribe, M.C.; Núñez-Cornú, F.J.; Chávez-Dagostino, R.M.; Trejo-Gómez, E. Granulometric analysis of shallow vents sediments at Banderas Bay (Mexico). J. Mar. Sci. Eng. 2020, 8, 342. [Google Scholar] [CrossRef]
- Yang, H.; Chang, Y.; Dong, X.; Wang, S.; Che, F.; Huang, W. The coupled effect of sediment resuspension and microbiota on phosphorus release and transformation in a simulated aquatic ecosystem. J. Water Process Eng. 2024, 57, 104653. [Google Scholar] [CrossRef]
- Wang, Z.; Ren, H.; Ma, Z.; Yao, Z.; Duan, P.; Ji, G. The release of endogenous nitrogen and phosphorus in the Danjiangkou Reservoir: A double-membrane diffusion model analysis. J. Sens. 2021, 1, 6610178. [Google Scholar] [CrossRef]
- Bunke, D.; Leipe, T.; Moros, M.; Morys, C.; Tauber, F.; Virtasalo, J.J.; Arz, H.W. Natural and anthropogenic sediment mixing processes in the south-western Baltic Sea. Front. Mar. Sci. 2019, 6, 677. [Google Scholar] [CrossRef]
- Kim, S.R.; Lee, G.S.; Kim, D.C.; Bae, S.H.; Kim, S.P. Physical properties and geoacoustic provinces of surficial sediments in the southwestern part of the Ulleung Basin in the East Sea. Quat. Int. 2017, 459, 35–44. [Google Scholar] [CrossRef]
- Chen, C.; Deng, W.; Xu, X.; He, J.; Wang, S.; Jiao, L.; Zhang, Y. Phosphorus adsorption and release characteristics of surface sediments in Dianchi Lake, China. Environ. Earth Sci. 2015, 74, 3689–3700. [Google Scholar] [CrossRef]
- Adhikari, P.L.; White, J.R.; Maiti, K.; Nguyen, N. Phosphorus speciation and sedimentary phosphorus release from the Gulf of Mexico sediments: Implication for hypoxia. Estuar. Coast. Shelf Sci. 2015, 164, 77–85. [Google Scholar] [CrossRef]
- Tammeorg, O.; Nürnberg, G.K.; Horppila, J.; Tammeorg, P.; Jilbert, T.; Nõges, P. Linking sediment geochemistry with catchment processes, internal phosphorus loading and lake water quality. Water Res. 2024, 263, 122157. [Google Scholar] [CrossRef]
- Peng, C.; Huang, Y.; Yan, X.; Jiang, L.; Wu, X.; Zhang, W.; Wang, X. Effect of overlying water pH, temperature, and hydraulic disturbance on heavy metal and nutrient release from drinking water reservoir sediments. Water Environ. Res. 2021, 93, 2135–2148. [Google Scholar] [CrossRef]
- Zhang, Z.B.; Tan, X.B.; Wei, L.L.; Yu, S.M.; Wu, D.J. Comparison between the lower Nansi Lake and its inflow rivers in sedimentary phosphorus fractions and phosphorus adsorption characteristics. Environ. Earth Sci. 2012, 66, 1569–1576. [Google Scholar] [CrossRef]
- Xing, X.; Chen, M.; Wu, Y.; Tang, Y.; Li, C. The decomposition of macrozoobenthos induces large releases of phosphorus from sediments. Environ. Pollut. 2021, 283, 117104. [Google Scholar] [CrossRef]
- Liu, J.J.; Diao, Z.H.; Xu, X.R.; Xie, Q. Effects of dissolved oxygen, salinity, nitrogen and phosphorus on the release of heavy metals from coastal sediments. Sci. Total Environ. 2019, 666, 894–901. [Google Scholar] [CrossRef]
- Huang, Y.; Xu, C.; Yang, B.; Zhu, D.; Ning, Z.; Lu, D.; Kang, Z. Biogeochemistry of phosphorus species in water and sediments and sedimentary phosphorus release potential from a eutrophic estuary and adjacent bay. Mar. Environ. Res. 2025, 208, 107134. [Google Scholar] [CrossRef]
- Weng, H.; Sun, X.; Chen, J.; Chen, J.; Chen, L.; Chen, X.; Qin, Y. Potential effect of sedimentary iron-phosphorus accumulation on frequent algal bloom in the Pearl River Estuary. Sci. China Ser. D Earth Sci. 2007, 50, 453–461. [Google Scholar] [CrossRef]
- Emsens, W.J.; Aggenbach, C.J.; Smolders, A.J.; Zak, D.; van Diggelen, R. Restoration of endangered fen communities: The ambiguity of iron–phosphorus binding and phosphorus limitation. J. Appl. Ecol. 2017, 54, 1755–1764. [Google Scholar] [CrossRef]
- Wang, X.; Zhou, J.; Wu, Y.; Bol, R.; Wu, Y.; Sun, H.; Bing, H. Fine sediment particle microscopic characteristics, bioavailable phosphorus and environmental effects in the world largest reservoir. Environ. Pollut. 2020, 265, 114917. [Google Scholar] [CrossRef] [PubMed]
- Wang, Y.; Ouyang, W.; Lin, C.; Zhu, W.; Critto, A.; Tysklind, M.; Wu, H. Higher fine particle fraction in sediment increased phosphorus flux to estuary in restored Yellow River Basin. Environ. Sci. Technol. 2021, 55, 6783–6790. [Google Scholar] [CrossRef] [PubMed]
- Ning, Y.; Gao, B.; Wang, H.; Hou, W. Effects of pH, temperature and hydraulic disturbance on nitrogen release from sediments in the Sunxi River, Three Gorges Reservoir Area, China. PeerJ 2025, 13, 19161. [Google Scholar] [CrossRef] [PubMed]
- Wang, F.; Wang, J.; Cao, T.; Ji, X.; Yan, J.; Ding, S.; Chen, N. Seasonal hypoxia enhances sediment iron-bound phosphorus release in a subtropical river reservoir. Sci. Total Environ. 2024, 936, 173261. [Google Scholar] [CrossRef]
- Puttonen, I.; Lukkari, K.; Miettunen, E.; Ropponen, J.; Tuomi, L. Estimating internal phosphorus loading for a water quality model using chemical characterisation of sediment phosphorus and contrasting oxygen conditions. Sci. Total Environ. 2024, 942, 173717. [Google Scholar] [CrossRef]
Disclaimer/Publisher’s Note: The statements, opinions and data contained in all publications are solely those of the individual author(s) and contributor(s) and not of MDPI and/or the editor(s). MDPI and/or the editor(s) disclaim responsibility for any injury to people or property resulting from any ideas, methods, instructions or products referred to in the content. |
© 2025 by the authors. Licensee MDPI, Basel, Switzerland. This article is an open access article distributed under the terms and conditions of the Creative Commons Attribution (CC BY) license (https://creativecommons.org/licenses/by/4.0/).